Page 1 of 37 Tees Valley Job Vacancies January – December 2016 Contents Page 1. Introduction 2 2. Key Findings 3 3. Vacancy Summary by Geography 4 4. Occupational Groups 8 5. Detailed Occupations 12 6. Average Wage 14 7. Top Employers 16 8. Job Vacancies by Key Sector 17 9. Top Skills 23 10. Conclusions 26 11. Appendix A – Sector Definitions 27 12. Appendix B – Detailed Occupation Changes by Local Authority 28 January 2017
Transcript
Page 1 of 37
Tees Valley Job Vacancies
January – December 2016
Contents Page
1. Introduction 2
2. Key Findings 3
3. Vacancy Summary by Geography 4
4. Occupational Groups 8
5. Detailed Occupations 12
6. Average Wage 14
7. Top Employers 16
8. Job Vacancies by Key Sector 17
9. Top Skills 23
10. Conclusions 26
11. Appendix A – Sector Definitions 27
12. Appendix B – Detailed Occupation Changes by Local Authority
28
January 2017
Tees Valley Job Vacancies January – December 2016
Page 2 of 37
1. Introduction
This report is an update on the characteristics of job vacancies within Tees Valley covering the period January 2016 – December 2016 (inclusive). Tees Valley covers the five local authority districts of Darlington, Hartlepool, Middlesbrough, Redcar and Cleveland and Stockton-on-Tees.
The data used is drawn from the commercial ‘Labour Insight’ product. This searches the internet for job adverts. Consequently only jobs advertised via the internet will be included in this report. Occupations are defined by the 2010 Standard Occupational Classification (SOC) system. TVCA Key Sectors definitions can be found in Appendix A.
Due to a data update by Labour Insight in August 2016 the numbers in this report cannot be compared to previous Job Vacancies reports produced by TVCA.
The level of representation of job vacancies advertised on the web is open to question as there may be variations in mode of recruitment by sector and size of business. Small and medium size enterprises are less likely to advertise online therefore vacancies may be under represented.
An increase or decrease in job vacancies may be an indication of new job creation, skills shortage vacancies or high staff turnover.
The number of job vacancies in Tees Valley by 2-digit SOC code can be mapped using TVCA’s interactive mapping system https://teesvalley-ca.gov.uk/InstantAtlas/area_profile/atlas.html.
There were 28,876 job vacancies advertised online in Tees Valley between January 2016 and December 2016.
This is a 12% increase when compared to 2015 (3,018 extra vacancies), in comparison to a 14% increase nationally and an 18% increase across the North of England1.
The largest rise has been for teaching (35% rise) and corporate managers and directors (31% rise), in particular secondary school teachers and managers and directors in retail and wholesale.
The average advertised wage for job vacancies in Tees Valley in 2016 was £26,882 compared to an average advertised national wage of £35,579.
The National Health Service advertised the highest number of vacancies in 2016 at 2,060, followed by Redcar and Cleveland Council at 362 (including teaching vacancies). HC-One (private care home) advertised the highest number of private sector jobs at 145.
Out of the 16,117 vacancies which could be allocated to an industry sector, the Health Care sector shows the highest proportion of vacancies with 39% of all vacancies (6,222 vacancies) followed by Public Admin, Defence and Education with 19% (3,031 vacancies).
This large percentage of job vacancies available for public sector jobs reflects the larger than average public sector employment within Tees Valley, with latest figures from ONS showing that 23% of all employment within Tees Valley is public sector, compared to 17% nationally.
Job vacancies in the Other Services2 have seen the largest percentage increase (38%) when compared to the same period in 2015, with a rise in the number of advertisements for hairdressing and other beauty related vacancies.
1 The North region includes the North East, North West and Yorkshire and Humber.
2 Other Services includes Hairdressing, funeral activities, physical well-being organisations such as gyms, repair of goods, and
charities amongst others.
Tees Valley Job Vacancies January – December 2016
Page 4 of 37
3. Vacancy Summary by Geography
This section provides a summary of vacancies advertised at a Tees Valley level before looking at the vacancies advertised within each of the five Tees Valley districts.
There were 28,876 job vacancies advertised online in Tees Valley between January and December 2016.
Tees Valley - Over the last year
There has been a 12% increase in job vacancies (3,018 extra vacancies) with numbers increasing from 25,858 in 2015 to 28,876 in 2016. This compares to a 14% increase nationally and a more substantial 18% increase across the North of England (driven by a 32% rise across the North East).
There has been a 35% increase in vacancies for Teaching and Educational Professionals with numbers rising from 1,658 in 2015 to 2,241 in 2016 (583 extra vacancies), with a large 135% rise in the number of vacancies for secondary school teachers (532 extra vacancies).
There has also been a 31% rise in vacancies for Corporate Managers and Directors with numbers increasing from 1,110 in 2015 to 1,452 in 2016 (342 extra vacancies), with a particular 66% rise in vacancies for Managers and Directors in Retail and Wholesale (167 extra vacancies).
Tees Valley - Over the last three years
There has been a 3% increase in job vacancies (736 extra vacancies) with vacancies rising from 28,140 in 2013 to 28,876 in 2016. However this increase is small compared to the 32% rise seen across the UK and the 24% rise across the North of England.
The largest rise in vacancies has been for Caring Personal Service occupations with a 58% increase and numbers rising from 1,642 vacancies in 2013 to 2,591 in 2016 (949 fewer vacancies).
Tees Valley Job Vacancies January – December 2016
Page 5 of 37
The graph below shows the number of job vacancies advertised by the five Tees Valley districts over the last three years: Graph 1: Tees Valley Vacancy Numbers
The tables below summarise the changes in job vacancy numbers by Tees Valley district over the last year and last three years3:
Table 1: Change in job vacancies over last year
Change over last year
2015 2016 Change Change %
Darlington 5,052 6,194 1,142 23%
Hartlepool 1,927 2,330 403 21%
Middlesbrough 10,535 10,642 107 1%
Redcar and Cleveland 2,755 3,177 422 15%
Stockton 5,253 6,406 1,153 22%
Tees Valley 25,858 28,876 3,018 12%
North of England 1,211,585 1,429,716 218,131 18%
UK 8,171,516 9,316,567 1,145,051 14%
Table 2: Change in job vacancies over last three years
Change over last three years
2013 2016 Change Change %
Darlington 6,997 6,194 -803 -11%
Hartlepool 2,183 2,330 147 7%
Middlesbrough 8,818 10,642 1,824 21%
Redcar and Cleveland 4,081 3,177 -904 -22%
Stockton 5,894 6,406 512 9%
Tees Valley 28,140 28,876 736 3%
North of England 1,153,562 1,429,716 276,154 24%
UK 7,040,461 9,316,567 2,276,106 32%
3 The Tees Valley figure will not equal the sum of the five Tees Valley districts as there are a number of job vacancies
that advertise their location as ‘Tees Valley’ and do not specify a specific district.
Tees Valley Job Vacancies January – December 2016
Page 6 of 37
Darlington
Over the last year Darlington has seen a 23% increase in job vacancies, the largest rise in Tees Valley, with numbers rising from 5,052 to 6,194 (1,142 extra vacancies):
o The largest rise (53%) over the last year has been for Business and Public Service Associate Professionals with 235 extra vacancies.
o Health Professionals saw a 43% rise over the last year, with 229 extra vacancies.
Over the last three years Darlington has seen a 11% drop in job vacancies, with numbers falling from 6,997 in 2013 to 6,194 in 2016 (803 fewer vacancies):
o There has been a particular 52% drop in vacancies for Sales occupations with numbers dropping from 553 in 2013 to 264 in 2016 (289 fewer vacancies).
Hartlepool
Hartlepool consistently has the lowest number of job vacancies advertised in Tees Valley.
Over the last year a 21% rise has been seen with vacancies increasing from 1,927 in 2015 to 2,330 in 2016 (403 extra vacancies):
o This is mainly due to a rise in both Teaching and Educational Professionals (74% rise and 115 extra vacancies) and Caring Personal Service occupations (37% rise and 61 extra vacancies).
Over the last three years Hartlepool has seen a 7% increase in vacancies, with numbers rising from 2,183 in 2013 to 2,330 in 2016 (147 extra vacancies):
o There has been a particular 200% rise in Health and Social Care Associate Professionals (52 extra vacancies), followed by a 62% rise in Caring Personal Service vacancies (86 extra vacancies).
Middlesbrough
Middlesbrough consistently has the highest number of job vacancies in Tees Valley.
However over the last year Middlesbrough has seen the lowest increase in Tees Valley with a 1% increase and numbers rising from 10,535 in 2015 to 10,642 in 2016 (107 extra vacancies):
o In particular there has been a 24% rise in vacancies for Teaching and Educational Professionals with vacancies increasing from 660 in 2015 to 818 in 2016 (158 extra vacancies).
In comparison over the last three years Middlesbrough has shown the largest rise in job vacancies, with a 21% increase and numbers increasing from 8,818 in 2013 to 10,642 in 2016 (1,824 extra vacancies):
Tees Valley Job Vacancies January – December 2016
Page 7 of 37
o A particular 57% increase in Caring Personal Service vacancies has been seen with vacancies rising from 542 vacancies in 2013 to 849 vacancies in 2016 (307 extra vacancies).
Redcar and Cleveland
Over the last year Redcar and Cleveland has seen a 15% increase in job vacancies with numbers increasing from 2,755 in 2015 to 3,177 in 2016 (422 extra vacancies).
o There has been a 64% increase in Teaching and Educational Professional vacancies with numbers increasing from 243 in 2015 to 398 in 2016 (155 extra vacancies).
However over the last three years Redcar and Cleveland has seen a 22% fall in job vacancies, the largest fall in Tees Valley, with numbers decreasing from 4,081 in 2013 to 3,177 in 2016 (904 fewer vacancies).
o In particular there has been a 56% decrease in Science, Research, Engineering and Technology Professionals (266 fewer vacancies).
o There has also been a 60% decrease in vacancies for Sales occupations with numbers decreasing from 279 in 2013 to 111 in 2016 (168 fewer vacancies).
Stockton-on-Tees
Over the last year Stockton-on-Tees has seen a 22% rise in job vacancies with numbers increasing from 5,253 in 2015 to 6,406 in 2016 (1,153 extra vacancies):
o There has been a 43% increase Business and Public Service Associate Professionals with vacancies increasing from 413 in 2015 to 589 in 2016 (176 extra vacancies). This is followed by a 36% increase in Caring Personal Service occupations with vacancies rising from 398 to 540 (142 extra vacancies).
Over the last three years Stockton has seen a 9% rise in job vacancies with numbers increasing from 5,894 in 2013 to 6,406 in 2016 (512 extra vacancies).
o There has been an 87% increase in vacancies for Health Professionals (257 extra vacancies).
For a detailed analysis of occupation changes by district please see Appendix B.
Tees Valley Job Vacancies January – December 2016
Page 8 of 37
4. Occupational Groups
The chart below shows the distribution of job vacancies in Tees Valley by 2 digit Standard Occupational Classification (SOC) group, comparing 2015 to 2016:
Chart 1: Tees Valley Job Vacancies by Occupation Groups
Tees Valley Job Vacancies January – December 2016
Page 9 of 37
Health Professional occupations show the largest number of job vacancies with 2,720 job vacancies, followed by Business and Public Service Associate Professionals with 2,683 vacancies, then Caring Personal Service Occupations with 2,591 vacancies.
The largest rise (35%) can be seen in Teaching and Educational Professional occupations, with vacancies increasing from 1,658 in 2015 to 2,241 in 2016 (an extra 583 vacancies). This is followed by a 31% rise in vacancies for Corporate Managers and Directors with vacancies increasing from 1,110 in 2015 to 1,452 in 2016 (342 extra vacancies).
Elementary Administration and Service occupations have seen the most significant decrease in job vacancies compared to last year, with a 28% decrease and vacancies dropping from 1,182 in 2015 to 962 in 2016 (220 fewer vacancies). This is followed by a 15% drop in Elementary Trades and related occupations with vacancies dropping from 259 in 2015 to 221 in 2016 (38 fewer vacancies).
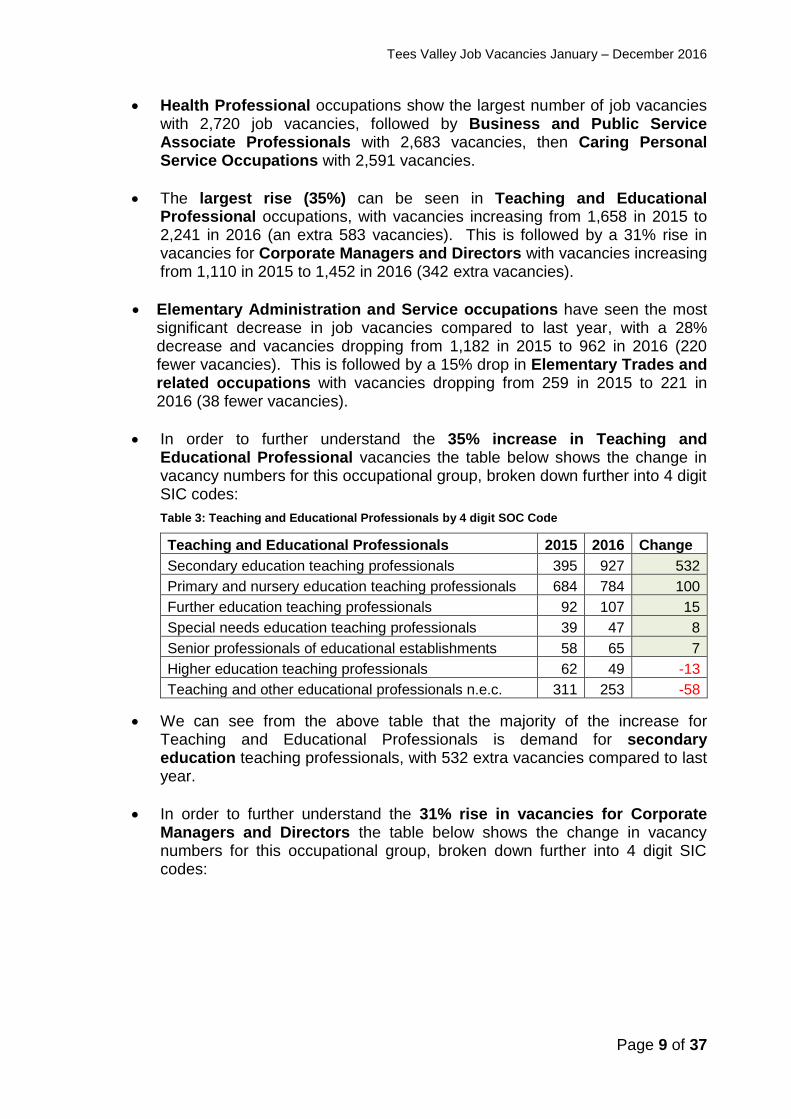
In order to further understand the 35% increase in Teaching and Educational Professional vacancies the table below shows the change in vacancy numbers for this occupational group, broken down further into 4 digit SIC codes:
Table 3: Teaching and Educational Professionals by 4 digit SOC Code
Teaching and Educational Professionals 2015 2016 Change
Primary and nursery education teaching professionals 684 784 100
Further education teaching professionals 92 107 15
Special needs education teaching professionals 39 47 8
Senior professionals of educational establishments 58 65 7
Higher education teaching professionals 62 49 -13
Teaching and other educational professionals n.e.c. 311 253 -58
We can see from the above table that the majority of the increase for Teaching and Educational Professionals is demand for secondary education teaching professionals, with 532 extra vacancies compared to last year.
In order to further understand the 31% rise in vacancies for Corporate Managers and Directors the table below shows the change in vacancy numbers for this occupational group, broken down further into 4 digit SIC codes:
Tees Valley Job Vacancies January – December 2016
Page 10 of 37
Table 4: Corporate Managers and Directors by 4 digit SOC Code
Occupation 2015 2016 Change
Managers and directors in retail and wholesale 253 420 167
Marketing and sales directors 66 122 56
Financial managers and directors 92 143 51
Officers in armed forces 0 32 32
Managers and directors in storage and warehousing 27 42 15
Production managers and directors in construction 124 139 15
Human resource managers and directors 44 54 10
Managers and directors in transport and distribution 26 34 8
Production managers and directors in manufacturing 224 232 8
Functional managers and directors n.e.c. 29 32 3
Chief executives and senior officials 24 26 2
Purchasing managers and directors 35 34 -1
Health services and public health managers and directors 101 90 -11
The table above shows that the increase in Corporate Managers and Directors is largely due to demand for managers and directors in retail and wholesale (167 extra vacancies).
In order to further understand the 28% fall in vacancies for Elementary Administration and Service occupations the table below shows the change in vacancy numbers, broken down further into 4 digit SOC codes:
Table 5: Elementary Administration and Service occupations by 4 digit SOC Code
Occupation 2015 2016 Change
Kitchen and catering assistants 283 184 -99
Postal workers, mail sorters, messengers and couriers 36 0 -36
Launderers, dry cleaners and pressers 34 0 -34
Cleaners and domestics 185 157 -28
Waiters and waitresses 99 77 -22
Elementary storage occupations 153 136 -17
Elementary security occupations n.e.c. 42 25 -17
Bar staff 77 61 -16
Security guards and related occupations 132 127 -5
Other elementary services occupations n.e.c. 44 85 41
We can see from the above table that there has been a decrease in vacancies across the majority of occupations; with 99 fewer vacancies for Kitchen and catering assistants.
In order to further understand the 15% fall in Elementary Trades and related occupations vacancies the table below shows the change in vacancy numbers for broken down further into 4 digit SOC codes:
Tees Valley Job Vacancies January – December 2016
Page 11 of 37
Table 6: Elementary Trades and related occupations by 4 digit SOC Code
Occupation 2015 2016 Change
Elementary process plant occupations n.e.c. 71 47 -24
Elementary construction occupations 130 112 -18
Industrial cleaning process occupations 30 29 -1
We can see from the table above that there has been a particular fall in Elementary process plant occupations with vacancy numbers falling by 24, followed by 18 fewer Elementary construction occupations.
Tees Valley Job Vacancies January – December 2016
Page 12 of 37
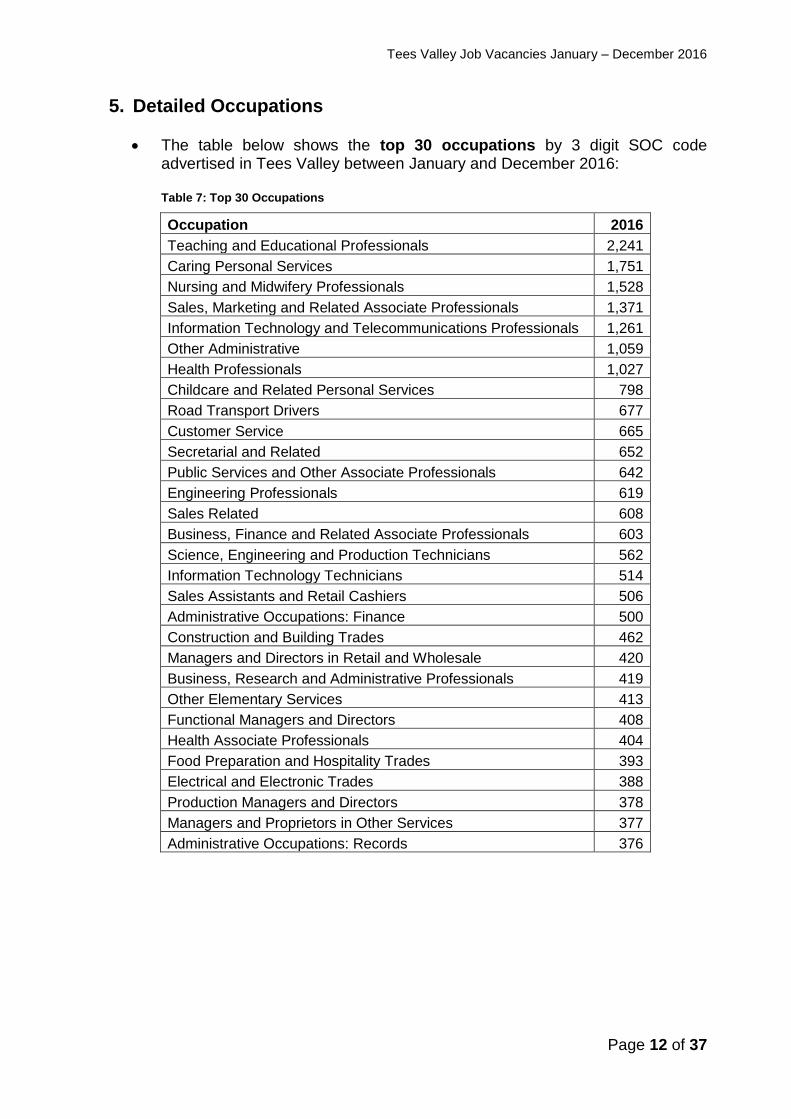
5. Detailed Occupations
The table below shows the top 30 occupations by 3 digit SOC code advertised in Tees Valley between January and December 2016:
Table 7: Top 30 Occupations
Occupation 2016
Teaching and Educational Professionals 2,241
Caring Personal Services 1,751
Nursing and Midwifery Professionals 1,528
Sales, Marketing and Related Associate Professionals 1,371
Information Technology and Telecommunications Professionals 1,261
Other Administrative 1,059
Health Professionals 1,027
Childcare and Related Personal Services 798
Road Transport Drivers 677
Customer Service 665
Secretarial and Related 652
Public Services and Other Associate Professionals 642
Engineering Professionals 619
Sales Related 608
Business, Finance and Related Associate Professionals 603
Science, Engineering and Production Technicians 562
Information Technology Technicians 514
Sales Assistants and Retail Cashiers 506
Administrative Occupations: Finance 500
Construction and Building Trades 462
Managers and Directors in Retail and Wholesale 420
Business, Research and Administrative Professionals 419
Other Elementary Services 413
Functional Managers and Directors 408
Health Associate Professionals 404
Food Preparation and Hospitality Trades 393
Electrical and Electronic Trades 388
Production Managers and Directors 378
Managers and Proprietors in Other Services 377
Administrative Occupations: Records 376
Tees Valley Job Vacancies January – December 2016
Page 13 of 37
The occupations that have shown the biggest increase in job vacancies when compared to 2015 (by 3 digit SOC code) can be seen in the table below.
Table 8: Largest Increases in Job Vacancies
Occupation 2015 2016 Change
Teaching and Educational Professionals 1,658 2,241 583
Health Professionals 568 1,027 459
Sales, Marketing and Related Associate Professionals 1,080 1,371 291
Caring Personal Services 1,461 1,751 290
Information Technology and Telecommunications Professionals 1,060 1,261 201
Public Services and Other Associate Professionals 467 642 175
Other Administrative Occupations 887 1,059 172
Managers and Directors in Retail and Wholesale 253 420 167
Functional Managers and Directors 275 408 133
Hairdressers and Related Services 127 251 124
The occupations that have shown the largest decrease in job vacancies when compared to 2015 (by 3 digit SOC code) are shown in the table below.
Table 9: Largest Decreases in Job Vacancies
Occupation 2015 2016 Change
Sales Assistants and Retail Cashiers 676 506 -170
Other Elementary Services Occupations 514 413 -101
Housekeeping and Related Services 253 177 -76
Managers and Proprietors in Health and Care Services 313 244 -69
Engineering Professionals 681 619 -62
Mobile Machine Drivers and Operatives 147 100 -47
Science, Engineering and Production Technicians 608 562 -46
Elementary Cleaning Occupations 225 183 -42
Welfare and Housing Associate Professionals 352 314 -38
Construction Operatives 121 83 -38
For a detailed analysis of occupation changes by district please see Appendix B.
Tees Valley Job Vacancies January – December 2016
Page 14 of 37
6. Average Advertised Wage
The average advertised wage in Tees Valley in 2016 was £26,880 a £500 or
1.8% decrease compared to £27,380 in 2015. Nationally the average advertised wage decreased by 2.1% (£760) from £36,340 in 2015 to £35,580 in 2016.
Chart 2: Average Advertised Wage in Tees Valley by occupation
Health Professionals have the highest average advertised wage in Tees Valley at £38,360, followed by Business, Media and Public Service Professionals at £37,840.
Tees Valley Job Vacancies January – December 2016
Page 15 of 37
Health Professionals have also seen the largest rise in average advertised wage when compared to 2015, rising 10% from £34,800 to £38,360 (a £3,560 increase).
The average wage of Sales occupations has also risen by 10%, from £21,780 in 2015 to £23,980 in 2016 (a £2,200 increase).
The average wage for Skilled Agricultural and Related Trades has risen by 9%, from £17,590 in 2015 to £19,160 in 2016 (a £1,570 increase).
The average wage for Teaching and Educational Professionals has seen a small 1% rise, from £32,000 in 2015 to £32,200 (a £200 increase).
There has been a 35% drop in the average advertised wage of Protective Service occupations with the average wage decreasing from £38,190 to £24,860 (a £13,330 drop), however numbers of vacancies are low for these occupations.
This is followed by a 17% drop in the average advertised wage of Customer Service occupations with the average advertise wage falling from £20,420 in 2015 to £16,910 in 2016 (a £3,510 decrease).
Tees Valley Job Vacancies January – December 2016
Page 16 of 37
7. Top Employers 40% of all job vacancies advertised in 2016 could be linked to an employer.
The chart below shows the top 10 employers to advertise job vacancies in Tees Valley in this time.
Chart 3: Top Tees Valley Employers
50% of employers in the top 10 are in the Health and Social Care sector.
20% of employers in the top 10 are the local authorities, which could include a range of jobs, including jobs in the education sector.
HC-One (private care home) advertised the highest number of private sector jobs at 145.
The top employers match historical trends, with no major changes over the last few years.
Tees Valley Job Vacancies January – December 2016
Page 17 of 37
8. Job Vacancies by Key Sector4
Please note: Only 56% of job vacancies advertised in 2016 could be allocated to an industry sector, therefore the following section should be used with caution and is not broken down into Tees Valley districts.
Chart 4: Tees Valley Key Sectors
The pie chart above shows the distribution of vacancies in Tees Valley by TVCA key sector between January – December 2016 inclusive. The highest proportions of vacancies advertised are in the Health Care sector with 39% of all vacancies and 6,222 job vacancies.
This is followed by Public Admin, Defence and Education with 19% of all vacancies (3 031 vacancies).
4 For sector definitions please see Appendix A.
Tees Valley Job Vacancies January – December 2016
Page 18 of 37
Chart 5: % Change in Job Vacancies
The graph above shows that the Other Services5 sector has seen a 38% rise in job vacancies when compared to 2015, with numbers increasing from 296 vacancies in 2015 to 408 in 2016 (112 extra vacancies). The majority of these extra vacancies were for Hairdressers and Barbers with 60 extra vacancies.
This is followed by a 28% rise in Public Admin, Defence and Education with numbers increasing by 654 from 2,377 in 2015 to 3,031 in 2016.
There has also been a 21% rise in the number of Wholesale and Retail vacancies when compared to 2015 with numbers increasing from 1,019 to 1,233 (214 extra vacancies).
Healthcare has also shown a rise in vacancies when compared to 2015, with a 20% rise and numbers increasing from 5,202 in 2015 to 6,222 in 2016 (1,020 extra vacancies).
However there has been a 20% drop in Culture and Leisure vacancies with numbers falling from 1,373 vacancies in 2015 to 1,096 in 2016 (277 fewer vacancies).
5 Other Services includes Hairdressing, funeral activities, physical well-being organisations such as gyms, repair of goods, and
charities amongst others.
Tees Valley Job Vacancies January – December 2016
Page 19 of 37
a) Construction
The Construction sector accounted for 2% of all vacancies advertised in Tees Valley in 2016 with 355 vacancies. The number of vacancies has dropped by 4% when compared to 2015, with numbers falling from 370 to 355 (15 fewer vacancies).
42% of job vacancies in Construction could be linked to an employer name. The top five employers to advertise Construction vacancies in 2016 were:
o Interserve (40 vacancies); o Carillion PLC (23 vacancies); o Anglian Home Improvements Group (5 vacancies); o Balfour Beatty (5 vacancies); and o Able Group (4 vacancies).
The average salary for the 355 Construction jobs advertised in 2016 was £29,629, a £1,011 increase compared to £28,618 in 2015.
b) Culture and Leisure
The Culture and Leisure sector accounted for 7% of all jobs advertised in Tees Valley in 2016 with 1,096 vacancies. However this sector has experienced the largest fall in vacancies compared to 2015 with a 20% drop and numbers falling from 1,373 in 2015 to 1,096 in 2016 (277 fewer vacancies). This is mainly due to a fall in vacancies for kitchen and catering assistants as well as chef’s, bar staff and waiter/waitresses.
58% of job vacancies in Culture and Leisure could be linked to an employer name. The top five employers to advertise vacancies in 2016 were:
o McDonalds (49 vacancies); o Huntercombe (43 vacancies); o Fitness First (38 vacancies); o Mitchells & Butlers (36 vacancies); and o Stonegate Pub Company (28 vacancies).
The average salary for the 1,096 Culture and Leisure jobs advertised in 2016 was £17,520 a £2,990 drop from the £20,510 average salary in 2015.
c) Health and Social Care
Health and Social Care is the largest sector for job vacancies in Tees Valley accounting for 39% of all vacancies advertised in 2016 with 6,222 vacancies. There has been a 20% rise in the number of vacancies advertised compared to 2015 with numbers increasing from 5,202 to 6,222 (1,020 extra vacancies).
55% of job vacancies in Health and Social Care could be linked to an employer name. The top five employers to advertise Health and Social Care vacancies in 2016 were:
Tees Valley Job Vacancies January – December 2016
Page 20 of 37
o National Health Service (2,060 vacancies); o HC-One (145 vacancies); o Care UK Health and Social Care (100 vacancies); o Voyage Care (93 vacancies); and o Four Seasons Health Care (80 vacancies); and
The average salary for the 6,222 Health and Social Care jobs advertised in 2016 was £30,069, a £997 increase from the £29,072 average salary in 2015.
d) IT, and Media
The IT and Media sector accounted for 1% of all jobs advertised in Tees Valley in 2016 with 137 vacancies. This sector has seen a 6% decrease in vacancies when compared to 2015 with numbers falling from 145 in 2015 to 137 in 2016 (8 fewer vacancies).
78% of job vacancies in IT and Media could be linked to an employer name. The top five employers to advertise vacancies in 2016 were:
o Virgin Media (12 vacancies); o EE Ltd (10 vacancies); o IRIS Software (9 vacancies); o Adept Telecom (8 vacancies); and o British Telecom (6 vacancies)
The average salary for the 137 IT and Media jobs advertised in 2016 was £23,495 a £1,511 rise from the £21,984 average salary in 2015. This wage reflects the entry and lower level IT vacancies advertised for various call centres in Tees Valley.
e) Logistics
The Logistics sector accounted for 3% of all job vacancies advertised in Tees Valley in 2016 with 404 vacancies. There has been a 7% rise in vacancies compared to 2015, with numbers increasing from 379 to 404 (25 extra vacancies).
37% of job vacancies in Logistics could be linked to an employer name. The top five employers to advertise Logistics vacancies in 2016 were:
o Royal Mail (20 vacancies); o PD Ports Group (6 vacancies); o TUIAG (6 vacancies); o McColls (5 vacancies); and o Stagecoach Group PLC (5 vacancies)
The average salary for the 404 Logistics jobs advertised in 2016 was £25,825, a £1,109 drop from the £26,934 average salary in 2015.
f) Production Industries
Production Industries accounted for 9% of all job vacancies advertised in Tees Valley in 2016 with 1,513 vacancies. However there has been a 2%
Tees Valley Job Vacancies January – December 2016
Page 21 of 37
drop in vacancies compared to 2015, with numbers falling from 1,537 to 1,513 (24 fewer vacancies). There has been a particular fall in vacancies for production managers and directors alongside engineering professionals.
36% of job vacancies in Production Industries could be linked to an employer name. The top five employers to advertise vacancies in 2016 were:
o Foster Wheeler (103 vacancies); o Huntsman Ltd (45 vacancies); o Cummins Ltd (26 vacancies); o Airbus (24 vacancies); and o Johnson Matthey (21 vacancies).
The average salary for the 1,513 Production Industries jobs advertised in 2016 was £29,694, a £329 increase from the £29,365 average salary in 2015.
g) Professional and Business Services
The Professional and Business Services sector accounted for 11% of all job vacancies advertised in Tees Valley in 2016 with 1,718 vacancies. There has been a 15% rise in vacancies compared to 2015, with numbers increasing from 1,497 to 1,718 (221 extra vacancies).
46% of job vacancies in Professional and Business services could be linked to an employer name. The top five employers to advertise vacancies in 2016 were:
o AMEC (60 vacancies); o Wesser LTD (48 vacancies); o G4S (45 vacancies); o Barclays (29 vacancies); and o Cordant Group (23 vacancies)
The average salary for the 1,718 Professional and Business Services jobs advertised in 2016 was £25,117, a £1,977 decrease compared to the £27,094 average salary in 2015.
h) Public Admin, Defence and Education
The Public Admin, Defence and Education sector is the second largest sector with 19% of all job vacancies advertised in Tees Valley in 2016 (3,031 vacancies). There has been a 28% rise in vacancies compared to 2015, with numbers increasing from 2,377 to 3,031 (654 extra vacancies). The vast majority of these extra vacancies were for secondary education teachers.
36% of job vacancies in Public Admin, Defence and Education could be linked to an employer name. The top five employers to advertise vacancies in 2016 were:
o Capita Plc (72 vacancies); o Applied Systems Ltd (50 vacancies); o Stockton Riverside College (45 vacancies);
Tees Valley Job Vacancies January – December 2016
Page 22 of 37
o Teesside University (45 vacancies); and o Education Network (34 vacancies);
The average salary for the 3,031 Public Admin, Defence and Education jobs advertised in 2016 was £24,776, similar to the £24,860 seen in 2015.
i) Wholesale and Retail
The Wholesale and Retail sector accounted for 8% of all job vacancies advertised in Tees Valley in 2016 with 1,233 vacancies. There has been a 21% rise in vacancies compared to 2015, with numbers increasing from 1,019 to 1,233 (214 extra vacancies).
61% of job vacancies in Wholesale and Retail could be linked to an employer name. The top five employers to advertise vacancies in 2016 were:
o Tesco (66 vacancies); o Lidl (49 vacancies); o Travis Perkins (36 vacancies); o WHSmiths (20 vacancies); and o Aldi (18 vacancies).
The average salary for the 1,233 Wholesale and Retail jobs advertised in 2016 was £22,058, a £775 drop from the £22,833 average salary for 2015.
j) Other Services
The Other Services sector accounted for 3% of all job vacancies advertised in Tees Valley in 2016 with 408 vacancies. This sector has seen the largest percentage rise in Tees Valley compared to 2015 with a 38% increase and numbers increasing from 296 to 408 (112 extra vacancies). The majority of these extra vacancies have been for hairdressers and barbers.
88% of job vacancies in Other Services could be linked to an employer name. The top five employers to advertise vacancies in 2016 were:
o The Bannatyne Group (65 vacancies); o The Automotive Association (41 vacancies); o Deep Limited (8 vacancies); o West Middlesbrough Neighbourhood Trust (6 vacancies); and o Sally Beauty Holdings (6 vacancies).
The average salary for the 408 Other Services jobs advertised in 2016 was £15,911, a £1,854 drop from the £17,765 average salary for 2015.
Tees Valley Job Vacancies January – December 2016
Page 23 of 37
9. Top Skills
Labour Insight groups skills into three groups;
o Baseline Skills such as communication and problem solving;
o Specialist Skills such as teaching and repair; and
o Computer and Programming Skills such as Microsoft Excel and JavaScript.
The table below shows the top 10 baseline skills requested in Tees Valley in 2016 along with the number of vacancies which requested the skill: Table 10: Top 10 Baseline Skills
Baseline Skills 2016
Communication Skills 5,389
Organisational Skills 3,471
Mathematics 1,939
Planning 1,616
English 1,517
Team Work/ Collaboration 1,327
Detail-Orientated 1,289
Writing 1,051
Creativity 869
Problem Solving 795
The table below shows the top 10 specialist skills requested in Tees Valley in 2016 along with the number of vacancies which requested the skill:
Table 11: Top 10 Specialist Skills
Specialist Skill 2,016
Customer Service 1,824
Teaching 1,777
Sales 1,285
Microsoft Excel 1,274
Microsoft Office 984
Business Management 928
Mental Health 910
Repair 893
Product Sales 662
Caregiving 659
The table below shows the top 10 computer and programming skills requested in Tees Valley in 2016 along with the number of vacancies which requested the skill:
Tees Valley Job Vacancies January – December 2016
Page 24 of 37
Table 12: Top 10 Computer and Programming Skills
Computer and Programming 2016
Microsoft Excel 1,274
Microsoft Office 984
JavaScript 590
Microsoft Windows 423
SQL 351
Microsoft Powerpoint 273
SAP 260
Microsoft C# 250
Computer Aided Draughting/Design (CAD) 226
.NET Programming 172
The top 10 baseline skills which are required in an increasing number of job vacancies compared to 2015 are shown in the table below:
Table 13: Increase in Baseline Skills
Baseline Skills 2015 2016 Change
Organisational Skills 2428 3,471 1,043
Mathematics 1069 1,939 870
Communication Skills 4554 5,389 835
English 859 1,517 658
Detail-Orientated 893 1,289 396
Time Management 399 690 291
File Management 356 577 221
Creativity 705 869 164
Problem Solving 660 795 135
Planning 1484 1,616 132
There has been a large rise in the number of vacancies requesting organisational skills.
The top 10 specialist skills which are required in an increasing number of job vacancies compared to 2015 are shown in the table below:
Table 14: Increase in Specialist Skills
Specialist Skill 2015 2016 Change
Teaching 1178 1,777 599
Employment Rights 0 193 193
Teaching Science 0 186 186
Sales Recruiting 279 463 184
Sales 1110 1,285 175
Billing Systems 324 494 170
Customer Service 1656 1,824 168
Lesson Planning 77 245 168
Retail Industry Background 0 168 168
Mental Health 771 910 139
Tees Valley Job Vacancies January – December 2016
Page 25 of 37
Teaching has shown the largest rise when compared to the same period in 2015.
The top 10 computer and programming skills which are required in an increasing number of job vacancies compared to 2015 are shown in the table below:
Table 15: Increase in Computer and Programming Skills
Computer and Programming 2015 2,016 Change
Microsoft Excel 973 1,274 301
Microsoft Office 867 984 117
Microsoft Windows 348 423 75
Microsoft Powerpoint 199 273 74
Hypertext Preprocessor (PHP) 119 170 51
MySQL 65 109 44
CSS 33 74 41
Microsoft PowerShell 3 43 40
LINUX 55 94 39
NoSQL 8 41 33
Tees Valley Job Vacancies January – December 2016
Page 26 of 37
10. Conclusions This report has summarised the characteristics of online job vacancies within Tees Valley as analysed by the Labour Insight system between January and December 2016. There has been a 12% rise in online job vacancies when compared to January – December 2015 with vacancies increasing from 25,858 to 28,876 (3,018 extra vacancies). This compares to a 14% increase nationally and an 18% increase across the North of England.
All Tees Valley districts have seen a growth in job vacancies over the last year, with Darlington showing the largest rise of 23% (1,142 extra vacancies) and Middlesbrough experiencing the smallest growth at 1% and 107 extra vacancies. This increase across Tees Valley has been driven by a 35% rise in vacancies for teachers (583 extra vacancies) and a 31% rise in corporate managers and directors (342 extra vacancies), in particular secondary school teachers and managers and directors in retail and wholesale. The proportion of job vacancies were highest in the Healthcare sector with 39% of all vacancies, followed by Public admin, defence and education with 19%. The National Health Service advertised the most job vacancies, followed by Redcar and Cleveland Council. This large percentage of job vacancies available for public sector jobs reflects the larger than average public sector employment within Tees Valley, with latest figures from ONS showing that 23% of all employment within Tees Valley is public sector, compared to 17% nationally. The Other Services6 sector has seen the largest percentage increase (38% or 112 extra vacancies) when compared to 2015, with a rise in the number of advertisements for hairdressing and other beauty related vacancies in particular. The average advertised wage for job vacancies in Tees Valley in 2016 was £26,882 a 1.8% decrease from the £27,382 seen in 2015. This is compared to a 2.1% decrease nationally (falling from £36,341 to £35,579). Specialist Skills in Customer Service were of highest demand in Tees Valley in 2016, followed by Teaching. Teaching has shown the largest rise when compared to the same period in 2015. Computer and Programming Skills in Microsoft Excel were of the greatest demand in 2016, Excel skills also showed the largest rise over the last year.
Tees Valley Combined Authority, Economic Strategy and Intelligence January 2017
6 Other Services includes Hairdressing, funeral activities, physical well-being organisations such as gyms, repair of goods, and
charities amongst others.
Tees Valley Job Vacancies January – December 2016
Page 27 of 37
11. Appendix A – Sector Definitions
Table 16: Sector Definitions
TVCA broad sector SIC Description SIC Code
Construction Construction F
Culture and Leisure Accommodation And Food Service Activities I
Arts, Entertainment And Recreation R
Healthcare Human Health And Social Work Activities Q
IT, Media & Other Services Information And Communication J
Logistics Transportation And Storage H
Production Industries
Agriculture, Forestry And Fishing A
Electricity, Gas, Steam And Air Conditioning Supply D
Manufacturing C
Mining And Quarrying B
Water Supply; Sewerage, Waste Management And Remediation Activities E
Professional & Business Services
Financial And Insurance Activities K
Professional, Scientific And Technical Activities M
Real Estate Activities L
Administrative And Support Service Activities N
Public Admin, Defence & Education
Education P
Public Administration And Defence; Compulsory Social Security O
Wholesale & Retail Wholesale And Retail Trade; Repair Of Motor Vehicles And Motorcycles G
Other Services Other Service Activities S
Tees Valley Job Vacancies January – December 2016
Page 28 of 37
12. Appendix B – Occupation Changes by Local Authority
Darlington
There were 6,194 Darlington job vacancies advertised online in 2016, a 23% increase compared to 2015 (1,142 extra vacancies). Darlington has seen the largest percentage rise in Tees Valley.
The chart below shows the distribution of vacancies in Darlington by 2 digit SOC group:
Chart 6: Darlington Job Vacancies
In 2016 the largest percentage of vacancies (12%) were for Health Professionals with 756 vacancies, followed by Business and Public
Tees Valley Job Vacancies January – December 2016
Page 29 of 37
Service Associate Professionals with 11% of all vacancies (675 vacancies).
The largest rise in job vacancies over the last year has been for Business and Public Service Associate Professionals with a 53% rise (235 extra vacancies).
There has also been a 43% increase in Health Professionals with numbers increasing from 527 in 2015 to 756 in 2016 (229 extra vacancies).
There has been 31% drop in vacancies for Other Managers and Proprietors compared to 2015 with 56 fewer vacancies.
The tables below show the top 10 vacancy increases and decreases in Darlington over the last year by 3 digit Standard Occupational Classification (SOC) group:
Table 17 - Top 10 Darlington increases
Top 10 vacancy increases in Darlington 2015 2016 Change
Health Professionals 93 238 145
Teaching and Educational Professionals 227 369 142
Sales, Marketing and Related Associate Professionals 221 328 107
Public Services and Other Associate Professionals 90 190 100
Other Administrative Occupations 177 253 76
Caring Personal Services 276 328 52
Managers and Directors in Retail and Wholesale 38 89 51
Nursing and Midwifery Professionals 414 464 50
Administrative Occupations: Records 68 112 44
Road Transport Drivers 121 163 42
Table 18 - Top 10 Darlington decreases
Top 10 vacancy decreases in Darlington 2015 2016 Change
Managers and Proprietors in Health and Care Services 94 47 -47
Other Elementary Services Occupations 125 102 -23
Engineering Professionals 139 120 -19
Managers and Proprietors in Hospitality and Leisure Services 28 13 -15
Customer Service Managers and Supervisors 22 8 -14
Legal Professionals 34 21 -13
Design Occupations 20 8 -12
Welfare and Housing Associate Professionals 62 52 -10
Health and Social Services Managers and Directors 38 28 -10
Information Technology and Telecommunications Professionals 230 221 -9
Over the last three years Darlington has seen an 11% fall in job vacancies. Vacancy numbers have dropped from 6,997 in 2013 to 6,194 in 2016 (803 fewer vacancies). There has been a 52% drop in vacancies for Sales occupations with numbers falling from 553 vacancies in 2013 to 264 in 2016 (289 fewer vacancies).
Tees Valley Job Vacancies January – December 2016
Page 30 of 37
Hartlepool
There were 2,330 Hartlepool job vacancies advertised online in 2016, a 21% increase compared to 2015 (403 extra vacancies). Hartlepool consistently has the lowest number of job vacancies in Tees Valley.
The chart below shows the distribution of vacancies in Hartlepool by 2 digit SOC group:
Chart 7: Hartlepool Occupational Groups
In 2016 the largest percentage of job vacancies (12%) were for both
Teaching and Educational Professionals (270 vacancies) and Health Professionals (269 vacancies). This is followed by Caring Personal Service vacancies with 10% (225 vacancies).
Tees Valley Job Vacancies January – December 2016
Page 31 of 37
There has been a 74% increase in Teaching and Educational Professionals over the last year with vacancies increasing from 155 in 2015 to 270 in 2016 (115 extra vacancies).
There has also been a 37% increase in Caring Personal Service occupations with vacancies increasing from 164 in 2015 to 225 in 2016 (61 extra vacancies).
The tables below show the top 10 vacancy increases and decreases in Hartlepool over the last year by 3 digit SOC group.
Table 19 - Top 10 Hartlepool increases
Top 10 job vacancy increases in Hartlepool 2015 2,016 Change
Teaching and Educational Professionals 155 270 115
Childcare and Related Personal Services 56 99 43
Engineering Professionals 43 79 36
Production Managers and Directors 15 42 27
Managers and Proprietors in Other Services 20 46 26
Managers and Directors in Retail and Wholesale 24 49 25
Hairdressers and Related Services 6 28 22
Nursing and Midwifery Professionals 173 194 21
Caring Personal Services 105 126 21
Health Professionals 46 67 21
Table 20 - Top 10 Hartlepool decreases
Top 10 job vacancy decreases in Hartlepool 2015 2016 Change
Managers and Proprietors in Health and Care Services 33 10 -23
Sales Related Occupations 71 52 -19
Road Transport Drivers 51 39 -12
Electrical and Electronic Trades 23 11 -12
Construction Operatives 13 5 -8
Therapy Professionals 15 8 -7
Functional Managers and Directors 21 15 -6
Quality and Regulatory Professionals 17 11 -6
Assemblers and Routine Operatives 12 6 -6
Food Preparation and Hospitality Trades 36 31 -5
Over the last three years Hartlepool has seen a 7% increase in job vacancies, with numbers rising from 2,183 in 2013 to 2,330 in 2016 (147 extra vacancies). There has been a particular 200% rise in Health and Social Care Associate Professionals (52 extra vacancies), followed by a 62% rise in Caring Personal Service vacancies (86 extra vacancies).
Tees Valley Job Vacancies January – December 2016
Page 32 of 37
Middlesbrough
Middlesbrough consistently has the highest number of job vacancies in Tees Valley. There were 10,642 Middlesbrough job vacancies advertised online in 2016, a 1% increase compared 2015 (107 extra vacancies).
The chart below shows the distribution of vacancies in Middlesbrough by 2 digit SOC group.
Chart 8: Middlesbrough Occupational Groups
In 2016 the largest percentage of vacancies (10%) were for Business and
Public Service Associate Professionals (1,055 vacancies). This is followed by Health Professionals with 9% (912 vacancies).
Tees Valley Job Vacancies January – December 2016
Page 33 of 37
There has been a 24% rise in vacancies for Teaching and Educational Professionals with vacancies increasing from 660 in 2015 to 818 in 2016 (158 extra vacancies).
The tables below show the top 10 vacancy increases and decreases in Middlesbrough over the last year by 3 digit (SOC) group:
Table 21 - Top 10 Middlesbrough increases
Top 10 job vacancy increases in Middlesbrough 2015 2016 Change
Health Professionals 255 426 171
Teaching and Educational Professionals 660 818 158
Information Technology and Telecommunications Professionals 406 537 131
Sales, Marketing and Related Associate Professionals 443 530 87
Functional Managers and Directors 120 192 72
Sales Related Occupations 235 299 64
Managers and Directors in Retail and Wholesale 100 157 57
Health Associate Professionals 107 159 52
Managers and Proprietors in Other Services 110 148 38
Childcare and Related Personal Services 236 273 37
Table 22 - Top 10 Middlesbrough decreases
Top 10 job vacancy decreases in Middlesbrough 2015 2016 Change
Sales Assistants and Retail Cashiers 318 208 -110
Science, Engineering and Production Technicians 286 209 -77
Other Elementary Services Occupations 193 134 -59
Welfare and Housing Associate Professionals 173 118 -55
Nursing and Midwifery Professionals 479 425 -54
Food Preparation and Hospitality Trades 157 104 -53
Vehicle Trades 146 97 -49
Housekeeping and Related Services 130 81 -49
Road Transport Drivers 302 262 -40
Engineering Professionals 258 221 -37
Over the last three years Middlesbrough has seen a 21% rise in vacancies, the largest percentage rise in Tees Valley, with numbers rising from 8,818 vacancies in 2013 to 10,642 in 2016 (1,824 extra vacancies), with a 57% increase in Caring Personal Service vacancies rising from 542 vacancies in 2013 to 849 vacancies in 2016 (307 extra vacancies).
Tees Valley Job Vacancies January – December 2016
Page 34 of 37
Redcar and Cleveland
There were 3,177 Redcar and Cleveland job vacancies advertised online in 2016, a 15% increase compared to 2015 (422 extra vacancies).
The chart below shows the distribution of vacancies in Redcar and Cleveland by 2 digit SOC group.
Chart 9: Redcar and Cleveland Occupational Groups
In 2016 the largest percentage of vacancies (15%) were for Caring Personal
Service occupations (471 vacancies). This is followed by Teaching and Educational Professionals with 13% (398 vacancies).
Tees Valley Job Vacancies January – December 2016
Page 35 of 37
There has been a 64% increase in Teaching and Educational Professional vacancies with numbers increasing from 243 in 2015 to 398 in 2016 (155 extra vacancies).
The tables below show the top 10 vacancy increases and decreases in Redcar and Cleveland over the last year by 3 digit (SOC) group:
Table 23 - Top 10 Redcar and Cleveland increases
Top 10 job vacancy increases in Redcar and Cleveland 2015 2016 Change
Teaching and Educational Professionals 243 398 155
Caring Personal Services 222 334 112
Health Professionals 69 119 50
Other Administrative Occupations 89 132 43
Information Technology and Telecommunications Professionals 81 115 34
Hairdressers and Related Services 30 55 25
Vehicle Trades 22 45 23
Administrative Occupations: Records 18 41 23
Construction and Building Trades 32 53 21
Managers and Directors in Retail and Wholesale 19 40 21
Table 24 - Top 10 Redcar and Cleveland decreases
Top 10 job vacancy decreases in Redcar and Cleveland 2015 2016 Change
Other Elementary Services Occupations 63 21 -42
Nursing and Midwifery Professionals 133 99 -34
Housekeeping and Related Services 53 21 -32
Sales Related Occupations 60 43 -17
Elementary Cleaning Occupations 25 9 -16
Managers and Proprietors in Health and Care Services 29 14 -15
Legal Professionals 24 11 -13
Natural and Social Science Professionals 57 45 -12
Legal Associate Professionals 16 4 -12
Elementary Process Plant Occupations 21 11 -10
Over the last three years Redcar and Cleveland has seen a 22% fall in vacancies (the largest in Tees Valley) with numbers decreasing from 4,081 vacancies in 2013 to 3,177 in 2016 (904 fewer vacancies), with a 56% decrease in Science, Research, Engineering and Technology Professionals (266 fewer vacancies).
There has also been a 60% decrease in vacancies for Sales occupations with numbers decreasing from 279 in 2013 to 111 in 2016 (168 fewer vacancies).
Tees Valley Job Vacancies January – December 2016
Page 36 of 37
Stockton-on-Tees
There were 6,406 Stockton-on-Tees job vacancies advertised online in 2016, a 22% increase compared to 2015 (1,153 extra vacancies).
The chart below shows the distribution of vacancies in Stockton-on-Tees by 2 digit SOC group.
Chart 10: Stockton-on-Tees Occupational Groups
In 2016 the largest percentage of vacancies (9%) was shared between four
occupational groups; Business and Public Service Associate Professionals (589 vacancies), Science, Research, Engineering and
Tees Valley Job Vacancies January – December 2016
Page 37 of 37
Technology Professionals (578 vacancies), Administrative occupations (559 vacancies), and Health Professionals (554 vacancies).
There has been a 43% increase Business and Public Service Associate Professionals with vacancies increasing from 413 in 2015 to 589 in 2016 (176 extra vacancies). This is followed by a 36% increase in Caring Personal Service occupations with vacancies rising from 398 to 540 (142 extra vacancies).
The tables below show the top 10 vacancy increases and decreases in Stockton-on-Tees over the last year by 2 digit (SOC) group:
Table 25 - Top 10 Stockton-on-Tees increases
Top 10 job vacancy increases in Stockton-on-Tees 2015 2016 Change
Caring Personal Services 216 368 152
Sales, Marketing and Related Associate Professionals 239 324 85
Customer Service Occupations 118 199 81
Other Administrative Occupations 222 299 77
Health Professionals 103 177 74
Welfare Professionals 48 117 69
Information Technology Technicians 105 164 59
Public Services and Other Associate Professionals 72 123 51
Information Technology and Telecommunications Professionals 304 353 49
Business, Finance and Related Associate Professionals 97 136 39
Table 26 - Top 10 Stockton-on-Tees decreases
Occupation 2015 2016 Change
Sales Assistants and Retail Cashiers 133 86 -47
Sales Related Occupations 138 99 -39
Engineering Professionals 182 150 -32
Construction and Building Trades 76 54 -22
Draughtspersons and Related Architectural Technicians 32 14 -18
Childcare and Related Personal Services 177 164 -13
Elementary Cleaning Occupations 54 41 -13
Elementary Security Occupations 42 29 -13
Elementary Administration Occupations 12 2 -10
Design Occupations 22 14 -8
Over the last three years Stockton-on-Tees has seen a 9% rise in vacancies with numbers increasing from 5,894 vacancies in 2013 to 6,406 in 2016 (512 extra vacancies), with an 87% increase in vacancies for Health Professional (257 extra vacancies).