24
TEGRA K1 DEVELOPER TOOLS FOR ANDROID Sébastien Dominé, Sr. Director SW Engineering | SIGGRAPH 2014
TEGRA K1 DEVELOPER TOOLS FOR ANDROIDSébastien Dominé, Sr. Director SW Engineering | SIGGRAPH 2014
https://developer.nvidia.com/gameworks
AGENDA
NVIDIA Developer Tools Introduction
Multi-core CPU tools
Graphics Developer Tools
Compute Developer Tools
Q&A
https://developer.nvidia.com/gameworks
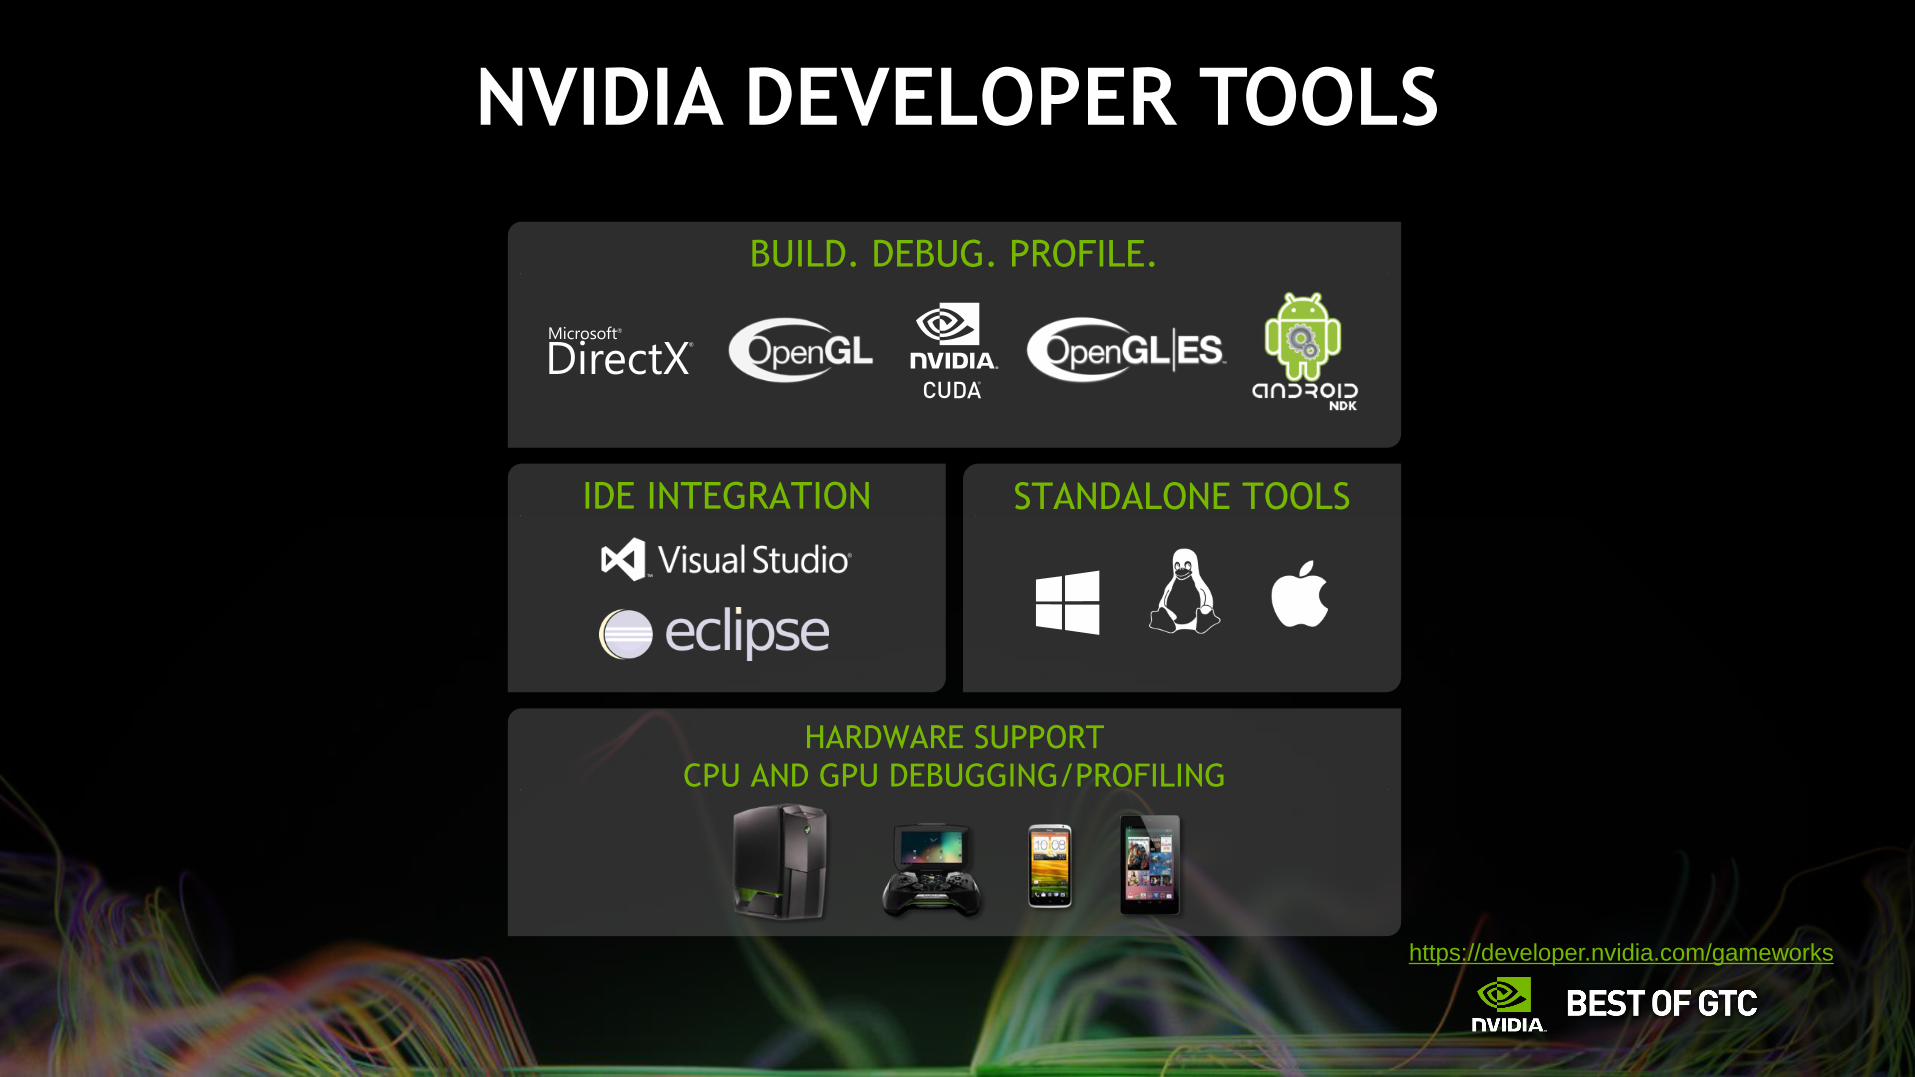
NVIDIA DEVELOPER TOOLS
HARDWARE SUPPORT
CPU AND GPU DEBUGGING/PROFILING
BUILD. DEBUG. PROFILE.
STANDALONE TOOLSIDE INTEGRATION
https://developer.nvidia.com/gameworks
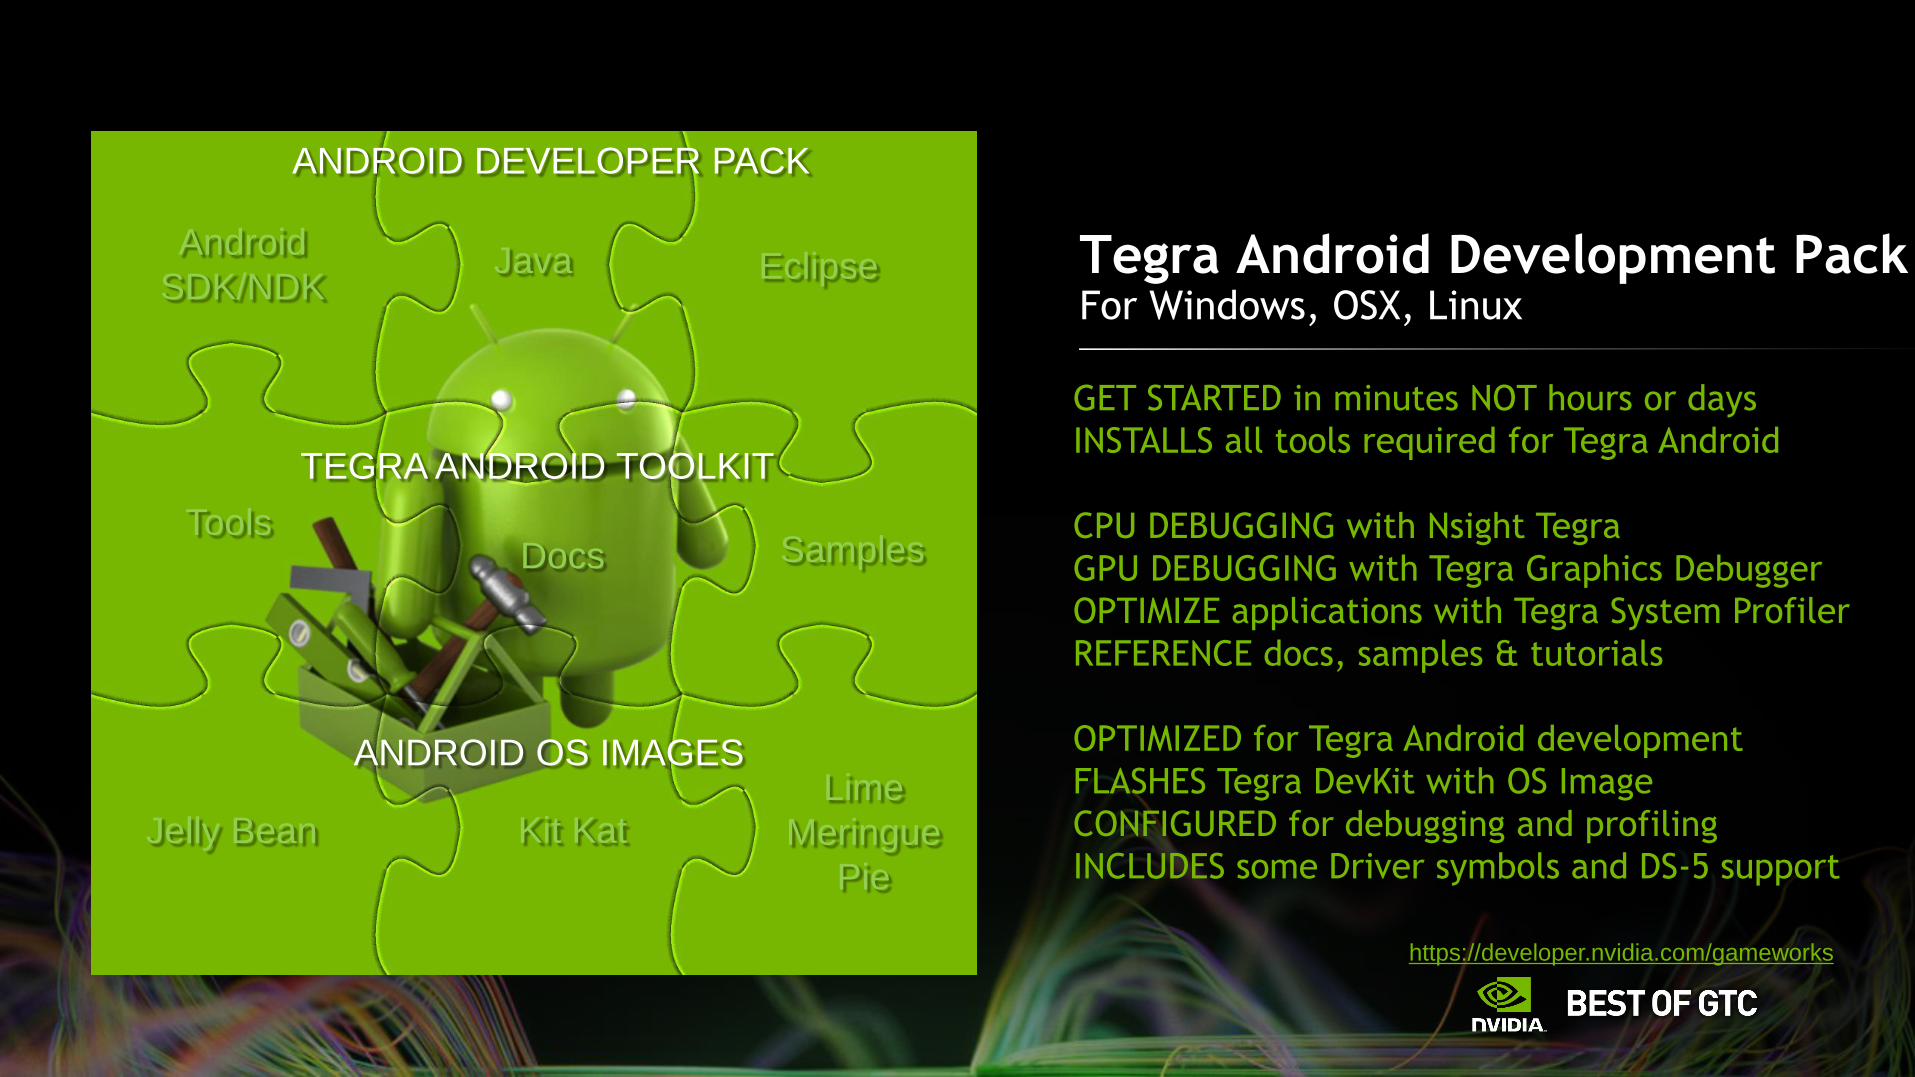
GET STARTED in minutes NOT hours or days
INSTALLS all tools required for Tegra Android
CPU DEBUGGING with Nsight Tegra
GPU DEBUGGING with Tegra Graphics Debugger
OPTIMIZE applications with Tegra System Profiler
REFERENCE docs, samples & tutorials
OPTIMIZED for Tegra Android development
FLASHES Tegra DevKit with OS Image
CONFIGURED for debugging and profiling
INCLUDES some Driver symbols and DS-5 support
Tegra Android Development PackFor Windows, OSX, Linux
ANDROID DEVELOPER PACK
TEGRA ANDROID TOOLKIT
ANDROID OS IMAGES
Android
SDK/NDKEclipseJava
SamplesDocsTools
Jelly Bean Kit KatLime
Meringue
Pie
https://developer.nvidia.com/gameworks
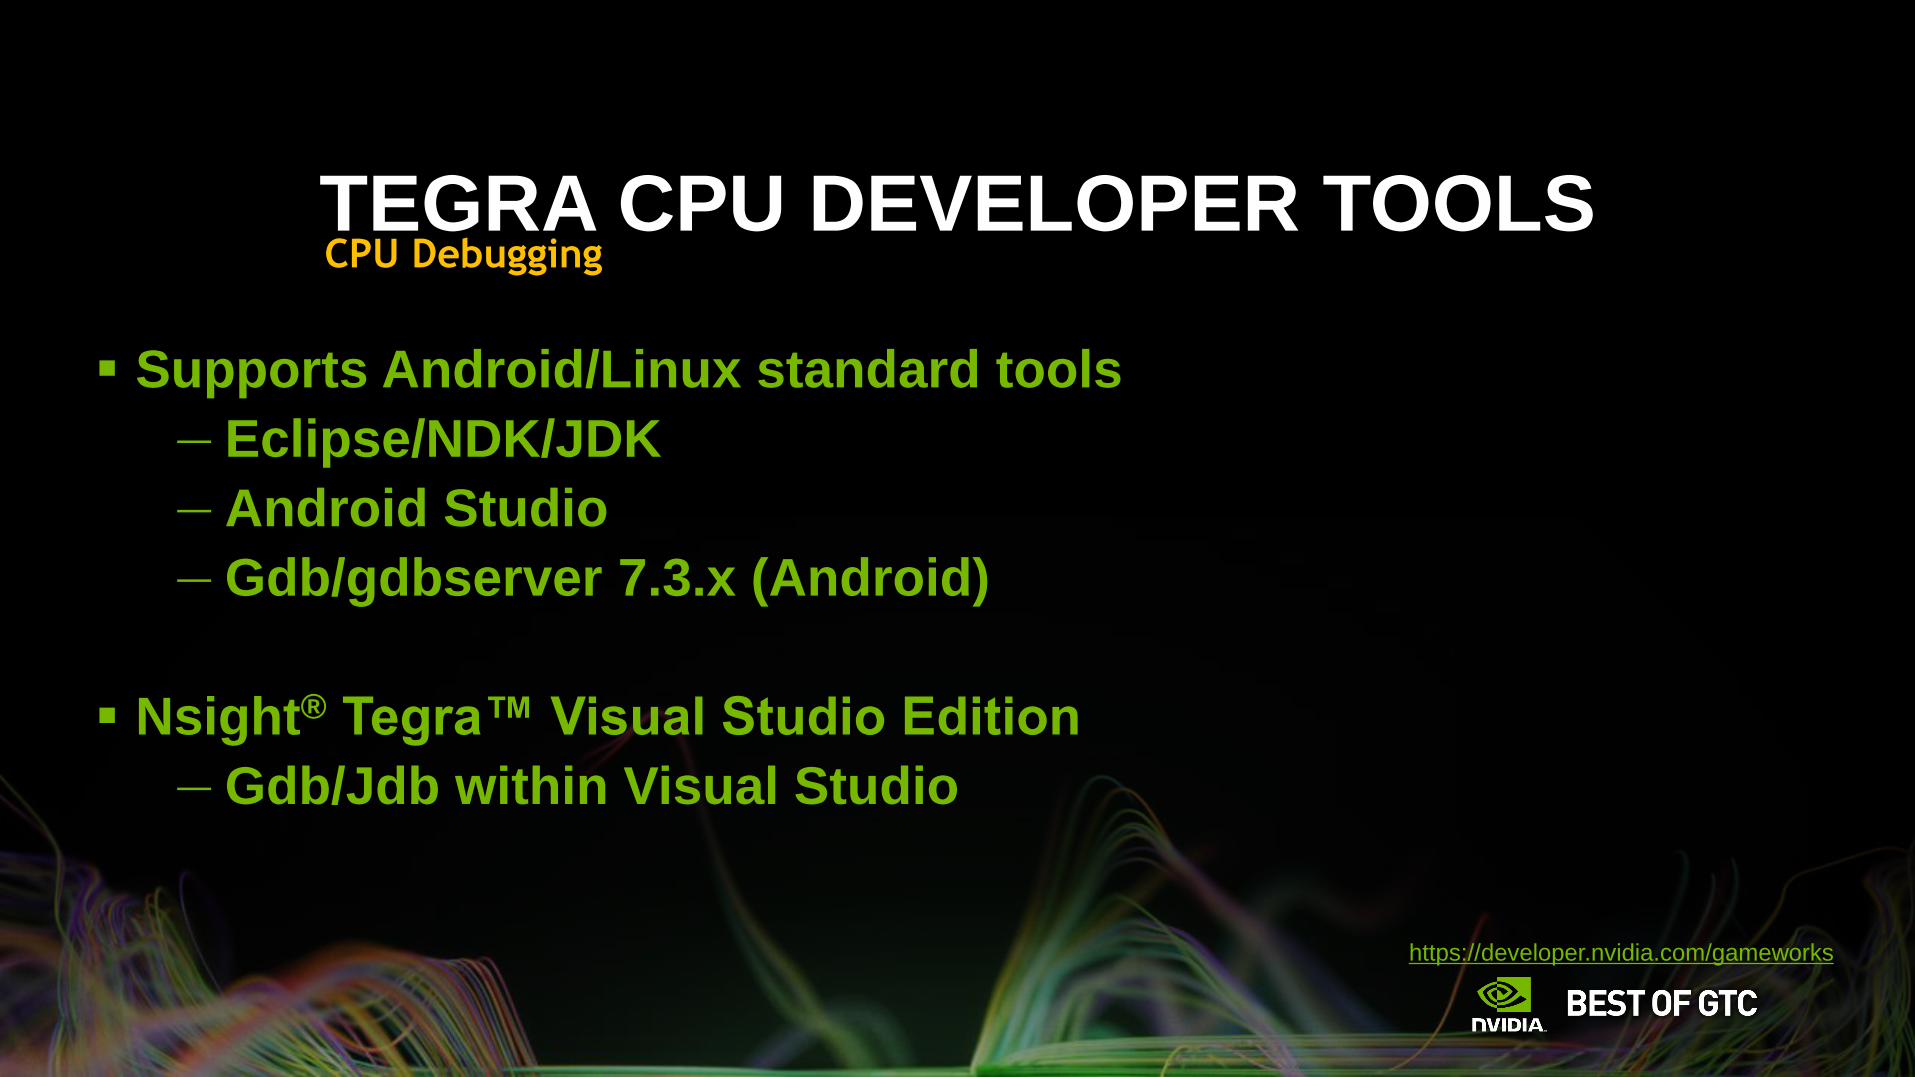
TEGRA CPU DEVELOPER TOOLS
Supports Android/Linux standard tools
— Eclipse/NDK/JDK
— Android Studio
— Gdb/gdbserver 7.3.x (Android)
Nsight® Tegra™ Visual Studio Edition
— Gdb/Jdb within Visual Studio
CPU Debugging
https://developer.nvidia.com/gameworks
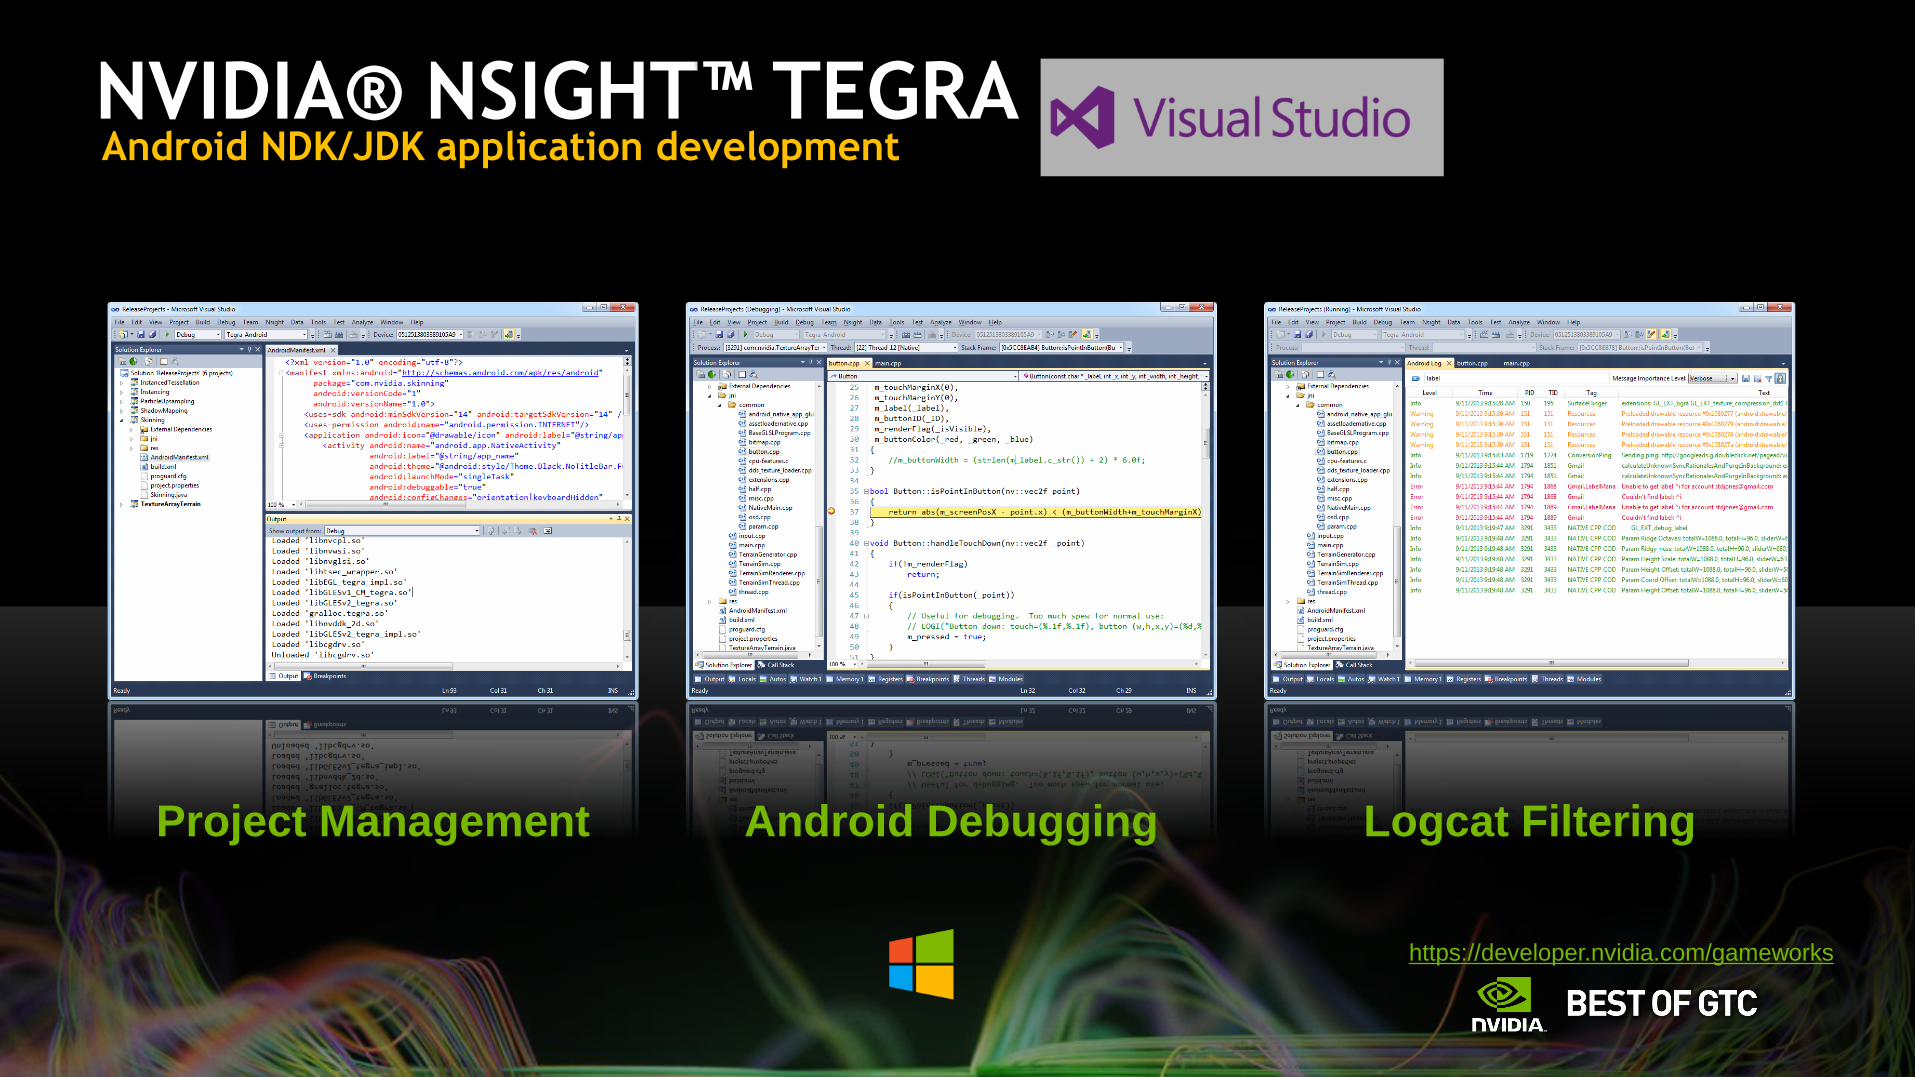
Android Debugging Logcat FilteringProject Management
Android NDK/JDK application developmentNVIDIA® NSIGHT™ TEGRA
https://developer.nvidia.com/gameworks
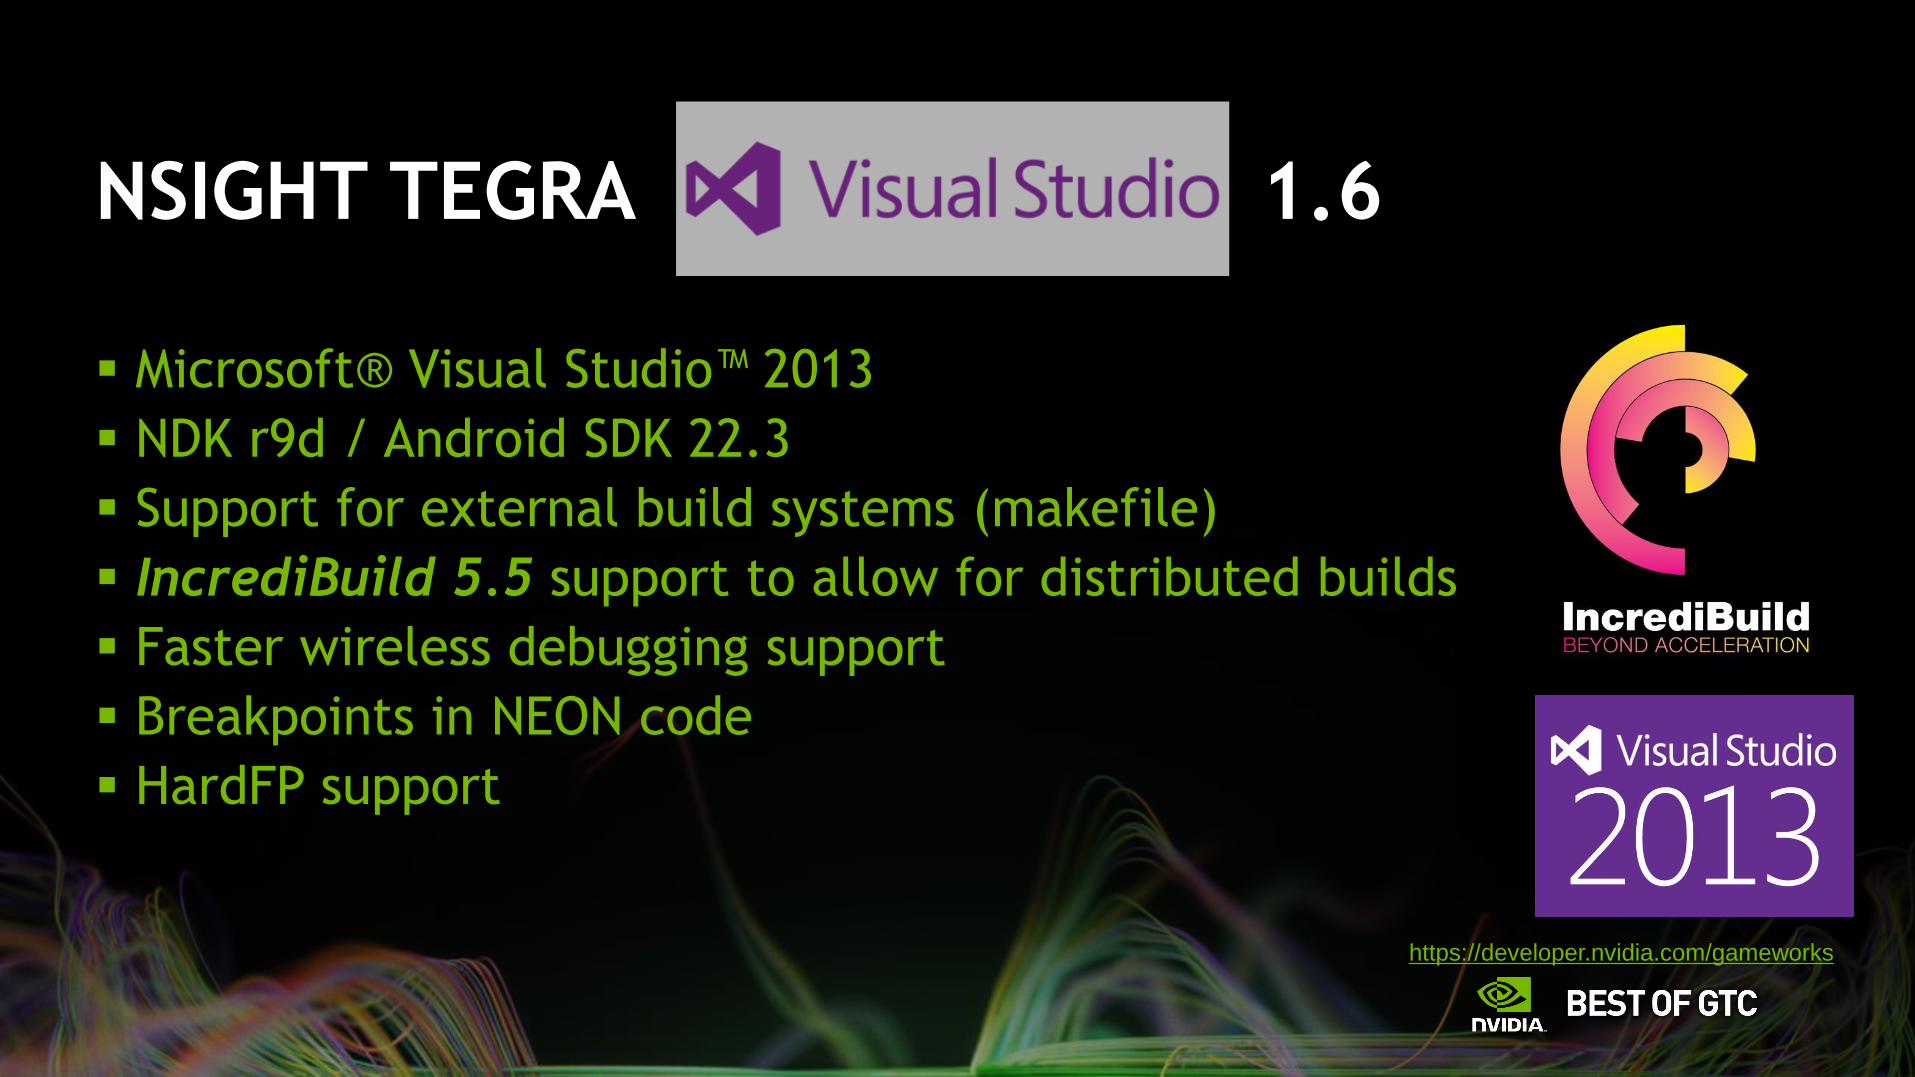
NSIGHT TEGRA 1.6
Microsoft® Visual Studio™ 2013
NDK r9d / Android SDK 22.3
Support for external build systems (makefile)
IncrediBuild 5.5 support to allow for distributed builds
Faster wireless debugging support
Breakpoints in NEON code
HardFP support
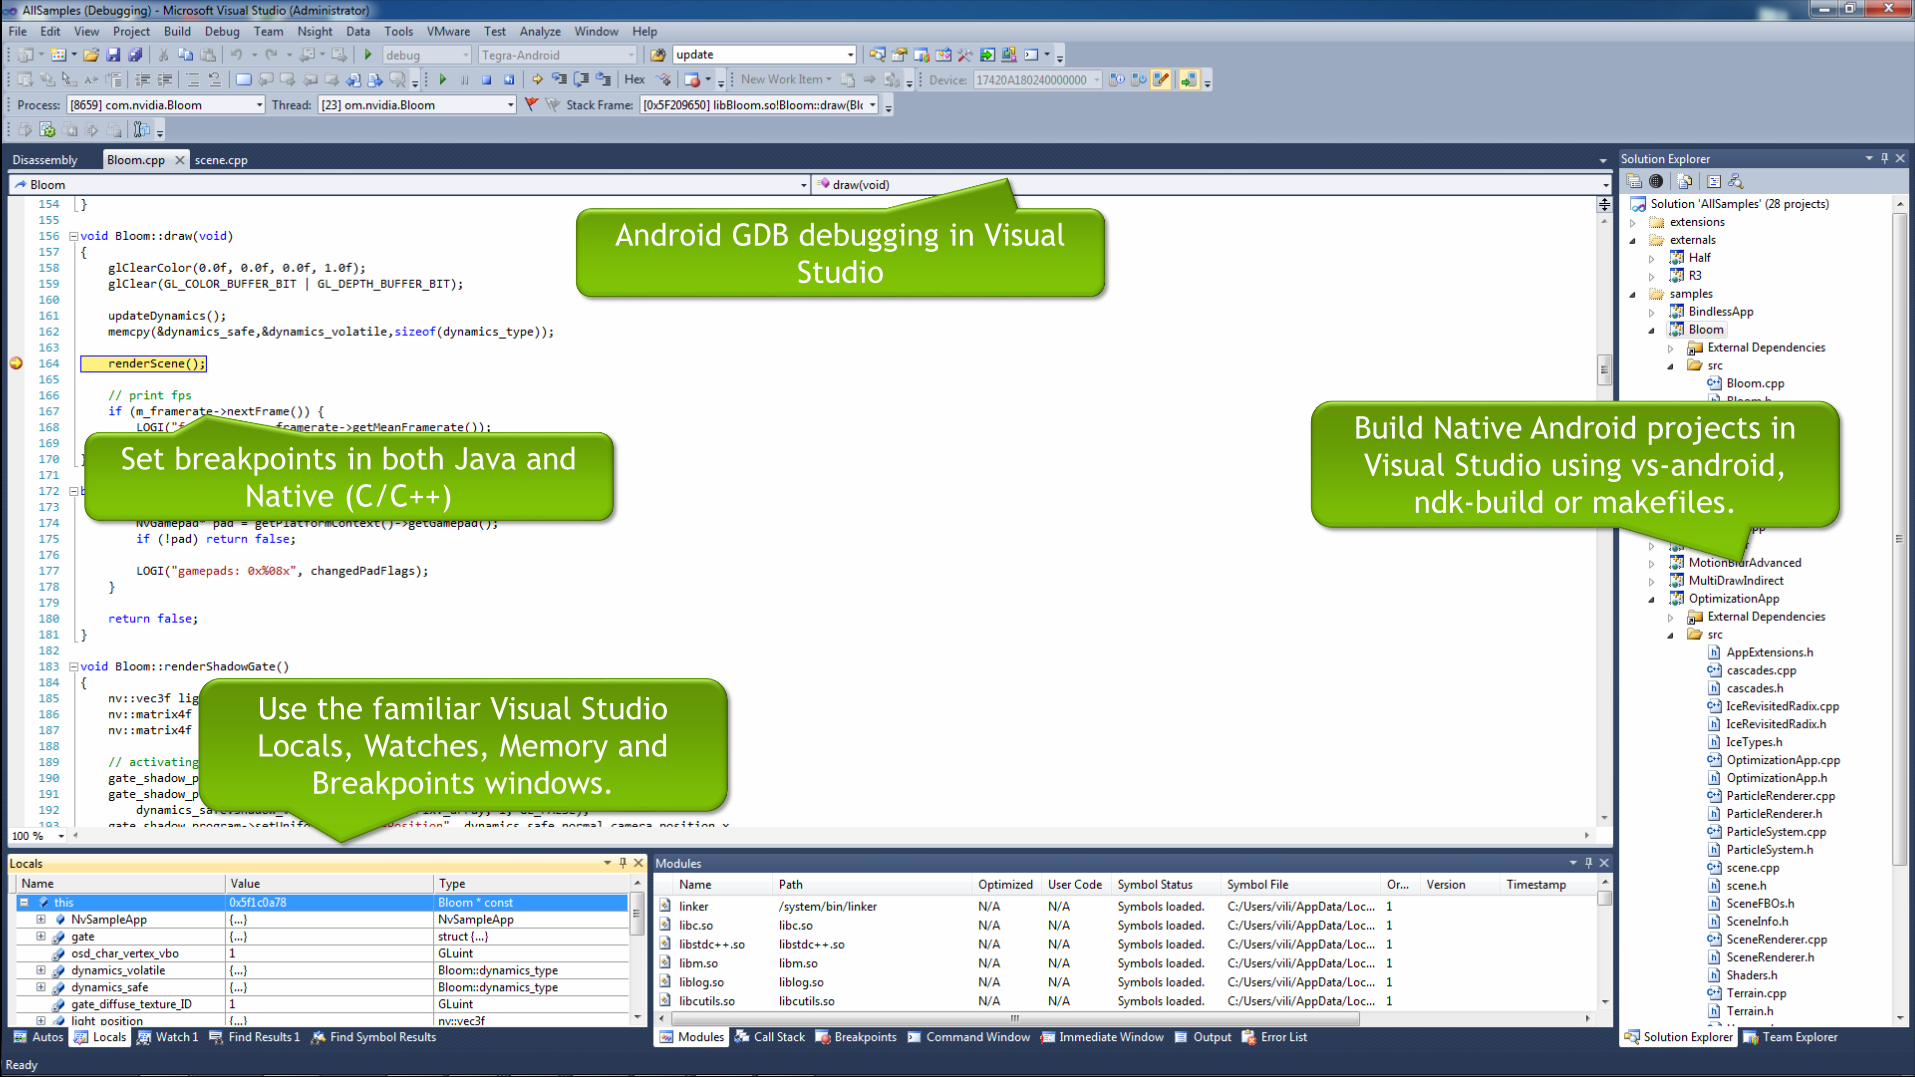
Android GDB debugging in Visual
Studio
Set breakpoints in both Java and
Native (C/C++)
Use the familiar Visual Studio
Locals, Watches, Memory and
Breakpoints windows.
Build Native Android projects in
Visual Studio using vs-android,
ndk-build or makefiles.
https://developer.nvidia.com/gameworks
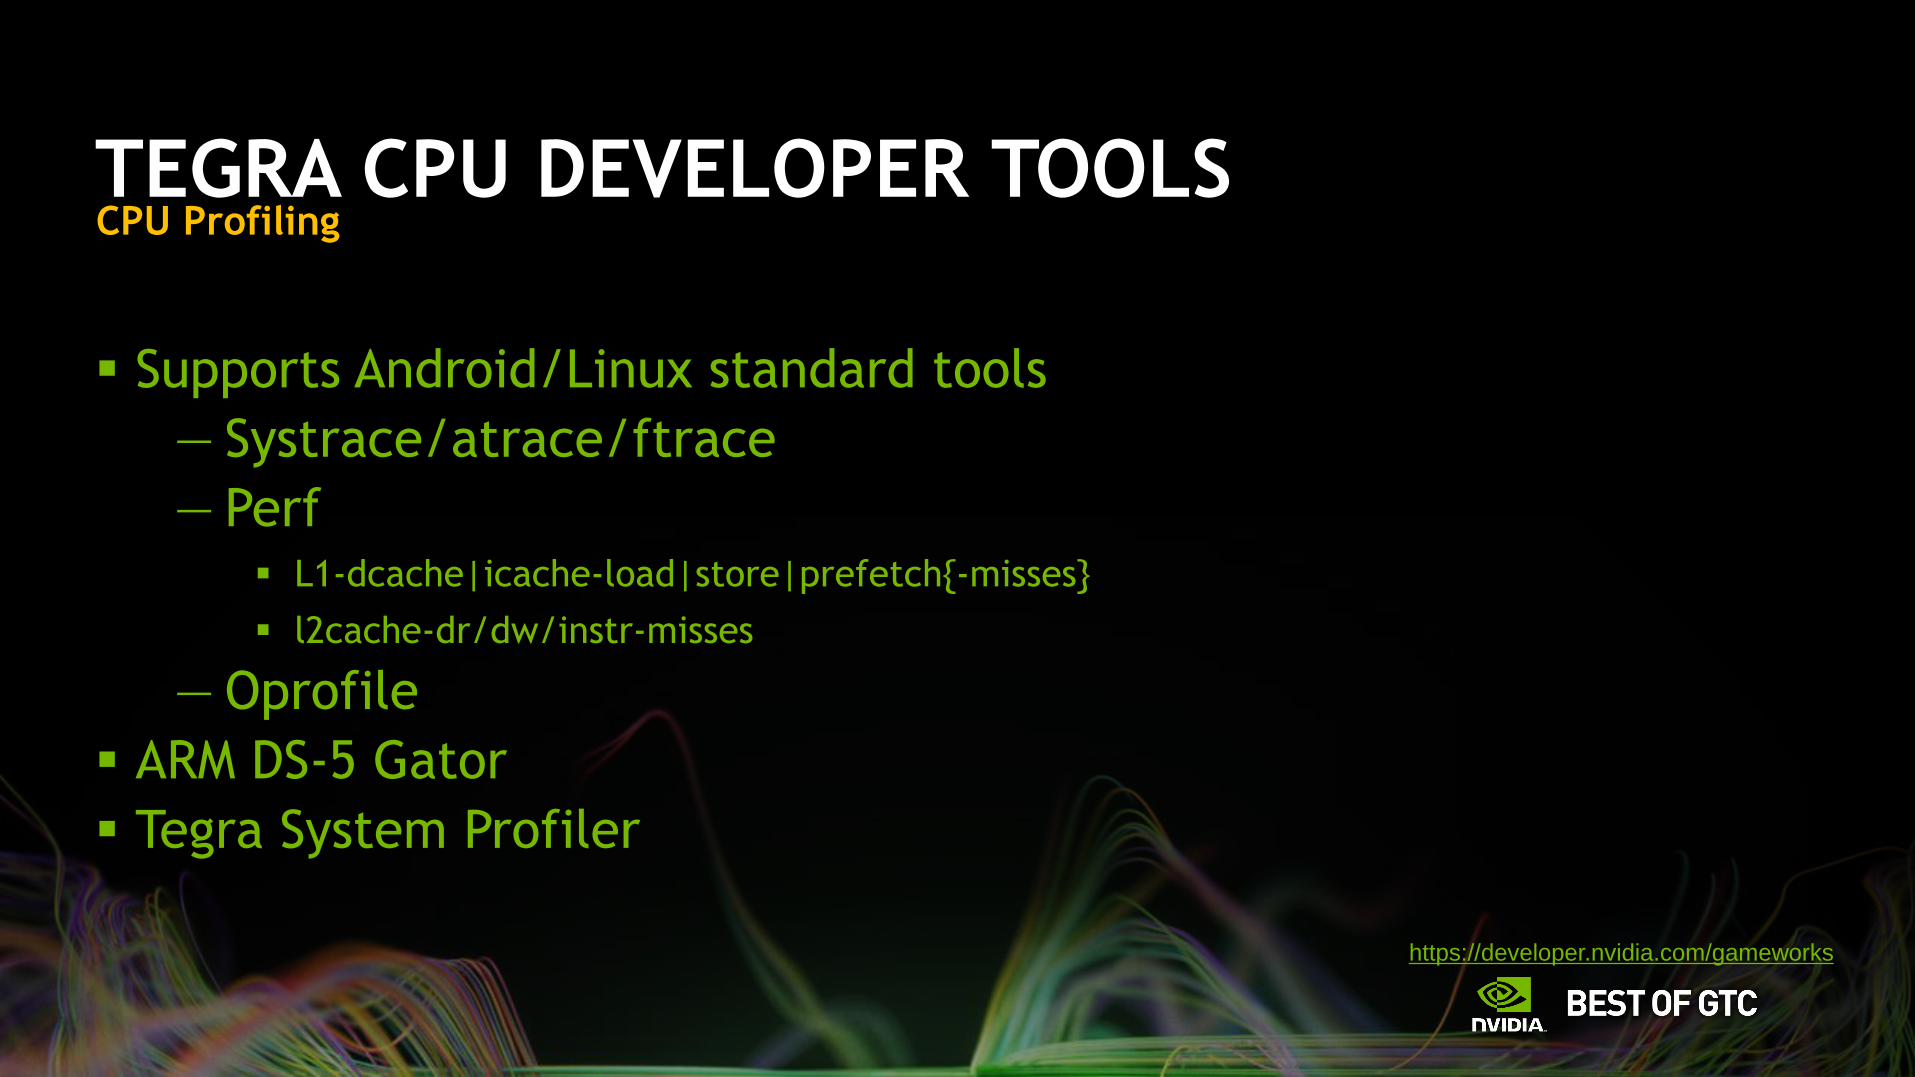
TEGRA CPU DEVELOPER TOOLS
Supports Android/Linux standard tools
— Systrace/atrace/ftrace
— Perf L1-dcache|icache-load|store|prefetch{-misses}
l2cache-dr/dw/instr-misses
— Oprofile
ARM DS-5 Gator
Tegra System Profiler
CPU Profiling
https://developer.nvidia.com/gameworks
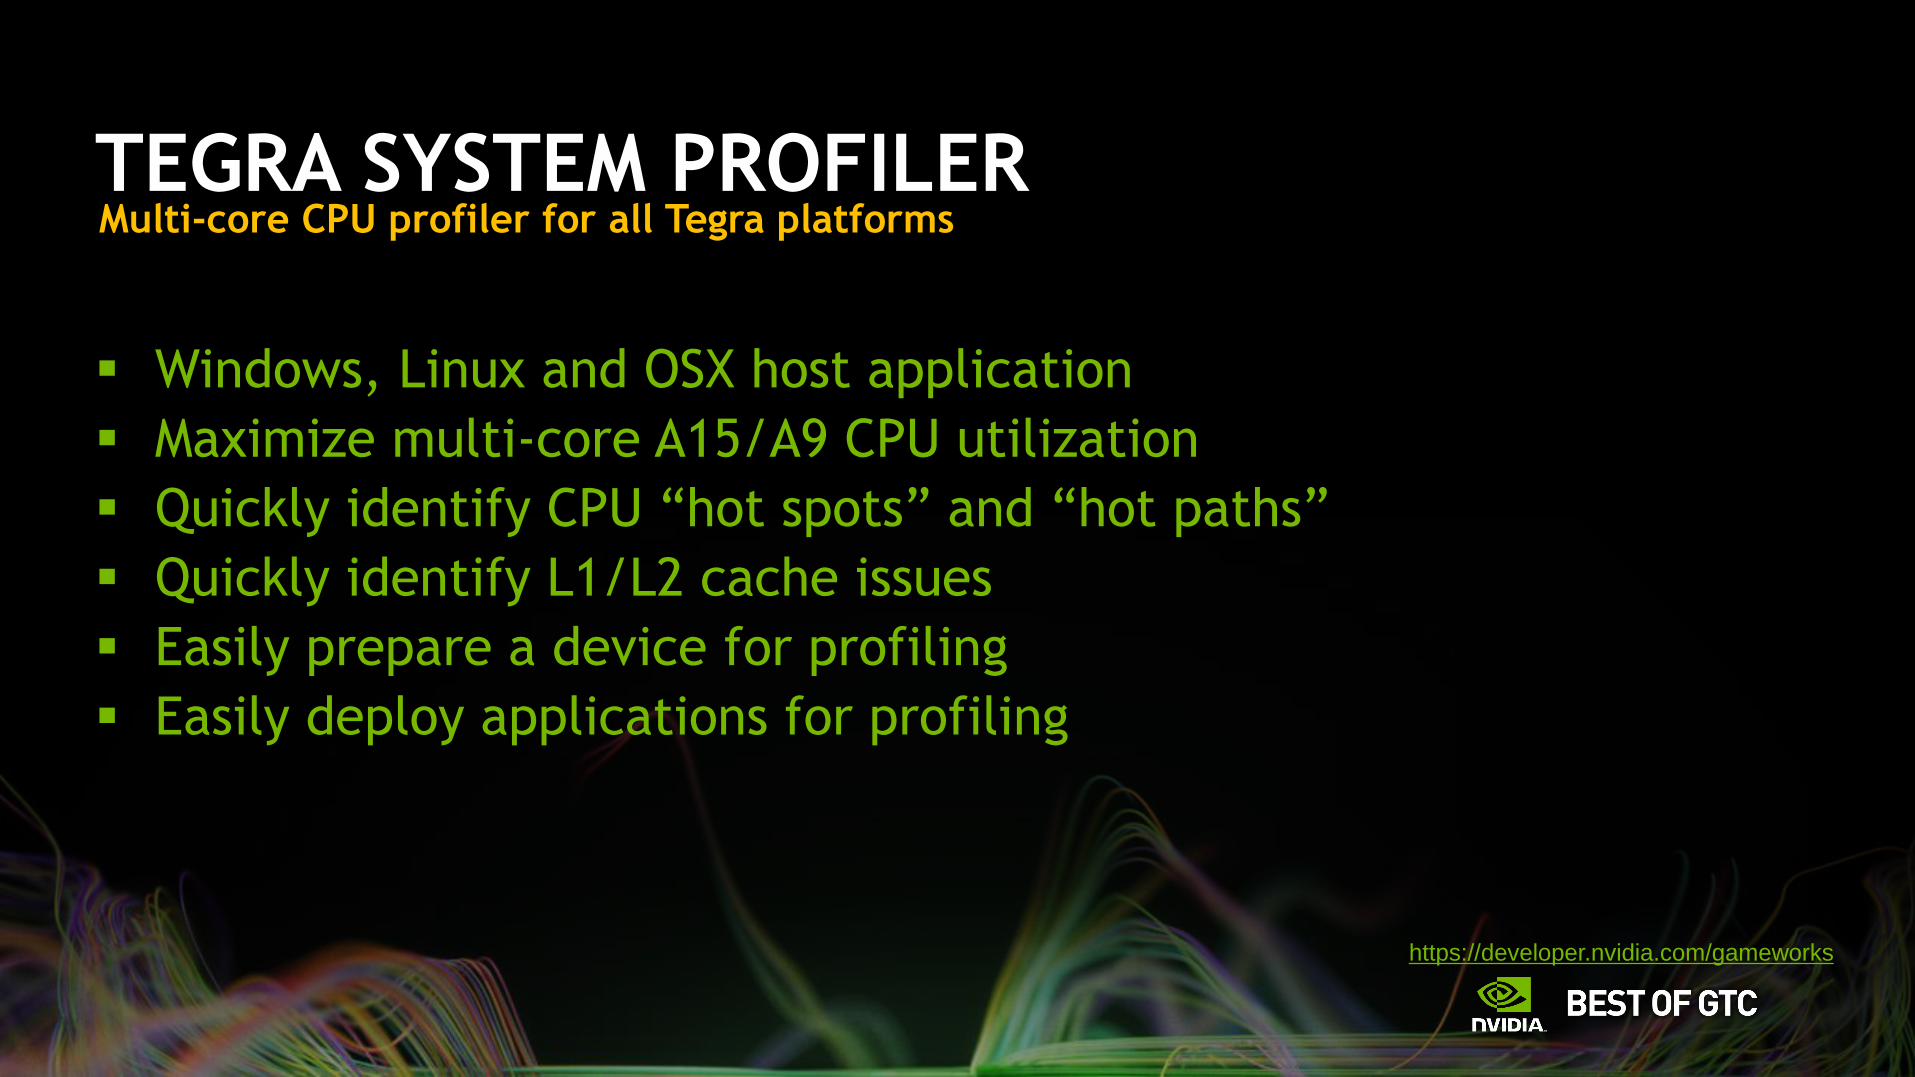
TEGRA SYSTEM PROFILER
Windows, Linux and OSX host application
Maximize multi-core A15/A9 CPU utilization
Quickly identify CPU “hot spots” and “hot paths”
Quickly identify L1/L2 cache issues
Easily prepare a device for profiling
Easily deploy applications for profiling
Multi-core CPU profiler for all Tegra platforms
https://developer.nvidia.com/gameworks
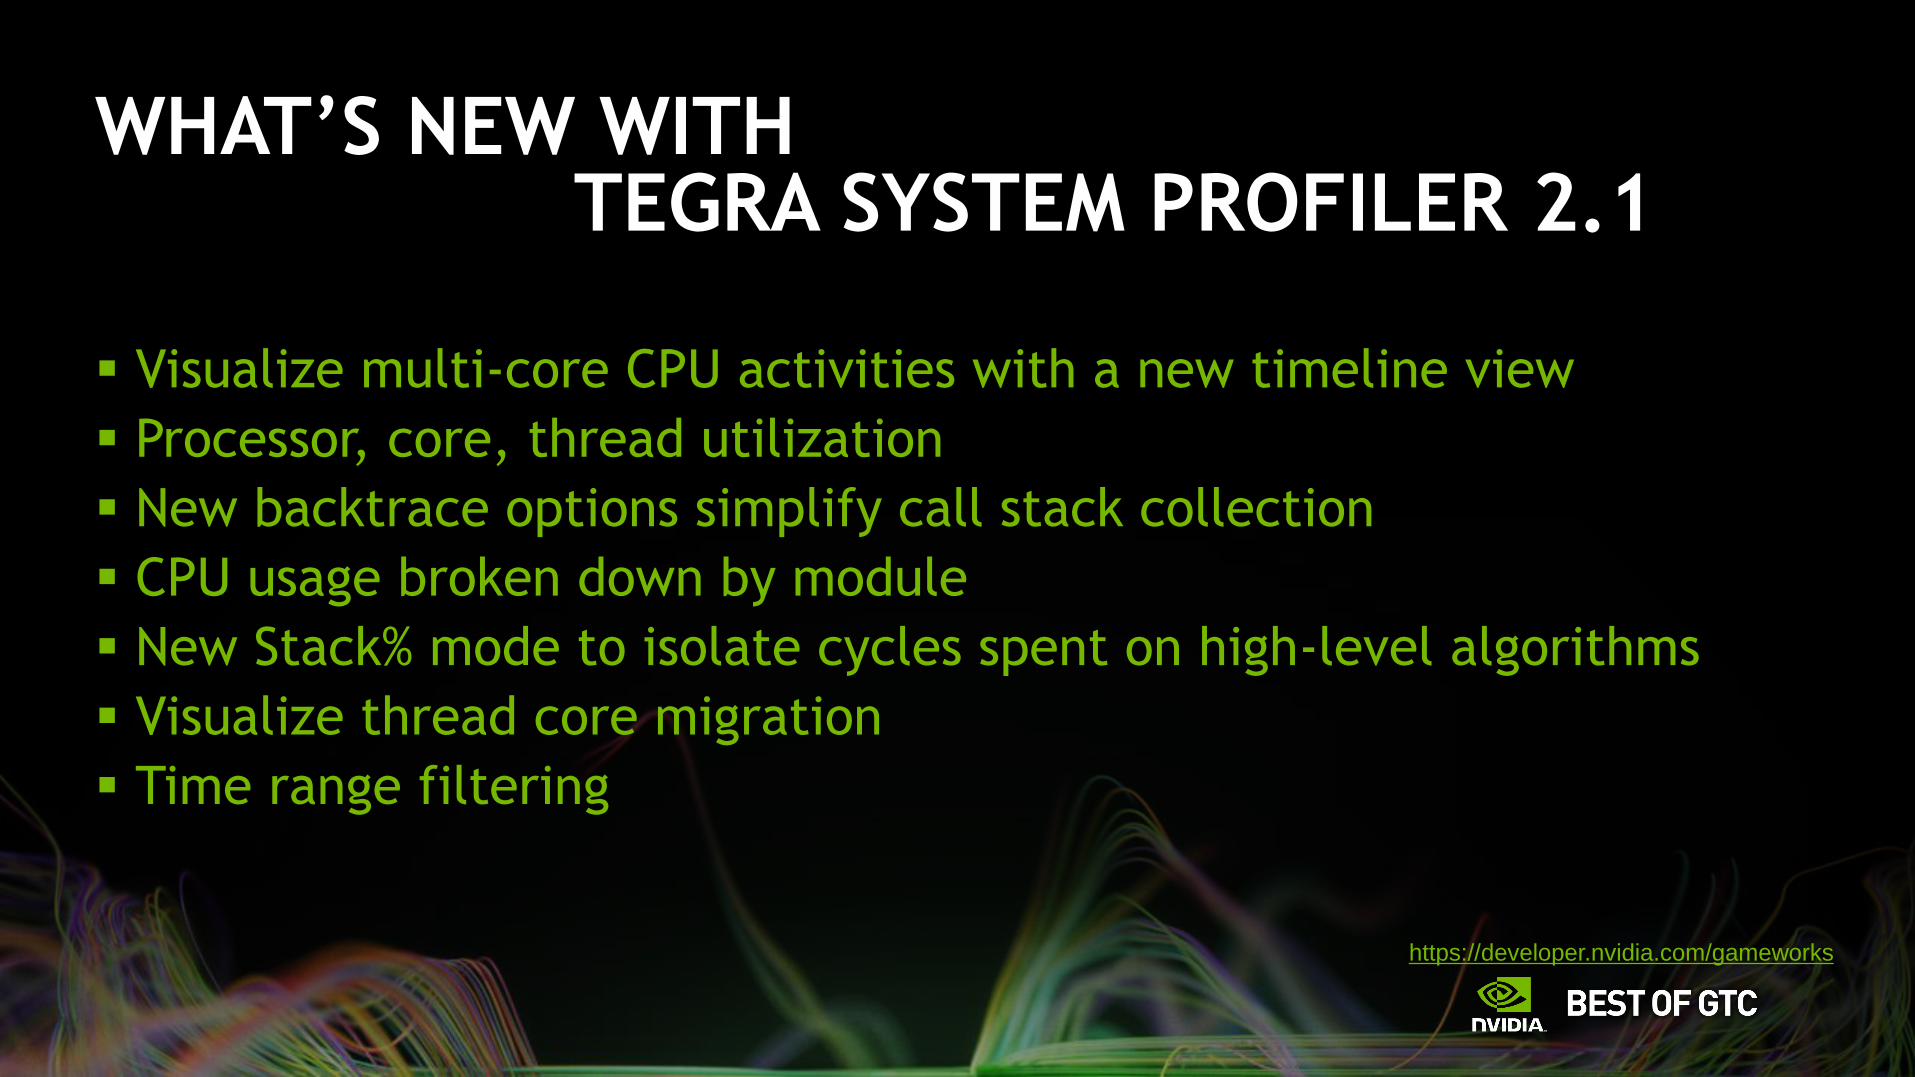
WHAT’S NEW WITH TEGRA SYSTEM PROFILER 2.1
Visualize multi-core CPU activities with a new timeline view
Processor, core, thread utilization
New backtrace options simplify call stack collection
CPU usage broken down by module
New Stack% mode to isolate cycles spent on high-level algorithms
Visualize thread core migration
Time range filtering
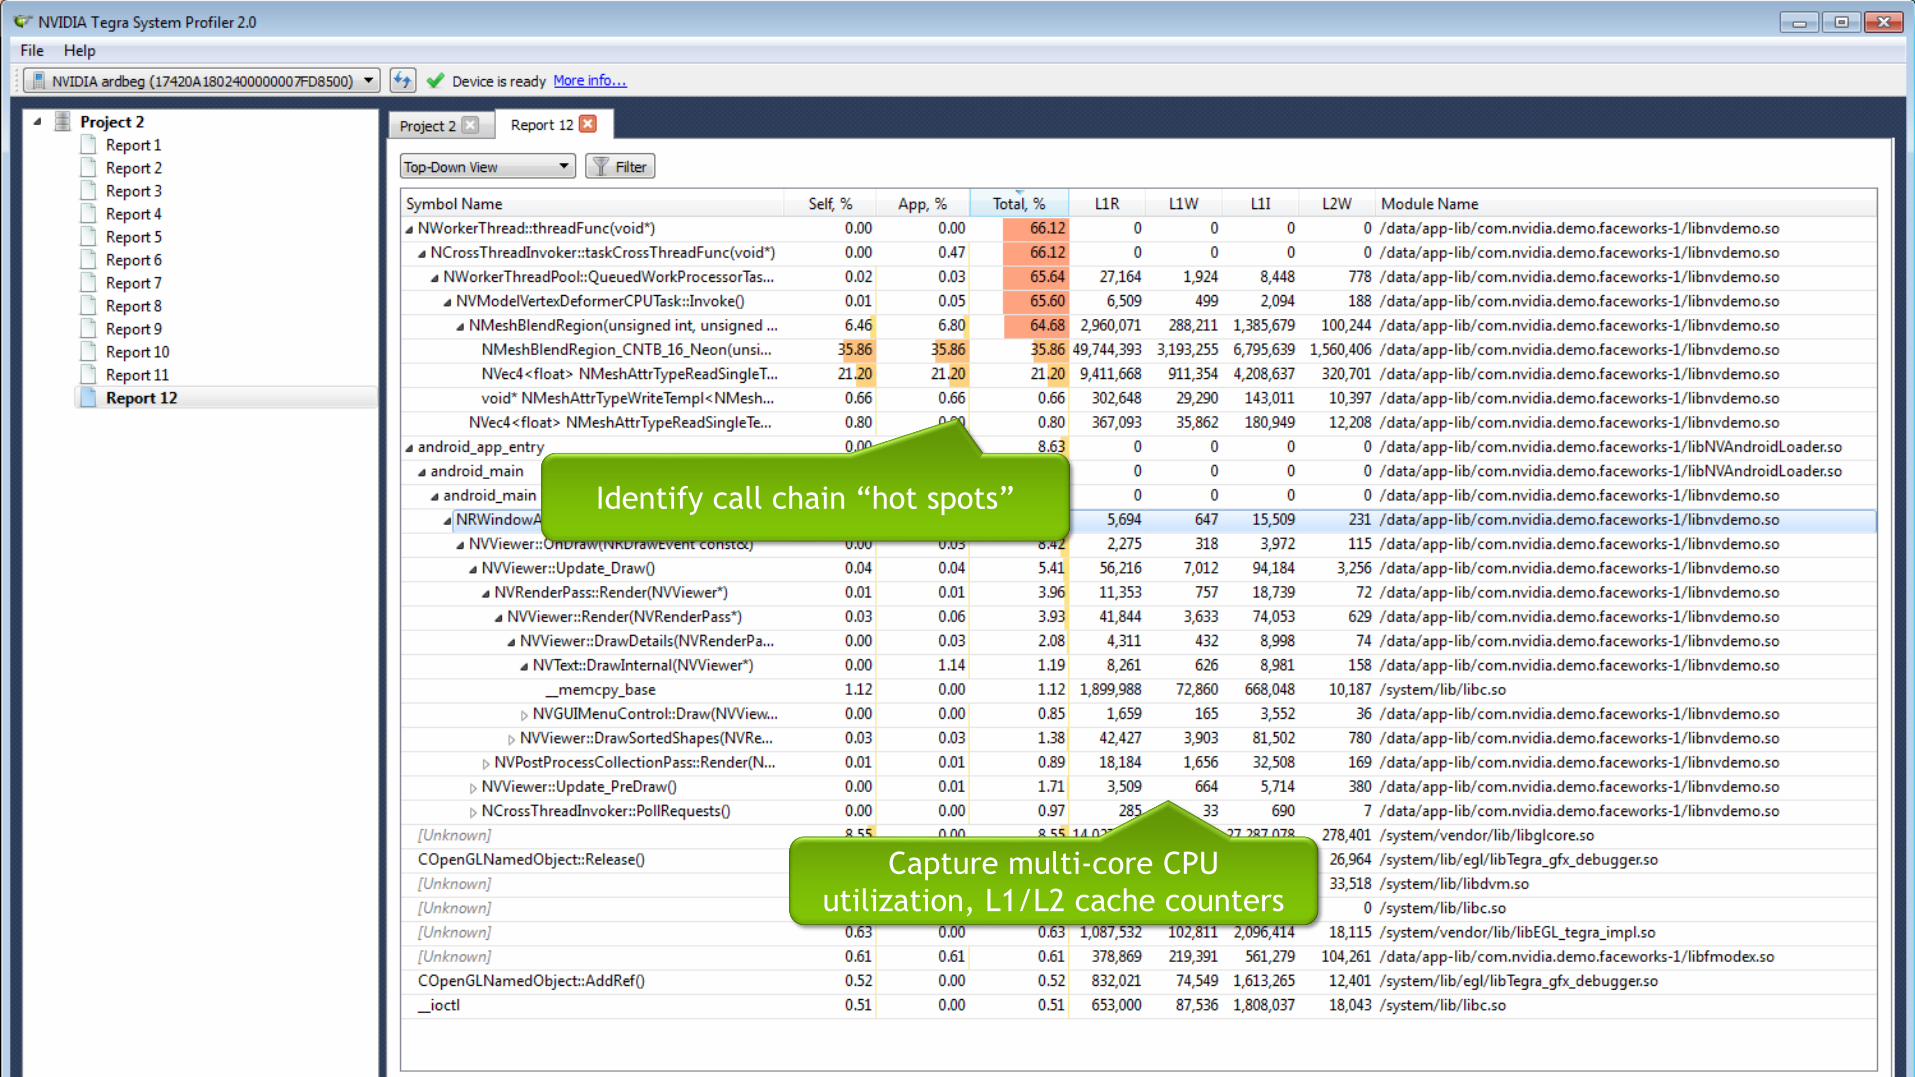
Identify call chain “hot spots”
Capture multi-core CPU
utilization, L1/L2 cache counters
https://developer.nvidia.com/gameworks
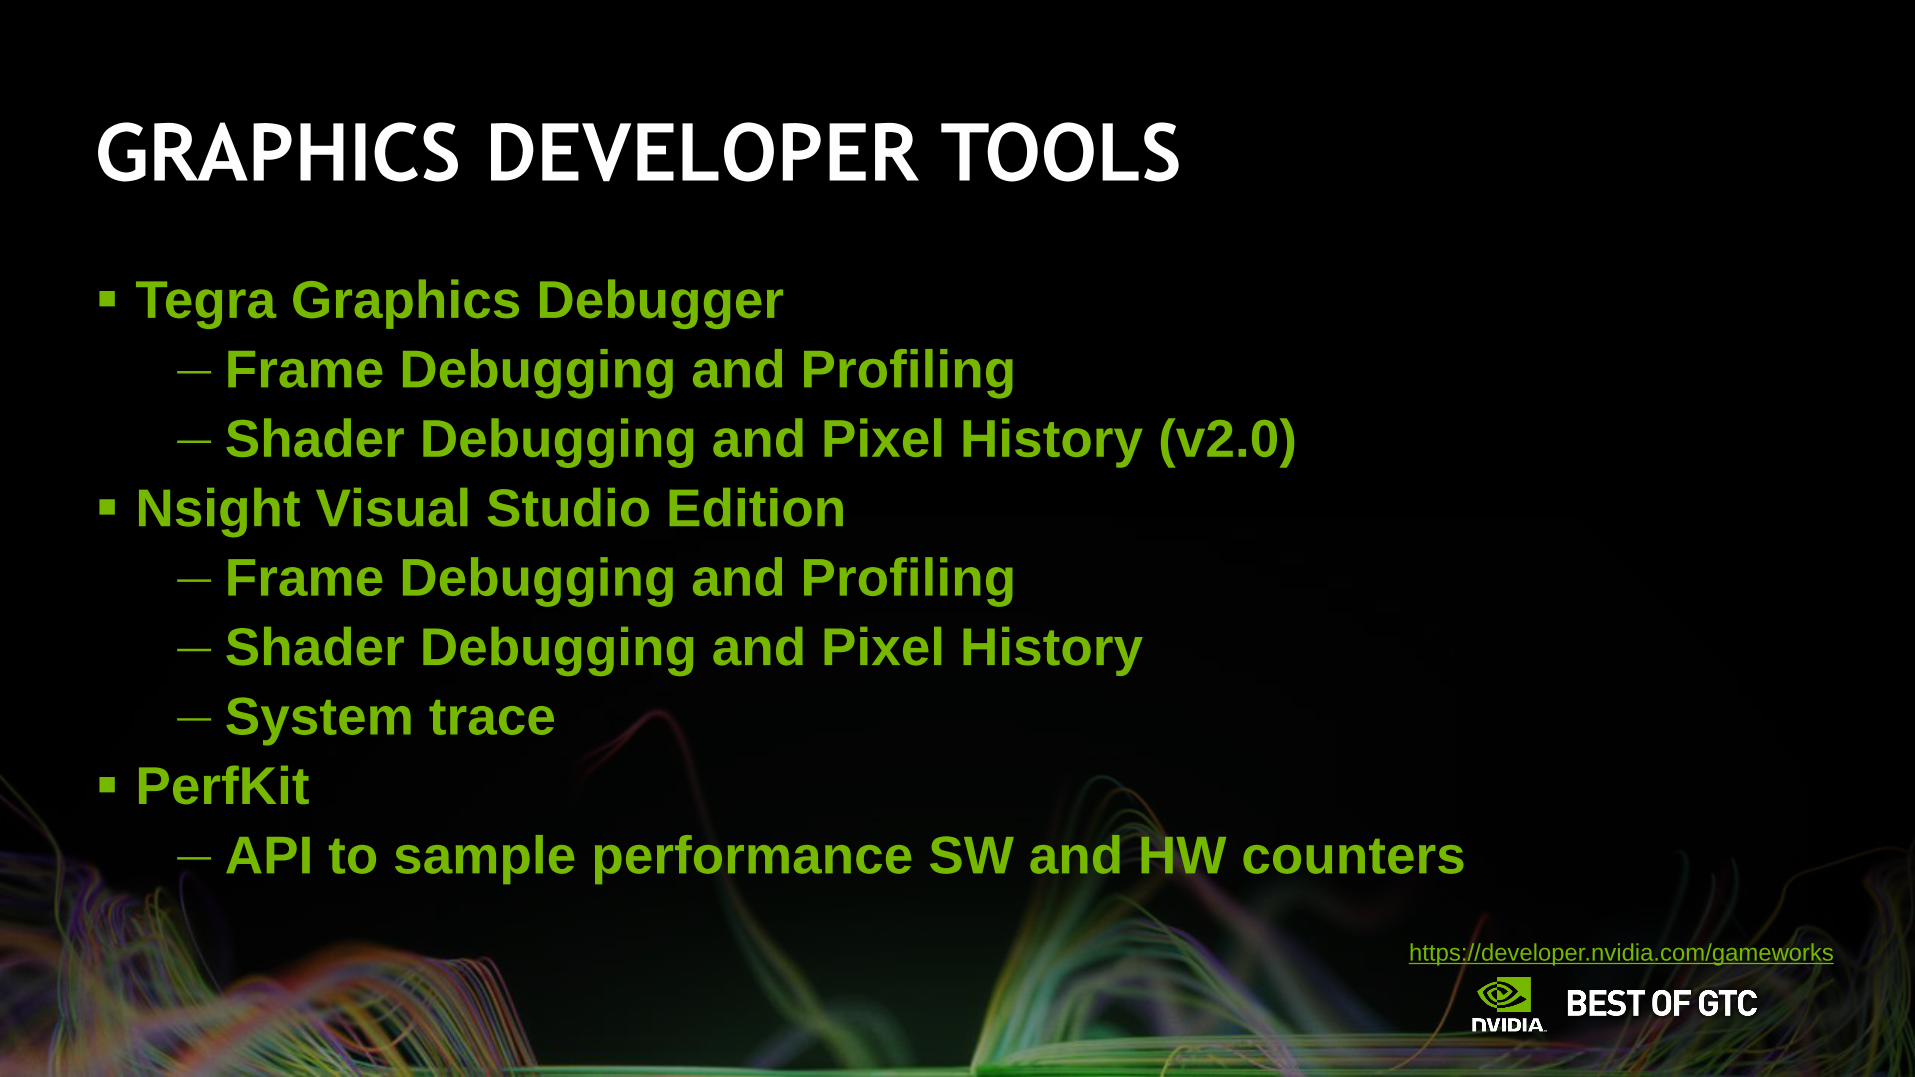
GRAPHICS DEVELOPER TOOLS
Tegra Graphics Debugger
— Frame Debugging and Profiling
— Shader Debugging and Pixel History (v2.0)
Nsight Visual Studio Edition
— Frame Debugging and Profiling
— Shader Debugging and Pixel History
— System trace
PerfKit
— API to sample performance SW and HW counters
https://developer.nvidia.com/gameworks
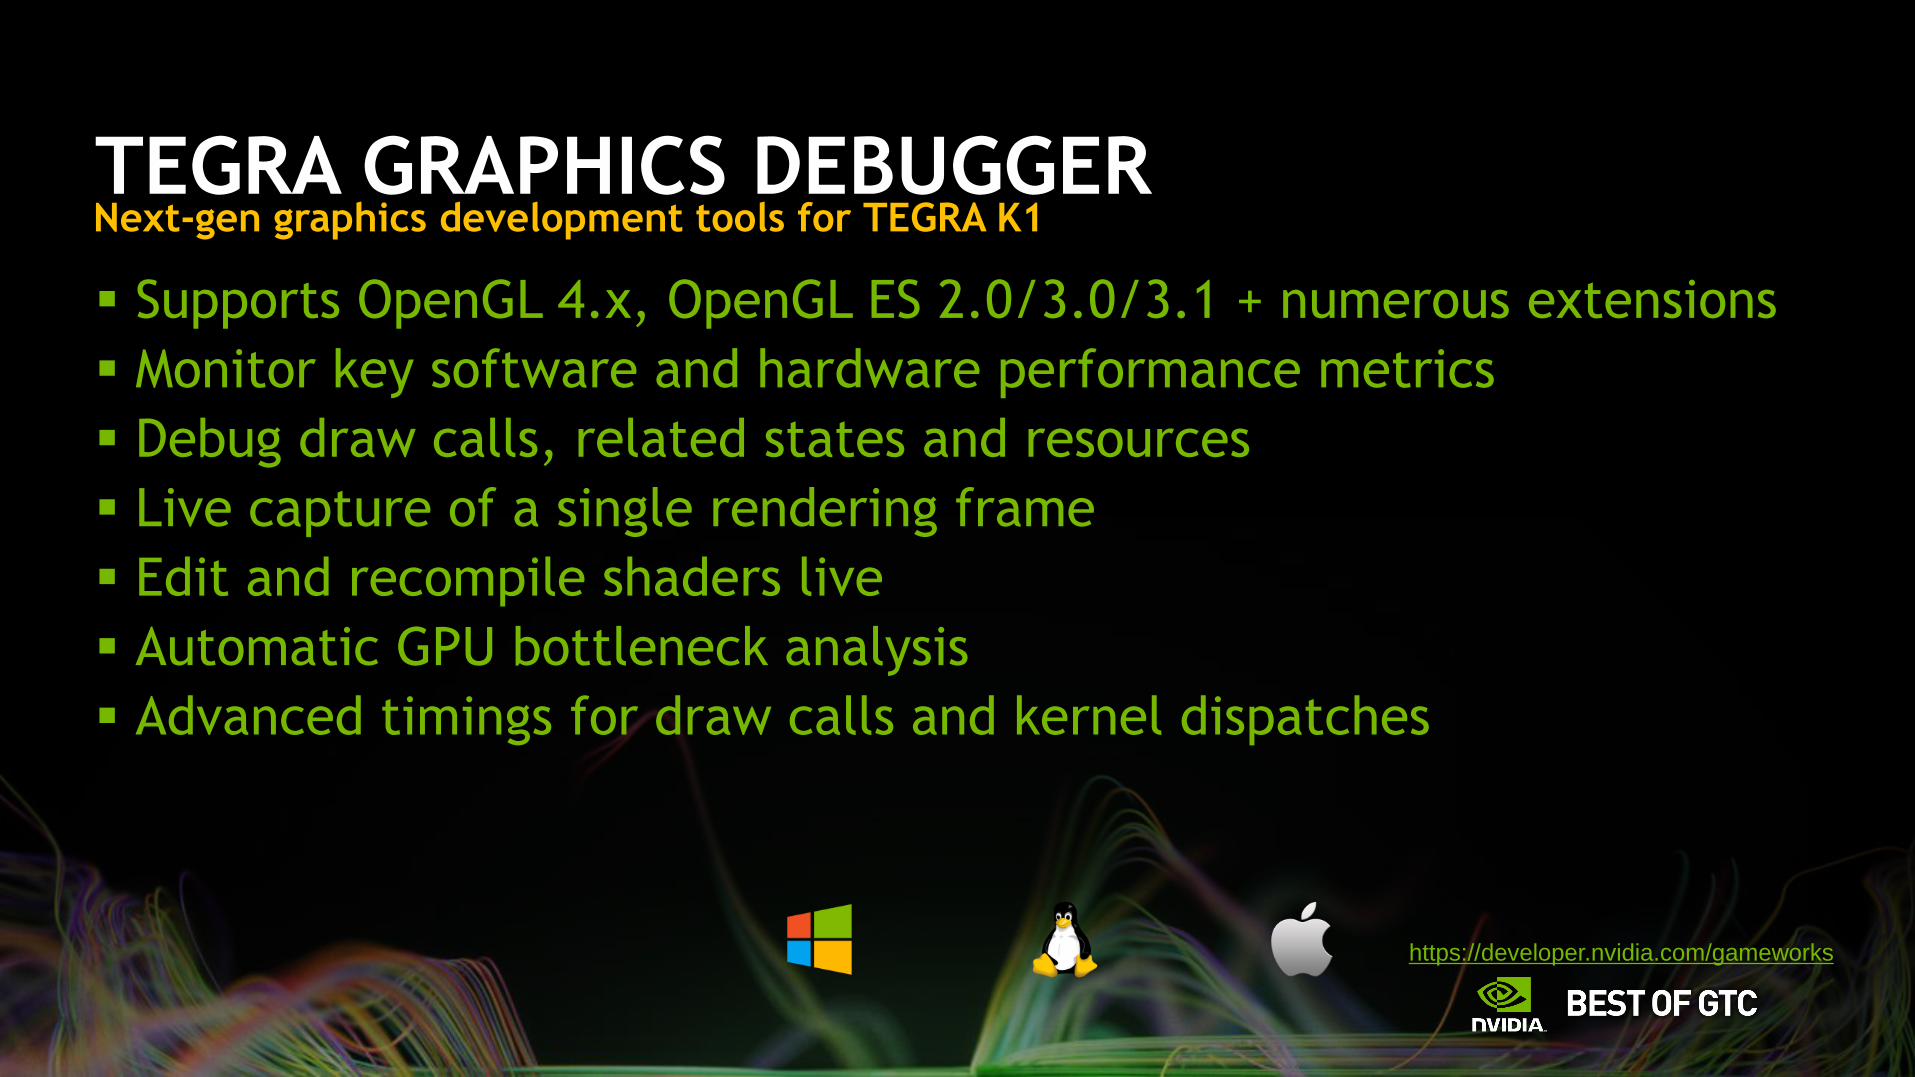
TEGRA GRAPHICS DEBUGGER
Supports OpenGL 4.x, OpenGL ES 2.0/3.0/3.1 + numerous extensions
Monitor key software and hardware performance metrics
Debug draw calls, related states and resources
Live capture of a single rendering frame
Edit and recompile shaders live
Automatic GPU bottleneck analysis
Advanced timings for draw calls and kernel dispatches
Next-gen graphics development tools for TEGRA K1
https://developer.nvidia.com/gameworks
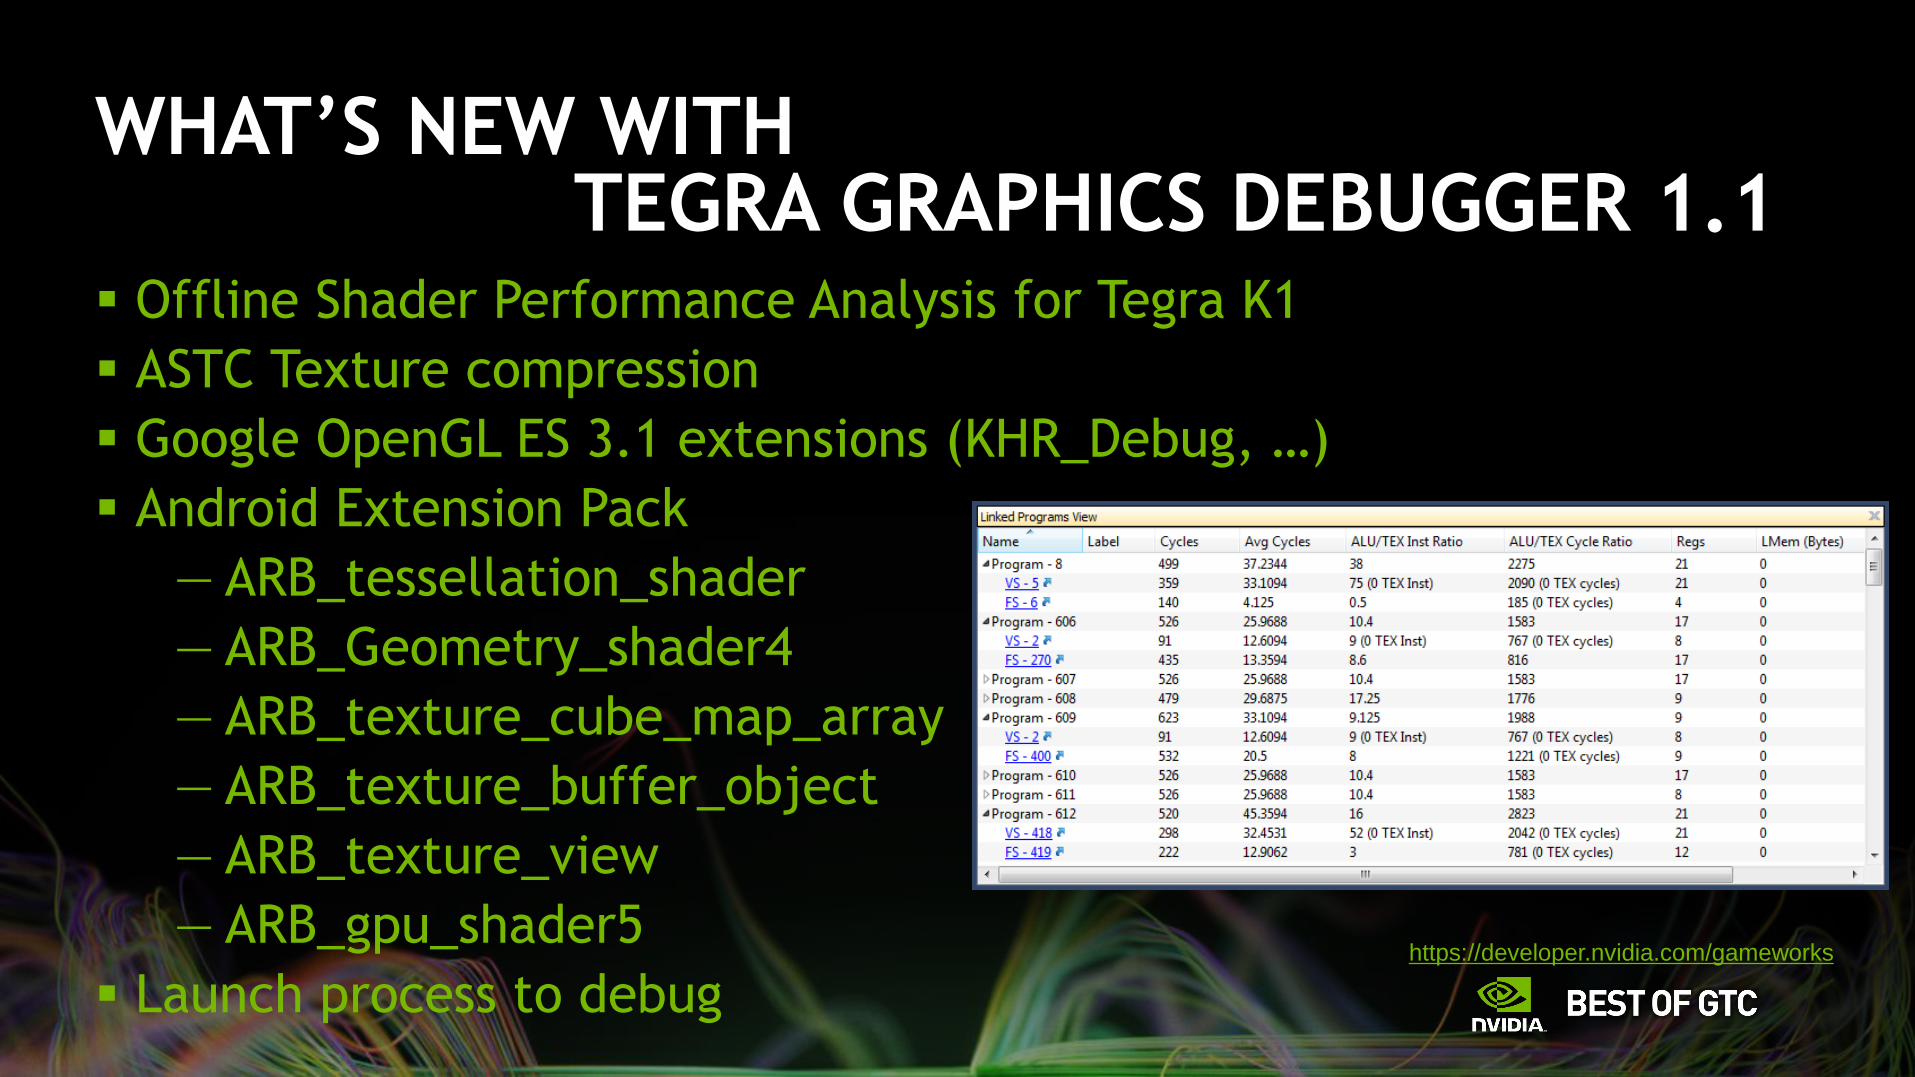
WHAT’S NEW WITH TEGRA GRAPHICS DEBUGGER 1.1
Offline Shader Performance Analysis for Tegra K1
ASTC Texture compression
Google OpenGL ES 3.1 extensions (KHR_Debug, …)
Android Extension Pack
— ARB_tessellation_shader
— ARB_Geometry_shader4
— ARB_texture_cube_map_array
— ARB_texture_buffer_object
— ARB_texture_view
— ARB_gpu_shader5
Launch process to debug
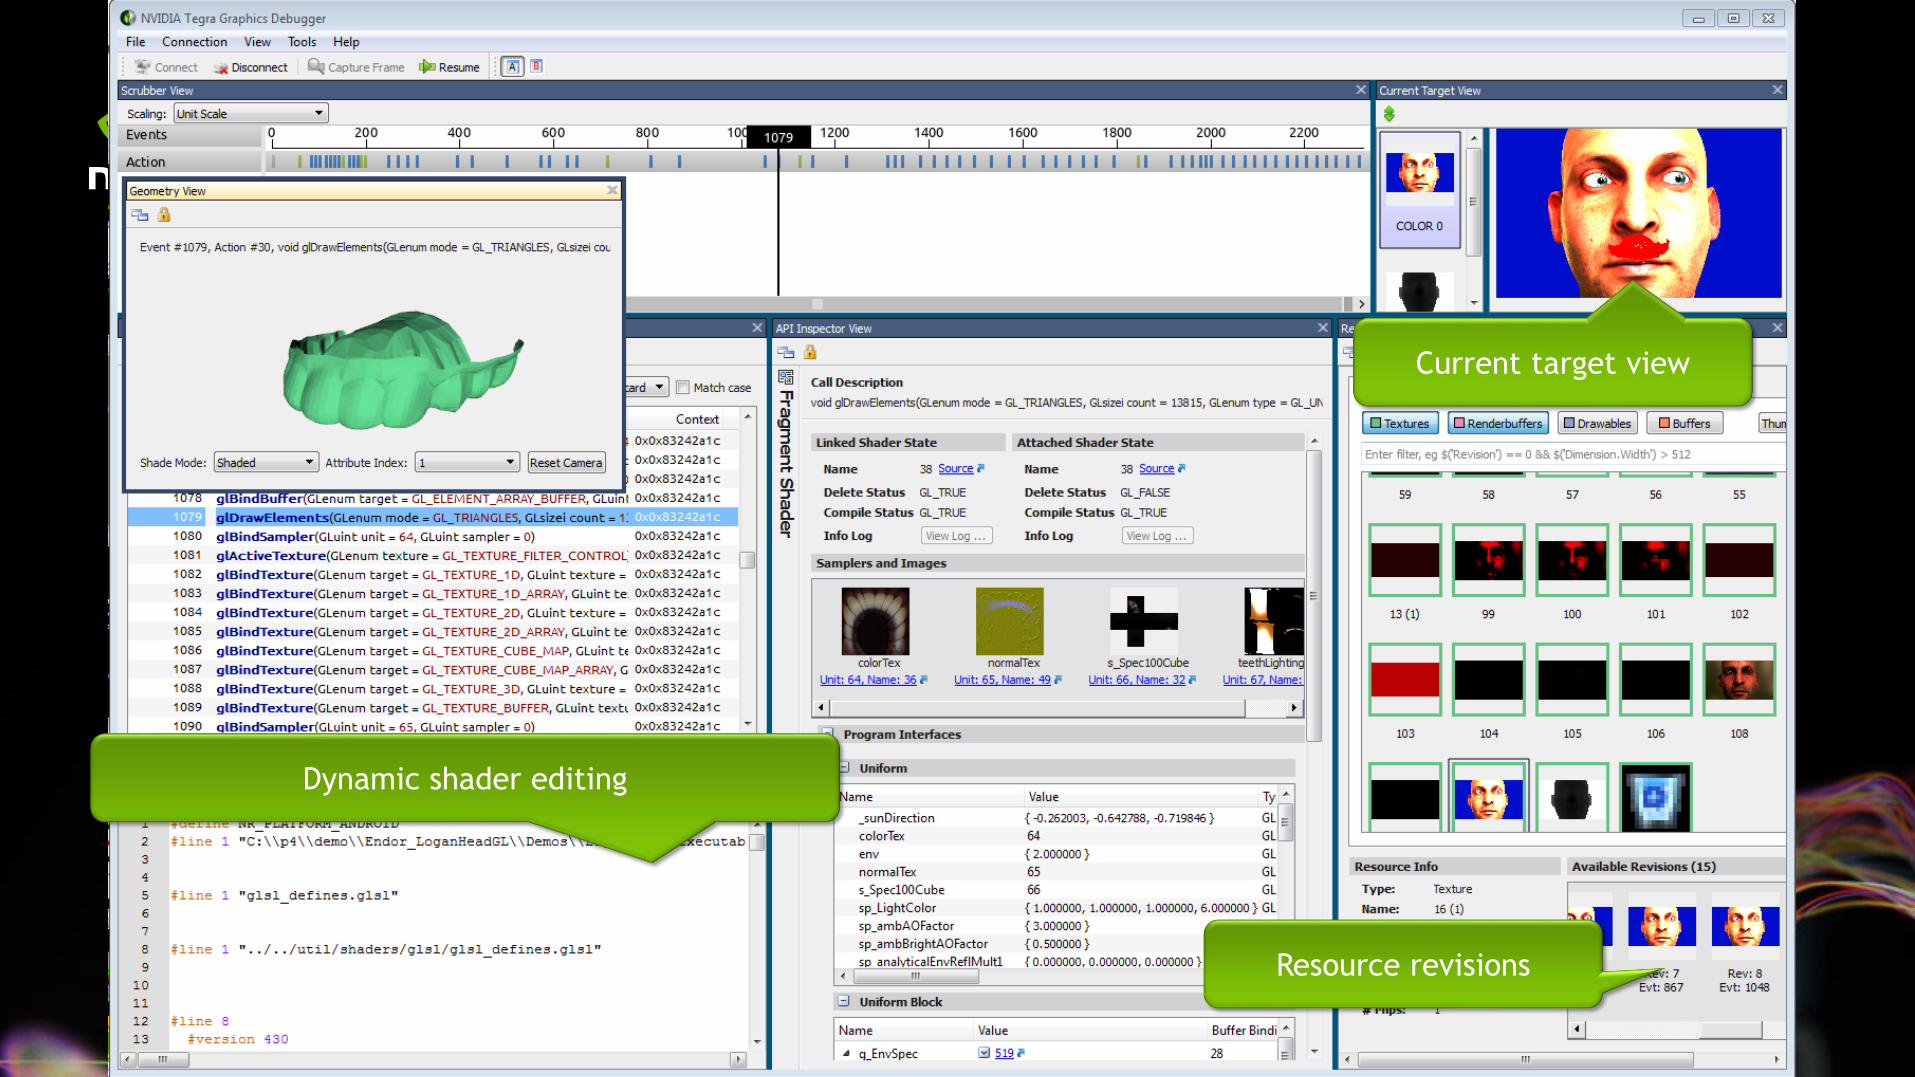
Dynamic shader editing
Current target view
Resource revisions
https://developer.nvidia.com/gameworks
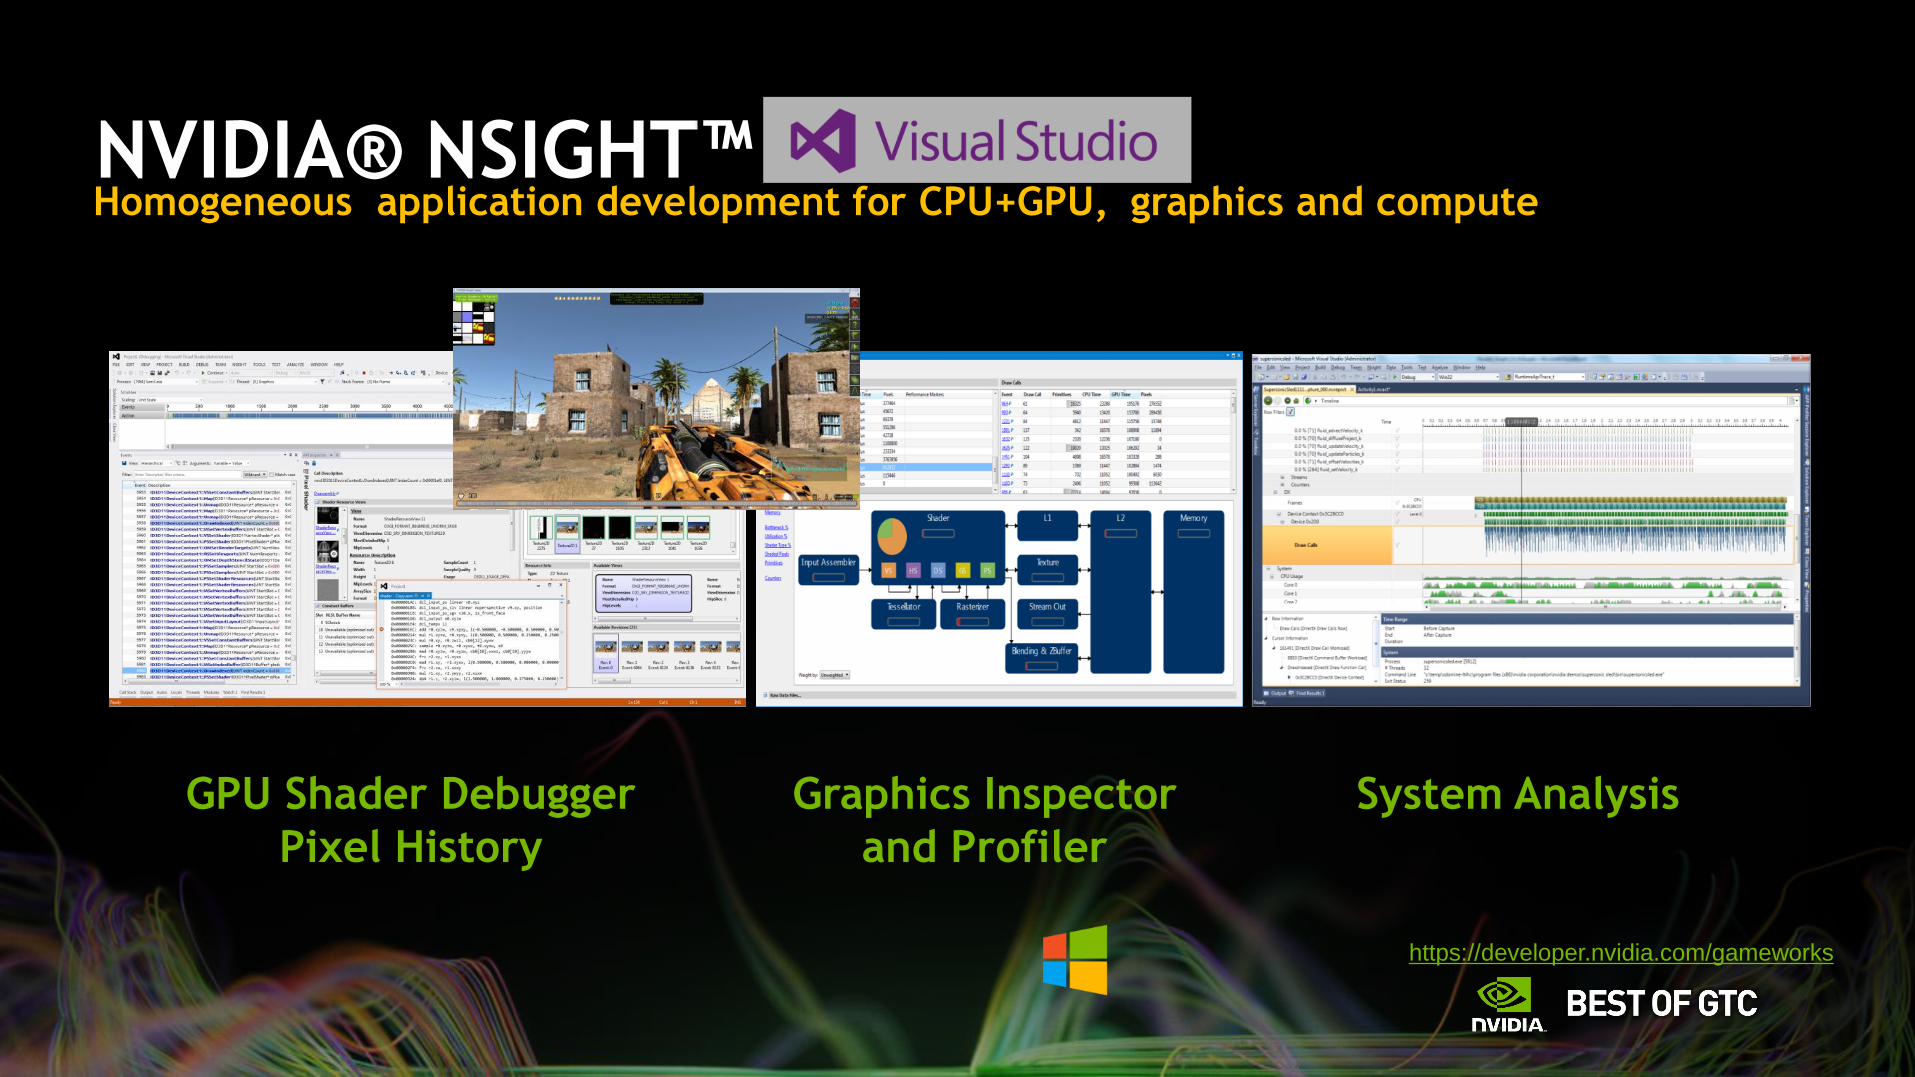
NVIDIA® NSIGHT™Homogeneous application development for CPU+GPU, graphics and compute
Graphics Inspector
and Profiler
System AnalysisGPU Shader Debugger
Pixel History
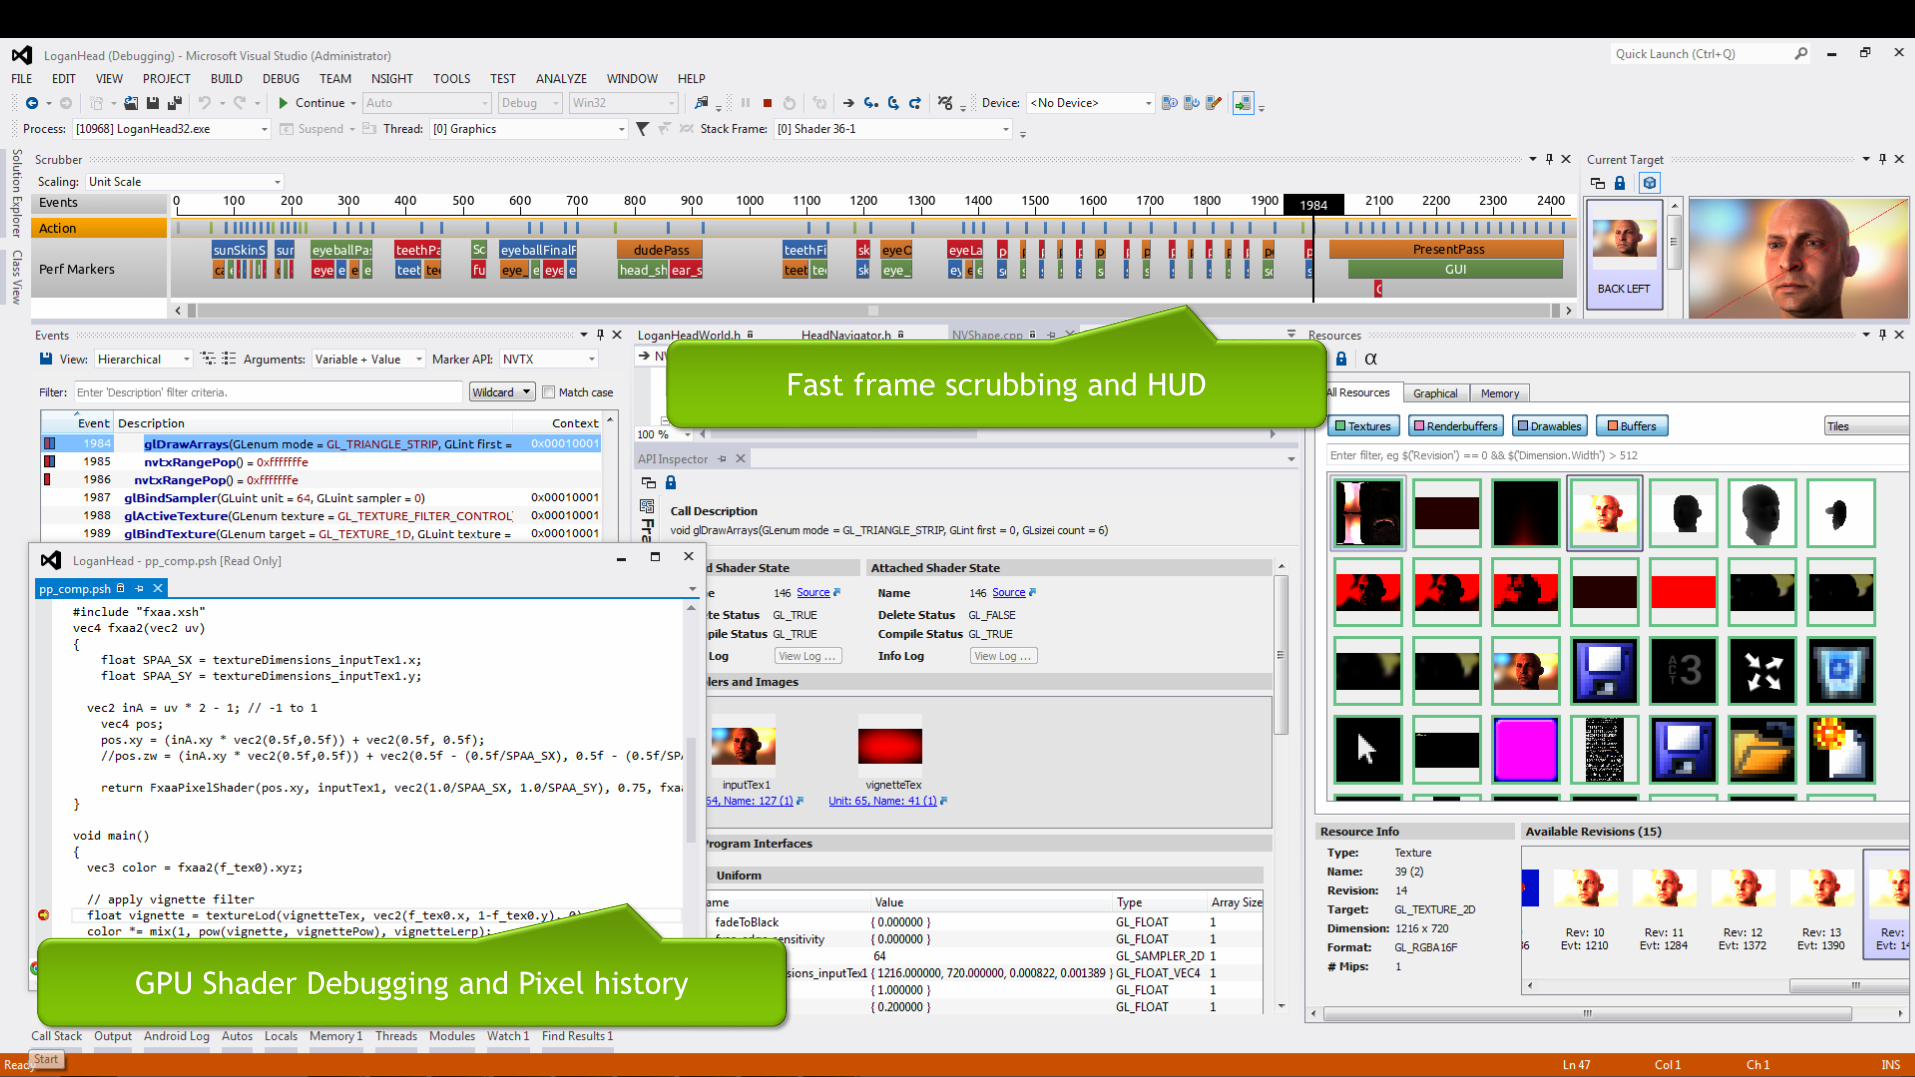
Demo
Basic Frame Debugging, Shader Debugging, Pixel History
Using FaceWorks
GPU Shader Debugging and Pixel history
Fast frame scrubbing and HUD
https://developer.nvidia.com/gameworks
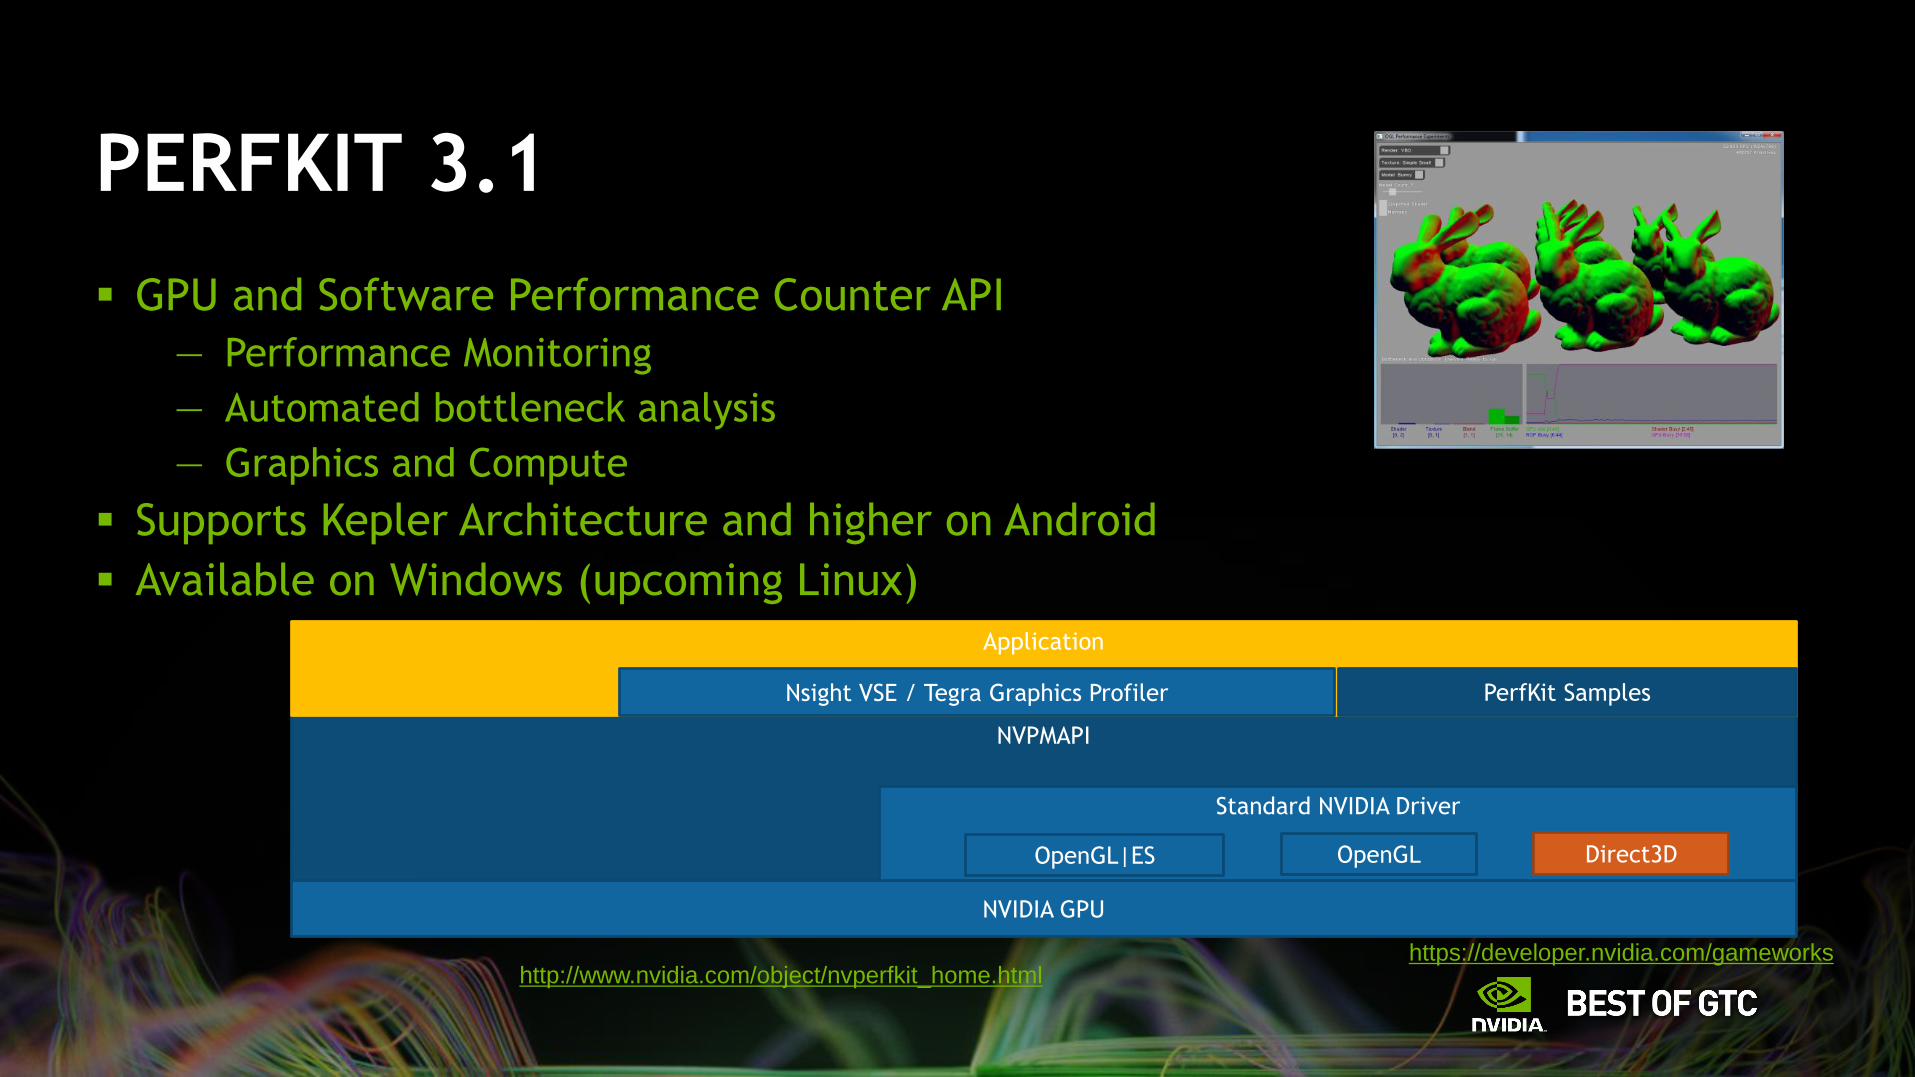
PERFKIT 3.1
GPU and Software Performance Counter API
— Performance Monitoring
— Automated bottleneck analysis
— Graphics and Compute
Supports Kepler Architecture and higher on Android
Available on Windows (upcoming Linux)
http://www.nvidia.com/object/nvperfkit_home.html
NVIDIA GPU
NVPMAPI
Standard NVIDIA Driver
Application
PerfKit Samples
OpenGL
Nsight VSE / Tegra Graphics Profiler
OpenGL|ES Direct3D
https://developer.nvidia.com/gameworks
COMPUTE DEVELOPER TOOLS
Nsight Eclipse Edition
— Integrated CUDA development environment for Linux and MAC
Nsight Visual Studio Edition
— Integrated CUDA development environment for Windows
CUDA 6.0 Toolkit command line tools for Android
RenderScript Tegra K1 acceleration / No developer tools
https://developer.nvidia.com/gameworks
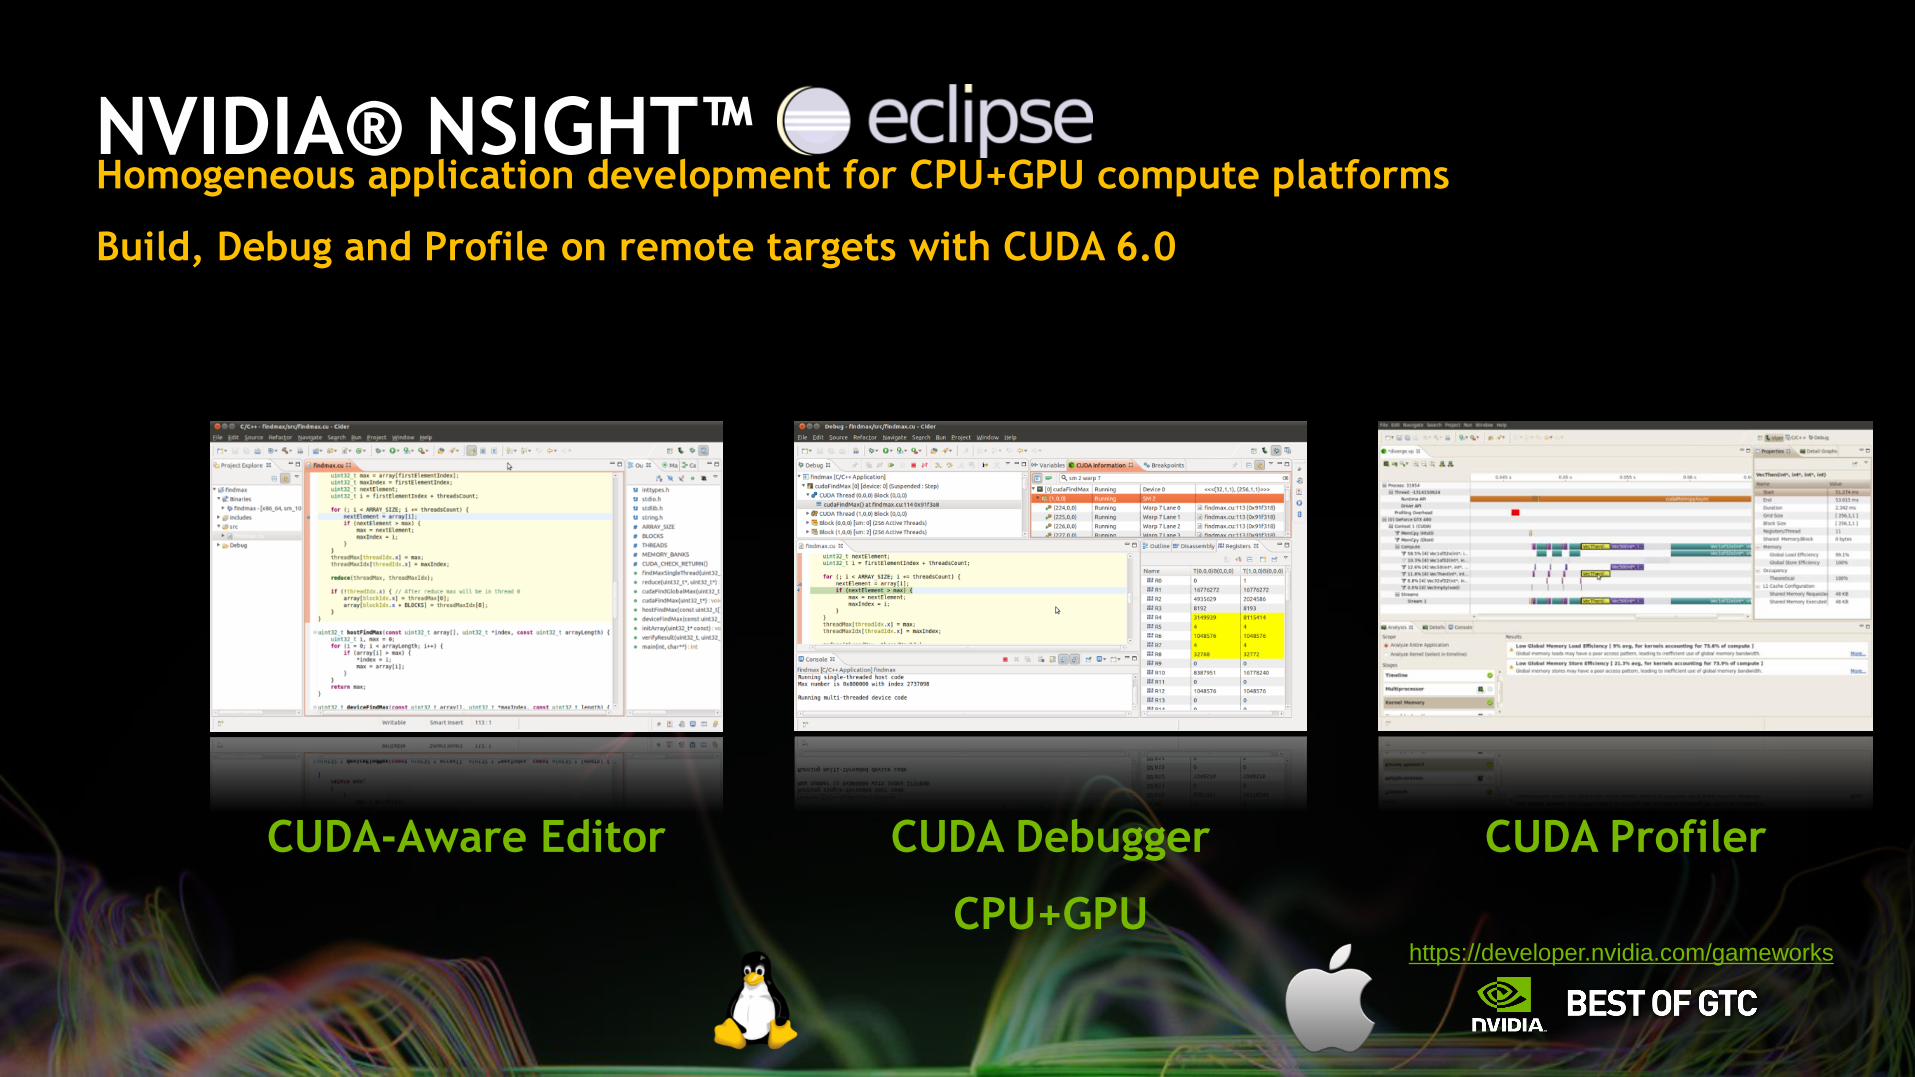
NVIDIA® NSIGHT™Homogeneous application development for CPU+GPU compute platforms
Build, Debug and Profile on remote targets with CUDA 6.0
CUDA-Aware Editor CUDA Debugger
CPU+GPU
CUDA Profiler
https://developer.nvidia.com/gameworks
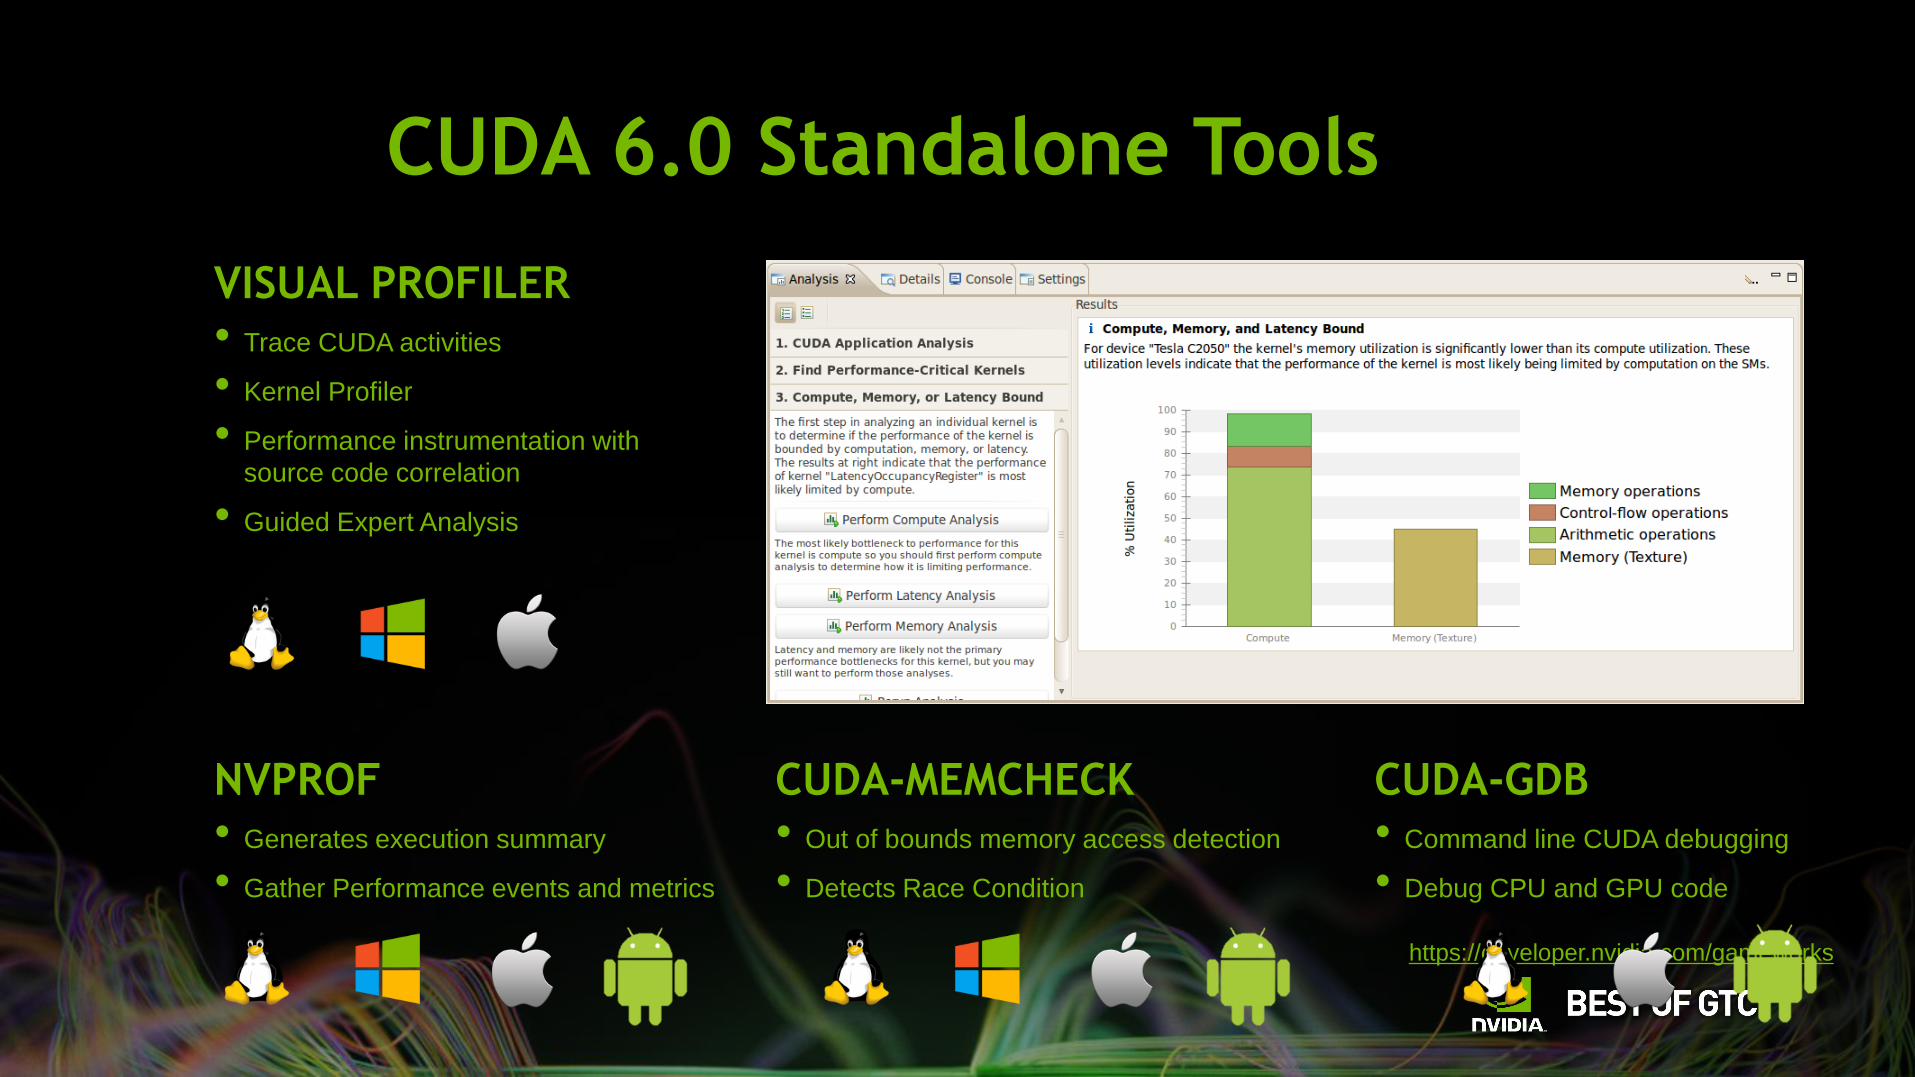
CUDA 6.0 Standalone Tools
CUDA-GDB
• Command line CUDA debugging
• Debug CPU and GPU code
NVPROF
• Generates execution summary
• Gather Performance events and metrics
VISUAL PROFILER
• Trace CUDA activities
• Kernel Profiler
• Performance instrumentation with
source code correlation
• Guided Expert Analysis
CUDA-MEMCHECK
• Out of bounds memory access detection
• Detects Race Condition
https://developer.nvidia.com/gameworks
CONCLUSION Full TEGRA K1 support
Full OpenGL 4.x and ES 2.0/3.0/3.1/AEP
Advanced Visual Studio integration
Advanced CPU profiling
Full support for Renderscript and CUDA 6.0
Consistent developer experience from Desktop to Tegra Android devices
https://developer.nvidia.com/gameworks
FINDING MORE INFORMATION… https://developer.nvidia.com/tegra-development
https://devtalk.nvidia.com/
Developer Tools


