Page 1
Submitted by:
Group 2
Aditya Mahadev Prakash 1311144
B Kiran Maruthi 1311154
Aditi Nehete 1311178
Sharad Chandran R 1311199
Swati Ramteke 1311189
COMPETITION
&
STRATEGY TELECOMMUNICATION INDUSTRY ANALYSIS
Page 2
2
Table of Contents 1. Introduction .......................................................................................................................................... 4
2. Evolution of Telecom Industry in India ................................................................................................. 4
3. Porter’s Five Forces Model ................................................................................................................... 6
3.1 Threat of New Entrants ..................................................................................................................... 6
3.1.1 Barriers to Entry ........................................................................................................................... 6
I. Economies of Scale .......................................................................................................................... 6
II. Differentiation ................................................................................................................................. 7
III. Brand Identity ................................................................................................................................. 7
IV. Switching Cost ................................................................................................................................ 7
V. Access to Distribution Channel ....................................................................................................... 8
VI. Capital Requirement ...................................................................................................................... 8
VII. Access to Technology .................................................................................................................... 8
VIII. Access to Raw Materials .............................................................................................................. 8
IX. Government Protection ................................................................................................................. 8
3.2 Industry Rivalry ................................................................................................................................. 9
I. Number of Competitors ................................................................................................................ 9
II. Industry Growth .......................................................................................................................... 10
III. Fixed costs ................................................................................................................................... 11
IV. Exit barriers .................................................................................................................................. 11
V. Switching Costs, Product Differentiation .................................................................................... 12
3.3 Bargaining Power of the Suppliers .................................................................................................. 12
I. Number of suppliers ................................................................................................................... 12
II. Availability of substitutes ............................................................................................................ 12
III. Switching costs ............................................................................................................................ 12
IV. Supplier’s threat of forward integration ..................................................................................... 13
V. Industry’s threat of backward integration .................................................................................. 13
VI. Industry’s importance to supplier ............................................................................................... 13
3.4 Bargaining Power of the Buyers ............................................................................................................ 13
3.4.1 Analyzing Customer Sensitivity: ..................................................................................................... 13
I. Product Differentiation ............................................................................................................... 13
II. Competition between Buyers ..................................................................................................... 14
Page 3
3
3.4.2 Analyzing Relative Buying Power: .................................................................................................. 14
I. Size and Concentration of Buyers relative to products .............................................................. 14
II. Buyers Switching Costs ............................................................................................................... 14
III. Buyers information ...................................................................................................................... 14
IV. Buyers ability to backward integrate ........................................................................................... 15
3.5 Threat of Substitutes ....................................................................................................................... 15
4. Growth ................................................................................................................................................ 16
5. Future Trends ...................................................................................................................................... 16
6. Summary ............................................................................................................................................. 16
7. Appendix ............................................................................................................................................. 17
8. References .......................................................................................................................................... 23
Page 4
4
1. Introduction
Telecom Industry is split into the following three segments
Mobile (Wireless): Comprises establishments operating and maintaining switching and transmission
facilities to provide direct communications via airwaves
Fixed Line (Wireline): Consists of companies that operate and maintain switching and transmission
facilities to provide direct communications through landlines, microwave or a combination of
landlines and satellite link-ups
Internet Services: Includes internet service providers (ISPs) that offer broadband internet
connections through consumer and corporate channels
2. Evolution of Telecom Industry in India
The telecom sector was formally introduced in India in 1881.However the actual evolution of the
telecom industry started in 1985 after the Indian Government set up the Department of
Telecommunications (DoT).In 1986, Mahanagar Telephone Nigam Limited (MTNL) and Videsh Sanchar
Nigam Limited (VSNL) were carved out of DoT to run the telecom services of metro
cities(Delhi and Mumbai) and international long distance operations respectively.1
The entire evolution of the telecom industry can be classified into three distinct phases.
Phase I- Pre-Liberalization Era (1980-89)
Phase II- Post Liberalization Era (1990-99)
Phase III- Post 2000
Until the late 90s the Government of India held a monopoly on all types of communications – as a result
of the Telegraph Act of 1885. Increased demand for telephones in India in the 90’s forced the
government to open doors to privatization and liberalization. Post-liberalization Indian telecom market
became one of the most liberalized markets in the world with private participation in almost all of its
segments.
1VanitaKohli (14 June 2006). The Indian Media Business. SAGE. pp. 189–. ISBN 978-0-7619-3469-1.
Page 5
5
In 1997, the government set up TRAI (Telecom Regulatory Authority of India) to provide autonomy in
deciding tariffs and policy making. The New Telecom Policy (NTP-1999) provided the much needed
impetus to the growth and liberalization of the industry. The policy introduced the concept of
telecommunication for all and its vision was to expand the telecommunication facilities to all the villages
in India. International players entered the market through joint ventures with state owned telecom
companies. Foreign firms were eligible to 49% of the total stake, but were just involved in technology
transfer, and not policy making. The government corporatized the operations wing of DoT on 1 October
2000 as Bharat Sanchar Nigam Limited (BSNL).
After March 2002 the government increased the allowable stake to 74% for foreign companies. As a
result, the service fees finally reduced and the call costs reduced greatly enabling every common
middle-class family in India to afford a cell phone. Nearly 32 million handsets were sold in India. Many
private operators, such as Reliance Communications, Tata Indicom, Vodafone, Airtel, Idea etc.,
successfully entered the high potential Indian telecom market.
In March ’98 there were only 0.88 million mobile subscribers in India with half of them from the Mumbai
and Delhi circles. NTP ’99 helped the mobile services take off in ’99-2000 adding 0.7 million customers to
its base. By 2003 the additions touched 6.6 million.
The implementation of Calling Party Pays (CPP) where incoming calls were made free and launch of
services by Reliance brought more low usage customers to mobile telephony. In 2004-05 with 52.2m
customers, the total mobile subscriber base overtook the total fixed line subscriber base. Since then the
industry has been adding more than 4m mobile subscribers every month.2
India has opted for the use of both GSM (global system for mobile communications) and CDMA (code-
division multiple access) technologies in the mobile sector. Along with landline and mobile phones,
some companies also provide the WLL service. The mobile tariffs in India have also become lowest in the
world.
2 State of the Industry, Telecom Industry Report- Crisil, India
Page 6
6
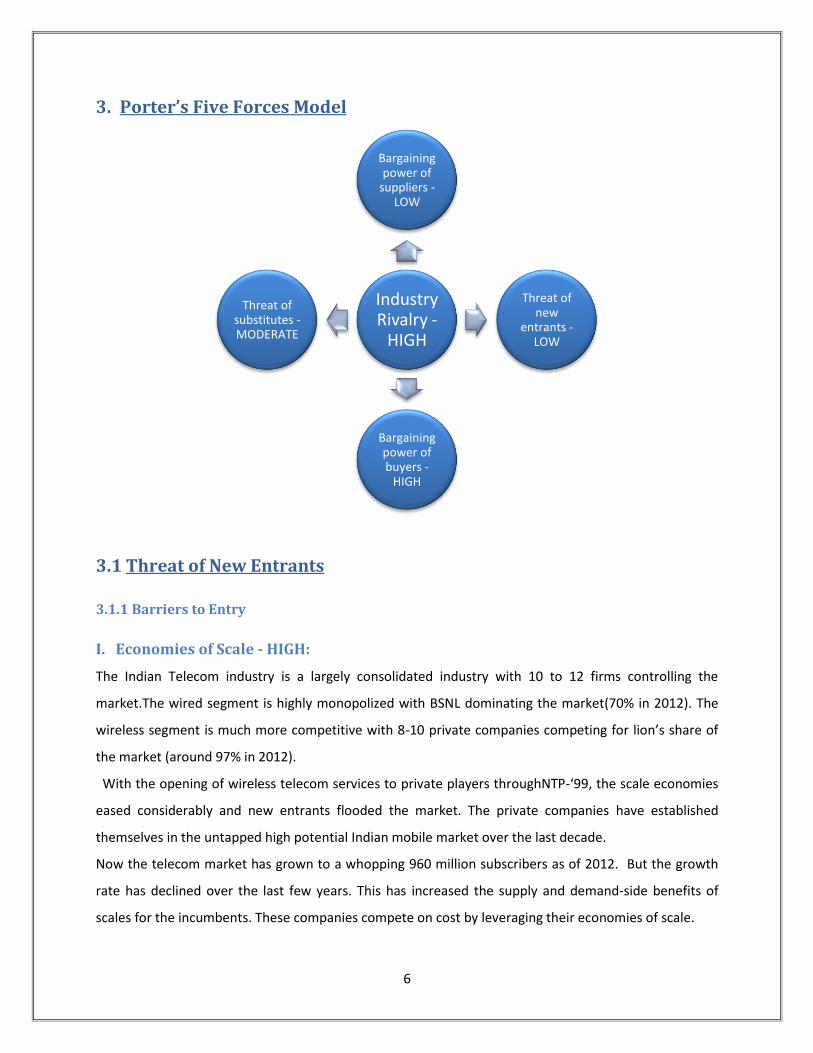
3. Porter’s Five Forces Model
3.1 Threat of New Entrants
3.1.1 Barriers to Entry
I. Economies of Scale - HIGH:
The Indian Telecom industry is a largely consolidated industry with 10 to 12 firms controlling the
market.The wired segment is highly monopolized with BSNL dominating the market(70% in 2012). The
wireless segment is much more competitive with 8-10 private companies competing for lion’s share of
the market (around 97% in 2012).
With the opening of wireless telecom services to private players throughNTP-‘99, the scale economies
eased considerably and new entrants flooded the market. The private companies have established
themselves in the untapped high potential Indian mobile market over the last decade.
Now the telecom market has grown to a whopping 960 million subscribers as of 2012. But the growth
rate has declined over the last few years. This has increased the supply and demand-side benefits of
scales for the incumbents. These companies compete on cost by leveraging their economies of scale.
Industry Rivalry -
HIGH
Bargaining power of
suppliers -LOW
Threat of new
entrants - LOW
Bargaining power of buyers -
HIGH
Threat of substitutes - MODERATE
Page 7
7
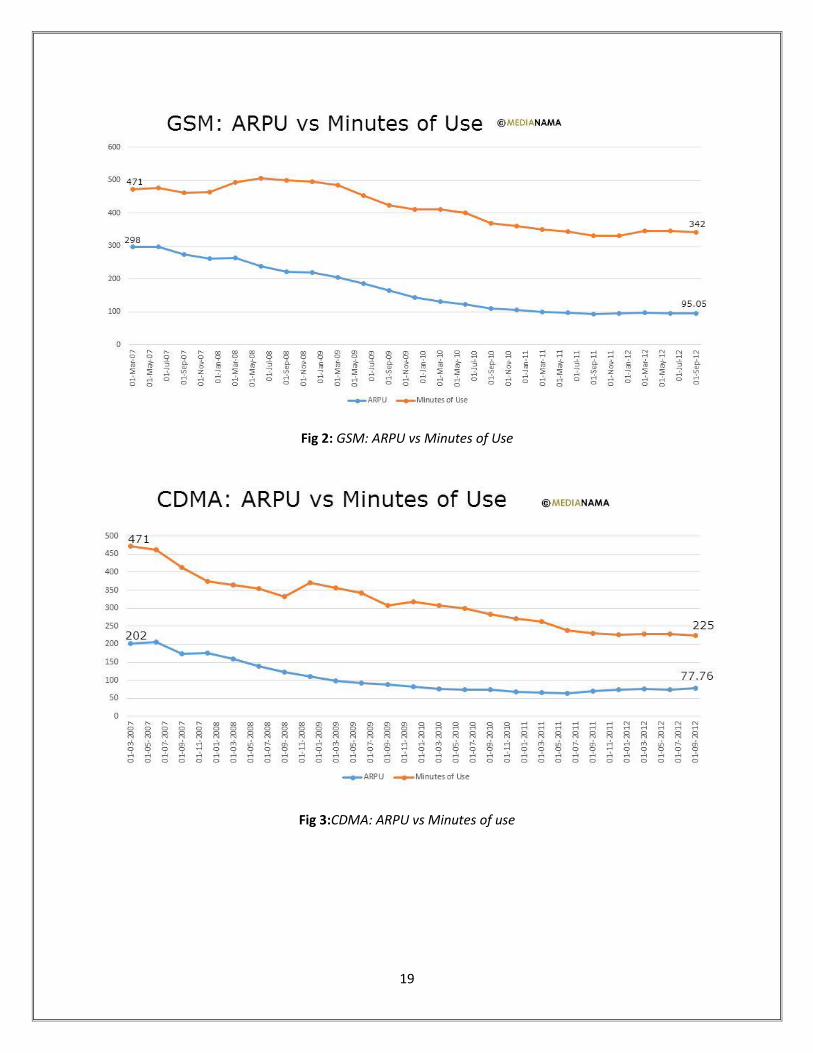
The low initial returns, nation-wide coverage by well-established players, declining Average Revenue per
User (ARPU- average 65% decline in last 5 years) and declining tariff rates(97% decline from 1999-2012)
are some of the scale economies that discourage new entrants.However the scale economies are more
influential in the wired segment than in the wireless segment because of the monopolistic power
exercised by the government-run BSNL.
So, in general, new entrants face unfavorable economies of scale.
II. Differentiation - LOW:
All the telecom service operators today provide the same basic services like voice, SMS and internet
capabilities. As such, the industry is largely driven by cost-competition. Attractive cost packages, high
quality and reliability of service and high accessibility differentiates the companies in the minds of the
customer. Hence there is no product differentiation in terms of the variety of features offered.
Low differentiation, in turn, leads to increased rivalry and lowers profitability and attractiveness of the
industry as a whole.
III. Brand Identity - MEDIUM:
Indian telecom sector is dominated by well-established companies with high brand image like Airtel
Idea, Vodafone etc. Brand image in telecom is built by reliability, accessibility and quality of service. A
new entrant would have to incur high infrastructure and advertising costs along with low pricing to build
a brand image. Also the incumbents can retaliate by further price cuts, providing availability of services
in new areas etc. However in the last 5 years, new entrants like Uninor and Tata Docomo have managed
to gain a substantial customer base through aggressive marketing and innovative pricing strategies.
So the incumbents exercise a moderate amount of power through their ‘Brand Pull’.
IV. Switching Cost - LOW:
The switching costs are relatively low in the telecom sector. Typically, the setup costs for wired services
are more than wireless sector because of the labor and material involved. Now, the Mobile number
portability facility for mobile users has reduced the switching costs to practically zero.
Thus overall switching cost is low.
Page 8
8
V. Access to Distribution Channel - HIGH:
India is a geographically diverse country that makes distribution a critical function. Since the market is
now huge (tele-density is 73.3% as of 2012), the incumbents have a huge advantage having already
setup their distribution channels all over the country. Since the distributors are small-time retailers and
distributors, they do not have much bargaining power and are more than satisfied to work with well-
established incumbents. So the costs for a new entrant to find new distribution channels are very high.
VI. Capital Requirement - HIGH:
A new entrant has to consider the following while entering the telecom sector
Extremely high infrastructure costs like communication equipment ,mobile towers
Spectrum License fee.
Cost of acquiring distribution channels
Marketing costs
So the incumbents have a huge cost advantage.
VII. Access to Technology – SLIGHTLY HIGH:
Technology is much more of a factor in the cellular segment than the wired segment. With rapidly
evolving cellular technologies like 3G and 4G, The incumbent firms can adapt more easily to the
changing technologies at a lower cost, since they already have the basic infrastructure in place. However
this is not a huge advantage as access to technology is readily available.
VIII. Access to Raw Materials – MODERATE:
In wired telecom sector, there is no advantage for the incumbents over new players as the access to
raw materials are easily available. SIM cards and Spectrum bandwidth are only raw materials in the
wireless sector. SIM cards are obtained from local manufacturers and are easily available at the same
cost. So access to raw materials is not a factor.
IX. Government Protection - HIGH:
Spectrum availability is a constraint for wireless sector. Spectrum allocations are done through auctions
by the government. Issues of interoperability with changing bandwidth, seamless integration of various
services and lobbying by powerful incumbents are major issues. Thus, spectrum availability poses a huge
barrier to entry, increasing the industry attractiveness.
The entry barriers are HIGH for entry into the Indian telecom industry.
Page 9
9
3.2 Industry Rivalry
There is intense rivalry in the industry due to emergence of new firms leading to price cuts. The
competition has become cut-throat. Due to almost equal size of rivals and nearly same customer base,
there is intense competition to attract customer with lower tariffs and more exciting services which
tends to drive industry profitability down. Apart from low profits, there are high exit barriers and high
fixed costs which are explained below:
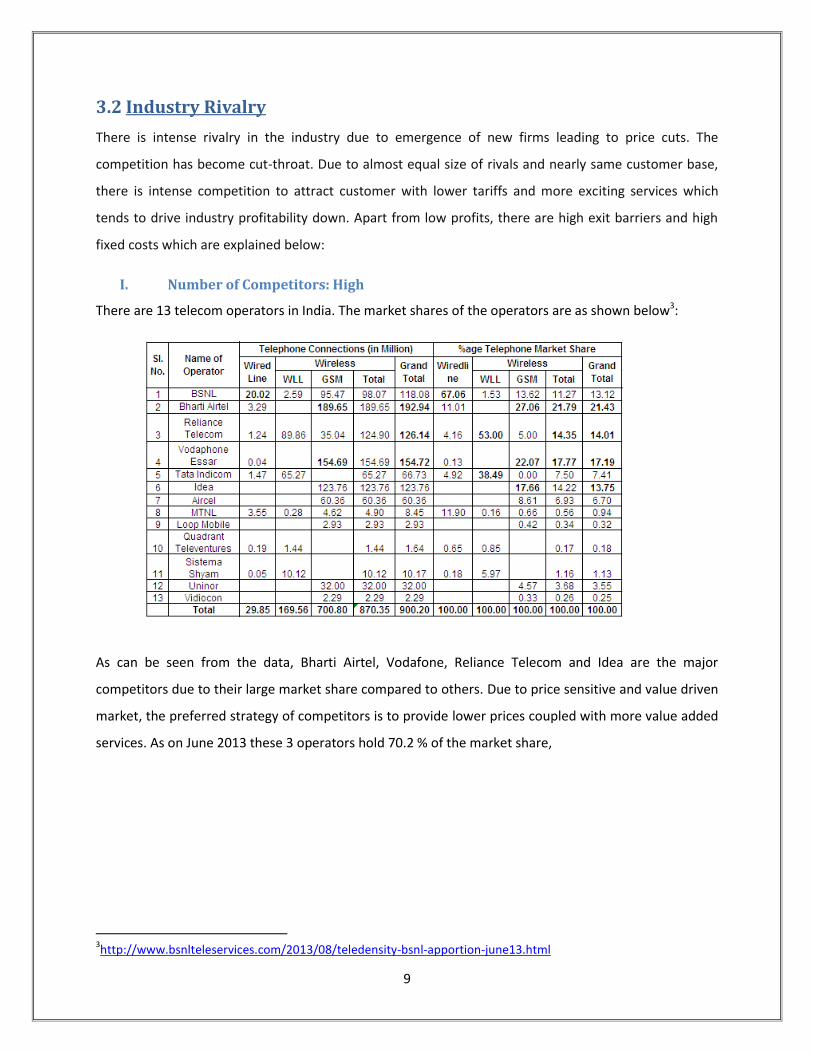
I. Number of Competitors: High
There are 13 telecom operators in India. The market shares of the operators are as shown below3:
As can be seen from the data, Bharti Airtel, Vodafone, Reliance Telecom and Idea are the major
competitors due to their large market share compared to others. Due to price sensitive and value driven
market, the preferred strategy of competitors is to provide lower prices coupled with more value added
services. As on June 2013 these 3 operators hold 70.2 % of the market share,
3http://www.bsnlteleservices.com/2013/08/teledensity-bsnl-apportion-june13.html
Page 10
10
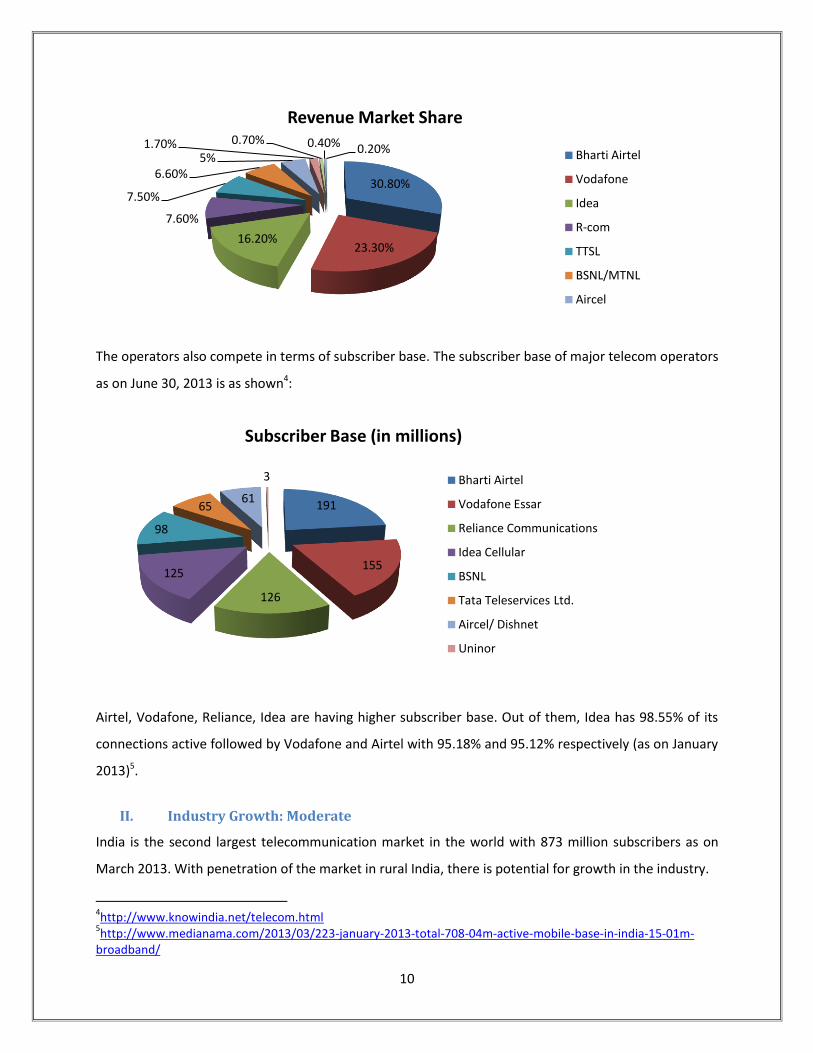
The operators also compete in terms of subscriber base. The subscriber base of major telecom operators
as on June 30, 2013 is as shown4:
Airtel, Vodafone, Reliance, Idea are having higher subscriber base. Out of them, Idea has 98.55% of its
connections active followed by Vodafone and Airtel with 95.18% and 95.12% respectively (as on January
2013)5.
II. Industry Growth: Moderate
India is the second largest telecommunication market in the world with 873 million subscribers as on
March 2013. With penetration of the market in rural India, there is potential for growth in the industry.
4http://www.knowindia.net/telecom.html
5http://www.medianama.com/2013/03/223-january-2013-total-708-04m-active-mobile-base-in-india-15-01m-
broadband/
30.80%
23.30% 16.20%
7.60%
7.50%
6.60% 5%
1.70% 0.70% 0.40% 0.20%
Revenue Market Share
Bharti Airtel
Vodafone
Idea
R-com
TTSL
BSNL/MTNL
Aircel
191
155
126
125
98
65 61
3
Subscriber Base (in millions)
Bharti Airtel
Vodafone Essar
Reliance Communications
Idea Cellular
BSNL
Tata Teleservices Ltd.
Aircel/ Dishnet
Uninor
Page 11
11
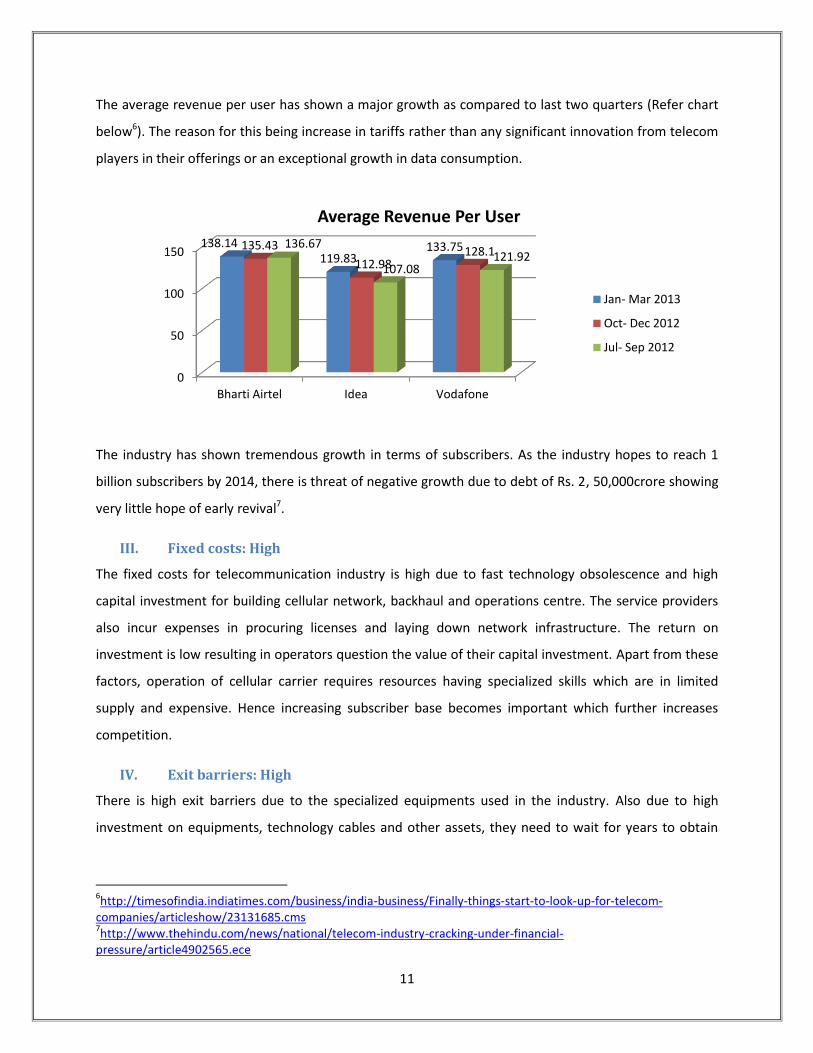
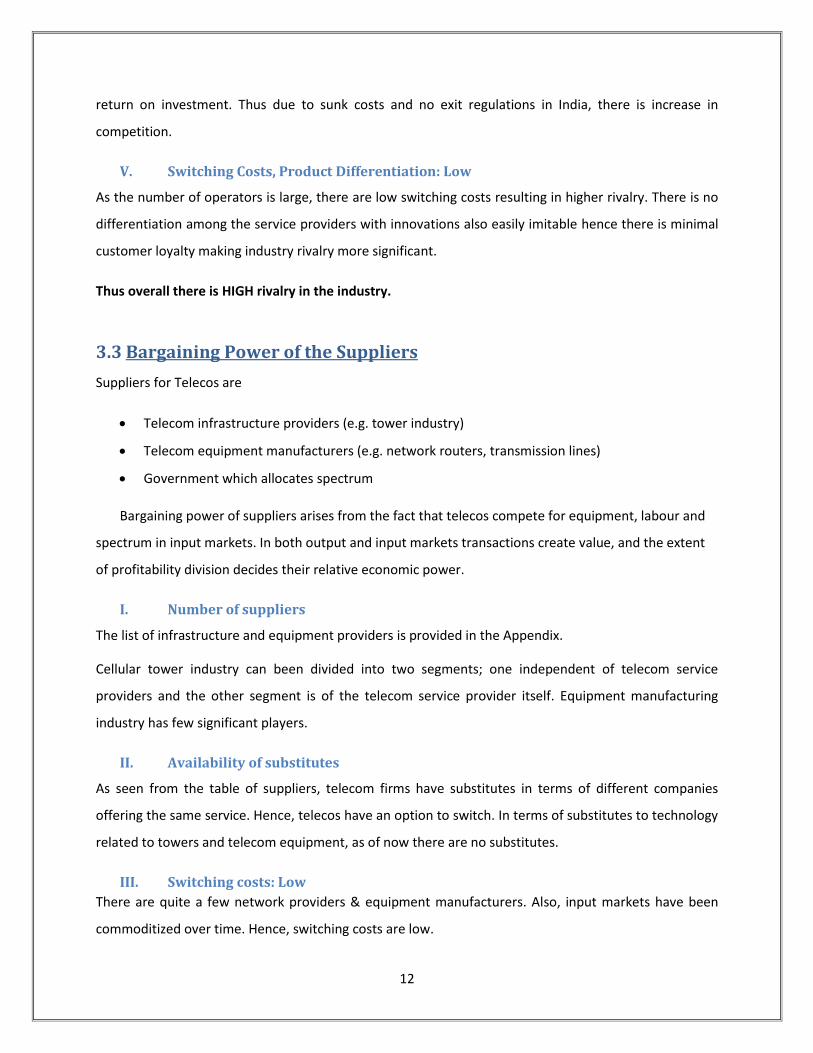
The average revenue per user has shown a major growth as compared to last two quarters (Refer chart
below6). The reason for this being increase in tariffs rather than any significant innovation from telecom
players in their offerings or an exceptional growth in data consumption.
The industry has shown tremendous growth in terms of subscribers. As the industry hopes to reach 1
billion subscribers by 2014, there is threat of negative growth due to debt of Rs. 2, 50,000crore showing
very little hope of early revival7.
III. Fixed costs: High
The fixed costs for telecommunication industry is high due to fast technology obsolescence and high
capital investment for building cellular network, backhaul and operations centre. The service providers
also incur expenses in procuring licenses and laying down network infrastructure. The return on
investment is low resulting in operators question the value of their capital investment. Apart from these
factors, operation of cellular carrier requires resources having specialized skills which are in limited
supply and expensive. Hence increasing subscriber base becomes important which further increases
competition.
IV. Exit barriers: High
There is high exit barriers due to the specialized equipments used in the industry. Also due to high
investment on equipments, technology cables and other assets, they need to wait for years to obtain
6http://timesofindia.indiatimes.com/business/india-business/Finally-things-start-to-look-up-for-telecom-
companies/articleshow/23131685.cms 7http://www.thehindu.com/news/national/telecom-industry-cracking-under-financial-
pressure/article4902565.ece
0
50
100
150
Bharti Airtel Idea Vodafone
138.14 119.83
133.75 135.43
112.98 128.1
136.67
107.08 121.92
Average Revenue Per User
Jan- Mar 2013
Oct- Dec 2012
Jul- Sep 2012
Page 12
12
return on investment. Thus due to sunk costs and no exit regulations in India, there is increase in
competition.
V. Switching Costs, Product Differentiation: Low
As the number of operators is large, there are low switching costs resulting in higher rivalry. There is no
differentiation among the service providers with innovations also easily imitable hence there is minimal
customer loyalty making industry rivalry more significant.
Thus overall there is HIGH rivalry in the industry.
3.3 Bargaining Power of the Suppliers
Suppliers for Telecos are
Telecom infrastructure providers (e.g. tower industry)
Telecom equipment manufacturers (e.g. network routers, transmission lines)
Government which allocates spectrum
Bargaining power of suppliers arises from the fact that telecos compete for equipment, labour and
spectrum in input markets. In both output and input markets transactions create value, and the extent
of profitability division decides their relative economic power.
I. Number of suppliers
The list of infrastructure and equipment providers is provided in the Appendix.
Cellular tower industry can been divided into two segments; one independent of telecom service
providers and the other segment is of the telecom service provider itself. Equipment manufacturing
industry has few significant players.
II. Availability of substitutes
As seen from the table of suppliers, telecom firms have substitutes in terms of different companies
offering the same service. Hence, telecos have an option to switch. In terms of substitutes to technology
related to towers and telecom equipment, as of now there are no substitutes.
III. Switching costs: Low
There are quite a few network providers & equipment manufacturers. Also, input markets have been
commoditized over time. Hence, switching costs are low.
Page 13
13
IV. Supplier’s threat of forward integration: Moderate
Suppliers can forward integrate given that they have access to infrastructure and logistics, but
establishing brand identity will be a challenge. Hence there is intermediate supplier’s threat of forward
integration.
V. Industry’s threat of backward integration: High
Large telecos can buy out network providers and backward integrate. This has happened in the case of
cellular towers where big players acquired major stake in existing suppliers. They have also shared their
resources in input markets to decrease costs.
VI. Industry’s importance to supplier: High
Suppliers form the core of telecommunication industry. Without cellular towers, transmission lines,
switches, modems, routers and spectrum (allocated government) service providers cannot carry out
their functions. Hence industry thrives on suppliers’ products and service.
3.4 Bargaining Power of the Buyers As of May 2012, the total number of telecom subscribers in India is 960 million with a growth rate of
0.84% per month. Buyers, in the telecommunication industry can be classified as8:
1. Residential or Individual Customers
2. Enterprise or Business Customers
Residential Customers refer to individual subscribers, whereas Enterprise Customers are the large
business firms like any IT firm or a bank et al.
3.4.1 Analyzing Customer Sensitivity:
I. Product Differentiation
The Telecom service providers, Telephone and Data services do not vary much, except for the signal
strength in specific geographical locations. Moreover, the government regulations apply to all the
providers.
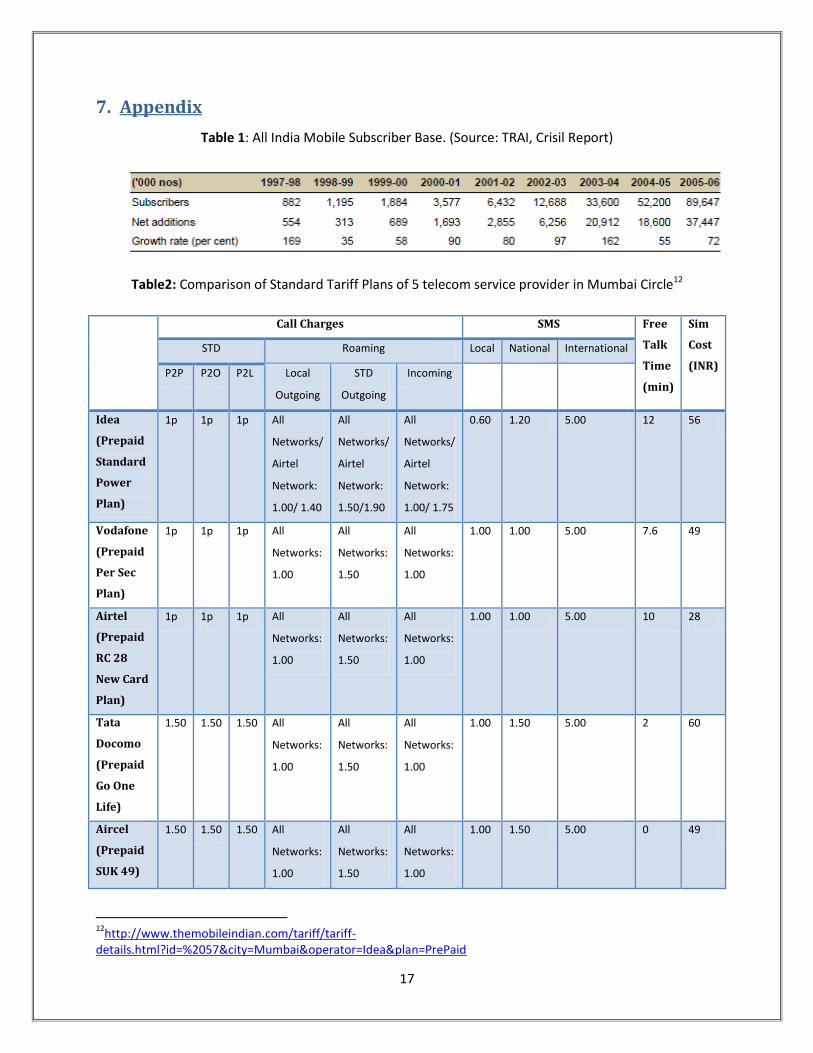
The Tariff table (Table 2 in appendix) compares the tariff plans of various telecom service providers. The
tariff rates are relatively similar. However, the customers can definitely switch over to any other service
provider which provides higher reliability and signal strength in their corresponding geographical area.
8http://www.investopedia.com/features/industryhandbook/telecom.asp
Page 14
14
Since the product differentiation is very minimal, switching costs are low for the residential customers.
The enterprise or business customers, like bank or IT firms requires bulk and customized services. In
their case, bargaining power as well as switching costs goes high.
II. Competition between Buyers
The residential customers don’t have any internal competition. However, the enterprise customer
segment generate, especially banks who render services to telecom operators in return and supplement
a major part of the provider’s revenue, have a upper hand in bargaining on the prices incurred on them.
3.4.2 Analyzing Relative Buying Power:
I. Size and Concentration of Buyers relative to products: MEDIUM
In the first segment, the size is large while the concentration of consumption per individual is relatively
lower. Buyer power is thus low. On the other hand, the enterprise customer segment has large size as
well as large concentration in term of consumption. They exercise a higher buyer power. The overall
buying power is thus medium.
II. Buyers Switching Costs: LOW
As stated in Product Differentiation, the switching costs are low.
The Mobile Number Portability (MNP)9 is convenient and affordable. Due to these reasons, the number
of MNP requests has gone up from 54 million subscribers to 59 million subscribers10 by the end of July
2012. Thus, switching costs are low.
Another indicator of Low Switching Cost is the Churn Rate.
Due to fierce competition, Telecom industry has the highest customer churn rate. This proves that the
high churn rate is due to the ease of switching among the service providers.
Thus the overall switching cost for customers is very low.
III. Buyers information: HIGH
Due to the explosion of social networking and internet advertising these days, the customers are aware
of all the available options. They can compare the tariff plans online and then decide which plan to
9http://www.mnpindia.in/number-portability.aspx
10 www.trai.gov.in
Page 15
15
choose. Blogs and other online dashboards provide various discussion threads wherein every user
shares his/her experience with the service provider. Using these resources, the customer does
background check on many attributes like roaming charges, signal strength, seasonal offers, network
reliability and quality of service before deciding on a particular operator. Hence, high buyer information
corresponds to high buyer power.
IV. Buyers ability to backward integrate: LOW
There are no intermediaries between the service provider and the customer. Hence, the ability to
backward integrate is low. This, in turn corresponds to lower buyer power.
Thus, overall Bargaining Power of the Buyers is HIGH.
3.5 Threat of Substitutes
The threat of substitutes in the telecom industry is moderate. Products and services from non-
traditional telecom industries pose serious substitution threats. Cable TV and satellite operators now
compete for buyers. The cable guys, with their own direct lines into homes, offer broadband internet
services, and satellite links can substitute for high-speed business networking needs. Railways and
energy utility companies are laying miles of high-capacity telecom network alongside their own track
and pipeline assets. Another substitute, the internet is becoming a viable vehicle for cut-rate voice calls.
Delivered by ISPs - "internet telephony" could take a big bite out of telecom companies' core voice
revenues. VoIP Applications like Skype offers video chat and call services over the internet, whereas
apps like Whatsapp offer free messaging services. India is a latecomer to the VoIP revolution. Currently,
Indian laws only allow VoIP calls to a telephone in India under strict conditions. However, they allow
such calls between computers within the country’s borders and between a computer in India and a
telephone (fixed or wireless) outside India.
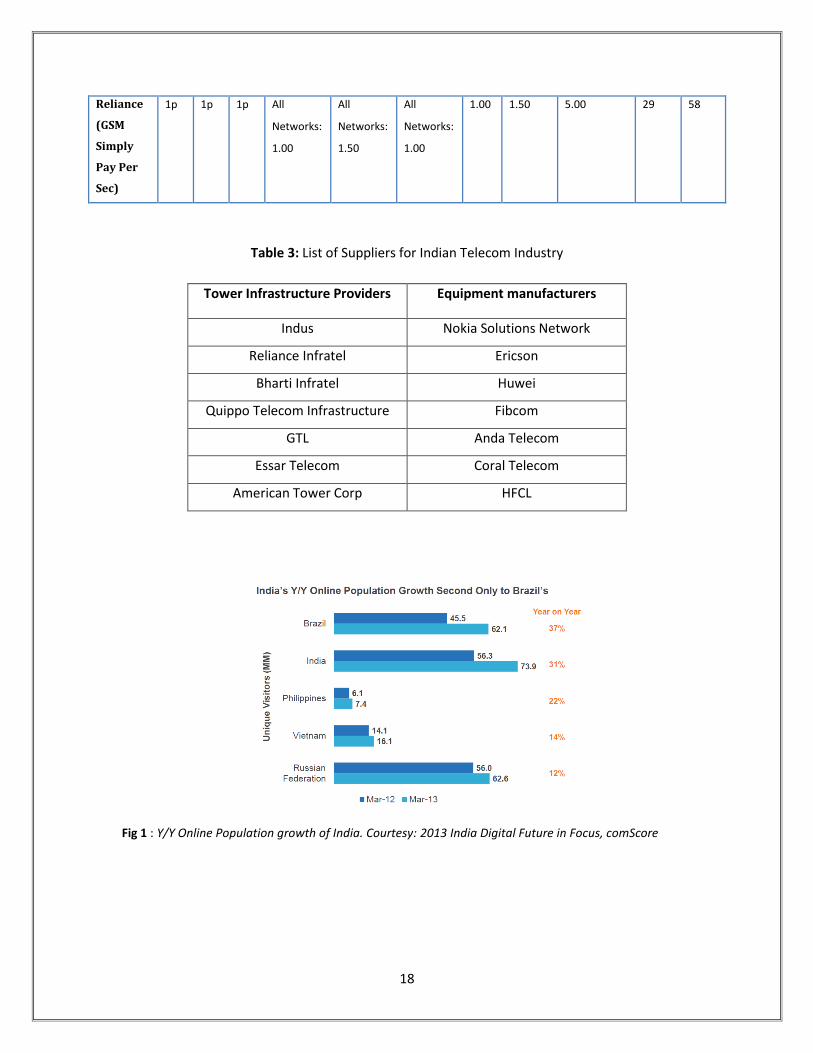
India has now the world’s third largest internet using population11 with nearly 74 million Internet users,
a 31% increase over March 2012. The Telecom Regulatory Authority of India (TRAI) pegged the number
of Internet subscribers in India at 164.81 million as of March 31, 2013, with seven out of eight accessing
the Internet from their mobile phones. This is good news for the mobile phone internet providers as
well as bad news due to the threat of VoIP software.
11
http://www.thehindu.com/sci-tech/technology/internet/india-is-now-worlds-third-largest-internet-user-after-us-china/article5053115.ece
Page 16
16
Therefore the overall Threat of Substitutes is MODERATE.
4. Growth
Revenue from wireless and wireline increased at a CAGR of 11.9 % to $40.8 billion over FY07-12.
Wireless subscriptions had increased at a CAGR of 34 % to 864.7 million over a 6 year period from
2006 to 2012
Mobile telephone density increased more than 5 times from 13.5% in 2006 to 70.9% in 2013
GSM services contribute the most to wireless segment with 88.1% share (June 2012); CDMA takes
the remaining.
Bharti Airtel is the market leader. The top five players – Bharti Airtel, Vodafone, Reliance, Idea, and
BSNL – contribute to about 79% of the total subscribers
5. Future Trends
Expansion to rural markets will be key to future growth
Broadband Wireless Access (BWA) technologies like WiMax have been successful in US and hence
expected to grow in India
Rising investments in telecom sector is a great sign for the industry
Outsourcing of non-core activities is expected to increase even more
6. Summary
The impact of each of the forces indicates that the Indian telecom industry is a moderately attractive
industry. Its strengths are low bargaining powers of suppliers and high barriers to entry. The weakness is
the high bargaining power of suppliers. The attractiveness index of this industry is 3.2(refer appendix)
which is neither too high nor too low.
Page 17
17
7. Appendix
Table 1: All India Mobile Subscriber Base. (Source: TRAI, Crisil Report)
Table2: Comparison of Standard Tariff Plans of 5 telecom service provider in Mumbai Circle12
Call Charges SMS Free
Talk
Time
(min)
Sim
Cost
(INR)
STD Roaming Local National International
P2P P2O P2L Local
Outgoing
STD
Outgoing
Incoming
Idea
(Prepaid
Standard
Power
Plan)
1p 1p 1p All
Networks/
Airtel
Network:
1.00/ 1.40
All
Networks/
Airtel
Network:
1.50/1.90
All
Networks/
Airtel
Network:
1.00/ 1.75
0.60 1.20 5.00 12 56
Vodafone
(Prepaid
Per Sec
Plan)
1p 1p 1p All
Networks:
1.00
All
Networks:
1.50
All
Networks:
1.00
1.00 1.00 5.00 7.6 49
Airtel
(Prepaid
RC 28
New Card
Plan)
1p 1p 1p All
Networks:
1.00
All
Networks:
1.50
All
Networks:
1.00
1.00 1.00 5.00 10 28
Tata
Docomo
(Prepaid
Go One
Life)
1.50 1.50 1.50 All
Networks:
1.00
All
Networks:
1.50
All
Networks:
1.00
1.00 1.50 5.00 2 60
Aircel
(Prepaid
SUK 49)
1.50 1.50 1.50 All
Networks:
1.00
All
Networks:
1.50
All
Networks:
1.00
1.00 1.50 5.00 0 49
12
http://www.themobileindian.com/tariff/tariff-details.html?id=%2057&city=Mumbai&operator=Idea&plan=PrePaid
Page 18
18
Reliance
(GSM
Simply
Pay Per
Sec)
1p 1p 1p All
Networks:
1.00
All
Networks:
1.50
All
Networks:
1.00
1.00 1.50 5.00 29 58
Table 3: List of Suppliers for Indian Telecom Industry
Tower Infrastructure Providers Equipment manufacturers
Indus Nokia Solutions Network
Reliance Infratel Ericson
Bharti Infratel Huwei
Quippo Telecom Infrastructure Fibcom
GTL Anda Telecom
Essar Telecom Coral Telecom
American Tower Corp HFCL
Fig 1 : Y/Y Online Population growth of India. Courtesy: 2013 India Digital Future in Focus, comScore
Page 19
19
Fig 2: GSM: ARPU vs Minutes of Use
Fig 3:CDMA: ARPU vs Minutes of use
Page 20
20
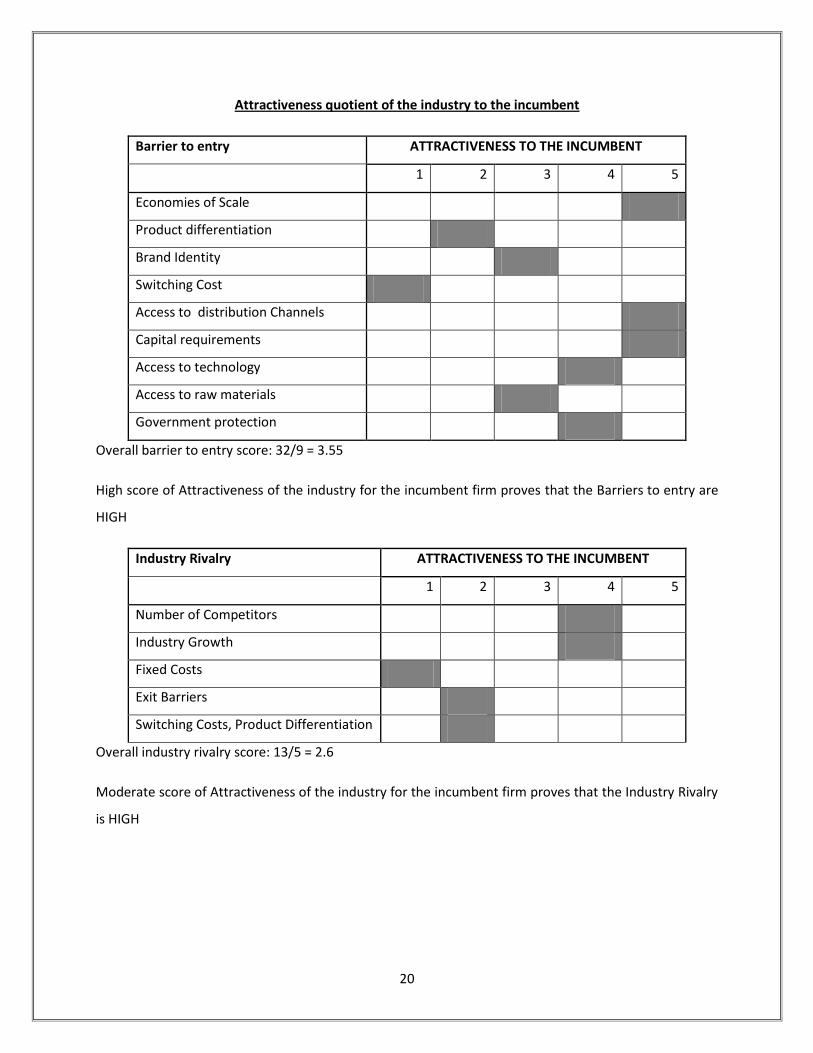
Attractiveness quotient of the industry to the incumbent
Barrier to entry ATTRACTIVENESS TO THE INCUMBENT
1 2 3 4 5
Economies of Scale
Product differentiation
Brand Identity
Switching Cost
Access to distribution Channels
Capital requirements
Access to technology
Access to raw materials
Government protection
Overall barrier to entry score: 32/9 = 3.55
High score of Attractiveness of the industry for the incumbent firm proves that the Barriers to entry are
HIGH
Industry Rivalry ATTRACTIVENESS TO THE INCUMBENT
1 2 3 4 5
Number of Competitors
Industry Growth
Fixed Costs
Exit Barriers
Switching Costs, Product Differentiation
Overall industry rivalry score: 13/5 = 2.6
Moderate score of Attractiveness of the industry for the incumbent firm proves that the Industry Rivalry
is HIGH
Page 21
21
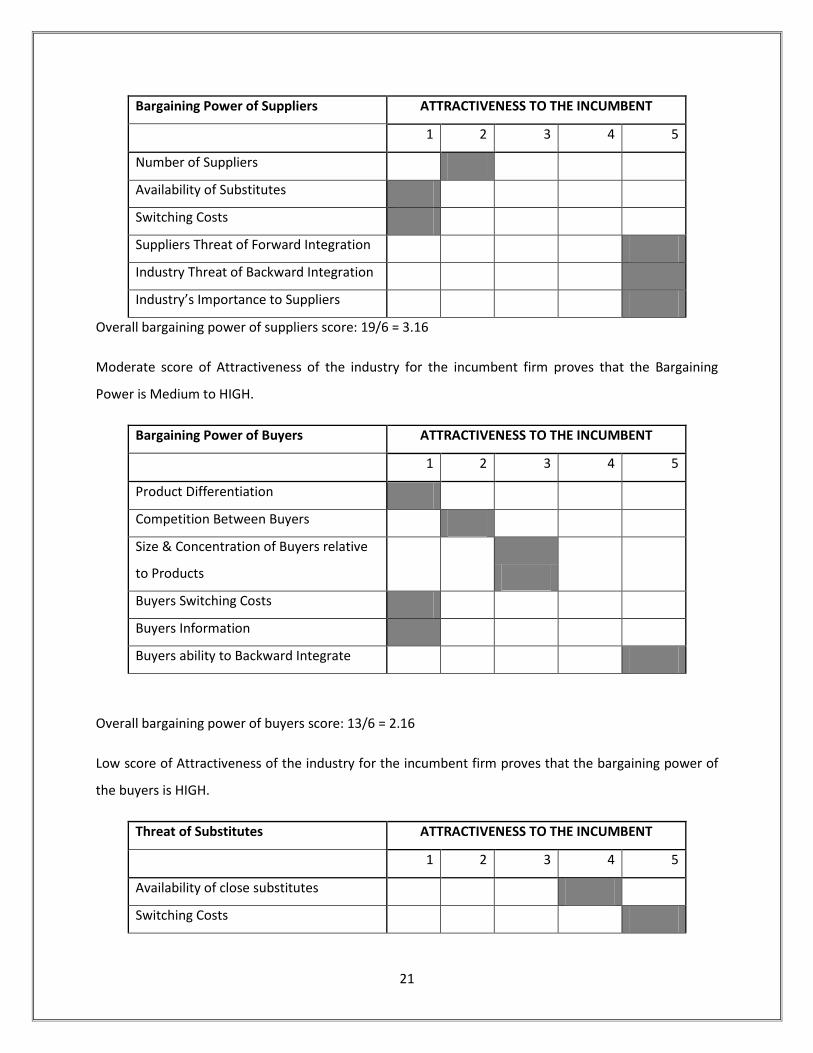
Bargaining Power of Suppliers ATTRACTIVENESS TO THE INCUMBENT
1 2 3 4 5
Number of Suppliers
Availability of Substitutes
Switching Costs
Suppliers Threat of Forward Integration
Industry Threat of Backward Integration
Industry’s Importance to Suppliers
Overall bargaining power of suppliers score: 19/6 = 3.16
Moderate score of Attractiveness of the industry for the incumbent firm proves that the Bargaining
Power is Medium to HIGH.
Bargaining Power of Buyers ATTRACTIVENESS TO THE INCUMBENT
1 2 3 4 5
Product Differentiation
Competition Between Buyers
Size & Concentration of Buyers relative
to Products
Buyers Switching Costs
Buyers Information
Buyers ability to Backward Integrate
Overall bargaining power of buyers score: 13/6 = 2.16
Low score of Attractiveness of the industry for the incumbent firm proves that the bargaining power of
the buyers is HIGH.
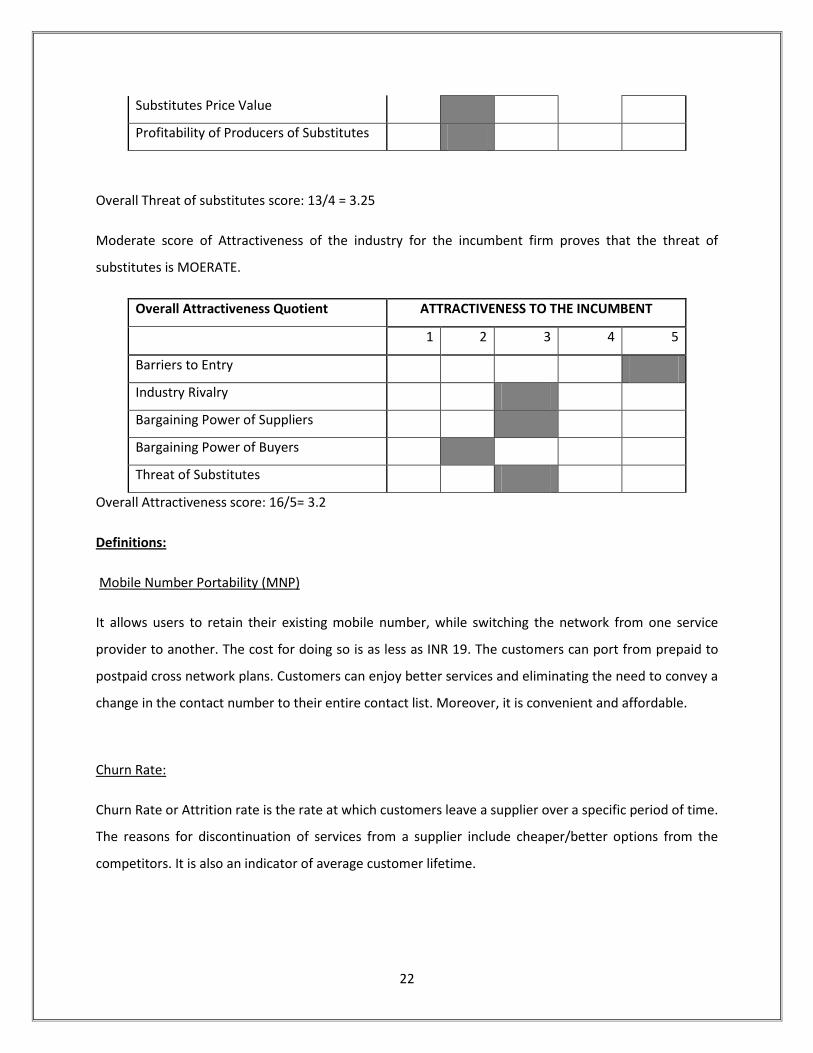
Threat of Substitutes ATTRACTIVENESS TO THE INCUMBENT
1 2 3 4 5
Availability of close substitutes
Switching Costs
Page 22
22
Substitutes Price Value
Profitability of Producers of Substitutes
Overall Threat of substitutes score: 13/4 = 3.25
Moderate score of Attractiveness of the industry for the incumbent firm proves that the threat of
substitutes is MOERATE.
Overall Attractiveness Quotient ATTRACTIVENESS TO THE INCUMBENT
1 2 3 4 5
Barriers to Entry
Industry Rivalry
Bargaining Power of Suppliers
Bargaining Power of Buyers
Threat of Substitutes
Overall Attractiveness score: 16/5= 3.2
Definitions:
Mobile Number Portability (MNP)
It allows users to retain their existing mobile number, while switching the network from one service
provider to another. The cost for doing so is as less as INR 19. The customers can port from prepaid to
postpaid cross network plans. Customers can enjoy better services and eliminating the need to convey a
change in the contact number to their entire contact list. Moreover, it is convenient and affordable.
Churn Rate:
Churn Rate or Attrition rate is the rate at which customers leave a supplier over a specific period of time.
The reasons for discontinuation of services from a supplier include cheaper/better options from the
competitors. It is also an indicator of average customer lifetime.
Page 23
23
8. References http://www.dnb.co.in/IndianTelecomIndustry/OverviewTI.asp
http://www.slideshare.net/zinnov/indian-telecom-market-overview
http://research.ijcaonline.org/ncaete/number3/mpginmc1098.pdf
http://www.livemint.com/Industry/9JEh45TZDJ1HU1xae9YRTJ/What-lies-ahead-for-Indias-telecom-
industry.html
http://www.comviva.com/media/BEsectortelecom.pdf
http://www.equitymaster.com/research-it/sector-info/telecom/Telecom-Sector-Analysis-Report.asp
http://www.ibef.org/download/telecommunication-august-2013.pdf
http://www.ideasmakemarket.com/2013/08/aug-entry6-analysis-of-indian.html
http://www.medianama.com/2013/04/223-india-mobile-arpu-minutes-cdma-gsm-2/