1.1 Subscription of Voice Telephony Service .................................................................................... 3
1.2 Market Share of Voice Services (Service-wise) ........................................................................... 3 1.3 Market Share of Voice Services (Operator-wise) ......................................................................... 4 1.4 Number of GSM/ IMT Subscribers (Growth) .......................................................................... 4 1.5 GSM/ IMT Market Share of Operators as per SIM card sells ................................................. 4
2. Internet Service ................................................................................................................................ 5
2.1 Subscription of Broadband Internet Service ............................................................................ 5 2.2 Market Share on Data Services (Technology-wise) ................................................................. 5 2.3 Market Share on Mobile Broadband (Operator-wise).............................................................. 6 2.4 Number of Subscribers (Fixed Internet Services) .................................................................... 6 2.5 Market Share on Fixed Broadband (Operator-wise) ................................................................ 7
3.1 Call Volume (Voice) ................................................................................................................ 8 3.2 Data Volume ............................................................................................................................ 8 3.3 Number of Subscribers (HLR vs VLR).................................................................................... 8 3.4 GSM/ IMT Market Share of Operators as per VLR................................................................. 8
3.5 (ARPU) Average Revenue Per User (Voice, Data and SMS).................................................. 9 3.6 Revenue from the Services ....................................................................................................... 9 3.7 Revenue of Fixed Internet Services ......................................................................................... 9
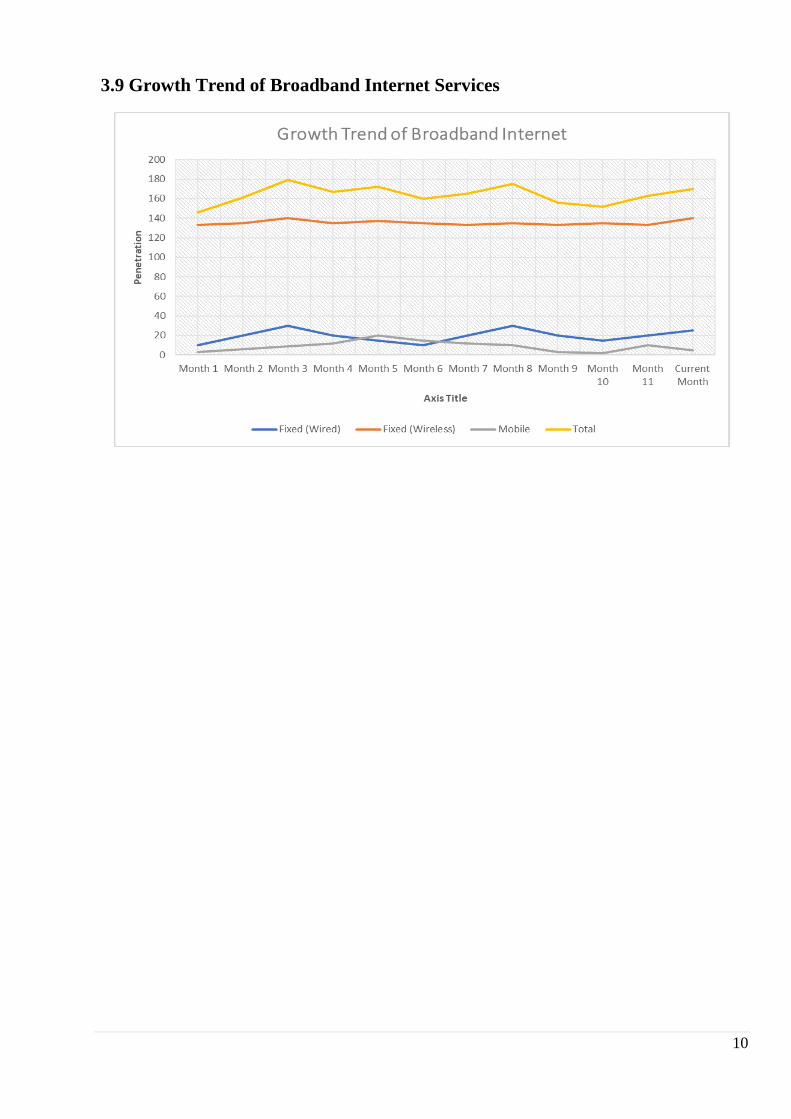
3.8 Growth Trend of Voice Telephony Services ............................................................................ 9 3.9 Growth Trend of Broadband Internet Services ...................................................................... 10
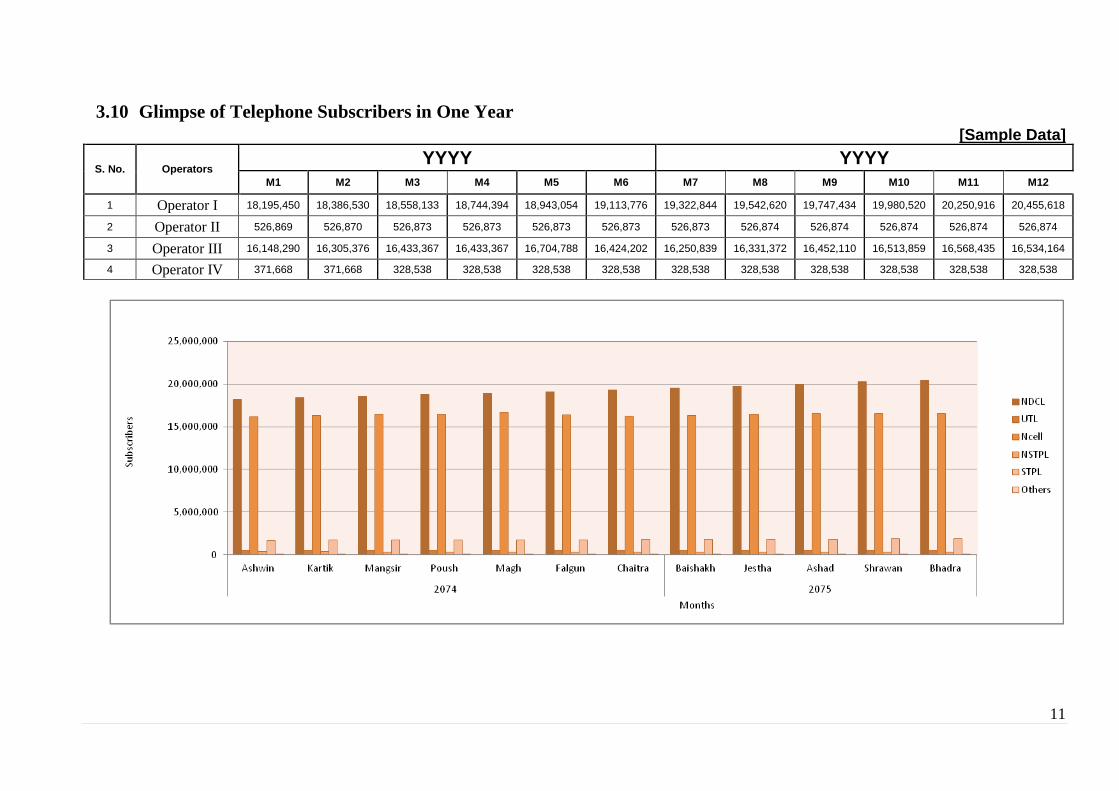
3.10 Glimpse of Telephone Subscribers in One Year ................................................................ 11 4. Coverage Map (GSM/ IMT) .......................................................................................................... 12
Appendix-I: NTA Licensing Activity at a glance as of …………………… ....................................... 18
3
1. Voice Telephony
1.1 Subscription of Voice Telephony Service Operator Technology P 1 P 2 P 3 P 4 P 5 P 6 P 7 Total Penetration
(%)
Operator A
Fixed
PSTN
VSAT
WLL
Mobile
CDMA
GSM/IMT
Operator B GSM/IMT
Operator C GSM/IMT
Operator D
Operator E
Others Others GMPCS
Total Population Projection (2011-2031) 29,291,746 (Source: cbs.gov.np)
*P= Province
1.2 Market Share of Voice Services (Service-wise)
[Calculated from the Total Column of 1.1 for Fixed, Mobile and Others Services]
4
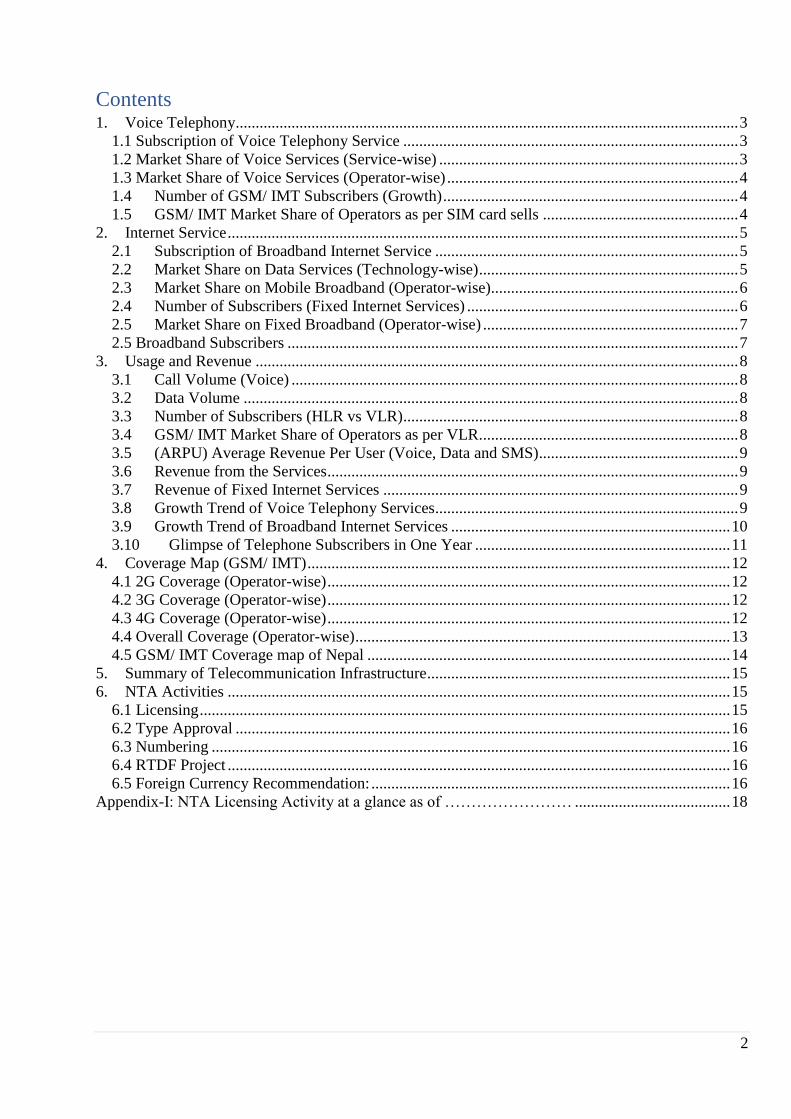
1.3 Market Share of Voice Services (Operator-wise)
[Calculated from the Total Column of 1.1 for each Operators]
1.4 Number of GSM/ IMT Subscribers (Growth)
Operator This Quarter Previous Quarter Growth (in %)
Operator A
Operator B
Operator C
1.5 GSM/ IMT Market Share of Operators as per SIM card sells
[Calculated from the This Quarter Column of 1.4 for each Operators]
5
2. Internet Service
2.1 Subscription of Broadband Internet Service Services Subscribers Total
Operator A Operator B Operator C ISPs
Fixed
Broadband
(Wired)
ADSL # - - -
Cable/ FTTH #
-
- -
Internet Leased
Line
Fixed
Broadband
(Wireless)
Radio (WIFI) #
WiMAX # -
Mobile
Broadband
3G
4G
EVDO
Total
Services Subscription (%)
Fixed Broadband (Wired) #
Fixed Broadband (Wireless) #
Mobile Broadband
Total Broadband (%)
Note: Data/Internet Service through GPRS Service is excluded in Broadband subscription # 1 Connection equal to 4.88 subscribers for fixed broadband (Source: cbs.gov.np)
* Data for the month of Bhadra not received
@ Data not provided
FTTH- Fibre to the Home
2.2 Market Share on Data Services (Technology-wise)
[Calculated from the Total Column of 1.1 for Fixed (Wired), Fixed (Wireless) and Mobile Broadband
Services]
6
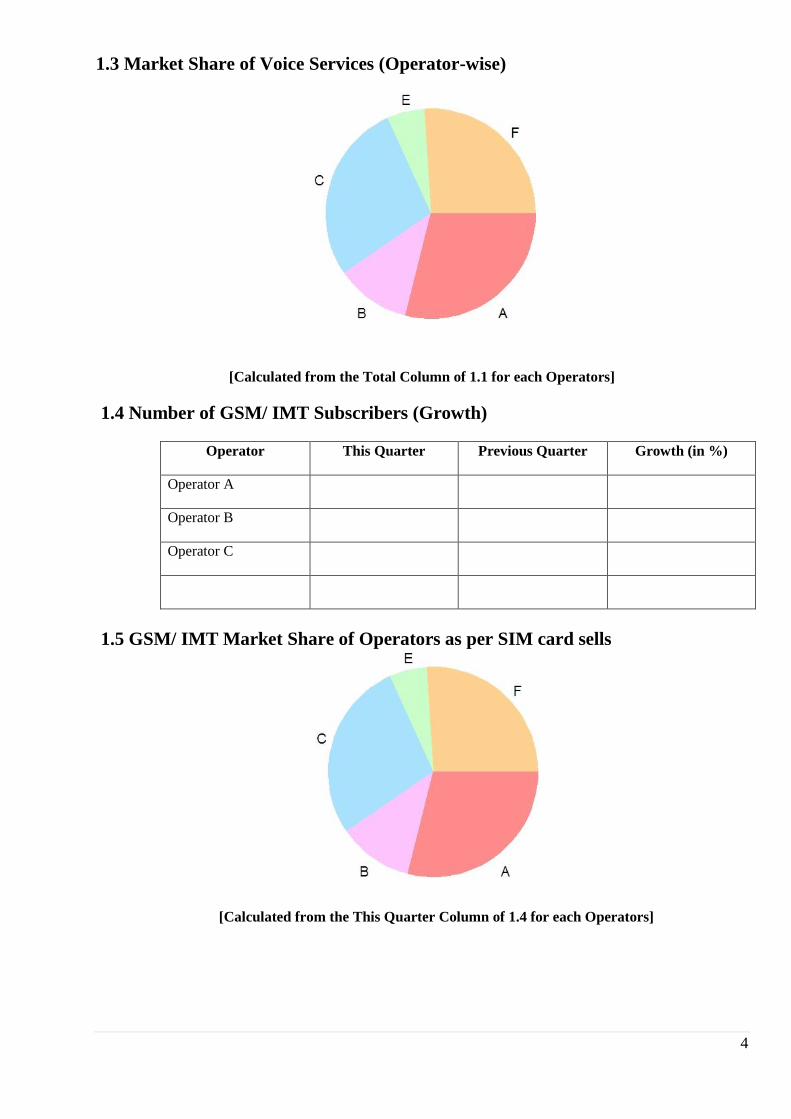
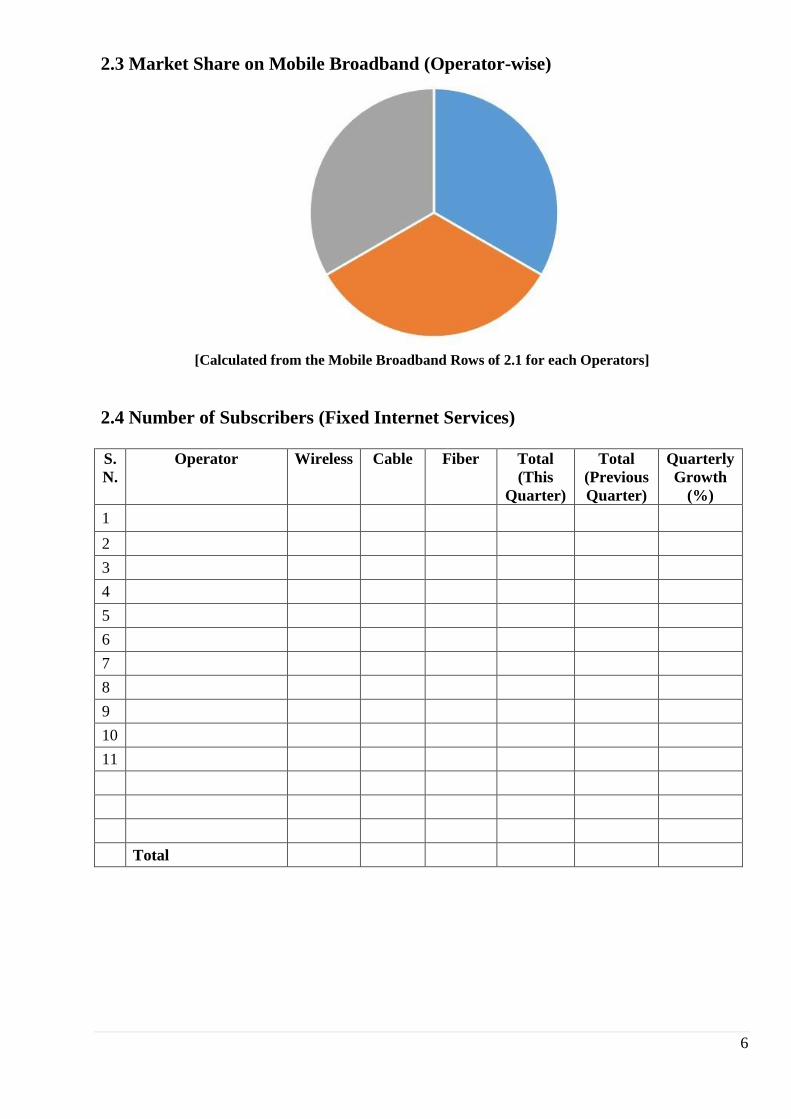
2.3 Market Share on Mobile Broadband (Operator-wise)
[Calculated from the Mobile Broadband Rows of 2.1 for each Operators]
2.4 Number of Subscribers (Fixed Internet Services)
S.
N.
Operator Wireless Cable Fiber Total
(This
Quarter)
Total
(Previous
Quarter)
Quarterly
Growth
(%)
1
2
3
4
5
6
7
8
9
10
11
Total
7
2.5 Market Share on Fixed Broadband (Operator-wise)
[Calculated from the This Quarter Column of 2.3 for at least top 10 ISPs (Individually) and Others
(Combined)]
2.5 Broadband Subscribers
8
3. Usage and Revenue
3.1 Call Volume (Voice) [Erlangs/ Minutes]
Operator Local
Incoming
Local
Outgoing
International
Incoming
International
Outgoing
Operator I
Operator II
Operator III
Total
3.2 Data Volume
Operator International
BW Provider
Incoming Volume
(GB)
Total
Operator I
Operator II
Total
3.3 Number of Subscribers (HLR vs VLR) Operator This Quarter Previous Quarter Growth
HLR VLR HLR VLR HLR VLR
Operator I
Operator II
Operator III
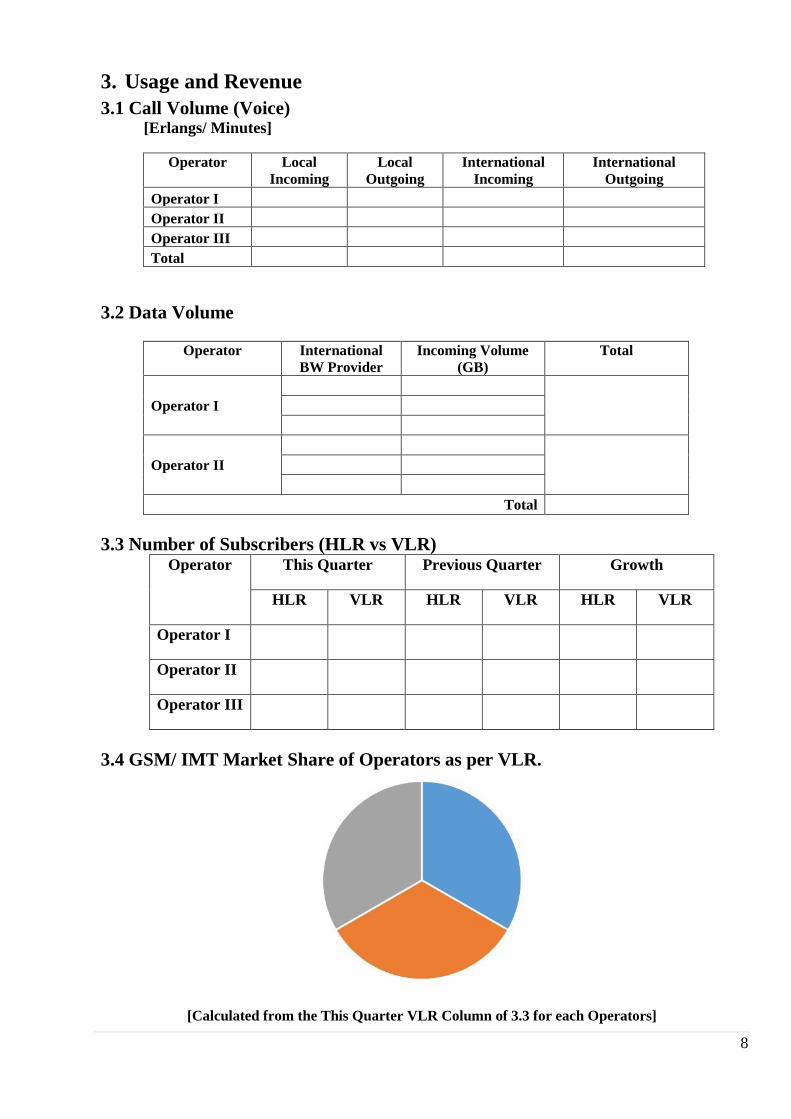
3.4 GSM/ IMT Market Share of Operators as per VLR.
[Calculated from the This Quarter VLR Column of 3.3 for each Operators]
9
3.5 (ARPU) Average Revenue Per User (Voice, Data and SMS) [GSM/ IMT]
Operator
Voice ARPU
(National)
Voice ARPU
(International) Data ARPU SMS ARPU
Operator I
Operator II
Operator III
3.6 Revenue from the Services
Revenue This Quarter Previous Quarter Growth
Voice (National)
Voice (International)
Data Usage
Others
3.7 Revenue of Fixed Internet Services Operator This Quarter Previous Quarter Growth (%)