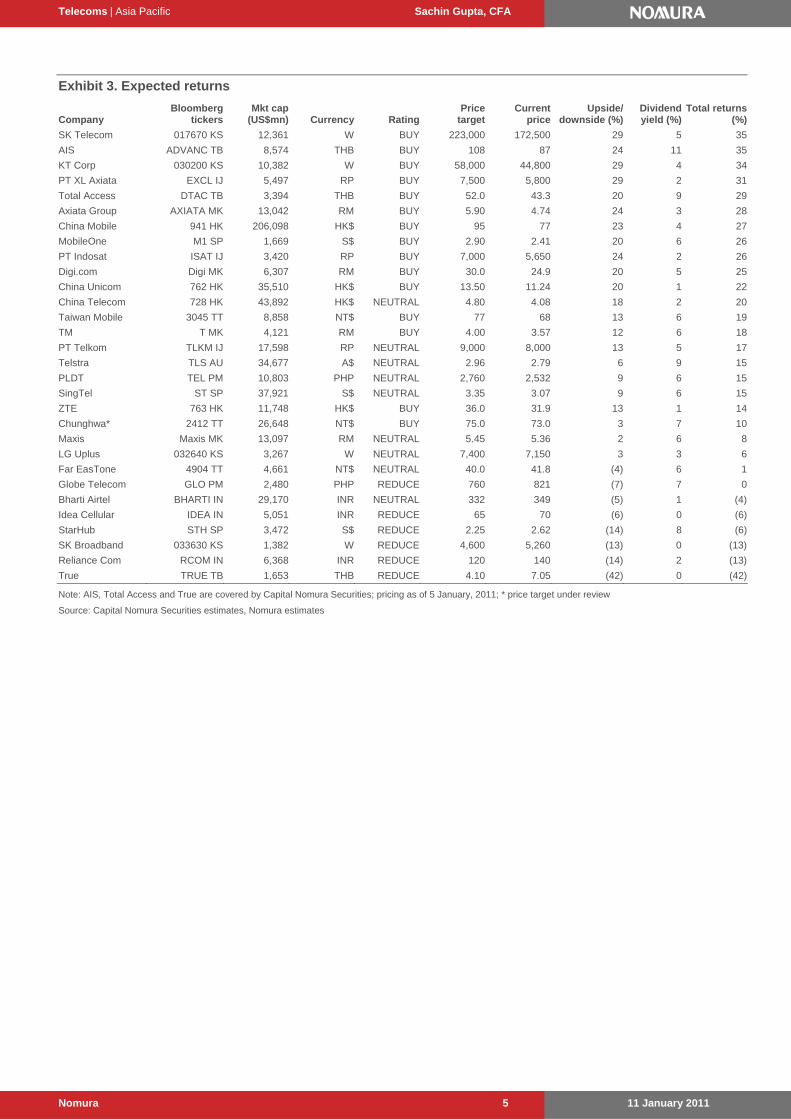
11 January 2011 Nomura NOMURA INTERNATIONAL (HK) LIMITED ANCHOR REPORT Nomura Anchor Reports examine the key themes and value drivers that underpin our sector views and stock recommendations for the next 6 to 12 months. Any authors named on this report are research analysts unless otherwise indicated. See the important disclosures and analyst certifications on pages 69 to 72. Telecoms | ASIA PACIFIC 2011 Outlook Sachin Gupta, CFA +65 6433 6968 [email protected]Will telcos run on 3D? After yet another disappointing year for Asian telcos in 2010, we look through our 3D themes to see if there are reasons to be more excited in 2011. Data growth, Diversification and Dividends should generate some appeal in the sector, but perhaps not enough to see share prices run much above our current average expected return of 9%, plus another 5% in dividend yields. Hence, a NEUTRAL sector view is our call for 2011. Macro industry/market views will remain a bigger driver for telco stocks overall, but operationally, we see relatively more growth and upside in China and Indonesia within the region, also balanced by a stable mix of competitive and regulatory risks. Meanwhile, we turn more cautious on Singapore and the Philippines, downgrading both to Bearish, and PLDT to NEUTRAL. Wider availability of mid-range smartphones (US$150-200) looks like an emerging area, which should accelerate data take-up rates to 25% of revenues in 2011, on our estimates. We believe that ZTE stands to benefit from this theme, along with its expanding network reach – thus, we add it to our key regional picks. Our other key BUYs are Axiata, China Unicom, M1 and SK Telecom. We also add AIS to our key picks given its attractive 11% yield and stable operating trends. Stocks to avoid are Globe, RCOM and StarHub. Looking down the value chain Diversification and dividends Key stock picks and markets NEUTRAL Stocks for action Our key picks reflect a combination of cash and earnings growth. Stock Rating Price Price target AIS (ADVANC TB) BUY 87 108 Axiata (AXIATA MK) BUY 4.74 5.90 China Unicom (762 HK) BUY 11.24 13.50 M1 (M1 SP) BUY 2.41 2.90 SK Telecom (017670 KS) BUY 172,500 223,000 ZTE (763 HK) BUY 31.85 36.00 Pricing as of 5 January, 2011; local currency Analysts Sachin Gupta, CFA +65 6433 6968 [email protected]Danny Chu, CFA Stanley Yang Leping Huang, PhD Piyachat Ratanasuvan (Capital Nomura Securities) B. Roshan Raj Neeraja Natarajan Pankaj Suri Eric Cha
Transcript
11 January 2011 Nomura
N O M U R A I N T E R N A T I O N A L ( H K ) L I M I T E D
AN
CH
OR
R
EP
OR
T
Nomura Anchor Reports examine the key themes and value drivers that underpin our sector views and stock recommendations for the next 6 to 12 months.
Any authors named on this report are research analysts unless otherwise indicated. See the important disclosures and analyst certifications on pages 69 to 72.
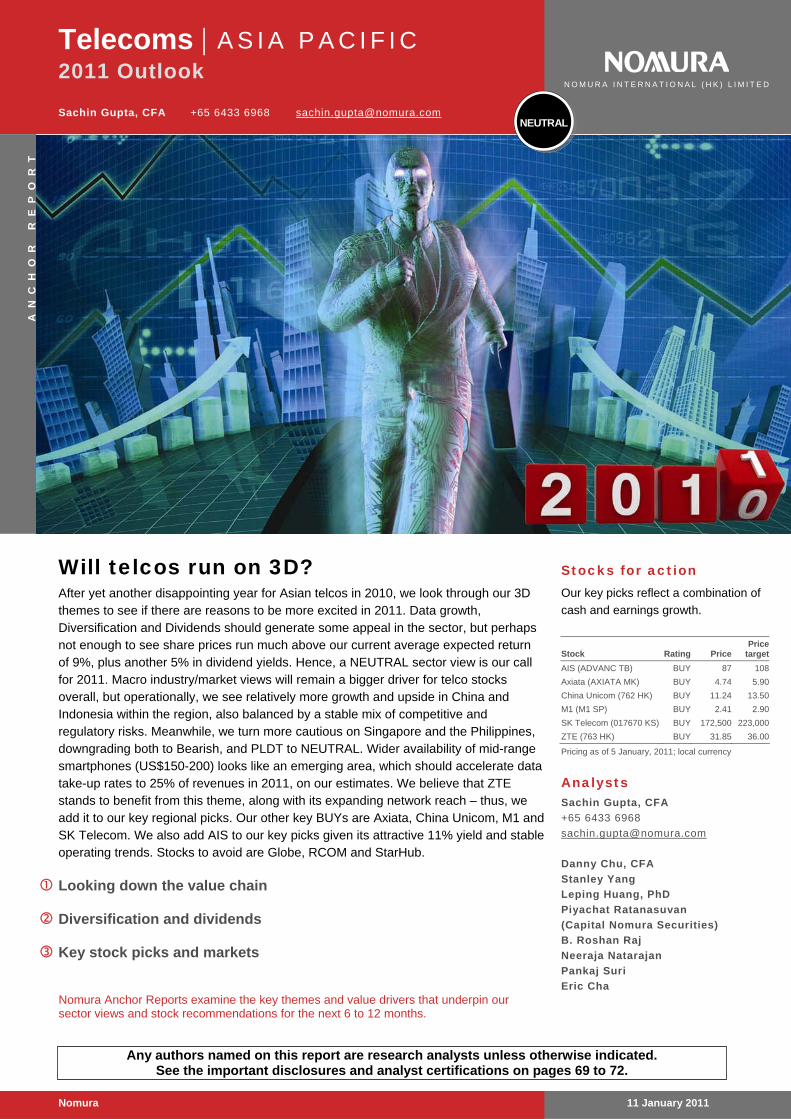
Will telcos run on 3D? After yet another disappointing year for Asian telcos in 2010, we look through our 3D themes to see if there are reasons to be more excited in 2011. Data growth, Diversification and Dividends should generate some appeal in the sector, but perhaps not enough to see share prices run much above our current average expected return of 9%, plus another 5% in dividend yields. Hence, a NEUTRAL sector view is our call for 2011. Macro industry/market views will remain a bigger driver for telco stocks overall, but operationally, we see relatively more growth and upside in China and Indonesia within the region, also balanced by a stable mix of competitive and regulatory risks. Meanwhile, we turn more cautious on Singapore and the Philippines, downgrading both to Bearish, and PLDT to NEUTRAL. Wider availability of mid-range smartphones (US$150-200) looks like an emerging area, which should accelerate data take-up rates to 25% of revenues in 2011, on our estimates. We believe that ZTE stands to benefit from this theme, along with its expanding network reach – thus, we add it to our key regional picks. Our other key BUYs are Axiata, China Unicom, M1 and SK Telecom. We also add AIS to our key picks given its attractive 11% yield and stable operating trends. Stocks to avoid are Globe, RCOM and StarHub.
Looking down the value chain
Diversification and dividends
Key stock picks and markets
NEUTRAL
Stocks for action Our key picks reflect a combination of
Will telcos run on 3D? Looking down the value chain
2010 was another disappointing year for Asia ex-Japan telcos, with the index up by only 8% and underperforming most markets and other sectors. EPS revisions were a negative 5% excluding XL Axiata. Unfortunately, 2011F is unlikely to have many fireworks, as we expect competition, regulations, capex and margin volatility to limit operational surprises and keep a lid on share prices.
So where is the excitement? Smartphones and data will be the buzz words, with entry-level smartphones (sub US$200) likely to be an emerging area in the APAC region considering different affordability levels. This should see data grow to around 25% of total revenues this year (from 17% in 2010). ARPUs could surprise positively, but margins may not. Hence, players down the value-chain stand to gain more than the operators. ZTE should be a beneficiary of handsets, 3G/4G and fixed network expansion.
Diversification and dividends
Moderation in revenue and earnings growth rates to 5% and 9%, respectively, in FY11F are hardly appealing for emerging markets. Hence, we see a rising focus on growth in adjacent industries this year, such as media and health. This may provide revenue surprises, but incremental returns will be questionable. Otherwise, dividends will be a focus; we see our 2011F forecasts for 7% FCF yield over 5% dividend yield providing enough buffer for capital management or even to absorb capex surprises from 3G/4G rollouts.
Key stock picks and markets
China and Indonesia should fare better than others in the region in 2011F, on growth, valuations, competition and regulations, while Singapore and the Philippines could lag. We expect upside ARPU and net-add surprises from Unicom. We still like Axiata’s diversity in cash and earnings, and 67% exposure to XL. Despite our cautious stance on Singapore, we expect M1 to gain further from the NBN rollout. SKT should benefit from rising smartphone penetration in Korea. We add ZTE into our key picks, along with AIS for its strong 11% yield (2011F) and stable operating trends. Stocks to avoid are Globe, RCOM, and StarHub.
Stocks for action Our key picks reflect a combination of cash and earnings growth.
Action In 2011F, data growth, diversification and dividends will be in focus for Asian
telecom operators. But these drivers alone may not bring the sector back into favour, as we believe macros will remain a bigger catalyst. With an expected average share price gain of 9% in 2011F, we stay Neutral. Ongoing competitive and regulatory risks limit the scope for P/E re-rating or positive EPS revisions. We expect bigger positive operational surprises from mid-tier operators and equipment makers. China and Indonesia are our preferred markets, while Singapore and the Philippines are not. Key BUYs are AIS, Axiata, China Unicom, M1, SKT and ZTE.
Catalysts Competition, regulations, capex, dividend surprises and M&A are key catalysts.
Anchor themes
Data growth, revenue diversification and dividends will likely be in focus in 2011F.
N O M U R A I N T E R N A T I O N A L ( H K ) L I M I T E D
Telecoms | Asia Pacific Sachin Gupta, CFA
11 January 2011 Nomura 2
Contents
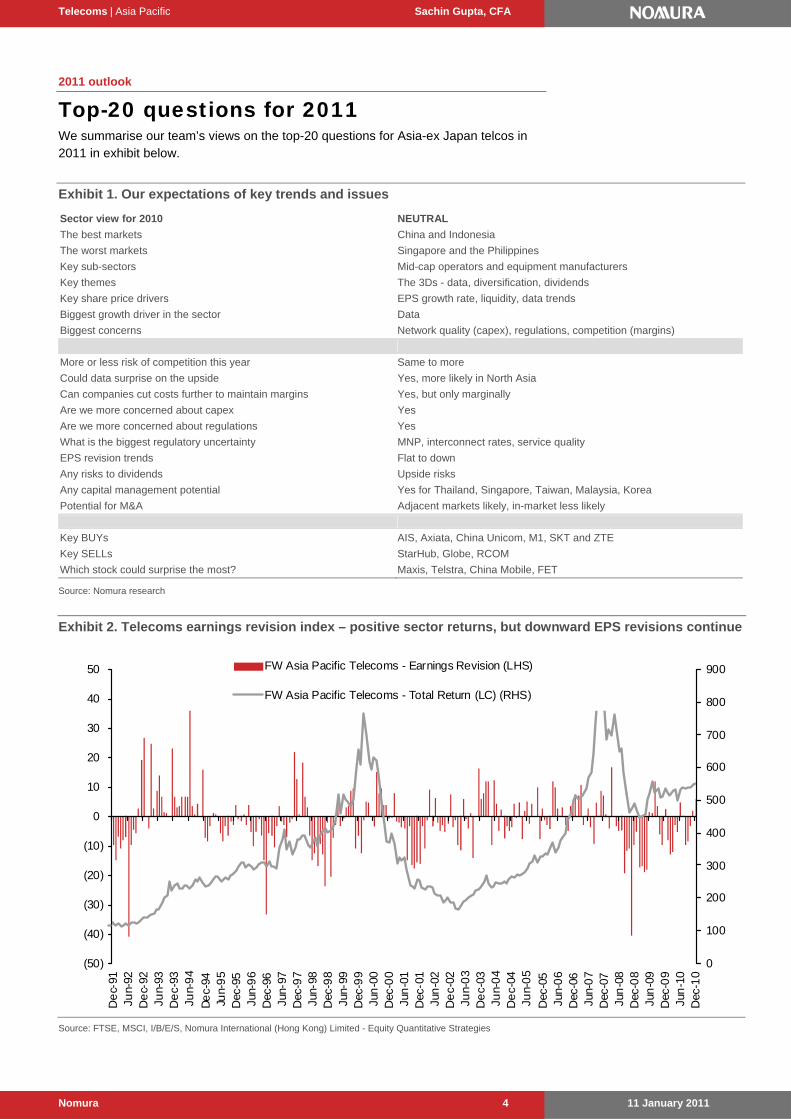
Top-20 questions for 2011 4
2011 – watch for the 3D effect? 6 2011F won’t be stellar either; key drivers and issues 6
Key stock picks 8
Key rating and earnings changes 10
Three key themes for 2011 12 Data – have to have or nice to have? 12 Revenue diversification 20 Dividends and capital management 23
Reviewing 2010 versus expectations 24 What key trends we expected from 2010 and what did we see? 26
Country-specific trends in 2011F 31 China: Variety and affordability of smart-phones to continue to improve 31 Equipment: more excitement down the value chain 32 India: some improvement, but still not exciting 33 Korea: return profile of data growth strategies is the key 34 Indonesia: growth appeal remains intact 34 Taiwan: stable is what we want today 35 Thailand: Focus on dividend yield rather than profits 36 Malaysia: Yield appeal expected to continue 37 Singapore: rising competitive pressures 38 Australia: getting close to NBN 39 Philippines: a year in transition? 39
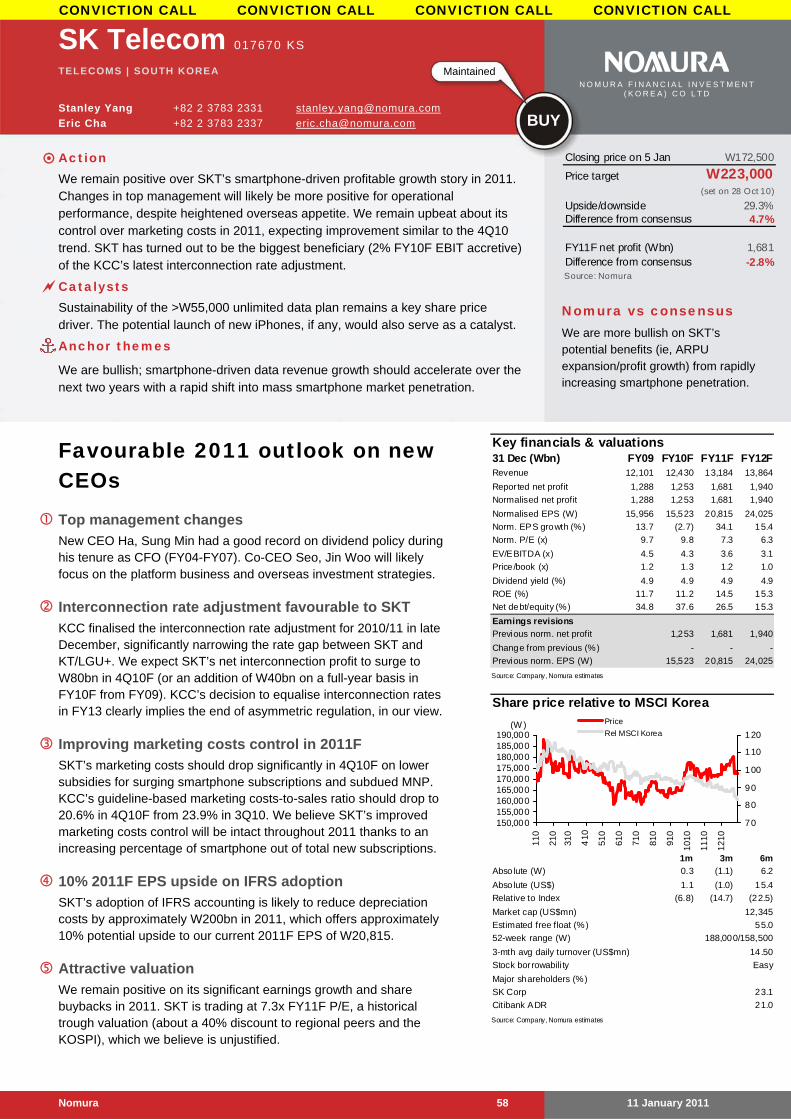
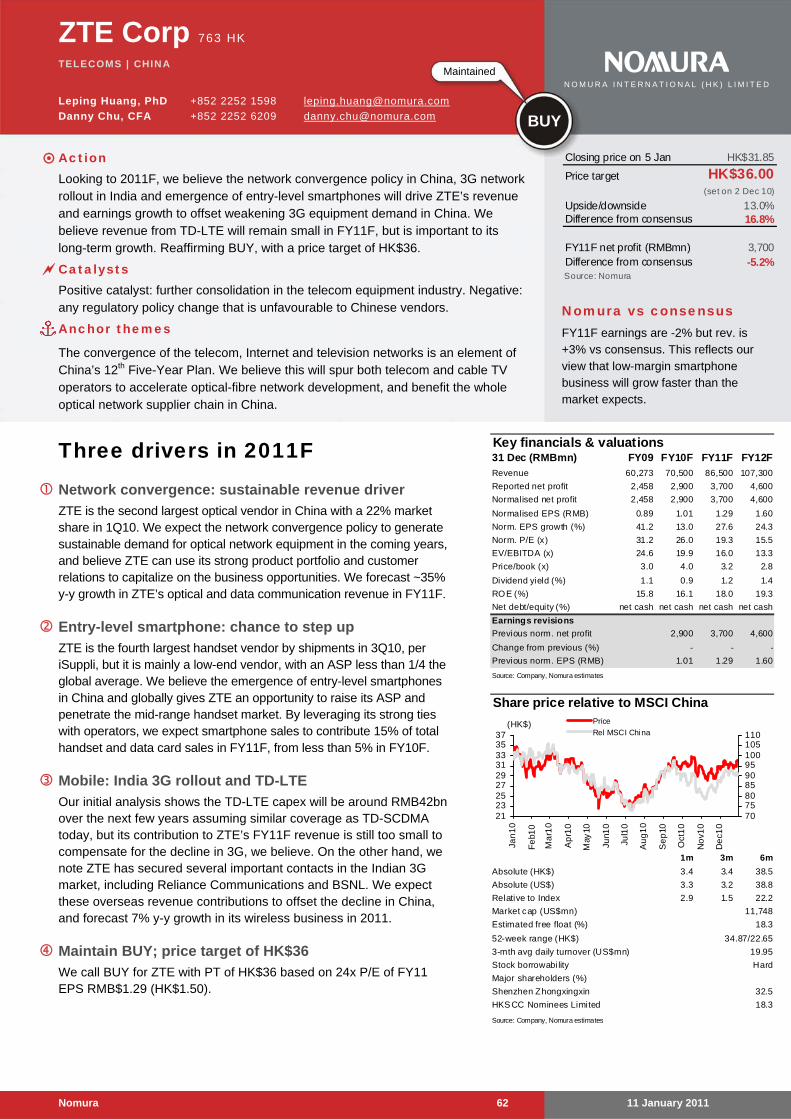
Key stock picks 41 Axiata: Appealing growth with emerging yield profile 41 China Unicom: ‘i’- factor to deliver an edge 41 M1: ‘Fixed’ NBN to provide operational flexibility 41 SK Telecom: maintaining momentum with Smartphones 41 AIS: Massive cash pile 41 ZTE: opportunities from convergence, smartphones and 3G/ 4G 42
Appendix: EBITDA margin trends 43
Valuation methodology and risks 45
Telecoms | Asia Pacific Sachin Gupta, CFA
11 January 2011 Nomura 3
Latest company views Axiata 47
China Unicom 51
M1 55
SKT 58
ZTE 62
Countries Singapore 66
Philippines 68
For more on the underlying Anchor themes, see ZTE — Three drivers in 2011F (2 December, 2010)
Also see our Anchor Report: 4G – little excitement for big potential (7 December, 2010)
Note: AIS, Total Access and True are covered by Capital Nomura Securities; pricing as of 5 January, 2011; * price target under review
Source: Capital Nomura Securities estimates, Nomura estimates
Telecoms | Asia Pacific Sachin Gupta, CFA
11 January 2011 Nomura 6
3Ds in 2011
2011 – watch for the 3D effect? 2010 was another disappointing year for Asia ex-Japan telcos. The NJA index was up 8%, and the average price increase for telcos was 7%, excluding XL, SmarTone and True (all up >100%), or 20% including these. This compared to our expected average return of 14% for 2010. Asian telcos were the second-worst performing sector in the region and most of the large cap names underperformed local markets, except for the Chinese. Key reasons for underperformance appear to be ongoing competition and regulatory concerns, as well as rising data growth (and subsidies) which compressed margins and consistently led to negative EPS revisions.
Exhibit 2 highlights the consensus earnings revision ratio and total return trends for Asian telcos since 1999. The earnings revision ratio is computed as the number of stock upgrades divided by the number of downgrades; that is, a ratio of >1 implies more upgrades than downgrades. As in 2009, this ratio remained negative in most months in 2010, and average EPS revisions were negative 5%, excluding XL.
2011F won’t be stellar either; key drivers and issues In our opinion, 2011F is not likely to be a stellar year too. We expect an average share increase of 9% and average dividend yield of 5% for 2011F and, hence we maintain a NEUTRAL view on the sector.
The three key themes to focus on:
Data growth and its impact on profitability – every market will have distinct challenges;
Revenue diversification from carriage to non-carriage businesses – we think telcos in Korea and Singapore could lead the way; and
Dividends – 7% FCF yields versus 5% dividend yields suggest some capital management upside, but we also need to watch for capex risks more this year.
The fundamental issues and concerns are still looming: 1) we expect average revenue and earnings growth to moderate to 5% and 9%, respectively, in 2011F; 2) the data outlook is strong, in our opinion, but voice still constitutes around 80% of total revenue and voice to data inflexion is still a few years away; 3) cost reduction is an ongoing focus but around 60% of costs in the sector are fixed and these can’t be reduced much without impacting the operating leverage; 4) the cash outlook is solid, in our view, but excess returns over the average 5% yield have been rare; 5) although capex surprises have been limited, we think the risk remains to the upside with impending 3G/4G launches and FTTx rollouts; and 6) regulations remains a key overhang.
In 2010, NJA Telcos underperformed with 8% returns, driven by negative EPS revisions
Telecoms | Asia Pacific Sachin Gupta, CFA
11 January 2011 Nomura 7
Exhibit 4. Asia ex-Japan sector performances (2010)
0
8
16
24
32
Util
ities
Tel
coS
ervi
ces
Fin
anci
als
Info
Tec
h
Con
sum
erS
tapl
es
Ene
rgy
Mat
eria
ls
Hea
lth C
are
Indu
stria
ls
Con
sum
erD
iscr
etio
nary
(%)
Source: Company data, Nomura estimates
Exhibit 5. Relative performances to local markets (2010)
SingTel 12.9 7.1 5.5 5.9 3.1 4.6 0.57 x √ √√ √ x √
NE
UT
RA
L
Telstra 9.8 4.7 9.3 11.8 (1.2) (6.4) (2.19) √ √ √√ xx x √
Globe Telecom 12.1 4.7 7.3 5.9 2.0 0.9 (0.54) √ x √ √ xx √
Idea Cellular 24.3 8.1 0.0 (2.2) 15.7 20.2 0.97 xx xx x x xx x
Reliance Com 16.2 7.5 1.6 2.4 9.3 14.8 1.66 xx x x x xx x
SK Broadband 37.5 5.0 0.0 2.8 6.2 26.6 4.05 xx xx x √ x √
StarHub 16.3 8.1 7.6 6.5 3.9 5.3 0.38 xx x x √ x √RE
DU
CE
True n/m 6.0 0.0 3.0 2.8 1.9 (0.27) x xx xx x x √
Source: Bloomberg, Nomura research; Note: AIS, Total Access and True are covered by Capital Nomura Securities
Telecoms | Asia Pacific Sachin Gupta, CFA
11 January 2011 Nomura 8
Stock picks
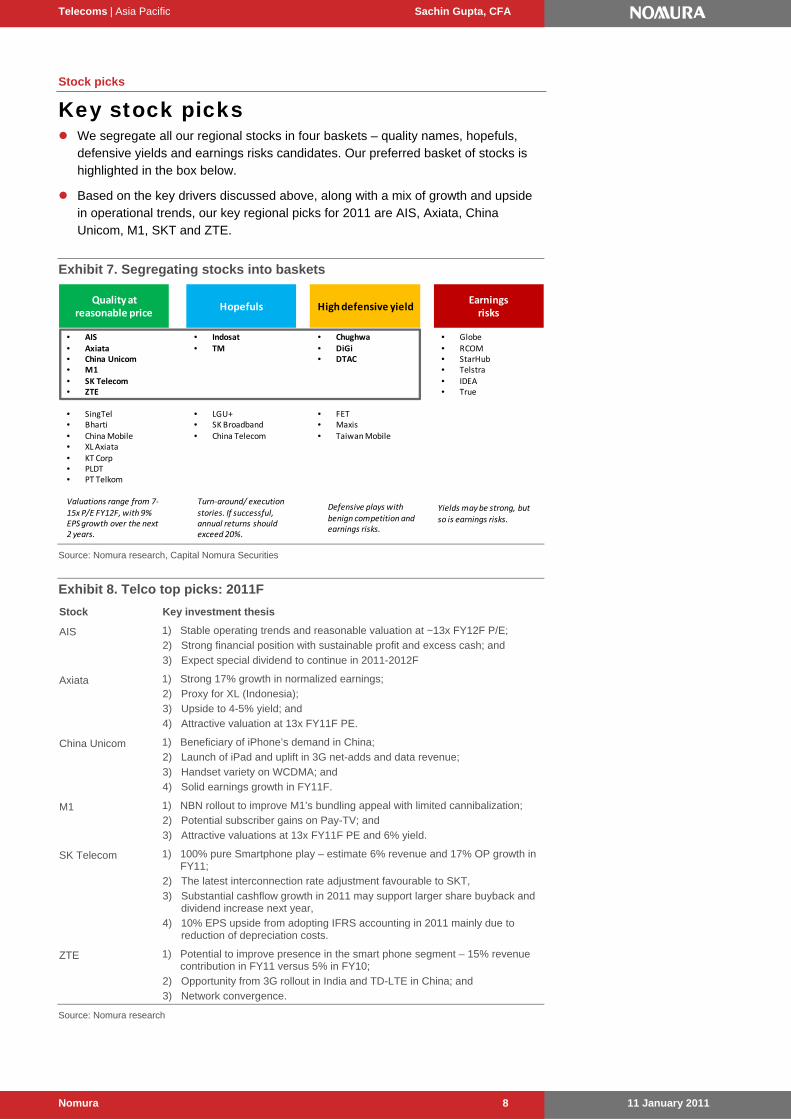
Key stock picks We segregate all our regional stocks in four baskets – quality names, hopefuls,
defensive yields and earnings risks candidates. Our preferred basket of stocks is highlighted in the box below.
Based on the key drivers discussed above, along with a mix of growth and upside in operational trends, our key regional picks for 2011 are AIS, Axiata, China Unicom, M1, SKT and ZTE.
15x P/E FY12F, with 9% EPS growth over the next 2 years.
Turn‐around/ execution
stories. If successful, annual returns should exceed 20%.
Defensive plays with benign competition and earnings risks.
Quality at reasonable price
Hopefuls High defensive yield
• Globe• RCOM• StarHub• Telstra• IDEA• True
Yields may be strong, but so is earnings risks.
Earningsrisks
Source: Nomura research, Capital Nomura Securities
Exhibit 8. Telco top picks: 2011F
Stock Key investment thesis
AIS 1) Stable operating trends and reasonable valuation at ~13x FY12F P/E;
2) Strong financial position with sustainable profit and excess cash; and
3) Expect special dividend to continue in 2011-2012F
Axiata 1) Strong 17% growth in normalized earnings;
2) Proxy for XL (Indonesia);
3) Upside to 4-5% yield; and
4) Attractive valuation at 13x FY11F PE.
China Unicom 1) Beneficiary of iPhone’s demand in China;
2) Launch of iPad and uplift in 3G net-adds and data revenue;
3) Handset variety on WCDMA; and
4) Solid earnings growth in FY11F.
M1 1) NBN rollout to improve M1’s bundling appeal with limited cannibalization;
2) Potential subscriber gains on Pay-TV; and
3) Attractive valuations at 13x FY11F PE and 6% yield.
SK Telecom 1) 100% pure Smartphone play – estimate 6% revenue and 17% OP growth in FY11;
2) The latest interconnection rate adjustment favourable to SKT,
3) Substantial cashflow growth in 2011 may support larger share buyback and dividend increase next year,
4) 10% EPS upside from adopting IFRS accounting in 2011 mainly due to reduction of depreciation costs.
ZTE 1) Potential to improve presence in the smart phone segment – 15% revenue contribution in FY11 versus 5% in FY10;
2) Opportunity from 3G rollout in India and TD-LTE in China; and
3) Network convergence. Source: Nomura research
Telecoms | Asia Pacific Sachin Gupta, CFA
11 January 2011 Nomura 9
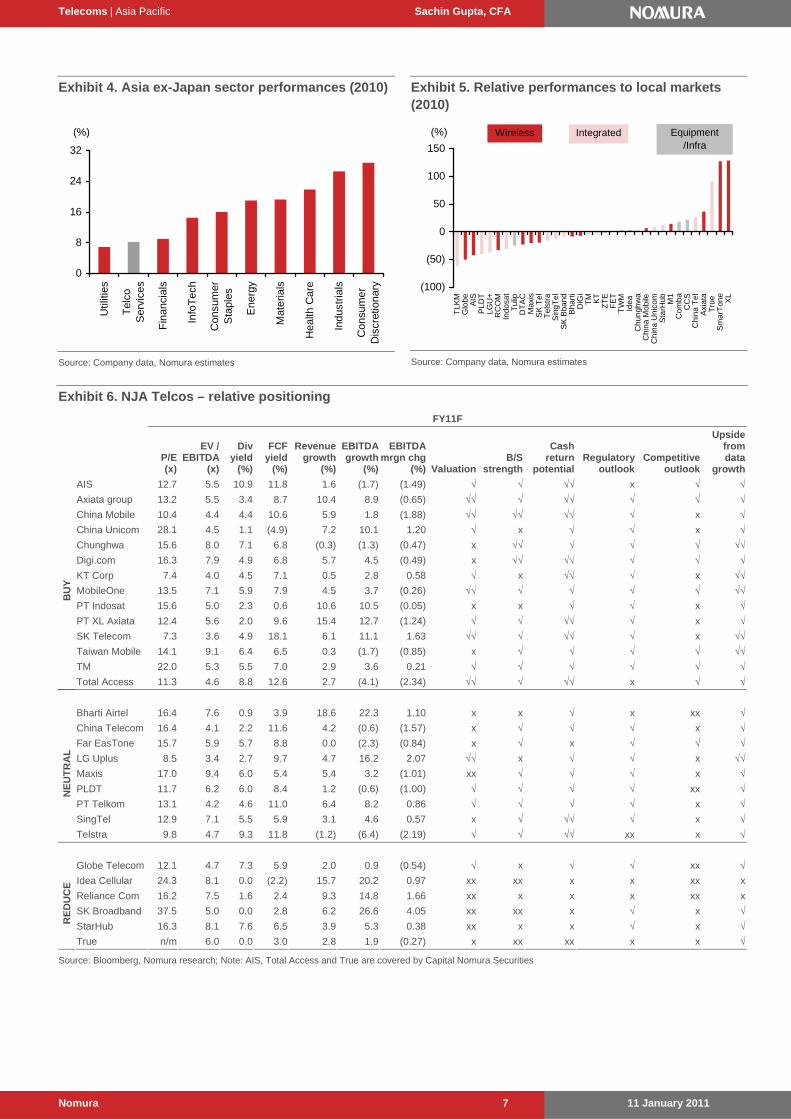
Our preferred markets are China and Indonesia, while Singapore and the Philippines as our least preferred.
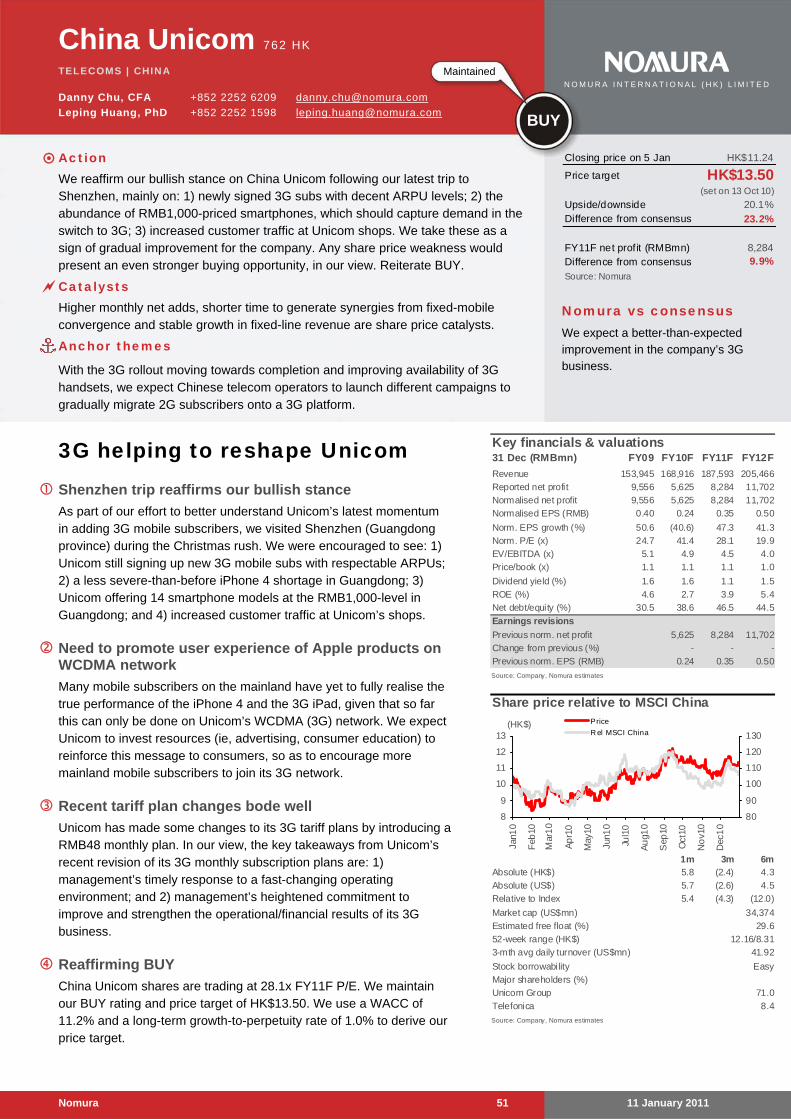
In China, when compared to 2010, we expect the variety of smartphones to increase in 2011F. At the same time, due to improved economies of scale, we expect ASP of smartphones to decline further. This should lower switching costs for the mass market segment of 2G subscribers and drive up volume of 2G mobile subscribers migrating to the 3G mobile platform. China Unicom is our key BUY, and we also maintain BUY on China Mobile and NEUTRAL on China Telecom.
In Indonesia, we expect competition to be relatively benign (in a regional context) during the year and also be a beneficiary of strong data and voice growth (in Java and other islands). There are some near-term concerns about increasing promotional packages, led by the incumbent Telkomsel, but we don't expect full fledged price wars. See our recent note, Incumbent leading the charge on promotions, dated 5 January for more details. We maintain BUY on Indosat and XL, and NEUTRAL on Telkom.
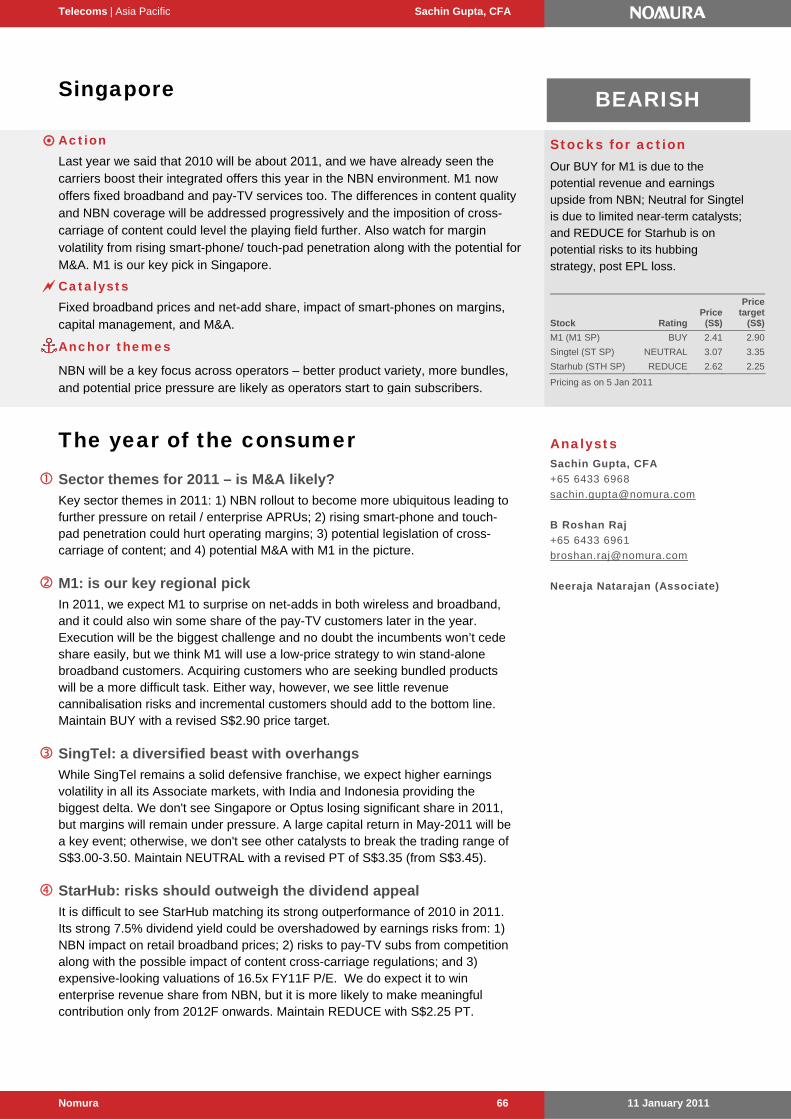
We expect much more open competition in Singapore this year, as NBN moves in the mass market (retail and enterprise) and content cross-carriage regulation kicks in. We maintain NEUTRAL on SingTel, REDUCE on StarHub and BUY on M1.
Similarly in the Philippines, we expect more aggressive promotions and price-cuts, which coupled with VOIP substitution, could erode margins for all carriers. We downgrade PLDT to NEUTRAL and maintain REDUCE on Globe.
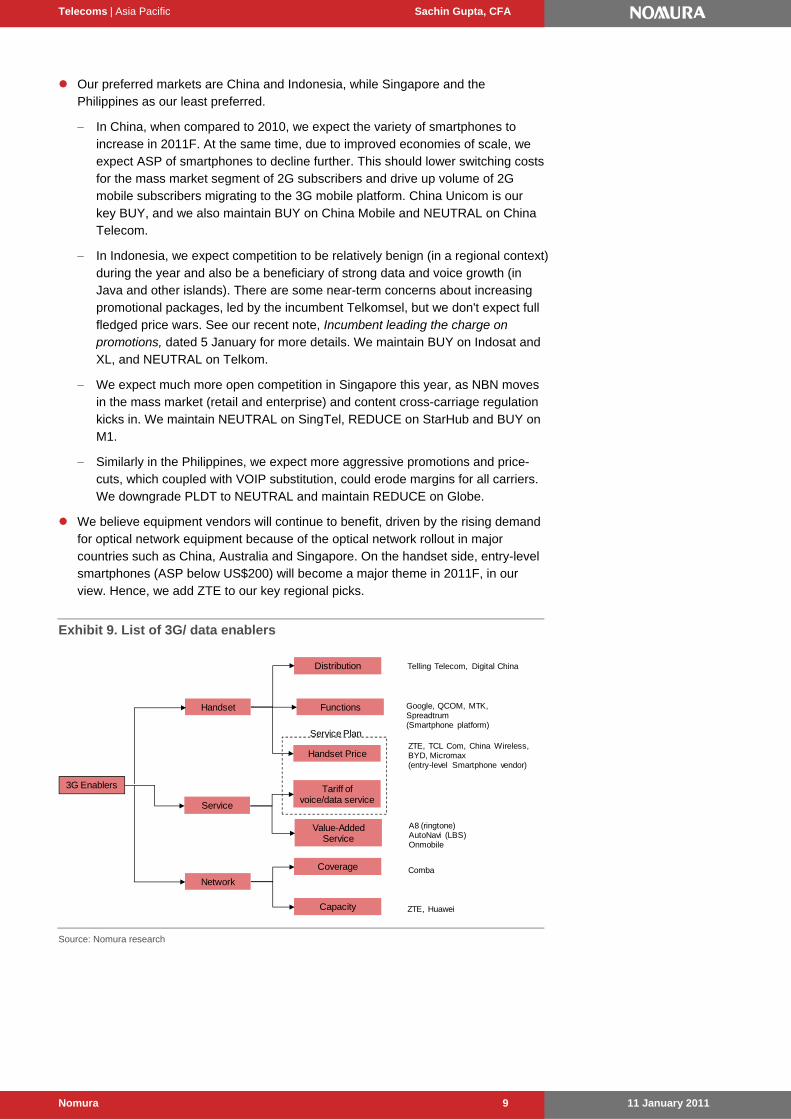
We believe equipment vendors will continue to benefit, driven by the rising demand for optical network equipment because of the optical network rollout in major countries such as China, Australia and Singapore. On the handset side, entry-level smartphones (ASP below US$200) will become a major theme in 2011F, in our view. Hence, we add ZTE to our key regional picks.
ZTE, TCL Com, China Wireless, BYD, Micromax(entry-level Smartphone vendor)
Comba
ZTE, Huawei
A8 (ringtone)AutoNavi (LBS)Onmobile
Source: Nomura research
Telecoms | Asia Pacific Sachin Gupta, CFA
11 January 2011 Nomura 10
Revisions
Key rating and earnings changes We add AIS to our key regional picks following an upgrade to BUY, with a price
target of THB108. See 4Q10F NP to drop q-q due to seasonal factors, published on 10 January, 2011 for more details.
We add ZTE to our key regional picks with a price target of HK$36.
We downgrade Singapore to Bearish, but maintain our BUY rating on M1 with a revised S$2.90 price target. We maintain NEUTRAL on SingTel, but reduce our price target to S$3.35 (see Singapore heating up, published 11 January, 2011, for more details). We maintain REDUCE on StarHub with a downward bias to earnings and our price target.
We downgrade the Philippines market to Bearish, and cut PLDT to NEUTRAL with a revised price target of PHP2,760. See Rising headwinds, 11 January, 2011 for more details. We maintain REDUCE on Globe.
We cut RCOM earnings by 16-40% and maintain REDUCE with INR120 price target. See our report Under scrutiny still, published 11 January, 2011 for details.
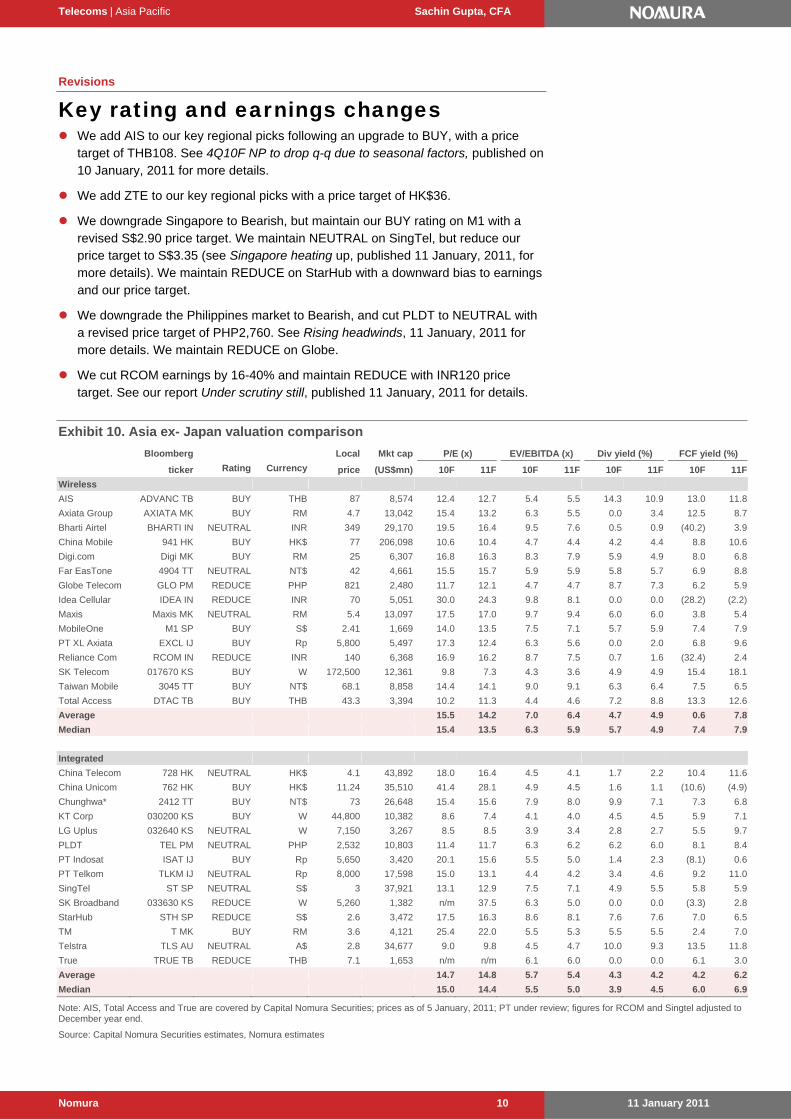
Exhibit 10. Asia ex- Japan valuation comparison
Bloomberg Local Mkt cap P/E (x) EV/EBITDA (x) Div yield (%) FCF yield (%)
Note: AIS, Total Access and True are covered by Capital Nomura Securities; prices as of 5 January, 2011; PT under review; figures for RCOM and Singtel adjusted to December year end.
Source: Capital Nomura Securities estimates, Nomura estimates
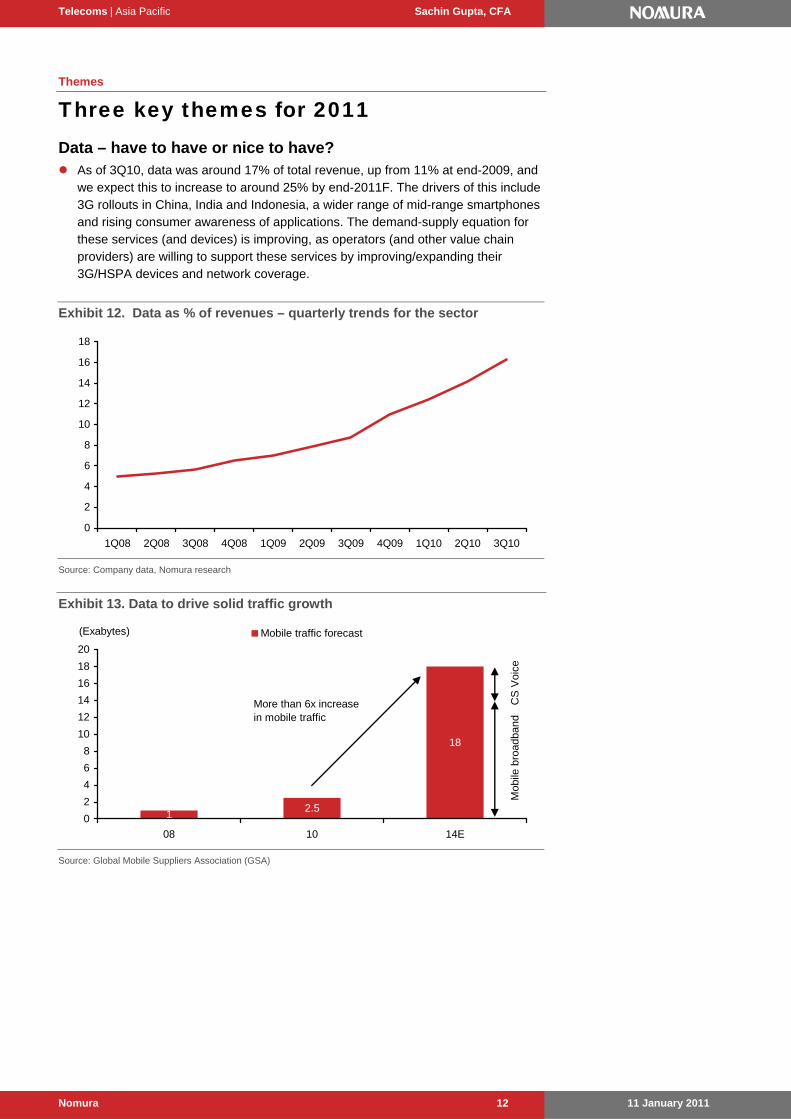
Three key themes for 2011 Data – have to have or nice to have? As of 3Q10, data was around 17% of total revenue, up from 11% at end-2009, and
we expect this to increase to around 25% by end-2011F. The drivers of this include 3G rollouts in China, India and Indonesia, a wider range of mid-range smartphones and rising consumer awareness of applications. The demand-supply equation for these services (and devices) is improving, as operators (and other value chain providers) are willing to support these services by improving/expanding their 3G/HSPA devices and network coverage.
Exhibit 12. Data as % of revenues – quarterly trends for the sector
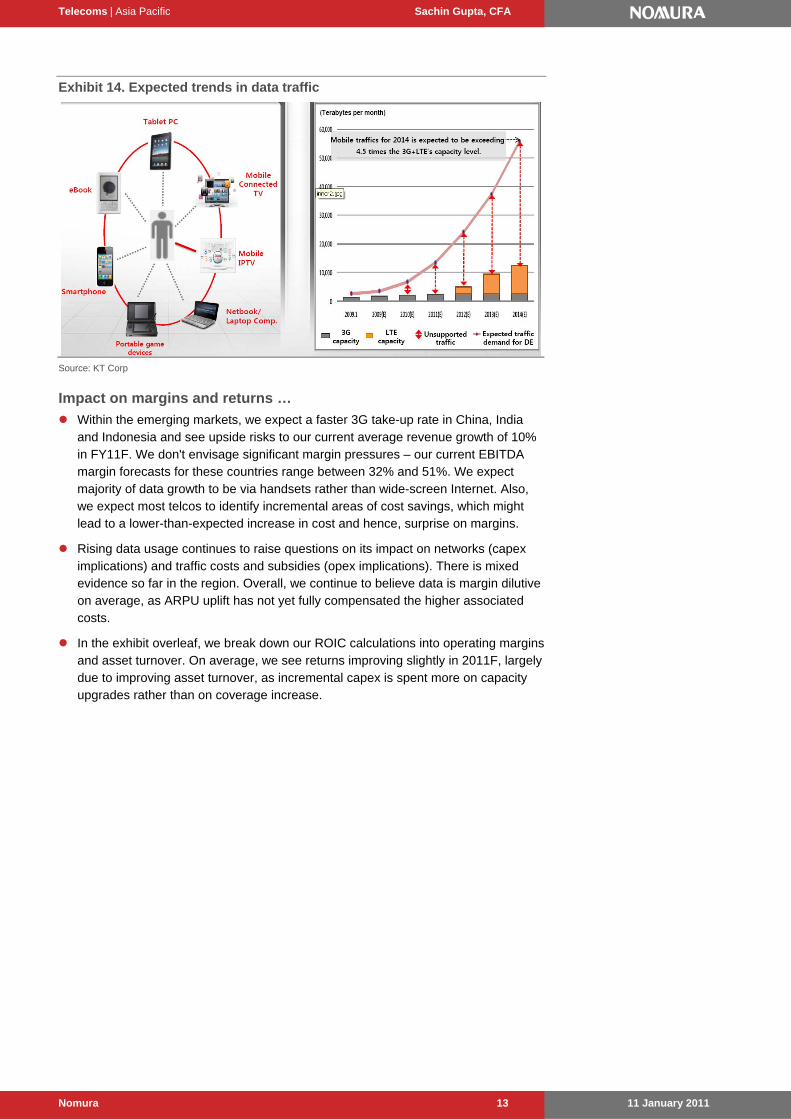
Within the emerging markets, we expect a faster 3G take-up rate in China, India and Indonesia and see upside risks to our current average revenue growth of 10% in FY11F. We don't envisage significant margin pressures – our current EBITDA margin forecasts for these countries range between 32% and 51%. We expect majority of data growth to be via handsets rather than wide-screen Internet. Also, we expect most telcos to identify incremental areas of cost savings, which might lead to a lower-than-expected increase in cost and hence, surprise on margins.
Rising data usage continues to raise questions on its impact on networks (capex implications) and traffic costs and subsidies (opex implications). There is mixed evidence so far in the region. Overall, we continue to believe data is margin dilutive on average, as ARPU uplift has not yet fully compensated the higher associated costs.
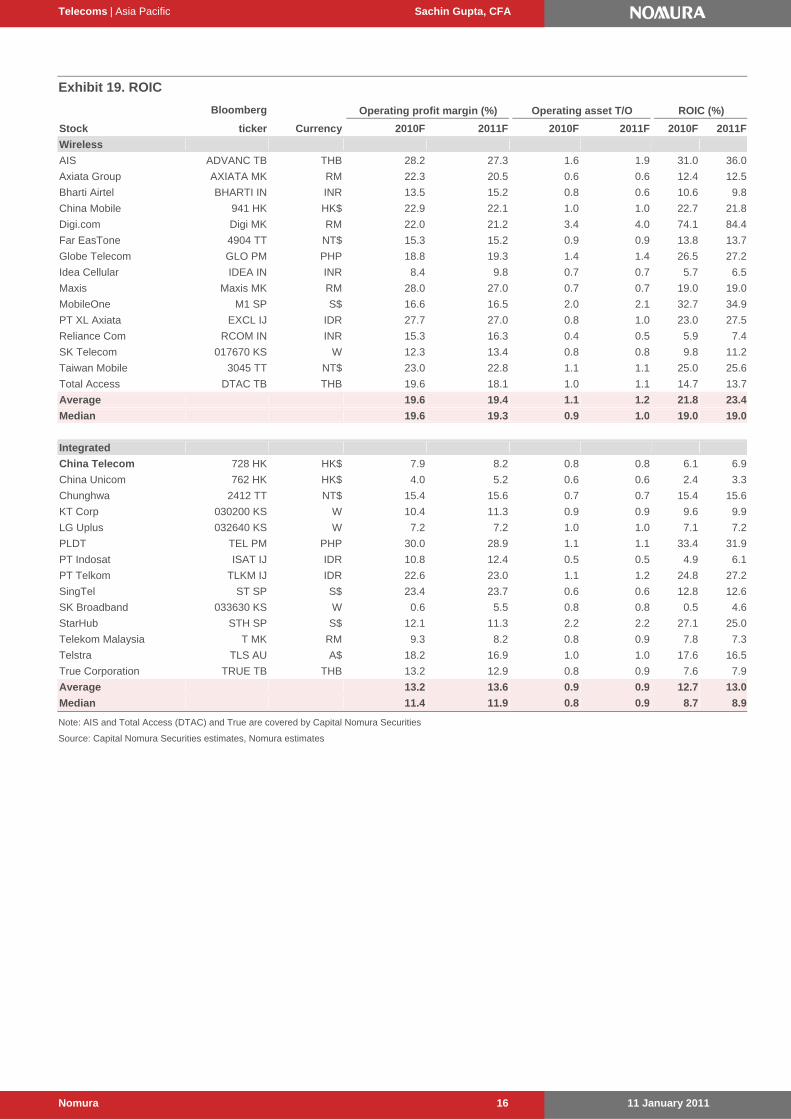
In the exhibit overleaf, we break down our ROIC calculations into operating margins and asset turnover. On average, we see returns improving slightly in 2011F, largely due to improving asset turnover, as incremental capex is spent more on capacity upgrades rather than on coverage increase.
Telecoms | Asia Pacific Sachin Gupta, CFA
11 January 2011 Nomura 14
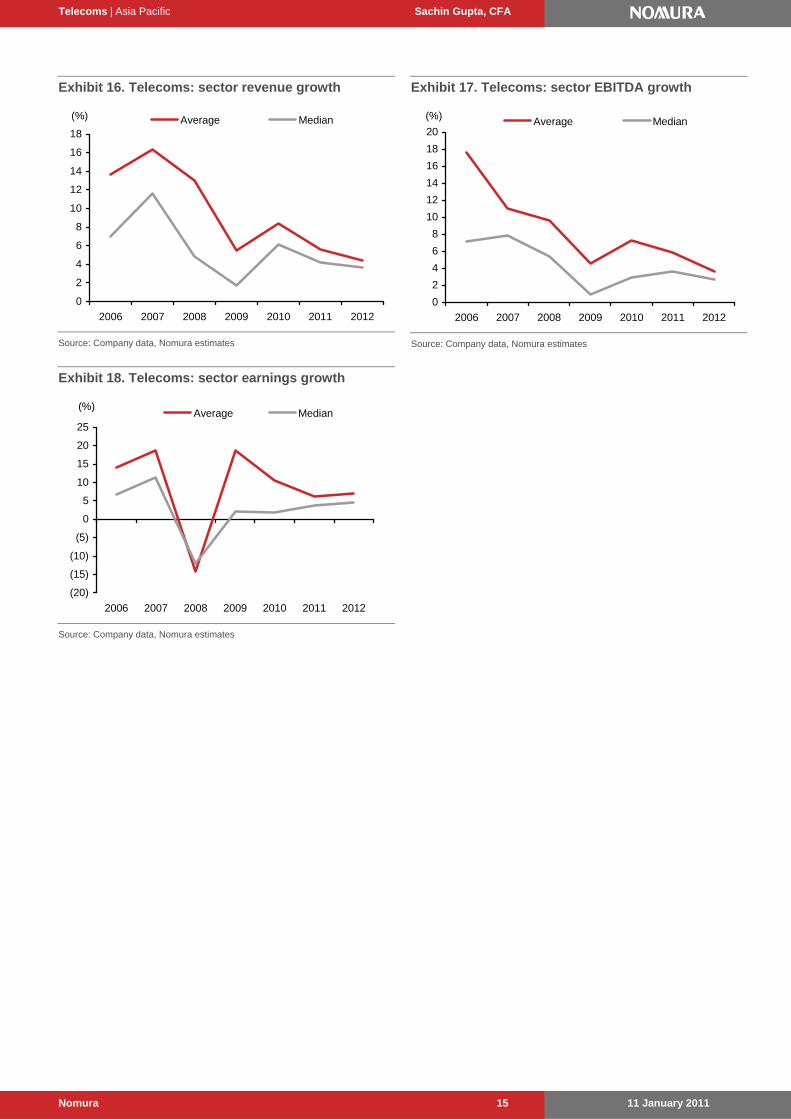
Exhibit 15. China, Indonesia and India telcos – revenue, EBITDA, EBITDA margins trends
Revenue
Unit 2006 2007 2008 2009 2010F 2011F 2012F
China Mobile RMBmn 295,358 356,959 412,343 461,651 497,865 527,303 554,348
% chg y-y % 21 16 12 8 6 5
China Telecom RMBmn 170,122 175,362 184,779 216,796 230,273 240,048 247,687
% chg y-y % 3 5 17 6 4 3
China Unicom RMBmn 94,294 99,539 148,906 157,600 169,195 181,294 194,677
DTAC* 11.4 13.8 14.8 16.1 11.9 11.8 12.6 12.8 12.8 13.3 14.4 Note: AIS, Total Access and True are covered by Capital Nomura Securities. * Change in definition from 1Q09
Source: Capital Nomura Securities estimates, Nomura estimates
Mid range smart-phones a key driver
Our tech team forecasts smartphones to grow 69% in FY10F, and 42% in FY11F to 415mn, with a total 23% penetration rate. With this, they expect the Android market share to rise from 21% in FY10F to 28% in FY11F, while that of Apple to increase from 16% in FY10F to 18% in FY11F. A number of operators continue to look for ways to diversify away from iPhones, where they appear to have much less bargaining power.
Given different affordability levels in Asia comparing with the US and Europe, we believe sub US$200 smartphones will be the key driver for smartphone growth in APAC region. We expect to see growth first in China in 2011F, and then in India in 2012F after completion of the 3G network rollout.
ZTE is likely to expand in the low-end smart-phone market dominated by Nokia, as it recently launched compelling low-end Android phones.
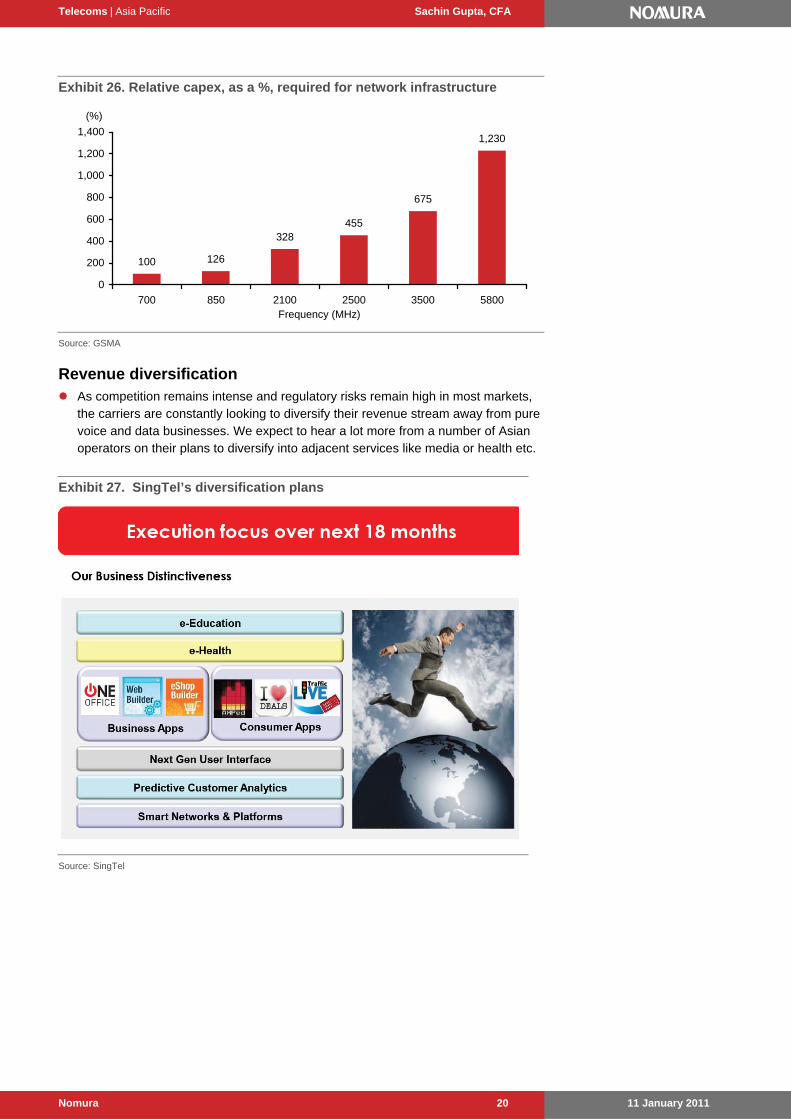
We did not see too many capex surprises in 2010 – with an average capex to sales of 21%; however, we think it is entering a period where carriers will need to review their LTE/4G rollout plans, which could see some capex allocations, or in anticipation of the rollout, they may look to further upgrade their backhaul and transmission assets before access issues are addressed. There are many variables to consider for LTE/4G capex, including: 1) spectrum availability and harmonisation; 2) location and density of cell-sites; 3) deployment frequencies; 4) device/ terminal availability; and 5) backhaul capacity. Data for all these isn’t readily available (or not always consistent). A rollout in the 2.6GHz could be three times more expensive than the 700MHz, but it also depends on the quality of the existing networks, along with backhaul requirements.
Telecoms | Asia Pacific Sachin Gupta, CFA
11 January 2011 Nomura 19
Based on preliminary numbers from the US, Japan, Scandinavia, Korea and China, we estimate at US$100k per BTS, total spend will be US$18bn, or 22% of our cumulative capex over the next three years for Asia ex-Japan telcos, also excluding India, Indonesia and Thailand, where even 2G/3G will be the main focus in the near term. China Mobile’s trials in six cities have a projected capex of RMB1.5bn (US$225mn) for 3,000 base stations, which is around US$75k per BTS. We understand this will be funded by parentco. Again, there will be specific company and country differences for each rollout, including the possibility of spectrum auctions. It is likely that capex will be re-allocated between 2G and 3G to LTE, and we have not made any changes to our forecasts at this stage – but will continue to monitor these developments closely. See our recently published report on 4G/LTE for more details.
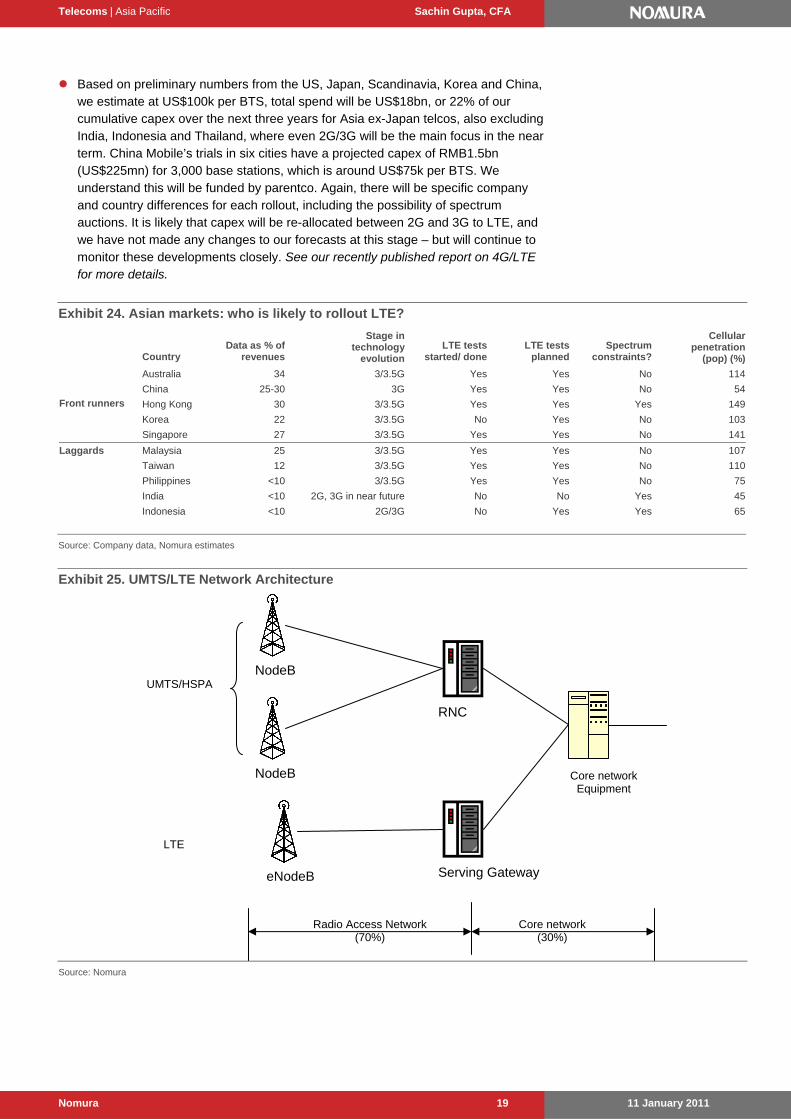
Exhibit 24. Asian markets: who is likely to rollout LTE?
Country
Data as % of revenues
Stage in technology
evolutionLTE tests
started/ done LTE tests
planned Spectrum
constraints?
Cellular penetration
(pop) (%)
Australia 34 3/3.5G Yes Yes No 114
China 25-30 3G Yes Yes No 54
Hong Kong 30 3/3.5G Yes Yes Yes 149
Korea 22 3/3.5G No Yes No 103
Front runners
Singapore 27 3/3.5G Yes Yes No 141
Malaysia 25 3/3.5G Yes Yes No 107
Taiwan 12 3/3.5G Yes Yes No 110
Philippines <10 3/3.5G Yes Yes No 75
India <10 2G, 3G in near future No No Yes 45
Laggards
Indonesia <10 2G/3G No Yes Yes 65
Source: Company data, Nomura estimates
Exhibit 25. UMTS/LTE Network Architecture
Source: Nomura
NodeB
NodeB
RNC
Serving Gateway eNodeB
Core network (30%)
Radio Access Network (70%)
Core network Equipment
UMTS/HSPA
LTE
Telecoms | Asia Pacific Sachin Gupta, CFA
11 January 2011 Nomura 20
Exhibit 26. Relative capex, as a %, required for network infrastructure
100 126
328455
675
1,230
0
200
400
600
800
1,000
1,200
1,400
700 850 2100 2500 3500 5800Frequency (MHz)
(%)
Source: GSMA
Revenue diversification As competition remains intense and regulatory risks remain high in most markets,
the carriers are constantly looking to diversify their revenue stream away from pure voice and data businesses. We expect to hear a lot more from a number of Asian operators on their plans to diversify into adjacent services like media or health etc.
Exhibit 27. SingTel’s diversification plans
Source: SingTel
Telecoms | Asia Pacific Sachin Gupta, CFA
11 January 2011 Nomura 21
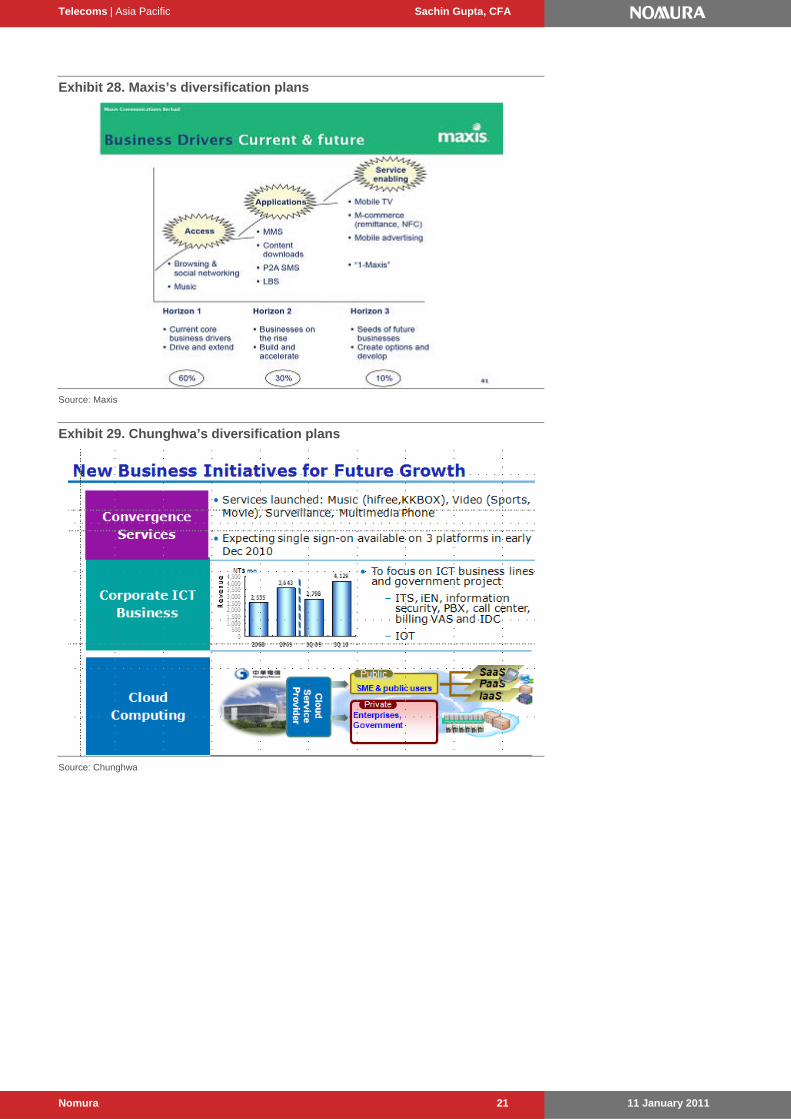
Exhibit 28. Maxis’s diversification plans
Source: Maxis
Exhibit 29. Chunghwa’s diversification plans
Source: Chunghwa
Telecoms | Asia Pacific Sachin Gupta, CFA
11 January 2011 Nomura 22
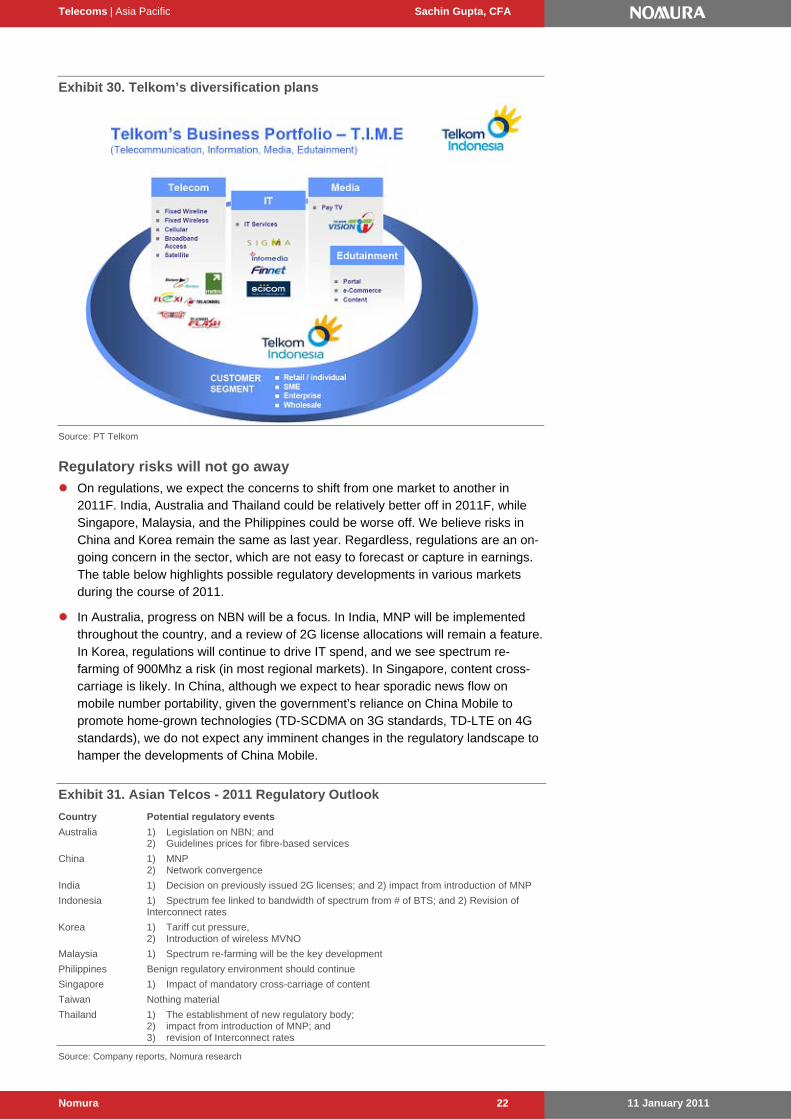
Exhibit 30. Telkom’s diversification plans
Source: PT Telkom
Regulatory risks will not go away
On regulations, we expect the concerns to shift from one market to another in 2011F. India, Australia and Thailand could be relatively better off in 2011F, while Singapore, Malaysia, and the Philippines could be worse off. We believe risks in China and Korea remain the same as last year. Regardless, regulations are an on-going concern in the sector, which are not easy to forecast or capture in earnings. The table below highlights possible regulatory developments in various markets during the course of 2011.
In Australia, progress on NBN will be a focus. In India, MNP will be implemented throughout the country, and a review of 2G license allocations will remain a feature. In Korea, regulations will continue to drive IT spend, and we see spectrum re-farming of 900Mhz a risk (in most regional markets). In Singapore, content cross-carriage is likely. In China, although we expect to hear sporadic news flow on mobile number portability, given the government’s reliance on China Mobile to promote home-grown technologies (TD-SCDMA on 3G standards, TD-LTE on 4G standards), we do not expect any imminent changes in the regulatory landscape to hamper the developments of China Mobile.
Exhibit 31. Asian Telcos - 2011 Regulatory Outlook
Country Potential regulatory events
Australia 1) Legislation on NBN; and 2) Guidelines prices for fibre-based services
China 1) MNP 2) Network convergence
India 1) Decision on previously issued 2G licenses; and 2) impact from introduction of MNP
Indonesia 1) Spectrum fee linked to bandwidth of spectrum from # of BTS; and 2) Revision of Interconnect rates
Korea 1) Tariff cut pressure, 2) Introduction of wireless MVNO
Malaysia 1) Spectrum re-farming will be the key development
Philippines Benign regulatory environment should continue
Singapore 1) Impact of mandatory cross-carriage of content
Taiwan Nothing material
Thailand 1) The establishment of new regulatory body; 2) impact from introduction of MNP; and 3) revision of Interconnect rates
Source: Company reports, Nomura research
Telecoms | Asia Pacific Sachin Gupta, CFA
11 January 2011 Nomura 23
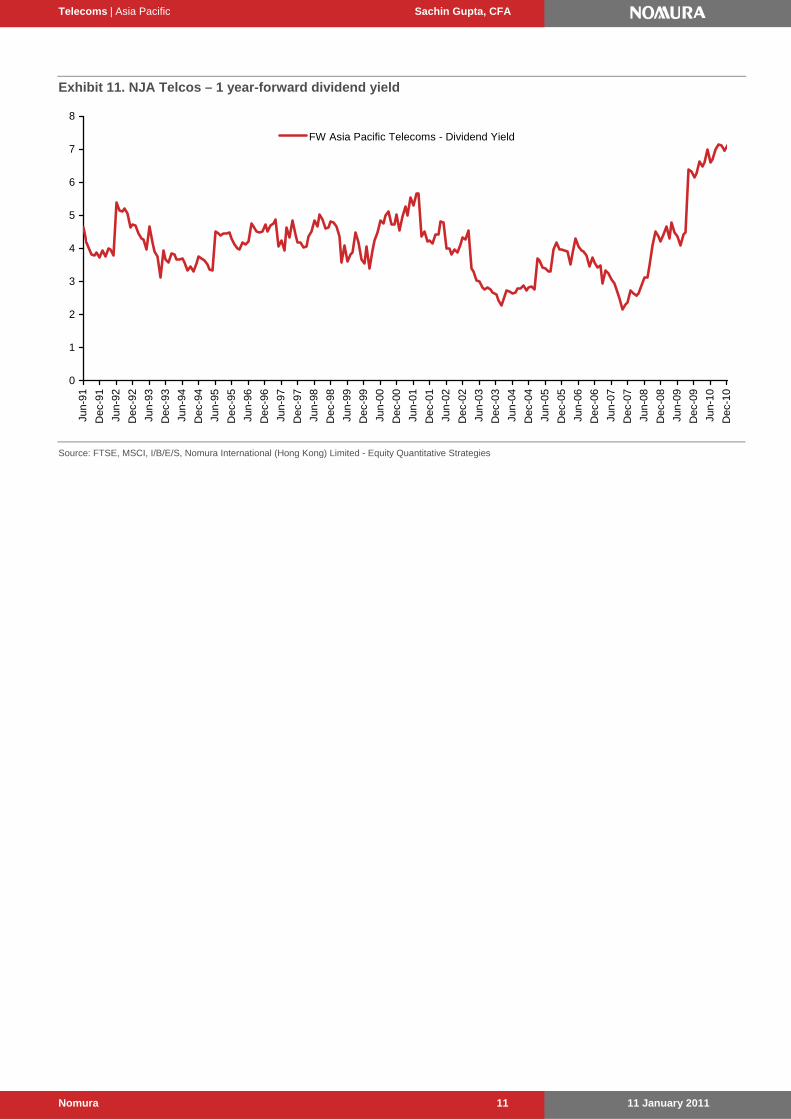
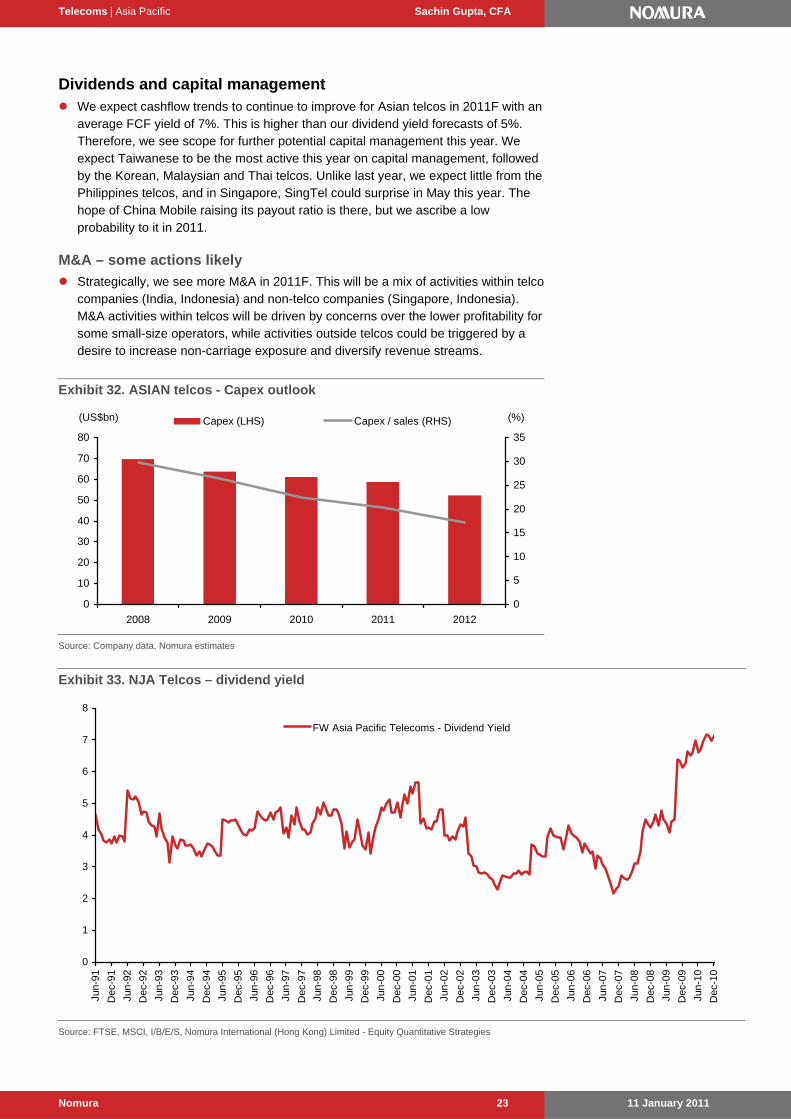
Dividends and capital management We expect cashflow trends to continue to improve for Asian telcos in 2011F with an
average FCF yield of 7%. This is higher than our dividend yield forecasts of 5%. Therefore, we see scope for further potential capital management this year. We expect Taiwanese to be the most active this year on capital management, followed by the Korean, Malaysian and Thai telcos. Unlike last year, we expect little from the Philippines telcos, and in Singapore, SingTel could surprise in May this year. The hope of China Mobile raising its payout ratio is there, but we ascribe a low probability to it in 2011.
M&A – some actions likely
Strategically, we see more M&A in 2011F. This will be a mix of activities within telco companies (India, Indonesia) and non-telco companies (Singapore, Indonesia). M&A activities within telcos will be driven by concerns over the lower profitability for some small-size operators, while activities outside telcos could be triggered by a desire to increase non-carriage exposure and diversify revenue streams.
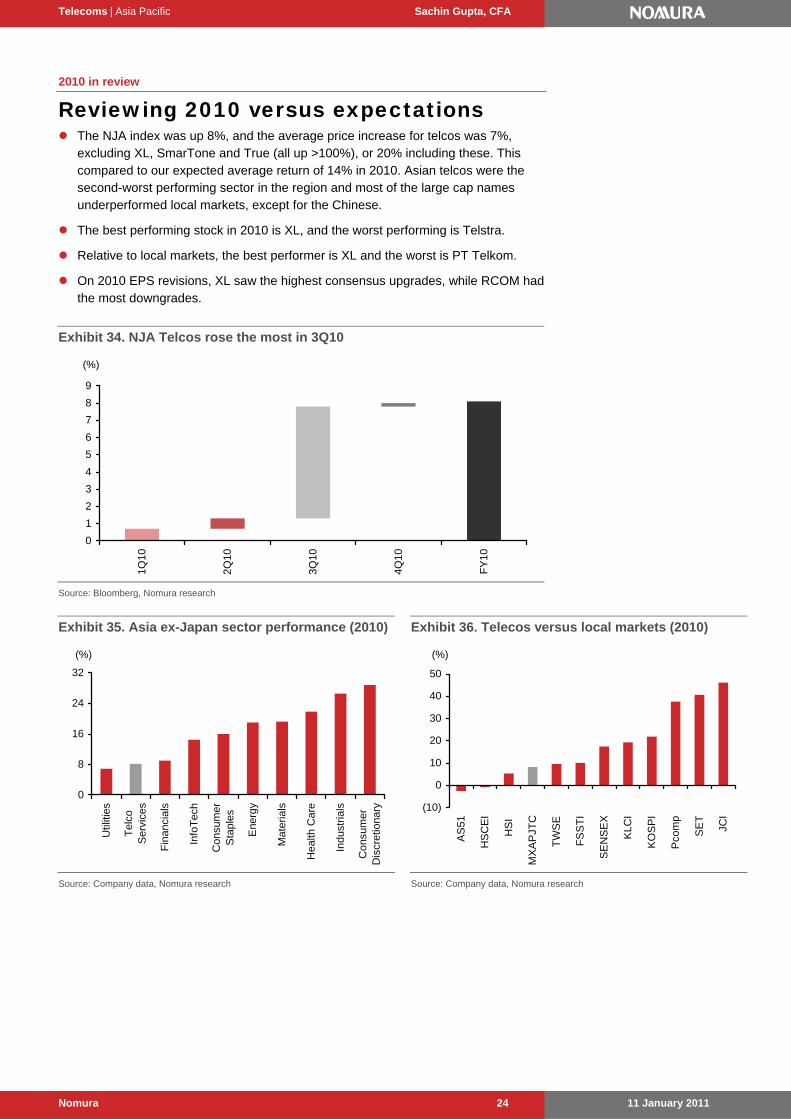
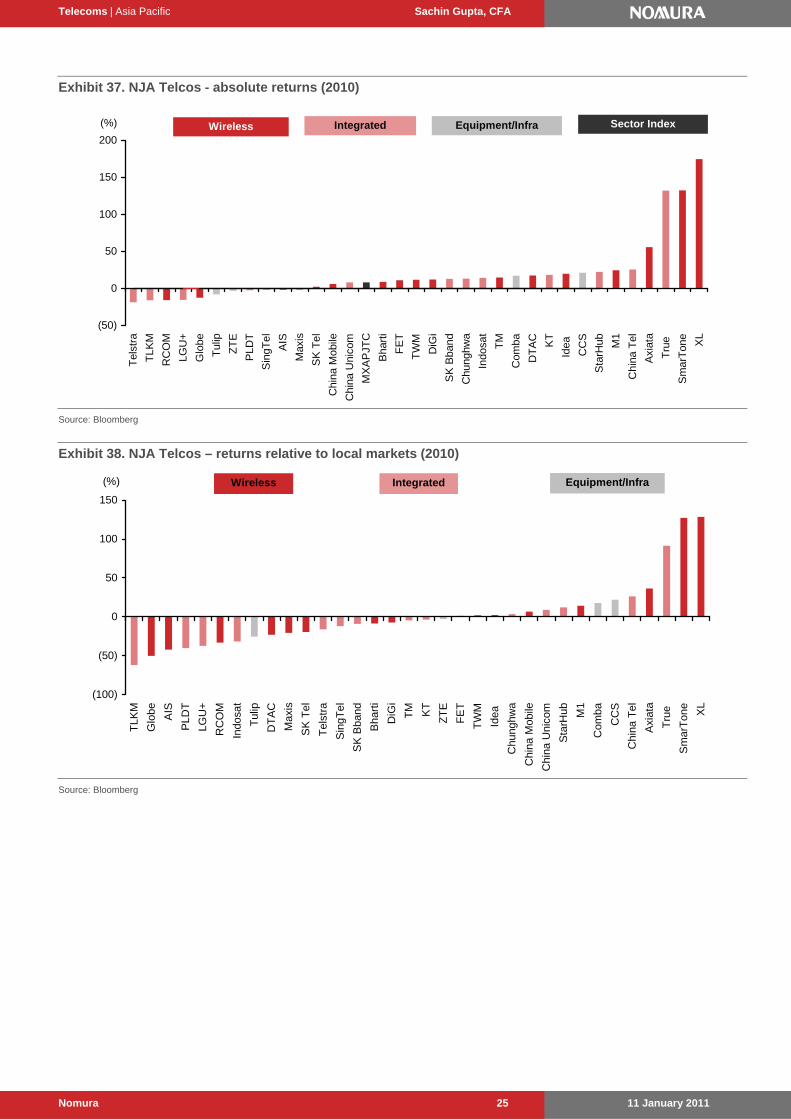
Reviewing 2010 versus expectations The NJA index was up 8%, and the average price increase for telcos was 7%,
excluding XL, SmarTone and True (all up >100%), or 20% including these. This compared to our expected average return of 14% in 2010. Asian telcos were the second-worst performing sector in the region and most of the large cap names underperformed local markets, except for the Chinese.
The best performing stock in 2010 is XL, and the worst performing is Telstra.
Relative to local markets, the best performer is XL and the worst is PT Telkom.
On 2010 EPS revisions, XL saw the highest consensus upgrades, while RCOM had the most downgrades.
Exhibit 34. NJA Telcos rose the most in 3Q10
0
1
2
3
4
5
6
7
8
9
1Q10
2Q10
3Q10
4Q10
FY
10
(%)
Source: Bloomberg, Nomura research
Exhibit 35. Asia ex-Japan sector performance (2010)
Exhibit 38. NJA Telcos – returns relative to local markets (2010)
(100)
(50)
0
50
100
150
TLK
M
Glo
be AIS
PLD
T
LGU
+
RC
OM
Indo
sat
Tul
ip
DT
AC
Max
is
SK
Tel
Tel
stra
Sin
gTel
SK
Bba
nd
Bha
rti
DiG
i
TM KT
ZT
E
FE
T
TW
M
Idea
Chu
nghw
a
Chi
na M
obile
Chi
na U
nico
m
Sta
rHub M
1
Com
ba
CC
S
Chi
na T
el
Axi
ata
Tru
e
Sm
arT
one
XL
Wireless Integrated Equipment/Infra(%)
Source: Bloomberg
Telecoms | Asia Pacific Sachin Gupta, CFA
11 January 2011 Nomura 26
Exhibit 39. Consensus 2010F EPS revisions
(100)
(50)
0
50
100
150
200
Re
lian
ce C
om
PT
In
do
sat
Ch
ina
Un
ico
mT
els
tra
Bh
art
i Airt
el
Glo
be
SK
Bro
ad
ba
nd
Sta
rHu
bP
T T
elk
om CT
Ma
xis
SK
Te
leco
mF
ar
Ea
sTo
ne
TM
Ta
iwa
n M
ob
ileS
ing
Te
lP
LD
TId
ea
Ce
llula
rC
hin
a M
ob
ile
Ch
un
gh
wa
Dig
i.co
mM
ob
ileO
ne
LG
Up
lus
KT
Co
rpA
IST
rue
To
tal A
cces
sA
xia
ta G
rou
pP
T X
L A
xia
ta
(%)
Source: Company data, Nomura estimates
Exhibit 40. Consensus 2011F EPS revisons
(100)
(50)
0
50
100
150
200
Re
lian
ce C
om
LG
Up
lus
PT
In
do
sat
Tru
e C
orp
ora
tion
Ch
ina
Un
ico
mT
els
tra
Glo
be
Te
leco
mP
T T
elk
om CT
Bh
art
i Airt
el
Fa
r E
asT
on
eM
axi
sP
LD
TT
MS
ing
Te
lS
K T
ele
com
Ta
iwa
n M
ob
ileS
tarH
ub
Ch
un
gh
wa
Te
leco
mC
hin
a M
ob
ileD
igi.c
om
Mo
bile
On
eA
ISId
ea
Ce
llula
rK
T C
orp
To
tal A
cces
sA
xia
ta G
rou
pP
T X
L A
xia
ta
(%)
Source: Company data, Nomura estimates
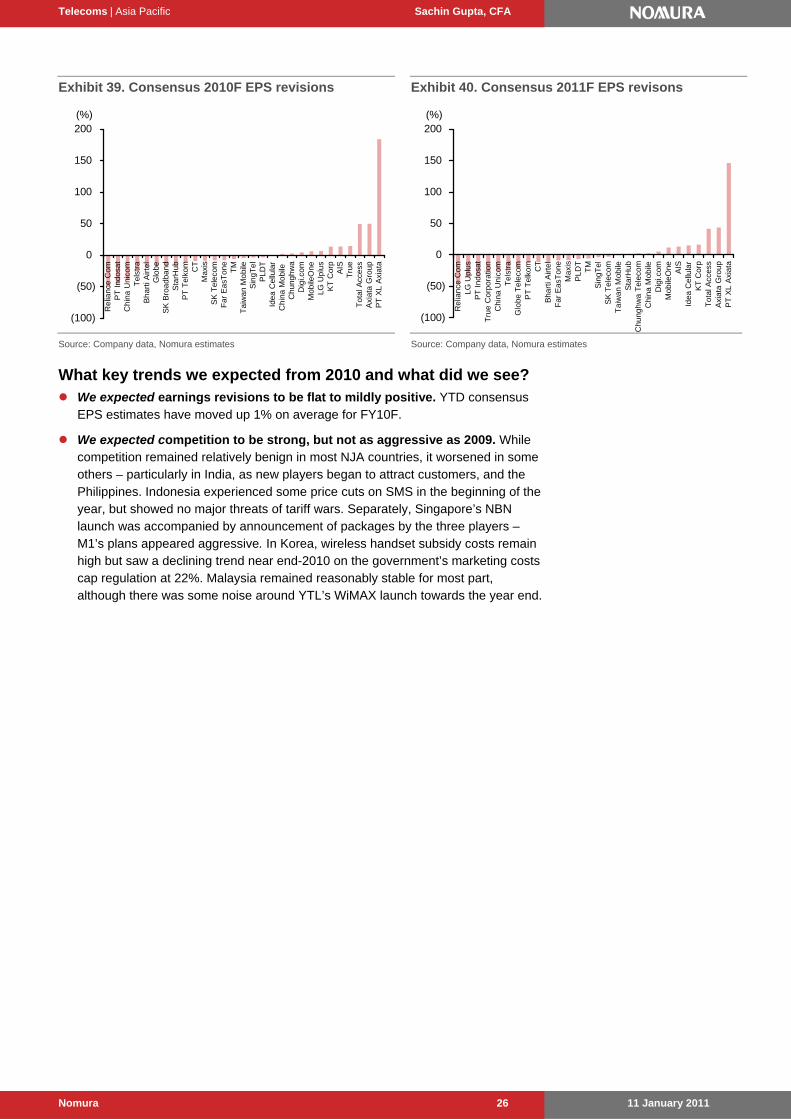
What key trends we expected from 2010 and what did we see? We expected earnings revisions to be flat to mildly positive. YTD consensus
EPS estimates have moved up 1% on average for FY10F.
We expected competition to be strong, but not as aggressive as 2009. While competition remained relatively benign in most NJA countries, it worsened in some others – particularly in India, as new players began to attract customers, and the Philippines. Indonesia experienced some price cuts on SMS in the beginning of the year, but showed no major threats of tariff wars. Separately, Singapore’s NBN launch was accompanied by announcement of packages by the three players – M1’s plans appeared aggressive. In Korea, wireless handset subsidy costs remain high but saw a declining trend near end-2010 on the government’s marketing costs cap regulation at 22%. Malaysia remained reasonably stable for most part, although there was some noise around YTL’s WiMAX launch towards the year end.
Telecoms | Asia Pacific Sachin Gupta, CFA
11 January 2011 Nomura 27
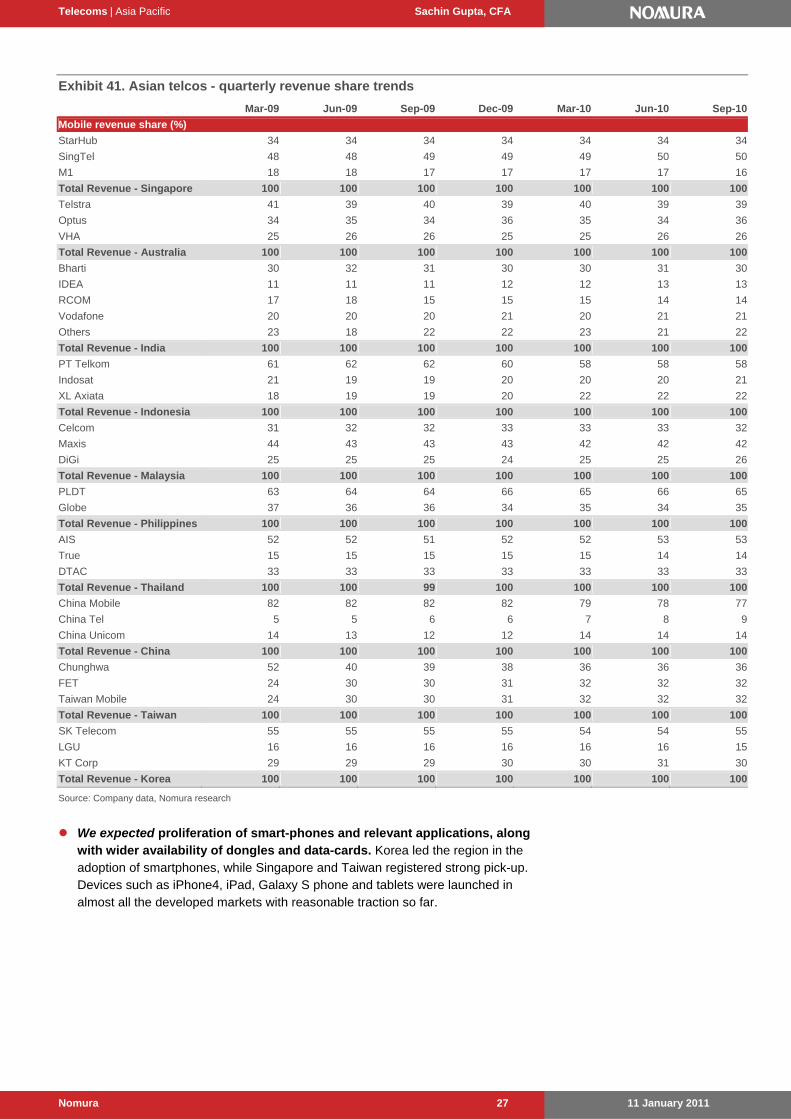
Exhibit 41. Asian telcos - quarterly revenue share trends
We expected proliferation of smart-phones and relevant applications, along with wider availability of dongles and data-cards. Korea led the region in the adoption of smartphones, while Singapore and Taiwan registered strong pick-up. Devices such as iPhone4, iPad, Galaxy S phone and tablets were launched in almost all the developed markets with reasonable traction so far.
We expected carriers to venture into multi-media and managed services. Only limited evidence of this so far – but continues to remain a focus for all carriers.
We expected some relief from regulations. Regulatory developments remained mixed across the region. Key developments included an interconnect rate reduction in Malaysia, mandated non-exclusivity of pay-TV content in Singapore and the approval of Telstra’s separation ahead of the NBN rollout in Australia. The Indian landscape remained the most volatile – 3G hogged the headlines and also saw the introduction of MNP and reviews 2G license allocations.
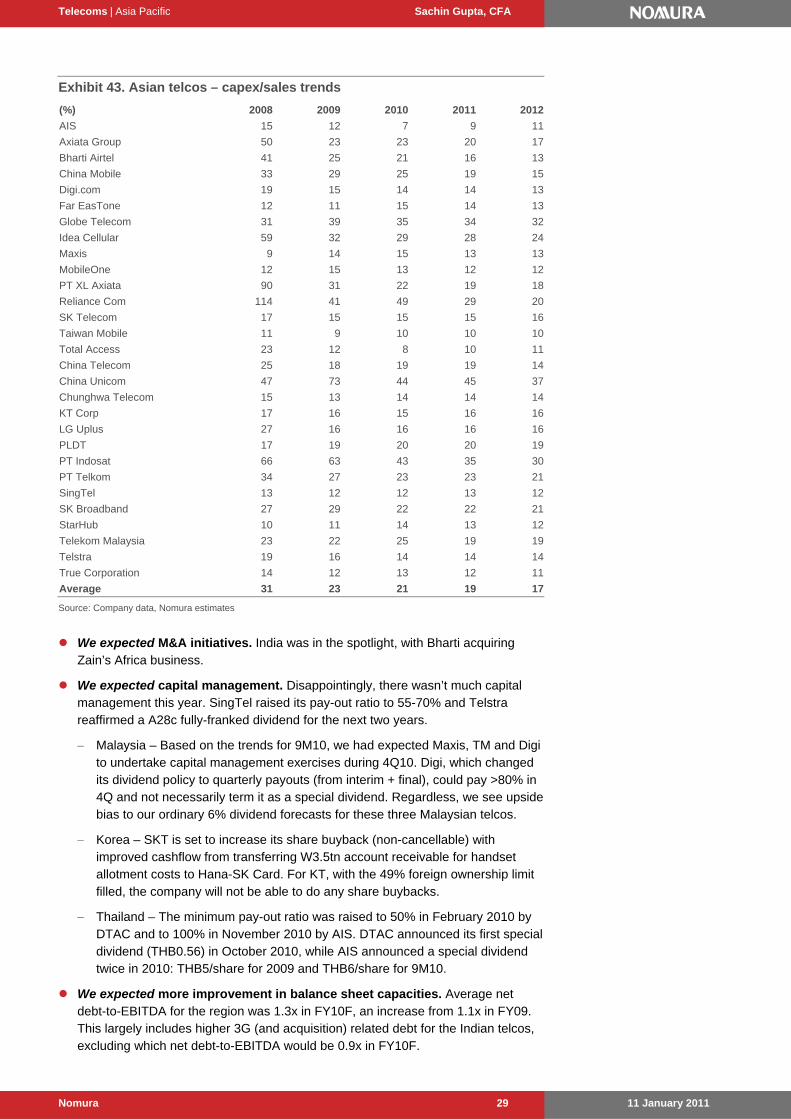
We expected less likelihood of upward revision to capex guidance. Capex trends for the region have remained stable and in fact guidance has actually been revised down by a few operators such as TM, PT Telkom. FY10F capex to sales for the region is 21% versus 23% in FY09.
Telecoms | Asia Pacific Sachin Gupta, CFA
11 January 2011 Nomura 29
Exhibit 43. Asian telcos – capex/sales trends
(%) 2008 2009 2010 2011 2012
AIS 15 12 7 9 11
Axiata Group 50 23 23 20 17
Bharti Airtel 41 25 21 16 13
China Mobile 33 29 25 19 15
Digi.com 19 15 14 14 13
Far EasTone 12 11 15 14 13
Globe Telecom 31 39 35 34 32
Idea Cellular 59 32 29 28 24
Maxis 9 14 15 13 13
MobileOne 12 15 13 12 12
PT XL Axiata 90 31 22 19 18
Reliance Com 114 41 49 29 20
SK Telecom 17 15 15 15 16
Taiwan Mobile 11 9 10 10 10
Total Access 23 12 8 10 11
China Telecom 25 18 19 19 14
China Unicom 47 73 44 45 37
Chunghwa Telecom 15 13 14 14 14
KT Corp 17 16 15 16 16
LG Uplus 27 16 16 16 16
PLDT 17 19 20 20 19
PT Indosat 66 63 43 35 30
PT Telkom 34 27 23 23 21
SingTel 13 12 12 13 12
SK Broadband 27 29 22 22 21
StarHub 10 11 14 13 12
Telekom Malaysia 23 22 25 19 19
Telstra 19 16 14 14 14
True Corporation 14 12 13 12 11
Average 31 23 21 19 17 Source: Company data, Nomura estimates
We expected M&A initiatives. India was in the spotlight, with Bharti acquiring Zain’s Africa business.
We expected capital management. Disappointingly, there wasn’t much capital management this year. SingTel raised its pay-out ratio to 55-70% and Telstra reaffirmed a A28c fully-franked dividend for the next two years.
Malaysia – Based on the trends for 9M10, we had expected Maxis, TM and Digi to undertake capital management exercises during 4Q10. Digi, which changed its dividend policy to quarterly payouts (from interim + final), could pay >80% in 4Q and not necessarily term it as a special dividend. Regardless, we see upside bias to our ordinary 6% dividend forecasts for these three Malaysian telcos.
Korea – SKT is set to increase its share buyback (non-cancellable) with improved cashflow from transferring W3.5tn account receivable for handset allotment costs to Hana-SK Card. For KT, with the 49% foreign ownership limit filled, the company will not be able to do any share buybacks.
Thailand – The minimum pay-out ratio was raised to 50% in February 2010 by DTAC and to 100% in November 2010 by AIS. DTAC announced its first special dividend (THB0.56) in October 2010, while AIS announced a special dividend twice in 2010: THB5/share for 2009 and THB6/share for 9M10.
We expected more improvement in balance sheet capacities. Average net debt-to-EBITDA for the region was 1.3x in FY10F, an increase from 1.1x in FY09. This largely includes higher 3G (and acquisition) related debt for the Indian telcos, excluding which net debt-to-EBITDA would be 0.9x in FY10F.
Telecoms | Asia Pacific Sachin Gupta, CFA
11 January 2011 Nomura 30
Exhibit 44. Net debt to EBITDA ratios (2011F)
(2)
(1)
0
1
2
3
4
5
6
7
Rel
ianc
e C
om
Tru
e C
orpo
ratio
n
Idea
Cel
lula
r
PT
Ind
osat
SK
Bro
adba
nd
Bha
rti A
irtel
Glo
be T
elec
om
Ch
ina
Uni
com
KT
Cor
p
Tel
stra
Sta
rHub
LG U
plus
Tel
ekom
Mal
aysi
a
Ma
xis
PLD
T
Sin
gTe
l
PT
XL
Axi
ata
SK
Tel
ecom
Mo
bile
One
Axi
ata
Gro
up
Chi
na T
elec
om AIS
To
tal A
cce
ss
Ta
iwan
Mob
ile
PT
Tel
kom
Dig
i.com
Far
Eas
Ton
e
Chu
nghw
a T
elec
om
Chi
na M
obile
Note: AIS, Total Access and True are covered by Capital Nomura Securities.
Source: Capital Nomura Securities estimates, Nomura estimates
Note: XL only for o/g. PT Telkom MoU excludes incoming and free minutes. ARPU for Korean telcos is net of interconnection. AIS, Total Access and True are covered by Capital Nomura Securities
Source: Capital Nomura Securities estimates, Nomura estimates
Telecoms | Asia Pacific Sachin Gupta, CFA
11 January 2011 Nomura 31
Country by country
Country-specific trends in 2011F China: Variety and affordability of smart-phones to continue to improve We believe a higher adoption of smart-phones could drive up ARPU of data-savvy
subscribers. This effect will be particularly obvious at China Unicom, given that the company's 3G monthly net adds is exceeding its 2G monthly net adds.
Also, due to higher data usage of smartphones and 3G mobile phones, the increased pressure on operators' networks could bring pressure to revise up capex for FY11F. Also, with the government mainly focusing on 3G and 4G developments, we do not expect the government to launch any aggressive regulatory measure.
Potential catalysts are: 1) higher adoption of 3G mobile services; 2) stabilisation of the blended ARPU trend due to the higher 3G adoption rate; and 3) stabilisation of EBITDA margins.
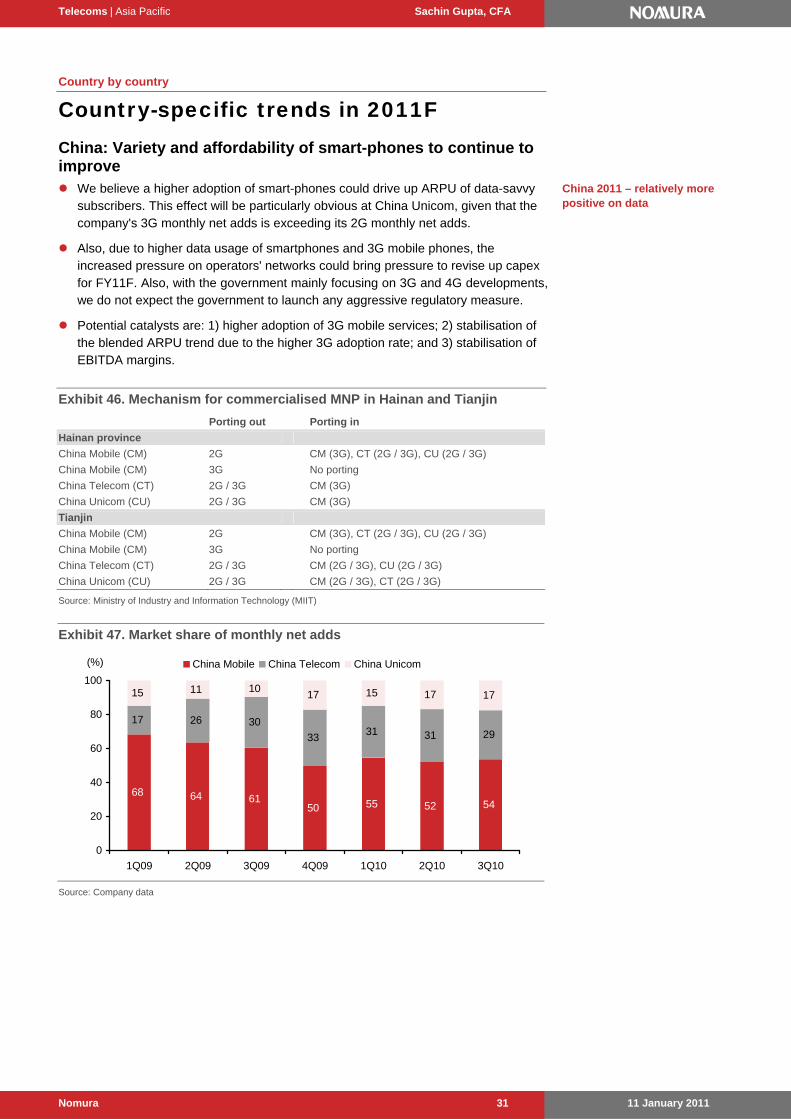
Exhibit 46. Mechanism for commercialised MNP in Hainan and Tianjin
Porting out Porting in
Hainan province
China Mobile (CM) 2G CM (3G), CT (2G / 3G), CU (2G / 3G)
China Mobile (CM) 3G No porting
China Telecom (CT) 2G / 3G CM (3G)
China Unicom (CU) 2G / 3G CM (3G)
Tianjin
China Mobile (CM) 2G CM (3G), CT (2G / 3G), CU (2G / 3G)
China Mobile (CM) 3G No porting
China Telecom (CT) 2G / 3G CM (2G / 3G), CU (2G / 3G)
China Unicom (CU) 2G / 3G CM (2G / 3G), CT (2G / 3G)
Source: Ministry of Industry and Information Technology (MIIT)
Exhibit 47. Market share of monthly net adds
68 64 6150 55 52 54
17 26 30
3331 31 29
15 11 1017 15 17 17
0
20
40
60
80
100
1Q09 2Q09 3Q09 4Q09 1Q10 2Q10 3Q10
China Mobile China Telecom China Unicom(%)
Source: Company data
China 2011 – relatively more positive on data
Telecoms | Asia Pacific Sachin Gupta, CFA
11 January 2011 Nomura 32
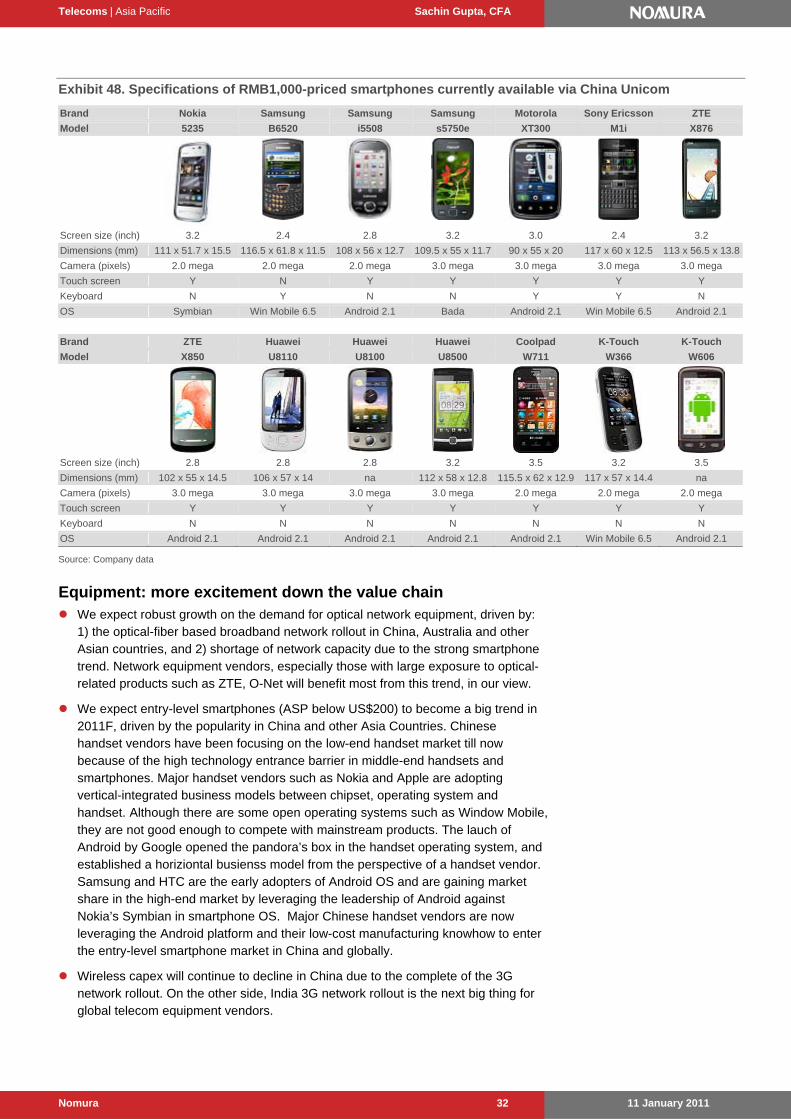
Exhibit 48. Specifications of RMB1,000-priced smartphones currently available via China Unicom
Brand Nokia Samsung Samsung Samsung Motorola Sony Ericsson ZTE
Model 5235 B6520 i5508 s5750e XT300 M1i X876
Screen size (inch) 3.2 2.4 2.8 3.2 3.0 2.4 3.2
Dimensions (mm) 111 x 51.7 x 15.5 116.5 x 61.8 x 11.5 108 x 56 x 12.7 109.5 x 55 x 11.7 90 x 55 x 20 117 x 60 x 12.5 113 x 56.5 x 13.8
Camera (pixels) 2.0 mega 2.0 mega 2.0 mega 3.0 mega 3.0 mega 3.0 mega 3.0 mega
Touch screen Y N Y Y Y Y Y
Keyboard N Y N N Y Y N
OS Symbian Win Mobile 6.5 Android 2.1 Bada Android 2.1 Win Mobile 6.5 Android 2.1
Dimensions (mm) 102 x 55 x 14.5 106 x 57 x 14 na 112 x 58 x 12.8 115.5 x 62 x 12.9 117 x 57 x 14.4 na
Camera (pixels) 3.0 mega 3.0 mega 3.0 mega 3.0 mega 2.0 mega 2.0 mega 2.0 mega
Touch screen Y Y Y Y Y Y Y
Keyboard N N N N N N N
OS Android 2.1 Android 2.1 Android 2.1 Android 2.1 Android 2.1 Win Mobile 6.5 Android 2.1
Source: Company data
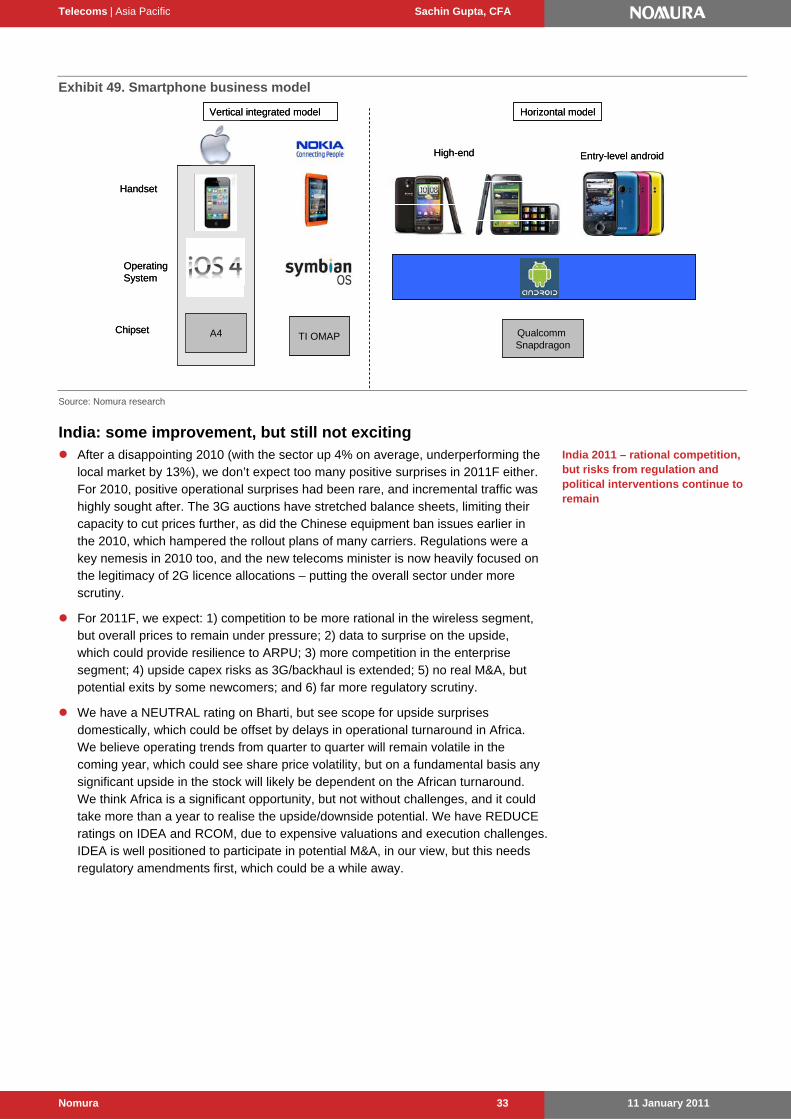
Equipment: more excitement down the value chain We expect robust growth on the demand for optical network equipment, driven by:
1) the optical-fiber based broadband network rollout in China, Australia and other Asian countries, and 2) shortage of network capacity due to the strong smartphone trend. Network equipment vendors, especially those with large exposure to optical-related products such as ZTE, O-Net will benefit most from this trend, in our view.
We expect entry-level smartphones (ASP below US$200) to become a big trend in 2011F, driven by the popularity in China and other Asia Countries. Chinese handset vendors have been focusing on the low-end handset market till now because of the high technology entrance barrier in middle-end handsets and smartphones. Major handset vendors such as Nokia and Apple are adopting vertical-integrated business models between chipset, operating system and handset. Although there are some open operating systems such as Window Mobile, they are not good enough to compete with mainstream products. The lauch of Android by Google opened the pandora’s box in the handset operating system, and established a horiziontal busienss model from the perspective of a handset vendor. Samsung and HTC are the early adopters of Android OS and are gaining market share in the high-end market by leveraging the leadership of Android against Nokia’s Symbian in smartphone OS. Major Chinese handset vendors are now leveraging the Android platform and their low-cost manufacturing knowhow to enter the entry-level smartphone market in China and globally.
Wireless capex will continue to decline in China due to the complete of the 3G network rollout. On the other side, India 3G network rollout is the next big thing for global telecom equipment vendors.
Telecoms | Asia Pacific Sachin Gupta, CFA
11 January 2011 Nomura 33
Exhibit 49. Smartphone business model
A4 TI OMAP Qualcomm Snapdragon
Vertical integrated model Horizontal model
High-end Entry-level android
Handset
Operating System
Chipset A4 TI OMAP Qualcomm Snapdragon
Vertical integrated model Horizontal model
High-end Entry-level android
Handset
Operating System
Chipset
Source: Nomura research
India: some improvement, but still not exciting After a disappointing 2010 (with the sector up 4% on average, underperforming the
local market by 13%), we don’t expect too many positive surprises in 2011F either. For 2010, positive operational surprises had been rare, and incremental traffic was highly sought after. The 3G auctions have stretched balance sheets, limiting their capacity to cut prices further, as did the Chinese equipment ban issues earlier in the 2010, which hampered the rollout plans of many carriers. Regulations were a key nemesis in 2010 too, and the new telecoms minister is now heavily focused on the legitimacy of 2G licence allocations – putting the overall sector under more scrutiny.
For 2011F, we expect: 1) competition to be more rational in the wireless segment, but overall prices to remain under pressure; 2) data to surprise on the upside, which could provide resilience to ARPU; 3) more competition in the enterprise segment; 4) upside capex risks as 3G/backhaul is extended; 5) no real M&A, but potential exits by some newcomers; and 6) far more regulatory scrutiny.
We have a NEUTRAL rating on Bharti, but see scope for upside surprises domestically, which could be offset by delays in operational turnaround in Africa. We believe operating trends from quarter to quarter will remain volatile in the coming year, which could see share price volatility, but on a fundamental basis any significant upside in the stock will likely be dependent on the African turnaround. We think Africa is a significant opportunity, but not without challenges, and it could take more than a year to realise the upside/downside potential. We have REDUCE ratings on IDEA and RCOM, due to expensive valuations and execution challenges. IDEA is well positioned to participate in potential M&A, in our view, but this needs regulatory amendments first, which could be a while away.
India 2011 – rational competition, but risks from regulation and political interventions continue to remain
Telecoms | Asia Pacific Sachin Gupta, CFA
11 January 2011 Nomura 34
Exhibit 50. India: wireless industry growth trends
Korea: return profile of data growth strategies is the key With mass-market smartphone penetration in FY11F, we expect the smartphone
billing ARPU to decline steadily. However, due to significantly higher smartphone ARPU over feature phones and accelerating smartphone penetration, overall ARPU should increase.
We expect solid control of marketing costs in FY11F, owing to: 1) a “special tariff discount” plan to meet KCC ‘s 22% marketing cost guideline and subsidy cap; 2) significant local vendor subsidy for Android-based smartphones, and; 3) reasonably set smartphone subsidies compared with a strong payback profile.
We expect limited capex growth in FY11F for Korea telcos despite early LTE roll out.
Exhibit 52. Korea: marketing cost/sales ratio
0.10
0.15
0.20
0.25
0.30
0.35
FY05 FY06 FY07 FY08 FY09F FY10F
SKT LGT
Source: Company data, Nomura estimates
Exhibit 53. Korea: capex/sales ratio
0.10
0.12
0.14
0.16
0.18
0.20
0.22
0.24
0.26
FY05 FY06 FY07 FY08 FY09F FY10F
SKT KT LGT
Source: Company data, Nomura estimates
Indonesia: growth appeal remains intact Indonesia could continue to remain a key telco market in 2011F, we believe. The
strong growth potential and not so detrimental regulatory / competitive risks are likely to support the market’s appeal. While we expect tariffs to remain low on almost everything – voice, SMS, VAS, we do not see any major threat of cut-throat price wars in 2011F; network utilizations remain high and pricing does not lend a differentiating edge any more. On the regulatory front, revised interconnect rates came into effect at the beginning of the year. Data growth and ex-Java region would form the key focus areas for operators, in our view.
Korea 2011F – Smartphone-driven earnings growth will be mostly visible in 2011 with its penetration increasing from 15% in 2010 to 30% in 2011F
Telecoms | Asia Pacific Sachin Gupta, CFA
11 January 2011 Nomura 35
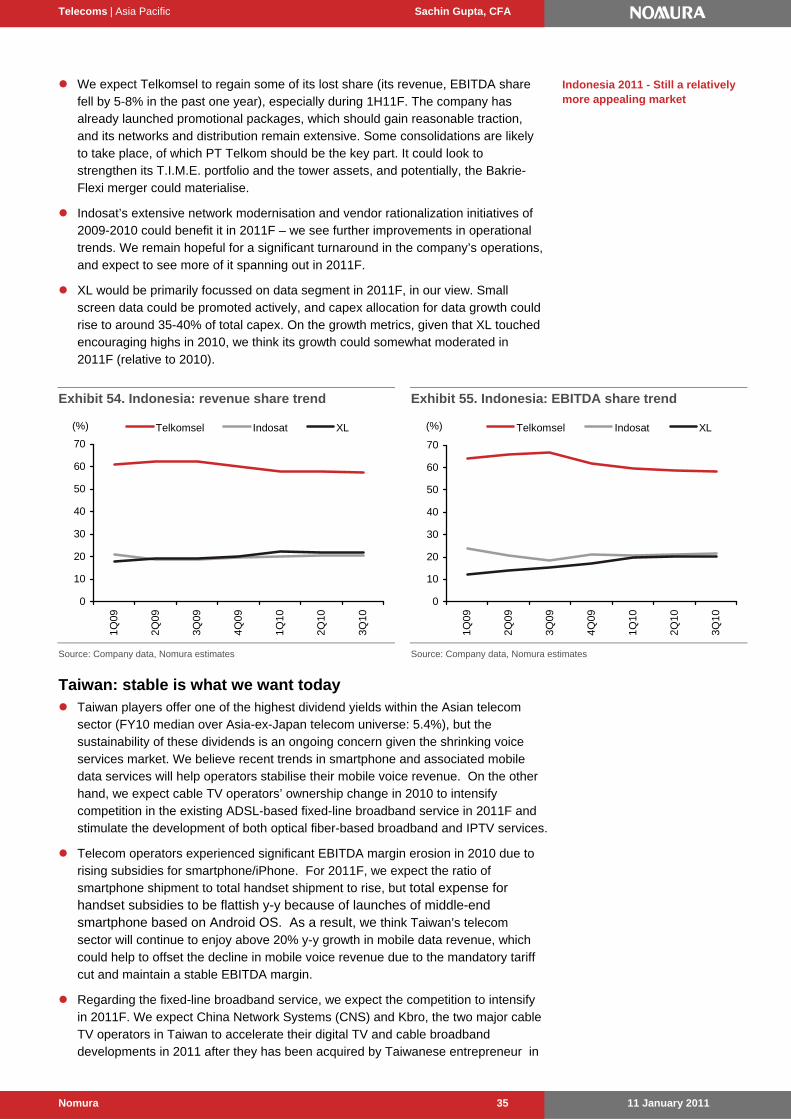
We expect Telkomsel to regain some of its lost share (its revenue, EBITDA share fell by 5-8% in the past one year), especially during 1H11F. The company has already launched promotional packages, which should gain reasonable traction, and its networks and distribution remain extensive. Some consolidations are likely to take place, of which PT Telkom should be the key part. It could look to strengthen its T.I.M.E. portfolio and the tower assets, and potentially, the Bakrie-Flexi merger could materialise.
Indosat’s extensive network modernisation and vendor rationalization initiatives of 2009-2010 could benefit it in 2011F – we see further improvements in operational trends. We remain hopeful for a significant turnaround in the company’s operations, and expect to see more of it spanning out in 2011F.
XL would be primarily focussed on data segment in 2011F, in our view. Small screen data could be promoted actively, and capex allocation for data growth could rise to around 35-40% of total capex. On the growth metrics, given that XL touched encouraging highs in 2010, we think its growth could somewhat moderated in 2011F (relative to 2010).
Exhibit 54. Indonesia: revenue share trend
0
10
20
30
40
50
60
70
1Q09
2Q09
3Q09
4Q09
1Q10
2Q10
3Q10
Telkomsel Indosat XL(%)
Source: Company data, Nomura estimates
Exhibit 55. Indonesia: EBITDA share trend
0
10
20
30
40
50
60
70
1Q09
2Q09
3Q09
4Q09
1Q10
2Q10
3Q10
Telkomsel Indosat XL(%)
Source: Company data, Nomura estimates
Taiwan: stable is what we want today Taiwan players offer one of the highest dividend yields within the Asian telecom
sector (FY10 median over Asia-ex-Japan telecom universe: 5.4%), but the sustainability of these dividends is an ongoing concern given the shrinking voice services market. We believe recent trends in smartphone and associated mobile data services will help operators stabilise their mobile voice revenue. On the other hand, we expect cable TV operators’ ownership change in 2010 to intensify competition in the existing ADSL-based fixed-line broadband service in 2011F and stimulate the development of both optical fiber-based broadband and IPTV services.
Telecom operators experienced significant EBITDA margin erosion in 2010 due to rising subsidies for smartphone/iPhone. For 2011F, we expect the ratio of smartphone shipment to total handset shipment to rise, but total expense for handset subsidies to be flattish y-y because of launches of middle-end smartphone based on Android OS. As a result, we think Taiwan’s telecom sector will continue to enjoy above 20% y-y growth in mobile data revenue, which could help to offset the decline in mobile voice revenue due to the mandatory tariff cut and maintain a stable EBITDA margin.
Regarding the fixed-line broadband service, we expect the competition to intensify in 2011F. We expect China Network Systems (CNS) and Kbro, the two major cable TV operators in Taiwan to accelerate their digital TV and cable broadband developments in 2011 after they has been acquired by Taiwanese entrepreneur in
Indonesia 2011 - Still a relatively more appealing market
Telecoms | Asia Pacific Sachin Gupta, CFA
11 January 2011 Nomura 36
2010. In preparation for intensifying competition, after CHT has migrated its customer base from ADSL to FTTx, which has higher bandwidth, it plans to improve its FTTx coverage and provide attractive IPTV (Multimedia on Demand, MOD) content. This should help the company to alleviate the impact of tariff cuts because only ADSL tariffs are regulated under the tariff cut scheme.
CHT and TWM has already announced their capital management plan to be executed in 2011, while FET is pending any capital management action since its request for approval to place new share to China Mobile is still pending. As a result, we do not expect any new capital management actions in 2011.
Since most of the tariff reduction scheme has been introduced, we expect limited regulatory risks in the telecom sector in 2011F. On the voice front, Taiwanese operators enjoy a much higher APRU and profit margin than peers in other Asian countries, given Taiwan’s stable regulatory and moderate competitive environment. After the regulator’s recent decision on mobile tariff cuts, we expect very little regulatory uncertainty in the voice segment over the next three years. This favourable regulatory environment, in our view, bodes well for market leader CHT.
Because of the sensitive nature of the telecom business, we and the market do not expect significant progress in the cross-straits cooperation between Chinese and Taiwanese operators. If FET’s application to place new share to Chinas Mobile is approved, this will be a big positive surprise to FET and the whole telecom sector, in our view.
CHT has emphasized many times that its property business will focus on generating more rental revenue from the renewal of properties used to install telecom equipment. However, recent rallies in Taipei’s property prices could attract investors’ attention on the non-cash gain on revaluation of CHT’s property, especially considering that CHT may need to disclose such information from 2012 due to the adoption of IFIS in Taiwan.
Thailand: Focus on dividend yield rather than profits Capital Nomura Securities (CNS) analyst, Piyachat Ratanasuvan, does not expect
Thai telcos to report impressive rates of net profit (NP) growth in 2011F. Thai Telcos’ earnings should be driven mainly by their service revenues growth and cost control. According to Mr Ratanasuvan, the revenues generated by non-voice services, following the surge smartphone sales, should be the major driver for telecom operators’ total revenue growth. Meanwhile, Mr Ratanasuvan believes each operator should be able to control costs and expenses efficiently.
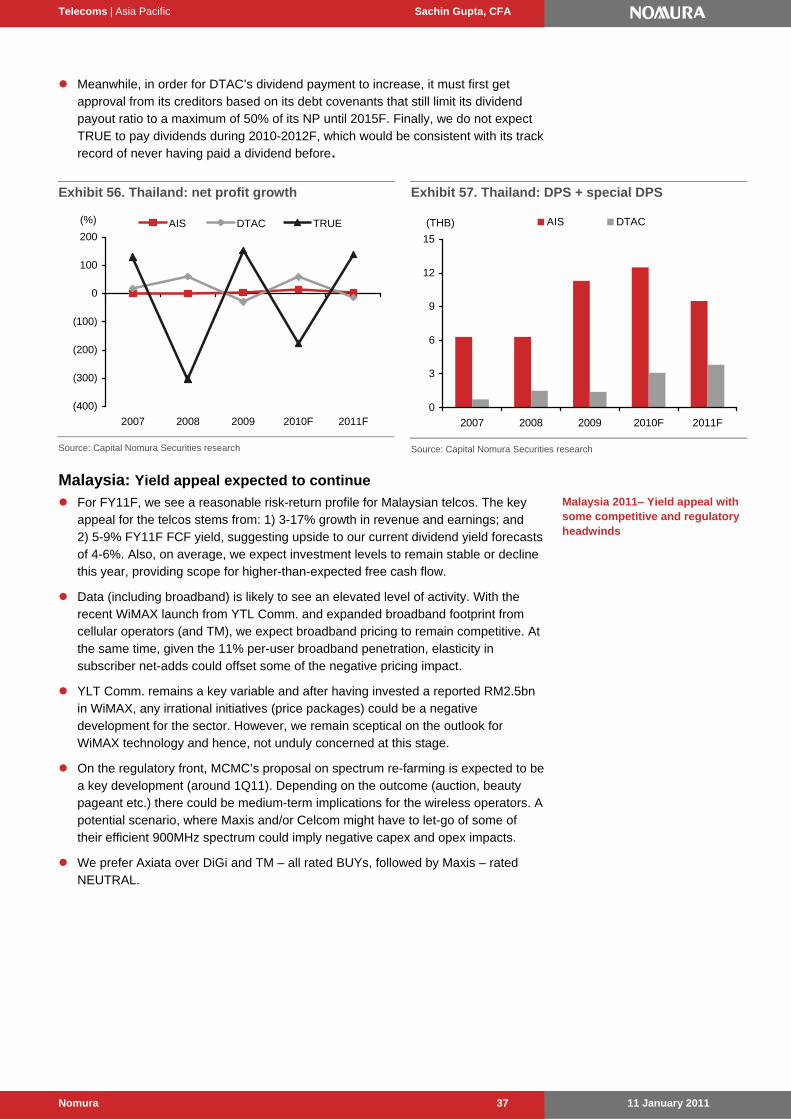
Instead, investors should focus on telecom operators’ ability to pay dividends in 2011F. Our forecasts call for AIS to raise its normal dividend in 2011F on a year-on-year basis and we also expect the company to pay a special dividend. Meanwhile, DTAC could also decide to raise its dividend payout ratio even though the company’s NP is likely to decline in 2011F. AIS’s and DTAC’s dividend announcements for 2011F could surprise the market just like in 2010.
Meanwhile, we do not expect telecom operators to make much progress on their 3G investments even though they have several options, i.e. upgrading their current spectrums, becoming a mobile virtual network operator (MVNO). We do not believe that the 3G license auctions, which will eventually be held by the National Broadcasting and Telecommunications Commission (NBTC), will happen in 2011F.
AIS is our top pick. We have upgraded AIS to BUY, from Neutral, after the recent share price drop. We do not expect AIS to make significant investment on 3G and this should result in excess cash which will likely be paid out as a special dividend. The key catalyst for AIS shares is likely to be the size of the company’s dividend payments, including normal dividend payments in February and August each year and special dividend payments for which the timing remains unclear.
Focus on dividend yield rather than profits; 3G investments to have no significant impact
Telecoms | Asia Pacific Sachin Gupta, CFA
11 January 2011 Nomura 37
Meanwhile, in order for DTAC’s dividend payment to increase, it must first get approval from its creditors based on its debt covenants that still limit its dividend payout ratio to a maximum of 50% of its NP until 2015F. Finally, we do not expect TRUE to pay dividends during 2010-2012F, which would be consistent with its track record of never having paid a dividend before.
Exhibit 56. Thailand: net profit growth
(400)
(300)
(200)
(100)
0
100
200
2007 2008 2009 2010F 2011F
AIS DTAC TRUE(%)
Source: Capital Nomura Securities research
Exhibit 57. Thailand: DPS + special DPS
0
3
6
9
12
15
2007 2008 2009 2010F 2011F
AIS DTAC(THB)
Source: Capital Nomura Securities research
Malaysia: Yield appeal expected to continue
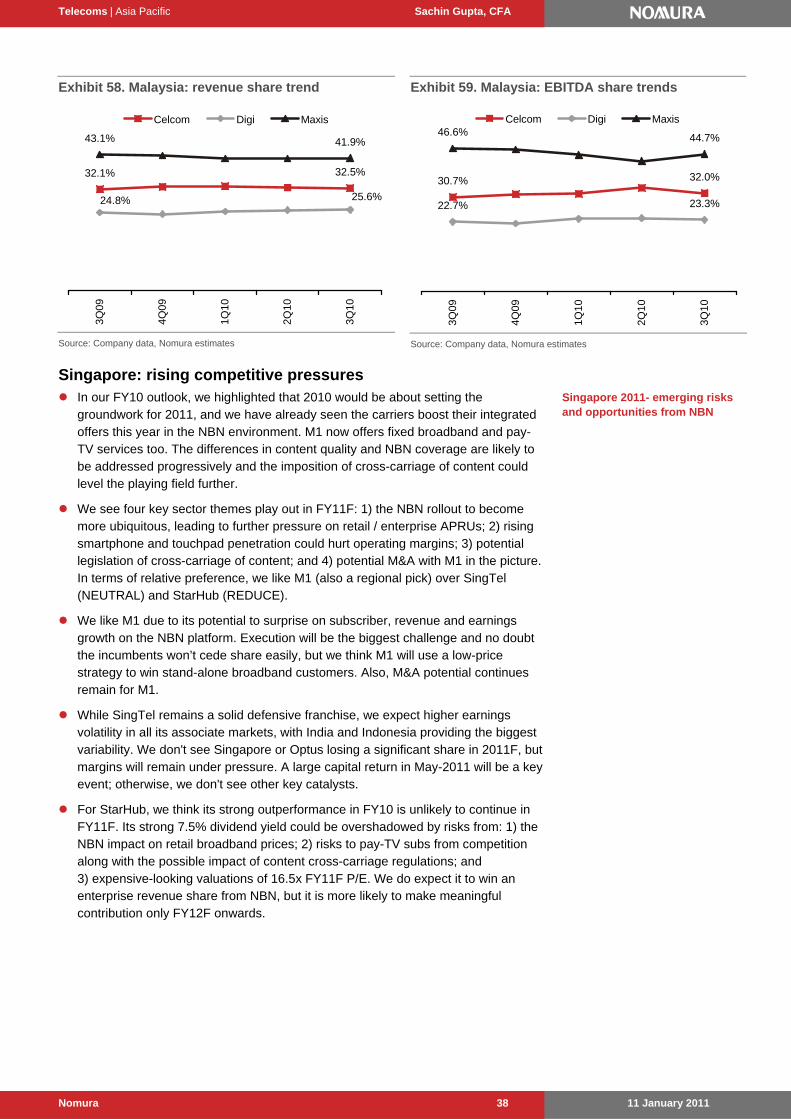
For FY11F, we see a reasonable risk-return profile for Malaysian telcos. The key appeal for the telcos stems from: 1) 3-17% growth in revenue and earnings; and 2) 5-9% FY11F FCF yield, suggesting upside to our current dividend yield forecasts of 4-6%. Also, on average, we expect investment levels to remain stable or decline this year, providing scope for higher-than-expected free cash flow.
Data (including broadband) is likely to see an elevated level of activity. With the recent WiMAX launch from YTL Comm. and expanded broadband footprint from cellular operators (and TM), we expect broadband pricing to remain competitive. At the same time, given the 11% per-user broadband penetration, elasticity in subscriber net-adds could offset some of the negative pricing impact.
YLT Comm. remains a key variable and after having invested a reported RM2.5bn in WiMAX, any irrational initiatives (price packages) could be a negative development for the sector. However, we remain sceptical on the outlook for WiMAX technology and hence, not unduly concerned at this stage.
On the regulatory front, MCMC’s proposal on spectrum re-farming is expected to be a key development (around 1Q11). Depending on the outcome (auction, beauty pageant etc.) there could be medium-term implications for the wireless operators. A potential scenario, where Maxis and/or Celcom might have to let-go of some of their efficient 900MHz spectrum could imply negative capex and opex impacts.
We prefer Axiata over DiGi and TM – all rated BUYs, followed by Maxis – rated NEUTRAL.
Malaysia 2011– Yield appeal with some competitive and regulatory headwinds
Telecoms | Asia Pacific Sachin Gupta, CFA
11 January 2011 Nomura 38
Exhibit 58. Malaysia: revenue share trend
32.1% 32.5%
43.1% 41.9%
24.8% 25.6%
3Q09
4Q09
1Q10
2Q10
3Q10
Celcom Digi Maxis
Source: Company data, Nomura estimates
Exhibit 59. Malaysia: EBITDA share trends
30.7% 32.0%
22.7% 23.3%
46.6% 44.7%
3Q0
9
4Q0
9
1Q1
0
2Q1
0
3Q1
0
Celcom Digi Maxis
Source: Company data, Nomura estimates
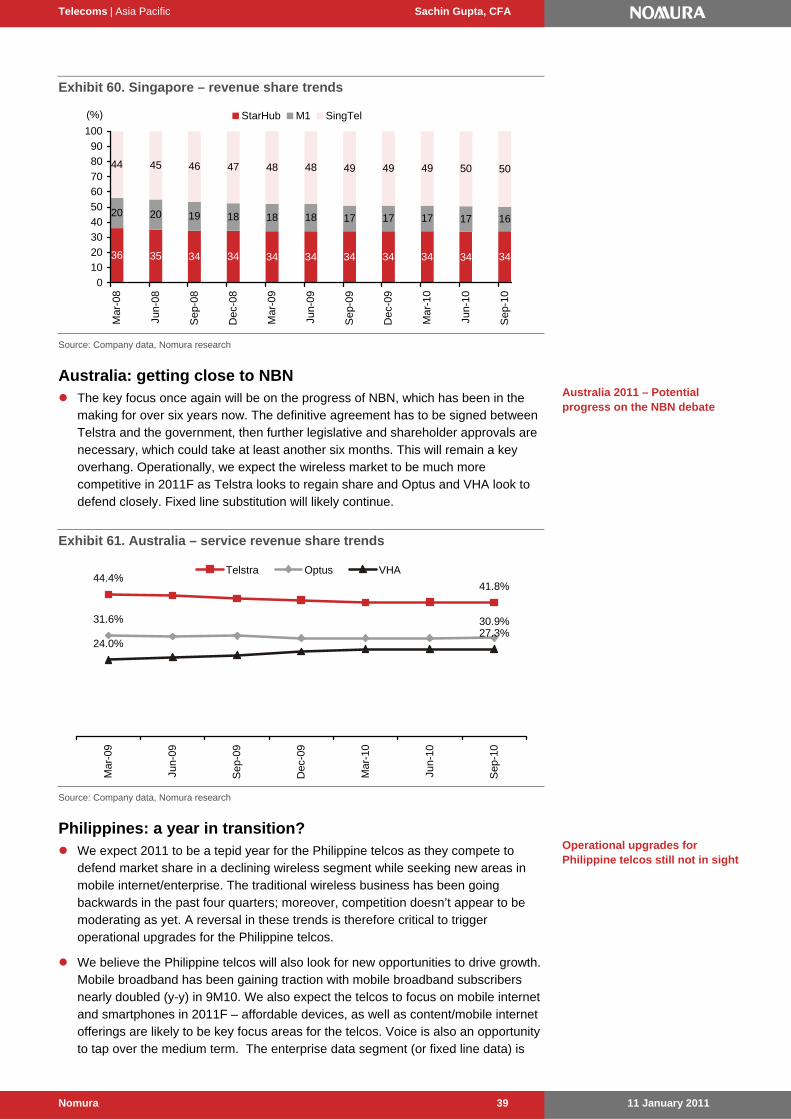
Singapore: rising competitive pressures In our FY10 outlook, we highlighted that 2010 would be about setting the
groundwork for 2011, and we have already seen the carriers boost their integrated offers this year in the NBN environment. M1 now offers fixed broadband and pay-TV services too. The differences in content quality and NBN coverage are likely to be addressed progressively and the imposition of cross-carriage of content could level the playing field further.
We see four key sector themes play out in FY11F: 1) the NBN rollout to become more ubiquitous, leading to further pressure on retail / enterprise APRUs; 2) rising smartphone and touchpad penetration could hurt operating margins; 3) potential legislation of cross-carriage of content; and 4) potential M&A with M1 in the picture. In terms of relative preference, we like M1 (also a regional pick) over SingTel (NEUTRAL) and StarHub (REDUCE).
We like M1 due to its potential to surprise on subscriber, revenue and earnings growth on the NBN platform. Execution will be the biggest challenge and no doubt the incumbents won’t cede share easily, but we think M1 will use a low-price strategy to win stand-alone broadband customers. Also, M&A potential continues remain for M1.
While SingTel remains a solid defensive franchise, we expect higher earnings volatility in all its associate markets, with India and Indonesia providing the biggest variability. We don't see Singapore or Optus losing a significant share in 2011F, but margins will remain under pressure. A large capital return in May-2011 will be a key event; otherwise, we don't see other key catalysts.
For StarHub, we think its strong outperformance in FY10 is unlikely to continue in FY11F. Its strong 7.5% dividend yield could be overshadowed by risks from: 1) the NBN impact on retail broadband prices; 2) risks to pay-TV subs from competition along with the possible impact of content cross-carriage regulations; and 3) expensive-looking valuations of 16.5x FY11F P/E. We do expect it to win an enterprise revenue share from NBN, but it is more likely to make meaningful contribution only FY12F onwards.
Singapore 2011- emerging risks and opportunities from NBN
Telecoms | Asia Pacific Sachin Gupta, CFA
11 January 2011 Nomura 39
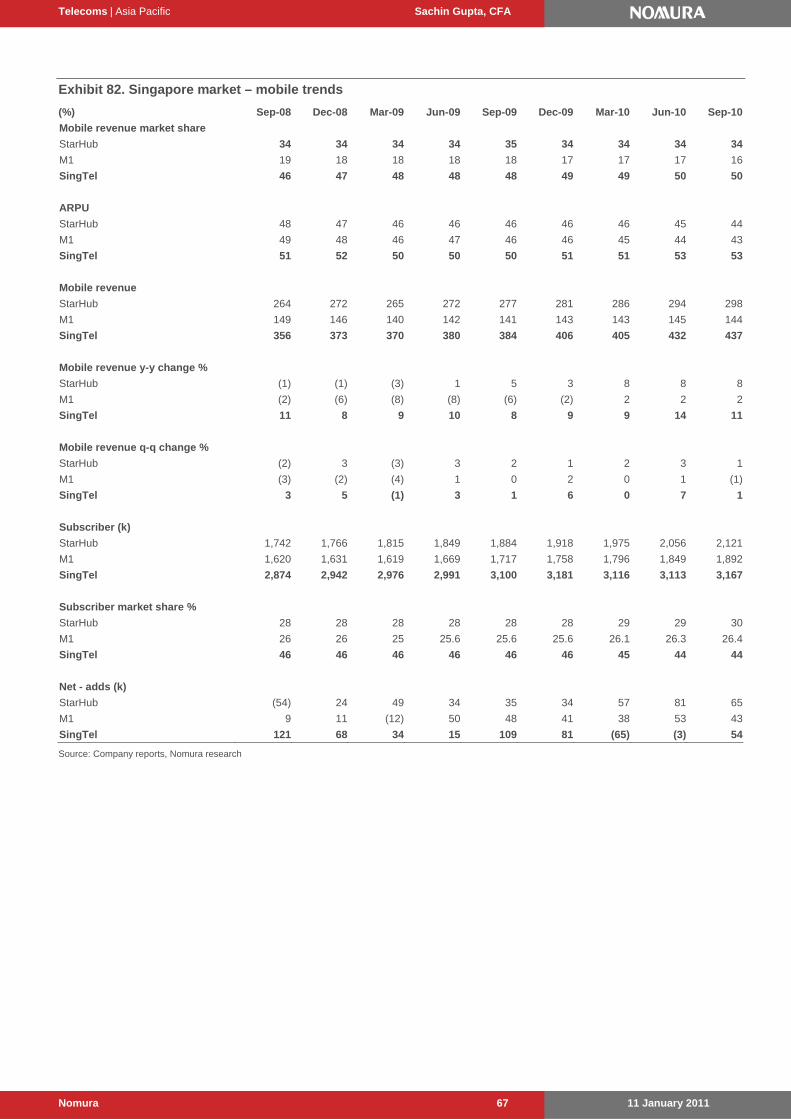
Exhibit 60. Singapore – revenue share trends
36 35 34 34 34 34 34 34 34 34 34
20 20 19 18 18 18 17 17 17 17 16
44 45 46 47 48 48 49 49 49 50 50
0
10
20
30
40
50
60
70
80
90
100
Mar
-08
Jun-
08
Sep
-08
Dec
-08
Mar
-09
Jun-
09
Sep
-09
Dec
-09
Mar
-10
Jun-
10
Sep
-10
StarHub M1 SingTel(%)
Source: Company data, Nomura research
Australia: getting close to NBN The key focus once again will be on the progress of NBN, which has been in the
making for over six years now. The definitive agreement has to be signed between Telstra and the government, then further legislative and shareholder approvals are necessary, which could take at least another six months. This will remain a key overhang. Operationally, we expect the wireless market to be much more competitive in 2011F as Telstra looks to regain share and Optus and VHA look to defend closely. Fixed line substitution will likely continue.
Exhibit 61. Australia – service revenue share trends
44.4%41.8%
31.6% 30.9%
24.0%27.3%
Mar
-09
Jun-
09
Sep
-09
Dec
-09
Mar
-10
Jun-
10
Sep
-10
Telstra Optus VHA
Source: Company data, Nomura research
Philippines: a year in transition? We expect 2011 to be a tepid year for the Philippine telcos as they compete to
defend market share in a declining wireless segment while seeking new areas in mobile internet/enterprise. The traditional wireless business has been going backwards in the past four quarters; moreover, competition doesn’t appear to be moderating as yet. A reversal in these trends is therefore critical to trigger operational upgrades for the Philippine telcos.
We believe the Philippine telcos will also look for new opportunities to drive growth. Mobile broadband has been gaining traction with mobile broadband subscribers nearly doubled (y-y) in 9M10. We also expect the telcos to focus on mobile internet and smartphones in 2011F – affordable devices, as well as content/mobile internet offerings are likely to be key focus areas for the telcos. Voice is also an opportunity to tap over the medium term. The enterprise data segment (or fixed line data) is
Australia 2011 – Potential progress on the NBN debate
Operational upgrades for Philippine telcos still not in sight
Telecoms | Asia Pacific Sachin Gupta, CFA
11 January 2011 Nomura 40
another growth area where we expect the telcos to focus on. The Philippine government is focusing on improving infrastructure and improving business confidence will likely offer a healthy backdrop for this segment.
Network is increasingly becoming a larger differentiator for this market– with the business mix moving away from the highly efficient SMS traffic to voice and data, telcos are coming with network strategies to manage traffic growth in an efficient fashion while offering acceptable services levels for medium- to higher-end customers. We expect Globe and PLDT to continue investing in their networks. We also expect Sun Cellular to expand to new regions in a bid to expand coverage.
Both Globe and PLDT have indicated that they may continue to invest in networks to cater to growth in voice and data traffic. With rising competition, rising capex and margin pressure, companies may chose to be more prudent and conserve cash rather than carry out capital management, we believe.
Exhibit 62. Industry growth – voice + SMS
(6)
(4)
(2)
0
2
4
6
1Q09 2Q09 3Q09 4Q09 1Q10 2Q10 3Q10
(%)
Note: based on data from PLDT, Globe Telecom and Sun Cellular
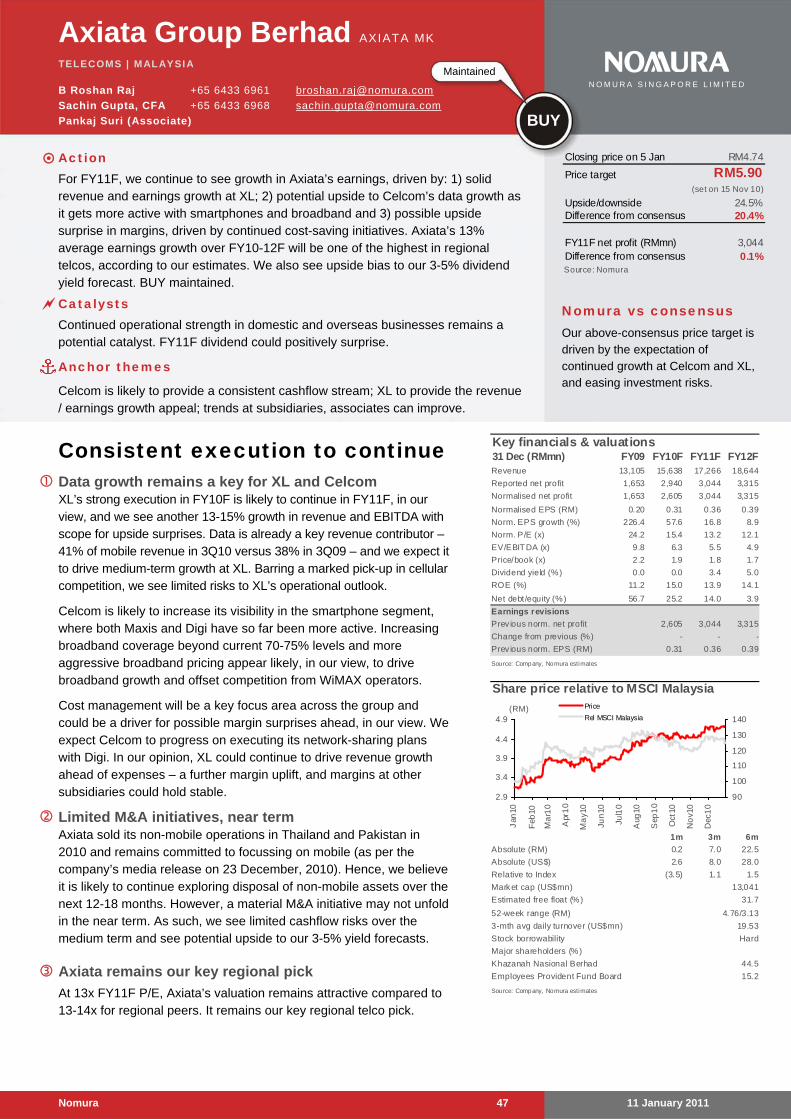
Key stock picks Axiata: Appealing growth with emerging yield profile For FY11F, Axiata remains our preferred pick due to its strong earnings outlook led by: 1) solid revenue and earnings growth at XL; 2) potential upside to Celcom’s data growth, as it gets more active with smartphones and broadband; and 3) possible upside surprise on margins, driven by continued cost saving initiatives. Axiata’s 13% average earnings growth over FY11F-12F will be one of the highest in regional telcos, as per our estimates. At the same time, we see upside bias to our 4-5% dividend yield forecast.
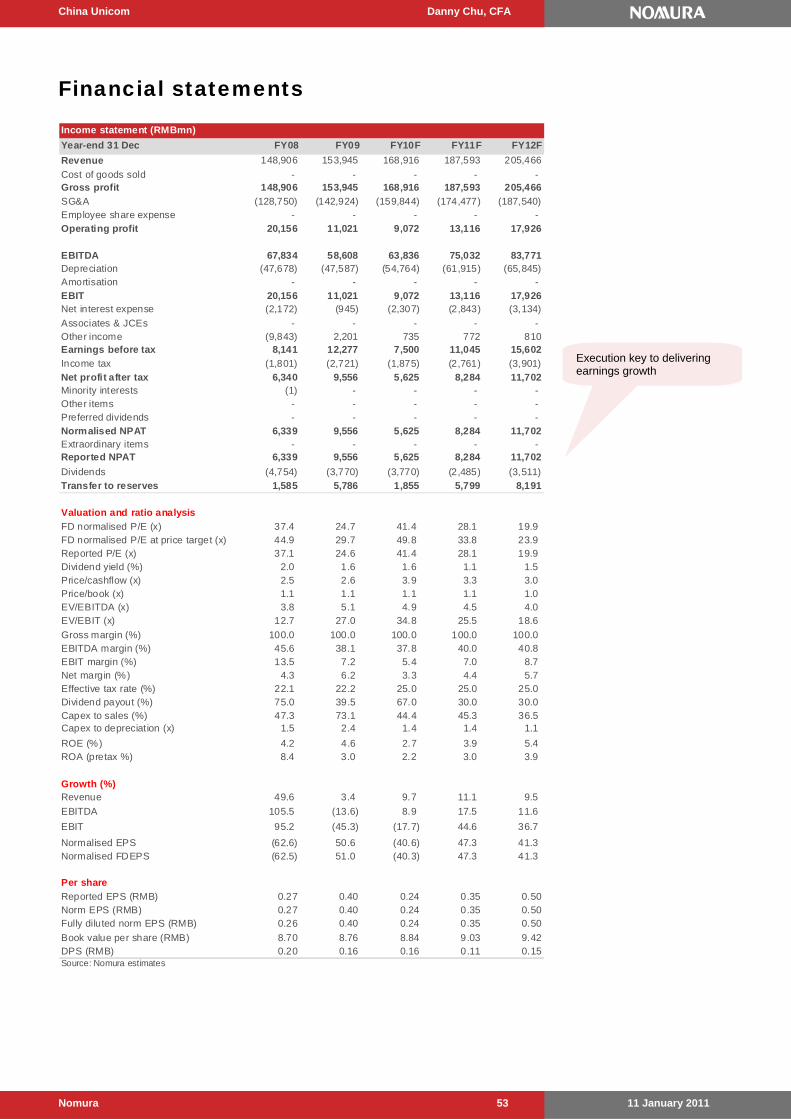
China Unicom: ‘i’- factor to deliver an edge We remain Bullish on China Unicom as: 1) it would be the major beneficiary of iPhone 4’s popularity in China; 2) the likely launch of iPad by Unicom and corresponding benefits from 3G net adds and data revenue; 3) a more comprehensive handsets offering on WCDMA platform; 4) steady launch of WCDMA smartphones targeted at the mass market segment; and 5) relatively high (> 40%) earnings growth in FY11. Our order of preference remains China Unicom (BUY) > China Mobile (BUY) > China Telecom (NEUTRAL).
M1: ‘Fixed’ NBN to provide operational flexibility We think M1 stands to gain the most from the NBN rollout and expect it to further boost its bundled offers. In 2011F, we expect M1 to surprise on net-adds in both wireless and broadband, and it could also win some share of the pay-TV customers later in the year. Execution will be the biggest challenge, in our view, and no doubt the incumbents won’t cede share easily, we think M1 will use a low-price strategy to win stand-alone broadband customers. Acquiring customers who are seeking bundled products will be a more difficult task. Either way, however, we see little revenue cannibalisation risks and incremental customers should add to the bottom-line.
SK Telecom: maintaining momentum with Smartphones SKT is our key pick on data upside on the back of rapidly increasing smartphone penetration in Korea. We expect SKT to emerge as a 100% pure smartphone play. For FY11F, we estimate 6% top-line growth and 17% OP growth, driven by lower smartphone-driven economics (high ARPU/lower subsidy). Besides, the shift in accounting standards to IFRS will likely provide additional earnings growth by approximately 10% for KT and SKT in 2011F, on our estimates. Also, the increasing premium for SKT’s ADR versus the underlying stock does suggest potential upside for the underlying to see increased interest in the near term. Latest changes in top management will likely be more positive for operational performance despite heightened overseas appetite. SKT has turned out to be the biggest beneficiary (2% 2010F EBIT accretive) of KCC’s latest interconnection rate adjustment.
AIS: Massive cash pile AIS has a solid financial position with a good track record of dividend payment. In 2009 and 2010, the company surprised the market by announcing special dividends of THB5/share and THB6/share, respectively. According to management, the timing of the
payment of the special dividends remains unclear. However, we understand that the next
special dividend payment will depend on the board’s plans for investment in 3G on the 2.1
GHz spectrum. We believe that significant investment on 3G is unlikely over the next 12 months, and thus AIS should continue to have excess cash to be paid out as special dividend. We expect DPS of THB9.5 for 2011, implying a dividend payout of 144%.
Axiata – solid growth + yield surprise
Unicom – iPhone & iPad advantage
M1 – NBN => broadband & Paytv opportunities
SKT – data upside from smartphones
AIS – insignificant 3G capex could lead to excess cash and special dividend
Telecoms | Asia Pacific Sachin Gupta, CFA
11 January 2011 Nomura 42
ZTE: opportunities from convergence, smartphones and 3G/ 4G We see upside to ZTE from three key drivers: 1) Network convergence, which is likely to increase the demand for optical fibre and in turn provides a sustainable revenue source for ZTE. We forecast ~35% y-y growth in ZTE’s optical and data communication revenue in FY11F. 2) Opportunity from entry-level smartphones, where ZTE can increase its relatively lower ASPs and penetrate the mid-range handset segment. By leveraging its strong ties with operators, we expect smartphone’s sales to contribute 15% of total handset and data card sales in FY11F, from less than 5% in FY10F. 3) Mobile: India’s 3G rollout and TD-LTE. Our initial analysis shows that over time, the TD-LTE capex in China will start improving, and partly compensate the decline in 3G capex. Incrementally, we note ZTE has secured several important contracts in the Indian 3G market, including RCOM and BSNL. We expect these overseas revenue contributions to offset the decline in China, and forecast 7% y-y growth in its wireless business in 2011F.
ZTE – Tapping demand from convergence, smartphones and 3G/4G rollouts
Telecoms | Asia Pacific Sachin Gupta, CFA
11 January 2011 Nomura 43
Appendix
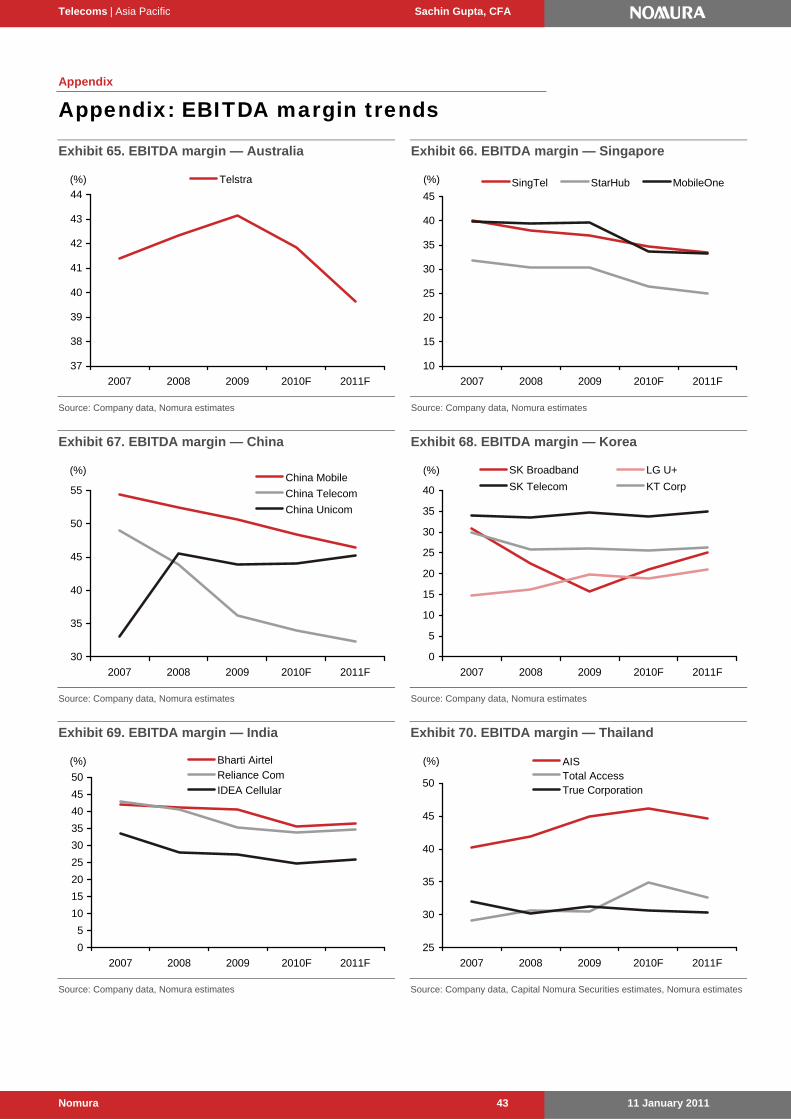
Appendix: EBITDA margin trends
Exhibit 65. EBITDA margin — Australia
37
38
39
40
41
42
43
44
2007 2008 2009 2010F 2011F
Telstra(%)
Source: Company data, Nomura estimates
Exhibit 66. EBITDA margin — Singapore
10
15
20
25
30
35
40
45
2007 2008 2009 2010F 2011F
SingTel StarHub MobileOne(%)
Source: Company data, Nomura estimates
Exhibit 67. EBITDA margin — China
30
35
40
45
50
55
2007 2008 2009 2010F 2011F
China Mobile
China Telecom
China Unicom
(%)
Source: Company data, Nomura estimates
Exhibit 68. EBITDA margin — Korea
0
5
10
15
20
25
30
35
40
2007 2008 2009 2010F 2011F
SK Broadband LG U+
SK Telecom KT Corp
(%)
Source: Company data, Nomura estimates
Exhibit 69. EBITDA margin — India
0
5
10
15
20
25
30
35
40
45
50
2007 2008 2009 2010F 2011F
Bharti Airtel
Reliance Com
IDEA Cellular
(%)
Source: Company data, Nomura estimates
Exhibit 70. EBITDA margin — Thailand
25
30
35
40
45
50
2007 2008 2009 2010F 2011F
AISTotal AccessTrue Corporation
(%)
Source: Company data, Capital Nomura Securities estimates, Nomura estimates
Telecoms | Asia Pacific Sachin Gupta, CFA
11 January 2011 Nomura 44
Exhibit 71. EBITDA margin — Indonesia
40
45
50
55
60
2007 2008 2009 2010F 2011F
PT XL Axiata
PT Indosat
PT Telkom
(%)
Source: Company data, Nomura estimates
Exhibit 72. EBITDA margin — Malaysia
0
10
20
30
40
50
60
2007 2008 2009 2010F 2011F
Digi.com Maxis Axiata TM(%)
Source: Company data, Nomura estimates
Exhibit 73. EBITDA margin — Philippines
48
50
52
54
56
58
60
62
2007 2008 2009 2010F 2011F
Globe Telecom PLDT(%)
Source: Company data, Nomura estimates
Exhibit 74. EBITDA margin — Taiwan
0
10
20
30
40
50
60
2007 2008 2009 2010F 2011F
Chunghwa TelecomFar EasToneTaiwan Mobile
(%)
Source: Company data, Nomura estimates
Telecoms | Asia Pacific Sachin Gupta, CFA
11 January 2011 Nomura 45
Appendix
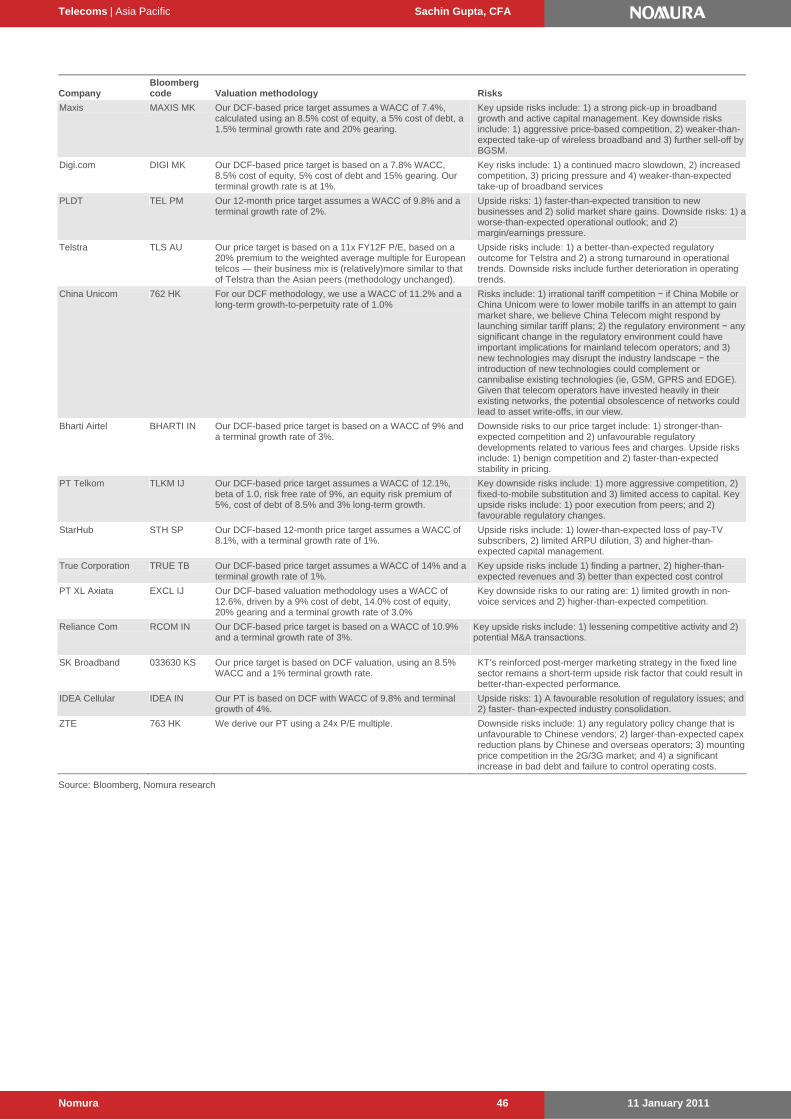
Valuation methodology and risks
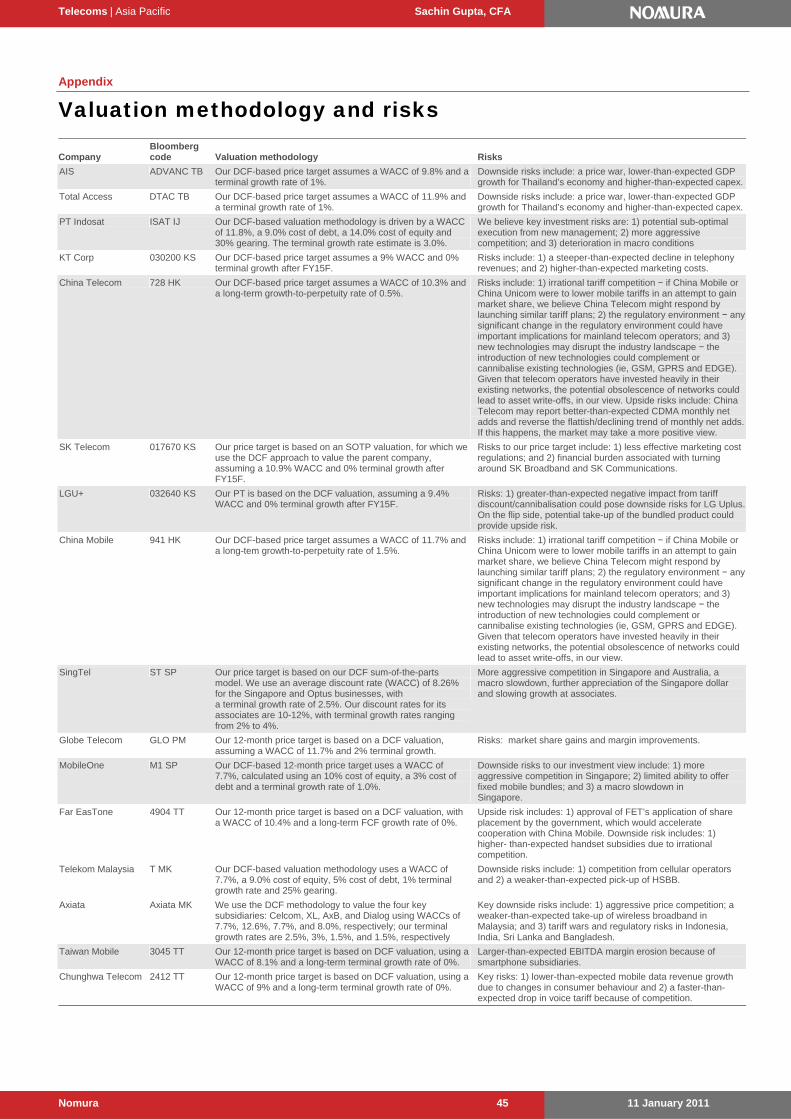
Company Bloomberg code Valuation methodology Risks
AIS ADVANC TB Our DCF-based price target assumes a WACC of 9.8% and a terminal growth rate of 1%.
Downside risks include: a price war, lower-than-expected GDP growth for Thailand’s economy and higher-than-expected capex.
Total Access DTAC TB Our DCF-based price target assumes a WACC of 11.9% and a terminal growth rate of 1%.
Downside risks include: a price war, lower-than-expected GDP growth for Thailand’s economy and higher-than-expected capex.
PT Indosat ISAT IJ Our DCF-based valuation methodology is driven by a WACC of 11.8%, a 9.0% cost of debt, a 14.0% cost of equity and 30% gearing. The terminal growth rate estimate is 3.0%.
We believe key investment risks are: 1) potential sub-optimal execution from new management; 2) more aggressive competition; and 3) deterioration in macro conditions
KT Corp 030200 KS Our DCF-based price target assumes a 9% WACC and 0% terminal growth after FY15F.
Risks include: 1) a steeper-than-expected decline in telephony revenues; and 2) higher-than-expected marketing costs.
China Telecom 728 HK Our DCF-based price target assumes a WACC of 10.3% and a long-term growth-to-perpetuity rate of 0.5%.
Risks include: 1) irrational tariff competition − if China Mobile or China Unicom were to lower mobile tariffs in an attempt to gain market share, we believe China Telecom might respond by launching similar tariff plans; 2) the regulatory environment − any significant change in the regulatory environment could have important implications for mainland telecom operators; and 3) new technologies may disrupt the industry landscape − the introduction of new technologies could complement or cannibalise existing technologies (ie, GSM, GPRS and EDGE). Given that telecom operators have invested heavily in their existing networks, the potential obsolescence of networks could lead to asset write-offs, in our view. Upside risks include: China Telecom may report better-than-expected CDMA monthly net adds and reverse the flattish/declining trend of monthly net adds. If this happens, the market may take a more positive view.
SK Telecom 017670 KS Our price target is based on an SOTP valuation, for which we use the DCF approach to value the parent company, assuming a 10.9% WACC and 0% terminal growth after FY15F.
Risks to our price target include: 1) less effective marketing cost regulations; and 2) financial burden associated with turning around SK Broadband and SK Communications.
LGU+ 032640 KS Our PT is based on the DCF valuation, assuming a 9.4% WACC and 0% terminal growth after FY15F.
Risks: 1) greater-than-expected negative impact from tariff discount/cannibalisation could pose downside risks for LG Uplus. On the flip side, potential take-up of the bundled product could provide upside risk.
China Mobile 941 HK Our DCF-based price target assumes a WACC of 11.7% and a long-tem growth-to-perpetuity rate of 1.5%.
Risks include: 1) irrational tariff competition − if China Mobile or China Unicom were to lower mobile tariffs in an attempt to gain market share, we believe China Telecom might respond by launching similar tariff plans; 2) the regulatory environment − any significant change in the regulatory environment could have important implications for mainland telecom operators; and 3) new technologies may disrupt the industry landscape − the introduction of new technologies could complement or cannibalise existing technologies (ie, GSM, GPRS and EDGE). Given that telecom operators have invested heavily in their existing networks, the potential obsolescence of networks could lead to asset write-offs, in our view.
SingTel ST SP Our price target is based on our DCF sum-of-the-parts model. We use an average discount rate (WACC) of 8.26% for the Singapore and Optus businesses, with a terminal growth rate of 2.5%. Our discount rates for its associates are 10-12%, with terminal growth rates ranging from 2% to 4%.
More aggressive competition in Singapore and Australia, a macro slowdown, further appreciation of the Singapore dollar and slowing growth at associates.
Globe Telecom GLO PM Our 12-month price target is based on a DCF valuation, assuming a WACC of 11.7% and 2% terminal growth.
Risks: market share gains and margin improvements.
MobileOne M1 SP Our DCF-based 12-month price target uses a WACC of 7.7%, calculated using an 10% cost of equity, a 3% cost of debt and a terminal growth rate of 1.0%.
Downside risks to our investment view include: 1) more aggressive competition in Singapore; 2) limited ability to offer fixed mobile bundles; and 3) a macro slowdown in Singapore.
Far EasTone 4904 TT Our 12-month price target is based on a DCF valuation, with a WACC of 10.4% and a long-term FCF growth rate of 0%.
Upside risk includes: 1) approval of FET’s application of share placement by the government, which would accelerate cooperation with China Mobile. Downside risk includes: 1) higher- than-expected handset subsidies due to irrational competition.
Telekom Malaysia T MK Our DCF-based valuation methodology uses a WACC of 7.7%, a 9.0% cost of equity, 5% cost of debt, 1% terminal growth rate and 25% gearing.
Downside risks include: 1) competition from cellular operators and 2) a weaker-than-expected pick-up of HSBB.
Axiata Axiata MK
We use the DCF methodology to value the four key subsidiaries: Celcom, XL, AxB, and Dialog using WACCs of 7.7%, 12.6%, 7.7%, and 8.0%, respectively; our terminal growth rates are 2.5%, 3%, 1.5%, and 1.5%, respectively
Key downside risks include: 1) aggressive price competition; a weaker-than-expected take-up of wireless broadband in Malaysia; and 3) tariff wars and regulatory risks in Indonesia, India, Sri Lanka and Bangladesh.
Taiwan Mobile 3045 TT Our 12-month price target is based on DCF valuation, using a WACC of 8.1% and a long-term terminal growth rate of 0%.
Larger-than-expected EBITDA margin erosion because of smartphone subsidiaries.
Chunghwa Telecom 2412 TT Our 12-month price target is based on DCF valuation, using a WACC of 9% and a long-term terminal growth rate of 0%.
Key risks: 1) lower-than-expected mobile data revenue growth due to changes in consumer behaviour and 2) a faster-than-expected drop in voice tariff because of competition.
Telecoms | Asia Pacific Sachin Gupta, CFA
11 January 2011 Nomura 46
Company Bloomberg code Valuation methodology Risks
Maxis MAXIS MK Our DCF-based price target assumes a WACC of 7.4%, calculated using an 8.5% cost of equity, a 5% cost of debt, a 1.5% terminal growth rate and 20% gearing.
Key upside risks include: 1) a strong pick-up in broadband growth and active capital management. Key downside risks include: 1) aggressive price-based competition, 2) weaker-than-expected take-up of wireless broadband and 3) further sell-off by BGSM.
Digi.com DIGI MK Our DCF-based price target is based on a 7.8% WACC, 8.5% cost of equity, 5% cost of debt and 15% gearing. Our terminal growth rate is at 1%.
Key risks include: 1) a continued macro slowdown, 2) increased competition, 3) pricing pressure and 4) weaker-than-expected take-up of broadband services
PLDT TEL PM Our 12-month price target assumes a WACC of 9.8% and a terminal growth rate of 2%.
Upside risks: 1) faster-than-expected transition to new businesses and 2) solid market share gains. Downside risks: 1) a worse-than-expected operational outlook; and 2) margin/earnings pressure.
Telstra TLS AU Our price target is based on a 11x FY12F P/E, based on a 20% premium to the weighted average multiple for European telcos — their business mix is (relatively)more similar to that of Telstra than the Asian peers (methodology unchanged).
Upside risks include: 1) a better-than-expected regulatory outcome for Telstra and 2) a strong turnaround in operational trends. Downside risks include further deterioration in operating trends.
China Unicom 762 HK For our DCF methodology, we use a WACC of 11.2% and a long-term growth-to-perpetuity rate of 1.0%
Risks include: 1) irrational tariff competition − if China Mobile or China Unicom were to lower mobile tariffs in an attempt to gain market share, we believe China Telecom might respond by launching similar tariff plans; 2) the regulatory environment − any significant change in the regulatory environment could have important implications for mainland telecom operators; and 3) new technologies may disrupt the industry landscape − the introduction of new technologies could complement or cannibalise existing technologies (ie, GSM, GPRS and EDGE). Given that telecom operators have invested heavily in their existing networks, the potential obsolescence of networks could lead to asset write-offs, in our view.
Bharti Airtel BHARTI IN Our DCF-based price target is based on a WACC of 9% and a terminal growth rate of 3%.
Downside risks to our price target include: 1) stronger-than-expected competition and 2) unfavourable regulatory developments related to various fees and charges. Upside risks include: 1) benign competition and 2) faster-than-expected stability in pricing.
PT Telkom TLKM IJ Our DCF-based price target assumes a WACC of 12.1%, beta of 1.0, risk free rate of 9%, an equity risk premium of 5%, cost of debt of 8.5% and 3% long-term growth.
Key downside risks include: 1) more aggressive competition, 2) fixed-to-mobile substitution and 3) limited access to capital. Key upside risks include: 1) poor execution from peers; and 2) favourable regulatory changes.
StarHub STH SP Our DCF-based 12-month price target assumes a WACC of 8.1%, with a terminal growth rate of 1%.
Upside risks include: 1) lower-than-expected loss of pay-TV subscribers, 2) limited ARPU dilution, 3) and higher-than-expected capital management.
True Corporation TRUE TB Our DCF-based price target assumes a WACC of 14% and a terminal growth rate of 1%.
Key upside risks include 1) finding a partner, 2) higher-than-expected revenues and 3) better than expected cost control
PT XL Axiata EXCL IJ Our DCF-based valuation methodology uses a WACC of 12.6%, driven by a 9% cost of debt, 14.0% cost of equity, 20% gearing and a terminal growth rate of 3.0%
Key downside risks to our rating are: 1) limited growth in non-voice services and 2) higher-than-expected competition.
Reliance Com RCOM IN Our DCF-based price target is based on a WACC of 10.9% and a terminal growth rate of 3%.
SK Broadband 033630 KS Our price target is based on DCF valuation, using an 8.5% WACC and a 1% terminal growth rate.
KT’s reinforced post-merger marketing strategy in the fixed line sector remains a short-term upside risk factor that could result in better-than-expected performance.
IDEA Cellular IDEA IN Our PT is based on DCF with WACC of 9.8% and terminal growth of 4%.
Upside risks: 1) A favourable resolution of regulatory issues; and 2) faster- than-expected industry consolidation.
ZTE 763 HK We derive our PT using a 24x P/E multiple. Downside risks include: 1) any regulatory policy change that is unfavourable to Chinese vendors; 2) larger-than-expected capex reduction plans by Chinese and overseas operators; 3) mounting price competition in the 2G/3G market; and 4) a significant increase in bad debt and failure to control operating costs.
Consistent execution to continue Data growth remains a key for XL and Celcom
XL’s strong execution in FY10F is likely to continue in FY11F, in our view, and we see another 13-15% growth in revenue and EBITDA with scope for upside surprises. Data is already a key revenue contributor – 41% of mobile revenue in 3Q10 versus 38% in 3Q09 – and we expect it to drive medium-term growth at XL. Barring a marked pick-up in cellular competition, we see limited risks to XL’s operational outlook.
Celcom is likely to increase its visibility in the smartphone segment, where both Maxis and Digi have so far been more active. Increasing broadband coverage beyond current 70-75% levels and more aggressive broadband pricing appear likely, in our view, to drive broadband growth and offset competition from WiMAX operators.
Cost management will be a key focus area across the group and could be a driver for possible margin surprises ahead, in our view. We expect Celcom to progress on executing its network-sharing plans with Digi. In our opinion, XL could continue to drive revenue growth ahead of expenses – a further margin uplift, and margins at other subsidiaries could hold stable.
Limited M&A initiatives, near term Axiata sold its non-mobile operations in Thailand and Pakistan in 2010 and remains committed to focussing on mobile (as per the company’s media release on 23 December, 2010). Hence, we believe it is likely to continue exploring disposal of non-mobile assets over the next 12-18 months. However, a material M&A initiative may not unfold in the near term. As such, we see limited cashflow risks over the medium term and see potential upside to our 3-5% yield forecasts.
Axiata remains our key regional pick
At 13x FY11F P/E, Axiata’s valuation remains attractive compared to 13-14x for regional peers. It remains our key regional telco pick.
Upside/downside 24.5%Difference from consensus 20.4%
FY11F net profit (RMmn) 3,044Difference from consensus 0.1%Source: Nomura
Nomura vs consensus Our above-consensus price target is driven by the expectation of continued growth at Celcom and XL, and easing investment risks.
Maintained
BUY
N O M U R A S I N G A P O R E L I M I T E D
Action For FY11F, we continue to see growth in Axiata’s earnings, driven by: 1) solid
revenue and earnings growth at XL; 2) potential upside to Celcom’s data growth as it gets more active with smartphones and broadband and 3) possible upside surprise in margins, driven by continued cost-saving initiatives. Axiata’s 13% average earnings growth over FY10-12F will be one of the highest in regional telcos, according to our estimates. We also see upside bias to our 3-5% dividend yield forecast. BUY maintained.
Catalysts Continued operational strength in domestic and overseas businesses remains a
potential catalyst. FY11F dividend could positively surprise.
Anchor themes
Celcom is likely to provide a consistent cashflow stream; XL to provide the revenue / earnings growth appeal; trends at subsidiaries, associates can improve.
As part of our effort to better understand Unicom’s latest momentum in adding 3G mobile subscribers, we visited Shenzhen (Guangdong province) during the Christmas rush. We were encouraged to see: 1) Unicom still signing up new 3G mobile subs with respectable ARPUs; 2) a less severe-than-before iPhone 4 shortage in Guangdong; 3) Unicom offering 14 smartphone models at the RMB1,000-level in Guangdong; and 4) increased customer traffic at Unicom’s shops.
Need to promote user experience of Apple products on WCDMA network
Many mobile subscribers on the mainland have yet to fully realise the true performance of the iPhone 4 and the 3G iPad, given that so far this can only be done on Unicom’s WCDMA (3G) network. We expect Unicom to invest resources (ie, advertising, consumer education) to reinforce this message to consumers, so as to encourage more mainland mobile subscribers to join its 3G network.
Recent tariff plan changes bode well
Unicom has made some changes to its 3G tariff plans by introducing a RMB48 monthly plan. In our view, the key takeaways from Unicom’s recent revision of its 3G monthly subscription plans are: 1) management’s timely response to a fast-changing operating environment; and 2) management’s heightened commitment to improve and strengthen the operational/financial results of its 3G business.
Reaffirming BUY
China Unicom shares are trading at 28.1x FY11F P/E. We maintain our BUY rating and price target of HK$13.50. We use a WACC of 11.2% and a long-term growth-to-perpetuity rate of 1.0% to derive our price target.
Key financials & valuations31 Dec (RMBmn) FY09 FY10F FY11F FY12F
Revenue 153,945 168,916 187,593 205,466
Reported net profit 9,556 5,625 8,284 11,702
Normalised net profit 9,556 5,625 8,284 11,702
Normalised EPS (RMB) 0.40 0.24 0.35 0.50
Norm. EPS growth (%) 50.6 (40.6) 47.3 41.3
Norm. P/E (x) 24.7 41.4 28.1 19.9
EV/EBITDA (x) 5.1 4.9 4.5 4.0
Price/book (x) 1.1 1.1 1.1 1.0
Dividend yield (%) 1.6 1.6 1.1 1.5
ROE (%) 4.6 2.7 3.9 5.4
Net debt/equity (%) 30.5 38.6 46.5 44.5
Earnings revisions
Previous norm. net profit 5,625 8,284 11,702
Change from previous (%) - - -
Previous norm. EPS (RMB) 0.24 0.35 0.50
Source: Company, Nomura estimates
Share price relative to MSCI China
1m 3m 6m 5.8 (2.4) 4.3
5.7 (2.6) 4.5
5.4 (4.3) (12.0)
Easy
Source: Company, Nomura estimates
34,374
29.6
12.16/8.31
41.92
Absolute (HK$)
Absolute (US$)
Relative to Index
Estimated free float (%)
Market cap (US$mn)
8.4
Major shareholders (%)
Unicom Group 71.0
52-week range (HK$)
3-mth avg daily turnover (US$mn)
Telefonica
Stock borrowability
8
9
10
11
12
13
Jan1
0
Feb
10
Mar
10
Ap
r10
May
10
Jun1
0
Jul1
0
Au
g10
Sep
10
Oct
10
No
v10
Dec
10
80
90
100
110
120
130
Price
R el MSCI China(HK$)
Closing price on 5 Jan HK$11.24
Price target HK$13.50(set on 13 Oct 10)
Upside/downside 20.1%Difference from consensus 23.2%
FY11F net profit (RMBmn) 8,284Difference from consensus 9.9%
Source: Nomura
Nomura vs consensus We expect a better-than-expected improvement in the company’s 3G business.
Maintained
BUY
N O M U R A I N T E R N A T I O N A L ( H K ) L I M I T E D
Action We reaffirm our bullish stance on China Unicom following our latest trip to
Shenzhen, mainly on: 1) newly signed 3G subs with decent ARPU levels; 2) the abundance of RMB1,000-priced smartphones, which should capture demand in the switch to 3G; 3) increased customer traffic at Unicom shops. We take these as a sign of gradual improvement for the company. Any share price weakness would present an even stronger buying opportunity, in our view. Reiterate BUY.
Catalysts Higher monthly net adds, shorter time to generate synergies from fixed-mobile
convergence and stable growth in fixed-line revenue are share price catalysts.
Anchor themes
With the 3G rollout moving towards completion and improving availability of 3G handsets, we expect Chinese telecom operators to launch different campaigns to gradually migrate 2G subscribers onto a 3G platform.
China Unicom Danny Chu, CFA
11 January 2011 Nomura 52
Drilling down
Catalysts On a short-term basis (three months), we believe catalysts for China Unicom include:
Monthly net adds, which reflect the company’s ability to win market share;
4Q10F results, which should show progress in business integration;
iPhone subscriptions, which reflect the company’s ability to attract data-savvy subscribers and improve its blended ARPU;
The ability to contain selling and marketing expenses, while growing 3G business.
On a longer-term basis (12 months), we believe catalysts for China Unicom include:
ARPU of its mobile subscriber base, as this reflects the company’s ability to attract high-ARPU subscribers;
FY10F results, which should show financial and operational KPIs;
China Unicom’s brand perception among consumers, as this affects subscriber take-up and the customer profile;
A regulatory roadmap drawn out by the Ministry of Industry and Information Technology (China’s telecom regulator).
Exhibit 81. Recent publications on China telecom services sector
Date Title of publication
1 Dec, 2010 China Mobile: Postcards from Shanghai & Beijing
17 Nov, 2010 China Mobile: Reporting live from MAC 2010
29 Oct, 2010 China Mobile: Scale of TD-LTE trial may exceed initial expectations
20 Oct, 2010 China Mobile: Review of 3Q10 results
13 Oct, 2010 China Mobile: Man vs machine
29 Sep, 2010 China Mobile: Happiness (LePhone) coming to TD-SCDMA; 3Q10 preview
8 Sep, 2010 China Mobile: Quick thoughts on placement
23 Aug, 2010 China Mobile: Friday morning with management
19 Aug, 2010 China Mobile: Elephant moving forward; one more new TD handset from Nokia
25 Nov, 2010 China Telecom: Postcards from Shanghai & Beijing
28 Oct, 2010 China Telecom: 3Q10 review – “CDMA express train” lost some steam
15 Oct, 2010 China Telecom: Preview of 3Q10 results
13 Oct, 2010 China Telecom: Catching breath before another dash
13 Sep, 2010 China Telecom: Back to school
27 Aug, 2010 China Telecom: Thursday morning with management
25 Aug, 2010 China Telecom: Better-than-expected results; investing for the future
26 Nov, 2010 China Unicom: All they want for X'mas is … iPhone 4 or iPad
15 Nov, 2010 China Unicom: Benefits from iPhone 4, iPad and smartphone not fully reflected
29 Oct, 2010 China Unicom: Driving a Ferrari (iPhone 4) through highway or local?
13 Oct, 2010 China Unicom: Revenge of the fallen
27 Aug, 2010 China Unicom: 1H10 review: Spring has not arrived yet
2 Dec, 2010 ZTE: Three drivers in 2011F
29 Nov, 2010 Telecoms | China: Monthly industry data
With NBN, the going gets better Steady progress on NBN
In 2H10, M1 introduced relatively aggressive broadband plans and closed the year with its preliminary pay-TV services, indicating the company’s steady progress on NBN-based opportunities. We recognise that M1’s inexperience in bundled services could make it difficult to acquire subscribers seeking bundled products. However, even minimal progress on this front will be revenue and earnings accretive, in our view, given limited risk of cannibalisation.
Reasonable operational trends in 9M10
M1 recorded a reasonable performance for 9M10, with improvement in its revenue market share by 110bps to 10% and its cellular subscriber share by 80bps to 26%. Also, the company has been relatively more aggressive than peers with its smartphone strategy, letting go of near-term margins to drive longer-term data revenue upside and improving subscriber stickiness over time.
Potential M&A?
At 13.5x FY11F P/E, M1 is trading at a discount to its regional peers. Its 8% FCF yield also suggests upside risks to its 6% ordinary yield. We see a strong cash outlook for regional telcos, and balance sheets appear to be under-geared at an average 1.1x net debt/EBITDA. With a moderating capex and revenue outlook, we think consolidation could be a key theme over the medium term.
In Singapore, we don't expect in-market consolidation, and there could be regulatory hurdles, too. However, M1 is likely to be on the radar of other suitors. Keppel and SPH collectively hold about 34%; Keppel had previously stated its intent to shed non-core assets. We believe M1’s current share price does not factor M&A upside — a possible catalyst. Our new revenue and earnings forecasts are 1-2% higher, driven by higher ARPU estimates. Our revised price target is S$2.90. Maintain BUY.
Upside/downside 20.3%Difference from consensus 17.9%
FY10F net profit (S$mn) 153.6Difference from consensus -2.5%Source: Nomura
Nomura vs consensus Our price target is ahead of consensus as we take into account potential upside from NBN.
Maintained
BUY
N O M U R A S I N G A P O R E L I M I T E D
Action We expect 2011 to see M1 gain traction in building its integrated fixed-wireless
customer base, leveraging from the NBN rollout. Late last year, it launched its first set of retail broadband and pay-TV offers. In the coming months, we look for more aggressive retail offers and M1 also stands to benefit from content cross-carriage regulations. Overall, we see upside risks to our revenue and EBITDA CAGR forecasts of 2-4% for FY10-12F. Dividend yield of 6% remains appealing in a regional context as does its M&A potential. Maintain BUY.
Catalysts Improvement in operational trends, better-than-expected revenue and earnings
upside from NBN are potential catalysts.
Anchor themes
Competition in mobile/ broadband/ pay-TV is strong, but focus on cost efficiencies should result in stable margins. The impact of fibre rollout is uncertain.
New CEO Ha, Sung Min had a good record on dividend policy during his tenure as CFO (FY04-FY07). Co-CEO Seo, Jin Woo will likely focus on the platform business and overseas investment strategies.
Interconnection rate adjustment favourable to SKT
KCC finalised the interconnection rate adjustment for 2010/11 in late December, significantly narrowing the rate gap between SKT and KT/LGU+. We expect SKT’s net interconnection profit to surge to W80bn in 4Q10F (or an addition of W40bn on a full-year basis in FY10F from FY09). KCC’s decision to equalise interconnection rates in FY13 clearly implies the end of asymmetric regulation, in our view.
Improving marketing costs control in 2011F
SKT’s marketing costs should drop significantly in 4Q10F on lower subsidies for surging smartphone subscriptions and subdued MNP. KCC’s guideline-based marketing costs-to-sales ratio should drop to 20.6% in 4Q10F from 23.9% in 3Q10. We believe SKT’s improved marketing costs control will be intact throughout 2011 thanks to an increasing percentage of smartphone out of total new subscriptions.
10% 2011F EPS upside on IFRS adoption
SKT’s adoption of IFRS accounting is likely to reduce depreciation costs by approximately W200bn in 2011, which offers approximately 10% potential upside to our current 2011F EPS of W20,815.
Attractive valuation
We remain positive on its significant earnings growth and share buybacks in 2011. SKT is trading at 7.3x FY11F P/E, a historical trough valuation (about a 40% discount to regional peers and the KOSPI), which we believe is unjustified.
Upside/downside 29.3%Difference from consensus 4.7%
FY11F net profit (Wbn) 1,681Difference from consensus -2.8%Source: Nomura
Nomura vs consensus We are more bullish on SKT’s potential benefits (ie, ARPU expansion/profit growth) from rapidly increasing smartphone penetration.
Maintained
BUY
N O M U R A F I N A N C I A L I N V E S T M E N T ( K O R E A ) C O L T D
Action We remain positive over SKT’s smartphone-driven profitable growth story in 2011.
Changes in top management will likely be more positive for operational performance, despite heightened overseas appetite. We remain upbeat about its control over marketing costs in 2011, expecting improvement similar to the 4Q10 trend. SKT has turned out to be the biggest beneficiary (2% FY10F EBIT accretive) of the KCC’s latest interconnection rate adjustment.
Catalysts Sustainability of the >W55,000 unlimited data plan remains a key share price
driver. The potential launch of new iPhones, if any, would also serve as a catalyst.
Anchor themes
We are bullish; smartphone-driven data revenue growth should accelerate over the next two years with a rapid shift into mass smartphone market penetration.
Valuation methodology and risks Our price target of W223,000 is based on a SOTP methodology, for which we use a DCF approach to value the parent company with 10.9% WACC and 0% terminal growth after FY15F.
Risks to our price target include less effective marketing cost regulations, coupled with the financial burden associated with turning around SK Broadband and SK Communications.
SK Telecom Stanley Yang
11 January 2011 Nomura 60
Revenue growth driven by increasing smartphone penetration
Activity (days)Days receivable 83.7 96.4 100.2 72.9 41.1 Days inventory na na na na naDays payable na na na na naCash cycle na na na na naSource: Nomura estimates
Three drivers in 2011F Network convergence: sustainable revenue driver
ZTE is the second largest optical vendor in China with a 22% market share in 1Q10. We expect the network convergence policy to generate sustainable demand for optical network equipment in the coming years, and believe ZTE can use its strong product portfolio and customer relations to capitalize on the business opportunities. We forecast ~35% y-y growth in ZTE’s optical and data communication revenue in FY11F.
Entry-level smartphone: chance to step up
ZTE is the fourth largest handset vendor by shipments in 3Q10, per iSuppli, but it is mainly a low-end vendor, with an ASP less than 1/4 the global average. We believe the emergence of entry-level smartphones in China and globally gives ZTE an opportunity to raise its ASP and penetrate the mid-range handset market. By leveraging its strong ties with operators, we expect smartphone sales to contribute 15% of total handset and data card sales in FY11F, from less than 5% in FY10F.
Mobile: India 3G rollout and TD-LTE
Our initial analysis shows the TD-LTE capex will be around RMB42bn over the next few years assuming similar coverage as TD-SCDMA today, but its contribution to ZTE’s FY11F revenue is still too small to compensate for the decline in 3G, we believe. On the other hand, we note ZTE has secured several important contacts in the Indian 3G market, including Reliance Communications and BSNL. We expect these overseas revenue contributions to offset the decline in China, and forecast 7% y-y growth in its wireless business in 2011.
Maintain BUY; price target of HK$36
We call BUY for ZTE with PT of HK$36 based on 24x P/E of FY11 EPS RMB$1.29 (HK$1.50).
Key financials & valuations31 Dec (RMBmn) FY09 FY10F FY11F FY12F
Revenue 60,273 70,500 86,500 107,300
Reported net profit 2,458 2,900 3,700 4,600
Normalised net profit 2,458 2,900 3,700 4,600
Normalised EPS (RMB) 0.89 1.01 1.29 1.60
Norm. EPS growth (%) 41.2 13.0 27.6 24.3
Norm. P/E (x) 31.2 26.0 19.3 15.5
EV/EBITDA (x) 24.6 19.9 16.0 13.3
Price/book (x) 3.0 4.0 3.2 2.8
Dividend yield (%) 1.1 0.9 1.2 1.4
ROE (%) 15.8 16.1 18.0 19.3
Net debt/equity (%) net cash net cash net cash net cash
Earnings revisions
Previous norm. net profit 2,900 3,700 4,600
Change from previous (%) - - -
Previous norm. EPS (RMB) 1.01 1.29 1.60
Source: Company, Nomura estimates
Share price relative to MSCI China
1m 3m 6m
3.4 3.4 38.5
3.3 3.2 38.8
2.9 1.5 22.2
Hard
Source: Company, Nomura estimates
11,748
18.3
34.87/22.65
19.95
Absolute (HK$)
Absolute (US$)
Relative to Index
Estimated free float (%)
Market cap (US$mn)
18.3
Major shareholders (%)
Shenzhen Zhongxingxin 32.5
52-week range (HK$)
3-mth avg daily turnover (US$mn)
HKSCC Nominees Limited
Stock borrowability
212325272931333537
Jan
10
Fe
b10
Ma
r10
Ap
r10
May
10
Jun1
0
Jul1
0
Au
g1
0
Se
p10
Oct
10
No
v10
De
c10
707580859095100105110
Price
Rel MSCI China(HK$)
Closing price on 5 Jan HK$31.85
Price target HK$36.00(set on 2 Dec 10)
Upside/downside 13.0%Difference from consensus 16.8%
FY11F net profit (RMBmn) 3,700Difference from consensus -5.2%Source: Nomura
Nomura vs consensus FY11F earnings are -2% but rev. is +3% vs consensus. This reflects our view that low-margin smartphone business will grow faster than the market expects.
Maintained
BUY
N O M U R A I N T E R N A T I O N A L ( H K ) L I M I T E D
Action Looking to 2011F, we believe the network convergence policy in China, 3G network
rollout in India and emergence of entry-level smartphones will drive ZTE’s revenue and earnings growth to offset weakening 3G equipment demand in China. We believe revenue from TD-LTE will remain small in FY11F, but is important to its long-term growth. Reaffirming BUY, with a price target of HK$36.
Catalysts Positive catalyst: further consolidation in the telecom equipment industry. Negative:
any regulatory policy change that is unfavourable to Chinese vendors.
Anchor themes
The convergence of the telecom, Internet and television networks is an element of China’s 12th Five-Year Plan. We believe this will spur both telecom and cable TV operators to accelerate optical-fibre network development, and benefit the whole optical network supplier chain in China.
ZTE Corp Leping Huang, PhD
11 January 2011 Nomura 63
Valuation methodology
We derive our PT using a 24x P/E multiple (unchanged). The stock has traded at 2.5x 12-month forward P/BV and 23x 12-month forward P/E on average since 2005. Since on our forecasts its net profit CAGR from FY10 to FY12F is higher (24%) than that from FY05 to FY09 (around 19%), we believe it is reasonable to apply a 24x P/E multiple to FY11F EPS of RMB1.29 (HK$1.50) to derive our price target of HK$36 per share.
Risks to our investment view
Downside risks include: 1) any regulatory policy change that is unfavourable to Chinese vendors; 2) larger-than-expected capex reduction plans by Chinese and overseas operators; 3) mounting price competition in the 2G/3G market; and 4) a significant increase in bad debt and failure to control operating costs.
Upside risks include: 1) a larger-than-expected volume of 3G handsets owing to operators’ active subsidy strategy; 2) further consolidation in the telecom equipment industry; 3) stronger-than-expected recovery in the overseas infrastructure market; and 4) margin strength and better cost control.
Action Last year we said that 2010 will be about 2011, and we have already seen the
carriers boost their integrated offers this year in the NBN environment. M1 now offers fixed broadband and pay-TV services too. The differences in content quality and NBN coverage will be addressed progressively and the imposition of cross-carriage of content could level the playing field further. Also watch for margin volatility from rising smart-phone/ touch-pad penetration along with the potential for M&A. M1 is our key pick in Singapore.
Catalysts Fixed broadband prices and net-add share, impact of smart-phones on margins,
capital management, and M&A.
Anchor themes
NBN will be a key focus across operators – better product variety, more bundles, and potential price pressure are likely as operators start to gain subscribers.
The year of the consumer Sector themes for 2011 – is M&A likely?
Key sector themes in 2011: 1) NBN rollout to become more ubiquitous leading to further pressure on retail / enterprise APRUs; 2) rising smart-phone and touch-pad penetration could hurt operating margins; 3) potential legislation of cross-carriage of content; and 4) potential M&A with M1 in the picture.
M1: is our key regional pick
In 2011, we expect M1 to surprise on net-adds in both wireless and broadband, and it could also win some share of the pay-TV customers later in the year. Execution will be the biggest challenge and no doubt the incumbents won’t cede share easily, but we think M1 will use a low-price strategy to win stand-alone broadband customers. Acquiring customers who are seeking bundled products will be a more difficult task. Either way, however, we see little revenue cannibalisation risks and incremental customers should add to the bottom line. Maintain BUY with a revised S$2.90 price target.
SingTel: a diversified beast with overhangs
While SingTel remains a solid defensive franchise, we expect higher earnings volatility in all its Associate markets, with India and Indonesia providing the biggest delta. We don't see Singapore or Optus losing significant share in 2011, but margins will remain under pressure. A large capital return in May-2011 will be a key event; otherwise, we don't see other catalysts to break the trading range of S$3.00-3.50. Maintain NEUTRAL with a revised PT of S$3.35 (from S$3.45).
StarHub: risks should outweigh the dividend appeal
It is difficult to see StarHub matching its strong outperformance of 2010 in 2011. Its strong 7.5% dividend yield could be overshadowed by earnings risks from: 1) NBN impact on retail broadband prices; 2) risks to pay-TV subs from competition along with the possible impact of content cross-carriage regulations; and 3) expensive-looking valuations of 16.5x FY11F P/E. We do expect it to win enterprise revenue share from NBN, but it is more likely to make meaningful contribution only from 2012F onwards. Maintain REDUCE with S$2.25 PT.
Stocks for action Our BUY for M1 is due to the potential revenue and earnings upside from NBN; Neutral for Singtel is due to limited near-term catalysts; and REDUCE for Starhub is on potential risks to its hubbing strategy, post EPL loss.
Action 2010 was disappointing for Philippine telcos, with operational downgrades for PLDT
and Globe, and the stocks underperforming the local index by an average of 47%. We don't think the worst is over yet, as we expect competition to intensify and data growth could adversely impact margins. We think 2011 is likely to be a transitional year rather than a transformational one, and faster expansion into new businesses could bear fruit beyond the next 12M. We downgrade the Philippine telco sector to Bearish, cut our rating on PLDT to NEUTRAL and maintain REDUCE on Globe.
Catalysts Stiffer competition and margin pressure are negative catalysts.
Anchor themes
BPO and broadband segment are key growth drivers, but competition and margin uncertainty persists.
Competitive headwinds Underperformance likely to continue in 2011F
Philippine telcos had a disappointing 2010, with several rounds of downgrades for PLDT and Globe, and both stocks down by an average of 7%, versus a 40% gain for the PSEi. Within the region, Philippine telcos ranked in the bottom quartile for 2010. The characteristics that once made these stocks appealing — namely, the benign duopolistic competition, relatively higher margins and yields, and capital management — now face strong headwinds. Competition has intensified, with Globe looking to regain share and Sun cementing its position with revenue share of 8% and generating ~30% margins. The outlook for incremental profitability is also challenging, in our view, as data is now the main driver. Ordinary yield of 6-8% for PLDT and Globe is reasonable, but we see some risks to capital management for PLDT.
Bearish sector outlook We downgrade the Philippine telco sector to Bearish in a regional context. We also lower our PLDT rating to NEUTRAL, but among domestic peers, continue to prefer it over Globe given: 1) its relatively better ability to defend share; 2) its network advantage and 3) its cost advantage which has helped to buffer earnings downgrades. Globe has begun to show signs of a turnaround and could surprise operationally, but we think earnings recovery is key.
More headwinds, few opportunities For the past four quarters, wireless revenue has declined at Globe and PLDT. This trend, combined with Globe’s ongoing refresh of its pre-paid offering, Sun’s potential coverage expansion, and SMC’s progress into the market, points to further competitive challenges in 2011, in our view. A stronger peso could also add to headwinds. That said, we remain optimistic on mobile Internet and broadband. Globe and PLDT are both focusing on smartphones and this could lead to handset alliances and other tie-ups to boost smartphone adoption. Corporate data/ enterprise connectivity remains a growth opportunity as the Philippines becomes an important destination for BPOs. Government efforts to improve infrastructure and improving business confidence in the country also bode well.
Stocks for action We downgrade PLDT to NEUTRAL and rate Globe as REDUCE.
BEARISH
Price Price
Stock Ticker Rating (5 Dec) target
PLDT TEL PM NEUTRAL 2,532 2,760
Globe GLO PM REDUCE 821 760
Local currency: PHP; Pricing as of 5 Jan.
11 January 2011 Nomura 69
Telecoms | Asia Pacific Sachin Gupta, CFA
Any Authors named on this report are Research Analysts unless otherwise indicated
Analyst Certification
We, Sachin Gupta, Danny Chu, Stanley Yang, Leping Huang, B. Roshan Raj, Neeraja Natarajan, Pankaj Suri and Eric Minuh Cha, hereby certify (1) that the views expressed in this Research report accurately reflect our personal views about any or all of the subject securities or issuers referred to in this Research report, (2) no part of our compensation was, is or will be directly or indirectly related to the specific recommendations or views expressed in this Research report and (3) no part of our compensation is tied to any specific investment banking transactions performed by Nomura Securities International, Inc., Nomura International plc or any other Nomura Group company.
Important Disclosures Conflict-of-interest disclosures Important disclosures may be accessed through the following website: http://www.nomura.com/research/pages/disclosures/disclosures.aspx . If you have difficulty with this site or you do not have a password, please contact your Nomura Securities International, Inc. salesperson (1-877-865-5752) or email [email protected] for assistance. Online availability of research and additional conflict-of-interest disclosures Nomura Japanese Equity Research is available electronically for clients in the US on NOMURA.COM, REUTERS, BLOOMBERG and THOMSON ONE ANALYTICS. For clients in Europe, Japan and elsewhere in Asia it is available on NOMURA.COM, REUTERS and BLOOMBERG. Important disclosures may be accessed through the left hand side of the Nomura Disclosure web page http://www.nomura.com/research or requested from Nomura Securities International, Inc., on 1-877-865-5752. If you have any difficulties with the website, please email [email protected] for technical assistance. The analysts responsible for preparing this report have received compensation based upon various factors including the firm's total revenues, a portion of which is generated by Investment Banking activities. Industry Specialists identified in some Nomura International plc research reports are employees within the Firm who are responsible for the sales and trading effort in the sector for which they have coverage. Industry Specialists do not contribute in any manner to the content of research reports in which their names appear. Distribution of ratings (Global) Nomura Global Equity Research has 1937 companies under coverage. 48% have been assigned a Buy rating which, for purposes of mandatory disclosures, are classified as a Buy rating; 41% of companies with this rating are investment banking clients of the Nomura Group*. 38% have been assigned a Neutral rating which, for purposes of mandatory disclosures, is classified as a Hold rating; 50% of companies with this rating are investment banking clients of the Nomura Group*. 12% have been assigned a Reduce rating which, for purposes of mandatory disclosures, are classified as a Sell rating; 13% of companies with this rating are investment banking clients of the Nomura Group*. As at 31 December 2010. *The Nomura Group as defined in the Disclaimer section at the end of this report. Explanation of Nomura's equity research rating system in Europe, Middle East and Africa, US and Latin America for ratings published from 27 October 2008 The rating system is a relative system indicating expected performance against a specific benchmark identified for each individual stock. Analysts may also indicate absolute upside to price target defined as (fair value - current price)/current price, subject to limited management discretion. In most cases, the fair value will equal the analyst's assessment of the current intrinsic fair value of the stock using an appropriate valuation methodology such as discounted cash flow or multiple analysis, etc. STOCKS A rating of 'Buy', indicates that the analyst expects the stock to outperform the Benchmark over the next 12 months. A rating of 'Neutral', indicates that the analyst expects the stock to perform in line with the Benchmark over the next 12 months. A rating of 'Reduce', indicates that the analyst expects the stock to underperform the Benchmark over the next 12 months. A rating of 'Suspended', indicates that the rating and target price have been suspended temporarily to comply with applicable regulations and/or firm policies in certain circumstances including when Nomura is acting in an advisory capacity in a merger or strategic transaction involving the company. Benchmarks are as follows: United States/Europe: Please see valuation methodologies for explanations of relevant benchmarks for stocks (accessible through the left hand side of the Nomura Disclosure web page: http://www.nomura.com/research);Global Emerging Markets (ex-Asia): MSCI Emerging Markets ex-Asia, unless otherwise stated in the valuation methodology. SECTORS A 'Bullish' stance, indicates that the analyst expects the sector to outperform the Benchmark during the next 12 months. A 'Neutral' stance, indicates that the analyst expects the sector to perform in line with the Benchmark during the next 12 months. A 'Bearish' stance, indicates that the analyst expects the sector to underperform the Benchmark during the next 12 months. Benchmarks are as follows: United States: S&P 500; Europe: Dow Jones STOXX 600; Global Emerging Markets (ex-Asia): MSCI Emerging Markets ex-Asia.
Telecoms | Asia Pacific Sachin Gupta, CFA
11 January 2011 Nomura 70
Explanation of Nomura's equity research rating system for Asian companies under coverage ex Japan published from 30 October 2008 and in Japan from 6 January 2009 STOCKS Stock recommendations are based on absolute valuation upside (downside), which is defined as (Price Target - Current Price) / Current Price, subject to limited management discretion. In most cases, the Price Target will equal the analyst's 12-month intrinsic valuation of the stock, based on an appropriate valuation methodology such as discounted cash flow, multiple analysis, etc. A 'Buy' recommendation indicates that potential upside is 15% or more. A 'Neutral' recommendation indicates that potential upside is less than 15% or downside is less than 5%. A 'Reduce' recommendation indicates that potential downside is 5% or more. A rating of 'Suspended' indicates that the rating and target price have been suspended temporarily to comply with applicable regulations and/or firm policies in certain circumstances including when Nomura is acting in an advisory capacity in a merger or strategic transaction involving the subject company. Securities and/or companies that are labelled as 'Not rated' or shown as 'No rating' are not in regular research coverage of the Nomura entity identified in the top banner. Investors should not expect continuing or additional information from Nomura relating to such securities and/or companies. SECTORS A 'Bullish' rating means most stocks in the sector have (or the weighted average recommendation of the stocks under coverage is) a positive absolute recommendation. A 'Neutral' rating means most stocks in the sector have (or the weighted average recommendation of the stocks under coverage is) a neutral absolute recommendation. A 'Bearish' rating means most stocks in the sector have (or the weighted average recommendation of the stocks under coverage is) a negative absolute recommendation. Explanation of Nomura's equity research rating system in Japan published prior to 6 January 2009 (and ratings in Europe, Middle East and Africa, US and Latin America published prior to 27 October 2008) STOCKS A rating of '1' or 'Strong buy', indicates that the analyst expects the stock to outperform the Benchmark by 15% or more over the next six months. A rating of '2' or 'Buy', indicates that the analyst expects the stock to outperform the Benchmark by 5% or more but less than 15% over the next six months. A rating of '3' or 'Neutral', indicates that the analyst expects the stock to either outperform or underperform the Benchmark by less than 5% over the next six months. A rating of '4' or 'Reduce', indicates that the analyst expects the stock to underperform the Benchmark by 5% or more but less than 15% over the next six months. A rating of '5' or 'Sell', indicates that the analyst expects the stock to underperform the Benchmark by 15% or more over the next six months. Stocks labeled 'Not rated' or shown as 'No rating' are not in Nomura's regular research coverage. Nomura might not publish additional research reports concerning this company, and it undertakes no obligation to update the analysis, estimates, projections, conclusions or other information contained herein. SECTORS A 'Bullish' stance, indicates that the analyst expects the sector to outperform the Benchmark during the next six months. A 'Neutral' stance, indicates that the analyst expects the sector to perform in line with the Benchmark during the next six months. A 'Bearish' stance, indicates that the analyst expects the sector to underperform the Benchmark during the next six months. Benchmarks are as follows: Japan: TOPIX; United States: S&P 500, MSCI World Technology Hardware & Equipment; Europe, by sector - Hardware/Semiconductors: FTSE W Europe IT Hardware; Telecoms: FTSE W Europe Business Services; Business Services: FTSE W Europe; Auto & Components: FTSE W Europe Auto & Parts; Communications equipment: FTSE W Europe IT Hardware; Ecology Focus: Bloomberg World Energy Alternate Sources; Global Emerging Markets: MSCI Emerging Markets ex-Asia. Explanation of Nomura's equity research rating system for Asian companies under coverage ex Japan published prior to 30 October 2008 STOCKS Stock recommendations are based on absolute valuation upside (downside), which is defined as (Fair Value - Current Price)/Current Price, subject to limited management discretion. In most cases, the Fair Value will equal the analyst's assessment of the current intrinsic fair value of the stock using an appropriate valuation methodology such as Discounted Cash Flow or Multiple analysis etc. However, if the analyst doesn't think the market will revalue the stock over the specified time horizon due to a lack of events or catalysts, then the fair value may differ from the intrinsic fair value. In most cases, therefore, our recommendation is an assessment of the difference between current market price and our estimate of current intrinsic fair value. Recommendations are set with a 6-12 month horizon unless specified otherwise. Accordingly, within this horizon, price volatility may cause the actual upside or downside based on the prevailing market price to differ from the upside or downside implied by the recommendation. A 'Strong buy' recommendation indicates that upside is more than 20%. A 'Buy' recommendation indicates that upside is between 10% and 20%. A 'Neutral' recommendation indicates that upside or downside is less than 10%. A 'Reduce' recommendation indicates that downside is between 10% and 20%. A 'Sell' recommendation indicates that downside is more than 20%. SECTORS A 'Bullish' rating means most stocks in the sector have (or the weighted average recommendation of the stocks under coverage is) a positive absolute recommendation. A 'Neutral' rating means most stocks in the sector have (or the weighted average recommendation of the stocks under coverage is) a neutral absolute recommendation. A 'Bearish' rating means most stocks in the sector have (or the weighted average recommendation of the stocks under coverage is) a negative absolute recommendation. Price targets Price targets, if discussed, reflect in part the analyst's estimates for the company's earnings. The achievement of any price target may be impeded by general market and macroeconomic trends, and by other risks related to the company or the market, and may not occur if the company's earnings differ from estimates.
Telecoms | Asia Pacific Sachin Gupta, CFA
11 January 2011 Nomura 71
Disclaimers This publication contains material that has been prepared by the Nomura entity identified on the banner at the top or the bottom of page 1 herein and, if applicable, with the contributions of one or more Nomura entities whose employees and their respective affiliations are specified on page 1 herein or elsewhere identified in the publication. Affiliates and subsidiaries of Nomura Holdings, Inc. (collectively, the 'Nomura Group'), include: Nomura Securities Co., Ltd. ('NSC') Tokyo, Japan; Nomura International plc, United Kingdom; Nomura Securities International, Inc. ('NSI'), New York, NY; Nomura International (Hong Kong) Ltd., Hong Kong; Nomura Financial Investment (Korea) Co., Ltd., Korea (Information on Nomura analysts registered with the Korea Financial Investment Association ('KOFIA') can be found on the KOFIA Intranet at http://dis.kofia.or.kr ); Nomura Singapore Ltd., Singapore (Registration number 197201440E, regulated by the Monetary Authority of Singapore); Nomura Securities Singapore Pte Ltd., Singapore (Registration number 198702521E, regulated by the Monetary Authority of Singapore); Capital Nomura Securities Public Company Limited; Nomura Australia Ltd., Australia (ABN 48 003 032 513), regulated by the Australian Securities and Investment Commission and holder of an Australian financial services licence number 246412; P.T. Nomura Indonesia, Indonesia; Nomura Securities Malaysia Sdn. Bhd., Malaysia; Nomura International (Hong Kong) Ltd., Taipei Branch, Taiwan; Nomura Financial Advisory and Securities (India) Private Limited, Mumbai, India (Registered Address: Ceejay House, Level 11, Plot F, Shivsagar Estate, Dr. Annie Besant Road, Worli, Mumbai- 400 018, India; SEBI Registration No: BSE INB011299030, NSE INB231299034, INF231299034, INE 231299034). THIS MATERIAL IS: (I) FOR YOUR PRIVATE INFORMATION, AND WE ARE NOT SOLICITING ANY ACTION BASED UPON IT; (II) NOT TO BE CONSTRUED AS AN OFFER TO SELL OR A SOLICITATION OF AN OFFER TO BUY ANY SECURITY IN ANY JURISDICTION WHERE SUCH OFFER OR SOLICITATION WOULD BE ILLEGAL; AND (III) BASED UPON INFORMATION THAT WE CONSIDER RELIABLE. NOMURA GROUP DOES NOT WARRANT OR REPRESENT THAT THE PUBLICATION IS ACCURATE, COMPLETE, RELIABLE, FIT FOR ANY PARTICULAR PURPOSE OR MERCHANTABLE AND DOES NOT ACCEPT LIABILITY FOR ANY ACT (OR DECISION NOT TO ACT) RESULTING FROM USE OF THIS PUBLICATION AND RELATED DATA. TO THE MAXIMUM EXTENT PERMISSIBLE ALL WARRANTIES AND OTHER ASSURANCES BY NOMURA GROUP ARE HEREBY EXCLUDED AND NOMURA GROUP SHALL HAVE NO LIABILITY FOR THE USE, MISUSE, OR DISTRIBUTION OF THIS INFORMATION. Opinions expressed are current opinions as of the original publication date appearing on this material only and the information, including the opinions contained herein, are subject to change without notice. Nomura is under no duty to update this publication. If and as applicable, NSI's investment banking relationships, investment banking and non-investment banking compensation and securities ownership (identified in this report as 'Disclosures Required in the United States'), if any, are specified in disclaimers and related disclosures in this report. In addition, other members of the Nomura Group may from time to time perform investment banking or other services (including acting as advisor, manager or lender) for, or solicit investment banking or other business from, companies mentioned herein. Further, the Nomura Group, and/or its officers, directors and employees, including persons, without limitation, involved in the preparation or issuance of this material may, to the extent permitted by applicable law and/or regulation, have long or short positions in, and buy or sell, the securities (including ownership by NSI, referenced above), or derivatives (including options) thereof, of companies mentioned herein, or related securities or derivatives. In addition, the Nomura Group, excluding NSI, may act as a market maker and principal, willing to buy and sell certain of the securities of companies mentioned herein. Further, the Nomura Group may buy and sell certain of the securities of companies mentioned herein, as agent for its clients. Investors should consider this report as only a single factor in making their investment decision and, as such, the report should not be viewed as identifying or suggesting all risks, direct or indirect, that may be associated with any investment decision. Please see the further disclaimers in the disclosure information on companies covered by Nomura analysts available at www.nomura.com/research under the 'Disclosure' tab. Nomura Group produces a number of different types of research product including, among others, fundamental analysis, quantitative analysis and short term trading ideas; recommendations contained in one type of research product may differ from recommendations contained in other types of research product, whether as a result of differing time horizons, methodologies or otherwise; it is possible that individual employees of Nomura may have different perspectives to this publication. NSC and other non-US members of the Nomura Group (i.e. excluding NSI), their officers, directors and employees may, to the extent it relates to non-US issuers and is permitted by applicable law, have acted upon or used this material prior to, or immediately following, its publication. Foreign-currency-denominated securities are subject to fluctuations in exchange rates that could have an adverse effect on the value or price of, or income derived from, the investment. In addition, investors in securities such as ADRs, the values of which are influenced by foreign currencies, effectively assume currency risk. The securities described herein may not have been registered under the US Securities Act of 1933, and, in such case, may not be offered or sold in the United States or to US persons unless they have been registered under such Act, or except in compliance with an exemption from the registration requirements of such Act. Unless governing law permits otherwise, you must contact a Nomura entity in your home jurisdiction if you want to use our services in effecting a transaction in the securities mentioned in this material. This publication has been approved for distribution in the United Kingdom and European Union as investment research by Nomura International plc ('NIPlc'), which is authorized and regulated by the UK Financial Services Authority ('FSA') and is a member of the London Stock Exchange. It does not constitute a personal recommendation, as defined by the FSA, or take into account the particular investment objectives, financial situations, or needs of individual investors. It is intended only for investors who are 'eligible counterparties' or 'professional clients' as defined by the FSA, and may not, therefore, be redistributed to retail clients as defined by the FSA. This publication may be distributed in Germany via Nomura Bank (Deutschland) GmbH, which is authorized and regulated in Germany by the Federal Financial Supervisory Authority ('BaFin'). This publication has been approved by Nomura International (Hong Kong) Ltd. ('NIHK'), which is regulated by the Hong Kong Securities and Futures Commission, for distribution in Hong Kong by NIHK. This publication has been approved for distribution in Australia by Nomura Australia Ltd, which is authorized and regulated in Australia by the Australian Securities and Investment Commission ('ASIC'). This publication has also been approved for distribution in Malaysia by Nomura Securities Malaysia Sdn Bhd. In Singapore, this publication has been distributed by Nomura Singapore Limited ('NSL') and/or Nomura Securities Singapore Pte Ltd ('NSS'). NSL and NSS accepts legal responsibility for the content of this publication, where it concerns securities, futures and foreign exchange, issued by their foreign affiliates in respect of recipients who are not accredited, expert or institutional investors as defined by the Securities and Futures Act (Chapter 289). Recipients of this publication should contact NSL or NSS (as the case may be) in respect of matters arising from, or in connection with, this publication. Unless prohibited by the provisions of Regulation S of the U.S. Securities Act of 1933, this material is distributed in the United States, by Nomura Securities International, Inc., a US-registered broker-dealer, which accepts responsibility for its contents in accordance with the provisions of Rule 15a-6, under the US Securities Exchange Act of 1934.
Telecoms | Asia Pacific Sachin Gupta, CFA
11 January 2011 Nomura 72
This publication has not been approved for distribution in the Kingdom of Saudi Arabia or to clients other than 'professional clients' in the United Arab Emirates by Nomura Saudi Arabia, Nomura International plc or any other member of the Nomura Group, as the case may be. Neither this publication nor any copy thereof may be taken or transmitted or distributed, directly or indirectly, by any person other than those authorised to do so into the Kingdom of Saudi Arabia or in the United Arab Emirates or to any person located in the Kingdom of Saudi Arabia or to clients other than 'professional clients' in the United Arab Emirates. By accepting to receive this publication, you represent that you are not located in the Kingdom of Saudi Arabia or that you are a 'professional client' in the United Arab Emirates and agree to comply with these restrictions. Any failure to comply with these restrictions may constitute a violation of the laws of the Kingdom of Saudi Arabia or the United Arab Emirates. No part of this material may be (i) copied, photocopied, or duplicated in any form, by any means; or (ii) redistributed without the prior written consent of the Nomura Group member identified in the banner on page 1 of this report. Further information on any of the securities mentioned herein may be obtained upon request. If this publication has been distributed by electronic transmission, such as e-mail, then such transmission cannot be guaranteed to be secure or error-free as information could be intercepted, corrupted, lost, destroyed, arrive late or incomplete, or contain viruses. The sender therefore does not accept liability for any errors or omissions in the contents of this publication, which may arise as a result of electronic transmission. If verification is required, please request a hard-copy version. Additional information available upon request NIPlc and other Nomura Group entities manage conflicts identified through the following: their Chinese Wall, confidentiality and independence policies, maintenance of a Restricted List and a Watch List, personal account dealing rules, policies and procedures for managing conflicts of interest arising from the allocation and pricing of securities and impartial investment research and disclosure to clients via client documentation. Disclosure information is available at the Nomura Disclosure web page: http://www.nomura.com/research/pages/disclosures/disclosures.aspx
AP86b
Nomura Asian Equity Research Group
Hong Kong Nomura International (Hong Kong) Limited 30/F Two International Finance Centre, 8 Finance Street, Central, Hong Kong Tel: +852 2536 1111 Fax: +852 2536 1820
Seoul Nomura Financial Investment (Korea) Co., Ltd. 17th floor, Seoul Finance Center, 84 Taepyeongno 1-ga, Jung-gu, Seoul 100-768, Korea Tel: +82 2 3783 2000 Fax: +82 2 3783 2500
Kuala Lumpur Nomura Securities Malaysia Sdn. Bhd. Suite No 16.5, Level 16, Menara IMC, 8 Jalan Sultan Ismail, 50250 Kuala Lumpur, Malaysia Tel: +60 3 2027 6811 Fax: +60 3 2027 6888
India Nomura Financial Advisory and Securities (India) Private Limited Ceejay House, Level 11, Plot F, Shivsagar Estate, Dr. Annie Besant Road, Worli, Mumbai- 400 018, India Tel: +91 22 4037 4037 Fax: +91 22 4037 4111
Indonesia PT Nomura Indonesia Suite 209A, 9th Floor, Sentral Senayan II Building Jl. Asia Afrika No. 8, Gelora Bung Karno, Jakarta 10270, Indonesia Tel: +62 21 2991 3300 Fax: +62 21 2991 3333
Sydney Nomura Australia Ltd. Level 25, Governor Phillip Tower, 1 Farrer Place, Sydney NSW 2000 Tel: +61 2 8062 8000 Fax: +61 2 8062 8362
Tokyo Equity Research Department Financial & Economic Research Center Nomura Securities Co., Ltd. 17/F Urbannet Building, 2-2, Otemachi 2-chome Chiyoda-ku, Tokyo 100-8130, Japan Tel: +81 3 5255 1658 Fax: +81 3 5255 1747, 3272 0869
Caring for the environment: to receive only the electronic versions of our research, please contact your sales representative.