51
| Date post: | 25-Dec-2015 |
| Category: |
Documents |
| Upload: | roberta-hutchinson |
| View: | 219 times |
| Download: | 0 times |

© 2001 Openwave Systems Inc.
MARKET SCENARIOS
Pessimistic Base Case Optimistic
Handset Replacement Cycles
Next Gen. Network Rollout
Availability of Data Enabled Handsets
Rate of Service Adoption Among
2
1
3
4
Pessimistic Base Case Optimistic
Handset Replacement Cycles
Next Gen. Network Rollout
Availability of Data Enabled Handsets
Rate of Service Adoption Among
2
1
3
4
Pessimistic Base Case Optimistic
Handset Replacement Cycles
Next Gen. Network Rollout
Availability of Data Enabled Handsets
Rate of Service Adoption Among
2
1
3
4
Pessimistic Base Case Optimistic
Handset Replacement Cycles
Next Gen. Network Rollout
Availability of Data Enabled Handsets
Rate of Service Adoption Among
2
1
3
4
Pessimistic Base Case Optimistic
Handset Replacement Cycles
Next Gen. Network Rollout
Availability of Data Enabled Handsets
Rate of Service Adoption Among
2
1
3
4
Base Market Model Case
Probable Storm Perfect Storm <$400M
Probable Wave Perfect Wave >$800M

© 2001 Openwave Systems Inc.
PROBABLE WAVE
Optimal
Challenging
Slow
Fast
ProductTransitions
FastIndustry Consolidation
Perfect Storm
ProbableStorm
ProbableWave

© 2001 Openwave Systems Inc.
PROBABLE STORM
Optimal
Challenging
Slow
Fast
ProductTransitions
FastIndustry Consolidation
Assumes: Market Share Constant / ASP Constant
Perfect Storm
Scenario 1
Probable Wave
ProbableStorm

© 2001 Openwave Systems Inc.
OPENWAVE MISSION
Deliver the Services OS™ software
platform that enables
communication service providers
to rapidly create profitable
Internet-based services.

© 2001 Openwave Systems Inc.
ANNUAL REVENUE GROWTH
$0
$100
$200
$300
$400
$500
1997 1998 1999 2000 2001
Mill
ion
s

© 2001 Openwave Systems Inc.
ANNUAL REVENUE GROWTH
$0
$100
$200
$300
$400
$500
1997 1998 1999 2000 2001
Mill
ion
s
85% GM
25¢/share
85% GM
25¢/share

© 2001 Openwave Systems Inc.
GEOGRAPHIC REVENUE DIVERSITY
June, 2001 September, 2001
Source: Openwave
Americas
EMEA
Japan andAsia-Pacific
ROW
38% 35%
27%
Americas
EMEA
Japan andAsia-Pacific
ROW
30% 35%
35%

© 2001 Openwave Systems Inc.
SUBSCRIBER GROWTH
1,000M+
189M
125M
906M
25.7M
420M
Mobile Internet Messaging
Active Subscribers
Subs Served by Our Customers
Worldwide Subscribers
Sources: Messaging Online (Year End 2000 Report), Radacati, EMC, CSFB, Operator Press Releases, Openwave Estimates, Morgan Stanley Dean Witter PC Industry Overview March 2001
# Seats Activated
# PCs
# Seats Licensed# Subscribers Licensed40M
+4.1M +5.9M

© 2001 Openwave Systems Inc.
COMPANY FACTS
2,000+Employees

© 2001 Openwave Systems Inc.
FINANCIAL PERFORMANCE
$117
$144.7$130.0
$109.7
Dec Mar Jun Sep
2001 2002

© 2001 Openwave Systems Inc.
FINANCIAL PERFORMANCE
$XXX $YYY
$144.7$130.0
$109.7
Dec Mar Jun Sep Dec
2001
85% GM
(4.6)% Profit Ops
(0.03)¢
85% GM
(4.6)% Profit Ops
(0.03)¢
2002
© 2001 Openwave Systems Inc.
AGENDA
Industry ModelIndustry Model
Japan’s Success
Global Market
Openwave Technology
© 2001 Openwave Systems Inc.
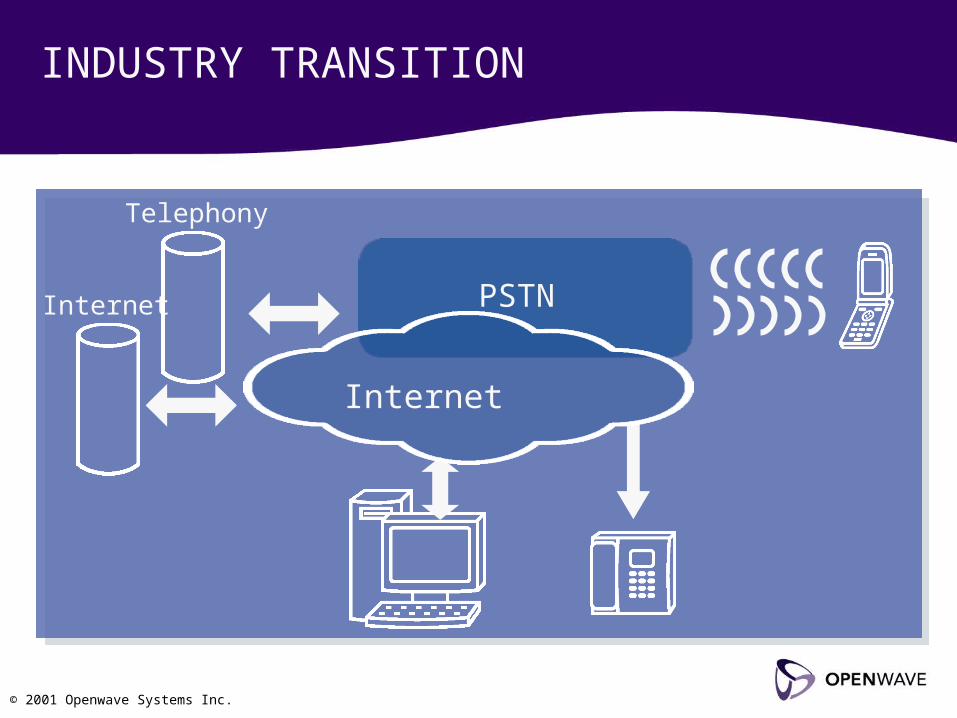
INDUSTRY TRANSITION
Internet
Telephony
PSTN
Internet

© 2001 Openwave Systems Inc.
# of Subscribers
INDUSTRY BUSINESS MODEL
# of Subscribers ProfitabilityNew ServicesVoice
Cost

© 2001 Openwave Systems Inc.
Content
INDUSTRY
ENTERPRISE
SME
SOHO
CONSUMER
Carrier Data Center
Telephony
Internet
Openwave
De
vice
Pro
du
cts
De
velo
per P
rod
ucts
Communication Services
Platform Services
Mobile Services Infrastructure
Customer Service
Ecosystem Partners

© 2001 Openwave Systems Inc.
ContentENTERPRISE
SME
SOHO
CONSUMER
Telephony
Internet
Carrier Data Center
Openwave
INDUSTRY SITUATION
Carrier Data CenterData Back Office
Voice

© 2001 Openwave Systems Inc.
ContentENTERPRISE
SME
SOHO
CONSUMER
Telephony
Internet
Carrier Data Center
Openwave
ENTERPRISE
ENTERPRISE

© 2001 Openwave Systems Inc.
AGENDA
Industry Model
Japan’s SuccessJapan’s Success
Global Market
Openwave Technology

© 2001 Openwave Systems Inc.
MARKET MODEL
ContentENTERPRISE
SME
SOHO
CONSUMER
Carrier Data Center
Telephony
Internet
Openwave

© 2001 Openwave Systems Inc.
0
0
0
0
SUCCESS FACTORS
1Internet
1

© 2001 Openwave Systems Inc.
ContentENTERPRISE
SME
SOHO
CONSUMER
Carrier Data Center
Telephony
Internet
Openwave
INDUSTRY SITUATION

© 2001 Openwave Systems Inc.
INDUSTRY PRIMITIVES AND MARKET MODEL: 12% INCREASE IN HANDSET SALES…
Summary
Total Handset Sales 1999 2000 2001 2002 2003 2004 2005 2006
Analog 0 14,553,708 7,490,937 5,368,588 3,121,895 1,915,078 754,731 440,383
2G
CDMA 0 53,997,112 52,239,189 53,315,311 61,064,964 68,446,559 53,644,559 30,127,607TDMA 0 42,008,987 39,232,331 42,171,544 45,297,200 40,859,986 29,673,696 18,909,950
GSM 0 265,055,824 272,589,870 270,655,591 296,522,525 302,705,668 252,800,052 205,573,904PDC 0 27,633,205 24,152,131 22,494,314 24,074,505 23,055,686 20,609,444 14,442,265
2.5GGPRS 0 0 5,481,861 37,998,235 67,679,935 129,950,961 168,612,154 240,027,862
CDMA 1xRTT 0 0 384,307 1,619,178 9,151,907 21,669,048 39,595,176 66,621,499HSCSD 0 0 6,009,276 16,584,902 6,073,003 4,135,375 607,972 391,968
EDGE 0 0 0 1,662,054 3,328,151 7,649,370 9,523,453 13,794,6343G
CDMA 2000 0 0 0 59,040 1,135,026 2,146,069 4,420,467 7,470,454WCDMA 0 0 299,654 6,188,250 13,468,094 38,465,334 74,837,554 147,243,745
Total Digital 0 388,695,128 400,388,619 452,748,420 527,795,311 639,084,054 654,324,527 744,603,887
Total 0 403,248,836 407,879,556 458,117,008 530,917,205 640,999,133 655,079,258 745,044,2710 0 0 0 0 0 0 0
Consistent With Current Analyst Expectations

© 2001 Openwave Systems Inc.
HANDSETS
© 2001 Openwave Systems Inc.
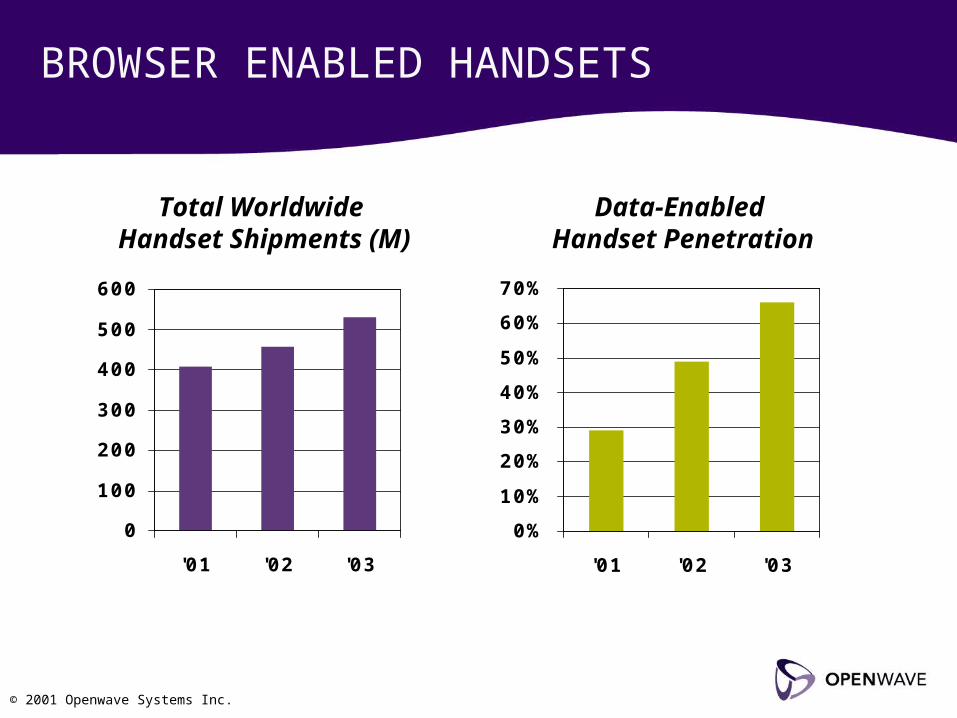
BROWSER ENABLED HANDSETS
0
100
200
300
400
500
600
'01 '02 '03
0%
10%
20%
30%
40%
50%
60%
70%
'01 '02 '03
Total Worldwide Handset Shipments (M)
Data-Enabled Handset Penetration

© 2001 Openwave Systems Inc.
ContentENTERPRISE
SME
SOHO
CONSUMER
Carrier Data Center
Telephony
Internet
Openwave
INDUSTRY SITUATION
Internet

© 2001 Openwave Systems Inc.
2.5G NETWORKS
Source: EMC, Openwave Analysis
69242
1480
52 258
3 25
Total # CSPs with 2.5G Footprint
1xRTT
GPRSIn Service(Commercial)
139 CSPs 605M Subs100%
GPRS
1xRTT
In Deployment(In Process ofRolling Out)

© 2001 Openwave Systems Inc.
ContentENTERPRISE
SME
SOHO
CONSUMER
Carrier Data Center
Telephony
Internet
Openwave
INDUSTRY SITUATION
New Services
$15/month
$30/month

© 2001 Openwave Systems Inc.
“Moore’s Law”
2-way and Global
Network
Secure and Private
Accessible
COMMUNITY STRUCTURE

© 2001 Openwave Systems Inc.
AGENDA
Industry Model
Japan’s Success
Global MarketGlobal Market
Openwave Technology

© 2001 Openwave Systems Inc.
INDUSTRY STANDARDS
Optical Standards
SecurityStandards
PresentationStandards
IP StandardsMessagingStandards
IP StandardsMessagingStandards
PresentationStandards
SecurityStandards
Optical Standards
Transport Communication Entertainment Commerce Imaging

© 2001 Openwave Systems Inc.
MOBILE INTERNET GROWTH

© 2001 Openwave Systems Inc.
CONTENT
Entertainment
Useful Information
Melodies/Images
Gourmet/Recipes
Shopping/Living
Travel/Traffic/Maps
Credit Card/Securities/Insurance
MobileBanking
News/Weather/
Information
Games/Fortunetelling

© 2001 Openwave Systems Inc.
DEMOGRAPHICS
20-2424%
25-2920%
30-3412%
35-398%
Over 3927%
Under 207%
Unknown2%

© 2001 Openwave Systems Inc.
MARKET SCENARIOS
Pessimistic Base Case Optimistic
Handset Replacement Cycles
Next Gen. Network Rollout
Availability of Data Enabled Handsets
Rate of Service Adoption Among
2
1
3
4
Pessimistic Base Case Optimistic
Handset Replacement Cycles
Next Gen. Network Rollout
Availability of Data Enabled Handsets
Rate of Service Adoption Among
2
1
3
4
Pessimistic Base Case Optimistic
Handset Replacement Cycles
Next Gen. Network Rollout
Availability of Data Enabled Handsets
Rate of Service Adoption Among
2
1
3
4
Pessimistic Base Case Optimistic
Handset Replacement Cycles
Next Gen. Network Rollout
Availability of Data Enabled Handsets
Rate of Service Adoption Among
2
1
3
4
Pessimistic Base Case Optimistic
Handset Replacement Cycles
Next Gen. Network Rollout
Availability of Data Enabled Handsets
Rate of Service Adoption Among
2
1
3
4
Base Market Model Case
Probable Storm Perfect Storm <$400M
Probable Wave Perfect Wave >$800M
© 2001 Openwave Systems Inc.
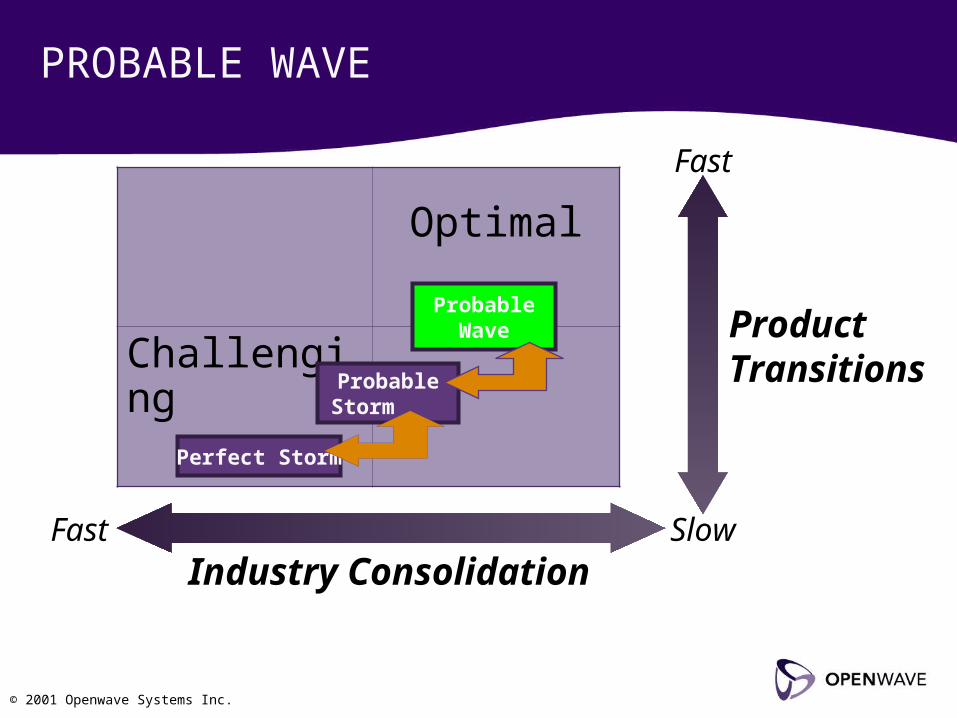
PROBABLE WAVE
Optimal
Challenging
Slow
Fast
ProductTransitions
FastIndustry Consolidation
Perfect Storm
ProbableStorm
ProbableWave

© 2001 Openwave Systems Inc.
PROBABLE STORM
Optimal
Challenging
Slow
Fast
ProductTransitions
FastIndustry Consolidation
Assumes: Market Share Constant / ASP Constant
Perfect Storm
Scenario 1
Probable Wave
ProbableStorm

© 2001 Openwave Systems Inc.
PROBABLE STORM – CY2002
124m 139m 181m 216m 226mMobile Data Subs
Key Drivers Perfect Storm• Replacement rates
fall (US) or stagnate • Significant delays in
NG infrastructure. US falls further behind Europe.
• Failure by vendors to increase number of browser enabled handsets
• Data adoption continues to be slow.
• Nokia stalls M-Services in Europe
Probable Storm• Replacement picks
up as confidence recovers and new models are shipped
• Continued delays in NG rollout. Greatest impact in US
• Data capable hand-sets become more pervasive
• Compelling content continues to be lacking, pushing back adoption by 2 quarters. .
• Europe sees continued use of SMS, causing delays in micro-browser uptake of up to 1 yr
Base Case• Gradual recovery in
handset replacement in all regions ‘02-06.
• Rollout of 2.5G in APAC and Europe in ‘01. US follows ’02. S. America, Asia, Middle East/ Africa ‘03-04
• All 2.5G+ handsets data enabled. Increases in % of new 2G handsets data enabled.
• Among users with data enabled handsets, steady growth in adoption to 60% by 2006 in US, APAC, W.Europe.
• Moderate growth in less developed regions
Probable Wave• Handset replacement
begins to pick up gradually from ‘02
• 2.5G and 3G networks continue present rollout path. 2001 APAC and W.Europe. 2002 US, 2002-3 ROW
• Increase in micro-browser enabled 2G handsets as consumer demand emerges.
• M-Services achieves early success and availability of rich content increases (e.g. Java).
• Data uptake outside Japan accelerates
Perfect Wave• Replacement rates return
to ’99/’00 level. Ongoing growth in Middle East/Africa and C.Asia
• 2.5G rollout accelerates from ’02. Seen in increased share of handset sales.
• Vendors rapidly increase availability of data enabled handsets.
• M-Services takes off in EU. CSPs “get” the concept of ecosystem development. Data uptake accelerates.
• Transition to Japan type penetration rates in Europe, US, Asia
90% C.I.99% C.I.
* Subs defined as at least 1 use per month
CY2001 – 84M

© 2001 Openwave Systems Inc.
COMMUNITY STRUCTURE
Open Community Messaging
© 2001 Openwave Systems Inc.
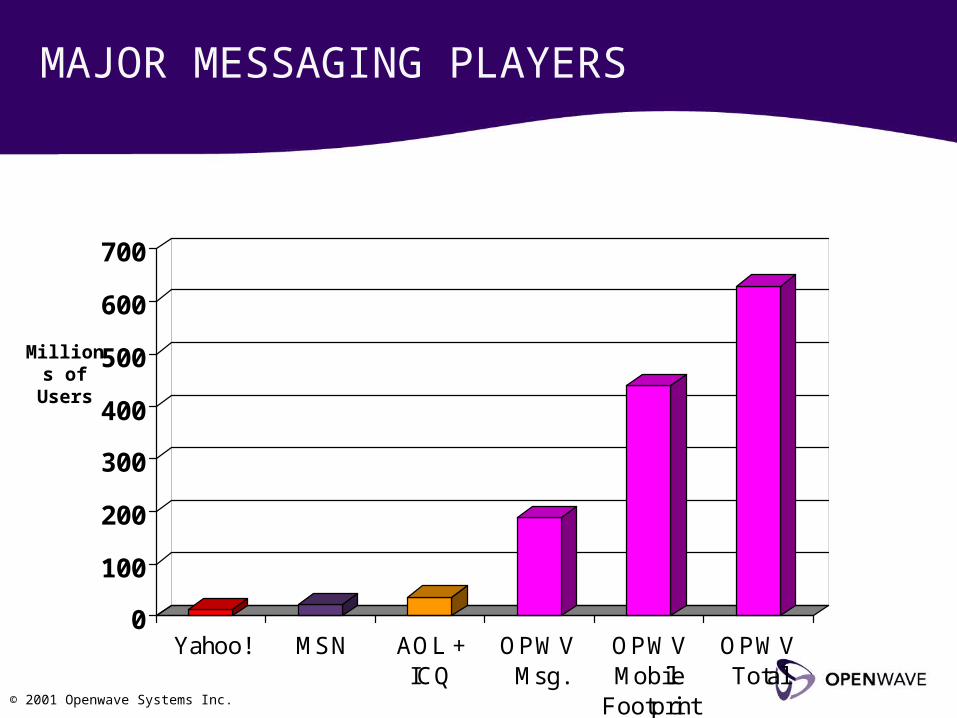
MAJOR MESSAGING PLAYERS
0
100
200
300
400
500
600
700
Yahoo! MSN AOL +ICQ
OPWV Msg.
OPWVMobile
Footprint
OPWVTotal
Millions of Users

© 2001 Openwave Systems Inc.
GLOBAL MARKET GROWTH
United StatesUnited States
DevelopmentDevelopment
EuropeEurope
DeploymentDeployment
Asia-PacificAsia-Pacific
JapanJapan
ExpansionExpansion

© 2001 Openwave Systems Inc.
AGENDA
Industry Model
Japan’s Success
Global Market
Openwave TechnologyOpenwave Technology

© 2001 Openwave Systems Inc.
COMPONENTS
Customer Service
Communication Services
Platform Services
Mobile Services Infrastructure
Mobile Access Gateway /Mobile Services Platform
Dev
ice
Pro
du
cts
Mo
bil
eB
row
se
rD
ev
ice
A
pp
lic
ati
on
s
Develo
per P
rod
ucts
WA
P P
us
h
Lib
rary
SD
K
MobileEmail
UnifiedMessaging
InstantMessaging
MultimediaMessaging
CommerceBroker
SyncManager
Provisioning Manager
DownloadFun
Mobile Messaging Gateway
Ecosystem Partners
Channel Alliances Strategic Alliances Developer AlliancesProduct andTechnology Alliances
Professional Services Customer Support

© 2001 Openwave Systems Inc.
PLATFORM
Mobile Services PlatformClie
nt
Ap
plic
atio
ns Communication Suite
Customer Life Cycle Management
Develo
per
Allian
ces
Strategic Alliances
© 2001 Openwave Systems Inc.
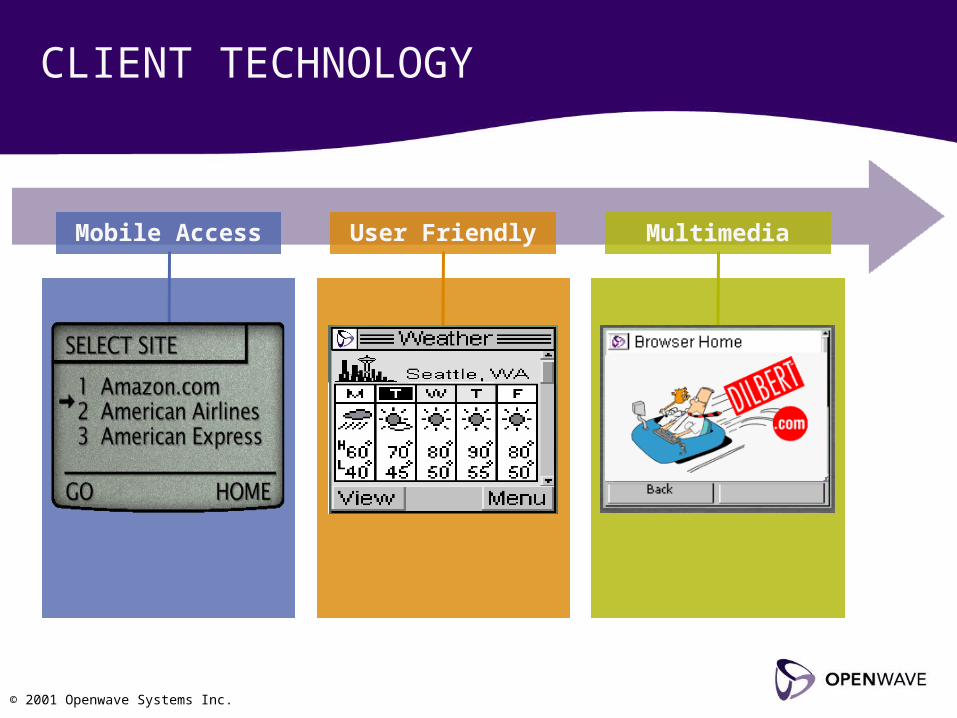
CLIENT TECHNOLOGY
Mobile Access MultimediaUser Friendly

© 2001 Openwave Systems Inc.
UNIFIED MESSAGING
TUI
“You have 3 urgent Voicemail Messages, 6 new Emails…”
Address Book
Notification
Calendar
Messaging

© 2001 Openwave Systems Inc.
INSTANT MESSAGING
WAP Client
SMS Client
DesktopIM Client
Mobile –Embedded Client
© 2001 Openwave Systems Inc.
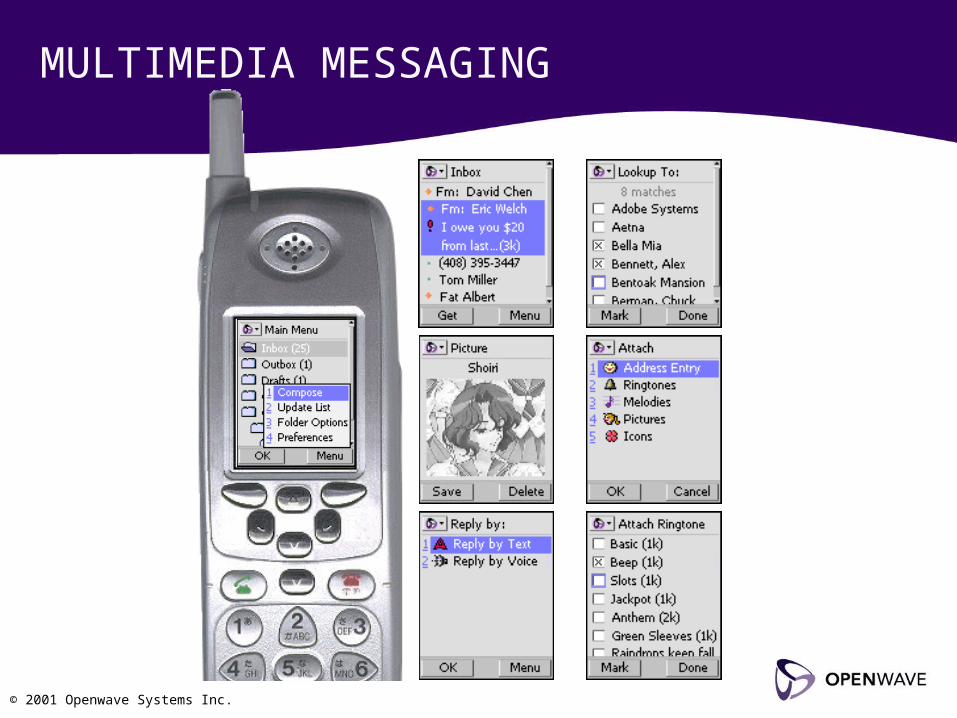
MULTIMEDIA MESSAGING

© 2001 Openwave Systems Inc.
ASIA’S SUCCESS…
© 2001 Openwave Systems Inc.
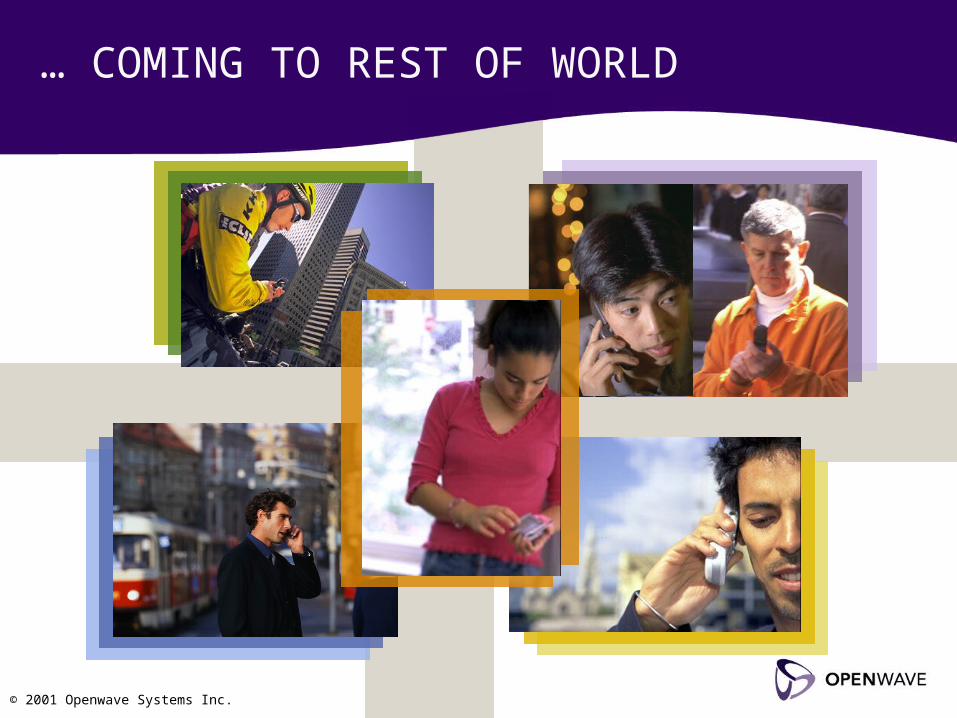
… COMING TO REST OF WORLD

THANK YOU!


