92
Year 2011 1 YEAR 2011 Enabling Digital Evolution
| Date post: | 08-Apr-2016 |
| Category: |
Documents |
| Upload: | zeeland-family |
| View: | 222 times |
| Download: | 1 times |
Year 2011 1 YE
AR
20
11
Enabling Digital Evolution
content
enabling Digital evolutionDigital networks allow households to enjoy better image quality, a wider
provision of services to a range of terminal equipment, interactivity, and
higher data rates. Similarly, video surveillance systems are increasingly
moving towards fully digital network technology and more advanced au-
tomatic control applications. Digitization of services and networks began
already in the late 1990s and is still continuing strong. It is progressing
deeper into the network infrastructure and, simultaneously, spreading
wider geographically; in teleste’s main market areas in europe, digitiza-
tion will still continue strong for many years and elsewhere in the world
in many places it is only just beginning.
teleste contributes to this digitization of networks by providing
its customers with both equipment and services. We can either make
available complete product solutions or develop them together with
our customers to make them better meet the changing demand. This,
combined with our strong offering of network design and maintenance
services, allows us to offer our unique overall expertise in the promotion
of digital expansion among our operator customers.
teLeSteYear 2011 in brief 1teleste in brief 2ceo´s letter 4 Research and technology Development 6Strategy 8
BUSIneSS AReASBusiness areas in brief 10Video and Broadband Solutions 12network Services 16customer Projects 18
ReSPonSIBILItYPersonnel 22Social Responsibility and Sustainable Development 24
MAnAgeMentBoard of Directors 28Management group 30
Information for Shareholders 32

Year 2011 1
0
50
100
150
200
09 10 11 09 10 11
09 10 1109 10 1109 10 1109 10 11
MeUR MeUR
MeUR %% % eUR
Year 2011 in Brief
teLeSte MAnAgeD to exceed the
set growth target while significantly
improving its profitability. Year 2011
showed an upward trend and the
highest net sales in the company
history was achieved in the fourth
quarter. At the same time, teleste’s
market share seemed to have
strengthened. Streamlining of opera-
tions proceeded nearly according to
plan. Market for our product-based
business continued active, especially
in France, Belgium, Israel, Poland and
Russia. Performance of the services
business was good, especially in
germany and the UK.
2011 2010 Change %
orders received, Meur 188.1 167.2 12.5
net sales, Meur 183.6 167.8 9.4
operating profit, Meur 9.4 7.4 26.2
Profit for the financial period, Meur 6.3 4.8 31.7
earnings per share, eur 0.36 0.27 31.7
Shareholder's equity per share, eur 3.17 2.90 9.3
Return on capital employed, % 11.5 10.2
turnover, % of share capital. 9.1 17.4
kEY figuREs nEt sAlEs
0
2
4
6
8
10
0
2
4
6
8
10
opERAting pRofit
0
25
50
75
100
EquitY RAtio
0,0
0,1
0,2
0,3
0,4
EARnings pER shARE
0
2
4
6
8
pRofit foR thE finAnCiAl pERioD
0
3
6
9
12
REtuRn on CApitAl EmploYED
26%
operating profit increased
over
FUtURe YeARS for teleste
appears equally bright. Market
demand has strengthened; the euro-
pean cable operators are well posi-
tioned and will be launching innova-
tive services in 2012. on the other
hand, a general economic downturn
in europe would also affect teleste’s
operation.

2 teleste, Enabling Digital Evolution
i am tamara Van laecke from Belgium and have worked at teleste for 1.5 years now.
my current position include administrative and supportive tasks around technical plan-ning and processing of the so called “build plans”.
my hobbies are reading and jogging and driving my two boys from one hobby to the other.
my name is mark griffiths. i am based in the uk office locat-ed in fareham. i have been employed as a Business Develop-ment manager at teleste for 10 years. my main responsibil-ity is to look for opportunities to help the uk and ireland cable operators improve their network. my aim is to work in partnership with Customers rather than just being another supplier, the last 10 years have been an absolute pleasure. There is nothing more satisfying than seeing teleste equip-ment being used in a customers’ network, especially in the areas that i know i have been involved in.
out of business hours i like to spend time with family, work on computers, watching films and television programs and go walking with the dog.
teleste is an international corporation specializing in
high-technology and network services. our expertise
is based on products and network services related to
processing, networking, transmission and management
of video and data for operators and the public sector.
teleste has two synergistic business areas: Video and
Broadband Solutions and network Services. These busi-
ness operations are linked by a common customer base
as well as video and broadband technology.
Video and Broadband Solutions focus on product
solutions related to broadband access networks, video
service platforms and video surveillance applications.
network Services provide network operators with
comprehensive technical services in selected target
markets.
teleste was founded in 1954, and its share (tLt1V)
is listed in the technology sector on the nASDAQ oMX
Helsinki oy.
teleste in Brief
my name is melanie Vogel and i have been working for Cableway in germany now for four years. since 2010 i have worked as an assistant to Cableways management. on top of my daily routines i am responsible for general administra-tive tasks. it is exciting to see how rapidly the company has grown in the recent years. During this period of growth i have gathered a lot of experience. in my free time i like riding, gym and reading.

Year 2011 3
tElEstE in BRiEf
my name is Yang Yani (Callie) and i work in teleste´s China manufac-turing site in suzhou. i am the first person to be seen when entering our office as i take care of our telephone reception. one of my hobbies is badmin-ton which is very popular in China .
When i hear about finland, i think about polar lights and a coun-try with small population and when i hear about teleste, i think about a professional and famous company in its own business area.
VAluEs CustomERs gloBAl pREsEnCE - loCAl RElEVAnCE
our values provide beacons that guide our journey towards our shared destination – the teleste vision
•customer centricity
•Respect
•Reliability
•ResultOrientation
one of our main customer groups consists of cable and video surveil-lance operators.
our cable television and IPtV solutions, and the networks Services divisions, serve mainly the biggest european cable operators, and much of the business is conducted through direct customer contacts.
Video Surveillance Solutions serve primarily the public sector, such as rail, land and air transport authori-ties, police and defense. Most of the business is handled through system integrators.
one of teleste’s competitive ad-vantages involves close customer relationships achieved through our local presence.
our main market is europe, where we have our densest network of offices. Besides the head office our biggest offices by number of per-sonnel are located in germany, the UK, Poland, Belgium and china.
teleste is headquartered in Finland and the vast majority of our product development and production has been concentrated in the turku region, in Littoinen, on our recently extended premises.
i am pirjo pahlberg and work in teleste´s produc-tion in finland, mainly on the Cfo equipments. my work consists of assembly, tuning and packaging of equipment.
i started at teleste back in 1978! over the years my work has changed significantly. in this time, just the number of personnel has increased almost tenfold and the premises have certainly become larger in the same proportion. our current headquarters in littoinen represents a stylish and modern production facility. The work itself has moved from the early manual tuning to high-quali-ty automation testing.
to offset work i engage in a variety of sports such as skiing and jogging. on top of that, travel-ling on our caravan with my husband we enjoy getting familiar with European cities.
my name is maciej Włodarczyk and i have worked as the ip system Engineer for teleste Video networks in krakow for 2 years now.
in poland there are two teleste Video networks offices: in krakow and in Wroclaw. people in the office in kra-kow integrate and support video net-works teleste systems. i’m personally responsible for support British telecom system in the uk. my colleagues in Wroclaw are developing teleste´s Video management software (VmX).
At teleste i like that every day brings new challenges.
in my free time i repair my old VW beetle.
4 teleste, Enabling Digital Evolution
growing together with customers
each year, teleste’s management and personnel come up with a theme, which encapsulates our common goal. For 2011, we chose the theme of “growing together with the customer”. De-mand picked up following the slightly sluggish beginning of the year whereas the second half was downright action-packed. With the strengthening of the market demand we also believe to have increased our market share. now, after the turn of the year I can proudly say that we managed to exceed our growth target while clearly improved our profitability. our net sales increased by 9.4% to eUR 183.6 million and our operating profit reached eUR 9.4 million, an increase of no less than 26.2%.
The net sales increased in both of our business areas. The operator clientele of Video and Broadband Solutions continued to improve the capacity of their networks as well as to invest in new services. For network Services, operations involving net-work design developed favorably with the customer relations be-coming increasingly closer. We also made progress in strength-ening our position in new markets such as Russia. In the past year, we entered into a number of significant framework agree-ments that do not appear in the order backlog. nevertheless, at the year-end our order backlog was about 25% higher that of the reference year.
This clear improvement in our operating profit is based on increased net sales, efficient production and successful project
deliveries. Streamlining of our operations proceeded almost as planned and as a part of it, we concentrated most of the R&D taking place in Finland and the whole production over to the premises in Littoinen. Instead, in the services business, results from the development program launched at an earlier stage were not yet fully realized in 2011. As to project deliveries, de-liveries involving particularly optical product solutions and video surveillance materialized better than forecast.
The Changing operating Environmentour operating environment is undergoing a constant and mas-sive change as the electronic data transfer breaks into new ar-eas. Video and broadband technologies are developing fast and new technologies will enable increasingly higher quality video. Also, the needs of our customers and, in particular, those of the end-users, are becoming greater. end-users want a diverse and high-quality content anytime, anywhere. At the same time, the range of terminal equipment is widening. Responding to the wishes expressed by the users of the Internet and tV requires increasingly broader bands and higher speeds, in other words, more efficient network capacity. Similarly, video technology is in-creasingly needed for safety applications. As the number of vari-ous threats increases, they are controlled more cost-effectively by means of video surveillance in areas such as traffic and guard-ing the borders.

Year 2011 5
JukkA RinnEVAARA
CEo’s lEttER
Enabling Digital EvolutionWhen it comes to the supply of video processing and transfer technology, teleste is one the industry-leading companies in the world, and in europe it is the market leader in subscriber network solutions (HFc). For its part, our offering enables an ever higher quality and faster electronic transmission of data. So we are enabling the digital evolution. teleste’s strongest expertise in-cludes hybrid fiber-coAX technology (HFc), the use of which will be stepped up in the future. We are also highly proficient in fiber optic technology, the share of which is set to rise. In addition to our technological know-how, we have a strong understanding of our customers’ needs, which is why we have succeeded in creat-ing a strong working relationship with our customer base and, thus, have compelling evidence of successful deliveries.
In 2011, we went through an extensive strategy process, in which we examined prospects for our markets and gauged the possible trends. As a result of this process we renewed our strat-egy. Based on the obtained information we concluded that the foundation of our competitiveness will continue to include both the HFc technology solutions and the fiber optic solutions.
Future success will require continuous development of our own operations and our production quality, but also that of the technologies we use. new, innovative product solutions will pro-vide us with competitive advantage. Very often we engage in
development work together with our clients putting their needs as our starting point. Therefore, our investments in product de-velopment were significant accounting for 12.9% of Video and Broadband Solutions’ product business.
forward with optimismThanks to the strong second half and our good order backlog, the year 2012 has started with an upbeat tone. our goal is to continue on our growth path while enhancing our profitability. In addition to our current markets we are also seeking growth in new market areas. However, our main market is in europe, the economic impact of which on the demand for our products and services can not be underestimated. A potential increase in financial costs would reduce our operator customers’ willingness to invest.
I would like to express my warm thanks to everyone at teleste for good cooperation and high-quality work even in the busy months. I want to thank our customers, partners and share-holders for their confidence in teleste.
Jukka Rinnevaaraceo
our net sales increased
by 9.4% to eUR 183.6
million and our operating
profit reached eUR 9.4
million, an increase of no
less than 26.2%.

6 teleste, Enabling Digital Evolution
technological Development –The cornerstone of our Success
technical innovations have provided the cornerstone of teleste’s business success in the company’s entire history. The company has made a long-term investment on R&D of at least 10% of the net sales of Video and Broadband Solutions´product business, and this has enabled the development of our wide-ranging and competitive product portfolio. teleste’s R&D activities represent mainly the so-called applied product development, which aims at creating new commercially exploitable products or product fea-tures. A prerequisite for applied R&D is the development of basic technology and research, for which part teleste relies on its part-ners focusing on such activity. These partners include Vtt, tech-nical Research centre of Finland, universities and polytechnics.
experienced and skilled R&D personnel, and its continued development, constitute the key success factors in teleste’s ap-proach to business. Since technology develops at an increasing speed and teleste operates in a number of different areas of technology, it is almost impossible to cover all the required areas of technology by our own personnel. For this reason, it is impor-tant to identify those technologies and key areas of expertise, the management of which by our own personnel is essential for
our success today and in the coming years. As for other neces-sary components, teleste relies on its wide network of partners both in Finland and overseas.
teleste’s R&D operates in close interaction with the com-pany’s key customers. This ensures that there is a real market need for any development project taken onboard and that the timing in relation to competition and market conditions is opti-mal. It does not seem at all exaggerated to say that the speed of commercialization with regard to technological innovations and the customer-oriented way of operation provide teleste with a strategic competitive advantage.
tailored upgrading of Access networkseuropean cable tV networks were originally built between the 1970s and 1990s. This relatively long period of time is one of the reasons for why the networks differ significantly in struc-ture from one another. Therefore, upgrading these networks to match the transmission capacity required by the new services is not possible by resorting to any so-called standard products. In-

Year 2011 7
REsEARCh AnD tEChnologY DEVElopmEnt
deed, customer-specific “tailoring” of product features is a defin-ing characteristic to product projects involving access networks.
The rapidly growing video-on-demand (VoD) services and high-speed data networks require segmentation by means of fiber optic cable connections. As to access networks, the main R&D projects carried out by teleste in 2011 focused on just these areas. Key product launches involved further development of high-density optical platform (HDo) and development of a modular optical receiver (Ac9000).
growing need for Video processingThe need of operators working in a multi-service (video, data, voice) environment for processing the service content is increas-ing rapidly with new customer applications. one example of these new services is offering the video content originally de-signed for traditional tV sets also for smartphones and tablet computers. Provision of such a service requires adapting video to different terminal equipment and different transmission net-works. As to teleste’s product offering, the Luminato and My-
cast product families have been developed with exactly this need in mind. Development of both product families continued actively throughout 2011.
Video surveillance solutions Draw on the internet networkVideo surveillance technology has undergone a significant transi-tion in recent years. earlier systems were based almost exclu-sively on a closed optical fiber network and supplier-specific ter-minal devices. The current modern video surveillance solutions are based on an overall system consisting of network elements using Internet Protocol (IP) and networks, on the one hand, and the management software developed for the efficient manage-ment of surveillance data, on the other.
In 2011, teleste launched the MPeg-4 standard (H.264) based encoder (MPH), and continued its strong investments in the further development of our video surveillance recording and management software (VMX product line) and in support of cus-tomer projects.

8 teleste, Enabling Digital Evolution
tREnDs
Forward with Revised Strategy
In year 2011, a comprehensive strategy project was carried out within teleste. Th is was motivated by the signs of disruption within the tV distribution market as well as the alleged maturing of the cable network access technology market. Th e focus was on product-based business and the purpose of the project was to describe, analyze and select a strategic pathway for teleste that generates the most shareholder value with growth and ad-ditional profi table revenue in segments where teleste has or will have a leading position.
Th e project confi rmed some of the starting-points that have been the basis of teleste’s strategy in the past years:
• In the short/mid-term future (5-10 years), cable companies have a superior broadband off ering in the areas covered by the cable plant, thus their business is not under immediate pressure and also the technology market is relatively secure
• In the long term, the business environment of cable operators is fundamentally changing and network architectures con-verge towards optical networks forcing technology vendors to adapt to the changes
•Th e growth in network service is due to outsourcing driven by operational expenditure pressure, introduction of new tech-nology, increased fi bre to the home roll-outs and entrance of new players
• In video surveillance, teleste is strongly present in the “ultra high-end” segment with encoders and tailored video manage-ment/recording software solutions
•teleste’s competitive advantage is based on installed base, its deep technology understanding, ability to customize, local presence and strong relationships with european cable opera-tors
tV AnD BRoADBAnD DIStRIBUtIon
Cable operators’ operative business typically running well in EuropeBroadband access service is superior compared to telcos’ off ering. Incumbent telecom operators are investing more to win market share from tV distribution market
over Th e top tV (ott) services will eventually disrupt the tV distribution businesscable operators in europe are well positioned and will launch innovative services in 2012
Cable operator networks are getting more and more congested
After several ownership structural changes in 2011, cable operator industry is expected to be more stable in 2012
VIDeo SURVeILLAnce
Diqitalization – Diqital products will replace analogue productsIncreased need for security
Long term good growth in IP cameras, management SW and recording
need to reduce oPeX by increasing effi ciency > Demand for intelligent systems with automation
Year 2011 9
stRAtEgY
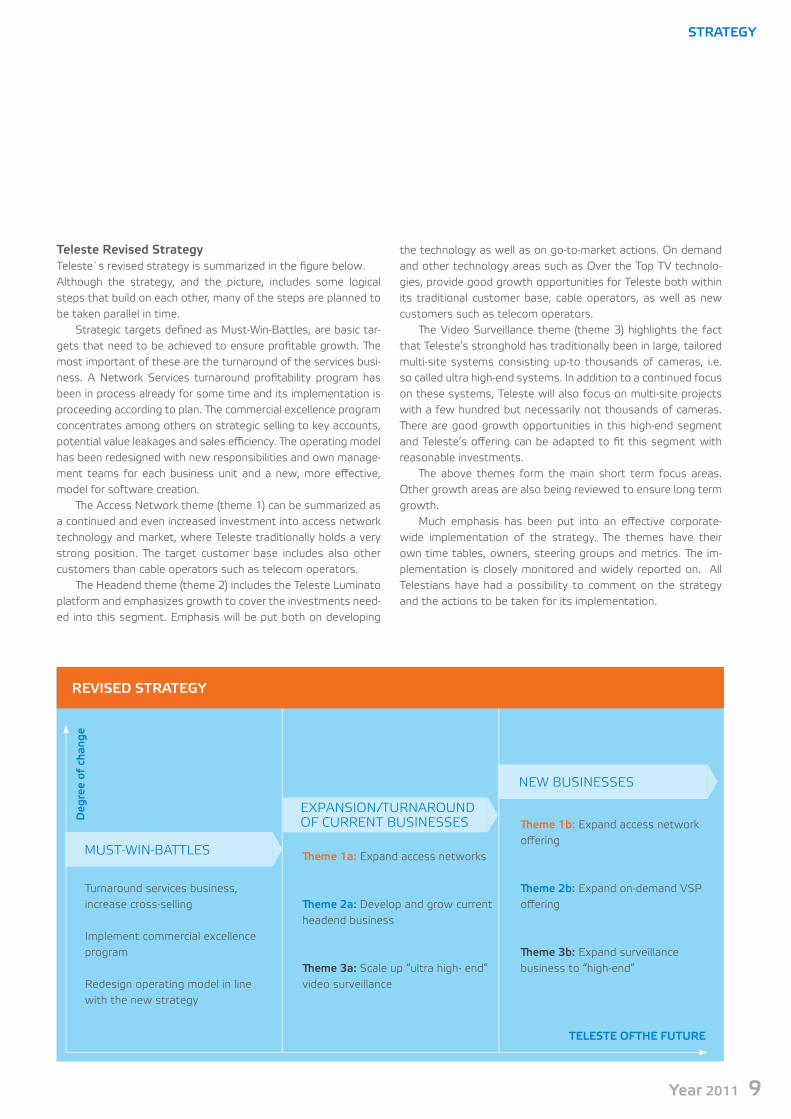
teleste Revised strategyteleste´s revised strategy is summarized in the fi gure below.Although the strategy, and the picture, includes some logical steps that build on each other, many of the steps are planned to be taken parallel in time.
Strategic targets defi ned as Must-Win-Battles, are basic tar-gets that need to be achieved to ensure profi table growth. Th e most important of these are the turnaround of the services busi-ness. A network Services turnaround profi tability program has been in process already for some time and its implementation is proceeding according to plan. Th e commercial excellence program concentrates among others on strategic selling to key accounts, potential value leakages and sales effi ciency. Th e operating model has been redesigned with new responsibilities and own manage-ment teams for each business unit and a new, more eff ective, model for software creation.
Th e Access network theme (theme 1) can be summarized as a continued and even increased investment into access network technology and market, where teleste traditionally holds a very strong position. Th e target customer base includes also other customers than cable operators such as telecom operators.
Th e Headend theme (theme 2) includes the teleste Luminato platform and emphasizes growth to cover the investments need-ed into this segment. emphasis will be put both on developing
the technology as well as on go-to-market actions. on demand and other technology areas such as over the top tV technolo-gies, provide good growth opportunities for teleste both within its traditional customer base, cable operators, as well as new customers such as telecom operators.
Th e Video Surveillance theme (theme 3) highlights the fact that teleste’s stronghold has traditionally been in large, tailored multi-site systems consisting up-to thousands of cameras, i.e. so called ultra high-end systems. In addition to a continued focus on these systems, teleste will also focus on multi-site projects with a few hundred but necessarily not thousands of cameras. Th ere are good growth opportunities in this high-end segment and teleste’s off ering can be adapted to fi t this segment with reasonable investments.
Th e above themes form the main short term focus areas. other growth areas are also being reviewed to ensure long term growth.
Much emphasis has been put into an eff ective corporate-wide implementation of the strategy. Th e themes have their own time tables, owners, steering groups and metrics. Th e im-plementation is closely monitored and widely reported on. All telestians have had a possibility to comment on the strategy and the actions to be taken for its implementation.
MUSt-WIn-BAttLeS
neW BUSIneSSeS
turnaround services business, increase cross-selling
Implement commercial excellence program
Redesign operating model in line with the new strategy
Th eme 1a: expand access networks
Th eme 2a: Develop and grow current headend business
Th eme 3a: Scale up “ultra high- end” video surveillance
Th eme 1b: expand access network off ering
Th eme 2b: expand on-demand VSP off ering
Th eme 3b: expand surveillance business to “high-end”
Deg
ree
of c
hang
e
tElEstE ofthE futuRE
REVisED stRAtEgY
eXPAnSIon/tURnARoUnD oF cURRent BUSIneSSeS
10 teleste, Enabling Digital Evolution
,,
BUSIneSS AReAS
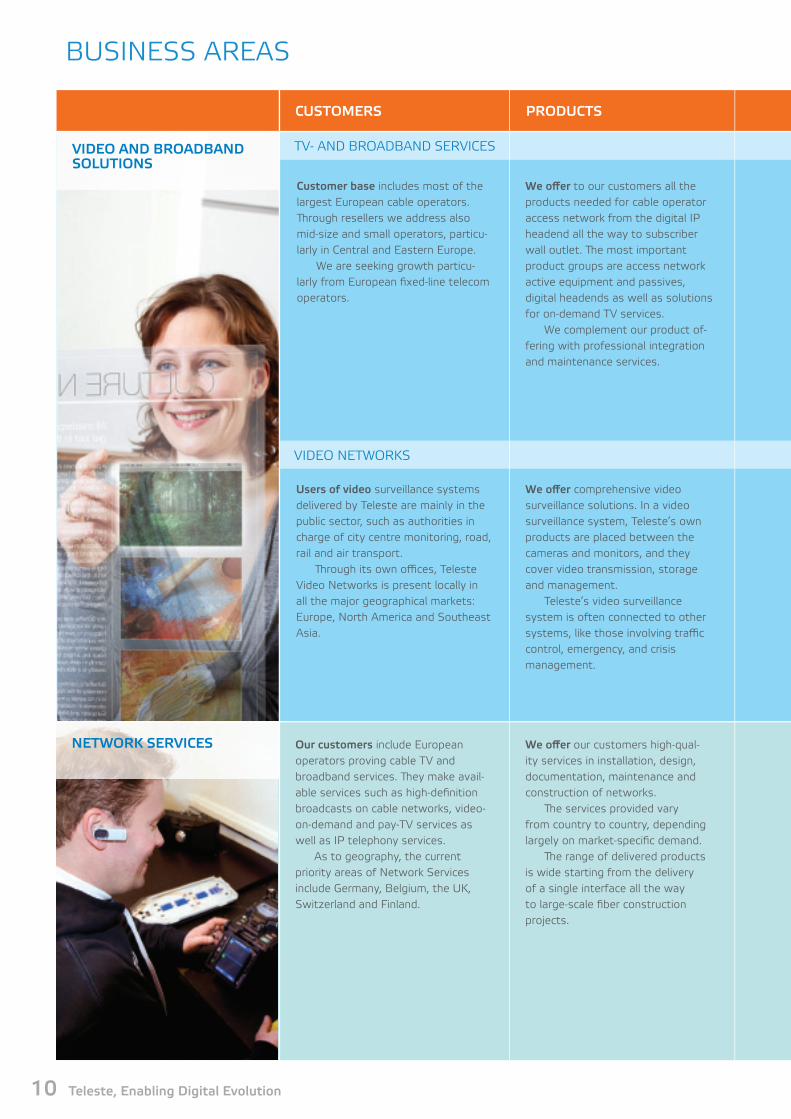
ViDEo AnD BRoADBAnD solutions
Customer base includes most of the largest european cable operators. Th rough resellers we address also mid-size and small operators, particu-larly in central and eastern europe. We are seeking growth particu-larly from european fi xed-line telecom operators.
We off er to our customers all the products needed for cable operator access network from the digital IP headend all the way to subscriber wall outlet. Th e most important product groups are access network active equipment and passives, digital headends as well as solutions for on-demand tV services.
We complement our product of-fering with professional integration and maintenance services.
nEtWoRk sERViCEs
CustomERs pRoDuCts
our customers include european operators proving cable tV and broadband services. Th ey make avail-able services such as high-defi nition broadcasts on cable networks, video-on-demand and pay-tV services as well as IP telephony services.
As to geography, the current priority areas of network Services include germany, Belgium, the UK, Switzerland and Finland.
We off er our customers high-qual-ity services in installation, design, documentation, maintenance and construction of networks.
Th e services provided vary from country to country, depending largely on market-specifi c demand.
Th e range of delivered products is wide starting from the delivery of a single interface all the way to large-scale fi ber construction projects.
users of video surveillance systems delivered by teleste are mainly in the public sector, such as authorities in charge of city centre monitoring, road, rail and air transport.
Th rough its own offi ces, teleste Video networks is present locally in all the major geographical markets: europe, north America and Southeast Asia.
We off er comprehensive video surveillance solutions. In a video surveillance system, teleste’s own products are placed between the cameras and monitors, and they cover video transmission, storage and management.
teleste’s video surveillance system is often connected to other systems, like those involving traffi c control, emergency, and crisis management.
VIDeo netWoRKS
tV- AnD BRoADBAnD SeRVIceS

Year 2011 11
,,
Th e teleste product innovations en-able operators to guarantee better subscriber service availability as well as build and run their networks more effi ciently.
Additionally, our strength is a product portfolio which is optimized for varying needs of european mar-kets. We are present on all the main markets and hence provide compre-hensive local support services for our customers.
teleste product quality is widely appreciated and customers respect our way of working.
We are the market leader in europe for cable access products. We are the only vendor present in all main cable markets in europe with comprehen-sive product off ering.
Digital IP headends we deliver globally through our partner network.
Delivery of tV content over public In-ternet may increase signifi cantly the need for access network capacity and hence speed up the operator invest-ments to increase their capacity. Th is disruption also opens new opportuni-ties for teleste to provide integrated service management solutions enabling on-demand video services for consumers. telecom operators’ stronger presence in tV distribution services may open signifi cant growth opportunities for teleste. Russian and eastern european markets provide major growth potential for existing product off ering.
stREngths mARkEt position gRoWth oppoRtunitiEs
our angle of approach to the market diff ers from that of most of our competitors with contractor background. our strength lies in our strong technological expertise and excellent reputation.
Th is technology know-how is expressed in our ability to provide innovative and novel solutions to items such as network maintenance. our long history as a european equipment supplier provides us with the necessary market credibility.
our market position varies from country to country. In Belgium, Switzerland and Finland, we are play-ing the role of the challenger having made excellent headway with the local operators.
In the UK, we rank among the most important special actors in the provision of technical design and consulting services to a selected segment.
In germany, we are among the market’s leading contractors provid-ing services to all major operators.
in today’s market we see interest-ing growth opportunities in countries like Belgium, Britain, Switzerland and Finland. In these countries, there are certain areas of application where we have identifi ed potential, but do not yet have active business. In germany, we see growth potential in projects related, for instance, to extensive fi ber network construction. tapping into new markets is also possible in the nordic countries and in continen-tal europe.
Moreover, we believe that our investments in the exploitation of sales opportunities between the dif-ferent business units will bear fruit, for example, in terms of monitoring solutions and professional services.
teleste’s special areas of compe-tence is in demanding video surveil-lance applications, where cameras, storage devices and workstations from several sites are networked into a single video surveillance system.
teleste’s references in its target segments are of world-class.
teleste has a strong foothold in very large and demanding projects in the public sector. our position is particu-larly strong in road and rail segments as well as in large-scale city centre monitoring projects.
Th e company is now expanding its off ering to include smaller projects comprising of several locations.
Th ere is a growing need for video sur-veillance. In the coming years, the cur-rent analog systems will be replaced by fully digital systems, and new construction will rapidly move over to IP-based solutions in all market areas. Th e need for intelligent solutions will continue to grow. network manage-ment and storage solutions form the core of these networks, and teleste’s good product off ering combined with the company’s world-class references provide a solid foundation even for a rapid growth.
12 teleste, Enabling Digital Evolution
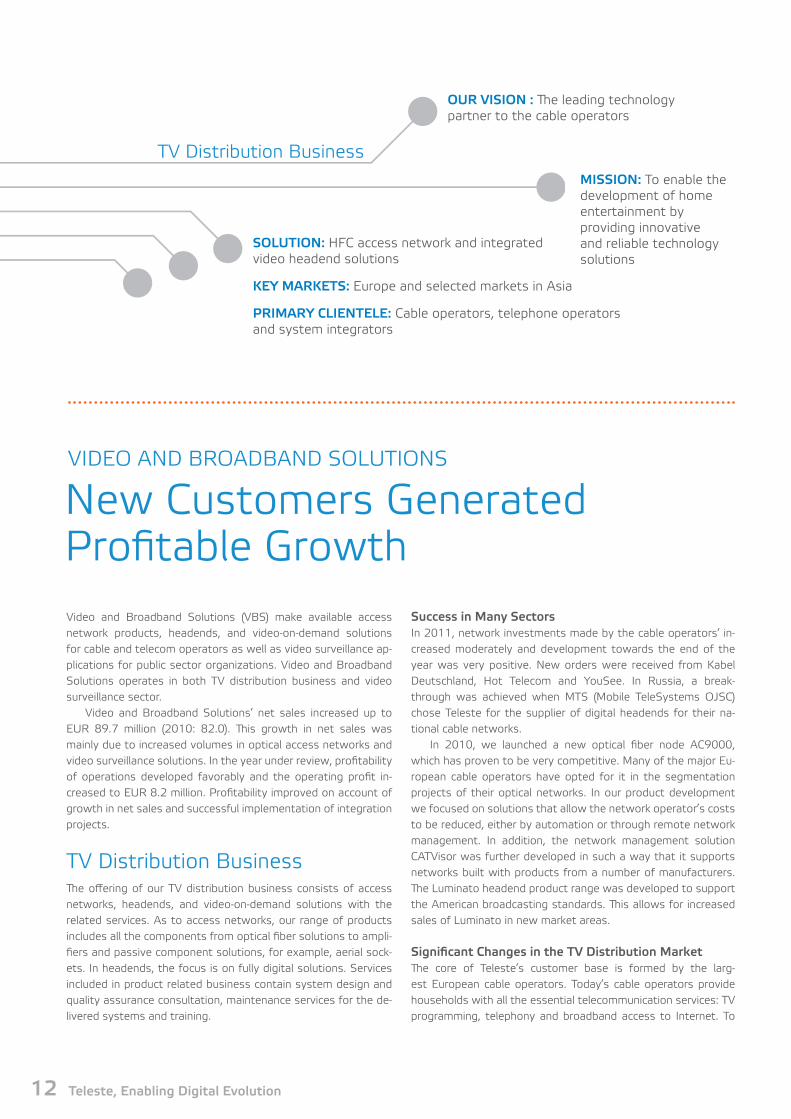
new customers generated Profitable growthVideo and Broadband Solutions (VBS) make available access network products, headends, and video-on-demand solutions for cable and telecom operators as well as video surveillance ap-plications for public sector organizations. Video and Broadband Solutions operates in both tV distribution business and video surveillance sector.
Video and Broadband Solutions’ net sales increased up to eUR 89.7 million (2010: 82.0). This growth in net sales was mainly due to increased volumes in optical access networks and video surveillance solutions. In the year under review, profitability of operations developed favorably and the operating profit in-creased to eUR 8.2 million. Profitability improved on account of growth in net sales and successful implementation of integration projects.
tV Distribution BusinessThe offering of our tV distribution business consists of access networks, headends, and video-on-demand solutions with the related services. As to access networks, our range of products includes all the components from optical fiber solutions to ampli-fiers and passive component solutions, for example, aerial sock-ets. In headends, the focus is on fully digital solutions. Services included in product related business contain system design and quality assurance consultation, maintenance services for the de-livered systems and training.
success in many sectorsIn 2011, network investments made by the cable operators’ in-creased moderately and development towards the end of the year was very positive. new orders were received from Kabel Deutschland, Hot telecom and YouSee. In Russia, a break-through was achieved when MtS (Mobile teleSystems oJSc) chose teleste for the supplier of digital headends for their na-tional cable networks.
In 2010, we launched a new optical fiber node Ac9000, which has proven to be very competitive. Many of the major eu-ropean cable operators have opted for it in the segmentation projects of their optical networks. In our product development we focused on solutions that allow the network operator’s costs to be reduced, either by automation or through remote network management. In addition, the network management solution cAtVisor was further developed in such a way that it supports networks built with products from a number of manufacturers. The Luminato headend product range was developed to support the American broadcasting standards. This allows for increased sales of Luminato in new market areas.
significant Changes in the tV Distribution marketThe core of teleste’s customer base is formed by the larg-est european cable operators. today’s cable operators provide households with all the essential telecommunication services: tV programming, telephony and broadband access to Internet. to
ouR Vision : The leading technology partner to the cable operators
mission: to enable the development of home entertainment by providing innovative and reliable technology solutions
solution: HFc access network and integrated video headend solutions
kEY mARkEts: europe and selected markets in Asia
pRimARY CliEntElE: cable operators, telephone operators and system integrators
tV Distribution Business
VIDeo AnD BRoADBAnD SoLUtIonS

Year 2011 13
BusinEss AREAs, VIDeo AnD BRoADBAnD SoLUtIonS

14 teleste, Enabling Digital Evolution
The new generation of optical network terminals. Designed to accommodate the needs for future broadband capacity. There is enough capacity to meet the requirements of about 250–1000 subscribers.
The latest version of the Ems network management system enables highly customizable views with network maps and the adding of documentation to real-time network data.
A compact mph series video transmitter designed for video surveillance. The device converts the signal from a CCtV camera into digital format and forwards it over the network to the control room. This series also supports hD resolution, and its efficient pro-cessing relays the video without significant delays.
teleste luminato headend repre-sents the forefront of the field. The device allows for full exploitation of the digital television technolo-gy. teleste luminato is an effective and compact platform that meets the demands of large and small cable television operators alike.
maintain their competitiveness, the operators must continually invest in increased capacity and solutions of their access network, which allows them to bring to market new and innovative ser-vices. In the coming years, the tV distribution market is likely to experience significant changes, as besides broadcast networks (cable, satellite, terrestrial network, IPtV) tV content will be dis-tributed via the public Internet (over the top services, ott). In addition, through ott services tV content can be delivered not only to traditional television receivers, but also to mobile devices.
This revolution will bring teleste new business opportunities. teleste can supply an ott service provider with the Mycast ser-vice management solution that includes the most important func-tions of ott services, such as consumer interface and content search capabilities. When consumers shift their consumption of television services towards on-demand viewing, the broadband traffic of access networks will increase dramatically. to avoid net-work congestion, the cable and telecom operators need to invest in greater capacity of their access networks. Thus, the increase in popularity of the ott and video-on-demand services can bring teleste additional sales with accelerated investments in network capacity.
telecom operators will build fiber networks at an increased speed all the way to the basement of apartment buildings (Fi-ber to the Building) and they will use the existing infrastructure in these buildings, that is, pair or a coaxial cabling, to connect households to the optical node in the basement of the building. teleste will be having significant business opportunities, should the telecom operators choose to use the buildings’ coaxial cabling in the construction of their high-speed broadband connections (Data over coax).
We strive to further improve our competitiveness in the op-tical data transmission by investing in product solutions, the volume of which is on the increase. These include, for example, externally modulated 1550 nm optical transmitters and a digital return path.
Video networksVideo networks supplies comprehensive video surveillance appli-cations with emphasis on demanding video surveillance applica-tions, where cameras, recorders and workstations from a number of sites will be networked into a single video surveillance sys-tem. teleste´s solutions include products, systems design, proj-ect implementation and services related to system maintenance and training. In the system, teleste’s own products are placed between the cameras and monitors, and they cover transmission, storage and management of video. teleste’s video surveillance systems are often connected to other systems, like those involv-ing traffic control, emergency, and crisis management.
Through its own offices, teleste Video networks is present lo-cally in all the major geographical markets: europe, north America and Southeast Asia. teleste’s references are of world class in its target segments.
Varied needs of CustomersUtilizers of video surveillance are mainly in the public sector, such as authorities in charge of city centre monitoring as well as road, rail and air transport. The most important private sector appli-cations are related to energy distribution systems and control of industrial processes, where the requirements are higher with respect to, for example, degree of connectivity, quality of the video as well as the analysis and processing tools for the stored video content.
customers often wish to use one video surveillance system for several purposes. For example, an airport control system can be used by airlines, enterprises at the airport, providers of secu-rity guard and security services, police and border guards, among others. to fulfill these requirements, the systems must work seamlessly with each other. Based on open standards, teleste solutions can easily be integrated with other systems.

Year 2011 15
VBs nEt sAlEs shARE of pERsonnEl
network Services, 56,7%
Video and Broadband Solutions, 43,3%
shARE of nEt sAlEs
network Services,51,1%
Video and Broadband Solutions,48,9%
BusinEss AREAs, VIDeo AnD BRoADBAnD SoLUtIonS
VBs oRDERs RECEiVED
0
25
50
75
100
09 10 110
25
50
75
100
09 10 11
successful DeliveriesHighlights of 2011 include the successful delivery of the video surveillance solution for the greater Paris Police Department (Préfecture de Police). In the year under review, we continued our cooperation with the French national railway company SncF, who also placed new orders with us. Deliveries continued to the chicago transit Authority and the State of Queensland prison project. numerous systems have also been delivered to the Mid-dle east and South Africa.
tapping new markets by product DevelopmentIn the future, besides large-scale and multi-annual projects, we will be investing to smaller, but geographically wide projects.
These projects require more user-friendly products. A new ver-sion of the VMX video management and recording software is thus being developed with significantly improved software inte-gration friendliness and ease of remote use. Similarly, we are also building complete turn-key solutions for our main segments. our partner network will be strengthened and extended to coun-tries like India and Brazil.
The long-term market outlook for IP based video surveillance is positive. In the coming years, the current analog systems will be replaced by fully digital systems, and new construction will rapidly move over to IP-based solutions in all market areas. The need for intelligent solutions will continue to grow.
Video networks
our Vision: A leading provider of integrated video surveillance solutions
mission: enable high-quality and efficient work of security professionals through provision of video surveillance technologies
solution: extensive networked video monitoring solutions
kEY mARkEts: The business focus is on high-quality video surveillance networks for road, rail and public places monitoring and corporate security systems on a global scale. Main market areas are europe, USA and Southeast Asia
pRimARY CliEntElE: The systems developed by teleste are supplied mainly to the public sector. teleste delivers its solutions to the end-clients for the most part through system integrators

16 teleste, Enabling Digital Evolution
network Services (nS) make available network design and high-quality installation and maintenance services for european cable and Fttx operators. The customers are often leading operators in their respective countries and they have a vision of providing their subscribers with compelling services, including high-speed Internet access, pay television, video-on-demand and telephony.
net sales of networks Services grew by 9.4% over the year of comparison standing at eUR 93.9 (2010: 85.8) million. De-spite this growth in net sales, operating income increased only slightly on the previous year and amounted to eUR 1.2 (1.1) mil-lion. In germany, the service process was streamlined, but the impact of the conducted measures on profitability did not pro-duce the desired result yet. Profitability of the german services business was also eroded by the services consisting of more basic deliveries in which the price and margin levels are lower. Moreover, operating profit was reduced by limited sub-contract-ing resources and severe weather in the beginning of the year. The total number of employees in the services business stood at 764 (713), out of which 640 in germany. teleste’s services business is also strongly present in the UK, Belgium, Switzerland and Finland.
The relative importance of cable tV programming for our cli-ent base has increased significantly together with the growth
of value-added tV services and high-speed Internet access. operators are also paying increasing attention to measurements of customer satisfaction, and have realized the importance of reliable, high-quality technical services in their pursuit to meet and exceed the customers’ expectations. In this context, the need for a specialized and professional services partner is em-phasized and, at the same time, teleste’s expertise comes into its own. Many customers have found that cooperation with a partner specializing in cable technology (HFc) brings in better results compared with those obtained with a local mainstream contractor.
Development measures in germanycurrently, the german operations of network Services account for, by far, teleste’s largest country organization. In 2011, the german activities were subject to vigorous development. A ma-jor restructuring program was successfully implemented at the same time with streamlining of the german regional operations. The teleste Way-of-Working was introduced, and the german service brands were aligned so that we now operate exclusively under the cableway brand. Similarly, the local administrative structure was reformed to cut down on overlapping functions that were brought about as a result of several acquisitions. The
Year of organic growthnetWoRK SeRVIceS

Year 2011 17
BusinEss AREAs, netWoRK SeRVIceS
ouR Vision: to be the preferred partner providing technical services for european cable operators.
solutions: new construction, upgrading planning and maintenance services for cable networks
kEY mARkEts: northern and central europe
pRimARY CliEntElE: operators providing television and broadband services and looking for improved customer experience
impact of these cost-saving measures is expected to appear in 2012.
Furthermore, integration of the Ict infrastructure and pro-cesses with teleste corporation was launched with the intention of taking advantage of our increased purchasing volumes.
organic growth by Cross-sellingIf earlier network Services used to grow largely through acquisi-tions, in 2011 we focused actively on pursuing fresh revenue from amongst our existing customer base. In the past 12 months, the business was expanded in several countries. In Britain, new ser-vice customerships were obtained, and growth was also achieved through the existing customers. In addition, the local organiza-tion was strengthened, in particular for the part of business de-velopment and sales operations. our strengthened market posi-tion enables continued growth. In Belgium, product range was expanded from network planning to field installations. In Finland, the first significant network upgrade projects were received and our own installation operations were launched. Furthermore, we successfully delivered Fttx installation services to several cus-
tomers, going beyond our usual scope of HFc applications and transfer of video. In Switzerland, new opportunities for services were found while utilizing the synergies between product sales and services operations. Many of the above measures were car-ried out by making active use of the service opportunities related to teleste’s existing customers.
growth opportunities in many Areasnetwork Services have a lot of opportunities to grow profitably in the countries where they already operate. As for customers, teleste is a viable partner thanks to the excellent reputation achieved on the product and technology side and the credibility gained in field work over the past 3-4 years. Moreover, there are a number of european countries where teleste has a significant market share in terms of product business, but where the provi-sion of services has not yet been exploited.
We keep acquisitions, organic growth and focused partner-ships in our toolbox while keeping an active eye on the market, focusing on quality, customer satisfaction and profitability in our services operations.
0
25
50
75
100
ns nEt sAlEs
09 10 11
shARE of pERsonnEl
Video and Broadband Solutions, 43,3%
network Services, 56,7%
shARE of nEt sAlEs
Video and Broadband Solutions, 48,9%
network Services, 51,1%0
25
50
75
100
ns oRDERs RECEiVED
09 10 11

18 teleste, Enabling Digital Evolution
YouSee to Increase Their network capacity
•customerships spanning over decades
•new, significant customerships
cUStoMeR PRoJectS
As the biggest cable operator in Denmark YouSee A/S provides 45% of
the households or 1.3 million customers with tV, high speed Internet and
telephony services. The headquarters is located in copenhagen with of-
fices throughout Denmark. YouSee is a fully owned subsidiary of tDc, the
largest telecom and mobile operator in Denmark.
YouSee has always been a pioneer in launching new service inno-
vations within european cable industry. They have launched already in
2010 their catch-up and start-over -services, which are today offered as a
multiscreen (tV, laptop, pad) service to their cable subscribers. The launch
of these new services has been truly successful, with large number of
households who have subscribed to the service and these subscribers
are using the time-shifting options extensively. Watching tV is expected
to disengage from time and place, so this trend can only be expected to
grow in the near future.
These services, together with ever growing need for high-speed
broadband Internet connectivity, are generating lots of traffic to the You-
See cable access network. Accordingly, YouSee has started measures
to increase the capacity of their network infrastructure. over the com-
ing years the large upgrade deployment with segmentation of the cable
network feeding fibre closer to the customer will be implemented in the
entire network across Denmark.
teleste has, for more than a decade, been a supplier of various
types of equipment for the YouSee cable network. There is a tradition
of close co-operation, at all levels in the organisations, between YouSee
and teleste. Accordingly, teleste was pleased to be invited to the profes-
sional tendering process which is typical for such a large investment. The
tendering process resulted in YouSee selecting teleste as the preferred
supplier for the network upgrade project, and a three-year frame agree-
ment was signed in the beginning of 2012, with an option to extend the
agreement for an additional period until the end of year 2016.
The tendering process included techno-economical evaluation of net-
work architectural options, as well as an extensive acceptance test of
the products, not only as a lab test but also in the field with live traffic.
The agreement includes deliveries of teleste´s most advanced fiber-
optic products required for the upgrading the access infrastructure. This
improvement is YouSee´s response to the increased demand for both
broadband and, in particular, unicast traffic. Deep Fiber Architecture, in
which the optical fiber is brought closer to subscribers, improves net-
work performance and reliability. Reduced network segment allows for
more competitive data rates while the smaller number of equipment en-
ables lower maintenance costs. Power consumption, too, is significantly
reduced.
The network solution is based on teleste’s fibre optic products in the
HDo platform series and Ac9000 intelligent node.

Year 2011 19
CustomER pRoJECts
Mobile teleSystems oJSc (“MtS”) selected deployment of both teleste
Luminato video headend platform and the teleste Broadcast Manager
service management solution for their nationwide digital tV network.
MtS is the leading telecommunications group in Russia, east europe
and central Asia offering mobile and fixed voice, broadband, pay tV as
well as content and entertainment services in one of the world’s most
rapidly growing areas. The group provides services to over 108 million
mobile subscribers in Russia, Ukraine, Uzbekistan, Armenia and Belarus.
As for fixed solutions, the group has more than 3 million pay tV subscrib-
ers and over 2 million users of broadband Internet services. Put together,
there are more than 230 million people living in the area.
Fixed broadband network and digital services development is one
of MtS key interests. MtS has already implemented several projects for
construction and modernization of fixed networks in Russia and plans to
convert all the networks in digital format in 2012-2013. now, MtS devel-
ops its video distribution network by digitizing the video headends in or-
der to be able to offer its customers a more versatile channel lineup, but
also additional services as well as high-definition content all over Russia.
The deployment of digital tV headend solution will consist of dozens
of headends in 90 cities nationwide by the end of 2013. The core of the
solution will be formed by the teleste Luminato video headend platform
and the teleste Broadcast Manager service management and ePg solu-
tions. The used technology provides a compact and flexible solution for
high-quality digital tV services in the foreseeable future.
MtS goes Digital
“This project is of major strategic importance to us and, therefore, we
need a partner we can rely on for years to come. teleste’s reliability as a
supplier, modern technology and continuous efforts in product develop-
ment form a strong basis for this cooperation. We are very pleased to
have teleste as our partner”, says Dmitry Bagdasaryan, the Director for
fixed business development, MtS oJSc
MtS has been satisfied with teleste’s shown performance. The ten-
der was closed in August 2011. In just a few months, by the end of 2011,
teleste had successfully delivered several hundreds of fully furnished Lu-
minato headends, including DVB-S receivers (both dual and quad) along
with the Broadcast Manager systems. The initial headend project will
continue in 2012 bringing also other new opportunities to widen the co-
operation of the two companies.
close cooperation with Kabel Deutschland
Listed company Kabel Deutschland is germany’s largest cable operator,
which through its networks serves about 8.7 million households. Kabel
Deutschland provides its customers with competitive and modern digital
tV services and HDtV services, analog tV channels, video on demand,
pay-tV services, video recording services as well as very fast, up to 100
Mbit/s Internet connections. Furthermore, the company makes available
telephone services in its own cable tV network while offering mobile com-
munications services through a partner’s network.
Kabel Deutschland has collaborated with teleste’s subsidiary cable-
way Ag for several years. cableway provides Kabel Deutschland with a
wide range of technical services from network upgrade projects, mainte-
nance, design and documentation services and access delivery services all
the way to network expansions.
combined with active cooperation between the companies, success-
ful delivery of services to Kabel Deuschland is based on cableway’s high
technical expertise and a broad geographical coverage in germany. In ad-
dition to daily operational activities the companies actively collaborate in
various development projects, with the aim of improving the quality of
the client’s network even further. Also teleste´s products, such as ampli-
fiers and passives, are widely used.

20 teleste, Enabling Digital Evolution
elisa is a listed communications services provider and Ict company on
the Helsinki Stock exchange that serves approximately 2.2 million con-
sumers, companies and government organizations. In Finland elisa has
more than 250,000 cable television subscribers. elisa’s total net sales
for 2010 equaled 1.46 billion euros and the company employed approxi-
mately 3,600 people.
In early 2011, elisa placed an order with teleste for plans involving
upgrading the HFc network in the area of city of Riihimäki, covering ap-
proximately 10,000 subscribers and more than 700 street cabinets. once
the planning had begun, elisa and teleste also discussed the installation
work, and elisa decided to order the installation for the area from teleste
on the turnkey principle. The selected hardware solution is based on de-
vices in the Ac3000/3200 series standing for teleste’s new generation
of amplifiers and M Series passives. elisa’s aim is to improve the network
reliability and increase the capacity offered to the subscribers. In connec-
tion with the project other measures designed to increase capacity have
also been carried out, such as reducing the cell size of the network by
installing Ac800 fiber nodes.
The work was begun in spring as soon as the snow conditions al-
lowed efficient working. In addition to street cabinets the project also
included replacement of distribution amplifiers. The model of the project
is an exception to elisa’s earlier approach to network upgrades , since,
for instance, teleste has handled the material call-offs in the field, thus,
relieving the workload of elisa’s own personnel in practical terms. As to
device installations, preparations have been made for a possible introduc-
tion of a element monitoring system in the future. High quality of work
is ensured by comprehensive documentation and recording of installa-
tion data. Jari Simpanen (Head of Department, elisa oyj, Fixed Access):
“cooperation with teleste in the Riihimäki project has gone well and we
are very pleased with the installation work and the quality of operations.
everything has gone on schedule. Since teleste works as the equipment
supplier while being responsible for the planning and installation, cooper-
ation with elisa has been seamless and characterized by strong expertise
in cable technology. We have also placed an order for a similar project
over network restructuring in the surrounding municipalities of Riihimäki”.
Hot Upgrades to Fibre
Hot telecommunication Systems Ltd. is Israel’s premier cable television
operator offering the triple Play by providing over 160 channels including
HD, video-on-demand (VoD) services as well as the fastest Internet surf-
ing in Israel with 100Mb/s based on DocSIS 3 technology, IP telephony
over cable and telecommunication services.
Hot serves more than 900 000 subscribers to multi channel televi-
sion services with 61% tV market share, 765 000 customers to Internet
services for 40% market share and in excess of 630 000 lines of tele-
phone services. About 1.3 million Households in Israel (over a total of 2
millions) subscribe to Hot services.
Hot is constantly looking for innovation and seeks to understand
the needs of customers in a world of rapidly changing technologies. The
company runs an advanced, fiber-based cable network infrastructure
extended to each building and implemented through FttLA-technology
(Fibre to The Last Amplifier). The total length of fiber lines is more than
6 500 km.
The large-scale Fttx upgrade deployment program of Hot telecom
cable networks covering two million homes passed, will be done during
the coming 4 years by changing the architecture from classical HFc to-
wards deep fibre to enable higher capacity for new and future services.
Hot chose teleste as their partner after careful evaluation of com-
mercial and technological aspects.
The Hot strategy is to invest into HFc network upgrades continu-
ously, replace coaxial network segments by fibre and migrate closer to
the subscriber premises to be prepared for the future. Therefore FttLA is
the right choice and being highly committed to highest standard of quality
and services where high quality products are a necessity. Hot decided to
use teleste´s Ac, cXe and HDo family products .
cUStoMeR PRoJectS
elisa to Improve Their network Reliability

Year 2011 21
CustomER pRoJECts
no more than a year ago teleste secured a position as a technology sup-
plier for the winning consortium to supply Préfecture de Police (PdP) in
Paris metropolitan area state-of-the-art video surveillance platform. In the
project teleste is responsible on active video networking equipment, re-
cording infrastructure, software applications, and the required elements
for the proper operation and security of such a system, according to reg-
ulations related to video surveillance. In December 2011 and after two
months of intensive trials and field testing, the first phase with 200 cam-
eras was officially taken in use for round-the-clock. Within next 6 months
the system will expand to manage several thousand additional camera
feeds. once fully up and running, this urban video protection system for
public areas will provide a decision tool to facilitate traffic management,
maintenance of law and order, fight against crime and terrorism and res-
cue operations thru the whole capital of France.
In plain figures the system will manage directly more than 1.200 cam-
eras within Paris territory, and will interconnect with other security net-
works across Paris metropolitan area, in total covering more than 12.000
cameras: railways (SncF), underground, city of Paris traffic control, large
Parisian malls, etc. In addition, the system will include over 250 worksta-
tions, 55 monitoring centres, around 2500 operators, digital video stor-
age for 30 days recordings and authentication of video evidential material.
The complete system is based on backbone of a 400 km long and fully
secured and redundant optical 10ge network.
Main users of the system, the Paris area authorities (department of
Ministry of the Interior), appreciates this unified system that interconnects
both the private and public video surveillance systems. The user-friendly
technology with clear and homogenous user interfaces provide authorised
officers access to live videos but also recordings with indexed data and
timestamps. Duty reports and event management is supported with addi-
tional tools. The operation with multiple simultaneous camera connections
is supported with highly developed and geographical Information System
(gIS). Although the core system operation is based on open standards,
the system is taking all the advantages of secured and highly protected
network communication methods.
The, by teleste provided equipment consist of cFo fiber optics, new
line of MPH series H.264 encoders and VMX video management building
blocks, both software and hardware. The project took an advantage of
some recently developed features in the VMX video management plat-
form. A particular new area in software architectural entities is based on
web services modules, which are bringing totally new dimension to the
VMX platform and its functionality.
next generation city center Monitoring to Paris
•Deliveries of increasingly innovative solutions
•ever larger system deliveries
•World-class technology solutions

22 teleste, Enabling Digital Evolution
As an innovative technology group, teleste’s expertise and com-petitive edge are based on motivated and professional person-nel. The function of human resources is to create an organiza-tion, which supports the corporate business strategy while being flexible, innovative and learning. At the year-end 2011 teleste corporation employed 1319 people.
Customer-focused ThinkingThe long-term objectives of our human resources management include satisfied, committed and skilled personnel, which is sup-ported by good leadership, open and inclusive working culture as well as by active HR processes. each year teleste’s operation is also formulated by a chosen theme, which provides the frame-work for the planning and implementation of the topical devel-opment activities. The theme selected for 2011 was “growing together with The customer”
Development of age management was particularly highlight-ed in the continuous improvement of teleste’s HR management and the related support for leadership. In 2011, new tools were introduced and supervisors were trained in the management of employees of different ages.
to strengthen open and inclusive working culture, person-nel were encouraged to participate in activities related to the theme of the year. In the past year, understanding concerning teleste’s business and the underlying factors was enhanced, and
the importance of customer-centric thinking was emphasized throughout the organization. concrete actions included a per-sonnel training workshop, key customer presentations for the personnel, visits to customers’ premises as well as strategic and operational development projects.
Appropriate HR management processes ensure good hu-man resources policy and high-quality management of employee issues. Prioritization and measures were keyed on continuous improvement and harmonization of the group’s employment is-sues as well as HR management practices by means of manage-rial communication and training.
Achievement of the goal specified as “Satisfied, committed and skilled personnel” has been assessed by means of teleste’s internal job satisfaction surveys implemented by work communi-ties. corrective actions were carried out based on results ob-tained from the surveys, and in-house vocational training was provided for the business units.
incentive payteleste’s pay and incentive schemes are based on profitability on the corporate, team and personal levels. The deployed incentives include systems of bonuses and payment by results as well as those involving share bonus schemes and options. Implementa-tion of teleste’s equality plan has been evaluated together with personnel representatives.
Innovative and Learning organization
Year 2011 23
hR Vision: Flexible, innovative and learning organization in support of teleste’s strategy
hR mission: Personnel structure and expertise support the corporate strategy and objectives
hR oBJECtiVEs: good governance, open and inclusive work culture, working HR processes and satisfied, committed and skilled personnel
pERsonnEl
thE thEmE foR 2011: growing together with The customer
long-term CareersWe at teleste believe that well-being at work is shaped by good atmosphere and motivation, and a healthy working community signals a positive employer image and contributes to ensur-ing the permanence of skilled employees. Well-being at work is monitored on a regular basis through discussions with the oc-cupational health care. For example, long years of service are indicative of job satisfaction among the personnel. At the end of the year 2011 we celebrated 20 individuals who had 10 years of service (previous year 55) and 2 persons with 20 years of service (previous year 8).
teleste’s leisure time committee called Vapari is selected annually from amongst the personnel. This body is in charge of organizing summer and christmas parties and various events related to physical exercise, like the annual champion cycle com-muter competition. teleste also promotes many types of physi-cal activity by the personnel through financial support.
natural interactioncontinuous interaction and flow of information between the personnel and the employer is ensured by meetings held every month between the employer and the employee representatives.
Moreover, interaction between the management and personnel is maintained by regular meetings between the representatives of the management and the employees. This has helped to cre-ate a flexible co-operation, which allows for quick adaptation to changes in the market.
The safety committee meets regularly to evaluate the work-ing environment, its safety and possible risk factors. The pre-pared plans and measures are designed to turn safety into a part of everyday work.
Cooperation with Educational institutionsconstruction of a positive employer image for future profession-als was continued through cooperation with universities and other educational institutions. This process has taken forms such as research collaboration, patronage, and teleste’s representa-tion in various bodies of universities and educational institutes. teleste is also represented in the Law and education and Labour committees of the turku chamber of commerce. The mandate of education and Labour committee includes ensuring the avail-ability of skilled workforce and skills development issues. The committee is particularly active at the interface between enter-prises and educational institutions.
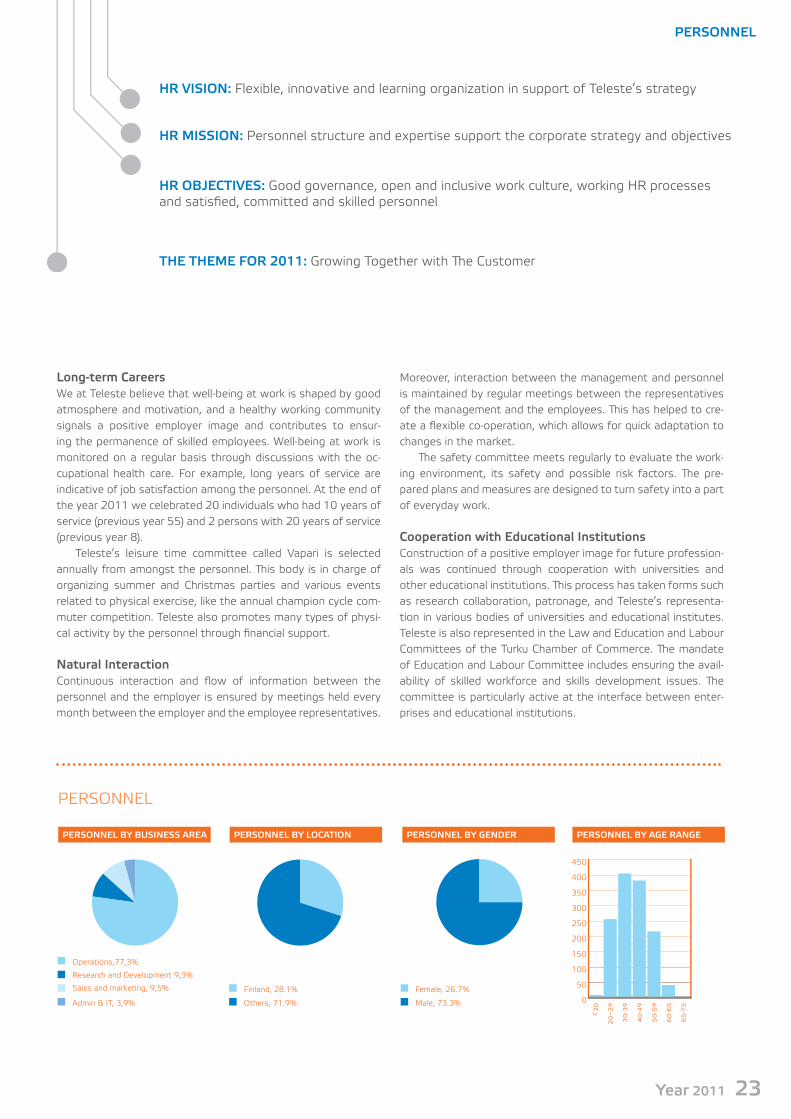
0
50
100
150
200
250
300
350
400
450
pERsonnEl BY AgE RAngEpERsonnEl BY gEnDERpERsonnEl BY loCAtionpERsonnEl BY BusinEss AREA
<20
20–2
9
30-3
9
40-4
9
50-5
9
60-6
5
65-7
5Male, 73.3%
Female, 26.7%
others, 71.9%
Finland, 28.1%
Admin & It, 3,9%
Sales and marketing, 9,5%
operations,77,3%
Research and Development 9,3%
PeRSonneL
24 teleste, Enabling Digital Evolution
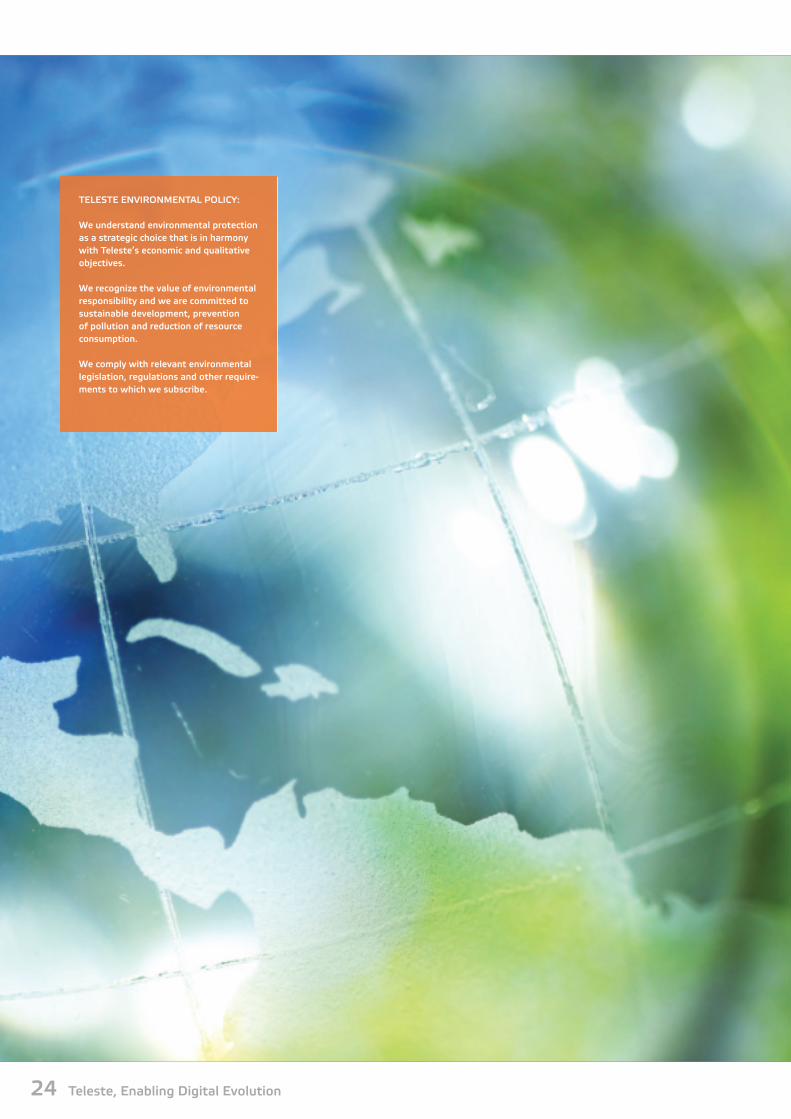
tElEstE EnViRonmEntAl poliCY: We understand environmental protection as a strategic choice that is in harmony with teleste’s economic and qualitative objectives.
We recognize the value of environmental responsibility and we are committed to sustainable development, prevention of pollution and reduction of resource consumption.
We comply with relevant environmental legislation, regulations and other require-ments to which we subscribe.

Year 2011 25
soCiAl REsponsiBilitY AnD sustAinABlE DEVElopmEnt
new Innovations for More environmentally Friendly Products
We at teleste believe that a growing business can only be based on principles of sustainable development and social responsibil-ity. teleste code of conduct has been published to demonstrate our commitment to the determined policy of present and the future. This code, together with our previously published values, lays down the principles on which teleste’s operations are based in practice.
teleste requires that also its partners, suppliers and contrac-tors comply with the same set of ethical principles. For example, the company does not accept the use of child labor in any form and, therefore, declines to have any business with communities that do not follow this principle. Acceptance of social respon-sibility is already a widespread practice in the industry, since also teleste’s customers and partners often require adherence to these same principles of social responsibility and sustainable development.
Threat posed by Counterfeit productscounterfeiting is a major problem in many industries. It can give rise to quality problems, violate proprietary rights and lead to unethical behavior. Unfortunately, the electronics industry is not immune to unethical conduct, whereby most of the cases involve raw materials of electronic components that may come from il-legal sources.
teleste is aware of these risks and wants to contribute to the fight against counterfeiting. We are is committed to the five key principles presented below, and also expect our suppliers to promote the following by their actions in their own businesses:
1. combating piracy by means of supplier channel selection2. Utilization of one’s own capacity of manufacturing and final
assembly in a profitable manner3. Purchases are made through authorized and trusted suppli-
ers and trusted channels4. Supplier audits are carried out regularly5. All suppliers should promote these principles in their own
businesses.
protecting the Environment by innovationsone essential component in social responsibility is the commit-ment to protecting the environment and support to sustainable development. teleste operates responsibly in environmental matters. We at teleste believe that sustainable development arises from commitment to sustainable development in all its
operations and from the values of innovation designed to im-prove sustainable development.
good examples of how product innovation can support sus-tainable development are provided by teleste’s renewed cAtVi-sor eMS Management Software and Ac9000 fiber optic node. network management and more accurate fault location featured by cAtVisor eMS Management Software help customers focus on the essentials and target remedial action to the right place and, thus, reduce any unnecessary truck rolls of the field install-ers, and thereby reducing the carbon footprint. In turn, the new Ac9000 fiber optic node can be managed remotely, and it has advanced automatic control features. Its automatic power con-trol based on the latest component technology ensures that the power consumption of the device is always at the optimum level. Moreover, teleste’s volume amplification products now include power supplies with the Power Factor correction (PFc) feature, capable of regulating their own efficiency. This reduces the con-sumption of reactive power in the product’s life cycle.
tElEstE EnViRonmEntAl oBJECtiVEs
• Promotion of product-driven environmental thinking
• Reducing the amount of waste• Reduction in energy consumption• continuous environmental improvement in
logistics and transport• Promotion of environmentally conscious
thinking in supply chain• Increasing environmental awareness
among the personnel

26 teleste, Enabling Digital Evolution
highlights 2011
measures designed to help reducing greenhouse gas emissions, among others
• transportation of raw materials has been reduced by better classification of raw materials and by de-veloping methods of prediction. Intervals between deliverables have been reduced while batch sizes have been increased.
• R&D moved over onto new more energy efficient premises at the headquarters in Littoinen. At the same time, passenger and freight transport between different offices was eliminated.
• Limit to co2 emissions was specified for new car leasing contracts.
measures designed to reduce the load caused by teleste’s products
• Introduction of the PFc power supply in the amplifiers of the Ac product range.
• Introduction of state-of-the-art component technology in our new fiber optic node.
• The new HDo transmitter, with the power consumption approx. 40% smaller than its predecessors.
• eMS network management software featuring more accurate fault location.
0
100
200
300
400
number of items
09 10 11 0
500
1 000
1 500
2 000
total power consumption
09 10 11
pRoDuCt gEnERAtions in tERms of EnViRonmEntAl fRiEnDlinEss
ModulesRecuired space
chassis
DVX
AtMux
Luminato
DVX
AtMux
Luminato
DVX is teleste´s latest headend system for managing and delivering of the analogue tV and radio channels.
Atmux was teleste´s first digital headend platform for processing and transmission of the digital tV services. luminato is teleste´s next generation headend platform for the IP-based cable television and IPtV services transmission.
Innovations spanning across product generations in aid of sustainable development have long been an important priority at teleste. For example, video headend systems have evolved considerably over the years in terms of their size, customer’s requirements for a smaller footprint and the power consumed by the system in its life cycle. teleste’s latest Luminato system is based on a new generation of components, which allow the production of an even more energy-efficient and compact head-end system. For the customer this means savings in electricity consumption in the system’s life cycle and in need for cooling the premises as well as prolonged life thanks to a lower operating temperature and improved service reliability.
commitment to sustainable development in everything we do also extends to our production and premises. In 2011, we enhanced heat collection on our premises in Littoinen and, thus, ensured an even better energy efficiency of our property.
Reducing the Environmental loadWe at teleste understand environmental protection as a strate-gic choice, which is in line with our economic and qualitative ob-jectives. We recognize the value of environmental responsibility and we are committed to sustainable development, prevention
of pollution and reduction of resource consumption. We comply with relevant environmental legislation, regulations and other in-dustry requirements to which we subscribe.
Based on continuous improvement, and in compliance with our environmental policies, teleste is committed to bringing down the environmental load of its own making. teleste has been granted the ISo 14001:2004 environmental management system certification. teleste complies with environmental legisla-tion and regulations in all of its operations. We at teleste keep an eye on developments in different markets and any implications thereof to our operations. teleste’s operations are guided by its environmental policy, which has been communicated to the com-pany’s employees.
low Environmental impact by productionAt teleste, the environmental burden caused by the manufactur-ing of our physical products is relatively low compared to the impact of the product’s life cycle as a whole. our production is based on the assembly of PcBs and electronic devices, the pro-duction of which gives rise to no significant emissions. Further-more, teleste is a significant producer of software applications and the environmental impact of these is very limited. environ-
BeFoRe: DVX analogue headend AFteR: Luminato digital IPtV-headend

Year 2011 27
highlights 2011
soCiAl REsponsiBilitY AnD sustAinABlE DEVElopmEnt
1. Compliance with laws and Regulations teleste along with its subsidiaries, agencies and offices undertake to comply with the national laws of the coun-try, where the given teleste office is located or where teleste is operational.
2. Clientele teleste undertakes to maintain the trust and respect en-dowed upon us by our customers. teleste competes fairly and honestly in supplying products and services to its customers. Illegal or unethical behavior is not tolerated.
3. human Rights teleste respects and complies with internationally rec-ognized human rights, such as those specified in the Un Declaration and the ILo convention.
4. forced labor teleste does not engage in, or support, forced labor, nor any non-voluntary work.
5. Child labor teleste does not engage in, or support, the use of child labor.
6. prohibition of Discrimination teleste supports diversity and equality. All teleste em-ployees are required to appreciate and respect different cultures and customs in the workplace, and no discrimina-tion in the workplace will be tolerated.
7. freedom of Assembly open and direct communication between employees and management is the most effective way to solve is-sues related to employment and remuneration/rewards. employees must be able to communicate openly with the management about working conditions without fear of intimidation or harassment.
8. health and safety at Work teleste is committed to paying attention to employees’ health and safety as well as conducting its operations in accordance with applicable laws and regulations.
9. prohibition on Bribery teleste with its employees are committed to integrity, honesty and fairness with regard to both internal and external relations of co-operation.teleste does not allow, condone, encourage or promote, directly or indirectly, il-legal or unethical activities, such as bribery, or other activi-ties, which can be interpreted as being corrupt, illegal or unethical.
10. Environment teleste respects the environment and is committed to operating in compliance with applicable laws and regula-tions.
11. supplier Co-operation The abovementioned points provide the selection criteria for our suppliers, who are expected to comply.
in its opERAtions tElEstE ConfoRms to thE folloWing EthiCAl pRinCiplEs
mental load related to teleste’s operational activities arises from generation of waste, energy consumption and transportation.
We at teleste aspire to reduce our generation of waste in all operations. Waste is sorted and most of it is recycled or used for energy, so only a very small fraction ends up in landfill. The amount of hazardous waste is minimal and even that can be mainly recycled. Items consuming energy include heating and power for production facilities, testing equipment and office equipment.
environmental pollution caused by duty travel is further re-duced by adding and expanding the use of tools provided by modern information technology, such as teleconferencing. Fur-thermore, we encourage our personnel to use bikes for daily commuting over short distances instead of car.
importance of Energy Efficient productsAt teleste, environmental management focuses on the manage-ment of indirect environmental impacts in the product’s entire life cycle. This lays more emphasis on the significance of cooperation with our suppliers, subcontractors and customers. environmen-tal issues have been incorporated into evaluations of suppliers and subcontractors, and we require commitment to continuous environmental improvement.
As to minimizing the environmental impact caused by our products, product development provides a tool of great impor-tance. currently, our final products mainly consist of recyclable materials like metals. Systems included in cable networks and video surveillance are, by nature, relatively long-lived compared to other electronic equipment, such as consumer electronics. Moreover, they are maintainable as well as upgradable, which means that their life-cycle can be extended even more. This is to say that the single most significant environmental aspect related to our products is the power they consume. In recent years, par-ticular attention has been paid to this aspect.
At teleste, we also put a particular emphasis on the end-product packaging and the related environmental friendliness. Most of the packaging materials are fiber-based, which allow for easy recycling.
Reducing the Environmental impact in 2011Regarding its operations teleste has defined long-term environ-mental objectives, which are subject to annual specification by way of more detailed environmental goals.
teleste’s code of conduct is available on teleste website at http://www.teleste.com/Investors/teleste Values/code of conduct

28 teleste, Enabling Digital Evolution
BoARD of DiRECtoRs
mARJo miEttinEn
M.Sc. (ed.), born in 1957chairman of the Board since 2009–eM group oy is a significant shareholder of teleste
Principal occupation:eM group oy, ceo 2006–
Primary working experience:ensto oy, chairman of the Board 2002–2006ensto oy, managerial positions 1989–2001
other elected positions of trust:componenta corporation, Member of the Board 2004–efla oy, chairman of the Board 2007–eM group oy, Member of the Board 2005–ensto oy, Member of the Board 2002–technology Industries of Finland, Member of the Board 2007–
pERtti ERVi
B.Sc. (eng.), born in 1957Member of the Board since 2009–Independent of teleste and its significant shareholders
Principal occupation:Independent consultant
Primary working experience:computer 2000, co-President until 2000computer 2000 Finland oy, MD until 1995
other elected positions of trust:efecte oy, Member of the Board 2009– , chairman of the Board 2011–Forte netservices/groupservices oy, Member and chairman of the Board 2000–F-Secure corporation, Member of the Board 2003–, chairman of the Audit com-mittee 2006–Inventure oy, chairman of the Board 2005–Ixonos Plc, chairman of the Board 2011–nevtor oy, chairman of the Board 2008–
tERo lAAksonEn
M.Sc. (Math.), born in 1946Member of the Board since 1999–Independent of teleste and its significant shareholders
Principal occupation:Professional Board Member
Primary working experience:comptel corporation, ceo 2002–2004telia Finland oy, ceo 1998–2001nokia telecommunication oy, SVP 1995–1998
other elected positions of trust:Ixonos Plc, chairman of the Board 2005–2011tieto-X Plc, Member of the Board 2004–2005

Year 2011 29
BoARD of DiRECtoRs
pEttERi WAllDén
M.Sc. (eng.), born in 1948Member of the Board since 2009–Independent of teleste and its significant shareholders
Principal occupation:M.Sc. (eng.)
Primary working experience:Alteams oy, ceo 2007–1/2010onninen oy, ceo 2001–2005ensto oy, ceo 1996–2001nokia Kaapeli oy, ceo 1990–1996Sako oy, ceo 1987–1990
other elected positions of trust:
comptel corporation,
Member of the Board 2009–
Kuusakoski group oy,
Member of the Board 2007–
Mesera Yhtiöt Inc.,
Member of the Board 2010–
nokia tyres plc,
chairman of the Board 2006–
tikkurila oyj, Member of the Board 2008–
pERtti RAAtikAinEn
Dr. Sc. (technology), born in 1956Member of the Board since 2003– Independent of teleste and its significant shareholders
Principal occupation:Vtt Ict, Director technology 2009–
Primary working experience:Vtt Information technology, Research professor, 1998–2008Helsinki University of technology, Docent 2002–University of Jyväskylä, Docent 1998–Helsinki University of technology, Professor (fixed term) 1997
kAi tElAnnE
M.Sc. (econ.), born in 1964Member of the Board since 2008–Independent of teleste and its significant shareholders
Principal occupation:Alma Media corporation, ceo 2005–
Primary working experience:Kustannus oy Aamulehti, Managing Director 2001–2005Kustannus oy Aamulehti, Deputy MD 2000–2001
other elected positions of trust:talentum oyj, chairman of the Board 2011–Varma Mutual Pension Insurance company,Member of the Board 2009–

30 teleste, Enabling Digital Evolution
mAnAgEmEnt gRoup
JukkA RinnEVAARA
M.Sc. (econ.)President and ceoBorn in 1961
Joined teleste in 2002
Primary working experience:ABB Installaatiot oy, President 1999–2001ABB Building Systems, group Senior Vice President 2001–2002
other elected positions of trust:Ventilation Holding Finland oy, Member of the Board 2008–Salcomp Plc, Member of the Board 2009–Finland chamber of commerce, Member of the Board 2011–
JohAn slottE
LL.M, eMBADeputy ceoBorn in 1959
Joined teleste in 1999
Member of the Management group since 1999–
Primary working experience:Uponor group, Various directorial positions 1989–1999
ERJA sAARikoski
Business school graduatecFoBorn in 1953
Primary working experience:Joined teleste in 1984
Member of the Management group since 2002–

Year 2011 31
mAnAgEmEnt gRoup
Juha Järvenreuna was a member of the Management group until 1 Sep 2011.
Andree Kang started as a member of the Management group as of 1 Feb 2012.
hAnno nARJus
M.Sc. (econ.)Video and Broadband Solutions, Senior Vice PresidentBorn in 1962
Joined teleste in 2006Member of the Management group since 2007–
Primary working experience:teleste corporation, Director, Sales/continental europe 1989–1996nokia corporation, Various managerial positions 1996–2006
AnDREE kAng
Ph.D. (eng.)network Services, Senior Vice PresidentBorn in 1964
Joined teleste 1st. Feb. 2012Member of the Management group since 2012–
Primary working experience:emerson network Power germany, general Manager Power Products & Services 2010–2011chloride Poland, President 2009–2011Masterguard gmbH, MD 2007–2011
Esko mYllYlä
B.Sc. (eng.), cBAResearch and Development, ctoBorn in 1966
Primary working experience:Joined teleste in 1994
Member of the Management group since 2006–
mARkus mAttilA
M.Sc. (eng.)operations, Senior Vice PresidentBorn in 1968
Joined teleste in 2008Member of the Management group since 2008–
Primary working experience:nokia Mobile Phones/nokia corporation, managerial and directorial positions in opera-tions, Logistics and Sourcing 1993–2008

32 teleste, Enabling Digital Evolution
share Basicsteleste corporation is listed on the nASDAQ oMX Helsinki oy in the technology sector. The company shares are included in the book-entry securities system. The company has one series of shares. In Annual general Meeting each share carries one vote and confers an equal right to a dividend. on 31 December 2011, teleste’s registered share capital stood at eUR 6,966,932.80 divided in 18,728,590 shares.
As to the company share price in 2011, the low was eUR 2.50 (3.64) and the high eUR 4.82 (5.33). closing price on 31 December 2011 stood at eUR 3.00 (4.41).
Facts about the share:trading code tLt1VListed on 30 March1999Listing price 8,20 € ISIn code FI0009007728Reuter’s ticker symbol tLt1V.HeBloomberg ticker symbol tLt1VFH
financial Releases in 2012:Financial publications including the stock exchange releases are available in Finnish and english at the company website.
Publication dates:Interim Report, January–March 26 Apr 2012Interim Report, January–June 1 Aug 2012Interim Report, January–September 31 oct 2012Financial Statement Release 1 Feb 2013
Publications can be ordered directly to your e-mail from the on-line news release service on teleste’s website
Changes in shareholders’ Contact informationThe shareholder register is maintained by euroclear Finland oy.Shareholders are kindly requested to inform the custodian of their book-entry account of any changes in contact details.
Information for Shareholders
Annual general meetingteleste corporation’s Annual general Meeting (AgM) will be held on tuesday, 3 April 2012, commencing at 3 p.m., in Helsinki Hall at Finlandia Hall in Helsinki, Mannerheimintie13 e.
Shareholders registered on the list of shareholders with eu-roclear Finland oy on Thursday, 22 March 2012 are entitled to participate in the Annual general Meeting. Shareholders wishing to attend the Annual general Meeting must sign up with the company no later than by 4 p.m. on Monday, 26 March 2012.
sign up to the Agm by one of the following:by email at [email protected],by telephone +358 2 2605 611 Monday-Friday between 09:00-16:00 eet;by telefax +358 2 2605 812; orby regular mail to the address teleste corporation,tiina Vuorinen, P.o.Box 323, FI-20101 turku, Finland.
proposal for Distribution of Dividend 2011The Board of Directors proposes to the Annual general Meeting that, based on the adopted balance sheet, a dividend of eUR 0.14 per share be paid for shares other than those in company possession for the fiscal year that ended on 31 December 2011.
Annual general Meeting 3 Apr 2012Dividend ex date 4 Apr 2012Dividend record date 10 Apr 2012Payment of dividend 17 Apr 2012
FINANCIAL STATEMENTS 2011
Enabling Digital Evolution

REpoRT oF ThE boARD oF DIRECToRS 1
CoRpoRATE FINANCIAL STATEMENT 4
Statement of comprehensive income 4
Statement of financial position 5
Consolidated cash flow statement 6
Cosoldated statement of changes in equity 7
Accounting principles 8
Segment reporting 15
Business combinations acquired during 2011 and
2010 17
Notes to the consolidated income statement and
balance sheet 18
FINANCIAL STATEMENT oF MoThER CoMpANY 36
Income statement 36
Balance sheet 37
Cash flow statement 38
Accounting principles 39
Notes to the consolidated income statement and
balance sheet of mother company 40
Proposal for the distribution of earnings 45
Auditor’s report 46
Corporate governance statement 47
Key figures 2007-2011 50
Calculation of key figures 51
Shares and shareholders 52
CoNteNt

business Description and overview Video and Broadband Solutions’ net sales and profitability increased over the year of comparison.
Network Services’ net sales grew from the comparative year. operating profit was at par with the reference year. In Germany, streamlining of the services processes was in progress, but its impact on profitability fell short of target.
Net Sales and profitability The Group’s net sales increased 9.4% from the previous year and totaled eUR 183.6 (167.8) million. In the financial year 2011 our main customers, the european cable operators were investing in network segmentation while the households’ transmission capacity was increasing. Increased provision of services (digitiza-tion of infrastructure) by telecom operators pushed up deliveries of Luminato video headends. In the financial year, main part of the Paris urban area video surveillance project was delivered.
operating profit stood at eUR 9.4 (7.4) million making 5.1% (4.4%) of the net sales. The year-on-year growth in operating profit was due to an increase in Video and Broadband Solutions’ net sales and successful project deliveries.
Year-on-year orders received by the Group improved by 12.5% standing at eUR 188.1 (167.2) million. At the year-end, the order backlog stood at eUR 21.2 (17.0) million.
Profit after financial items totaled eUR 8.8 (6.7) million while the net profit equaled eUR 6.3 (4.8) million. Undiluted result per share for the Group stood at eUR 0.36 (eUR 0.27). The return on capital employed was 11.5% (10.2%) and the return on equity was 11.9% (9.9%).
bUSINESS AREAS
Video and broadband SolutionsThis business area focuses on broadband access networks, video services platforms and CCtV applications. The core clientele of the business area consists of cable operators but includes also resellers and public sector organizations. The main market of the business area is europe.
The business area has 23 offices of its own and a number of retail and integration partners. outside europe, Video and Broad-band Solutions has offices of its own located in the United States, Australia, China and India.
Net sales grew by 9.4% over the year of comparison amount-ing to eUR 89.7 (82.0) million. This increase in net sales was mainly due to higher delivery volumes in video surveillance and integration projects as well as optical product solutions. operat-
ing profit stood at eUR 8.2 (6.3) million making 9.2% (7.7%) of the net sales. This improvement in operating profit over the refer-ence year was brought about by growth in net sales and success-ful project deliveries. orders received amounted to eUR 93.3 (86.5) million with the order backlog equaling eUR 20.3 (17.0) million.
The R&D efforts by the business area focused on the IP-based video processing system (the Luminato product range) and the video surveillance transmission system based on H.264 stan-dard. R&D efforts were continued on amplifier technology (the Access product range), optical transmission system for HFC net-work (the HDo product range) as well as video surveillance management system (VMX).
Network ServicesThe clientele of teleste’s Network Services business mainly con-sists of large european cable operators. The services provided by this business area include planning, new construction, upgrading and maintenance of cable networks. Implementation and scope of the relevant services vary by client ranging from standalone applications to integrated turnkey deliveries. Most deliveries are based on frame agreements. The services also include teleste’s own product solutions. our know-how in services covers all the sectors related to the cable network technology from installation and maintenance of headends to upgrading of house networks. Services are also provided through a network of subcontractors.
Net sales amounted to eUR 93,9 (85,8) million. operating profit equaled eUR 1.2 (1.1) million. operating profit remained at par with the comparative period in spite of the 9.4% increase in net sales, which was partly due to increased human resources in the German fiber projects. Moreover, expenses were increased and operating profit was weakened by limited sub-contracting resources and severe weather in the beginning of the year. orders received totaled eUR 94.8 (80.7) million, while the order backlog amounted to eUR 0.9 (0.0) million. The German development pro-gram fell short of the set goal.
R&D and Investments R&D expenditure for the period under review totaled eUR 11.6 (10.3) million making 6.3% (6.1%) of the net sales. teleste’s R&D expenditure focused on the business area of Video and Broad-band Solutions, the R&D expenses of which amounted to 12.9% (12.6%) of the net sales.
Some 60% (60%) of the R&D expenses involved continued development of product platforms currently in production and their maintenance as well as customer-specific product applica-tions. Activated R&D inputs totaled eUR 2.7 (1.7) million. Depre-
Founded in 1954, teleste is a technology company consisting of two business areas: Video and Broadband Solutions and Network Services. In line with its strategy, teleste continues to focus on the chosen product and technology segments as well as services business.
Report of the Board of Directors
Financial Statements 2011 1
ciation on activated R&D expenses amounted to eUR 2.0 (2.4) million.
At the end of the financial period, 9.7% (9.7%/2010, 10.0%/2009) of the Group personnel were working in R&D related duties. teleste was involved in number of projects in co-operation with Finnish universities and research institutes.
Net investments for the financial period amounted to eUR 5.2 (3.8) million, or 2.9% (2.2%) of the net sales. The largest prod-uct development investments involved Luminato video process-ing system (eUR 1.9 million) and video surveillance management system (eUR 0.6 million). Investment for the Littoinen extension project totaled eUR 1.1 million. Investments in tools and measur-ing equipment amounted to eUR 1.3 million while those in infor-mation systems equaled eUR 0.5 million. Investments of eUR 0.3 (0.1) million were carried out under financial lease arrange-ments. In Finland, real estate was sold for eUR 0.7 million.
Financing The Group’s liquidity was good throughout the financial year. operating cash flow stood at eUR 2.1 (5.4) million. Accounts receivable did not result in substantial credit losses. The need for working capital bound by growth was financed by credit facilities of eUR six million in interest-bearing loan. At the end of the period, the amount of unused binding stand-by credits amounted to eUR 7.5 (13.5) million. The current binding stand-by credit facil-ities of eUR 40.0 million are valid till November 2013. The Group’s equity ratio equaled 41.6% (43.6%) while net gearing was 32.2% (25.5%). on 31 December 2011, the Group’s interest-bearing debt stood at eUR 33.2 (28.0) million.
personnel and organization In 2011, the Group employed an average of 1,297 people (1,215/2010, 1,103/2009). At the year-end, the figure totaled 1,319 (1,231/2010, 1,260/2009) of which 72% (70%/2010, 68%/2009) were stationed overseas. At the end of the account-ing period, rented workforce involved 26 people. This figure is not included in the number of personnel. employees stationed out-side europe accounted for less than 5% of the Group’s personnel. expenditure on employee benefits amounted to eUR 54.6 (50.8/2010, 44.6/2009) million. The year-on-year growth in employee benefits was brought about by re-establishment of full employment in Finland´s operations, and due to increase in staff-ing levels of Network Services in Germany and the UK.
Group Structure In the financial period, teleste Kaurakatu oy was sold. Cableway Nord GmbH was merged with Cableway Mitte GmbH, whose name was changed to Cableway Nord GmbH. Cableway Nord Mitte GmbH&KG and Cableway North West GmbH&KG were merged into teleste Services GmbH.
The parent company has branch offices in Australia, China, Denmark and the Netherlands, with subsidiaries in 12 countries outside Finland. Due to financial arrangements, teleste Manage-ment oy and teleste Management II oy, owned by the members of the Management Group, have been merged with the teleste Corporation figures.
Key Risks faced by the business Areas With europe as teleste’s main marketing area, our most signifi-cant clients include european cable operators and specified orga-nizations in the public sector.
Concerning Video and Broadband Solutions, integrated deliv-eries of solutions create favorable conditions for growth, even if the involved resource allocation and technical implementation pose a challenge involving reasonable risks. Network investments carried out by the clients vary based on their need for upgrading and their capital structure. Much of teleste’s competition comes from the USA so the exchange rate of euro up against the US dollar affects our competitiveness. Also the exchange rate devel-opment of the Chinese renminbi to euro affects our material costs. The company hedges against short-term currency expo-sure by means of forward contracts. The tight financial market in europe may slow down the customers’ investment plans. Natural phenomena, such as floods and earthquakes, may reduce the availability of components. The right technology choices and their timing are crucial to success.
Net sales of Network Services comes, for the most part, from a small number of large european customers, so a significant change in the demand for services by any one of them is reflected in the actual deliveries. Improvements in customer satisfaction and productivity require efficient control of service process man-agement as well as innovative solutions in processes, products and logistics to ensure the quality of services and cost effective-ness. Smooth operation of cable networks necessitates efficient technical management of the networks and functional solutions for devices in accordance with contractual obligations. This, in turn, requires continuous and determined development of skill levels in teleste’s own personnel as well as those of our subcon-tractors. Besides, availability of subcontractor network capacity may restrict our ability to deliver.
The business areas will have to keep an eye on market move-ments, such as consolidations among the customers and com-petitors. Severe weather conditions have an impact on the busi-ness areas’ ability to deliver their products and services.
The Board of Directors annually reviews any essential risks related to the company operation and the management thereof. Risk management is an integral part of the strategic and opera-tional activities of the business areas. Risks and their probability are reported to the Board in conjunction with regular monthly reports.
The Company has covered the most significant operational hazard risks of the Business areas by insurance. Insurance does not cover credit loss risks. In the period under review, no such risks materialized, nor was there any pending litigation or legal proceedings, which would have had any significant relevance to the Group’s operations.
Decisions by the Annual General Meeting The Annual General Meeting of teleste Corporation held on 8 April 2011 confirmed the financial statements for 2010 and dis-charged the Board of Directors and the Ceo from liability for the financial period. The AGM confirmed the dividend of eUR 0.12 per share as proposed by the Board. The dividend was paid out on 20 April 2011
Marjo Miettinen, Pertti ervi, tero Laaksonen, Pertti Raati-kainen, Kai telanne and Peter Walldén were elected members of the Board by the Annual General Meeting. Marjo Miettinen was elected chairperson in the organizing meeting of the Board held immediately after the AGM.
Authorized Public Accountants KPMG oy Ab continue as the auditor until the next AGM. esa Kailiala, accountant authorized by the Central Chamber of Commerce of Finland, was chosen audi-tor-in-charge.
2 Teleste, Enabling Digital Evolution

BoARD oF DIReCtoRS´RePoRt 2011
The Annual General Meeting decided to authorize the Board of Directors to decide on repurchasing the Company’s own shares. Based on the authorization, the Board of Directors may repurchase a maximum of 1,400,000 own shares of the Com-pany otherwise than in proportion to the holdings of the share-holders by using the non-restricted equity through public trading on NASDAQ oMX Helsinki Ltd at the market price prevailing at the time of acquisition. The authorization to repurchase own shares is valid until the Annual General Meeting for year 2012.
The Annual General Meeting accepted the proposal of the Board of Directors to authorize the Board of Directors to decide on issuing new shares and/or conveying the Company’s own shares held by the Company and/or granting special rights. Based on the authorization, a maximum of 5,000,000 new shares may be issued and a maximum of 1,779,985 of the Company’s own shares held by the Company or its group company may be con-veyed. The number of shares to be issued to the Company itself together with the shares repurchased to the Company on basis of the authorization to repurchase own shares shall be at the maximum of 1,400,000 shares. The maximum number of new shares that may be subscribed and own shares held by the Com-pany that may be conveyed by virtue of the special rights granted by the Company is 2,500,000 shares in total which number is included in the above maximum numbers of new shares and own shares held by the Company. The authorizations are valid for three (3) years from the resolution of the Annual General Meeting.
Shares and Changes in Share Capital on 31 December 2011, eM Group oy was the largest single shareholder with the holding of 21.08%.
In the period under review, the lowest company share price was eUR 2.50 (3.64) and the highest was eUR 4.82 (5.33). Clos-ing price on 31 December 2011 stood at eUR 3.00 (4.41). Accord-ing to euroclear Finland Ltd, the number of shareholders at the end of the period under review was 5,054 (5,184). Foreign own-ership accounted for 7.76% (8.38%). From 1 January to 31 December 2011, trading with teleste share at NASDAQ oMX Helsinki amounted to eUR 6.2 (14.2) million. In the period under review, 1.7 (3.2) million teleste shares were traded on the stock exchange.
In December 2011, the Board decided on a directed share issue of 542,000 shares to teleste Management II oy, founded by the Management Group members of teleste Corporation. This directed share issue was authorized by the AGM on 8 April 2011.
on 31 December 2011, the Group held a total of 1,302,985 own shares (760,985), of which the parent company teleste Cor-poration had none (0) while other Group companies or controlled companies had 1,302,985 shares. At the end of the period, the Group’s holding of the total amount of shares amounted to 6.96% (4.18%). Based on the rights of options, the Company’s holding of shares may increase by 840,000 shares equaling to 4.29% of all shares and votes.
on 31 December 2011, teleste’s registered share capital stood at eUR 6,966,932.80 divided in 18,728,590 shares.
ownership by Management and Members of the Governing bodies on 31 December 2011 on the balance sheet date, Ceo and the Members of the Board owned 84,791 (98,482) teleste Corporation shares equaling to 0.45% (0.54%) of all shares and votes. Based on teleste 2007 stock option rights, Ceo was entitled to subscribe 120,000 shares. on the balance sheet date, the ownership including rights
of options by the Ceo and the Board amounted to 204,791 (218,482) shares, which is equal to 1.09% (1.15%) of all shares and votes. on 31 December 2011, other members of the Man-agement team were not in the possession of teleste Corporation shares.
on 31 December 2011, teleste Management oy and teleste Management II oy (companies established for the management incentive system) owned 923,000 (381,000) shares of the teleste Corporation. The Ceo owns 34.4% and the others 65.6%, respectively, of the teleste Management oy shares. of the teleste Management II oy shares the Ceo owns 31.25% while the others have a holding of 68.75%, respectively. on 31 Decem-ber 2011, in addition to Ceo’s stock options, members of teleste Corporation’s Management Group owned a total of 210,000 (255,000) teleste 2007 options.
teleste Corporation complies with the Corporate Governance Code, effective as of 1 october 2010 and issued by the Securities Market Association for the Finnish listed companies. The Corpo-rate Governance Statement will be issued separately from the Company’s Annual Report, and it will be available on teleste’s website under Investors. Since 1 March 2000, teleste complies with the insider guidelines issued by the NASDAQ oMX Helsinki oy in their valid form at any given time.
outlook for 2012 In our estimation, deliveries of equipment and solutions in 2012 for the operator clientele by Video and Broadband Solutions in our target market will reach at least the 2011 level. european telecom operators have launched tV distribution infrastructure investments, and in our view, teleste’s optical products and IP network solutions are competitive in this new emerging market.
In our estimate, demand on the annual level for services by Network Services continues relatively stable. We believe that in the main market area of Germany the operating profit will improve from the 2011 level due to more efficient resource management.
Net sales and operating profit will grow over the 2011 level.
The board’s proposal for the Distribution of Dividends Parent company teleste Corporation’s distributable equity on the balance sheet date is eUR 36,775,101.54.
The Board of Directors proposes to the Annual General Meet-ing to be held on 3 April 2012 that a dividend be paid for 2011 of eUR 0.14 (eUR 0.12) per share for the outstanding shares.
31 January 2012
teleste Corporation Jukka RinnevaaraBoard of Directors Ceo
Financial Statements 2011 3

StAteMeNt oF CoMPReHeNSIVe INCoMe
1,000 € Note 2011 2010 Change %
Net sales 1 183,616 167,836 9.4
other operating income 2 2,112 1,460 44.7
Raw material and consumables used -90,990 -82,054 10.9
employee benefits expense 3 -54,560 -50,824 7.4
Depreciation and amortisation expense 4 -5,372 -5,896 -8.9
other operating expenses 5 -25,426 -23,090 10.1
operating profit 9,380 7,432 26.2
Financial income 6 189 84 125.0
Financial expenses 7 -730 -773 -5.6
profit before taxes 8,839 6,743 31.1
Income tax expense 8 -2,540 -1,959 29.7
profit for the financial period 6,299 4,784 31.7
Attributable to: 9
equity holders of the parent 6,299 4,784 31.7
earnings per share for profit of the year attributable to the equity holders of the parent
(expressed in € per share)
Basic 0.36 0.27 31.7
Diluted 0.36 0.27 31.7
total comprehensive income for the period (teUR)
Net profit 6,299 4,784 31.7
translation differences 149 277 -46.2
Fair value reserve 20 –70 n/a
total comprehensive income for the period 6,468 4,991 29.6
Attributable to:
equity holders of the parent 6,468 4,991 29.6
4 Teleste, Enabling Digital Evolution

GRoUP FINANCIAL StAteMeNtS
StAteMeNt oF FINANCIAL PoSItIoN
1,000 € Note 2011 2010 Change %
ASSETS
Non-current assets
Property, plant and equipment 10 9,364 8,836 6.0
Goodwill 11 31,277 30,959 1.0
other intangible assets 11 6,338 6,709 -5.5
Available-for-sale investments 12 713 713 0.0
Deferred tax assets 13 1,714 0 n/a
49,406 47,217 4.6
Current assets
Inventories 14 24,075 21,000 14.6
trade and other receivables 15 44,326 32,819 35.1
Cash and cash equivalents 16 15,404 15,203 1.3
83,805 69,022 21.4
Total assets 133,211 116,239 14.6
EQUITY AND LIAbILITIES
Equity attributable to equity holders of the parent
Share capital 17 6,967 6,967 0.0
Share premium 17 1,504 1,504 0.0
translation differences 54 -95 n/a
Invested nonrestricted equity 2,737 2,737 0.0
other reserves -166 -186 -10.8
Retained earnings 43,559 39,183 11.2
Share of non controlling interest 623 292 113.4
55,278 50,402 9.7
Non-current liabilities
Interest-bearing liabilities 18 11,940 11,847 0.8
other liabilities 4,140 3,865 7.1
Deferred tax liabilities 13 1,946 511 280.8
Provisions 19 605 657 -7.8
18,631 16,880 10.4
Current liabilities
trade and other payables 20 35,223 30,161 16.8
Current tax payable 21 1,595 1,240 28.6
Provisions 19 1,211 1,313 -7.8
Interest-bearing liabilities 18 21,273 16,243 31.0
59,302 48,957 21.1
Total liabilities 77,933 65,837 18.4
Totsl equity and liabilities 133,211 116,239 14.6
Financial Statements 2011 5

CoNSoLIDAteD CASH FLoW StAteMeNt
1,000 € Note 2011 2010
Cash flows from operating activities
Profit for the period 6,299 4,784
Adjustments for:
Non-cash transactions 23 5,552 6,143
Interest and other financial expenses 730 773
Interest income -138 –72
Dividend income -51 –12
Income tax expense 2,540 1,959
Changes in working capital and provisions
Increase in trade and other receivables -11,407 –4,650
Increase in inventories -3,075 1,265
Increase in trade and other payables 4,809 –3,942
Decrease in provisions -154 431
Paid interests and dividends -760 –565
Received interests and dividends 189 84
Paid taxes -2,471 –786
Net cash from operating activities 2,063 5,412
Cash flows from investing activities
Acquisition of subsidiary, net of cash acquired 0 –3,643
Purchases of property, plant and equipment (PPe) -3,346 –1,022
Proceeds from sales of PPe 714 306
Purchases of intangible assets -2,822 –1,499
Proceeds from sale of shares 93 0
Net cash used in investing activities -5,361 –5,858
Cash flows from financing activities
Proceeds from borrowings 6,000 5,520
Repayments of borrowings -222 –966
Payment of finance lease liabilities -655 –596
Dividends paid -2,091 –1,394
Proceeds from issuance of ordinary shares 319 289
Net cash used in financing activities 3,351 2,853
Change in cash
Cash and cash equivalents at 1 January 15,203 12,518
effect of currency changes 149 277
Cash and cash equivalents at 31 December 15,404 15,203
6 Teleste, Enabling Digital Evolution
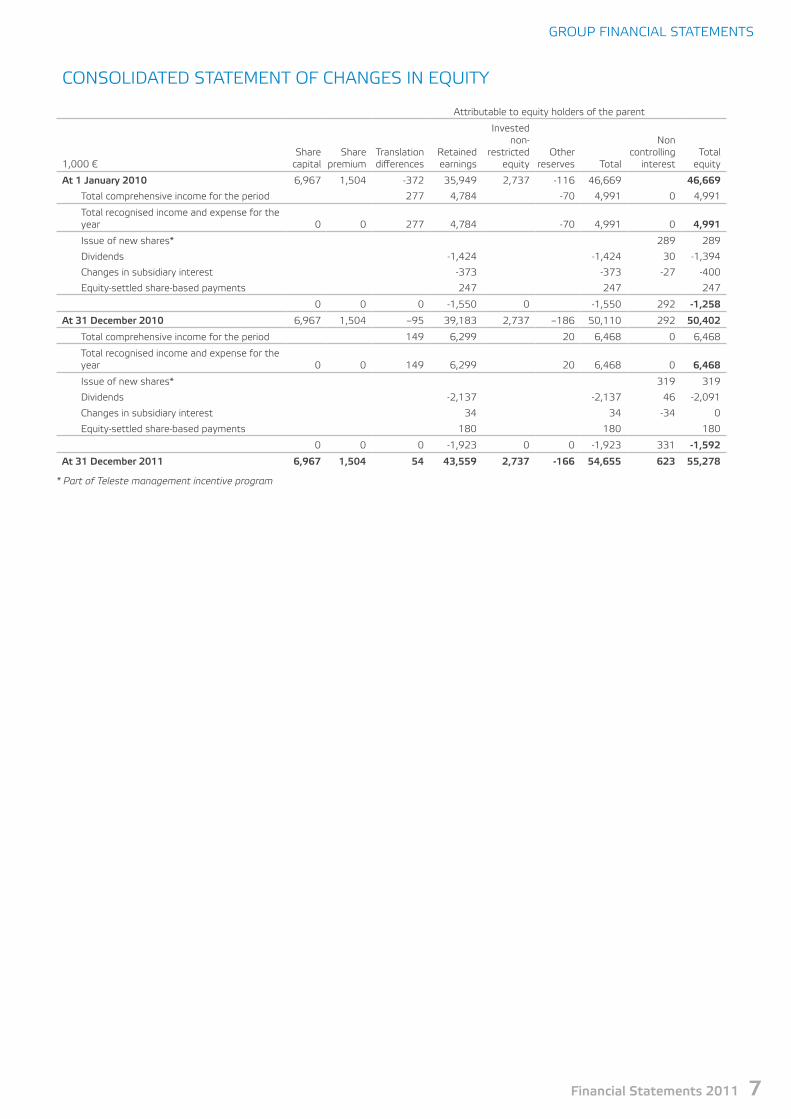
GRoUP FINANCIAL StAteMeNtS
CoNSoLIDAteD StAteMeNt oF CHANGeS IN eQUItY
Attributable to equity holders of the parent
1,000 €Share
capitalShare
premiumtranslation differences
Retained earnings
Invested non-
restricted equity
other reserves total
Non controlling
interesttotal
equity
At 1 January 2010 6,967 1,504 -372 35,949 2,737 -116 46,669 46,669
total comprehensive income for the period 277 4,784 -70 4,991 0 4,991
total recognised income and expense for the year 0 0 277 4,784 -70 4,991 0 4,991
Issue of new shares* 289 289
Dividends -1,424 -1,424 30 -1,394
Changes in subsidiary interest -373 -373 -27 -400
equity-settled share-based payments 247 247 247
0 0 0 -1,550 0 -1,550 292 -1,258
At 31 December 2010 6,967 1,504 –95 39,183 2,737 –186 50,110 292 50,402
total comprehensive income for the period 149 6,299 20 6,468 0 6,468
total recognised income and expense for the year 0 0 149 6,299 20 6,468 0 6,468
Issue of new shares* 319 319
Dividends -2,137 -2,137 46 -2,091
Changes in subsidiary interest 34 34 -34 0
equity-settled share-based payments 180 180 180
0 0 0 -1,923 0 0 -1,923 331 -1,592
At 31 December 2011 6,967 1,504 54 43,559 2,737 -166 54,655 623 55,278
* Part of Teleste management incentive program
Financial Statements 2011 7
Accounting principles
Company profileteleste Corporation (the”Company”) is a Finnish public limited lia-bility company organised under the laws of Finland and domiciled in turku in Finland. Its registered address is Seponkatu 1, 20660 Littoinen.
Founded in 1954 teleste is a technology company running its two business units Video and Broadband Solutions and Network Services; in both fields, we are among the global leaders. Video is at the core of our business activities, with a focus on the pro-cessing, transmission and management of video and data for operators and public authorities who provide multiple video-related information, entertainment and security services to end-users. Video and Broadband Solutions business segment has the emphasis on product solutions for broadband access networks, video service platforms and video surveillance applications. Net-work Services segment deliver comprehensive network service solutions including new construction, rebuilding, upgrading, plan-ning and maintenance services of cable networks. The parent company of teleste Group, teleste Corporation, has operations in Australia, China, Denmark, the Netherlands and a subsidiary in tweleve countries outside Finland. teleste Corporation has been listed on the Helsinki Stock exchange since 1999. A copy of the consolidated financial statements can be obtained either from teleste’s website www.teleste.com or from the parent compa-ny’s head office, the address of which is mentioned above.
Statement of complianceThese financial statements have been prepared in accordance with International Financial Reporting Standards (IFRSs) in force as at 31 December 2011. International financial reporting stan-dards, referred to in the Finnish Accounting Act and in ordinances issued based on the provisions of this Act, refer to the standards and their interpretations adopted in accordance with the proce-dure laid down in regulation (eC) No 1606/2002 of the eU. The notes to the consolidated financial statements also include addi-tional information in accordance with the Finnish accounting and company legislation.
teleste adopted IFRSs as from 1 January 2005. Prior to IFRSs teleste’s financial statements were based on Finnish accounting standards (FAS) applicable to listed companies in Fin-land. IFRS 1 First-time adoption of IFRS was applied in the transi-tion. teleste’s date of transition to IFRSs was 1 January 2004.
The Group has applied the following new and revised stan-dards and interpretations as of 1 January 2011:• IAS 32 (Amendment) “Financial instruments: Classification of
rights issues”• IAS 24 (Revised) “Related party disclosures”• IFRIC 19 “extinguishing financial liabilities with equity instru-
ments”• IFRIC 14 (Amendment) “Prepayments of a minimum funding
requirement”• Annual amendments to the IFRS’s (Annual improvements).The above mentioned changes, amendments and interpretations do not have any material impact on teleste ’s financial reporting.
basis of preparationThe consolidated financial statements are presented in thou-sands of euro (teUR) and have been prepared under the historical cost convention, unless otherwise stated in the accounting prin-ciples.
Use of estimatesThe preparation of financial statements in conformity with IFRSs requires management to make estimates and assumptions that affect the contents of the financial statements as well as use judgement when applying accounting principles. The estimates and assumptions are based on the management’s current best knowledge reflecting historical experience and other reasonable assumptions. Actual results may differ from these estimates. Accounting estimates mainly relate to goodwill, obsolete invento-ries, credit losses and warranty provisions. The chapter “Account-ing policies requiring management’s judgement and key sources of estimation uncertainty” discusses judgements made by man-agement and those financial statement items on which judge-ments have a significant effect.
SubsidiariesThe consolidated financial statements include the accounts of the parent company teleste Corporation and all those subsidiaries in which it holds, directly or indirectly, over 50% of the voting rights or in which it otherwise has control (together referred to as “Group” or “teleste”). Control exists when the Group has the power to govern the financial and operating policies of an entity so as to obtain benefits from its activities. The companies acquired during the financial periods presented have been con-solidated from the date of acquisition, when control commenced. The companies disposed during a financial period are included in the consolidated financial statements up to the date of disposal.
AssociatesAssociates included in the consolidated financial statements are those entities in which teleste Group holds voting rights over 20% or in which it otherwise has significant influence, but not control, over the financial and operating policies. Holdings in asso-ciates are accounted for using the equity method from the date that significant influence commences until the date that signifi-cant influence ceases. The Group’s proportionate share of associ-ates’ net income for the financial year is presented as a separate line item in the consolidated income statement. The unrealised profits between the Group and associates are eliminated in pro-portion to share ownership. The carrying amount of an invest-ment in an associate includes the carrying amount of goodwill resulted from its acquisition. When teleste’s share in an associ-ate’s losses exceeds its interest in the associate, the Group’s car-rying amount is reduced to nil and recognition of further losses is discontinued except to the extent that the Group has incurred obligations in respect of the associate or made payments on behalf of the associate. At the end of the reporting period the Group had no investments in associates.
8 Teleste, Enabling Digital Evolution

NoteS to tHe CoNSoLIDAteD INCoMe StAteMeNt AND BALANCe SHeet
Joint venturesJoint ventures are those entities over whose activities the Group has joint control, established by contractual agreement. The con-solidated financial statements include the Group’s proportionate share of the joint ventures’ assets, liabilities, revenue and expenses on a line by line basis, from the date that joint control commences until the date that joint control ceases. At the end of the reporting period the Group had no interests in joint ventures.
principles of consolidationAcquisitions of companies are accounted for by using the pur-chase method. All intercompany income and expenses, receiv-ables, liabilities and unrealised profits arising from intercompany transactions, as well as distribution of profits within the Group are eliminated as part of the consolidation process. The allocation of the profit for the period attributable to equity holders of the parent company and non-controlling interest is presented on the face of the income statement and the non-controlling interest is also disclosed in the statement of comprehensive income. Non-controlling interests are disclosed separately under consolidated total equity.
teleste has applied the exemption under IFRS 1 according to which the classification and accounting treatment of business combinations occurred prior to the IFRS transition date do not have to be restated but previous values under FAS are taken as a deemed cost.
Financial statements of foreign subsidiariesThe functional currency of the parent company is euro and the consolidated financial statements are presented in euro. The functional currency is the currency that best reflects the economic substance of the underlying events and circumstances relevant to that entity. In preparing the consolidated financial statements, income statements and cash flows of those foreign subsidiaries whose functional and presentation currency are not the euro, are translated into euro at the average exchange rate during the financial period. Their balance sheets are translated at the closing rate at the balance sheet date.
All translation differences arising from consolidation of for-eign shareholdings are recognised as a separate item in the com-prehensive income. In accordance with the exemption included in IFRS 1 those cumulative translation differences arisen until the transition date have been reclassified to retained earnings and consequently they will not be later released in the income state-ment. From the transition date onwards translation differences arising on the consolidation are presented as a separate compo-nent of equity. If an interest in a foreign entity is disposed of all, or part of, that entity, related cumulative translation differences deferred in equity are recognised in the income statement as part of the gain or loss on sale.
Foreign currency transactionstransactions in foreign currencies are translated at the rates of exchange prevailing on the dates of the transactions. At the end of the accounting period, foreign currency monetary balances are translated at the closing rate at the balance sheet date. Non-monetary items stated at fair value in a foreign currency are translated at foreign exchange rates ruling at the dates the fair value was determined. other non-monetary items are translated using the exchange rate at the date of the transaction. Gains and losses resulting from transactions in foreign currencies and trans-lation of monetary items are recognised in the income statement.
Foreign exchange gains and losses on trade receivables and pay-ables are adjusted to revenues and operating expenses, respec-tively. other foreign exchange gains and losses are presented as financial income and expenses.
property, plant and equipmentItems of property, plant and equipment are stated at historical cost less cumulative depreciation and any impairment losses. Where parts of an item of property, plant and equipment have different useful lives, they are accounted for as separate items of property, plant and equipment. Interest costs which are directly attributable to the acquisition, construction or manufacturing of an asset that meets the determined criteria, in which case they are capitalized as part of the cost of that asset. ordinary mainte-nance, repairs and renewals are expensed during the financial period in which they are incurred. In teleste there are no such significant inspection or maintenance costs that should be capi-talised. The Group recognises in the carrying amount of an item of property, plant and equipment the subsequent costs when that cost is incurred if it is probable that future economic benefits in excess of the originally assessed standard of performance of the existing asset will flow to the Group and the cost of the item can be measured reliably. Such renewals and repairs are depreciated on a systematic basis over the remaining useful life of the related asset. Gains and losses on sales and disposals are calculated as a difference between the received proceeds and the carrying amount and are included in other operating income and expenses, respectively.
Depreciation is charged to the income statement on a straight-line basis over the estimated useful lives of each part of an item of property, plant and equipment. expected useful lives and residual values of non-current assets are reassessed at each balance sheet date and where they differ from previous esti-mates, depreciation periods are changed accordingly. The esti-mated useful lives are as follows:• Buildings 25–33 years• Machinery and equipment 3–5 years• Computers 0–3 years• Software 3 yearsLand is not depreciated.
Leases
Group as lesseeLeases of property, plant and equipment where substantially all the risks and rewards incidental to ownership have been trans-ferred to the Group are classified as finance leases. These assets are capitalised and are stated at an amount equal to the lower of their fair value and the present value of the minimum lease pay-ments at inception of the lease less cumulative depreciation and any impairment losses. The associated lease liabilities are included in interest-bearing liabilities in accordance with their maturity.
These assets acquired under finance leases are depreciated as comparable owned assets over the shorter of the useful lives disclosed above for property, plant and equipment or lease period and are adjusted for impairment charges, if any. Lease payments are apportioned between the reduction of the outstanding lease liability and finance charge. In respect of finance leases, the depreciation on the leased assets and the financial charge on the lease liability are shown in the income statement. The financial charge is allocated to the income statement so as to achieve a
Financial Statements 2011 9

constant interest rate on the outstanding liability during the lease term.
An operating lease is a lease of property, plant and equipment where the lessor retains significant risks and rewards incidental to ownership. Payments made thereunder are charged to the income statement as rental expense on a straight-line basis over the lease term.
Group as lessorThose leases under which teleste is a lessor are classified as operating leases. Leased assets are presented in the lessor’s bal-ance sheet under property, plant and equipment according to the nature of the asset. They are depreciated over their estimated useful lives in accordance with the depreciation policy used for comparable assets in own use. Lease income is recognised in the income statement on a straight-line basis over the lease term.
Intangible assetsAn intangible asset is recognised only when it is probable that future economic benefits that are attributable to the asset will flow to the Group and if the cost of the asset can be measured reliably. All other expenditure is expensed as incurred.
GoodwillGoodwill represents the Group’s share of difference between the cost of the acquisition and the fair value measured at the acquisi-tion date of the net identifiable assets, liabilities and contingent liabilities acquired. The difference is first allocated, where applica-ble, to the underlying assets. The rest of the excess is presented as goodwill as a separate item in the consolidated balance sheet. Goodwill has been allocated to segments and in respect of asso-ciates, the carrying amount of goodwill is included in the carrying amount of the investment in the associate. Goodwill is stated at cost less any cumulative impairment losses. Goodwill (together with other intangible assets with indefinite lives) is not amortised but is tested annually for impairment. Consequently goodwill was amortised on a straight-line basis over the expected useful life until 31 December 2003, after which the amortisation was dis-continued.
Research and development costsResearch and development costs are expensed as they are incurred, except for certain development costs, which are capital-ised when certain criteria are met. Significant future product plat-forms for which the potential demand and future cash flows can be estimated with sufficient degree of accuracy have been capi-talised as intangible assets. Amortisation of such capitalised development projects is commenced after the completion of the subprojects related to the product platform concerned. They are amortised on a systematic basis over their expected useful life, which is three years.
other intangible assetsother intangible assets of the Group mainly consist of connection fees and these are not amortised.
Those intangible assets which have estimated useful lives are depreciated on a straight-line basis over their known or estimated useful lives.The estimated useful lives are as follows:• Customer relationships 2-4 years• trademarks 5-10 years• technology 3-5 years
Non-current assets held for sale and discontinued operationsA non-current asset (or disposal group) is classified as held for sale when its carrying amount will be recovered principally through a sale transaction rather than through continuing use. It is mea-sured at the lower of carrying amount and fair value less costs to sell. Such assets and associated liabilities are presented sepa-rately in the balance sheet. Assets held for sale are not depreci-ated (or amortised) after the classification as held for sale.
A discontinued operation is a component of the Group’s busi-ness that represents a separate major line of business or a geo-graphical area of operations or is a subsidiary acquired exclusively with a view to resale. The result of discontinued operations is presented separately on the face of the consolidated income statement.
ImpairmentThe carrying amounts of assets are assessed for potential impair-ment at each balance sheet date and whenever there is any indi-cation that an asset may be impaired. For the purposes of assess-ing impairment, assets are grouped at the cash generating unit level, which is the lowest level for which there are separately iden-tifiable, mainly independent, cash inflows and outflows. Goodwill, unfinished intangible assets and intangible assets with indefinite useful lives, if any, are in all cases tested annually. All goodwill items of the Group have been allocated to segments. If there is an indication of an impairment, the Group estimates the recover-able amount of the asset or cash generating unit. When the recoverable amount of the asset or cash generating unit is lower than the carrying amount, the difference is immediately recog-nised as an impairment loss in the income statement. If the impairment loss is to be allocated for a cash-generating unit, it is allocated first by writing down any goodwill and then on pro rata basis to other assets of the unit.
The recoverable amount is the higher of an asset’s or cash generating unit’s fair value less costs to sell or value in use. teleste has applied value in use in its calculations in which case the estimated future net cash flows expected to be derived from the asset or cash generating unit are discounted to their present value. expenditures to improve assets’ performance, investments or future restructurings are excluded from the cash flow esti-mates.
An impairment loss relating to property, plant and equipment and other intangible assets excluding goodwill is reversed if there is an indication that the impairment loss may no longer exist and there has been a positive change in the estimates used to deter-mine the recoverable amount of an asset or cash generating unit. An impairment loss is only reversed to the extent that the asset’s carrying amount does not exceed the carrying amount that would have been determined, net of depreciation or amortisation, had no impairment loss been recognised for the asset in prior years. However, an impairment loss in respect of goodwill is never reversed.
InventoriesInventories are stated at the lower of cost or net realisable value. Cost is assigned by using the first-in, first-out (FIFo) method. Net realisable value is the estimated selling price in the ordinary course of business, less the estimated costs of completion and the estimated costs necessary to make the sale. The cost of inventories comprises all direct costs incurred in acquiring the inventories and bringing them to their existing location and condi-
10 Teleste, Enabling Digital Evolution

NoteS to tHe CoNSoLIDAteD INCoMe StAteMeNt AND BALANCe SHeet
tion. In the case of manufactured inventories and work in prog-ress, cost includes an appropriate share of overheads based on normal operating capacity.
Financial assets and liabilitiesIn teleste hedge accounting as defined under IAS 39 is applied only for interest swap contracts for specific loans.
Financial assets are classified into categories as follows: financial assets at fair value through profit or loss, held-to-matu-rity assets, loans or receivables (assets) and available-for-sale assets. Financial assets are classified when initially acquired based on their purpose of use. In the case of a financial asset not measured at fair value through profit or loss, transaction costs are included in the acquisition cost. Fair value is the amount for which an asset could be exchanged, or a liability settled, between knowledgeable, willing parties in an arm’s length transaction. All purchases or sales of financial assets are recognised or derecog-nised using trade date accounting.
A financial asset is derecognised when the Group has lost its contractual rights to the cash flows from the financial asset or when it has transferred substantially all the significant risks and rewards of ownership of the financial asset to an external party.
Financial assets at fair value through profit or lossFinancial assets at fair value through profit or loss are either clas-sified as held for trading, or they are designated by the Group as at fair value through profit or loss upon initial recognition. A finan-cial asset is classified as held for trading if it is acquired or incurred principally for the purpose of short-term profittaking from changes in market prices or it is a derivative that does not qualify for hedge accounting. Financial assets and liabilities at fair value through profit or loss are recognised on the balance sheet using trade date accounting. They are measured at their fair values, which is the bid price at the balance sheet date based on pub-lished price quotations in an active market. Both financial assets held for trading and other financial assets maturing in 12 months after the balance sheet date are included in the current assets. A gain or loss arising from a change in the fair value, realised or unrealised, is recognised in the income statement as incurred.
Derivatives and hedge accountingDerivatives, including embedded derivatives, are included in the financial assets at fair value through profit or loss. They are recog-nised on the balance sheet at cost, equivalent to the fair value, and are subsequently fair valued at each balance sheet date. The Group uses forward exchange agreements and the Group’s hedg-ing policy is to cover all material currency risks at least six months ahead. Hedge accounting is applied for interest swap contracts hedging the interest risk for specific loans. Changes in fair value of instruments designated as hedging instruments are recognised in profit or loss. Gains and losses arising from changes in fair value are included in operating profit unless the hedged item relates to financing when fair value changes are recognised in financial income or expenses. Fair values are determined utilising public price quotations and rates as well as generally used valuation models. The data and assumptions used in the valuation model are based on verifiable market prices. Derivatives that mature within 12 months after the balance sheet date are included in current assets or liabilities. Derivatives are not used for specula-tive purposes. Changes in the fair values of derivative instru-ments, for which hedge accounting is applied and which are effec-
tive hedging instruments, are recognised in profit or loss in con-gruence with the hedged items.
on initial designation of the hedge, the Group documents the relationship between the hedged item and hedging instrument, and the risk management objectives and strategy in undertaking the hedge transaction. The Group documents and assesses both at the inception of the hedge relationship and at least at each reporting date, the effectiveness of the hedging relationship by monitoring the ability of the hedging instrument to offset the changes in the fair value or cash flows of the respective hedged item. The interest element of interest rate swaps used to hedge variable rate loans is recognised in profit or loss within financial items and the change in the fair value of the hedging instrument is recognised in equity.
Available-for-sale assetsThis category comprises those non-derivative financial assets that are designated as available for sale or are not classified into other categories. In teleste available-for-sale investments consist of holdings in listed and unlisted companies and they are normally measured at their fair value. Investments in listed companies are measured at the bid price at the balance sheet date based on published price quotations in an active market. Such unlisted shares whose fair value cannot be reliably determined, are mea-sured at cost. Unrealised changes in value of available-for-sale investments, net of tax, are recognised in the comprehensive income and in equity in fair value reserve. Cumulative fair value changes are released to the income statement when the invest-ment is sold or disposed of. Such significant impairment losses for which there is objective evidence, are recognised in the income statement immediately. Normally available-for-sale investments are included in non-current assets unless the Group has the inten-tion to hold them for less than 12 months after the balance sheet date.
Loans and receivablesFinancial assets that belong to this category meet the following criteria: they are non-derivative financial assets with fixed or determinable payments that are not quoted in an active market. The Group does not hold them for trading purposes either. Loans and receivables arise when money, goods or services are deliv-ered to a debtor. They are included in current or non-current assets in accordance with their maturity. Loans granted by the Group are measured at cost. An impairment loss is recognised on loan receivables if their carrying amount exceeds their recover-able amount.
held-to-maturity investmentsHeld-to-maturity investments are non-derivative financial assets with fixed or determinable payments and fixed maturity that the Group has the positive intent and ability to hold to maturity. They are stated at amortised cost less impairment losses and pre-sented within non-current assets. At the end of the reporting period the Group had no assets classified as held-to-maturity investments.
Financial liabilitiesFinancial liabilities are classified either as financial liabilities at fair value through profit or loss or as other liabilities. teleste only has liabilities classified to the latter category. on initial recognition a loan is measured at its fair value that is based on the consider-ation received. Subsequent to initial recognition, these liabilities
Financial Statements 2011 11

are stated at amortised cost calculated using the effective inter-est method. Interest expenses are recognised in the income statement over the term of the loan using the effective interest method.
Trade receivablestrade receivables are recognised at the original invoice amount to customers and stated at their cost less impairment losses, if any. The amount of doubtful receivables and assessment of a poten-tial impairment is based on risk of individual receivables. trade receivables are measured at their probable value at the highest. An impairment loss is recorded when there is objective evidence that the Group will not be able to collect all amounts due accord-ing to the original terms of the receivables. Bad debts recognised in the income statement are included in other operating expenses.
Cash and cash equivalentsCash and cash equivalents comprises cash balances, call deposits and other short-term highly liquid investments with original maturities of three months or less from the date of acquisition. Bank overdrafts, if any, are included within current liabilities.
Treasury sharesteleste Corporation’s own shares acquired by the Group, includ-ing directly attributable costs, are presented as a deduction from total equity in the consolidated financial statements. Purchases or subsequent sales of treasury shares are presented as changes in equity.
DividendsThe dividend proposed by the Board of Directors is not recog-nised until approved by a general meeting of shareholders.
provisionsA provision is recognised in the balance sheet when the Group has a present legal or constructive obligation as a result of a past event, a reliable estimate can be made of the amount of the obli-gation and it is probable that an outflow of economic benefits will be required to settle the obligation. The amount recognised as a provision is the best estimate of the expenditure required to set-tle the present obligation at the balance sheet date. If the effect of the time value of money on the amount of a provision is mate-rial, a provision is discounted. Provisions can arise from warran-ties, onerous contracts and restructurings. A warranty provision is recognised when the underlying products are sold. The provi-sion is based on historical warranty data and an estimate. A provi-sion for non-cancellable purchase commitments of the Group is recognised, if these commitments result in inventory in excess of forecasted requirements. A provision for onerous contracts is rec-ognised when the expected benefits to be derived by the Group from a contract are lower than the unavoidable cost of meeting its obligations under the contract. A reimbursement from a third party related to a provision is recognised as a receivable only when the reimbursement is virtually certain.
A provision for restructuring is recognised when the Group has a detailed and formal restructuring plan, and the restructuring has either commenced or has been announced publicly to those it concerns. The plan identifies at least the following: the business concerned, the principal locations affected, the location, function, and approximate number of employees who will be compensated for terminating their services, the expenditures that will be under-
taken and when the plan will be implemented. Future operating costs are not provided for.
Revenue recognition and net salesRevenue from the sale of goods is recognised in the income statement when all significant risks and rewards of ownership have been transferred to the buyer, which normally takes place when a commodity is delivered. Revenue from services is recog-nised when the service has been performed.
Revenue from construction contracts is recognised either on a percentage-of-completion basis, using units of delivery (based on predetermined milestones) or by applying the cost-to-cost method of accounting as the measurement basis. estimated con-tract profits are recognised in earnings in proportion to recorded sales, when a certain predetermined milestone has been achieved. In the cost-to-cost method, revenue and profits are recognised after considering the ratio of cumulative costs incurred to esti-mated total costs to complete each contract (the stage of com-pletion). Recognition of profit requires the outcome of a construc-tion contract be estimated reliably. If this is not the case, revenue is recognised only to the extent of contract costs incurred that it is probable will be recoverable; and contract costs are expensed in the period in which they are incurred. In the event that the Group can be held as the main contractor of a construction con-tract, various product expenses including raw materials and labour costs will be accounted for in the calculation of the stage of completion. Possible changes in the expected total expenses of a construction contract are expensed as incurred. The expected loss is charged to the income statement immediately.
Costs related to a construction contract for which revenue is not yet recognised are included in inventories under unfinished construction contracts. If costs incurred together with recognised profits exceed the amount billed, the difference is included in the balance sheet item “trade and other receivables”. When costs incurred together with recognised profits are lower than the amount billed, the difference is shown under “trade and other payables”.
Net sales include revenue from services rendered and goods sold, adjusted for discounts granted, sales-related taxes and effects of the translation differences.
other operating incomeother operating income comprises income not generated from primary activities, such as rental income and gains from disposal of assets.
Government grantsGovernment grants that compensate the Group for expenses incurred are recognised as revenue in the income statement on a systematic basis in the same periods in which the expenses are incurred. Grants that compensate the Group for the cost of an asset are recognised by deducting the grant from the carrying amount of the asset.
Employee benefits
pension arrangementsPension plans are classified as either defined contribution plans or defined benefit plans. The plans the Group has currently are classified as defined contribution plans. Contributions to defined contribution pension plans are recognised as an expense in the income statement in the year to which they relate. The statutory
12 Teleste, Enabling Digital Evolution
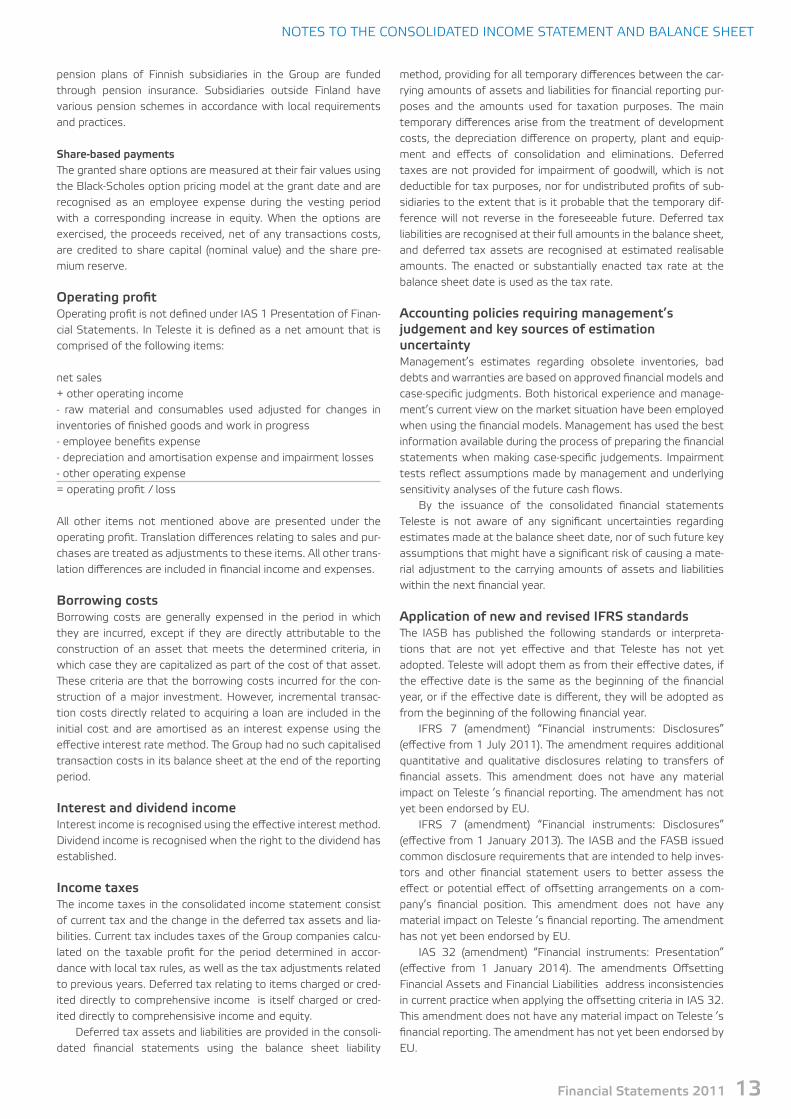
NoteS to tHe CoNSoLIDAteD INCoMe StAteMeNt AND BALANCe SHeet
pension plans of Finnish subsidiaries in the Group are funded through pension insurance. Subsidiaries outside Finland have various pension schemes in accordance with local requirements and practices.
Share-based paymentsThe granted share options are measured at their fair values using the Black-Scholes option pricing model at the grant date and are recognised as an employee expense during the vesting period with a corresponding increase in equity. When the options are exercised, the proceeds received, net of any transactions costs, are credited to share capital (nominal value) and the share pre-mium reserve.
operating profitoperating profit is not defined under IAS 1 Presentation of Finan-cial Statements. In teleste it is defined as a net amount that is comprised of the following items:
net sales+ other operating income- raw material and consumables used adjusted for changes in inventories of finished goods and work in progress- employee benefits expense- depreciation and amortisation expense and impairment losses- other operating expense= operating profit / loss
All other items not mentioned above are presented under the operating profit. translation differences relating to sales and pur-chases are treated as adjustments to these items. All other trans-lation differences are included in financial income and expenses.
borrowing costsBorrowing costs are generally expensed in the period in which they are incurred, except if they are directly attributable to the construction of an asset that meets the determined criteria, in which case they are capitalized as part of the cost of that asset. These criteria are that the borrowing costs incurred for the con-struction of a major investment. However, incremental transac-tion costs directly related to acquiring a loan are included in the initial cost and are amortised as an interest expense using the effective interest rate method. The Group had no such capitalised transaction costs in its balance sheet at the end of the reporting period.
Interest and dividend incomeInterest income is recognised using the effective interest method. Dividend income is recognised when the right to the dividend has established.
Income taxesThe income taxes in the consolidated income statement consist of current tax and the change in the deferred tax assets and lia-bilities. Current tax includes taxes of the Group companies calcu-lated on the taxable profit for the period determined in accor-dance with local tax rules, as well as the tax adjustments related to previous years. Deferred tax relating to items charged or cred-ited directly to comprehensive income is itself charged or cred-ited directly to comprehensisive income and equity.
Deferred tax assets and liabilities are provided in the consoli-dated financial statements using the balance sheet liability
method, providing for all temporary differences between the car-rying amounts of assets and liabilities for financial reporting pur-poses and the amounts used for taxation purposes. The main temporary differences arise from the treatment of development costs, the depreciation difference on property, plant and equip-ment and effects of consolidation and eliminations. Deferred taxes are not provided for impairment of goodwill, which is not deductible for tax purposes, nor for undistributed profits of sub-sidiaries to the extent that is it probable that the temporary dif-ference will not reverse in the foreseeable future. Deferred tax liabilities are recognised at their full amounts in the balance sheet, and deferred tax assets are recognised at estimated realisable amounts. The enacted or substantially enacted tax rate at the balance sheet date is used as the tax rate.
Accounting policies requiring management’s judgement and key sources of estimation uncertaintyManagement’s estimates regarding obsolete inventories, bad debts and warranties are based on approved financial models and case-specific judgments. Both historical experience and manage-ment’s current view on the market situation have been employed when using the financial models. Management has used the best information available during the process of preparing the financial statements when making case-specific judgements. Impairment tests reflect assumptions made by management and underlying sensitivity analyses of the future cash flows.
By the issuance of the consolidated financial statements teleste is not aware of any significant uncertainties regarding estimates made at the balance sheet date, nor of such future key assumptions that might have a significant risk of causing a mate-rial adjustment to the carrying amounts of assets and liabilities within the next financial year.
Application of new and revised IFRS standardsThe IASB has published the following standards or interpreta-tions that are not yet effective and that teleste has not yet adopted. teleste will adopt them as from their effective dates, if the effective date is the same as the beginning of the financial year, or if the effective date is different, they will be adopted as from the beginning of the following financial year.
IFRS 7 (amendment) “Financial instruments: Disclosures” (effective from 1 July 2011). The amendment requires additional quantitative and qualitative disclosures relating to transfers of financial assets. This amendment does not have any material impact on teleste ’s financial reporting. The amendment has not yet been endorsed by eU.
IFRS 7 (amendment) “Financial instruments: Disclosures” (effective from 1 January 2013). The IASB and the FASB issued common disclosure requirements that are intended to help inves-tors and other financial statement users to better assess the effect or potential effect of offsetting arrangements on a com-pany’s financial position. This amendment does not have any material impact on teleste ’s financial reporting. The amendment has not yet been endorsed by eU.
IAS 32 (amendment) “Financial instruments: Presentation” (effective from 1 January 2014). The amendments offsetting Financial Assets and Financial Liabilities address inconsistencies in current practice when applying the offsetting criteria in IAS 32. This amendment does not have any material impact on teleste ’s financial reporting. The amendment has not yet been endorsed by eU.
Financial Statements 2011 13

IAS 1 “Presentation of items of other comprehensive income” (amendment to IAS1) (effective from 1 July 2012). The amend-ment changes the grouping of items presented in oCI. Items that would be reclassified to profit or loss at a future point in time would be presented separately from items that will never be reclassified. The amendment has not yet been endorsed by eU.
IAS19 (amendment) ”employee benefits” (effective from 1 January 2013). The impact will be as follows: to eliminate the cor-ridor approach and recognise all actuarial gains and losses in oCI as they occur; to immediately recognise all past service costs; and to replace interest cost and expected return on plan assets with a net interest amount that is calculated by applying the discount rate to the net defined benefit liability (asset). teleste is yet to assess the full impact of the amendment. The amendment has not yet been endorsed by eU.
IFRS 9 ”Financial Instruments” (effective from 1 January 2015). This standard is a part of a wider project to replace IAS 39 and the later phases will be issued mainly during 2010. New stan-dard provides guidance in respect of classification and measure-ment of financial instruments. Later phases relate to impairment of financial instruments and hedge accounting. In teleste ’s esti-mation, this standard will not have any material impact on valua-tion of teleste ’s financial instruments compared with present IAS 39 but will have some effect on presentation of teleste ’s finan-cial instruments. This standard has not yet been endorsed by eU.
IFRS 10 ”Consolidated financial statements” builds on exist-ing principles by identifying the concept of control as the deter-mining factor in whether the entity should be included within the consolidated financial statemenst of the parent company. The change will not have any material impact on teleste ’s financial reporting. The amendment has not yet been endorsed by eU.
IFRS 11 “Joint arrangements” (effective from 1 January 2013). The change will not have any material impact on teleste ’s financial reporting. The amendment has not yet been endorsed by eU.
IFRS 12 “Disclosures of interest in other entities” (effective from 1 January 2013). The standard includes the disclosure requirements for all forms of interests in other entities, including joint arrangements, associates and/or structured entities. This standard has not yet been endorsed by eU.
IFRS 13 “Fair value measurement” (effective from 1 January 2013). The standard will not have any material impact on teleste ’s financial reporting. This standard has not yet been endorsed by eU.
IAS 27 (revised) “Separate financial statements” (effective from 1 January 2013). The standards includes the provisions on separate financial statements that are left after the control provi-sions of IAS 27 have been included to new IFRS 10. The amended standard has not yet been endorsed by eU.
IAS 28 (revised) “Associates and joint ventures” (effective from 1 January 2013). The standard include requirements for joint ventures, as well as associates, to be equity accounted following the issue of IFRS 11. The revised standard has not yet been endorsed by eU.
other changes or amendments to other published IFRS stan-dards and IFRIC’s do not have any material impact on teleste ’s financial reporting.
14 Teleste, Enabling Digital Evolution

NoteS to tHe CoNSoLIDAteD INCoMe StAteMeNt AND BALANCe SHeet
teleste Group is organised in two reporting segments. These seg-ments are based on the Group’s organisational and internal reporting structure. The Group has adopted IFRS 8 since 1 Janu-ary 2009 and it haven’t had any impact on the reporting of oper-ating segments.
business segmentsThe Group comprises two business segments that are Networks Services and Video and Broadband Solutions.
Video and Broadband Solutions business segment has the emphasis on product solutions for broadband access networks, video service platforms and video surveillance applications.
Network Services segment deliver comprehensive network service solutions including new construction, rebuilding, upgrad-ing, planning and maintenance services of cable networks.
Geographical divisionThe two segments operates in four geographical areas:• Finland• other Nordic countries• other europe• others (North America, Asia and other countries)
The main market area of Video and Broadband Solutions is europe where the business unit is present with its 23 dedicated offices supported by several support and integration partners.
Apart from europe, offices have been established in Australia, China, India and USA.
The geographical division od sales are shown based on cus-tomer location. Assets and investments are presented by geo-graphical location of assets.
There are no major inter-segment sales in the Group.
Unallocated itemsUnallocated income statement items include costs and incomes which follow earnings after depreciations. Assets not allocated to the segments represent cash. Unallocated liabilities are interest bearing liabilities and tax liabilities.
Segment Reporting
Financial Statements 2011 15

BUSINeSS SeGMeNtS
2011 1,000 €
Video and Broadband
Solutions Network Services Group
external sales
Services 4,305 93,900 98,205
Goods 85,411 0 85,411
total external sales 89,716 93,900 183,616
operating profit of segments 8,220 1,160 9,380
operating profit 9,380
Financial items -541 -541
Profit before taxes 8,839 8,839
Non-current assets of segment 35,545 13,861 49,406
2010 1,000 €
Video and Broadband
Solutions Network Services Group
external sales
Services 3,379 85,829 89,208
Goods 78,628 0 78,628
total external sales 82,007 85,829 167,836
operating profit of segments 6,345 1,087 7,432
operating profit 7,432
Financial items –689
Profit before taxes 6,743
Non-current assets of segment 33,527 13,690 47,217
Geographical division
2011 1,000 € Finland Nordic countries other europe others Group
Sales by origin 10,830 11,059 154,979 6,748 183,616
Assets 38,576 9,280 83,634 1,721 133,211
Capital expenditure 3,631 15 1,576 18 5,240
2010 1,000 € Finland Nordic countries other europe others Group
Sales by origin 11,272 17,932 129,512 9,120 167 ,836
Assets 29,877 7,922 77,272 1,168 116,239
Capital expenditure 2,190 25 1,511 25 3,751
Major customerRevenues from one customer of the Group’s Network Services segment represents approximately 56.7 Meur in 2011 (51.6 Meur in 2010), which is 30.9% (30.7%) of Group net sales.
16 Teleste, Enabling Digital Evolution
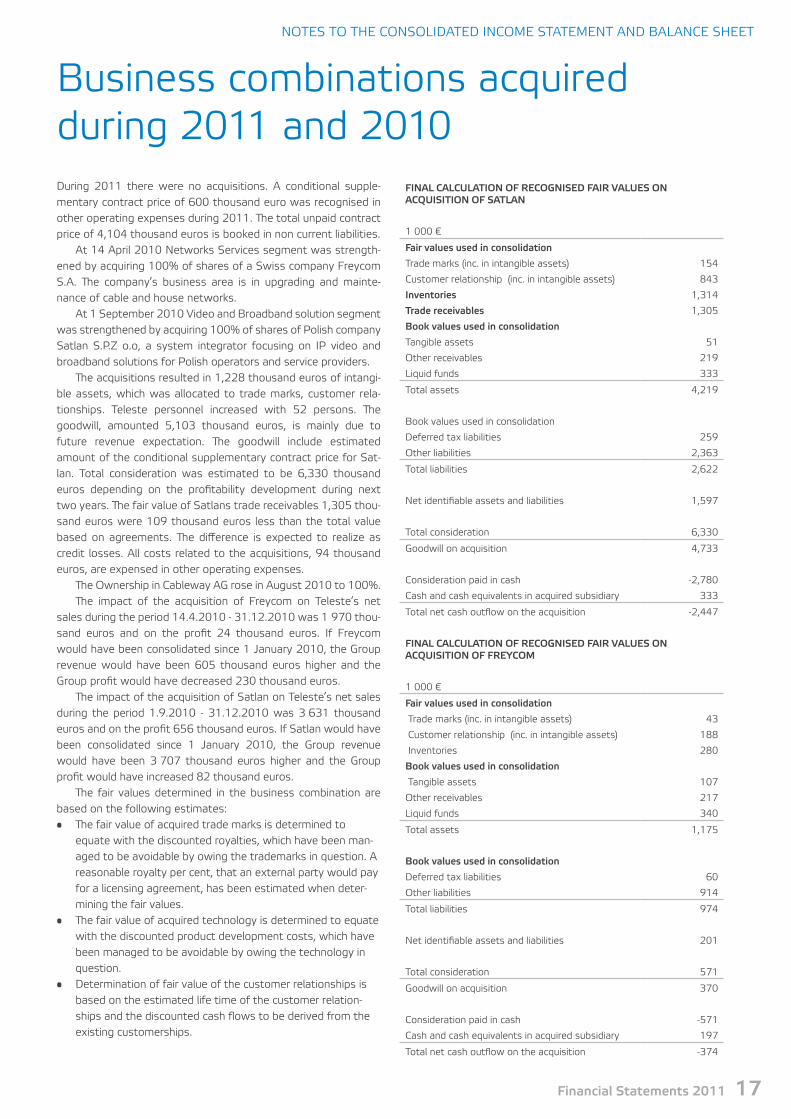
NoteS to tHe CoNSoLIDAteD INCoMe StAteMeNt AND BALANCe SHeet
During 2011 there were no acquisitions. A conditional supple-mentary contract price of 600 thousand euro was recognised in other operating expenses during 2011. The total unpaid contract price of 4,104 thousand euros is booked in non current liabilities.
At 14 April 2010 Networks Services segment was strength-ened by acquiring 100% of shares of a Swiss company Freycom S.A. The company’s business area is in upgrading and mainte-nance of cable and house networks.
At 1 September 2010 Video and Broadband solution segment was strengthened by acquiring 100% of shares of Polish company Satlan S.P.Z o.o, a system integrator focusing on IP video and broadband solutions for Polish operators and service providers.
The acquisitions resulted in 1,228 thousand euros of intangi-ble assets, which was allocated to trade marks, customer rela-tionships. teleste personnel increased with 52 persons. The goodwill, amounted 5,103 thousand euros, is mainly due to future revenue expectation. The goodwill include estimated amount of the conditional supplementary contract price for Sat-lan. total consideration was estimated to be 6,330 thousand euros depending on the profitability development during next two years. The fair value of Satlans trade receivables 1,305 thou-sand euros were 109 thousand euros less than the total value based on agreements. The difference is expected to realize as credit losses. All costs related to the acquisitions, 94 thousand euros, are expensed in other operating expenses.
The ownership in Cableway AG rose in August 2010 to 100%.The impact of the acquisition of Freycom on teleste’s net
sales during the period 14.4.2010 - 31.12.2010 was 1 970 thou-sand euros and on the profit 24 thousand euros. If Freycom would have been consolidated since 1 January 2010, the Group revenue would have been 605 thousand euros higher and the Group profit would have decreased 230 thousand euros.
The impact of the acquisition of Satlan on teleste’s net sales during the period 1.9.2010 - 31.12.2010 was 3 631 thousand euros and on the profit 656 thousand euros. If Satlan would have been consolidated since 1 January 2010, the Group revenue would have been 3 707 thousand euros higher and the Group profit would have increased 82 thousand euros.
The fair values determined in the business combination are based on the following estimates:• The fair value of acquired trade marks is determined to
equate with the discounted royalties, which have been man-aged to be avoidable by owing the trademarks in question. A reasonable royalty per cent, that an external party would pay for a licensing agreement, has been estimated when deter-mining the fair values.
• The fair value of acquired technology is determined to equate with the discounted product development costs, which have been managed to be avoidable by owing the technology in question.
• Determination of fair value of the customer relationships is based on the estimated life time of the customer relation-ships and the discounted cash flows to be derived from the existing customerships.
FINAL CALCULATIoN oF RECoGNISED FAIR VALUES oN ACQUISITIoN oF SATLAN
1 000 €
Fair values used in consolidation
trade marks (inc. in intangible assets) 154
Customer relationship (inc. in intangible assets) 843
Inventories 1,314
Trade receivables 1,305
book values used in consolidation
tangible assets 51
other receivables 219
Liquid funds 333
total assets 4,219
Book values used in consolidation
Deferred tax liabilities 259
other liabilities 2,363
total liabilities 2,622
Net identifiable assets and liabilities 1,597
total consideration 6,330
Goodwill on acquisition 4,733
Consideration paid in cash -2,780
Cash and cash equivalents in acquired subsidiary 333
total net cash outflow on the acquisition -2,447
FINAL CALCULATIoN oF RECoGNISED FAIR VALUES oN ACQUISITIoN oF FREYCoM
1 000 €
Fair values used in consolidation
trade marks (inc. in intangible assets) 43
Customer relationship (inc. in intangible assets) 188
Inventories 280
book values used in consolidation
tangible assets 107
other receivables 217
Liquid funds 340
total assets 1,175
book values used in consolidation
Deferred tax liabilities 60
other liabilities 914
total liabilities 974
Net identifiable assets and liabilities 201
total consideration 571
Goodwill on acquisition 370
Consideration paid in cash -571
Cash and cash equivalents in acquired subsidiary 197
total net cash outflow on the acquisition -374
Business combinations acquired during 2011 and 2010
Financial Statements 2011 17
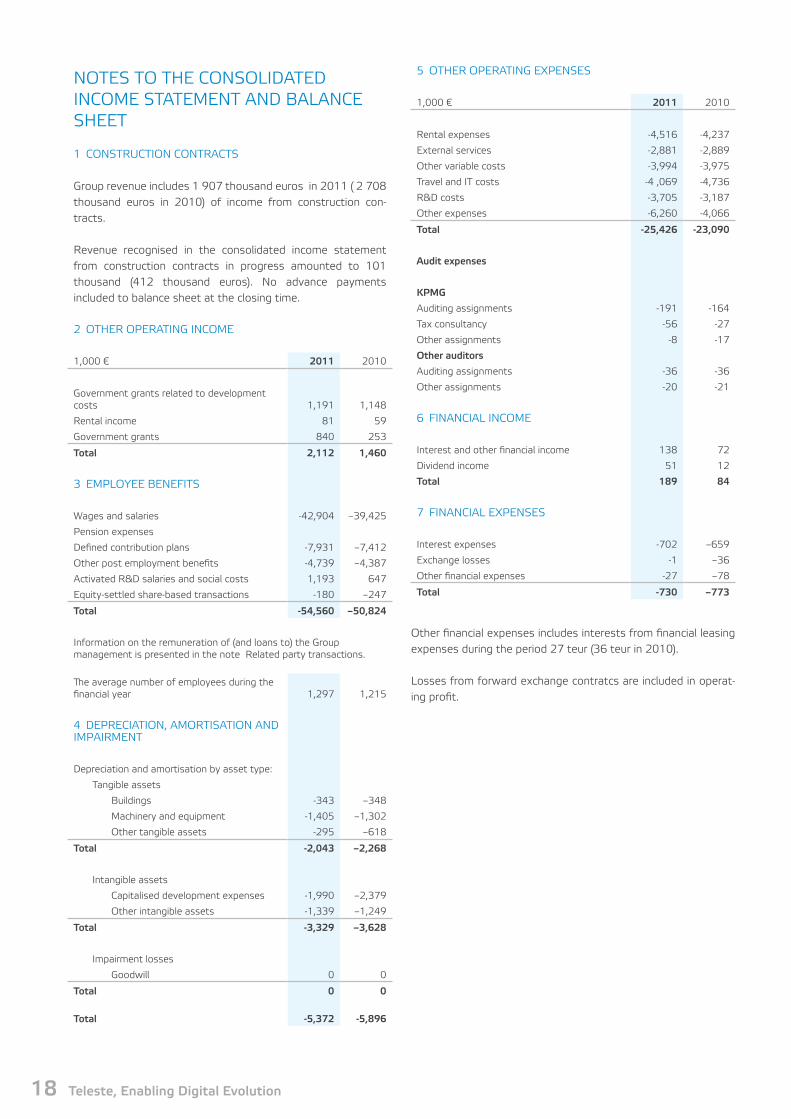
NoteS to tHe CoNSoLIDAteD INCoMe StAteMeNt AND BALANCe SHeet
1 CoNStRUCtIoN CoNtRACtS
Group revenue includes 1 907 thousand euros in 2011 ( 2 708 thousand euros in 2010) of income from construction con-tracts.
Revenue recognised in the consolidated income statement from construction contracts in progress amounted to 101 thousand (412 thousand euros). No advance payments included to balance sheet at the closing time.
2 otHeR oPeRAtING INCoMe
1,000 € 2011 2010
Government grants related to development costs 1,191 1,148
Rental income 81 59
Government grants 840 253
Total 2,112 1,460
3 eMPLoYee BeNeFItS
Wages and salaries -42,904 –39,425
Pension expenses
Defined contribution plans -7,931 –7,412
other post employment benefits -4,739 –4,387
Activated R&D salaries and social costs 1,193 647
equity-settled share-based transactions -180 –247
Total -54,560 –50,824
Information on the remuneration of (and loans to) the Group management is presented in the note Related party transactions.
The average number of employees during the financial year 1,297 1,215
4 DePReCIAtIoN, AMoRtISAtIoN AND IMPAIRMeNt
Depreciation and amortisation by asset type:
tangible assets
Buildings -343 –348
Machinery and equipment -1,405 –1,302
other tangible assets -295 –618
Total -2,043 –2,268
Intangible assets
Capitalised development expenses -1,990 –2,379
other intangible assets -1,339 –1,249
Total -3,329 –3,628
Impairment losses
Goodwill 0 0
Total 0 0
Total -5,372 -5,896
5 otHeR oPeRAtING eXPeNSeS
1,000 € 2011 2010
Rental expenses -4,516 -4,237
external services -2,881 -2,889
other variable costs -3,994 -3,975
travel and It costs -4 ,069 -4,736
R&D costs -3,705 -3,187
other expenses -6,260 -4,066
Total -25,426 -23,090
Audit expenses
KpMG
Auditing assignments -191 -164
tax consultancy -56 -27
other assignments -8 -17
other auditors
Auditing assignments -36 -36
other assignments -20 -21
6 FINANCIAL INCoMe
Interest and other financial income 138 72
Dividend income 51 12
Total 189 84
7 FINANCIAL eXPeNSeS
Interest expenses -702 –659
exchange losses -1 –36
other financial expenses -27 –78
Total -730 –773
other financial expenses includes interests from financial leasing expenses during the period 27 teur (36 teur in 2010).
Losses from forward exchange contratcs are included in operat-ing profit.
18 Teleste, Enabling Digital Evolution

NoteS to tHe CoNSoLIDAteD INCoMe StAteMeNt AND BALANCe SHeet
8 INCoMe tAXeS
1,000 € 2011 2010
Recognised in the income statement
Current year -2 ,443 –1,764
Adjustments for prior years -25 –230
Deferred tax expense -72 35
Total -2,540 –1,959
Reconciliation of the tax expense, eUR -2 540 thousand, calcu-lated using the teleste Group’s domestic corporation 26 % tax rate:
Profit before tax 8 839 6 743
Income tax using the domestic corporation tax rate (26 %) -2,298 -1,753
effect of tax rates in foreign jurisdictions 44 -86
tax debt increase related to balance sheet items -72 35
Non-deductible expenses -189 -76
taxes from previous year -25 -230
effect of tax losses utilised 0 150
Income tax income/expense reported in the consolidated income statement -2,540 -1,959
9 eARNINGS PeR SHARe
The basic earnings per share is calculated as follows:
Profit for the year attributable to equity holders of the parent
Weighted average number of ordinary shares outstanding during the financial year
The number of ordinary shares outstanding excludes the treasury shares.
The diluted earnings per share is calculated as follows:
Profit for the year attributable to equity holders of the parent (diluted)
Weighted average number of ordinary shares outstanding during the financial year (diluted)
The changes in the number of the shares are presented in the note 17 Capital and reserves.
2011 2010
Profit for the year attributable to equity holders of the parent, (1 000 €) 6,299 4,784
Weighted average number of ordinary shares outstanding during the financial year (1 000) 17,425 17,425
Basic earnings per share (€) 0.36 0.27
Weighted average number of ordinary shares outstanding during the financial year (1000) 17,425 17,425
effect of share options on issue (1000) 0 268
Weighted average number of ordinary shares outstanding during the financial year (diluted)(1 000) 17,425 17,693
Diluted earnings per share (€) 0.36 0.27
The share options granted by the Group have a dilutive effect, i.e. they increase the number of the ordinary shares when their sub-scription price is below the fair value of the share. The dilutive effect equals the number of the shares gratuitously issued ; this difference arises when the Group can not issue the same number of shares at their fair value using the proceeds received on the exercise of the options.
Financial Statements 2011 19
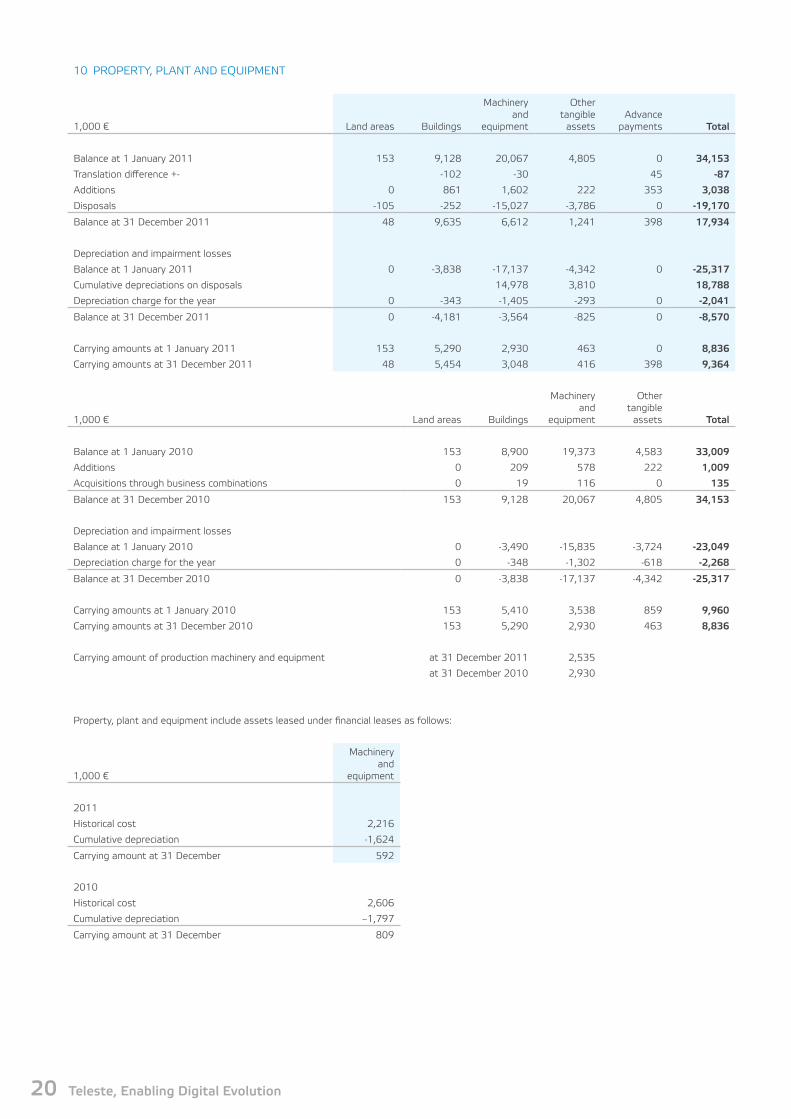
10 PRoPeRtY, PLANt AND eQUIPMeNt
1,000 € Land areas Buildings
Machinery and
equipment
other tangible
assetsAdvance
payments Total
Balance at 1 January 2011 153 9,128 20,067 4,805 0 34,153
translation difference +- -102 -30 45 -87
Additions 0 861 1,602 222 353 3,038
Disposals -105 -252 -15,027 -3,786 0 -19,170
Balance at 31 December 2011 48 9,635 6,612 1,241 398 17,934
Depreciation and impairment losses
Balance at 1 January 2011 0 -3,838 -17,137 -4,342 0 -25,317
Cumulative depreciations on disposals 14,978 3,810 18,788
Depreciation charge for the year 0 -343 -1,405 -293 0 -2,041
Balance at 31 December 2011 0 -4,181 -3,564 -825 0 -8,570
Carrying amounts at 1 January 2011 153 5,290 2,930 463 0 8,836
Carrying amounts at 31 December 2011 48 5,454 3,048 416 398 9,364
1,000 € Land areas Buildings
Machinery and
equipment
other tangible
assets Total
Balance at 1 January 2010 153 8,900 19,373 4,583 33,009
Additions 0 209 578 222 1,009
Acquisitions through business combinations 0 19 116 0 135
Balance at 31 December 2010 153 9,128 20,067 4,805 34,153
Depreciation and impairment losses
Balance at 1 January 2010 0 -3,490 -15,835 -3,724 -23,049
Depreciation charge for the year 0 -348 -1,302 -618 -2,268
Balance at 31 December 2010 0 -3,838 -17,137 -4,342 -25,317
Carrying amounts at 1 January 2010 153 5,410 3,538 859 9,960
Carrying amounts at 31 December 2010 153 5,290 2,930 463 8,836
Carrying amount of production machinery and equipment at 31 December 2011 2,535
at 31 December 2010 2,930
Property, plant and equipment include assets leased under financial leases as follows:
1,000 €
Machinery and
equipment
2011
Historical cost 2,216
Cumulative depreciation -1,624
Carrying amount at 31 December 592
2010
Historical cost 2,606
Cumulative depreciation –1,797
Carrying amount at 31 December 809
20 Teleste, Enabling Digital Evolution

NoteS to tHe CoNSoLIDAteD INCoMe StAteMeNt AND BALANCe SHeet
11 INtANGIBLe ASSetS
1,000 € Goodwill Develop-ment costs other intangible assets Total
Balance at 1.1 2011 31,759 13,771 6,933 52,463
translations differences 318 136 454
Additions 0 2,723 0 2,723
Disposals 0 -5,002 0 -5,002
Balance at 31.12.2011 32,077 11,492 7,069 50,638
Amortisation and impairment losses
Balance at 1.1. 2011 -800 -10,572 -3,423 -14,795
Cumulative depreciations on disposals 5,103 5,103
Amortisation for the year 0 -1,990 -1,341 -3,331
Balance at 31.12.2011 -800 -7,459 -4,764 -13,023
Carrying amounts 1.1.2011 30,959 3,199 3,510 37,668
Carrying amounts 31.12.2011 31,277 4,033 2,305 37,615
1,000 € Goodwill Develop-ment costs other intangible assets Total
Balance at 1.1 2010 32,457 12,029 6,002 50,488
Additions 5,103 1,742 1,160 8,005
Disposals -5,801 - -229 -6,030
Balance at 31.12.2010 31,759 13,771 6,933 52,463
Amortisation and impairment losses
Balance at 1.1. 2010 -800 -8,193 -2,174 -11,167
Amortisation for the year 0 -2,379 -1,249 -3,628
Balance at 31.12.2010 -800 -10,572 -3,423 -14,795
Carrying amounts 1.1.2010 31,657 3,836 3,828 39,321
Carrying amounts 31.12.2010 30,959 3,199 3,510 37,668
For the purposes of impairment testing goodwill items of the Group have been allocated to the segments, each of which repre-sents a separate cash-generating unit. The aggregate goodwill amount totalled 31.3 million euro at 31 December 2011. Goodwill has been allocated to the following cash-generating unit (Meur):
Video and Broadband Solutions 23.5Network Services 7.8
The recoverable amount of the segments is based upon value-in-use calculations. Those calculations use cash flow projections based upon the strategy and budgets approved by the manage-ment. Calculations are prepared covering a 10 years’ period. The cash flow for Video and Broadband Solutions segment covers the five first years with 5% annual growth rate and for Network Ser-vices segment over 20% annual growth for the 3 first years and 5% annual growth rate for the next 2 years (For both Video and Broadband Solutions and Network Services first 5 years is based on 5% yearly growth rate) The expected future cash flows for a further 5 year period are extrapolated using a 2% (5 %) growth rate for both segments.
Management’s view on the cash flows is cautious as the changes of the industry are difficult to foresee. A discount rate of 10.99% (12.7%) has been used in discounting the projected cash flows. The terminal value of the segments is calculated by using a growth rate of 2%. The impairment test process included the sen-sitivity analysis of the segment or a cash generating unit (CGU) in the segment, in which the specific yearly cash flow estimates
were reduced by 1 - 3 percentage units and the discount interests were increased by 1 - 2 percentage units. In Video and Broadband Solutions segment the recoverable amount is 48% higher than the carrying amount of net assets. If the annual growth rate would decrease to 2% annually for the next 10 years and discount rate would increase 3.2 percentage units, then the recoverable amount would be 1% higher than the carrying amount of net assets. In Networks Services segment the recoverable amount is 21% higher than the carrying amount of net assets. If the annual growth rate would be 10% less than the growth expectation for 3 next years and 2% annually the following next 7 years and dis-count rate woulld stay at 10.99%, then the recoverable amount would be 4% higher than the carrying amount of net assets.
The Group received a grant amounting to 1.6 million euro from tekes (National technology Agency of Finland) towards develop-ment costs in 2011 (2010: 1.4 million euro). From the grant received 0,36 million euro (2010: 0,22 million euro) has been rec-ognised to deduct the carrying amount of the asset. The grant has the condition, according to which 10 % of the total costs of the project have to be incurred through subcontracting work in Finnish small and medium-sized companies.
12 AVAILABLe-FoR-SALe INVeStMeNtS
1,000 € 2011 2010
Unlisted shares 713 713
total 713 713
Financial Statements 2011 21
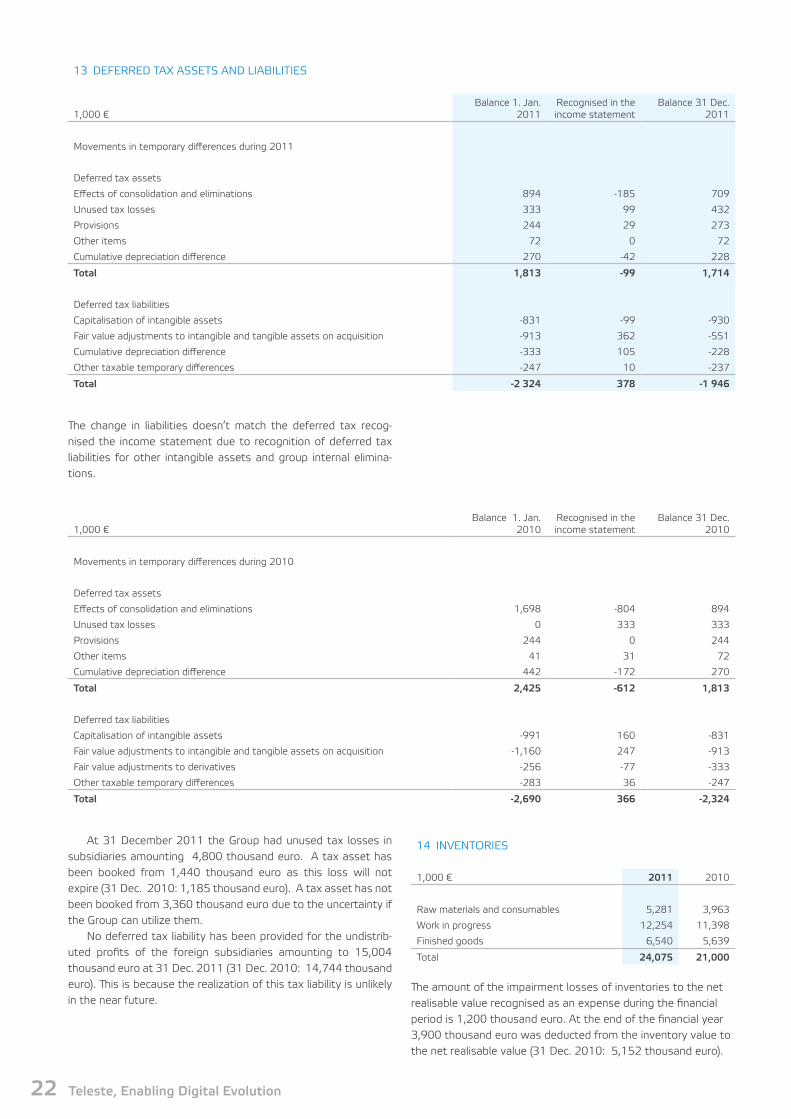
13 DeFeRReD tAX ASSetS AND LIABILItIeS
1,000 €Balance 1. Jan.
2011Recognised in the income statement
Balance 31 Dec. 2011
Movements in temporary differences during 2011
Deferred tax assets
effects of consolidation and eliminations 894 -185 709
Unused tax losses 333 99 432
Provisions 244 29 273
other items 72 0 72
Cumulative depreciation difference 270 -42 228
Total 1,813 -99 1,714
Deferred tax liabilities
Capitalisation of intangible assets -831 -99 -930
Fair value adjustments to intangible and tangible assets on acquisition -913 362 -551
Cumulative depreciation difference -333 105 -228
other taxable temporary differences -247 10 -237
Total -2 324 378 -1 946
The change in liabilities doesn’t match the deferred tax recog-nised the income statement due to recognition of deferred tax liabilities for other intangible assets and group internal elimina-tions.
1,000 €Balance 1. Jan.
2010Recognised in the income statement
Balance 31 Dec. 2010
Movements in temporary differences during 2010
Deferred tax assets
effects of consolidation and eliminations 1,698 -804 894
Unused tax losses 0 333 333
Provisions 244 0 244
other items 41 31 72
Cumulative depreciation difference 442 -172 270
Total 2,425 -612 1,813
Deferred tax liabilities
Capitalisation of intangible assets -991 160 -831
Fair value adjustments to intangible and tangible assets on acquisition -1,160 247 -913
Fair value adjustments to derivatives -256 -77 -333
other taxable temporary differences -283 36 -247
Total -2,690 366 -2,324
At 31 December 2011 the Group had unused tax losses in subsidiaries amounting 4,800 thousand euro. A tax asset has been booked from 1,440 thousand euro as this loss will not expire (31 Dec. 2010: 1,185 thousand euro). A tax asset has not been booked from 3,360 thousand euro due to the uncertainty if the Group can utilize them.
No deferred tax liability has been provided for the undistrib-uted profits of the foreign subsidiaries amounting to 15,004 thousand euro at 31 Dec. 2011 (31 Dec. 2010: 14,744 thousand euro). This is because the realization of this tax liability is unlikely in the near future.
14 INVeNtoRIeS
1,000 € 2011 2010
Raw materials and consumables 5,281 3,963
Work in progress 12,254 11,398
Finished goods 6,540 5,639
total 24,075 21,000
The amount of the impairment losses of inventories to the net realisable value recognised as an expense during the financial period is 1,200 thousand euro. At the end of the financial year 3,900 thousand euro was deducted from the inventory value to the net realisable value (31 Dec. 2010: 5,152 thousand euro).
22 Teleste, Enabling Digital Evolution

NoteS to tHe CoNSoLIDAteD INCoMe StAteMeNt AND BALANCe SHeet
1,000 €Balance 1. Jan.
2010Recognised in the income statement
Balance 31 Dec. 2010
Movements in temporary differences during 2010
Deferred tax assets
effects of consolidation and eliminations 1,698 -804 894
Unused tax losses 0 333 333
Provisions 244 0 244
other items 41 31 72
Cumulative depreciation difference 442 -172 270
Total 2,425 -612 1,813
Deferred tax liabilities
Capitalisation of intangible assets -991 160 -831
Fair value adjustments to intangible and tangible assets on acquisition -1,160 247 -913
Fair value adjustments to derivatives -256 -77 -333
other taxable temporary differences -283 36 -247
Total -2,690 366 -2,324
15 tRADe AND otHeR CURReNt ReCeIVABLeS
1,000 € 2011 2010
trade receivables 40,095 28,082
Accrued income and prepayments 1,006 2,070
other receivables 3,225 2,667
Total 44,326 32,819
16 CASH AND CASH eQUIVALeNtS
Cash at bank and in hand and call deposits 15,404 15,203
Total 15,404 15,203
Cash and cash equivalents in the statement of cash flows 15,404 15,203
17 CAPItAL AND ReSeRVeS
1,000 €Number of shares,
1,000Number of own
shares, 1,000Number of shares,
total 1,000Share capital,
1,000 €Reserve fund,
1,000 €
At 1 January 2010 17,426 379 17,805 6,967 1,504
Issue of new shares (teleste Management oy) 381 381
Share options exercised by employees 0 0 0 0 0
own shares purchased 0 0 0 0 0
own shares sold 0 0 0 0 0
At 31 December 2010 17,426 760 18,186 6,967 1,504
Issue of new shares (teleste Management II oy) 0 542 542 0 0
Share options exercised by employees 0 0 0 0 0
own shares purchased 0 0 0 0 0
own shares sold 0 0 0 0 0
At 31 December 2011 17,426 1,302 18,728 6,967 1,504
The number of teleste oyj shares was 18,728,590 at 31 Decem-ber 2011 (31 Dec. 2010 18,186,590 shares). All shares issued have been fully paid.
The Annual General Meeting of teleste oyj held on 8th of April 2011 decided to authorize the Board of Directors to decide on issuing new shares and/or conveying the Company’s own shares.
Based on the authorization, a maximum of 5,000,000 new shares may be issued and a maximum of 1,779,985 of the Com-pany’s own shares held by the Company or its group company may be conveyed. The number of shares to be issued to the Com-pany itself together with the shares repurchased to the Company on basis of the authorization to repurchase own shares shall be at the maximum of 1,400,000 shares. The maximum number of new shares that may be subscribed and own shares held by the Company that may be conveyed by virtue of the special rights granted by the Company is 2,500,000 shares in total which num-ber is included in the above maximum numbers of new shares and own shares held by the Company.
on the basis of authorization granted by the Annual General Meeting of teleste oyj held on 8 April 2011, the Board of Direc-tors of teleste decided on 5th December 2011 on a share issue against payment directed to teleste Management II. In the share issue, a maximum total of 542,000 new shares in teleste will be
offered for subscription by teleste Management II, in derogation from the shareholders’ pre-emptive subscription rights. There are weighty financial reasons for the derogation from the sharehold-ers’ pre-emptive subscription rights as the shares to be issued in the share issue will be used for the implementation of the incen-tive and commitment plan of the members of the teleste Man-agement Group. At the end of December 2011, the number of own shares in the Group possession stood at 1,302,985.
The Annual General Meeting of teleste oyj held on 9 April 2010 decided to authorize the Board of Directors to repurchase Company’s own shares in accordance with the proposal of the Board of Directors. Based on the authorization, the Board of Directors may repurchase a maximum of 1,400,000 own shares of the Company otherwise than in proportion to the holdings of the shareholders by using the non-restricted equity at the market price prevailing at the time of the acquisition in NASDAQ oMX Helsinki Ltd.
Based on the authorization, a maximum of 10,000,000 new shares may be issued and a maximum of 1,779,985 of own shares held by the Company may be conveyed. The number of shares to be issued to the Company itself together with the shares repurchased to the Company on the basis of the authori-zation to repurchase own shares shall be at the maximum 1,400,000 shares. The maximum number of new shares that may
Financial Statements 2011 23

17 SHARe-BASeD PAYMeNtS
teleste Corporation had one option scheme in operation during the period: Stock options 2007. The scheme was approved by teleste annual general shareholders’ meetings in 2007. The stock options have an average maturity of 6 years from the plan launch including a waiting period and a two-year share subscription period. Under the schemes outstanding at the end of the period the annual general meeting of shareholders has authorized teleste board of directors to grant up to 840 000 options to the
Basic information Stock options 2007 total
2011 2007A 2007B 2007C
31 December 2011
Annual General Shareholders' Meeting date 03 April 2007 03 April 2007 03 April 2007
Grant date(s) 24 August 2007 15 october 2008 21 September 2009
Maximum number of stock options 280,000 280,000 280,000 840,000
The number of shares subscribed by one option 1 1 1
Initial exercise price * 12.89 € 6.94 € 3.57 €
Dividend adjustment Yes Yes Yes
exercise price Dec. 31, 2008 12.45 € 6.70 € --
exercise price Dec. 31, 2009 12.33 € 6.58 € 3.57 €
exercise price Dec. 31, 2010 12.25 € 6.50 € 3.49 €
exercise price Dec. 31, 2011 ** 12.13 € 6.38 € 3.37 €
Beginning of exercise period (vesting) 01 April 2010 01 April 2011 01 April 2012
end of excercise period (expiration) 30 April 2012 30 April 2013 30 April 2014
Maximum contractual life, years 5.1 6.1 7.1
Remaining contractual life Dec. 31, 2010, years 0.3 1.3 2.3
Number of persons Dec. 31, 2011 Vested Vested 41
Vesting conditions employment until beginning of exercise period
* Share subscription price for stock options 2007 is the volume weighted average price plus 10 % of Teleste share in NASDAQ OMX Helsinki Ltd during April 2007, April 2008 and April 2009 for the stock options 2007A, 2007B and 2007C, respectively.
** Share subscription price at the expiration if the stock options expired during the period.”
Group key employees or to teleste subsidiary, which may be authorized to grant options further to the Group key personnel. The options are forfeited if the employee leaves the Group before the options vest. The options expire unless not distributed or exercised by the end of the share subscribtion period. Dilution effect of the new shares potentially subscribed with the out-standing stock options the after share capital increase currently amount to 3,76%, at maximum. Key characteristics and terms of the teleste option schemes in operation at the end of the period are listed in the table below.
be subscribed and own shares held by the Company that may be conveyed by virtue of the special rights granted by the Company is 5,000,000 shares in total which number shall be included in the above maximum numbers of new shares and own shares held by the Company. on the basis of authorization granted by the Annual General Meeting of Shareholders of teleste on 7 April 2009, the Board of Directors of teleste decided on a share issue against payment directed to teleste Management to be formed. In the share issue, a total of 381,000 new shares in teleste was offered for subscription by teleste Management, in derogation from the shareholders’ pre-emptive subscription rights.
At the end of December 2010, the number of own shares in the Group possession stood at 760,985.
Shares subscribed for pursuant to the share option plans will entitle to dividend when the increase of the share capital is regis-
tered with the Finnish trade register. Voting and other share-holder rights will commence on the date on which the increase of the share capital is registered with the Finnish trade register.
Translation reserveThe translation reserve comprises all foreign exchange differ-ences arising from the translation of the financial statements of foreign subsidiaries.
DividendsAfter the balance sheet date the dividend of 0.14 euro per share (2010 0.12 euro per share) was proposed by the Board of Direc-tors.
24 Teleste, Enabling Digital Evolution
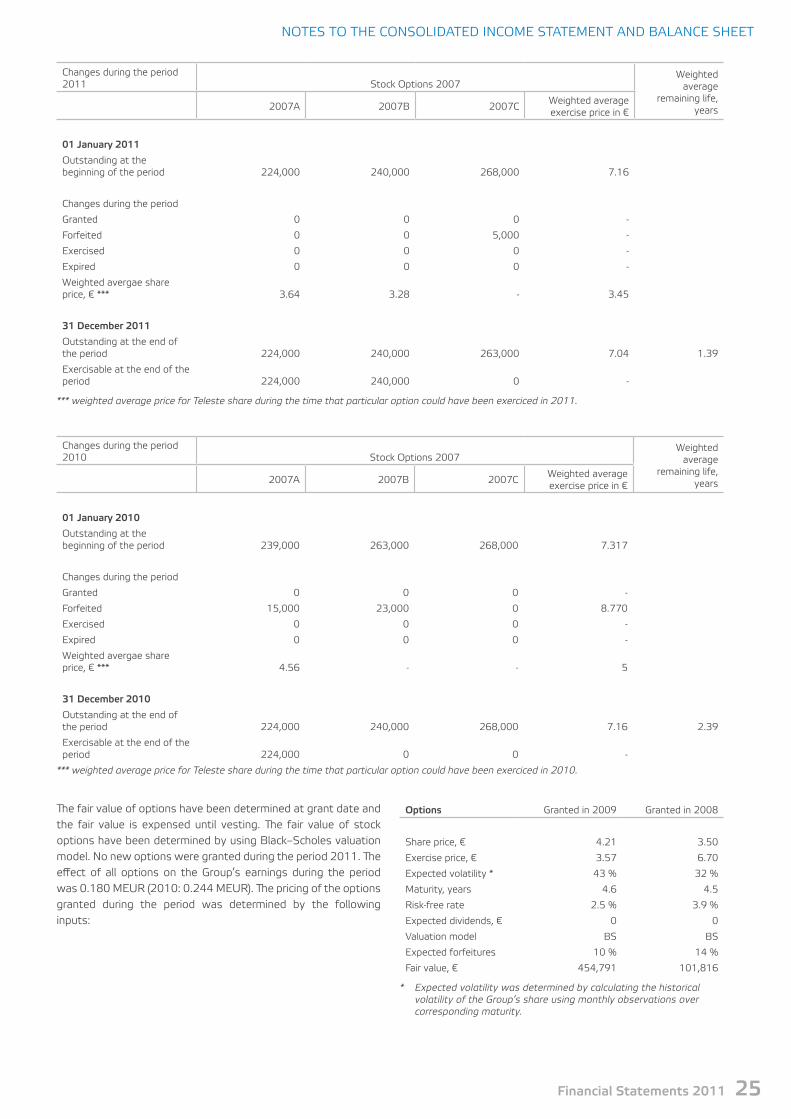
NoteS to tHe CoNSoLIDAteD INCoMe StAteMeNt AND BALANCe SHeet
Changes during the period 2011 Stock options 2007
Weighted average
remaining life, years2007A 2007B 2007C
Weighted average exercise price in €
01 January 2011
outstanding at the beginning of the period 224,000 240,000 268,000 7.16
Changes during the period
Granted 0 0 0 -
Forfeited 0 0 5,000 -
exercised 0 0 0 -
expired 0 0 0 -
Weighted avergae share price, € *** 3.64 3.28 - 3.45
31 December 2011
outstanding at the end of the period 224,000 240,000 263,000 7.04 1.39
exercisable at the end of the period 224,000 240,000 0 -
*** weighted average price for Teleste share during the time that particular option could have been exerciced in 2011.
options Granted in 2009 Granted in 2008
Share price, € 4.21 3.50
exercise price, € 3.57 6.70
expected volatility * 43 % 32 %
Maturity, years 4.6 4.5
Risk-free rate 2.5 % 3.9 %
expected dividends, € 0 0
Valuation model BS BS
expected forfeitures 10 % 14 %
Fair value, € 454,791 101,816
* Expected volatility was determined by calculating the historical volatility of the Group’s share using monthly observations over corresponding maturity.
Changes during the period 2010 Stock options 2007
Weighted average
remaining life, years2007A 2007B 2007C
Weighted average exercise price in €
01 January 2010
outstanding at the beginning of the period 239,000 263,000 268,000 7.317
Changes during the period
Granted 0 0 0 -
Forfeited 15,000 23,000 0 8.770
exercised 0 0 0 -
expired 0 0 0 -
Weighted avergae share price, € *** 4.56 - - 5
31 December 2010
outstanding at the end of the period 224,000 240,000 268,000 7.16 2.39
exercisable at the end of the period 224,000 0 0 -
*** weighted average price for Teleste share during the time that particular option could have been exerciced in 2010.
The fair value of options have been determined at grant date and the fair value is expensed until vesting. The fair value of stock options have been determined by using Black–Scholes valuation model. No new options were granted during the period 2011. The effect of all options on the Group’s earnings during the period was 0.180 MeUR (2010: 0.244 MeUR). The pricing of the options granted during the period was determined by the following inputs:
Financial Statements 2011 25
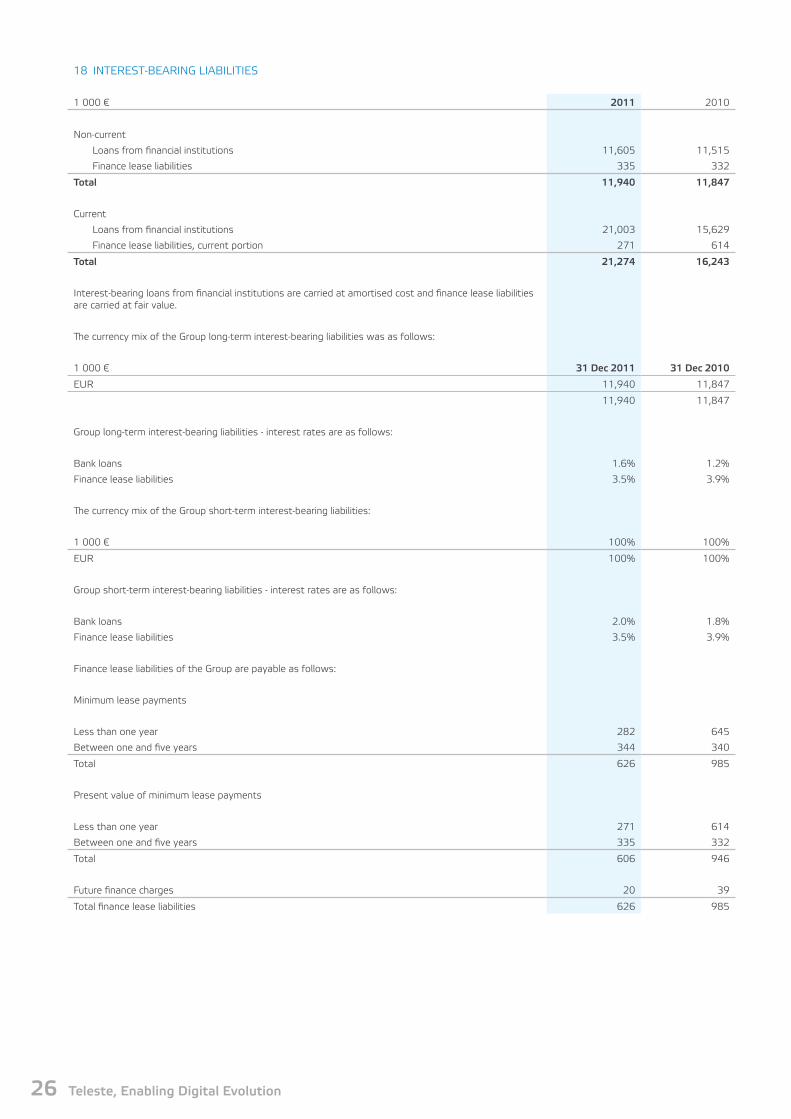
18 INteReSt-BeARING LIABILItIeS
1 000 € 2011 2010
Non-current
Loans from financial institutions 11,605 11,515
Finance lease liabilities 335 332
Total 11,940 11,847
Current
Loans from financial institutions 21,003 15,629
Finance lease liabilities, current portion 271 614
Total 21,274 16,243
Interest-bearing loans from financial institutions are carried at amortised cost and finance lease liabilities are carried at fair value.
The currency mix of the Group long-term interest-bearing liabilities was as follows:
1 000 € 31 Dec 2011 31 Dec 2010
eUR 11,940 11,847
11,940 11,847
Group long-term interest-bearing liabilities - interest rates are as follows:
Bank loans 1.6% 1.2%
Finance lease liabilities 3.5% 3.9%
The currency mix of the Group short-term interest-bearing liabilities:
1 000 € 100% 100%
eUR 100% 100%
Group short-term interest-bearing liabilities - interest rates are as follows:
Bank loans 2.0% 1.8%
Finance lease liabilities 3.5% 3.9%
Finance lease liabilities of the Group are payable as follows:
Minimum lease payments
Less than one year 282 645
Between one and five years 344 340
total 626 985
Present value of minimum lease payments
Less than one year 271 614
Between one and five years 335 332
total 606 946
Future finance charges 20 39
total finance lease liabilities 626 985
26 Teleste, Enabling Digital Evolution

NoteS to tHe CoNSoLIDAteD INCoMe StAteMeNt AND BALANCe SHeet
19 PRoVISIoNS
1 000 € Warranties Total
Balance at 1 January 2011 1,970 1,970
Provisions made during the year -154 -154
Balance at 31 December 2011 1,816 1,816
2011
Non-current 605
Current 1,211
Total 1,816
WarrantiesThe Group grants 12-36 months guarantees for its certain prod-ucts. If defects are detected during the warranty period, the Group either repairs the product or delivers a comparable new product. The amount of the warranty provision is based on the past experience on defective products and an estimate of related expenses.
20 tRADe AND otHeR CURReNt LIABILItIeS
1 000 € 2011 2010
Current
trade payables 14,043 11,048
Personnel, social security and pensions 6,116 5,465
Accrued interest expenses and other financial items 53 78
other accrued expenses and deferred income 10,577 8,717
Advances 400 748
other liabilities 4,044 4,105
Total 35,233 30,161
Non current
other liabilties 4,140 3,865
21 INCoMe tAX PAYABLe FoR tHe PeRIoD
At the end of the period there was income tax payable 1,595 thousand euro on the profit for the period (31 Dec. 2010 there was 1,240 thousand euro tax payable).
Financial Statements 2011 27

Assets and liabilities in foreign currency translated at closing rate
2011 2010
USD SeK NoK GBP PLN USD SeK NoK GBP
Current assets 964 1,043 850 2,204 2,104 770 1,596 1,450 1,275
Current liabilities 1,637 1,490 732 1,290 1,346 1,389 894 367 228
The objective of the Group’s financial risk management is to iden-tify, evaluate and hedge financial risks to reduce the impacts of price fluctuations in financial markets and of other factors on earnings, balance sheet and cash flows as well as to guarantee cost-efficient funding for the Group at all times.
The Board has approved financial risk management guidelines and the allocation of responsibilities defined in the Group risk management policy and related operating policies covering spe-cific areas. The Board oversees the Group’s risk management framework. The Group’s administration is responsible for the coordination and control of the Group’s total financial risk position and external hedging transactions with banks in the name of the parent company. teleste is risk averse in its treasury activities. The identification of the exposure is a common task of the busi-ness units and the Group administration.
The hedge accounting principles as defined in IAS 39 are applied in teleste only for hedging the interest risk for specific long term loans.
Financial risks comprise market, credit, liquidity and cash flow interest rate risk, which are discussed more in detail below. The Group’s exposure to price risk is low.
Market riskMarket risk includes three types of risk: currency risk, price risk and fair value interest rate risk. Fluctuations of foreign exchange rates, market prices or market interest rates may cause a change in the value of a financial instrument. These changes may have an effect on the consolidated earnings, balance sheet and cash flows.
Currency risktransaction riskThe Group’s currency position is divided into the transaction posi-tion and net investments in foreign operations. Foreign exchange exposures of the Group’s units arise from receivables and accounts payables denominated in foreign currency, sales and purchase contracts and from forecast sales and purchases. Major part of the Group’s sales is in euro. The most significant non-euro sales currencies are PLN (accounts for 5 per cent of the net sales), Swedish and Norwegian crowns (6 per cent) and UK pound ster-ling (2 per cent). Significant part of expenses, 67 per cent, arise in euro and in US dollar almost 30 per cent. The hedging decisions are based on the expected net cash flow for the following six months.
Cash flow hedges at 31 Dec 2011
Currency position
Currency exposure Hedge NetHedge
Instrument Hedge%
USD 2,870 2,334 535
Forward exchange contract 81
SeK 319 0 319
Forward exchange contract 0
NoK 1,493 1,158 335
Forward exchange contract 78
GBP 1,550 1,135 415
Forward exchange contract 73
Cash flow hedges at 31 Dec 2010
Currency exposure Hedge NetHedge
Instrument Hedge%
USD 1,089 1,149 60
Forward exchange contract 105
SeK 866 759 107
Forward exchange contract 88
NoK 2,025 1,487 538
Forward exchange contract 73
GBP 1,776 753 1,024
Forward exchange contract 42
Financial Risk Management
28 Teleste, Enabling Digital Evolution
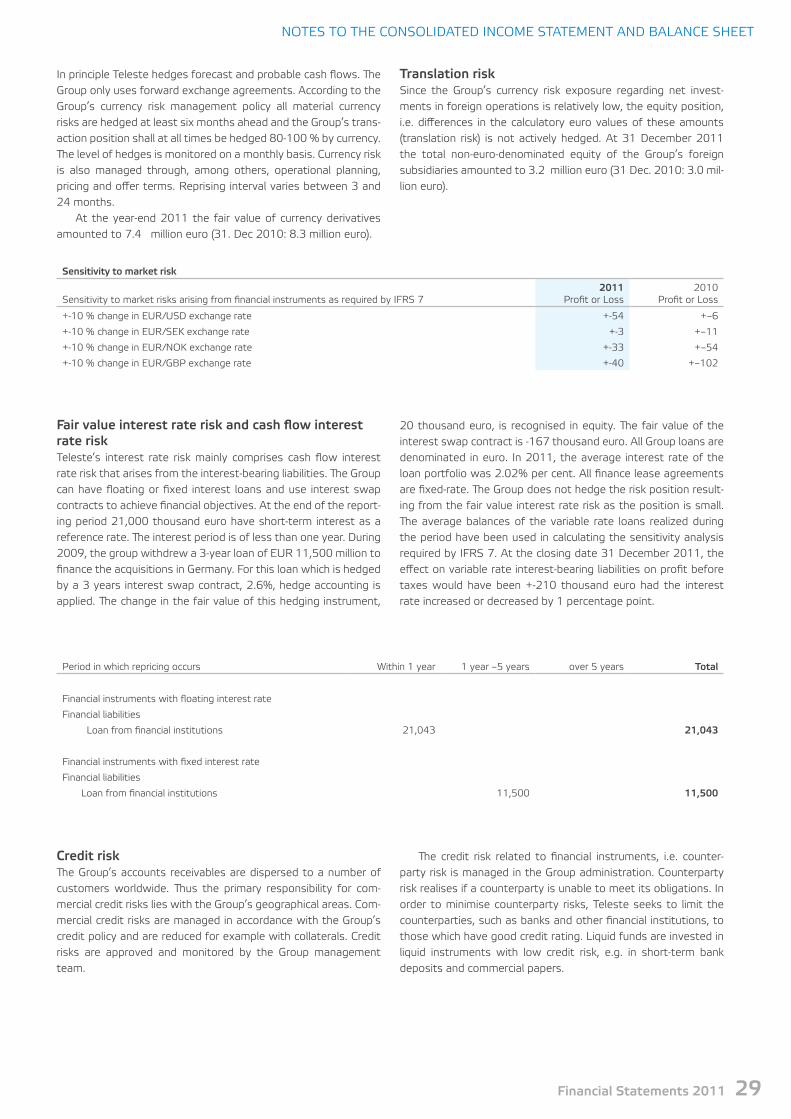
NoteS to tHe CoNSoLIDAteD INCoMe StAteMeNt AND BALANCe SHeet
In principle teleste hedges forecast and probable cash flows. The Group only uses forward exchange agreements. According to the Group’s currency risk management policy all material currency risks are hedged at least six months ahead and the Group’s trans-action position shall at all times be hedged 80-100 % by currency. The level of hedges is monitored on a monthly basis. Currency risk is also managed through, among others, operational planning, pricing and offer terms. Reprising interval varies between 3 and 24 months.
At the year-end 2011 the fair value of currency derivatives amounted to 7.4 million euro (31. Dec 2010: 8.3 million euro).
Sensitivity to market risk
Sensitivity to market risks arising from financial instruments as required by IFRS 72011
Profit or Loss2010
Profit or Loss
+-10 % change in eUR/USD exchange rate +-54 +–6
+-10 % change in eUR/SeK exchange rate +-3 +–11
+-10 % change in eUR/NoK exchange rate +-33 +–54
+-10 % change in eUR/GBP exchange rate +-40 +–102
Translation riskSince the Group’s currency risk exposure regarding net invest-ments in foreign operations is relatively low, the equity position, i.e. differences in the calculatory euro values of these amounts (translation risk) is not actively hedged. At 31 December 2011 the total non-euro-denominated equity of the Group’s foreign subsidiaries amounted to 3.2 million euro (31 Dec. 2010: 3.0 mil-lion euro).
Fair value interest rate risk and cash flow interest rate riskteleste’s interest rate risk mainly comprises cash flow interest rate risk that arises from the interest-bearing liabilities. The Group can have floating or fixed interest loans and use interest swap contracts to achieve financial objectives. At the end of the report-ing period 21,000 thousand euro have short-term interest as a reference rate. The interest period is of less than one year. During 2009, the group withdrew a 3-year loan of eUR 11,500 million to finance the acquisitions in Germany. For this loan which is hedged by a 3 years interest swap contract, 2.6%, hedge accounting is applied. The change in the fair value of this hedging instrument,
20 thousand euro, is recognised in equity. The fair value of the interest swap contract is -167 thousand euro. All Group loans are denominated in euro. In 2011, the average interest rate of the loan portfolio was 2.02% per cent. All finance lease agreements are fixed-rate. The Group does not hedge the risk position result-ing from the fair value interest rate risk as the position is small. The average balances of the variable rate loans realized during the period have been used in calculating the sensitivity analysis required by IFRS 7. At the closing date 31 December 2011, the effect on variable rate interest-bearing liabilities on profit before taxes would have been +-210 thousand euro had the interest rate increased or decreased by 1 percentage point.
Period in which repricing occurs Within 1 year 1 year –5 years over 5 years Total
Financial instruments with floating interest rate
Financial liabilities
Loan from financial institutions 21,043 21,043
Financial instruments with fixed interest rate
Financial liabilities
Loan from financial institutions 11,500 11,500
Credit riskThe Group’s accounts receivables are dispersed to a number of customers worldwide. Thus the primary responsibility for com-mercial credit risks lies with the Group’s geographical areas. Com-mercial credit risks are managed in accordance with the Group’s credit policy and are reduced for example with collaterals. Credit risks are approved and monitored by the Group management team.
The credit risk related to financial instruments, i.e. counter-party risk is managed in the Group administration. Counterparty risk realises if a counterparty is unable to meet its obligations. In order to minimise counterparty risks, teleste seeks to limit the counterparties, such as banks and other financial institutions, to those which have good credit rating. Liquid funds are invested in liquid instruments with low credit risk, e.g. in short-term bank deposits and commercial papers.
Financial Statements 2011 29
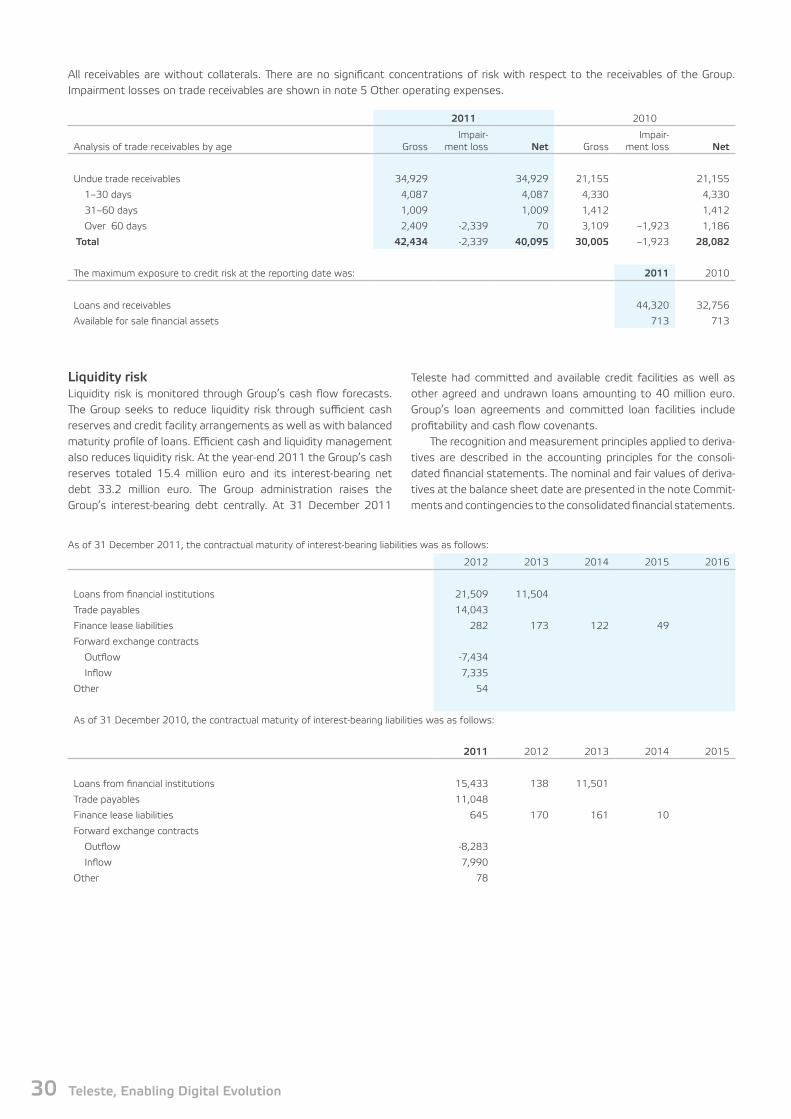
All receivables are without collaterals. There are no significant concentrations of risk with respect to the receivables of the Group. Impairment losses on trade receivables are shown in note 5 other operating expenses.
2011 2010
Analysis of trade receivables by age GrossImpair-
ment loss Net GrossImpair-
ment loss Net
Undue trade receivables 34,929 34,929 21,155 21,155
1–30 days 4,087 4,087 4,330 4,330
31–60 days 1,009 1,009 1,412 1,412
over 60 days 2,409 -2,339 70 3,109 –1,923 1,186
Total 42,434 -2,339 40,095 30,005 –1,923 28,082
The maximum exposure to credit risk at the reporting date was: 2011 2010
Loans and receivables 44,320 32,756
Available for sale financial assets 713 713
As of 31 December 2011, the contractual maturity of interest-bearing liabilities was as follows:
2012 2013 2014 2015 2016
Loans from financial institutions 21,509 11,504
trade payables 14,043
Finance lease liabilities 282 173 122 49
Forward exchange contracts
outflow -7,434
Inflow 7,335
other 54
As of 31 December 2010, the contractual maturity of interest-bearing liabilities was as follows:
2011 2012 2013 2014 2015
Loans from financial institutions 15,433 138 11,501
trade payables 11,048
Finance lease liabilities 645 170 161 10
Forward exchange contracts
outflow -8,283
Inflow 7,990
other 78
Liquidity riskLiquidity risk is monitored through Group’s cash flow forecasts. The Group seeks to reduce liquidity risk through sufficient cash reserves and credit facility arrangements as well as with balanced maturity profile of loans. efficient cash and liquidity management also reduces liquidity risk. At the year-end 2011 the Group’s cash reserves totaled 15.4 million euro and its interest-bearing net debt 33.2 million euro. The Group administration raises the Group’s interest-bearing debt centrally. At 31 December 2011
teleste had committed and available credit facilities as well as other agreed and undrawn loans amounting to 40 million euro. Group’s loan agreements and committed loan facilities include profitability and cash flow covenants.
The recognition and measurement principles applied to deriva-tives are described in the accounting principles for the consoli-dated financial statements. The nominal and fair values of deriva-tives at the balance sheet date are presented in the note Commit-ments and contingencies to the consolidated financial statements.
30 Teleste, Enabling Digital Evolution

NoteS to tHe CoNSoLIDAteD INCoMe StAteMeNt AND BALANCe SHeet
Capital risk managementThe Group’s objective when managing capital is to secure the con-tinuity of the business and to make investments possible with optimal capital structure. The capital structure of the Group is reviewed by the Board of Directors on a regular basis.
The Group monitors its capital on the basis of leverage ratio, the ratio of interest-bearing net debt to interest-bearing net debt, plus total equity. Interest-bearing net debt is calculated as bor-rowings less cash and cash equivalents. The Group’s objective to maintain the leverage less than 50%.
The leverage ratio as of 31 December 2011 and 2010 was as follows:
2011 2010
total borrowings 33,213 28,090
Cash and cash equivalents 15,404 15,203
Interest-bearing net debt 17,809 12,887
total equity 55,278 50,402
Interest-bearing net debt and total equity 73,087 63,289
Leverage ratio 24.4% 20.4%
22 FAIR VALUeS oF FINANCIAL ASSetS AND LIABILItIeS
All other financial assets and liabilities are measured at their fair values in the consolidated balance sheet except for the long-term bank loan, which is measured at amortised cost.
Derivative instrumentsteleste uses forward exchage contracts to hedge its balance sheet items against transaction risk. The changes in the fair val-ues of forward exchage contracts designated as hedging instru-ments are fully recognised through profit and loss. The fair value
changes of forward exchange contracts amounted to -99 thou-sand euro in 2011 (2010: -293 thousand euro) and they are rec-ognised as adjustements to sales. Long term bank loans are hedged by a interest swap contract. For this interest swap con-tract teleste apply hedge accounting. The fair value changes of interest swap contracts amounted to -166 thousand euro of which 20 thousand euro is entered in the total comprehensive income. The currency exchange contracts and interest swap con-tracts are in level 2.
Available-for-sale financial assetsAvailable-for-sale financial assets comprise unlisted shares that are measured at cost. They are in level 3. The fair value of these investments could not be determined reliably and the estimate fluctuates significantly or the probabilities within the range of dif-ferent estimates are not reasonably determinable to be used to estimate the fair value.
Finance lease liabilities The fair values of finance lease liabilities are based on the dis-counted future cash flows. The discount rate used is the market interest rates for homogeneous lease agreements.
Trade and other payables or receivablesFor trade payables and other receivables than those arising from derivative instruments the notional amount equals their fair value as the discounting has no material effect considering the short maturity of these items.
Following discount rates were used for determining fair value:
2011 2010
Finance lease liabilities 3.5% 3.9%
Financial Statements 2011 31

Carrying amounts of financial assets and liabilities by measurment categories
Note
Financial assets and liabilities at
fair value through income
statementLoans and
receivables
Available for sale financial
assets
Financial liabilities
measured at amortized
cost
Carrying amount by
balance sheet item Fair Value
2011 balance item
Non current financial assets
other financial assets 12 713 713 713
Current financial assets
trade and other receivables 15 40,095 40,095 40,095
Carrying amount by category 0 40,095 713 0 40,808 40,808
Non-current financial liabilities
Interest-bearing liabilities 18 335 11,605 11,940 11,940
Current financial liabilities
Interest-bearing liabilities 18 271 21,003 21,274 21,274
Forward exchange contracts 25 99 99 99
Interest swap contracts 25 166 166 166
trade and other payables 20 14,043 14,043 14,043
other current liabilities 20 54 54 54
Carrying amount by category 871 0 0 46,705 47,576 47,576
Note
Financial assets and liabilities at
fair value through income
statementLoans and
receivables
Available for sale financial
assets
Financial liabilities
measured at amortized
cost
Carrying amount by
balance sheet item Fair Value
2010 balance item
Non current financial assets
other financial assets 12 713 713 713
Current financial assets
trade and other receivables 15 28,082 28,082 28,082
Carrying amount by category 0 28,082 713 0 28,795 28,795
Non-current financial liabilities
Interest-bearing liabilities 18 332 11,515 11,847 11,847
Current financial liabilities
Interest-bearing liabilities 18 614 15,629 16,243 16,243
Forward exchange contracts 25 293 293 293
Interest swap contracts 25 256 256 256
trade and other payables 20 11,048 11,048 11,048
other current liabilities 20 78 78 78
Carrying amount by category 1,495 0 0 38,270 39,765 39,765
32 Teleste, Enabling Digital Evolution
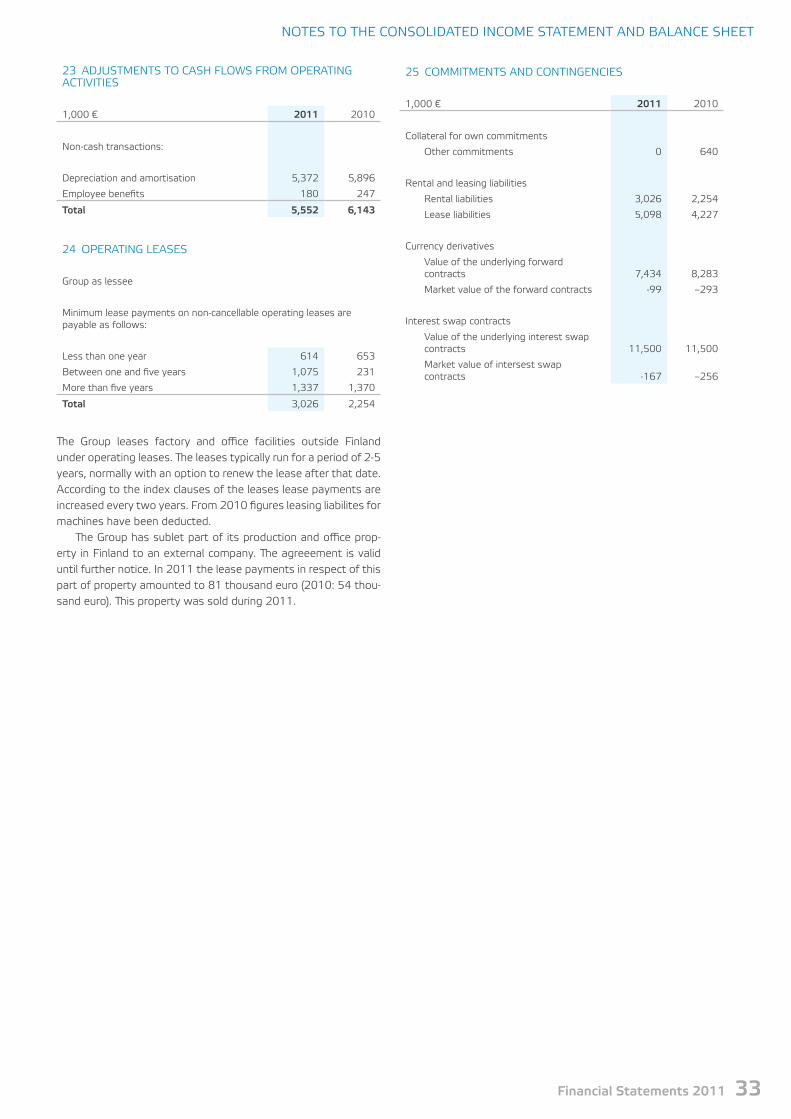
NoteS to tHe CoNSoLIDAteD INCoMe StAteMeNt AND BALANCe SHeet
23 ADJUStMeNtS to CASH FLoWS FRoM oPeRAtING ACtIVItIeS
1,000 € 2011 2010
Non-cash transactions:
Depreciation and amortisation 5,372 5,896
employee benefits 180 247
Total 5,552 6,143
24 oPeRAtING LeASeS
Group as lessee
Minimum lease payments on non-cancellable operating leases are payable as follows:
Less than one year 614 653
Between one and five years 1,075 231
More than five years 1,337 1,370
Total 3,026 2,254
The Group leases factory and office facilities outside Finland under operating leases. The leases typically run for a period of 2-5 years, normally with an option to renew the lease after that date. According to the index clauses of the leases lease payments are increased every two years. From 2010 figures leasing liabilites for machines have been deducted.
The Group has sublet part of its production and office prop-erty in Finland to an external company. The agreeement is valid until further notice. In 2011 the lease payments in respect of this part of property amounted to 81 thousand euro (2010: 54 thou-sand euro). This property was sold during 2011.
25 CoMMItMeNtS AND CoNtINGeNCIeS
1,000 € 2011 2010
Collateral for own commitments
other commitments 0 640
Rental and leasing liabilities
Rental liabilities 3,026 2,254
Lease liabilities 5,098 4,227
Currency derivatives
Value of the underlying forward contracts 7,434 8,283
Market value of the forward contracts -99 –293
Interest swap contracts
Value of the underlying interest swap contracts 11,500 11,500
Market value of intersest swap contracts -167 –256
Financial Statements 2011 33

26 ReLAteD PARtY tRANSACtIoNS
teleste Group has related party relationships with its Board members and Ceo.
Companies owned by the Group and parent company Group holding, % Group voting, %
Parent company teleste oyj, turku, Finland
Cableway Süd GmbH, Munchen, Germany 100 100
Cableway AG, Bergisch Gladbach, Germany 100 100
Cableway Nord GmbH, Bergisch Gladbach, Germany 100 100
Cableway Nord GmbH & Co. KG, Bergisch Gladbach, Germany 100 100
Cableway Cyber optic GmbH & Co. KG (former MKS Cyber optic GmbH & Co. KG), Bergisch Gladbach, Germany 100 100
Cableway Management GmbH (former MKS Management GmbH), Bergisch Gladbach, Germany 100 100
DINH techniCom S.A., Herstal, Belgium 100 100
DINH teleCom S.A., Herstal, Belgium 100 100
Flomatik A/S, Porsgrun, Norway 100 100
Flomatik Network Services Ltd, Fareham, UK 100 100
Freycom S.A., Yverdon, Switzerland 100 100
Kaavisio oy, turku, Finland 100 100
Promacom AB, Stockholm, Sweden 100 100
Satlan Sp z o.o., Wroclaw, Poland 100 100
Suomen turvakamera oy, Vantaa, Finland 100 100
teleste India Ptv. Mumbai, India 100 100
teleste Incentive oy (former Suomen Yhteisantennit oy), turku, Finland 100 100
teleste Belgium SPRL, Bryssel, Belgium 100 100
teleste d.o.o., Ljutomer, Slovenia 100 100
teleste electronics (SIP) Co., Ltd, Shuzhou, China 100 100
teleste France SAS, Paris, France 100 100
teleste GmbH, Hannover, Germany 100 100
teleste LLC, Georgetown texas, USA 100 100
teleste Services GmbH, Hildesheim, Germany 100 100
teleste Sweden AB, Stockholm, Sweden 100 100
teleste UK Ltd, Cambridge, UK 100 100
teleste Video Networks Sp z o.o., Krakov, Poland 100 100
The key management personnel compensations
1 000 € 2011 2010
Ceo
Salaries and other short-term benefits 391 499
During 2011 no options were granted to the Ceo of teleste (2010: 0 options).The terms of the management share option plans are similar to those of other employees’ share option plans, except for the terms of 2007 options. According to the 2007 option terms the recipient has to subscribe teleste shares to the amount that equals his net annual salary. At 31 December 2011 management
had 120,000 (2010: 120,000) options, of which 0 were exercis-able (2010: 0). Management of the parent company has 0,45 % or 84,791 of the parent company’s shares (2010: 0,54% or 98,482 shares). Ceo holding in the teleste Management oy stands at 34.4% and in the teleste Management II oy 31.25 %.
A voluntary pension fee for Ceo amounted 59 teur (56 teur in 2010).
34 Teleste, Enabling Digital Evolution
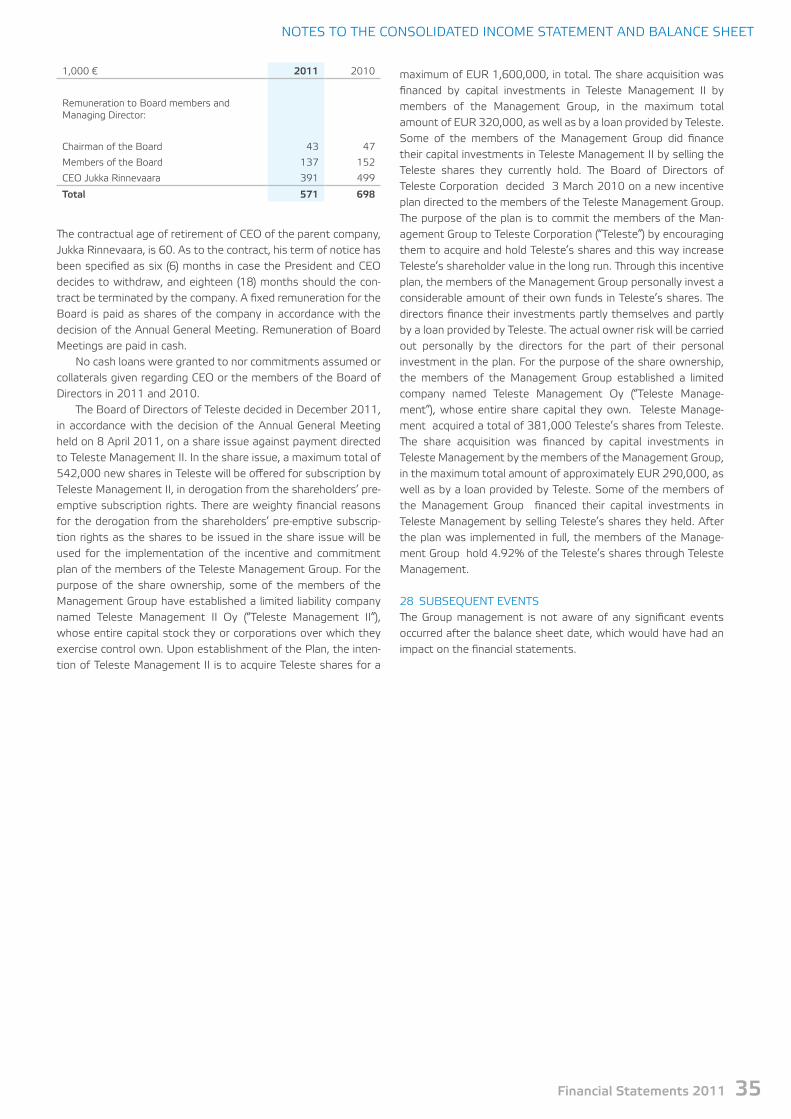
NoteS to tHe CoNSoLIDAteD INCoMe StAteMeNt AND BALANCe SHeet
1,000 € 2011 2010
Remuneration to Board members and Managing Director:
Chairman of the Board 43 47
Members of the Board 137 152
Ceo Jukka Rinnevaara 391 499
Total 571 698
The contractual age of retirement of Ceo of the parent company, Jukka Rinnevaara, is 60. As to the contract, his term of notice has been specified as six (6) months in case the President and Ceo decides to withdraw, and eighteen (18) months should the con-tract be terminated by the company. A fixed remuneration for the Board is paid as shares of the company in accordance with the decision of the Annual General Meeting. Remuneration of Board Meetings are paid in cash.
No cash loans were granted to nor commitments assumed or collaterals given regarding Ceo or the members of the Board of Directors in 2011 and 2010.
The Board of Directors of teleste decided in December 2011, in accordance with the decision of the Annual General Meeting held on 8 April 2011, on a share issue against payment directed to teleste Management II. In the share issue, a maximum total of 542,000 new shares in teleste will be offered for subscription by teleste Management II, in derogation from the shareholders’ pre-emptive subscription rights. There are weighty financial reasons for the derogation from the shareholders’ pre-emptive subscrip-tion rights as the shares to be issued in the share issue will be used for the implementation of the incentive and commitment plan of the members of the teleste Management Group. For the purpose of the share ownership, some of the members of the Management Group have established a limited liability company named teleste Management II oy (“teleste Management II”), whose entire capital stock they or corporations over which they exercise control own. Upon establishment of the Plan, the inten-tion of teleste Management II is to acquire teleste shares for a
maximum of eUR 1,600,000, in total. The share acquisition was financed by capital investments in teleste Management II by members of the Management Group, in the maximum total amount of eUR 320,000, as well as by a loan provided by teleste. Some of the members of the Management Group did finance their capital investments in teleste Management II by selling the teleste shares they currently hold. The Board of Directors of teleste Corporation decided 3 March 2010 on a new incentive plan directed to the members of the teleste Management Group. The purpose of the plan is to commit the members of the Man-agement Group to teleste Corporation (“teleste”) by encouraging them to acquire and hold teleste’s shares and this way increase teleste’s shareholder value in the long run. Through this incentive plan, the members of the Management Group personally invest a considerable amount of their own funds in teleste’s shares. The directors finance their investments partly themselves and partly by a loan provided by teleste. The actual owner risk will be carried out personally by the directors for the part of their personal investment in the plan. For the purpose of the share ownership, the members of the Management Group established a limited company named teleste Management oy (“teleste Manage-ment”), whose entire share capital they own. teleste Manage-ment acquired a total of 381,000 teleste’s shares from teleste. The share acquisition was financed by capital investments in teleste Management by the members of the Management Group, in the maximum total amount of approximately eUR 290,000, as well as by a loan provided by teleste. Some of the members of the Management Group financed their capital investments in teleste Management by selling teleste’s shares they held. After the plan was implemented in full, the members of the Manage-ment Group hold 4.92% of the teleste’s shares through teleste Management.
28 SUBSeQUeNt eVeNtSThe Group management is not aware of any significant events occurred after the balance sheet date, which would have had an impact on the financial statements.
Financial Statements 2011 35

INCoMe StAteMeNt oF PAReNt CoMPANY 1.1. - 31.12.2011
1,000 € Note 2011 2010
Net sales 1 59,115 55,451
Change in inventories of finished goods 841 817
other operating income 2 4,153 3,668
Materials, supplies and services 3 -24,870 –23,140
Wages, salaries and social expenses 4 -18,679 –18,015
Depreciation and amortisation 5 -524 –709
other operating expenses -16,251 –13,216
operating profit 3,783 4,858
Financial income and expenses 6 3,477 3,722
profit before extraordinary items 7,260 8,580
extra ordinary items 7 -290 –761
profit before taxes 6,970 7,819
Appropriations 8 311 –220
Direct taxes 9 -593 –1,414
profit for the financial period 6,688 6,185
36 Teleste, Enabling Digital Evolution

PAReNt CoMPANY FINANCIAL StAteMeNtS
BALANCe SHeet 31.12.2011
1,000 € Note 2011 2010
Non-current assets
Intangible assets 10 32 0
Property, plant and equipment 10 5,685 5,342
Long-term receivables 11 29,490 26,822
Investments 12 22,972 24,760
58,179 56,925
Current assets
Inventories 13 7,043 4,959
trade and other receivables 14 22,584 14,063
Cash and cash equivalents 15 8,201 9,841
37,829 28,863
Total assets 96,009 85,789
Shareholders’ equity
Share capital 16 6,967 6,967
Share premium 16 1,504 1,504
Invested non-restricted equity 16 5,784 4,185
Retained earnings 16 24,305 20,257
Profit for the financial period 16 6,688 6,185
45,247 39,097
Appropriations 8 411 722
provisions 17 949 949
Liabilities
Long-term liabilities 18 11,500 11,500
Short-term liabilities 17 37,901 33,521
49,401 45,021
Total equity and liabilities 96,009 85,789
Financial Statements 2011 37

CASH FLoW StAteMeNt
1,000 € 2011 2010
Cash flow from operations
operating profit 3,783 4,858
Adjustments to operating profit 524 709
Change in net working capital -11,865 -4,880
Interest income 1,394 1,128
Interest expenses -710 -648
Dividend income 4,193 2,255
Paid group contribution -290 -761
other financial items -17 236
taxes paid -952 -257
Cash flow from operations -3,939 2,639
Investments
Payment of other tangible assets -1,604 -1,064
Sale of other tangible assets 596 262
Sale of shares 93 0
Long term receivables -2,667 0
Investments in subsidiary shares 421 -3,442
Cash flow from investments -3,161 -4,244
Cash flow before financing -7,101 -1,605
Financing
Short-term liabilities 6,000 5,000
Paid dividends -2,137 -1,424
other reserves 1,280 1,160
Share issue 318 287
Financing total 5,461 5,023
Change in liquid funds -1,640 4,526
Liquid funds 1 Jan 9,841 5,315
Liquid funds 31 Dec 8,201 9,841
38 Teleste, Enabling Digital Evolution

Accounting principles
Accounting principles of Teleste Corporationteleste Corporation is the parent company of the teleste Group. Business ID of teleste Corporation is 1102267-8 with registered office in turku. The company registered address is Seponkatu 1, 20660 Littoinen.
Foreign Currency Transactionstransactions in foreign currencies are recorded at the rates of exchange prevailing on the date of the transaction. At the end of the accounting period, unsettled foreign currency balances are translated into the accounting currency at the closing rate on the balance sheet date. Foreign exchange gains and losses on trade accounts receivable and payable are adjusted to revenues and operating expenses, respectively. other foreign exchange gains and losses are recorded as financial income and expenses.
DerivativesThe company has currency forward exchange agreements. exchange agreements are designed to eliminate the effect of cur-rency exposures on the company performance and financial standing. The interest swap agreements are taken for specific long term floating interest loans to eliminate the interest risk.
our corporate hedging policy is to cover all material currency risks at least six months ahead. The effect on company perfor-mance of the exchange rate agreements is recorded on their exercise day.
Valuation of Fixed AssetsThe balance sheet values for fixed assets are stated as historical cost, less the accumulated depreciation and amortisation. Depre-ciation and amortisation is calculated on straight-line basis over the expected useful lives of the assets. estimated useful lives for various assets are:
Intangible assets 3 yearsGoodwill 10 yearsother capitalised expenditure 3 yearsBuildings 25 to 33 yearsMachinery 3 to 5 yearsComputers 0 to 3 years
Write-downs on permanent impairment of the assets are recorded when it becomes evident that the carrying amount is not recover-able.Companies acquired or established during the financial period are included in the subsidiary shares as of date of acquisition or for-mation. Companies disposed of in the financial period have been included in the subsidiary shares up to the date of disposal.Long-term investments and receivables include financial assets, which are intended to be held for over one year.
Leased AssetsPurchases made under operating leases and capital leases are entered into income statement as renting expenses.
InventoriesInventories are stated at the lower of cost or net realisable value. Acquisition cost is determined using the first-in-first-out (FIFo) method. In addition to variable expenditure, value of inventory includes their share of the fixed expenditure under purchases and manufacturing.
CashCash and cash equivalents include cash in hand and in bank. Short-term investments include other funds equivalent to cash, such as commercial papers.
Net SalesNet sales include revenue from services rendered and goods sold, adjusted for discounts granted, sales-related taxes and effects of the translation differences. Revenue is recognised when services are rendered, or when the goods are delivered to the customer.
Percentage of completion method: sales and anticipated prof-its under significant long-term engineering and construction con-tracts are recorded on a percentage-of-completion basis, using units of delivery (based on predetermined milestones) or the cost-to-cost method of accounting as the measurement basis. esti-mated contract profits are recorded in earnings in proportion to recorded sales. In the cost-to-cost method, sales and profits are recorded after considering the ratio of accumulated costs to esti-mated total costs to complete each contract. In the event that the company can be held as the main contractor of a long-term delivery contract, various product expenses, including raw materi-als and labour costs, will be accounted for in the calculation of the completion percentage. Possible changes in the anticipated total expenses or loss related to a long-term delivery contract are expensed as incurred.
Research and DevelopmentR&D expenses are recorded as revenue expenditure.
pension ArrangementsThe statutory pension liabilities of Finnish companies are funded through pension insurance.
Income TaxesIncome tax includes tax on profit for the current financial period and the accrual adjustment for the preceding financial period.
Treasury sharestreasury shares acquired by the Group are not included in bal-ance. As to this, final accounts for the year of comparison have been adjusted by eliminating the value of treasury shares from the company fixed assets and the equity. This adjustment is based on an amendment of the Finnish accounting legislation. Use of own shares are recognised in invested non-restricted equity since 3 April 2007.
Financial Statements 2011 39
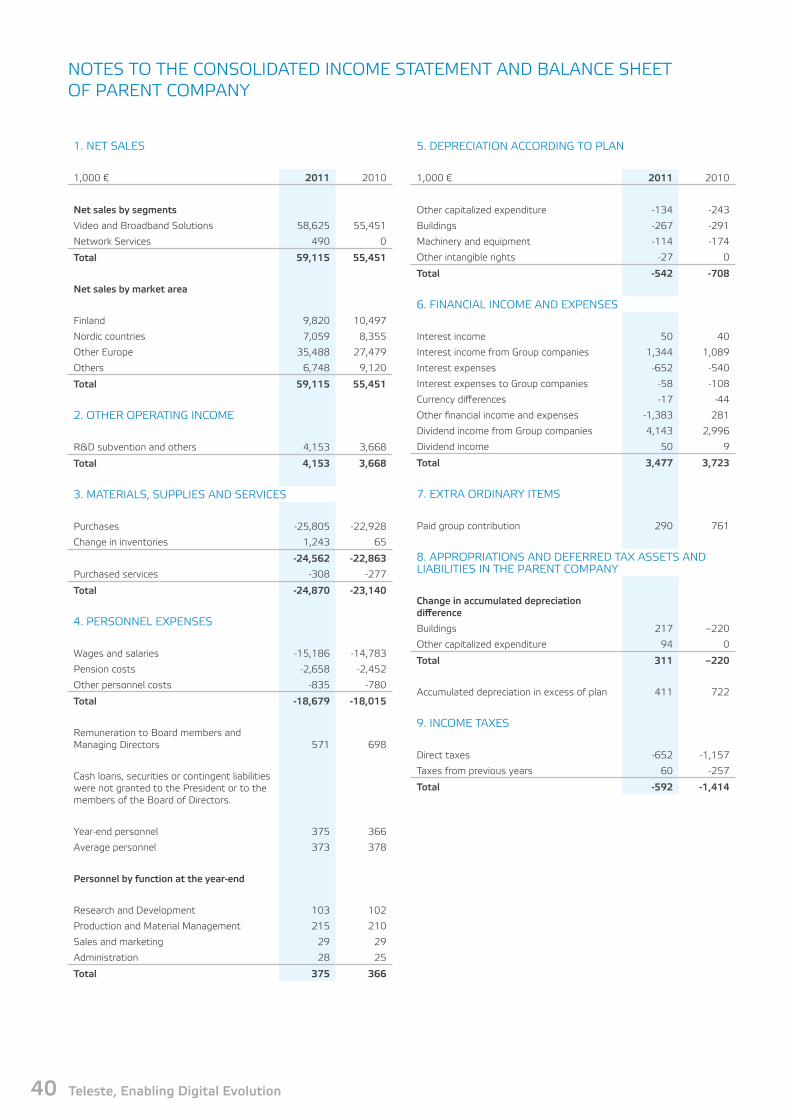
5. DePReCIAtIoN ACCoRDING to PLAN
1,000 € 2011 2010
other capitalized expenditure -134 -243
Buildings -267 -291
Machinery and equipment -114 -174
other intangible rights -27 0
Total -542 -708
6. FINANCIAL INCoMe AND eXPeNSeS
Interest income 50 40
Interest income from Group companies 1,344 1,089
Interest expenses -652 -540
Interest expenses to Group companies -58 -108
Currency differences -17 -44
other financial income and expenses -1,383 281
Dividend income from Group companies 4,143 2,996
Dividend income 50 9
Total 3,477 3,723
7. eXtRA oRDINARY IteMS
Paid group contribution 290 761
8. APPRoPRIAtIoNS AND DeFeRReD tAX ASSetS AND LIABILItIeS IN tHe PAReNt CoMPANY
Change in accumulated depreciation difference
Buildings 217 –220
other capitalized expenditure 94 0
Total 311 –220
Accumulated depreciation in excess of plan 411 722
9. INCoMe tAXeS
Direct taxes -652 -1,157
taxes from previous years 60 -257
Total -592 -1,414
1. Net SALeS
1,000 € 2011 2010
Net sales by segments
Video and Broadband Solutions 58,625 55,451
Network Services 490 0
Total 59,115 55,451
Net sales by market area
Finland 9,820 10,497
Nordic countries 7,059 8,355
other europe 35,488 27,479
others 6,748 9,120
Total 59,115 55,451
2. otHeR oPeRAtING INCoMe
R&D subvention and others 4,153 3,668
Total 4,153 3,668
3. MAteRIALS, SUPPLIeS AND SeRVICeS
Purchases -25,805 -22,928
Change in inventories 1,243 65
-24,562 -22,863
Purchased services -308 -277
Total -24,870 -23,140
4. PeRSoNNeL eXPeNSeS
Wages and salaries -15,186 -14,783
Pension costs -2,658 -2,452
other personnel costs -835 -780
Total -18,679 -18,015
Remuneration to Board members and Managing Directors 571 698
Cash loans, securities or contingent liabilities were not granted to the President or to the members of the Board of Directors.
Year-end personnel 375 366
Average personnel 373 378
personnel by function at the year-end
Research and Development 103 102
Production and Material Management 215 210
Sales and marketing 29 29
Administration 28 25
Total 375 366
NoteS to tHe CoNSoLIDAteD INCoMe StAteMeNt AND BALANCe SHeet oF PAReNt CoMPANY
40 Teleste, Enabling Digital Evolution

NoteS to tHe CoNSoLIDAteD PAReNt CoMPANY AND BALANCe SHeet
10. tANGIBLe AND INtANGIBLe ASSetS
Tangible assets
Intangible assets Land Buildings Machinery
other capital-ized expendi-
ture Total
Acquisition cost 1 Jan 7,579 86 8,233 8,751 3,713 20,783
Increases 40 0 1,065 87 324 1,476
Disposals 0 -38 -559 -772 0 -1,369
Acquisition cost 31 Dec 7,619 48 8,739 8,066 4,037 20,890
Accumulated depreciation 1 Jan 7,579 0 3,311 8,546 3,597 15,454
Cumulative depreciations on disposals 0 0 0 -764 0 -764
Depreciation 8 0 267 114 134 515
Accumulated depreciation 31 Dec 7,587 0 3,578 7,896 3,731 15,205
book value 31 Dec 2011 32 48 5,161 170 306 5,685
Book value of machinery and equipment 31 Dec 2011 139
Book value of machinery and equipment 31 Dec 2010 120
Financial Statements 2011 41

11. LoNG teRM ReCeIVABLeS
1,000 € 2011 2010
Subordinated loan from group company 165 1,200
other long term receivables from group companies 29,325 25,455
other long term receivables 0 167
Total 29,490 26,822
12. INVeStMeNtS
Shares ingroup
compa-nies
Sharesothers total
Acquisition cost 1. Jan 25,531 714 26,245
Increase 0 0 0
Acquisition cost 31. Dec 25,531 714 26,245
Accumulated depreciation 1. Jan -1,485 0 -1,485
Disposals -418 -418
Loss on disposals -1,370 0 -1,370
Accumulated depreciation 31. Dec -3,273 0 -3,273
book value 31. Dec 2011 22,258 714 22,972
13. INVeNtoRIeS
1,000 € 2011 2010
Raw materials and consumables 2,253 1,010
Work in progress 2,777 3,001
Finished goods 2,013 948
Total 7,043 4,959
14. CURReNt ASSetS
Accounts receivables 11,435 7,904
Accounts receivables from Group companies 9,737 5,111
other receivables from Group companies 0 5
other receivables 80 0
Accrued income 1,333 1,043
Total 22,584 14,063
15. LIQUID FUNDS
Cash and cash equivalents 8,201 9,841
16. CHANGeS IN SHAReHoLDeRS' eQUItY
1,000 € 2011 2010
Share capital 1 Jan 6,967 6,967
Share capital 31 Dec 6,967 6,967
Share premium fund 1 Jan 1,504 1,504
Share premium fund 31 Dec 1,504 1,504
1,000 € 2011 2010
Invested non-restricted equity 1 Jan 4,185 2,737
Share issues 1,598 1,448
Invested non-restricted equity 31 Dec 5,784 4,185
Retained earnings 1 Jan 26,441 21,681
Dividends -2,136 -1,425
Retained earnings 31 Dec 24,305 20,257
Profit for the financial period 6,688 6,185
Accumulated profit 31 Dec 30,993 26,442
Total 45,247 39,097
Companys distributable equity 31. Dec 36,775 30,626
Company’s registered share capital consists of one serie and is divided into 18,728,590 shares at 1 vote each.
17. oBLIGAtoRY PRoVISIoNS
1,000 € 2011 2010
Provision for guarantees 949 949
18. LoNG teRM LIABILItIeS
Bank Loan 11,500 11,500
19. SHoRt teRM LIABILItIeS
Bank loans 21,000 15,000
Advance payments received 299 422
Advance payments from Group companies 865 0
Accounts payables 4,152 4,099
Accounts payables from Group companies 989 999
other current liabilities 1,433 1,513
other current liabilities from Group companies 2,905 6,081
Accrued liabilities 6,259 5,408
Total 37,901 33,521
20. CoNtINGeNt LIABILItIeS AND PLeDGeD ASSetS
Leasing liabilities
For next year 606 663
For later years 1,123 542
Total 1,729 1,205
Rental liabilities 1,603 1,635
Liabilities on own behalf
Bank guarantees 0 0
Guarantees given on behalf of subsidiaries 0 0
21. CURReNCY DeRIVAteS
Value of underlying forward contracts 5,023 5,195
Market value of forward contracts -80 –277
Forward contracts are used only for hedging currency exchange risks.
42 Teleste, Enabling Digital Evolution

NoteS to tHe CoNSoLIDAteD PAReNt CoMPANY AND BALANCe SHeet
22. CoMPANIeS oWNeD BY tHe GRoUP AND PAReNt CoMPANY
Corporate’s share %
Parent company’sshare %
teleste Services GmbH, Hildesheim, Germany 100 100
Cableway Nord GmbH, Bergisch Gladbach, Germany 100 0
Cableway Nord GmbH & Co. KG, Bergisch Gladbach, Germany 100 0
Cableway Süd GmbH , Mynchen, Germany 100 0
Cableway Cyber optic GmbH&Co. KG (former MKS Cyber optic GmbH & Co. KG), Bergisch Gladbach, Germany 100 0
Cableway Management GmbH (former MKS Management GmbH), Bergisch Gladbach, Germany 100 0
Cableway AG, Bergisch Gladbach, Germany 100 12,5
teleste Belgium SPRL, Bryssel, Belgium 100 100
Dinh techniCom S.A., Herstal, Belgium 100 0
Dinh teleCom S.A., Herstal, Belgium 100 1
Flomatik A/S, Porsgrun, Norway 100 100
Flomatik Network Services Ltd. Fareham,UK 100 100
Freycom S.A. Yverdon, Switzerland 100 100
Kaavisio oy, turku, Finland 100 100
Promacom AB, tukholma, Sweden 100 100
Satlan Sp z o.o., Wroclaw, Poland 100 100
Suomen turvakamera oy, Vantaa, Finland 100 100
teleste India Ptv. Mumbai, India 100 100
teleste Incentive oy, turku, Finland 100 100
teleste d.o.o., Ljutomer, Slovenia 100 100
teleste electronics (SIP), Shuzhou, China 100 100
teleste France SAS, Paris, France 100 100
teleste GmbH, Hannover, Germany 100 100
teleste LLC, Georgetown texas, USA 100 100
teleste Sweden AB, tukholma, Sweden 100 100
teleste UK Ltd, Cambridge, UK 100 100
teleste Video Networks Sp z o.o., Krakov, Poland 100 100
23. oWN SHAReSNumber
of shares
Nominal value euros
Percentage of share capital and votes
teleste oyj owns own shares 31. Dec 2011 0 0 0
24. SHAReS AND oWNeRS
Management interest
Number of sharesPercentage of
sharesPercentage of
shares and votes
Ceo and Board Members 84,791 0.45 0.45
option programs
Number of shares entitled to subscribe with options
Number of sharesVotes after
exercised options
Ceo 120,000 0.61
other option holders 607,000 3.10
2007 program warrants hold by the group 113,000 0.58
Total 840,000 4.29
Audit expenses 2011 2010
Auditing assignments 48 44
tax consultancy 56 27
other assignments 8 8
Financial Statements 2011 43
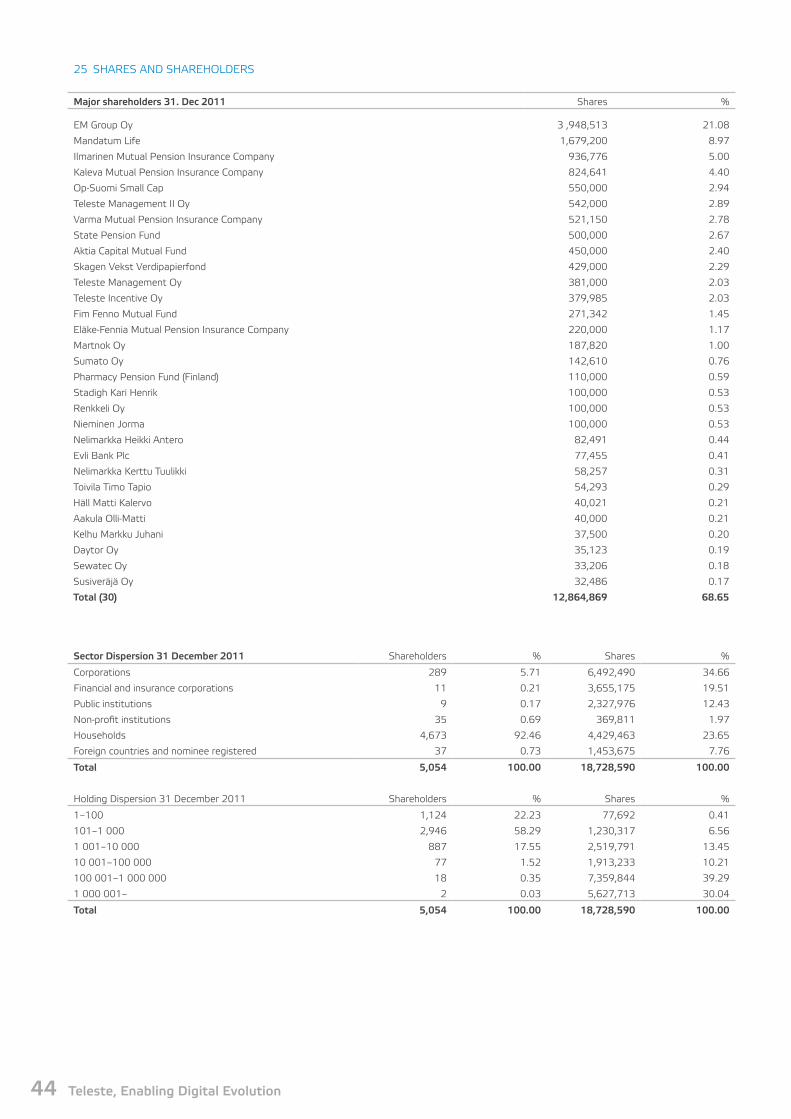
Sector Dispersion 31 December 2011 Shareholders % Shares %
Corporations 289 5.71 6,492,490 34.66
Financial and insurance corporations 11 0.21 3,655,175 19.51
Public institutions 9 0.17 2,327,976 12.43
Non-profit institutions 35 0.69 369,811 1.97
Households 4,673 92.46 4,429,463 23.65
Foreign countries and nominee registered 37 0.73 1,453,675 7.76
Total 5,054 100.00 18,728,590 100.00
Holding Dispersion 31 December 2011 Shareholders % Shares %
1–100 1,124 22.23 77,692 0.41
101–1 000 2,946 58.29 1,230,317 6.56
1 001–10 000 887 17.55 2,519,791 13.45
10 001–100 000 77 1.52 1,913,233 10.21
100 001–1 000 000 18 0.35 7,359,844 39.29
1 000 001– 2 0.03 5,627,713 30.04
Total 5,054 100.00 18,728,590 100.00
25 SHAReS AND SHAReHoLDeRS
Major shareholders 31. Dec 2011 Shares %
eM Group oy 3 ,948,513 21.08
Mandatum Life 1,679,200 8.97
Ilmarinen Mutual Pension Insurance Company 936,776 5.00
Kaleva Mutual Pension Insurance Company 824,641 4.40
op-Suomi Small Cap 550,000 2.94
teleste Management II oy 542,000 2.89
Varma Mutual Pension Insurance Company 521,150 2.78
State Pension Fund 500,000 2.67
Aktia Capital Mutual Fund 450,000 2.40
Skagen Vekst Verdipapierfond 429,000 2.29
teleste Management oy 381,000 2.03
teleste Incentive oy 379,985 2.03
Fim Fenno Mutual Fund 271,342 1.45
eläke-Fennia Mutual Pension Insurance Company 220,000 1.17
Martnok oy 187,820 1.00
Sumato oy 142,610 0.76
Pharmacy Pension Fund (Finland) 110,000 0.59
Stadigh Kari Henrik 100,000 0.53
Renkkeli oy 100,000 0.53
Nieminen Jorma 100,000 0.53
Nelimarkka Heikki Antero 82,491 0.44
evli Bank Plc 77,455 0.41
Nelimarkka Kerttu tuulikki 58,257 0.31
toivila timo tapio 54,293 0.29
Häll Matti Kalervo 40,021 0.21
Aakula olli-Matti 40,000 0.21
Kelhu Markku Juhani 37,500 0.20
Daytor oy 35,123 0.19
Sewatec oy 33,206 0.18
Susiveräjä oy 32,486 0.17
Total (30) 12,864,869 68.65
44 Teleste, Enabling Digital Evolution

PRoPoSAL FoR tHe DIStRIBUtIoN oF eARNINGS
board of Directors’ proposal for the Distribution of EarningsThe parent company’s distributable equity as of 31 December 2011 stood at eUR 36,775,101.54
As to the Annual General Meeting scheduled for 3 April 2012, the Board proposes that a dividend of eUR 0.14 per share be paid for the outstanding shares for the year 2011.
Helsinki 31 January 2012
teleste CorporationBoard of Directors
Marjo Miettinen Pertti ervi tero LaaksonenChairman Member Member
Pertti Raatikainen Kai telanne Petteri WalldénMember Member Member
Jukka Rinnevaara Ceo
The Auditor’s Noteour auditors report has been issued today.
Helsinki 31 January 2012
KPMG oY AB
esa KailialaAuthorised Public Accountant
Proposal for the Distribution of earnings
Financial Statements 2011 45
To the Annual General Meeting of Teleste CorporationWe have audited the accounting records, the financial state-ments, the report of the Board of Directors, and the administra-tion of teleste Corporation for the year ended 31 December 2011. The financial statements comprise the consolidated state-ment of financial position, income statement, statement of com-prehensive income, statement of changes in equity and state-ment of cash flows, and notes to the consolidated financial state-ments, as well as the parent company’s balance sheet, income statement, cash flow statement and notes to the financial state-ments.
Responsibility of the board of Directors and the president and CEoThe Board of Directors and the President and Ceo are responsi-ble for the preparation of consolidated financial statements that give a true and fair view in accordance with International Financial Reporting Standards (IFRS) as adopted by the eU, as well as for the preparation of financial statements and the report of the Board of Directors that give a true and fair view in accordance with the laws and regulations governing the preparation of the financial statements and the report of the Board of Directors in Finland. The Board of Directors is responsible for the appropriate arrangement of the control of the company’s accounts and finances, and the President and Ceo shall see to it that the accounts of the company are in compliance with the law and that its financial affairs have been arranged in a reliable manner.
Auditor’s Responsibilityour responsibility is to express an opinion on the financial state-ments, on the consolidated financial statements and on the report of the Board of Directors based on our audit. The Auditing Act requires that we comply with the requirements of profes-sional ethics. We conducted our audit in accordance with good auditing practice in Finland. Good auditing practice requires that we plan and perform the audit to obtain reasonable assurance about whether the financial statements and the report of the Board of Directors are free from material misstatement, and whether the members of the Board of Directors of the parent company or the President and Ceo are guilty of an act or negli-gence which may result in liability in damages towards the com-pany or have violated the Limited Liability Companies Act or the articles of association of the company.
An audit involves performing procedures to obtain audit evi-dence about the amounts and disclosures in the financial state-ments and the report of the Board of Directors. The procedures selected depend on the auditor’s judgment, including the assess-ment of the risks of material misstatement, whether due to fraud or error. In making those risk assessments, the auditor considers internal control relevant to the entity’s preparation of financial statements and report of the Board of Directors that give a true and fair view in order to design audit procedures that are appro-priate in the circumstances, but not for the purpose of expressing an opinion on the effectiveness of the company’s internal control.
Auditor’s report
An audit also includes evaluating the appropriateness of account-ing policies used and the reasonableness of accounting estimates made by management, as well as evaluating the overall presenta-tion of the financial statements and the report of the Board of Directors.
We believe that the audit evidence we have obtained is suffi-cient and appropriate to provide a basis for our audit opinion.
opinion on the consolidated financial statementsIn our opinion, the consolidated financial statements give a true and fair view of the financial position, financial performance, and cash flows of the group in accordance with International Financial Reporting Standards (IFRS) as adopted by the eU.
opinion on the company’s financial statements and the report of the board of DirectorsIn our opinion, the financial statements and the report of the Board of Directors give a true and fair view of both the consoli-dated and the parent company’s financial performance and finan-cial position in accordance with the laws and regulations govern-ing the preparation of the financial statements and the report of the Board of Directors in Finland. The information in the report of the Board of Directors is consistent with the information in the financial statements.
Helsinki, 31 January 2012
KPMG oY AB
esa KailialaAuthorized Public Accountant
46 Teleste, Enabling Digital Evolution
CoPPoRAte GoVeRNANCe StAteMeNt
This Corporate Governance Statement report has been drawn up on the basis of Chapter 2 Section 6 of the Securities Markets Act and of the recommendation 54 specified in the Finnish Corporate Governance Code 2010 available in the Securities Market Asso-ciation website at www.cgfinland.fi. The Corporate Governance Statement will be issued separate from the Annual Report, and the provided data is based on situation dated on 31 December 2011.
Corporate Governanceteleste Corporation aims at organizing its management in a con-sistent and functional manner. The governance is based on the Finnish Companies Act and teleste Articles of Association. teleste shares are listed on the NASDAQ oMX Helsinki oy (hereafter Stock exchange). The company abides by the Securities Markets Act, rules and regulations for the listed companies issued by the Stock exchange, including the Finnish Corporate Governance Code, and rules and regulations issued by the Financial Supervi-sory Authority. Since 1 March 2000, teleste complies with the insider guidelines issued by the Board of Directors of the Stock exchange in their valid form at any given time. These insider guidelines are complemented by teleste’s internal guidelines. The company has confirmed the set of applied values.
Annual General MeetingThe Annual General Meeting (hereafter AGM) of teleste Corpora-tion is the highest decision-making body of the company. It is held at least once a year by the end of June as specified in the Articles of Association. The AGM is held in Helsinki in the customary man-ner.
The AGM decides on any specified tasks in compliance with the Finnish Companies Act. Issues decided by the AGM include approval of the financial statement, allocation of profit shown in the balance sheet, discharge from liability of the Board of Direc-tors and the Ceo, and the election of the members of the Board of Directors and the auditor. Responsibilities of the AGM also include making amendments to the Articles of Association, deci-sion-making concerning share issues, granting of entitlements to options and other special rights, procurement and redeeming of company’s own shares and reduction of share capital. teleste Corporation’s Annual General Meeting shall be convened by the Board of Directors.
board of Directors
Rules of procedureIt is the function of teleste Corporation’s Board of Directors to carry out any administrative duties in accordance with the law, statutory regulations, Articles of Association and decisions taken by the General Meeting. The operating procedures and main duties of the Board of Directors have been specified in the Board’s Rules of Procedure. The Board shall resolve any matters of great importance in terms of scope and magnitude to the Group’s operation. The Board oversees and assesses the opera-tion of the Ceo and the Management Group. The Board decides
Corporate Governance Statement
on the criteria of the company’s compensation system and makes decisions on any other far-reaching issues related to personnel.
In line with the view adopted by the Board of teleste Corpora-tion, the proceedings of the Board will be carried out in an opti-mum way without formation of separate committees but by involving the entire Board in the so-called committee proceed-ings. The Board is also carrying out the duties of the Audit Com-mittee.
The Board shall conduct an annual evaluation of its perfor-mance and working methods. The Board of teleste Corporation has laid down rules of procedure according to which the essential duties of the Board include the following:• Provision for the company business strategy and its revision
at regular intervals,• Approval of annual budgets and supervision of their imple-
mentation,• Decisions concerning major investments and divestments,• Handling and approval of annual financial statements and
interim reports,• Appointment of the Ceo and discharging him from his duties
and specification of his responsibilities and conditions of work,
• Decisions concerning incentive and bonus systems involving management as well as personnel and presentation of any related proposals to the AGM as required,
• Annual revision of any essential risks related to the company operation and management thereof,
• Laying down the company values and policies.
Election and Term of office of the board of DirectorsAccording to the Articles of Association, the Board consisting of a minimum of three and a maximum of eight members will be elected annually at the Annual General Meeting. Members shall hold office until the end of the next Annual General Meeting. The Board shall elect Chairman of the Board from amongst its mem-bers.
In its meeting held on April 8, 2011 the AGM elected the six persons specified below to the Board of Directors of teleste Cor-poration. Marjo Miettinen was elected Chairperson by the mem-bers of the Board.• Marjo Miettinen, Chairperson, b. 1957, M.Sc. (ed.), eM Group
oy, Ceo• Pertti ervi, Member of the Board, b. 1957, B.Sc. (eng.), Inde-
pendent Consultant• tero Laaksonen, Member of the Board, b. 1946, M.Sc.
(Math.), Professional Board Member• Pertti Raatikainen, Member of the Board, b. 1956, Dr. Sc.
(technology), Vtt ICt, Director technology• Kai telanne, Member of the Board, b. 1964, M.Sc. (econ.),
Alma Media Corporation, Ceo• Petteri Walldén, Member of the Board, b. 1948, M.Sc. (eng.)
The Members of the Board are not employed by the company, and are in line with the issued Finnish recommendations indepen-dent of the company and any significant shareholders of it with
Financial Statements 2011 47

the exception of Chairperson Marjo Miettinen, who is the Ceo of eM Group oy, a significant shareholder.
In 2011, the Board of Directors of teleste Corporation had 10 meetings. The attendance of the Directors at the Board meetings was 98%. In addition to the Members of the Board the meetings were attended by the Ceo, the Deputy Ceo and concerning interim reports also the CFo and persons invited separately as required.
Remuneration for the Members of the boardThe remuneration of the Members of the Board of Directors is decided on by the Annual General Meeting. on April 8, 2011 the AGM decided that the Chairman of the Board be paid annually eUR 40,000 and each Member will receive eUR 25,000 a year. Attendance allowance, which is paid separately, stands at eUR 250 per meeting. Remuneration for the Members of the Board will be paid so that 40% of the specified annual amount will be company shares and the rest will be remitted in money. Salaries, remuneration and other benefits paid in 2011 to the Board of Directors were as follows:• Marjo Miettinen, eUR 42,500 including 3,954 teleste shares• Pertti ervi, eUR 27,500 including 2,471 teleste shares• tero Laaksonen, eUR 27,500 including 2,471 teleste shares• Pertti Raatikainen, eUR 27,500 including 2,471 teleste
shares• Kai telanne, eUR 27,500 including 2,471 teleste shares• Petteri Walldén, eUR 27,250 including 2,471 teleste shares
president and CEoThe Company’s Ceo is in charge of the Group’s business opera-tions and corporate governance in line with the law, teleste Cor-poration’s Articles of Association as well as instructions and regu-lations issued by the Board.
Detailed terms of employment of the Ceo are specified in a separate contract subject to the Board approval. Ceo is not a member of teleste’s Board of Directors. The current President and Ceo of teleste, Jukka Rinnevaara, b. 1961, M.Sc. (econ.), assumed his present responsibilities on 1 November 2002. The Ceo is assisted by the Corporate Management Group.
The Company Board of Directors decides on the salary, fees and other benefits received by the Ceo. Salary, remuneration and other benefits paid in 2011 to the Ceo of teleste Corporation totaled eUR 390,783. The contractual age of retirement of Presi-dent and Ceo Jukka Rinnevaara is 60. The insurance premium of the voluntary retirement insurance policy of the Ceo was eUR 59,016, which amount is not included in the paid salary and remu-neration. As to the contract of President and Ceo Rinnevaara, his term of notice has been specified as six (6) months in case the President and Ceo decides to withdraw, and eighteen (18) months should the contract be terminated by the company.
Management Group The teleste Corporation Management Group is chaired by the Ceo who reports to the Board of Directors. on December 31, 2011 the Group’s Management Group consisted of six members including Ceo, to whom the Management Group members report. Members of the Management Group consist of the directors of teleste’s business areas and the Group Management. Subsidiar-ies are operating as parts of the business areas.
The Management Group handles the issues that concern man-aging the company, such as issues related to strategy, budget,
interim reports and acquisitions, and prepares investments for approval by the Board of Directors. The Management Group meets once a month or at other times, when necessary.
Salary for all Members of the Management Group consists of a fixed basic salary and a results-based bonus. The amount of results-based bonus is determined by the company performance, the business area in question and other key operative objectives. The Board decides on the remuneration of the Management Group, and in December 2011 it made a decision on an executive incentive scheme (teleste Management II oy) for the Members of the teleste Management Group. For more information on this new scheme see teleste’s Annual Report 2011, see Notes sec-tion: Related party transactions.
Management Interestteleste Management oy is in possession of 381,000 teleste Cor-poration’s shares. Ceo’s holding in the teleste Management oy shares stands at 34.4% while the ownership by other members equals 65.6%.
teleste Management II oy is in possession of 542,000 teleste Corporation’s shares. Ceo’s holding in the teleste Man-agement II oy shares stands at 31.25% while the ownership by other members equals 68.75%. In addition, the Ceo was in the possession of 5,357 teleste Corporation’s shares on December 31, 2011.
Share ownership and options of the Management GroupWith the exception of the Ceo, other Members of teleste Corpo-ration’s Management Group were not in the possession of teleste Corporation’s shares on December 31, 2011.
on 31 December 2011, the Ceo was in the possession of a total of 120,000 teleste 2007 options while the other teleste Corporation’s Management Group members held 210,000 options put together.
For details related to option specifics see teleste’s Annual Report 2011, Notes section: Share-based payments. For hold-ings and stock options of the President and Ceo and the Man-agement Group see Notes section: Related party transactions.
Auditing and RevisionsThe term of office of teleste Corporation auditor expires at the closing of the first Annual General Meeting following the election. on April 8, 2011 teleste AGM selected Authorized Public Accoun-tants KPMG oy Ab for the company auditor. The Company’s Chief Auditor is esa Kailiala, KHt auditor (authorised public accountant). In addition to their statutory duties the auditors report to the teleste Corporation Board of Directors and attend the Board meeting at least once a year.
In 2011, teleste Group’s auditing expenses totaled eUR 227 000 in which the share of KPMG was eUR 191 000. More-over, auditing units of KPMG have supplied teleste Group compa-nies with other consultation worth total eUR 64 000 and other than KPMG auditors for eUR 20 000.
Insider RegisterSince 1 March 2000, teleste complies with the insider guidelines issued by the Board of Directors of NASDAQ oMX Helsinki oy in their valid form at any given time. These insider guidelines are complemented by teleste’s internal guidelines.
Membership in the teleste Corporation permanent inner circle is based on position. Thus, the group consists of Members of the
48 Teleste, Enabling Digital Evolution

Board of Directors, Ceo and the auditors. Furthermore, the extended inner register includes Members of the Management Group and the Ceo’s assistant.
Moreover, insider rules and regulations include provisions con-cerning temporary commercial activities. Project-specific insider register includes personnel who, based on their position, have access to company-related information, which upon publication may affect the value formation of the company’s share. The Ceo will assess, on a case-by-case basis, whether an issue or arrange-ment under preparation will be defined as a project.
It is recommendable for those included in the insider register to time any intended trading involving company shares and deriv-atives in such a manner that optimum information affecting the value of the shares is available in the market at the time. The permanent members of teleste Corporation’s insider register are obliged by the so-called Silent Period during which trading on company shares is banned completely for 14 days preceding pub-lication of interim reports and the financial statements. During the specified period teleste Corporation will not engage in any meetings with investors or analysts and no teleste Group repre-sentative is allowed to comment upon company results.
The company insider administration is included in the SIRe system of euroclear Finland oy.
INTERNAL SUpERVISIoN, RISK MANAGEMENT AND INTERNAL AUDITING
Internal Supervisionteleste’s internal supervision is designed to support the imple-mentation of the strategy and to ensure the achievement of the specified goals, compliance with the regulations as well as reli-ability and correctness of the conducted financial reporting. Inter-nal supervision is based on teleste’s values and corporate culture as well as on mutually supporting structures and processes on the Group and operational levels. Management of the Group and the business units monitor the internal supervision as part of their normal managerial duties while the Board evaluates and ensures its correctness and efficiency. Supported by teleste’s centralised controller function, management of the relevant busi-ness unit in both of our business units answers for the compli-ance with the internal supervision principles on every level of the unit in question.
Risk ManagementGroup risk policy with the relevant principles and objectives are subject to approval by the teleste Board of Directors. Risk man-agement is based on the specified strategic and business objec-tives of the teleste Group. Risk management aims to ensure achievement of operational goals so that essential risks affecting the business operation and posing a threat to its objectives are identified and these will be monitored and valued at all times. The risk management methods are specified and the implementation of risk prevention is attempted through the same. Moreover, any risks that for economic or other reasons are reasonable to insure, are aimed to be covered. In risk management, the regular evalua-tion of most significant risks and exercising control in a cost-effec-tive manner are emphasized. Risk management supports the business activity and generates added value, assisting decision-making and goal-setting for the management in charge of busi-ness. A part of the risk management system is monthly reporting by which the development of the orders received, turnover, order backlog, deliveries, trade receivables and cash flow is monitored
and, through the same, the profit development of the entire teleste Group.
teleste’s risk management system covers, for instance, the fol-lowing classes of risk:• strategic risks• operational risks• economic risks• interest groups risks• personnel risks• property and business interruption risks
Internal AuditingInternal auditing unit is in charge of the internal auditing of teleste Corporation and its subsidiaries. The results are reported to the appointed Member of the Board. The internal auditing evaluates business operations, any related processes, their involved risks and efficiency of the conducted supervision while making sugges-tions for developmental measures. These activities are performed in cooperation with controllers and other relevant bodies as needed. Furthermore, the internal auditing carries out any special assignments issued by the Management. The internal auditing covers all levels of the organisation. Internal auditing is reported to the teleste Corporation Board of Directors twice a year. exter-nal auditor participates in the selection of the priorities for the internal auditing and assessment of results.
Key features of the Internal Auditing and Risk Management Systems Related to the Financial Reporting processInternal supervision and risk management involved in the financial reporting process are based on the general principles of internal supervision and risk management described above. CFo answers for the systems involved in the internal supervision and risk man-agement related to the financial reporting process.
Internal supervision related to the financial reporting process has been created by describing the reporting process, surveying its relevant risks and by defining the control points on the basis of the conducted risk assessment. Results from the risk and control assessment have been reported to the Board. The entire report-ing process from the accounting by the subsidiaries to monthly, quarterly and annual reporting is covered by these controls. There are inbuilt controls in the reporting systems, or they can involve, for instance, matching, inspections conducted by the Manage-ment or specified procedures or policies. CFo is responsible for it that for each control there is a separately defined person in charge who answers for the implementation and efficiency of the control in question. Standards for the financial reporting are spec-ified in the Group Accounting Manual. Financial reports due for publishing will be processed by the Management Group and the Board prior to their publication. Correctness of the external annual financial reporting is verified by the external auditor.
CoPPoRAte GoVeRNANCe StAteMeNt
Financial Statements 2011 49

KeY FIGUReS 2007-2011
IFRS 2011 IFRS 2010 IFRS 2009 IFRS 2008 IFRS 2007
profit and loss account, balance sheet
Net sales, Meur 183.6 167.8 141.7 108.7 125.1
Change % 8.6 18.5 30.3 -13.1 22.9
Sales outside Finland, % 94.1 93.3 91.8 90.2 91.2
operating profit, Meur 9.4 7.4 2.5 5.6 13.2
% of net sales 5.1 4.4 1.8 5.2 10.5
Profit after financial items, Meur 8.8 6.7 1.4 5.1 12.7
% of net sales 4.8 4.0 1.0 4.7 10.1
Profit before taxes, Meur 8.8 6.7 1.4 5.1 12.7
% of net sales 4.8 4.0 1.0 4.7 10.1
Profit for the financial period, Meur 6.3 4.8 0.4 5.5 9.4
% of net sales 3.4 2.9 0.3 5.1 7.5
R&D expenditure, Meur 11.6 10.3 10.8 13.5 13.1
% of net sales 6.3 6.1 7.6 12.4 10.5
Gross investments, Meur 5.2 3.8 25.2 3.9 12.3
% of net sales 2.9 2.2 17.8 3.6 9.8
Interest bearing liabilities, Meur 33.2 28.1 22.8 11.0 9.5
Shareholder's equity, Meur 55.3 50.4 46.7 46.6 46.7
total assets, Meur 133.2 116.2 110.1 75.5 77.9
personnel and orders
Average personnel 1 297 1 215 1 103 702 681
order backlog at year end, Meur 21.2 17.0 33.1 24.0 21.5
orders received, Meur 188.1 167.2 151.0 118.6 118.5
Key metrics
Return on equity, % 11.9 9.9 0.9 11.8 22.2
Return on capital employed, % 11.5 10.2 3.3 10.4 27.1
equity ratio, % 41.6 43.6 43.6 61.7 60.2
Gearing, % 32.2 25.5 22.0 3.6 3.8
earnings per share, euro 0.36 0.27 0.02 0.32 0.55
earnings per share fully diluted, euro 0.36 0.27 0.02 0.32 0.52
Shareholders equity per share, euro 3.17 2.90 2.68 2.74 2.69
Teleste share
Highest price, euro 4.82 5.33 4.30 7.49 12.34
Lowest price, euro 2.50 3.64 2.25 1.90 6.47
Closing price, euro 3.00 4.41 3.72 2.24 6.71
Average price, euro 3.64 4.49 3.62 4.52 10.10
Price per earnings 8.3 16.3 154.1 7.0 12.3
Market capitalization, Meur 56.2 80.2 66.2 39.9 118.6
Stock turnover, Meur 6.2 14.2 28.5 51.1 72.4
turnover, number in millions 1.7 3.2 7.8 11.5 7.2
turnover, % of capital stock 9.1 17.4 44.0 64.6 40.5
Average number of shares 18,189,560 18,093,689 17,805,590 17,708,782 17,494,435
Number of shares at the year-end 18,728,590 18,186,590 17,805,590 17,805,590 17,671,305
Average number of shares, diluted w/o own shares 17,425,605 17,693,605 17,229,154 17,372,555 17,971,752
Number of shares at the year-end, diluted w/o own shares 17,425,605 17,693,605 17,425,605 17,039,399 17,972,785
Paid dividend, Meur *2.4 2.1 1.4 2.0 4.2
Dividend per share, euro *0.14 0.12 0.08 0.12 0.24
Dividend per net result, % 38.9 43.7 331.3 37.4 43.9
effective dividend yield, % 4.7 2.7 2.2 5.4 3.6
* The Board’s proposal to the AGM
50 Teleste, Enabling Digital Evolution
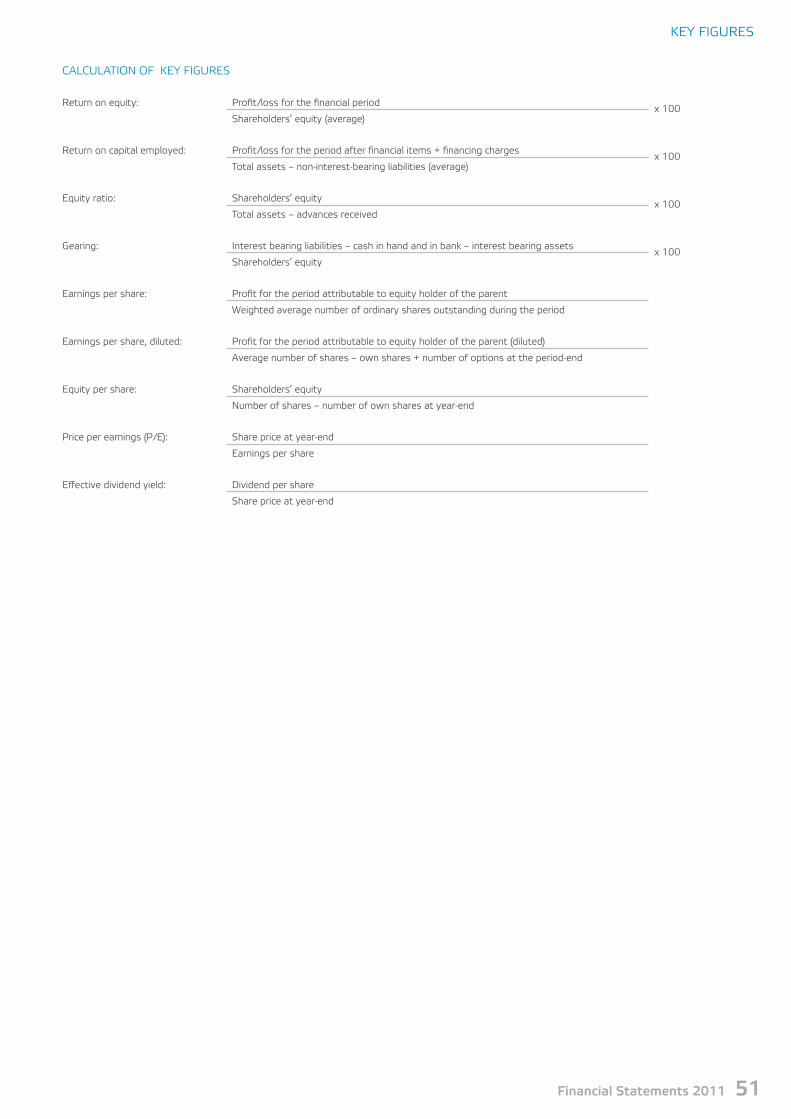
KeY FIGUReS
CALCULAtIoN oF KeY FIGUReS
Return on equity: Profit/loss for the financial periodx 100
Shareholders’ equity (average)
Return on capital employed: Profit/loss for the period after financial items + financing chargesx 100
total assets – non-interest-bearing liabilities (average)
equity ratio: Shareholders’ equityx 100
total assets – advances received
Gearing: Interest bearing liabilities – cash in hand and in bank – interest bearing assetsx 100
Shareholders’ equity
earnings per share: Profit for the period attributable to equity holder of the parent
Weighted average number of ordinary shares outstanding during the period
earnings per share, diluted: Profit for the period attributable to equity holder of the parent (diluted)
Average number of shares – own shares + number of options at the period-end
equity per share: Shareholders’ equity
Number of shares – number of own shares at year-end
Price per earnings (P/e): Share price at year-end
earnings per share
effective dividend yield: Dividend per share
Share price at year-end
Financial Statements 2011 51
Investor RelationsCeo, Mr. Jukka Rinnevaara is in charge of investor relations. In addition to the Ceo, the top management of the company is committed to serving various participants of the capital market.
objectives and principlesour communication aims at providing all the market participants with equally correct and relevant information, which supports the value formation of the company share. The principles guiding teleste’s disclosure policy include up-to-dateness, truthfulness and simultaneity. Corner stones of our regular financial communi-cations also include coherence of the released information and continuity. For all meetings, any specified information involving corporate strategy and development is based on previously pub-lished data.
teleste has formulated a Disclosure Policy, approved by the Board of Directors, which defines the principles and procedures by which teleste Corporation communicates with the capital mar-ket.
Contact Information Jukka Rinnevaara, Ceo Phone +358 2 2605 611, fax +358 2 2605 812
tiina Vuorinen, Investor Relations and Press office Phone +358 2 2605 611, fax +358 2 2605 812
email: [email protected]
Share basicsteleste Corporation is listed on the NASDAQ oMX Helsinki oy in the technology sector. In 2011, the company was included in the small cap segment. The company shares are included in the book-entry securities system.
Facts about the share:Listed on ......................................................................30. March 1999ISIN code ......................................................................FI0009007728trading code ..................................................................................tLt1VReuter’s ticker symbol ..........................................................tLt1V. HeBloomberg ticker symbol ......................................................tLt1V FH
12 months high ...............................................................................4,8212 months low ................................................................................2,50All-time high (7. Sep 2000) ......................................................... 39,00All-time low (12. Dec 2008) ..........................................................1,90
Financial InformationAnnually, teleste releases the Financial Statement bulletin, Annual Report and three Interim Reports. teleste meets inves-
tors, analysts and representatives of the media in news confer-ences set up in connection with releases of financial reports.
teleste exercises a Silent Period of two weeks preceding pub-lication of financial statements and interim reports. During these periods teleste will not participate in any meetings with investors or analysts and Group representatives are not allowed to com-ment upon company results.
Financial Releases in 2012:Interim Report, January–March ....................................26. Apr 2012Interim Report, January–June ........................................ 1. Aug 2012Interim Report, January–September .......................... 31. oct 2012Financial Statement Release ..........................................1. Feb 2013
These publications including the stock exchange releases are available in Finnish and english at the company website.
Publications can be ordered on teleste’s website or by con-tacting the company’s investor relations at [email protected], tel. +358 2 2605 611.
Moreover, you can use the online news release service on the website to subscribe to the company’s stock exchange releases and have them sent directly to your e-mail.
Changes in Shareholders’ Contact InformationThe shareholder register is maintained by euroclear Finland oy. Shareholders are kindly requested to inform the custodian of their book-entry account of any changes in contact details.
In the event euroclear Finland oy acts as the account opera-tor, any changes should be notified to the address:euroclear Finland oyPL 111000101 HelsinkiStreet address: Urho Kekkosenkatu 5 cPhone:+358 20 770 6000email: [email protected]
Analyst CoverageAccording to information available to us, analysts listed below (the list may not be exhaustive) monitor teleste’s performance on their own initiative publishing investment analyses about us. teleste takes no responsibility for the opinions expressed by ana-lysts or for any evaluations presented by them.
For analyst contact information visit our company website.
Carnegie Investment Bank Ab, Ilkka HaavistoSeB enskilda equities, Artem BeletskiHandelsbanken Capital Markets, Karri RintaDanske Markets equities, Ilkka RauvolaNordea Markets, Martti LarjoPohjola Pankki oyj, Hannu Rauhala
Shares and shareholders
52 Teleste, Enabling Digital Evolution

SHAReS AND SHAReHoLDeRS
Annual General Meetingteleste Corporation’s Annual General Meeting (AGM) will be held on tuesday, 3 April 2012, commencing at 3 p.m., in Helsinki Hall at Finlandia Hall in Helsinki, Mannerheimintie13 e. Registration and distribution of voting tickets begins at 2 p.m.
Right to participate and RegistrationShareholders registered on the list of shareholders with euroclear Finland oy on Thursday, 22 March 2012 are entitled to partici-pate in the Annual General Meeting. A shareholder whose shares have been registered on his/her personal Finnish book-entry secu-rities account has been entered into the list of company share-holders.
Shareholders wishing to attend the Annual General Meeting must sign up with the company no later than by 4 p.m. on Mon-day, 26 March 2012.
Sign up to the AGM by one of the following:by email at [email protected],by telephone +358 2 2605 611 Monday-Friday between 09:00-16:00 eet;by telefax +358 2 2605 812; orby regular mail to the address teleste Corporation, tiina Vuorinen, P.o.Box 323, FI-20101 turku, Finland.
The registration notice must be delivered before the deadline stated above. Please specify your name, person ID, address, tele-phone number and the name and person ID of assistant or repre-sentative, if any. Personal information provided by the share-holder to teleste Corporation will be used only for the AGM and the related necessary registration purposes.
Use of Representative and proxiesA shareholder is entitled to attend the AGM and exercise his/her rights at it through a representative. The appointed representa-tive of this shareholder must produce a dated proxy, or by other reliable means confirm his/her authorization for the representa-tion of the shareholder. Should a shareholder participate in the meeting by means of several authorized representatives repre-senting the shareholder with shares in different book-entry accounts, the shares by which each authorized representative represents the shareholder shall be identified in connection with the registration.
Possible powers of attorney should be delivered in originals to the address teleste Corporation, tiina Vuorinen, P.o. Box 323, FI-20101 turku, Finland by Monday, 26 March 2012 at 4 p.m. at the latest.
holder of Nominee-registered SharesThe owner of nominee-registered shares is entitled to attend the meeting by virtue of the shares pursuant to which he would be entitled to be registered with euroclear Finland oy’s shareholder register on 29 March 2012. Participation also requires that the shareholder of the relevant shares has been entered temporarily
in the shareholder register maintained by euroclear Finland oy no later than 29 March 2012 at 10:00 a.m. For nominee registered shares, this shall be deemed as registration for the meeting.
A holder of nominee-registered shares is advised to request the necessary instructions regarding temporary registration in the company’s shareholder register, the issuing of proxy documents and registration for the General Meeting from his/her custodian bank well in advance. The account management organization of the custodian bank must have the holder of a nominee-registered share who wishes to participate in the AGM to be temporarily entered in the shareholder register no later than the deadline specified above.
other InformationShareholders attending the AGM are entitled, as specified under the Companies Act section 5 paragraph 25, to put forth ques-tions regarding issues dealt with in the Meeting.
on the date of this notice of meeting, the total number of shares and votes in teleste Corporation is 18,728,590.
Dividend policyteleste wishes to be an attractive investee corporation in which the investment’s increase in value and the dividend yield form a competitive combination. The annual proposal for the dividend is validated by the Board in consideration of profitability, financial situation and needs for investment necessitated by profitable growth.
proposal for Distribution of Dividend 2011The Board of Directors proposes to the Annual General Meeting that, based on the adopted balance sheet, a dividend of eUR 0.14 per share be paid for shares other than those in company possession for the fiscal year that ended on 31 December 2011. The dividend will be paid to shareholders who on the record date, 10 April 2012, have been entered in the Company’s Shareholder List, which is kept by euroclear Finland oy. This dividend will be paid on 17 April 2012.
payment of dividend in 2012Annual General Meeting ................................................. 3. April 2012Dividend ex date ............................................................. 4. April 2012Dividend record date ....................................................10. April 2012Payment of dividend ....................................................17. April 2012
Dividend history, EUR
1999 2000 2001 2002 2003 2004 2005 2006 2007 2008 2009 2010 2011*
0.10 0.16 0.16 0.08 0.08 0.12 0.16 0.20 0.24 0.12 0.08 0.12 0.14*
* Proposal by the Board
For proposals by the Board for the General Meeting and other additional information about the AGM is available at teleste’s website: www.teleste.com/Annual General Meeting.
Minutes of the Annual General Meeting will be available at teleste’s website no later than 17 April 2012.
Financial Statements 2011 53
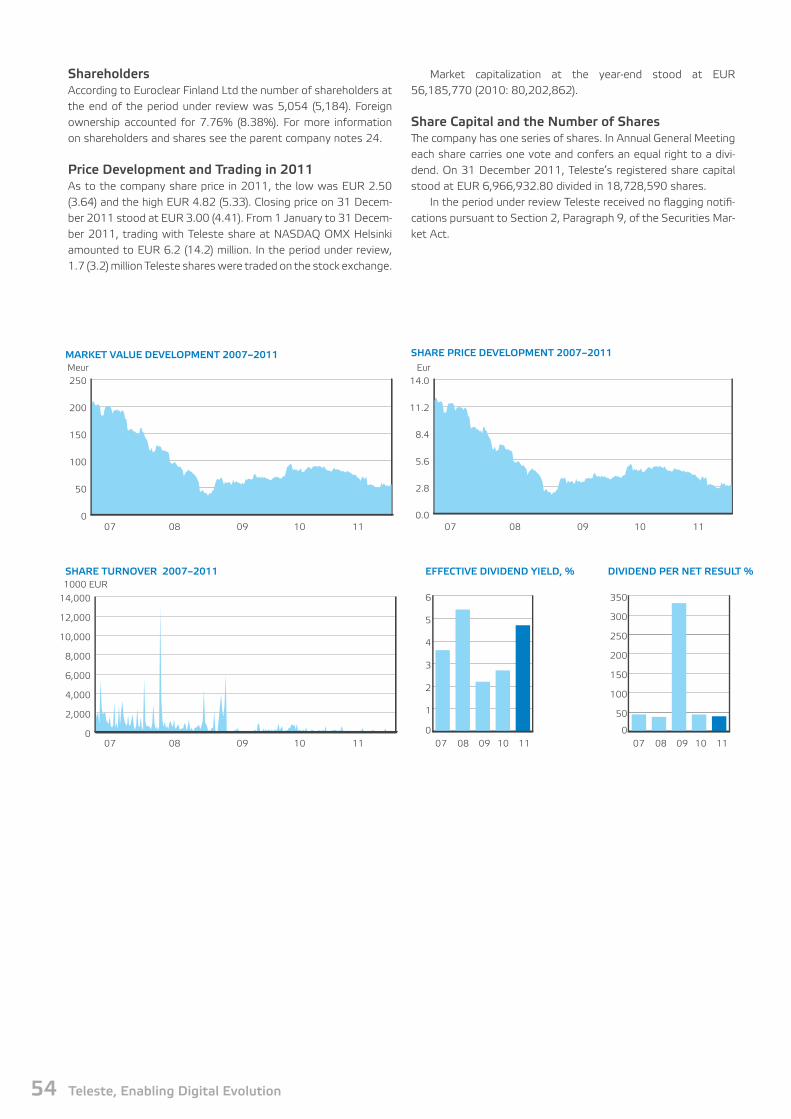
ShareholdersAccording to Euroclear Finland Ltd the number of shareholders at the end of the period under review was 5,054 (5,184). Foreign ownership accounted for 7.76% (8.38%). For more information on shareholders and shares see the parent company notes 24.
Price Development and Trading in 2011As to the company share price in 2011, the low was EUR 2.50 (3.64) and the high EUR 4.82 (5.33). Closing price on 31 Decem-ber 2011 stood at EUR 3.00 (4.41). From 1 January to 31 Decem-ber 2011, trading with Teleste share at NASDAQ OMX Helsinki amounted to EUR 6.2 (14.2) million. In the period under review, 1.7 (3.2) million Teleste shares were traded on the stock exchange.
markeT value DeveloPmenT 2007–2011
07 08 09 10 110
50
100
150
200
250
Share Price DeveloPmenT 2007–2011
Market capitalization at the year-end stood at EUR 56,185,770 (2010: 80,202,862).
Share capital and the number of SharesThe company has one series of shares. In Annual General Meeting each share carries one vote and confers an equal right to a divi-dend. On 31 December 2011, Teleste’s registered share capital stood at EUR 6,966,932.80 divided in 18,728,590 shares.
In the period under review Teleste received no flagging notifi-cations pursuant to Section 2, Paragraph 9, of the Securities Mar-ket Act.
07 08 09 10 110.0
2.8
5.6
8.4
11.2
14.0
Share Turnover 2007–2011
07 08 09 10 110
2,000
4,000
6,000
8,000
10,000
12,000
14,000
0
50
100
150
200
250
300
350
effecTive DiviDenD yielD, % DiviDenD Per neT reSulT %
0
1
2
3
4
5
6
07 08 09 10 11 07 08 09 10 11
Meur Eur
1000 EUR
54 Teleste, enabling Digital evolution
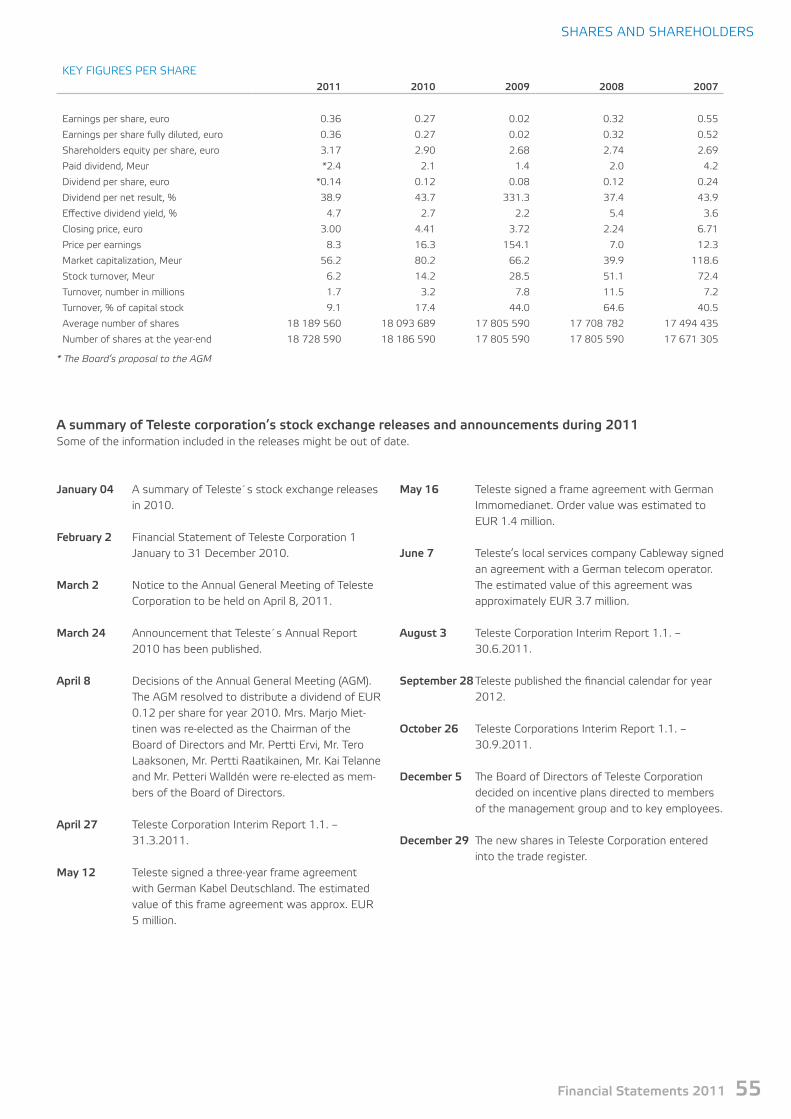
SHAReS AND SHAReHoLDeRS
DIVIDEND pER NET RESULT %
KeY FIGUReS PeR SHARe2011 2010 2009 2008 2007
earnings per share, euro 0.36 0.27 0.02 0.32 0.55
earnings per share fully diluted, euro 0.36 0.27 0.02 0.32 0.52
Shareholders equity per share, euro 3.17 2.90 2.68 2.74 2.69
Paid dividend, Meur *2.4 2.1 1.4 2.0 4.2
Dividend per share, euro *0.14 0.12 0.08 0.12 0.24
Dividend per net result, % 38.9 43.7 331.3 37.4 43.9
effective dividend yield, % 4.7 2.7 2.2 5.4 3.6
Closing price, euro 3.00 4.41 3.72 2.24 6.71
Price per earnings 8.3 16.3 154.1 7.0 12.3
Market capitalization, Meur 56.2 80.2 66.2 39.9 118.6
Stock turnover, Meur 6.2 14.2 28.5 51.1 72.4
turnover, number in millions 1.7 3.2 7.8 11.5 7.2
turnover, % of capital stock 9.1 17.4 44.0 64.6 40.5
Average number of shares 18 189 560 18 093 689 17 805 590 17 708 782 17 494 435
Number of shares at the year-end 18 728 590 18 186 590 17 805 590 17 805 590 17 671 305
* The Board’s proposal to the AGM
A summary of Teleste corporation’s stock exchange releases and announcements during 2011Some of the information included in the releases might be out of date.
May 16 teleste signed a frame agreement with German Immomedianet. order value was estimated to eUR 1.4 million.
June 7 teleste’s local services company Cableway signed an agreement with a German telecom operator. The estimated value of this agreement was approximately eUR 3.7 million.
August 3 teleste Corporation Interim Report 1.1. – 30.6.2011.
September 28 teleste published the financial calendar for year 2012.
october 26 teleste Corporations Interim Report 1.1. – 30.9.2011.
December 5 The Board of Directors of teleste Corporation decided on incentive plans directed to members of the management group and to key employees.
December 29 The new shares in teleste Corporation entered into the trade register.
January 04 A summary of teleste´s stock exchange releases in 2010.
February 2 Financial Statement of teleste Corporation 1 January to 31 December 2010.
March 2 Notice to the Annual General Meeting of teleste Corporation to be held on April 8, 2011.
March 24 Announcement that teleste´s Annual Report 2010 has been published.
April 8 Decisions of the Annual General Meeting (AGM). The AGM resolved to distribute a dividend of eUR 0.12 per share for year 2010. Mrs. Marjo Miet-tinen was re-elected as the Chairman of the Board of Directors and Mr. Pertti ervi, Mr. tero Laaksonen, Mr. Pertti Raatikainen, Mr. Kai telanne and Mr. Petteri Walldén were re-elected as mem-bers of the Board of Directors.
April 27 teleste Corporation Interim Report 1.1. – 31.3.2011.
May 12 teleste signed a three-year frame agreement with German Kabel Deutschland. The estimated value of this frame agreement was approx. eUR 5 million.
Financial Statements 2011 55

Teleste CorporationPostal address: P.o. Box 323, FI-20101 turku, FinlandVisiting address: Seponkatu 1, FI-20660 Littoinentelephone (switchboard): +358 2 2605 611telefax: +358 2 2605 812www.teleste.com
Business ID 1102267-8


