39
Telling a Story: Turning Numbers Into Information and Knowledge Jon Hall, PARIS21
| Date post: | 15-Dec-2015 |
| Category: |
Documents |
| Upload: | raven-beeching |
| View: | 215 times |
| Download: | 0 times |
Telling a Story: Turning Numbers Into Information and Knowledge
Jon Hall, PARIS21
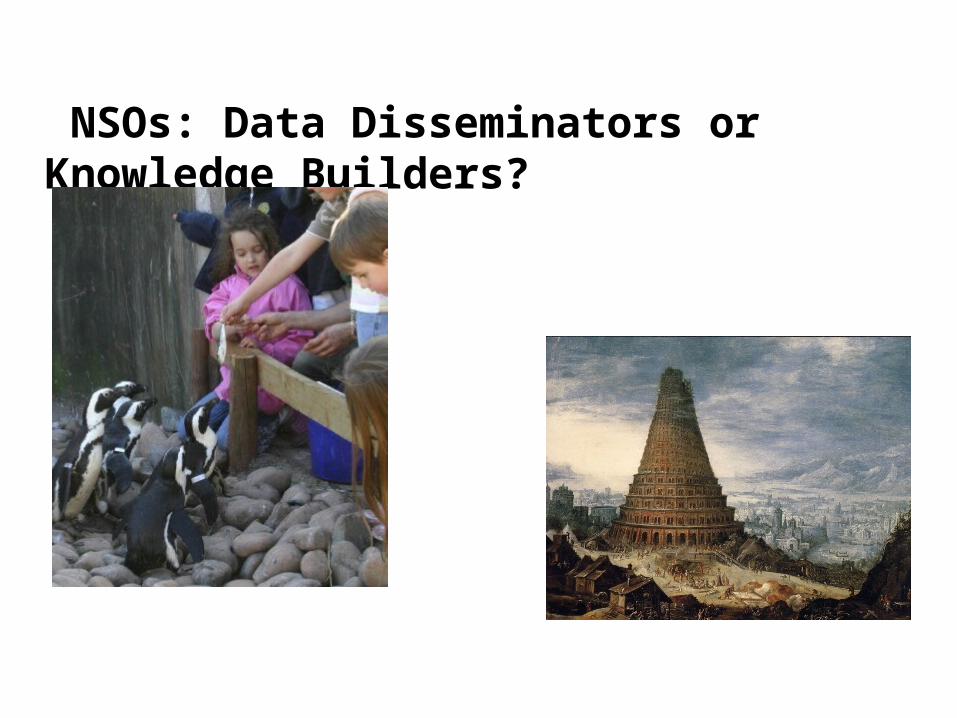
NSOs: Data Disseminators or Knowledge Builders?
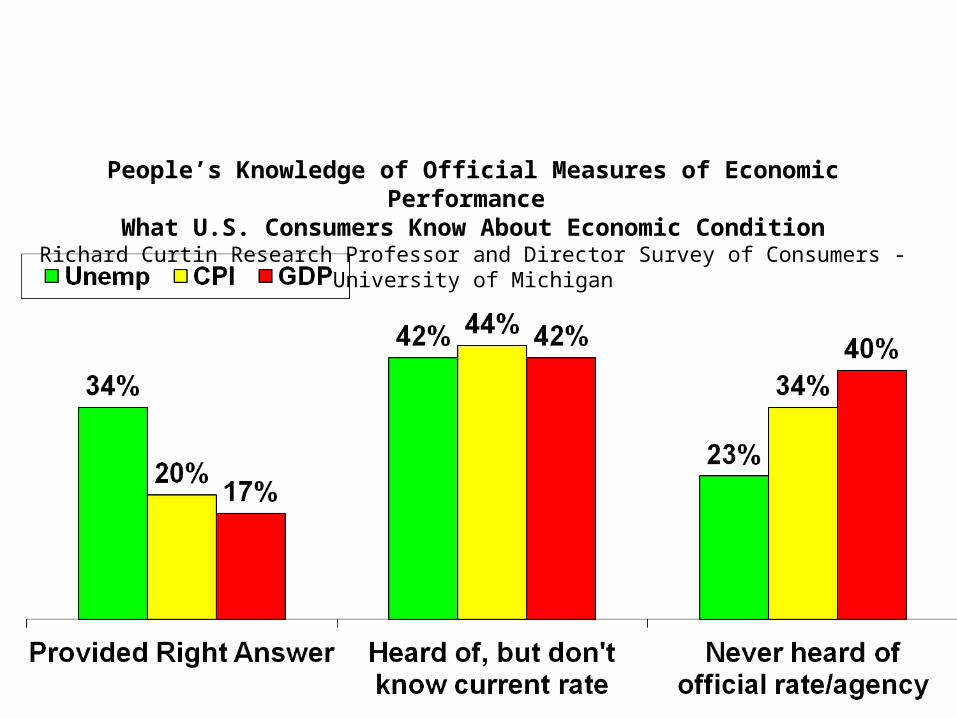
People’s Knowledge of Official Measures of Economic Performance What U.S. Consumers Know About Economic Condition
Richard Curtin Research Professor and Director Survey of Consumers - University of Michigan
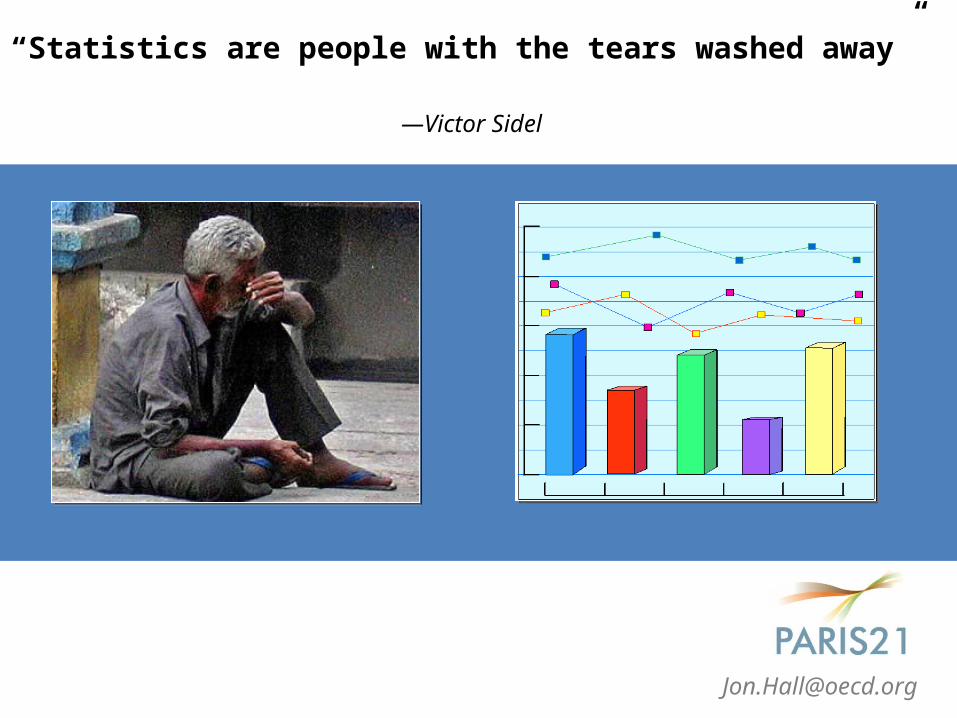
Statistics are worthless unless they are used!
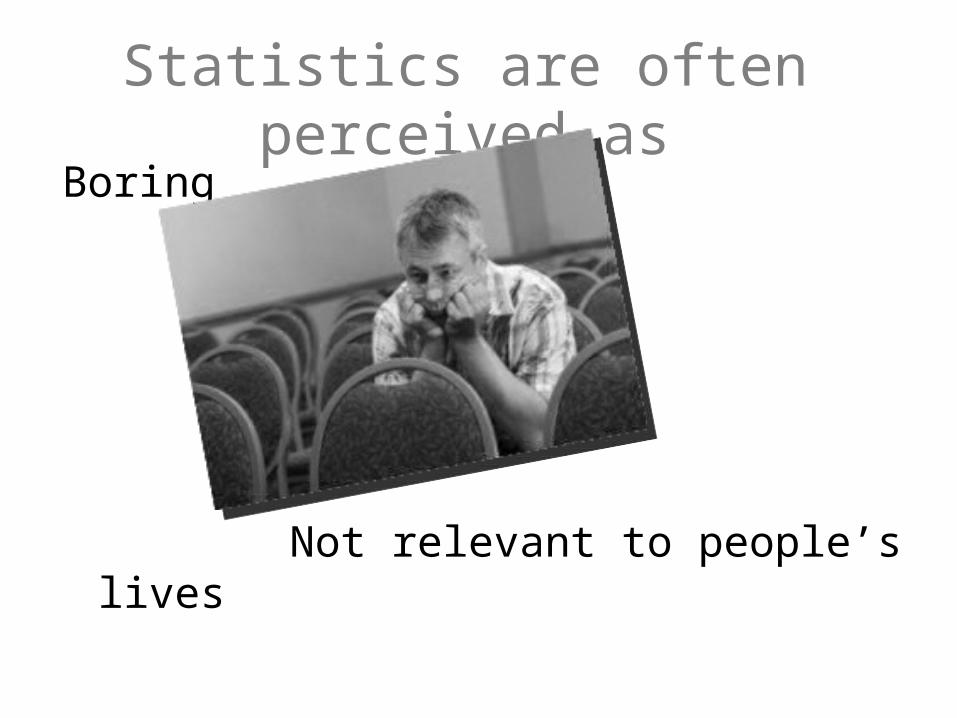
Boring
Not relevant to people’s lives
Statistics are often perceived as


The last 2 cm is the most important
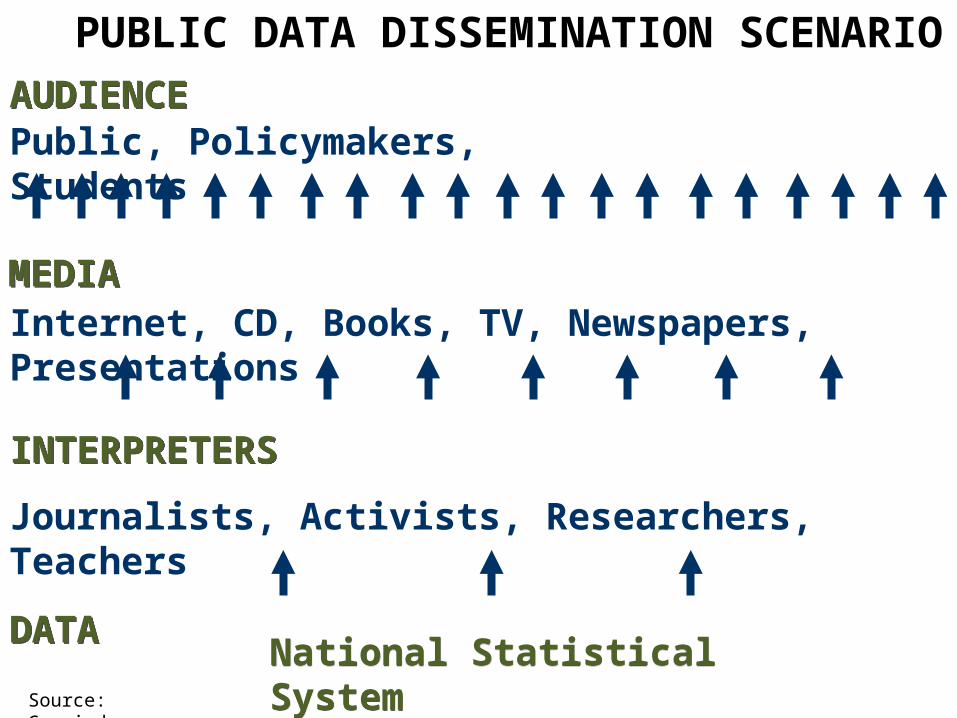
PUBLIC DATA DISSEMINATION SCENARIO
DATADATANational Statistical SystemNational Statistical System
MEDIAMEDIAInternet, CD, Books, TV, Newspapers, Presentations
INTERPRETERSINTERPRETERS
AUDIENCEAUDIENCEPublic, Policymakers, Students
Journalists, Activists, Researchers, Teachers
Source: Gapminder

DATADATA
National Statistical SystemNational Statistical System
MEDIAMEDIA
AUDIENCEAUDIENCE
INTERPRETERSINTERPRETERS
BUT THIS IS NOT THE CASE...BECAUSE...
BORINGBORING
DIFFICULTDIFFICULT
EXPENSIVEEXPENSIVE
Source: Gapminder
10
5 7445 7 9 112112 8 347 779 6,3
8 5656 2006=102006=10
135,4 9
45 + 7 12%
5 7445 7 9 112112
7687 8 2 3477 779 6,3
8 5656 2006=102006=10
135,4 9 45
+ 7 12%
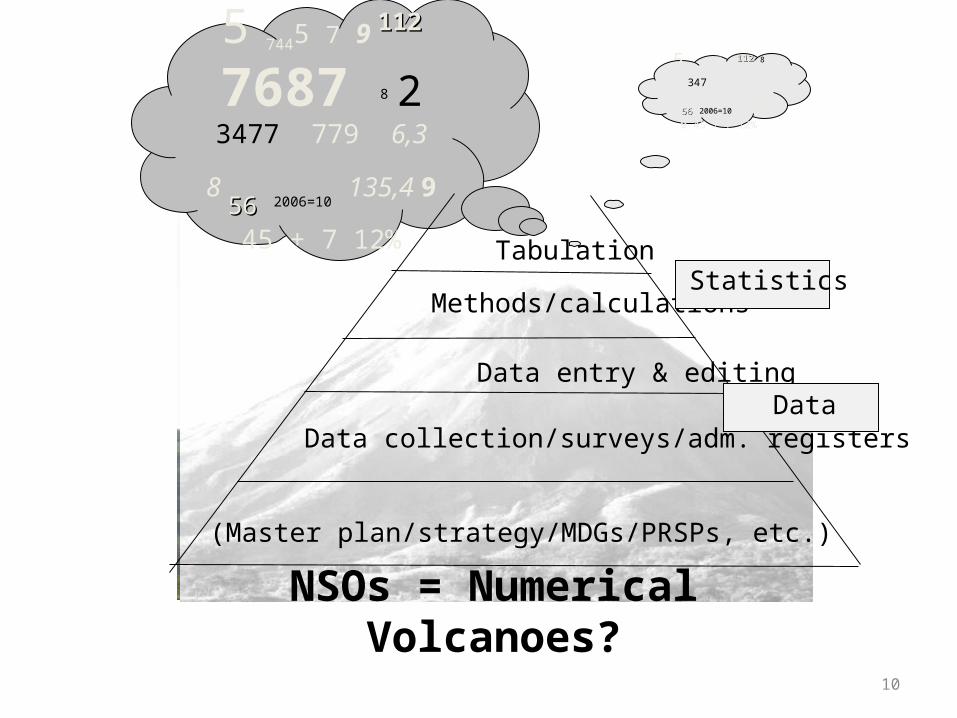
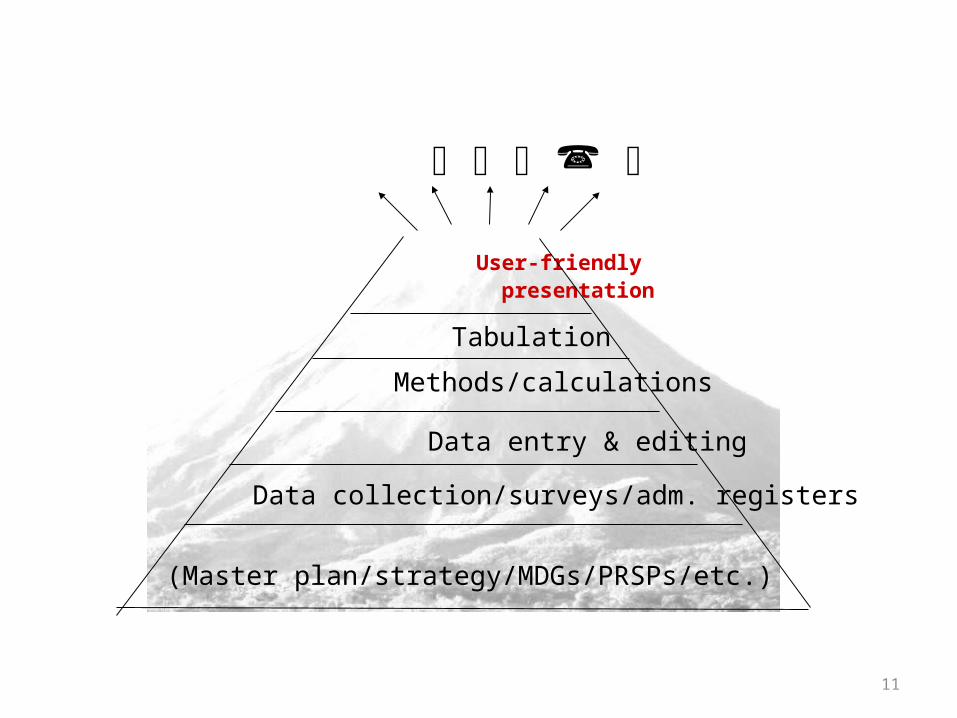
Methods/calculations
Data entry & editing
Data collection/surveys/adm. registers
(Master plan/strategy/MDGs/PRSPs, etc.)
Statistics
Data
Tabulation
NSOs = Numerical Volcanoes?
11
Methods/calculations
Data entry & editing
Data collection/surveys/adm. registers
(Master plan/strategy/MDGs/PRSPs/etc.)
User-friendly presentation
Tabulation
12
• Find the story
• Tell the story
• Spread the story
13
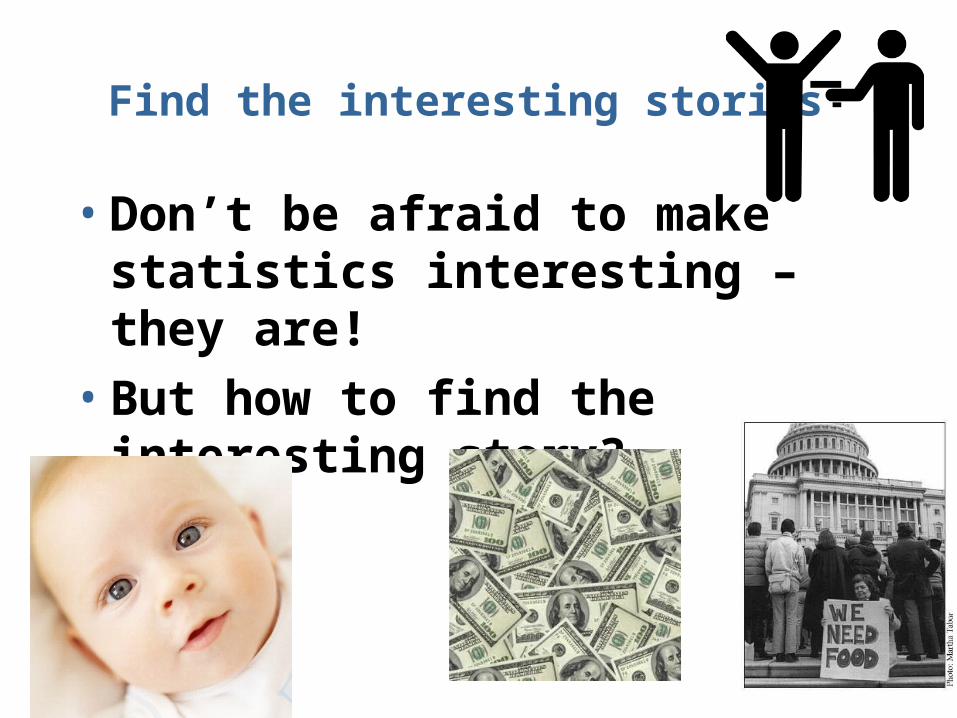
Find the interesting stories
• Don’t be afraid to make statistics interesting – they are!
• But how to find the interesting story?
14
Requires analysis…
• In a complex society, readers need to be
guided through the numerical jungle: “What do
the numbers really mean”?
• Informed users and the general public need
explanations, interpretation and comment
15
Analysis also
• Forces us to look closer at the data: concepts,
definitions, measurements, sampling, etc.
• … and provides feedback into the statistical
production process, increasing the quality of
statistics, by uncovering errors and mistakes
16
Analysis means …
• Selecting among all the possible numbers
What is… – Important?– Interesting?– New…?
• Making the figures comparable• And comparing: pointing out differences, trends and
tendencies – Over time– Between groups
17
Finding the Story• Pick an indicator and ask ….
• What is the level and the rate of change for the nation?
• How do different subgroups/regions etc differ?
• What is driving the change?
• How much change affect other aspects of life?
• How does this compare with other countries?
18
Telling the Story
• Short Simple Communication – Use Plain Language
19
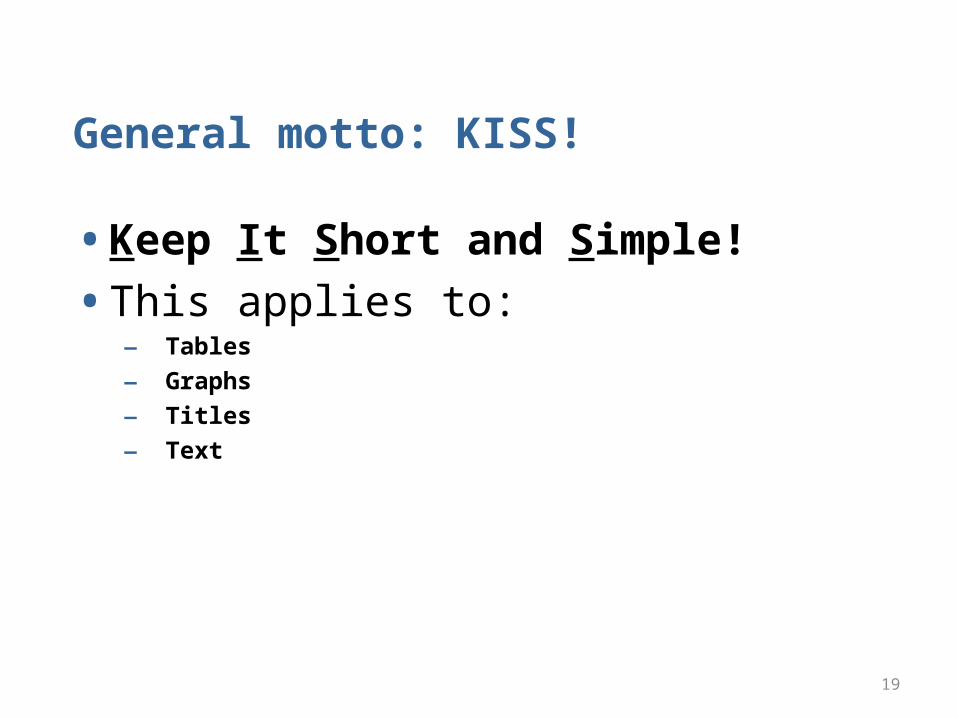
General motto: KISS!
• Keep It Short and Simple!
• This applies to:– Tables
– Graphs
– Titles
– Text
20
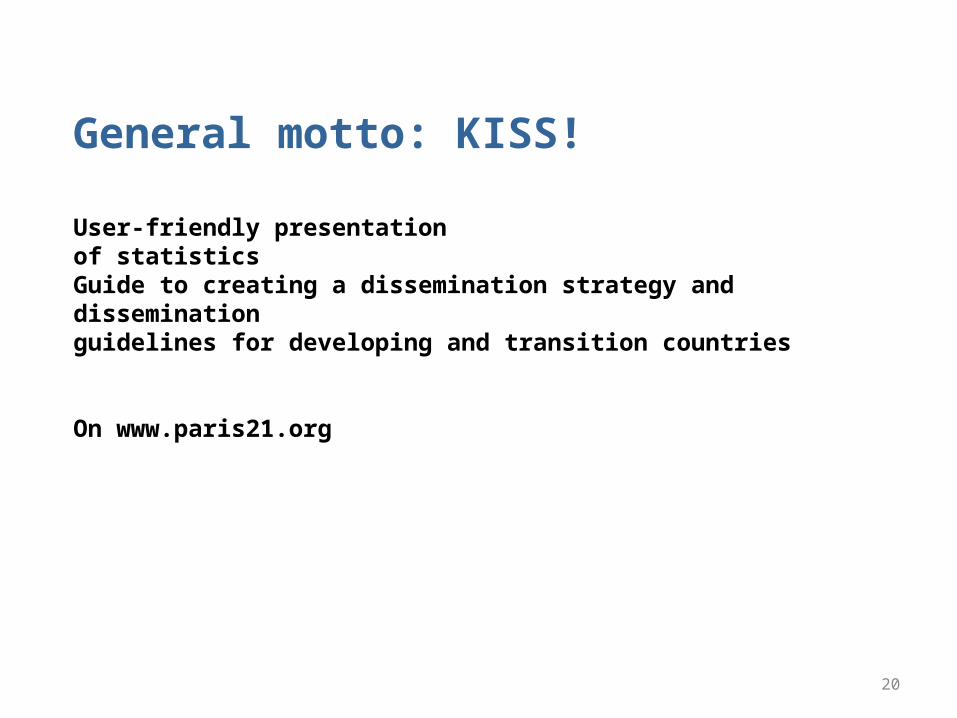
General motto: KISS!
User-friendly presentationof statisticsGuide to creating a dissemination strategy and disseminationguidelines for developing and transition countries
On www.paris21.org
21
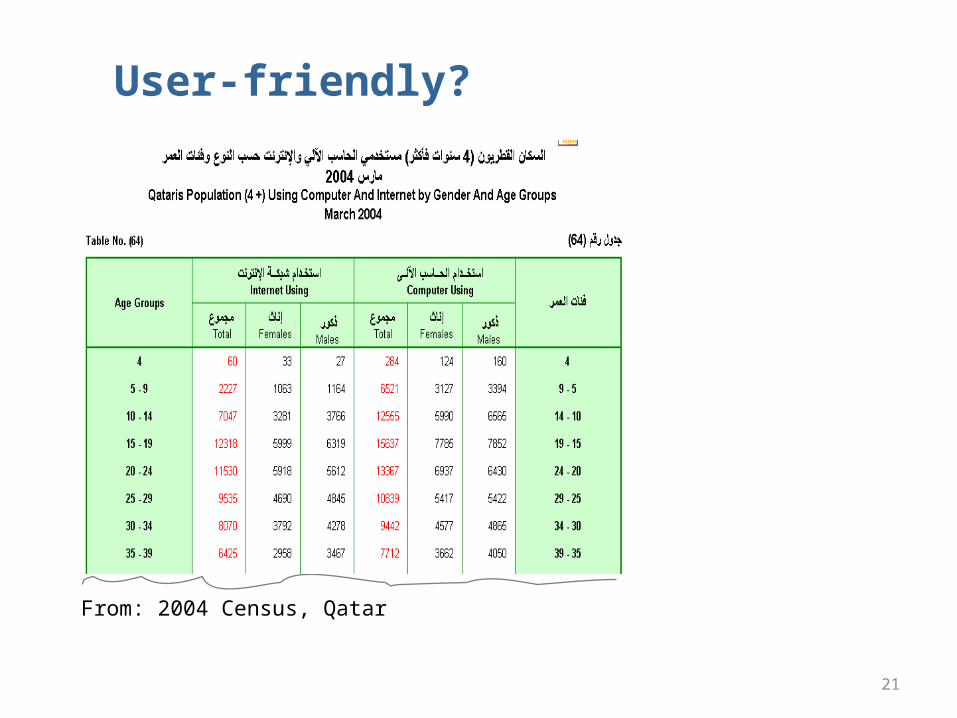
User-friendly?
From: 2004 Census, Qatar
22
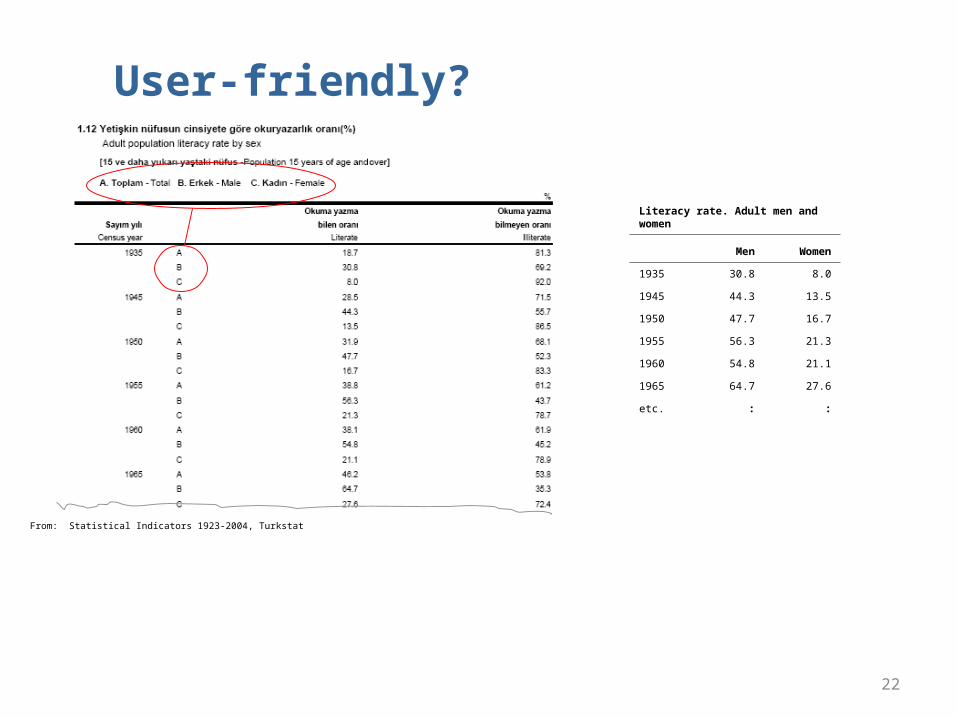
Literacy rate. Adult men and women
Men Women
1935 30.8 8.0
1945 44.3 13.5
1950 47.7 16.7
1955 56.3 21.3
1960 54.8 21.1
1965 64.7 27.6
etc. : :
From: Statistical Indicators 1923-2004, Turkstat
User-friendly?
23
General motto: KISS!
Men & Women not Males & Females
People not Persons
24
General motto: KISS!
A female born in 2010 has a life
expectancy at birth of 77.3 years
Or
In 2010 a baby girl can expect to live to
be more than 77.
25
Telling The Story
• Use new ICT tools and other techniques
Telling The Story
Ask 4 questions:
• What do we have/use traditionally to present our statistical data?
• Are all these options effectively helping us to reach our different audiences?
• What are the new possibilities in this area?• Are they better suited for our targets and will they
help improve communication on statistics?
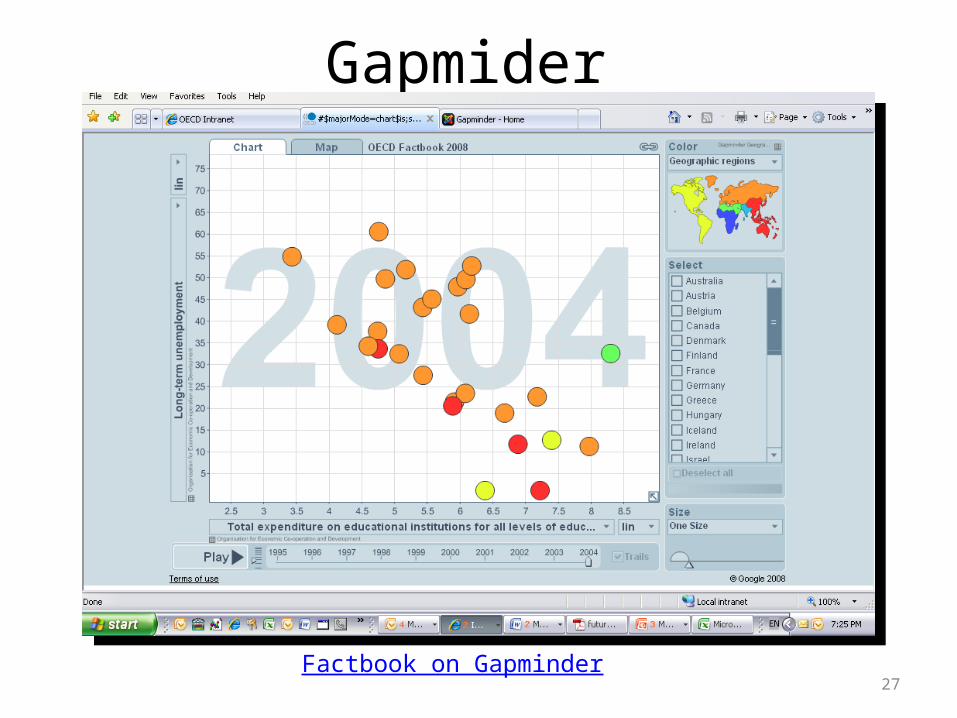
Gapmider
27Factbook on Gapminder
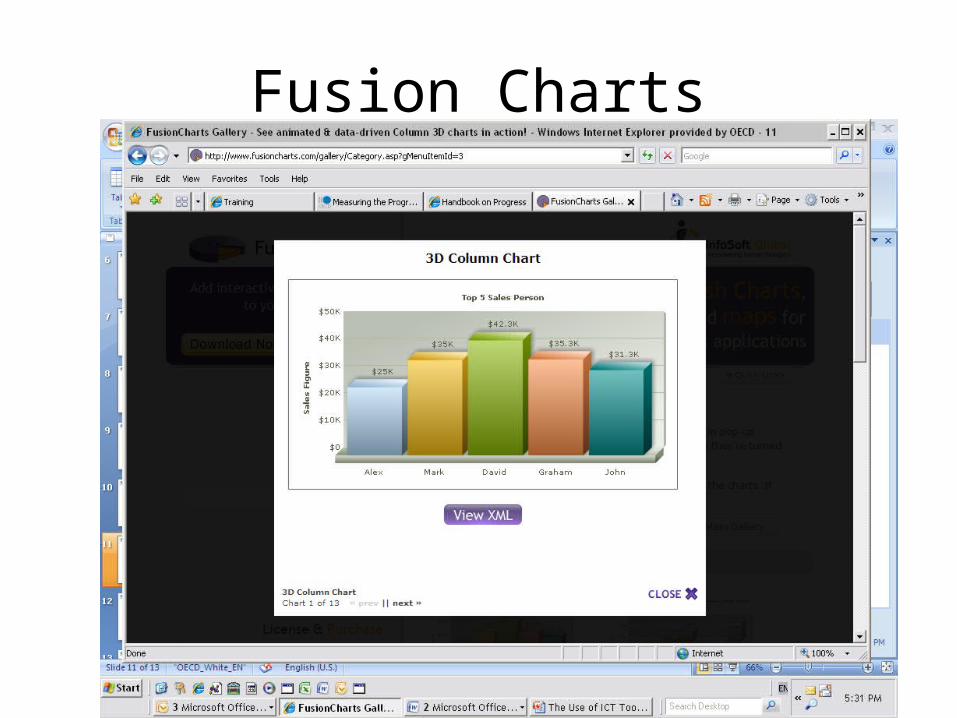
Fusion Charts
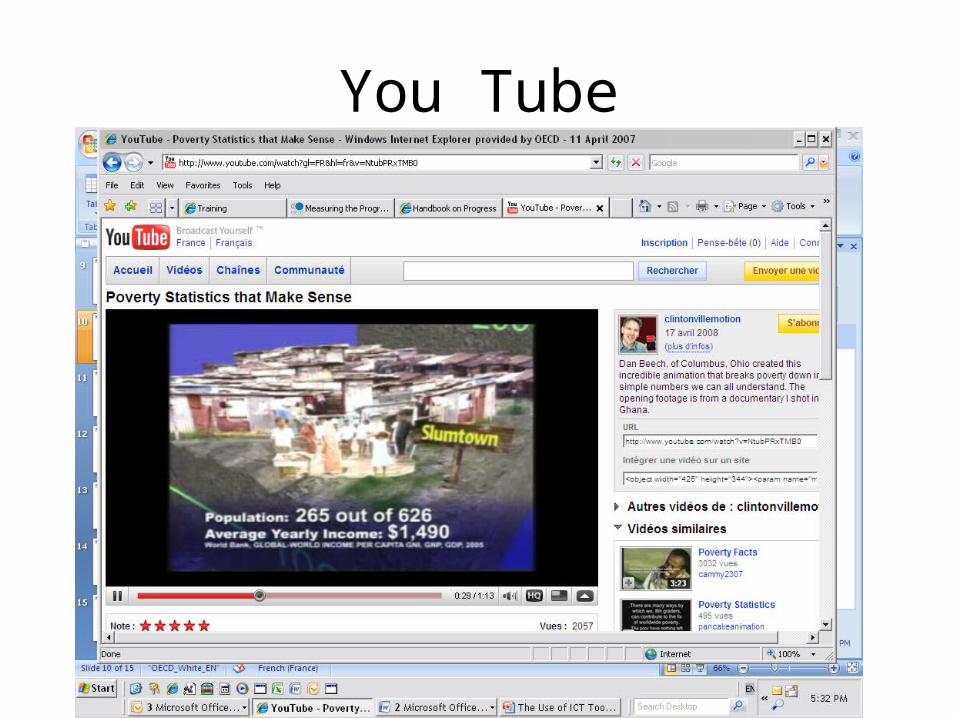
You Tube
30
Spreading the Story
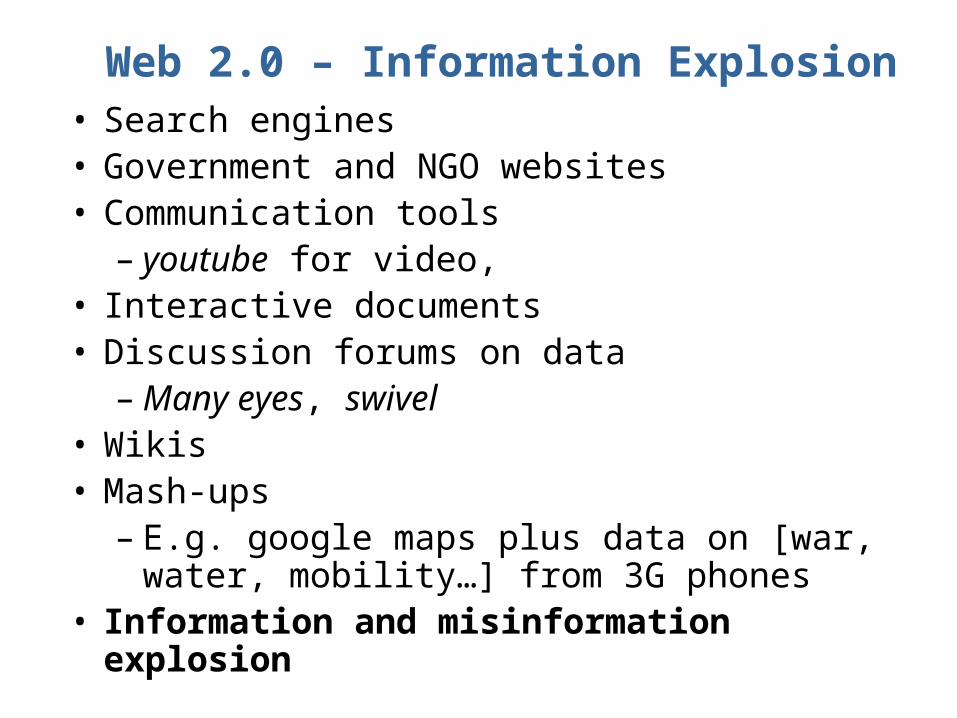
Web 2.0 – Information Explosion• Search engines• Government and NGO websites• Communication tools
– youtube for video, • Interactive documents • Discussion forums on data
– Many eyes, swivel• Wikis • Mash-ups
– E.g. google maps plus data on [war, water, mobility…] from 3G phones
• Information and misinformation explosion
32
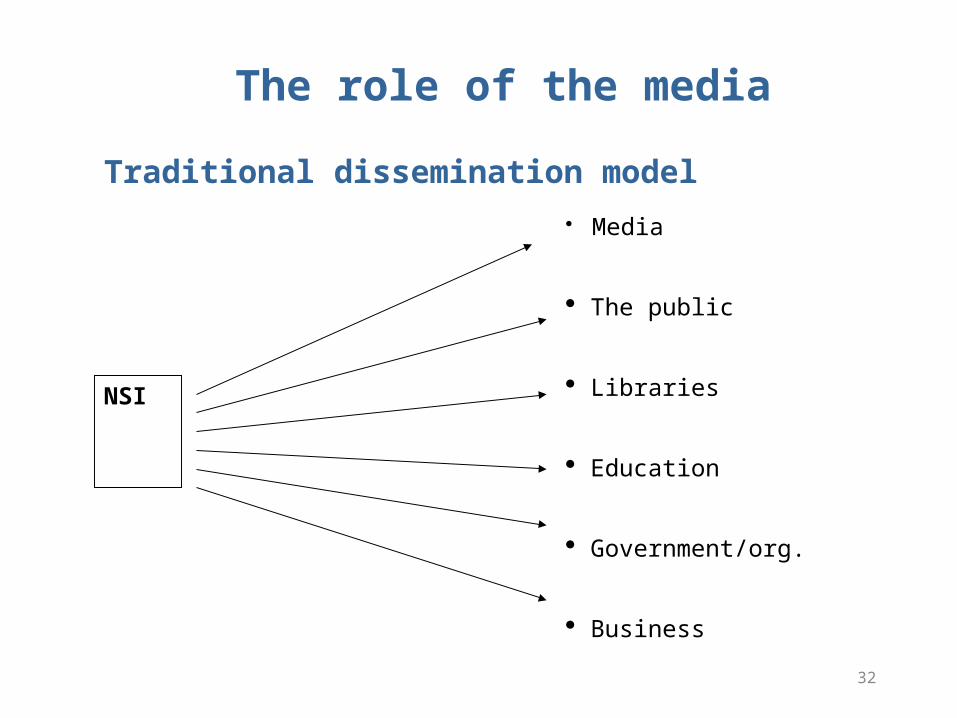
Traditional dissemination model
Media
The public
Libraries
Education
Government/org.
Business
NSI
The role of the media
33
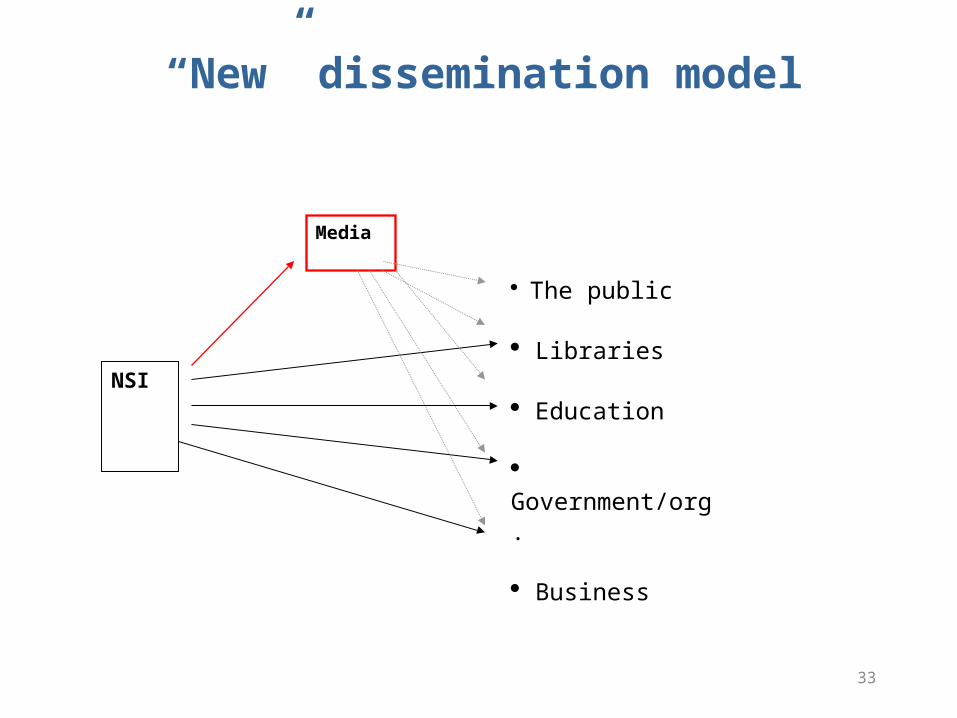
“New” dissemination model
The public
Libraries
Education
Government/org.
Business
NSI
Media
34
The media are of vital importance because:
• They represent an important channel of dissemination
• They help increase the visibility and public recognition of the NSO– And can improve the publics trust in statistics
35
Statistician and journalist: Like cat and dog?

36
We must cooperate
Journalists are our best friends …
37
Two basic rules when communicating with the media:
• Equal treatment– No pre-release access
• Establish a release calendar
38
In many NSOs dissemination is still limited, because:
• Focus on data collection and processing
• Lack of experience (and coordination)
• ”Fear of dissemination”?
• Lack of dissemination strategy and guidelines