23

TeMA Journal of Land Use, Mobility and Environment
1 - TeMA Journal of Land Use Mobility and Environment 1 (2014)
SMART CITIES CHALLENGES:SMART ENVIRONMENT
FOR SUSTAINABLE RESOURCE MANAGEMENT
1 (2014)
Published by Laboratory of Land Use Mobility and Environment DICEA - Department of Civil, Architectural and Environmental Engineering University of Naples "Federico II"
TeMA is realised by CAB - Center for Libraries at “Federico II” University of Naples using Open Journal System
Editor-in-chief: Rocco Papa print ISSN 1970-9889 | on line ISSN 1970-9870 Lycence: Cancelleria del Tribunale di Napoli, n° 6 of 29/01/2008
Editorial correspondenceLaboratory of Land Use Mobility and Environment DICEA - Department of Civil, Architectural and Environmental Engineering University of Naples "Federico II" Piazzale Tecchio, 80 80125 Naples web: www.tema.unina.it e-mail: [email protected]
TeMA Journal of Land Use, Mobility and Environment
2 - TeMA Journal of Land Use Mobility and Environment 1 (2014)
TeMA - Journal of Land Use, Mobility and Environment offers researches, applications and contributions with a unified approach toplanning and mobility and publishes original inter-disciplinary papers on the interaction of transport, land use and Environment. Domains include: engineering, planning, modeling, behavior, economics, geography, regional science, sociology, architecture anddesign, network science, and complex systems.
The Italian National Agency for the Evaluation of Universities and Research Institutes (ANVUR) classified TeMA as one of the most highly regarded scholarly journals (Category A) in the Areas ICAR 05, ICAR 20 and ICAR21. TeMA Journal has also received the Sparc Europe Seal for Open Access Journals released by Scholarly Publishing and Academic Resources Coalition (SPARC Europe) and the Directory of Open Access Journals (DOAJ). TeMA publishes online under a Creative Commons Attribution 3.0 License and is blind peer reviewed at least by two referees selected among high-profile scientists. TeMA is a four-monthly journal. TeMA has been publishedsince 2007 and is indexed in the main bibliographical databases and it is present in the catalogues of hundreds of academic andresearch libraries worldwide.
EDITOR- IN-CHIEF
Rocco Papa, Università degli Studi di Napoli Federico II, Italy
EDITORIAL ADVISORY BOARD
Luca Bertolini, Universiteit van Amsterdam, Netherlands Virgilio Bettini, Università Iuav di Venezia, Italy Dino Borri, Politecnico di Bari, Italy Enrique Calderon, Universidad Politécnica de Madrid, Spain Roberto Camagni, Politecnico di Milano, Italy Robert Leonardi, London School of Economics and Political Science, United Kingdom Raffaella Nanetti, College of Urban Planning and Public Affairs, United States Agostino Nuzzolo, Università degli Studi di Roma Tor Vergata, Italy Rocco Papa, Università degli Studi di Napoli Federico II, Italy
EDITORS
Agostino Nuzzolo, Università degli Studi di Roma Tor Vergata, Italy Enrique Calderon, Universidad Politécnica de Madrid, Spain Luca Bertolini, Universiteit van Amsterdam, Netherlands Romano Fistola, Dept. of Engineering - University of Sannio - Italy, Italy Adriana Galderisi, Università degli Studi di Napoli Federico II, Italy Carmela Gargiulo, Università degli Studi di Napoli Federico II, Italy Giuseppe Mazzeo, CNR - Istituito per gli Studi sulle Società del Mediterraneo, Italy
EDITORIAL SECRETARY
Rosaria Battarra, CNR - Istituito per gli Studi sulle Società del Mediterraneo, Italy Andrea Ceudech, TeMALab, Università degli Studi di Napoli Federico II, Italy Rosa Anna La Rocca, TeMALab, Università degli Studi di Napoli Federico II, Italy Enrica Papa, Università degli Studi di Roma Tor Vergata, Italy
ADMISTRATIVE SECRETARYStefania Gatta, Università degli Studi di Napoli Federico II, Italy

TeMA Journal of Land Use, Mobility and Environment
TeMA Journal of Land Use Mobility and Environment 1 (2014)
SMART CITIES CHALLENGES: SMART ENVIRONMENT FORSUSTAINABLE RESOURCE MANAGEMENT 1 (2014)
Contents
EDITORIALERocco Papa 3 EDITORIAL PREFACE
Rocco Papa
FOCUS FOCUS
Considering Resilience Steps Towards an Assessment Framework
James Kallaos, Gaëll Mainguy, Annemie Wyckmans5
Considering ResilienceSteps Towards an Assessment Framework James Kallaos, Gaëll Mainguy, Annemie Wyckmans
New Technologies for Sustainable Energy in the Smart City: the Wet Theory
Romano Fistola, Rosa Anna La Rocca29
New Technologies for Sustainable Energy in the Smart City: the Wet Theory Romano Fistola, Rosa Anna La Rocca
Climate Change Adaptation Challenges and Opportunities for Smart
Urban Growth Adriana Galderisi
43Climate Change Adaptation Challenges and Opportunities for Smart Urban GrowthAdriana Galderisi
Limits to Ecological-Based Planning in Zimbabwe. The Case of Harare Innocent Chirisa, Archimedes Muzenda
69Limits to Ecological-Based Planning in Zimbabwe. The Case of HarareInnocent Chirisa, Archimedes Muzenda
TeMA Journal of Land Use, Mobility and Environment
TeMA Journal of Land Use Mobility and Environment 1 (2014)
LAND USE, MOBILITY AND ENVIRONMENT
LAND USE, MOBILITY AND ENVIRONMENT
UrbanisationPatternof Incipient Mega Region in India
Ramachandra T V, Bharath H Aithal, Beas Barik83
UrbanisationPatternof Incipient Mega Region in India Ramachandra T V, Bharath H Aithal, Beas Barik
The Effectiveness of Planning Regulation to Curb Urban Sprawl
The Case of Striano (NA) Laura Russo
101The Effectiveness of Planning Regulation to Curb Urban Sprawl The Case of Striano (NA) Laura Russo
Prediction of Mymensingh Town Future Using Space Syntax
Silvia Alam 115
Prediction of Mymensingh Town Future Using Space Syntax Silvia Alam
OSSERVATORILaura Russo, Floriana Zucaro, Valentina Pinto,
Gennaro Angiello, Gerardo Carpentieri 131
REVIEW PAGES Laura Russo, Floriana Zucaro, Valentina Pinto, Gennaro Angiello, Gerardo Carpentieri
TeMA Journal of Land Use, Mobility and Environment
TeMA 1 (2014) 83-100 print ISSN 1970-9889, e- ISSN 1970-9870 DOI: 10.6092/1970-9870/2202
review paper received 28 December 2013, accepted 10 February 2014 Licensed under the Creative Commons Attribution – Non Commercial License 3.0 www.tema.unina.it
URBANISATION PATTERN OF INCIPIENT MEGA REGION
IN INDIA
ABSTRACT
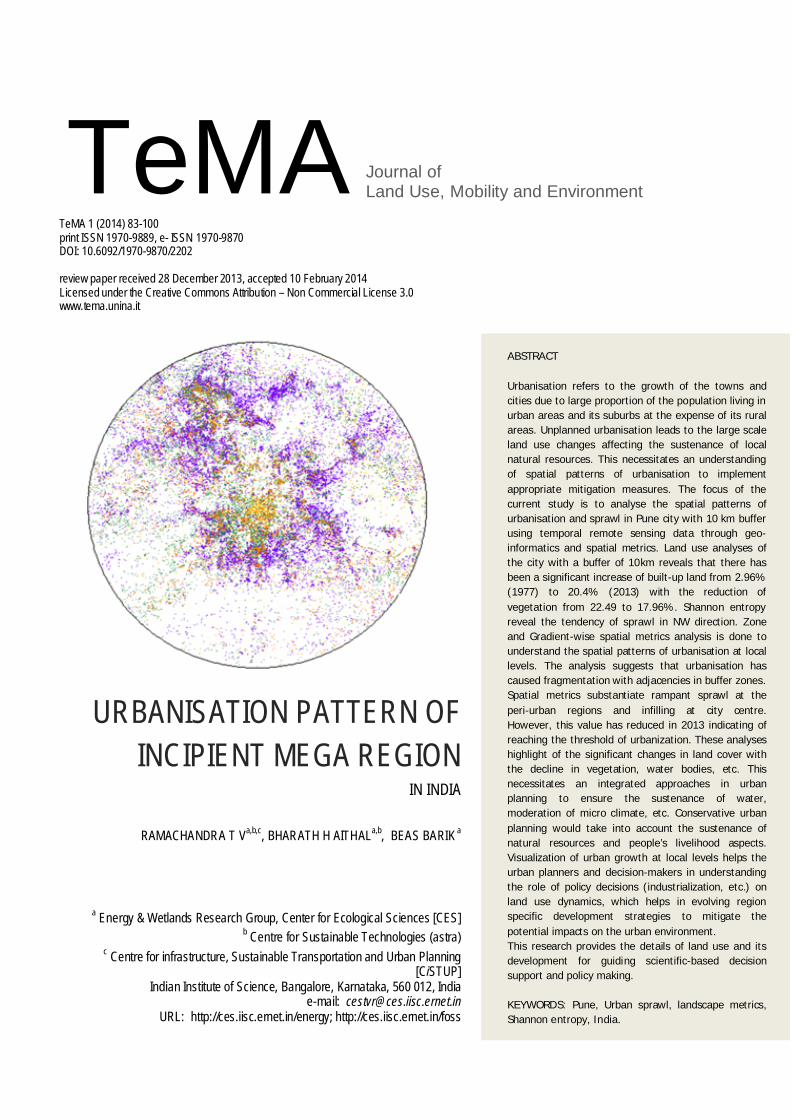
Urbanisation refers to the growth of the towns and cities due to large proportion of the population living in urban areas and its suburbs at the expense of its rural areas. Unplanned urbanisation leads to the large scale land use changes affecting the sustenance of local natural resources. This necessitates an understanding of spatial patterns of urbanisation to implement appropriate mitigation measures. The focus of the current study is to analyse the spatial patterns of urbanisation and sprawl in Pune city with 10 km buffer using temporal remote sensing data through geo-informatics and spatial metrics. Land use analyses of the city with a buffer of 10km reveals that there has been a significant increase of built-up land from 2.96% (1977) to 20.4% (2013) with the reduction of vegetation from 22.49 to 17.96%. Shannon entropy reveal the tendency of sprawl in NW direction. Zone and Gradient-wise spatial metrics analysis is done to understand the spatial patterns of urbanisation at local levels. The analysis suggests that urbanisation has caused fragmentation with adjacencies in buffer zones. Spatial metrics substantiate rampant sprawl at the peri-urban regions and infilling at city centre. However, this value has reduced in 2013 indicating of reaching the threshold of urbanization. These analyses highlight of the significant changes in land cover with the decline in vegetation, water bodies, etc. This necessitates an integrated approaches in urban planning to ensure the sustenance of water, moderation of micro climate, etc. Conservative urban planning would take into account the sustenance of natural resources and people’s livelihood aspects. Visualization of urban growth at local levels helps the urban planners and decision-makers in understanding the role of policy decisions (industrialization, etc.) on land use dynamics, which helps in evolving region specific development strategies to mitigate the potential impacts on the urban environment. This research provides the details of land use and its development for guiding scientific-based decision support and policy making.
KEYWORDS: Pune, Urban sprawl, landscape metrics, Shannon entropy, India.
RAMACHANDRA T Va,b,c, BHARATH H AITHALa,b, BEAS BARIK a
a Energy & Wetlands Research Group, Center for Ecological Sciences [CES] b Centre for Sustainable Technologies (astra)
c Centre for infrastructure, Sustainable Transportation and Urban Planning [CiSTUP]
Indian Institute of Science, Bangalore, Karnataka, 560 012, India e-mail: [email protected]
URL: http://ces.iisc.ernet.in/energy; http://ces.iisc.ernet.in/foss
T.V. Ramachandra, H.A. Bharath, B. Beas – Urbanisation Pattern of Incipient Mega Region in India
84 - TeMA Journal of Land Use Mobility and Environment 1 (2014)
TeMA
TeMA 1 (2014) 83-100 print ISSN 1970-9889, e- ISSN 1970-9870 DOI: 10.6092/1970-9870/2202
review paper received 28 December 2013, accepted 10 February 2014 Licensed under the Creative Commons Attribution – Non Commercial License 3.0 www.tema.unina.it
Pune
10
10
2.96%
1977 20.4% 2013
22.49% 17.96%
20
13
GIS Pune
RAMACHANDRA T Va,b,c, BHARATH H AITHALa,b, BEAS BARIK a
a CES b Centre for Sustainable Technologies (astra)
c Centre for infrastructure, Sustainable Transportation and Urban Planning [CiSTUP]
Indian Institute of Science, Bangalore, Karnataka, 560 012, India e-mail: [email protected]
URL: http://ces.iisc.ernet.in/energy; http://ces.iisc.ernet.in/foss

T.V. Ramachandra, H.A. Bharath, B. Beas – Urbanisation Pattern of Incipient Mega Region in India
85 - TeMA Journal of Land Use Mobility and Environment 1 (2014)
1 INTRODUCTION Cities origin can be traced back to the river valley civilizations of Mesopotamia, Egypt, Indus Valley and
China. Initially these settlements were largely dependent upon agriculture, however with the growth of
population the city size increased and the economic activity transformed to trading. The process of
urbanisation gained impetus with industrial revolution 200 years ago and accelerated with globalization in
1990’s.
Urbanisation refers to the growth of the towns and cities due to large proportion of the population living in
urban areas and its suburbs at the expense of its rural areas. In most of the countries the total population
living in the urban regions has extensively accelerated since the Second World War. Current global
population is 7,057,075,000 billion (Population Reference Bureau, 2005; United Nations, 2011). The rapid
urbanization of the world’s population over the 20th century is evident (Revision of the UN World
Urbanization Prospects report, 2005) from the dramatic increase in global urban population from 13% (220
million, in 1900), to 29% (732 million, in 1950), to 49% (3.2 billion, in 2005) and is expected to increase
to 60% (4.9 billion) by 2030 (Ramachandra and Kumar, 2008; Ramachandra et. al., 2012) and 9.6 billion in
2050 (United Nations, 2011).Urban population has been increasing three times faster than the rural
population, mainly due to migration in most parts of the world (Girardet 1996; Massey et. al., 1999).
People migrate to urban areas with the hope of a better living, considering relatively better infrastructural
facilities (education, recreation, health centres, banking, transport and communication), and higher per
capita income. However, rapid unplanned urbanization has led to serious problems in urban areas due to
higher pollution (air, water, noise) inequitable distribution of natural traffic congestion, development of
shanty towns and slums, unemployment, increased reliance on fossil fuels, and uncontrolled outgrowth or
sprawl in the periphery
The direct implication of such urbanisation is the change in land use and land cover of the region. Urban
ecosystems are the consequence of the intrinsic nature of humans as social beings to live together (Sudhira,
et al., 2003). The process of urbanisation contributed by infrastructure initiatives and consequent population
growth and migration results in the growth of villages into towns, towns into cities and cities into metros.
However, in such a phenomenon for ecologically feasible development, planning requires an understanding
of the growth dynamics. Nevertheless, in most cases there are lot of inadequacies to ascertain the nature of
uncontrolled progression of urban sprawls.
Urban sprawl refers to the dispersed development along highways or surrounding the city and in rural
countryside with implications such as loss of agricultural land, open space and ecologically sensitive habitats.
Sprawl is thus a pattern and pace of land use in which the rate of land consumed for urban purposes
exceeds the rate of population growth resulting in an inefficient and consumptive use of land and its
associated resources. This phenomenon is characterized by an unplanned and uneven pattern of growth,
driven by multitude of processes evident from lack of basic amenities. Urban sprawl is thus a term often
used variously to mean the gluttonous use of land, uninterrupted monotonous development, leapfrog
discontinuous development and inefficient use of land that are influenced by a myriad of factors, including
land features, infrastructure, policies, and individual characteristics. This is characterised by low levels of
some combination of eight distinct dimensions such as density, continuity, concentration, clustering,
centrality, nuclearity, mixed uses and proximity (Sudhira, et al., 2004; Ramachandra, et al., 2012a).
Process of urbanisation bring the development of a region (Verzosa and Gonzalez, 2010), which could be
planned (in the form of townships) or unplanned (organic). Unplanned urbanization leads to the haphazard
or irregular growth with the loss of green spaces and water bodies. Dispersed urban growth without proper
infrastructure and basic amenities is often referred as sprawl (Yeh and Li, 2001; Sudhira et al., 2004;
Verzosa and Gonzalez, 2010, Bharath H A et al., 2012, Bharath S et al., 2012) and this phenomenon is
widespread in developing countries (Bhatta et al., 2010a; 2010b). Implications of sprawl are excess demand
T.V. Ramachandra, H.A. Bharath, B. Beas – Urbanisation Pattern of Incipient Mega Region in India
86 - TeMA Journal of Land Use Mobility and Environment 1 (2014)
on natural resources, improper allocation of basic amenities and infrastructure, (Ramachandra et al., 2012b),
deteriorating water quality, an increased potential for harboring disease vectors, etc. Large scale land use
and land cover (LULC) changes, such as the loss of forests to meet the urban demands of fuel and land
(Ramachandra and Kumar, 2009) has led to the changes in the ecosystem structure, impacting its
functioning and thereby threatening sustainable development (Yeh and Li, 1999; Ji et al., 2001; Chen et al.,
2005; Xiao et al., 2006; Liu et al., 2007; Ramachandra et al., 2013).
Urban expansion is one of the most direct forms of land use change, and refers specifically to changes in
land use patterns and urban space distribution resulting from the social and economic pressures (Pathan et
al. 1989, 1991; Gillies et al., 2003; Alphan et al., 2009; Bhatta 2009; Ramachandra and Bharath, 2012a).
Land cover changes involving the disappearance of ecologically vital natural systems is the major concern in
developing countries (Taubenbock, 2009; Ramachandra et al., 2012a). This has necessitated the
understanding of spatial patterns of urbanisation and quantification of changes. Several earlier studies have
addressed issues relating to urbanisation in relation to energy, land use and climate (Roth et. al., 1989;
Grimm et. al, 2000; Voogt and Oke, 2003; Bharath H. A et al., 2012, Vinay et al., 2012).
Analysis of the urbanisation process and provision of appropriate management strategies requires monitoring
of the spatial extent of urbanisation with the location (Kong et. al., 2012).Availability of temporal data
through space borne sensors with geographic information system (GIS)has aided in the understanding of
spatial patterns and visualization of urbanization with environmental implications (Clapman, 2003; Sutton,
2003; Gillies et al., 2003; Martinuzzi et. al., 2007; Yang et al., 2003; Lopez et al., 2001; Ramachandra et al.,
2012b). Remote sensing data provides a birds-eye view of urban land-use changes at regular intervals.
Geographic information system (GIS) enables spatial analysis of temporal data, which aid in understanding
land use dynamics. Land use (LU) indicates the socio-economic use of land (for example, agriculture,
forestry, recreation or residential use), which implies the purpose for which land is employed (Codjoe, 2004)
or activities humans undertake inducing a change or maintain it (Di Gregorio and Jansen, 1997; Jansen and
Di Gregorio, 1998; Codjoe, 2004).
The spatial patterns elucidate the heterogeneity and complexity of the urban patches in the landscape
(Uuemaa et al., 2009) that can be measured using spatial metrics that help in quantifying and monitoring
the urban growth (Sudhira et al., 2003; Ramachandra and Bharath., 2012b; Ramachandra et al.,
2012a).Landscape structure is a prime factor in analysing the pattern and effects the various natural
processes (Molles, 2006), which is determined by size, shape, composition of land use patches within the
landscape. The analysis of structure of the landscape is essential to understand the implications of land use
changes. In this regard, spatial metrics with a robust mathematical framework help to understand and
quantify the spatial patterns of urbanisation (Gustafson, 1998; Sudhira et al., 2004; Herold et al., 2003;
Uuemaa et al., 2009; Bharath H.A et al., 2012). Spatial metrics can be computed using Fragstats and Patch
Analyst. Fragstats is designed to compute a wide variety of spatial metrics to understand landscape
dynamics (McGarigal and Marks, 1995). India has been experiencing urbanisation subsequent to
globalisation and opening Indian markets during 1990’s. Pune city is the eighth populated Indian city with
higher economic growth, industrial development and IT sectors has been experiencing rampant land use
changes. However, unplanned urbanisation in most cities in India including Pune has enhanced the
environmental concerns in recent years (Bhaskar, 2012). Pune city with sprawl is facing lack of infrastructure
and basic amenities such as sanitation, housing, improper drainages, transportation, etc. (Desai et al.,
2009). This has necessitated the analysis of spatio temporal patterns of urbanisation for implementing
appropriate policy measures to mitigate environmental consequences. The focus of the current paper is to
understand the spatial patterns of urbanisation through (I) the analysis of land use dynamics, (ii)
investigation of sprawl through Shannon’s entropy and (iii) patterns of urbanisation through spatial metrics
using gradient and zonal approach.
T.V. Ramachandra, H.A. Bharath, B. Beas – Urbanisation Pattern of Incipient Mega Region in India
87 - TeMA Journal of Land Use Mobility and Environment 1 (2014)
2 STUDY AREA Pune, earlier known as Poona is the cultural capital of Maharashtra and is also known as “Queen of Deccan”
as it is located atop the Deccan Plateau and also “Oxford of East” and “Detroit of India”. Pune is located in
the western part of Maharashtra state between 18°32´ N and 72° 51´E at a height of 560 m above mean
sea level. It lies near the confluence of the Mula-Mutha River. Rivers Pavana and Indrayani flows along the
north-western outskirts of the urban area. The Pune Municipal Corporation covers an area of 243.84 sq.
kms. Pune has a tropical wet and dry climate, with three distinct seasons- Summer(March to May), Monsoon
(June to September) and Winter (November to January).The River Bhima flows through the city and provide
water supply for the domestic, commercial and irrigation purpose. Rice, Jowar, Bajra, sugarcane, groundnut
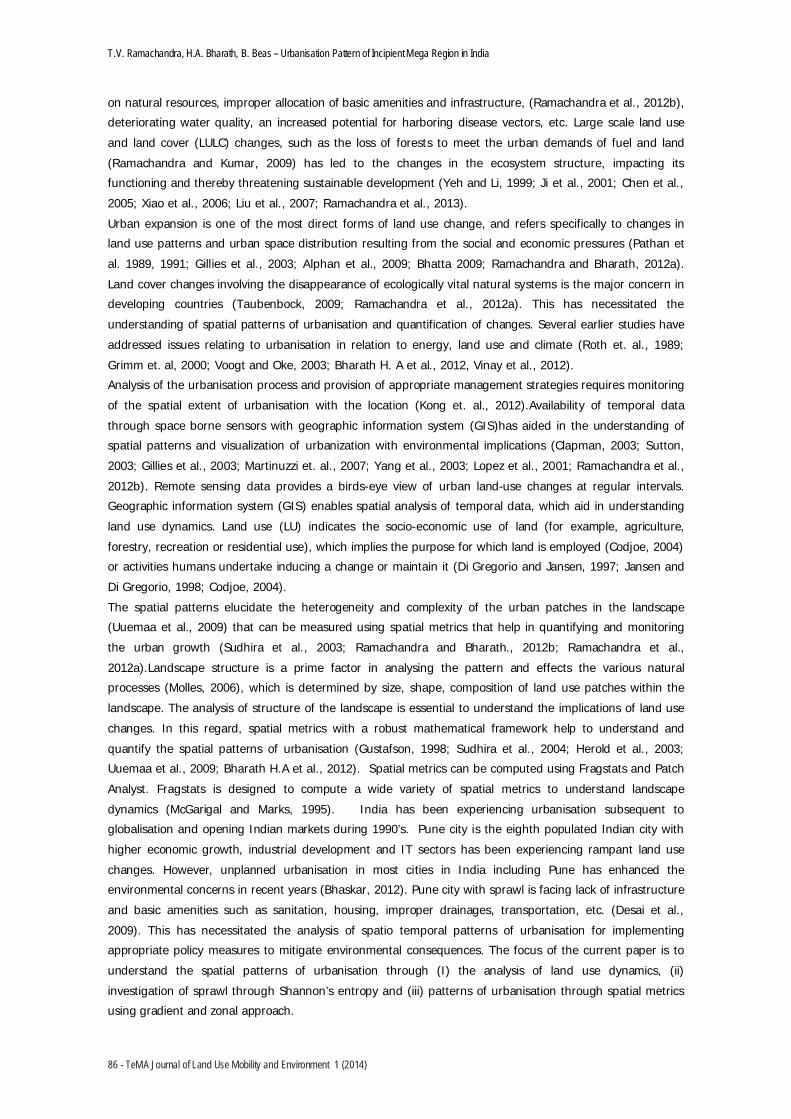
and sunflower are major crops grown in the Pune. Fig. 1 depicts the population dynamics during 1901 to
2011 showing an increase by 347% during the last 110 years. Pune being one among incipient mega cities
in India has seen the large scale development in recent times. Population of Pune has increased by 2 million
to 9 million (Census 2011) from 7 million in 2001 (Census 2001, JNNURM, 2006-2012). Fig. 1 shows the
population statistics of Pune in last 100 years.
Fig. 1: Growth of population in Pune
Pune Municipal Corporation with forty-eight wards is the civic body that is responsible administration and
infrastructure development of the city and it is known as the Pune Mahanagar Palika (PMP). The current
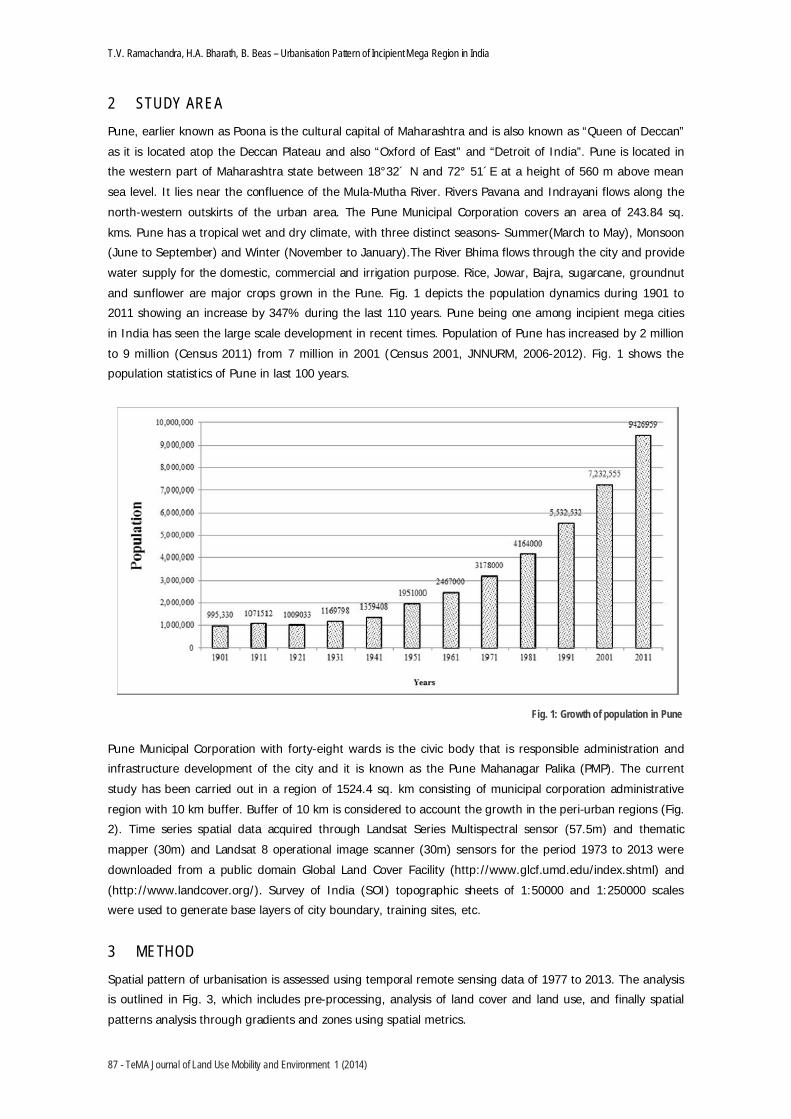
study has been carried out in a region of 1524.4 sq. km consisting of municipal corporation administrative
region with 10 km buffer. Buffer of 10 km is considered to account the growth in the peri-urban regions (Fig.
2). Time series spatial data acquired through Landsat Series Multispectral sensor (57.5m) and thematic
mapper (30m) and Landsat 8 operational image scanner (30m) sensors for the period 1973 to 2013 were
downloaded from a public domain Global Land Cover Facility (http://www.glcf.umd.edu/index.shtml) and
(http://www.landcover.org/). Survey of India (SOI) topographic sheets of 1:50000 and 1:250000 scales
were used to generate base layers of city boundary, training sites, etc.
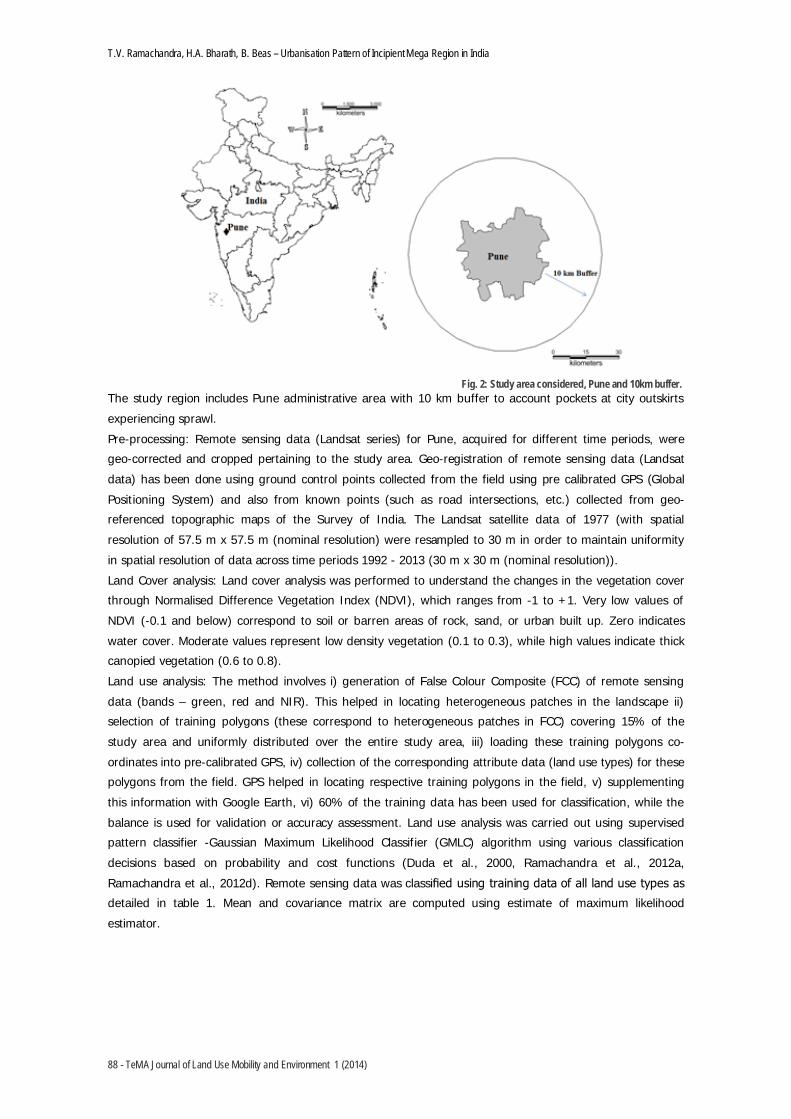
3 METHOD Spatial pattern of urbanisation is assessed using temporal remote sensing data of 1977 to 2013. The analysis
is outlined in Fig. 3, which includes pre-processing, analysis of land cover and land use, and finally spatial
patterns analysis through gradients and zones using spatial metrics.
T.V. Ramachandra, H.A. Bharath, B. Beas – Urbanisation Pattern of Incipient Mega Region in India
88 - TeMA Journal of Land Use Mobility and Environment 1 (2014)
Fig. 2: Study area considered, Pune and 10km buffer. The study region includes Pune administrative area with 10 km buffer to account pockets at city outskirts
experiencing sprawl.
Pre-processing: Remote sensing data (Landsat series) for Pune, acquired for different time periods, were
geo-corrected and cropped pertaining to the study area. Geo-registration of remote sensing data (Landsat
data) has been done using ground control points collected from the field using pre calibrated GPS (Global
Positioning System) and also from known points (such as road intersections, etc.) collected from geo-
referenced topographic maps of the Survey of India. The Landsat satellite data of 1977 (with spatial
resolution of 57.5 m x 57.5 m (nominal resolution) were resampled to 30 m in order to maintain uniformity
in spatial resolution of data across time periods 1992 - 2013 (30 m x 30 m (nominal resolution)).
Land Cover analysis: Land cover analysis was performed to understand the changes in the vegetation cover
through Normalised Difference Vegetation Index (NDVI), which ranges from -1 to +1. Very low values of
NDVI (-0.1 and below) correspond to soil or barren areas of rock, sand, or urban built up. Zero indicates
water cover. Moderate values represent low density vegetation (0.1 to 0.3), while high values indicate thick
canopied vegetation (0.6 to 0.8).
Land use analysis: The method involves i) generation of False Colour Composite (FCC) of remote sensing
data (bands – green, red and NIR). This helped in locating heterogeneous patches in the landscape ii)
selection of training polygons (these correspond to heterogeneous patches in FCC) covering 15% of the
study area and uniformly distributed over the entire study area, iii) loading these training polygons co-
ordinates into pre-calibrated GPS, iv) collection of the corresponding attribute data (land use types) for these
polygons from the field. GPS helped in locating respective training polygons in the field, v) supplementing
this information with Google Earth, vi) 60% of the training data has been used for classification, while the
balance is used for validation or accuracy assessment. Land use analysis was carried out using supervised
pattern classifier -Gaussian Maximum Likelihood Classifier (GMLC) algorithm using various classification
decisions based on probability and cost functions (Duda et al., 2000, Ramachandra et al., 2012a,
Ramachandra et al., 2012d). Remote sensing data was classi
detailed in table 1. Mean and covariance matrix are computed using estimate of maximum likelihood
estimator.

T.V. Ramachandra, H.A. Bharath, B. Beas – Urbanisation Pattern of Incipient Mega Region in India
89 - TeMA Journal of Land Use Mobility and Environment 1 (2014)
Fig. 3: Procedure followed in analysis
Land use Class Land uses included in the class Urban This category includes residential area, industrial area, and all paved surfaces and mixed
pixels having built up area. Water bodies Tanks, Lakes, Reservoirs.
Vegetation Forest, Cropland, nurseries.
Others Rocks, quarry pits, open ground at building sites, kaccha roads.
Table 1: Land use classification categories
Land use was computed using the temporal data through the open source program GRASS - Geographic
Resource Analysis Support System (http://ces.iisc.ernet.in/foss). Signatures were collected from field visits
and with the help of Google Earth. 60% of the total generated signatures were used in classification, 40%
signatures were used in validation and accuracy assessment.
Statistical assessment of classifier performance based on the performance of spectral classification
considering reference pixels is done
and user's) accuracies (Mitrakis et al., 2008, Congalton et al., 1983).
Accuracy assessment and Kappa coefficient indicate the effectiveness of the classifier (Congalton, 1991;
Lillesand & Kiefer, 2005). Recent remote sensing data (2013) was classified using the training data collected
from field using GPS and earlier time period, training polygon along with attribute details were compiled
from the previously published topographic maps, vegetation maps, revenue maps, etc.
Division of these zones to concentric circles (Gradient Analysis): All of the zones were divided into concentric
circles with a consecutive incrementing radius of 1 km from the centre of the city. This analysis helped in
visualising the process of change at local levels and understand the agents responsible for the changes. This
helps in identifying the causal factors and locations experiencing various levels (sprawl, compact growth,
T.V. Ramachandra, H.A. Bharath, B. Beas – Urbanisation Pattern of Incipient Mega Region in India
90 - TeMA Journal of Land Use Mobility and Environment 1 (2014)
etc.) of urbanization in response to the economic, social and political forces. This approach (zones,
concentric circles) also helps in visualizing the forms of urban sprawl (low density, ribbon, leaf-frog
development).
The built up density in each circle is monitored over different time period through time series analysis. This
helps the city administration in understanding the urbanization dynamics to provide appropriate
infrastructure and basic amenities. Shannon’s Entropy (Hn): Further to understand the growth of the urban
area in a specific zone and to understand if the urban area is compact or divergent, Shannon’s entropy (Lata
et al., 2001; Ramachandra et al., 2012a) given in equation 1, was computed for each zone.
Hn = Pi log(Pi) ….. (1)
Where, Pi is the proportion of the built-up in the ith concentric circle. If the distribution is maximally
concentrated, the Shannon’s Entropy (Hn), of zero is obtained. If distribution is evenly among the concentric
circles, Hn will have maximum of log n.
Computation of spatial metrics: Spatial metrics are helpful to quantify spatial characteristics of the
landscape. Select spatial metrics with details given in Table 2, were computed to analyse and understand the
urban dynamics through FRAGSTATS (McGarigal and Marks in 1995) at three levels: patch, class and
landscape levels.
Table 2. Landscape Metrics used in analysis
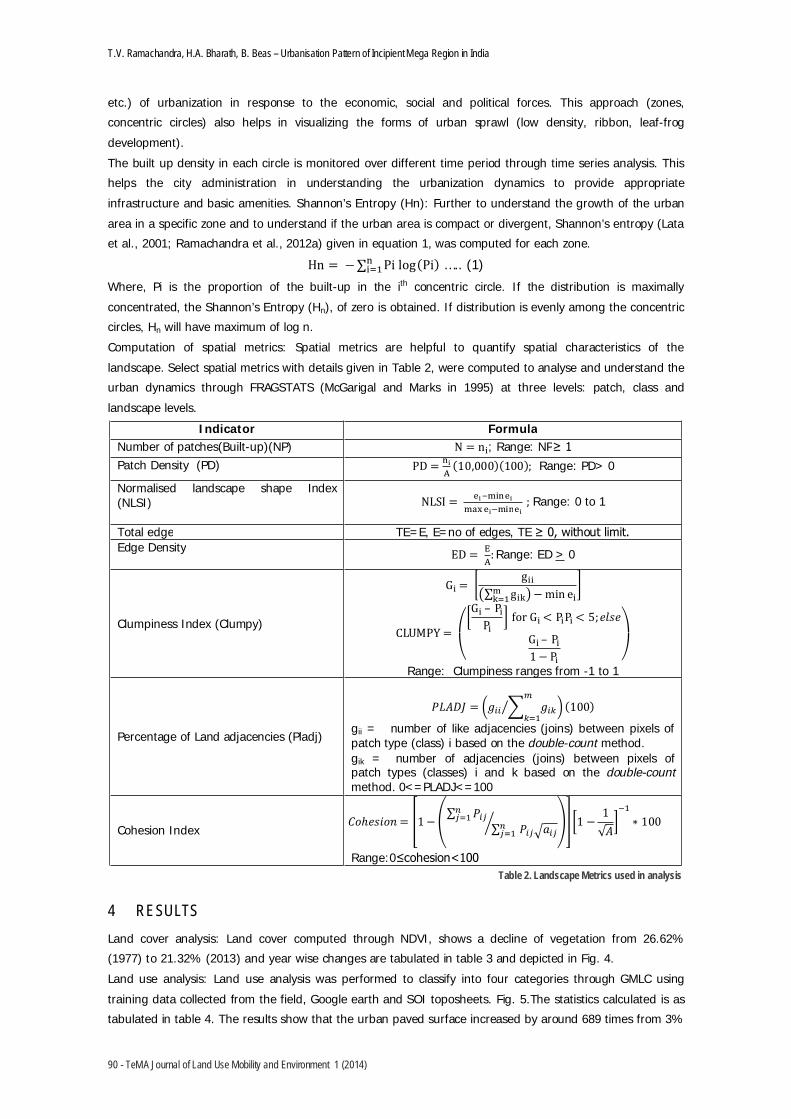
4 RESULTS Land cover analysis: Land cover computed through NDVI, shows a decline of vegetation from 26.62%
(1977) to 21.32% (2013) and year wise changes are tabulated in table 3 and depicted in Fig. 4.
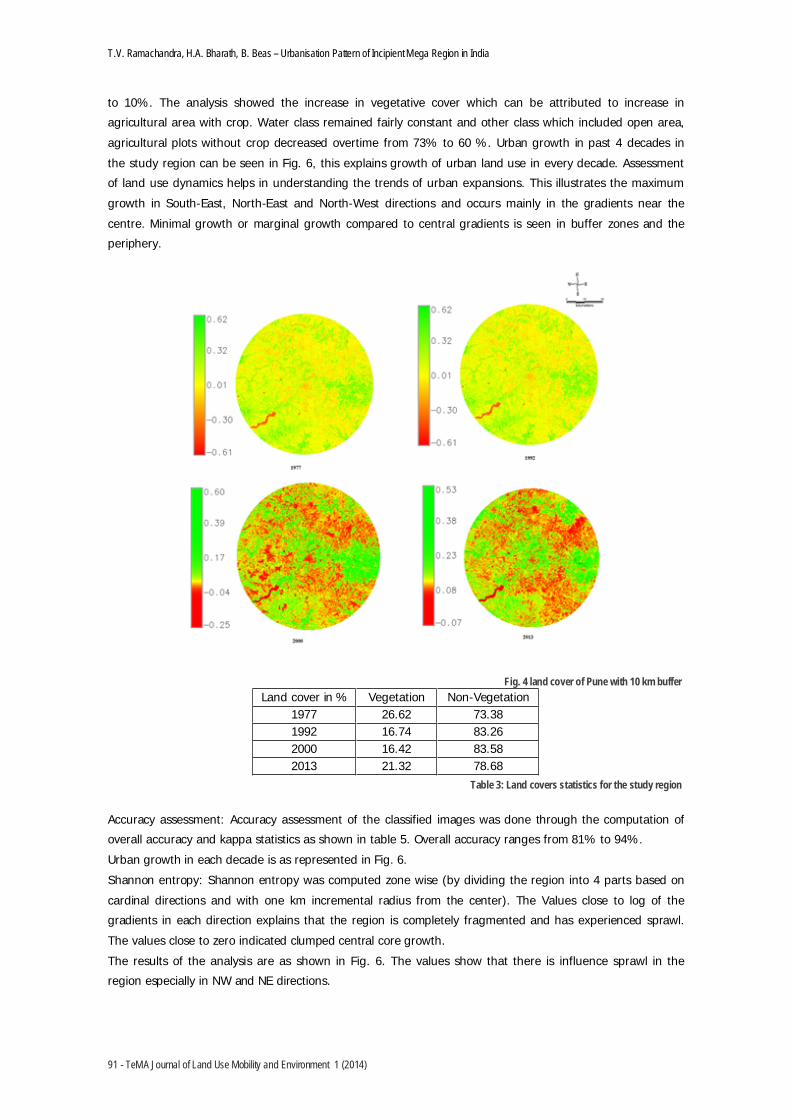
Land use analysis: Land use analysis was performed to classify into four categories through GMLC using
training data collected from the field, Google earth and SOI toposheets. Fig. 5.The statistics calculated is as
tabulated in table 4. The results show that the urban paved surface increased by around 689 times from 3%
Indicator Formula Number of patches(Built-up)(NP) N = n ; Range: NP Patch Density (PD) PD = (10,000)(100); Range: PD> 0
Normalised landscape shape Index (NLSI) NLSI = ; Range: 0 to 1
Total edge TE=E, E=no of edges, TE Edge Density
ED = :Range: ED > 0
Clumpiness Index (Clumpy)
G =g
g min e
CLUMPY =
G – P
Pfor G < PP < 5;
G – P
1 P
Range: Clumpiness ranges from -1 to 1
Percentage of Land adjacencies (Pladj)
= (100)
gii = number of like adjacencies (joins) between pixels of patch type (class) i based on the double-count method. gik = number of adjacencies (joins) between pixels of patch types (classes) i and k based on the double-count method. 0<=PLADJ<=100
Cohesion Index = 1 1
1100
Range:0
T.V. Ramachandra, H.A. Bharath, B. Beas – Urbanisation Pattern of Incipient Mega Region in India
91 - TeMA Journal of Land Use Mobility and Environment 1 (2014)
to 10%. The analysis showed the increase in vegetative cover which can be attributed to increase in
agricultural area with crop. Water class remained fairly constant and other class which included open area,
agricultural plots without crop decreased overtime from 73% to 60 %. Urban growth in past 4 decades in
the study region can be seen in Fig. 6, this explains growth of urban land use in every decade. Assessment
of land use dynamics helps in understanding the trends of urban expansions. This illustrates the maximum
growth in South-East, North-East and North-West directions and occurs mainly in the gradients near the
centre. Minimal growth or marginal growth compared to central gradients is seen in buffer zones and the
periphery.
Fig. 4 land cover of Pune with 10 km buffer Land cover in % Vegetation Non-Vegetation
1977 26.62 73.381992 16.74 83.262000 16.42 83.582013 21.32 78.68
Table 3: Land covers statistics for the study region
Accuracy assessment: Accuracy assessment of the classified images was done through the computation of
overall accuracy and kappa statistics as shown in table 5. Overall accuracy ranges from 81% to 94%.
Urban growth in each decade is as represented in Fig. 6.
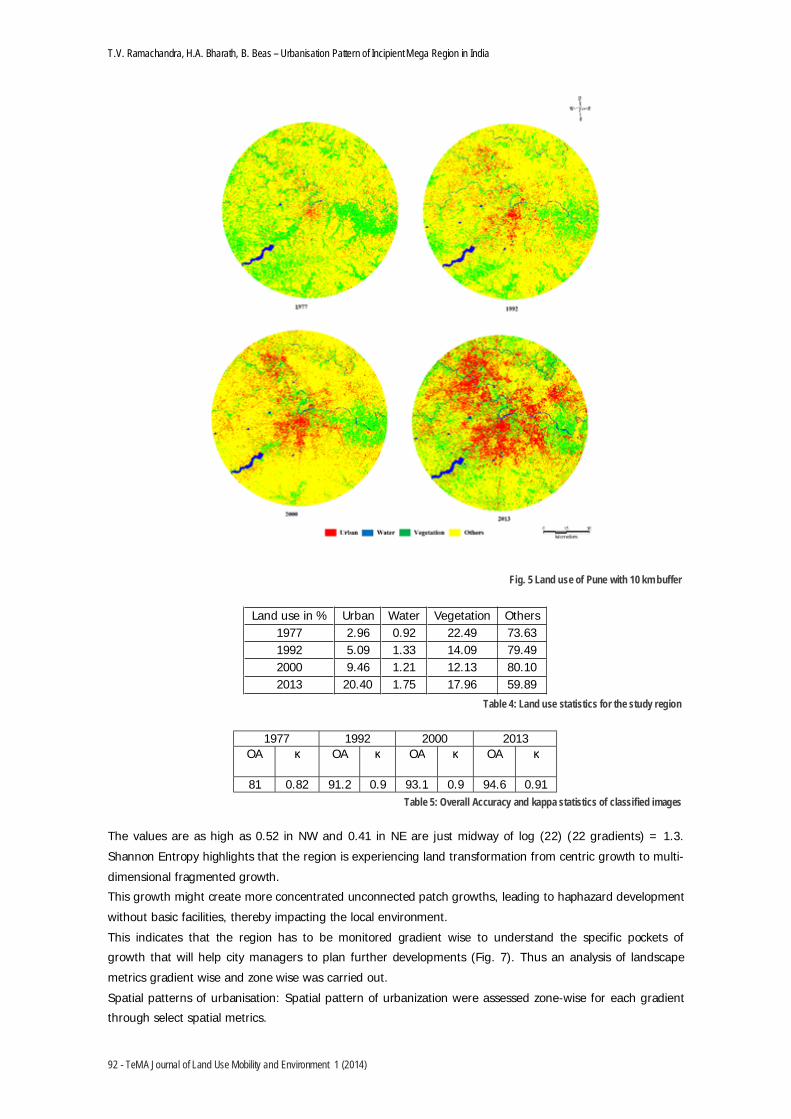
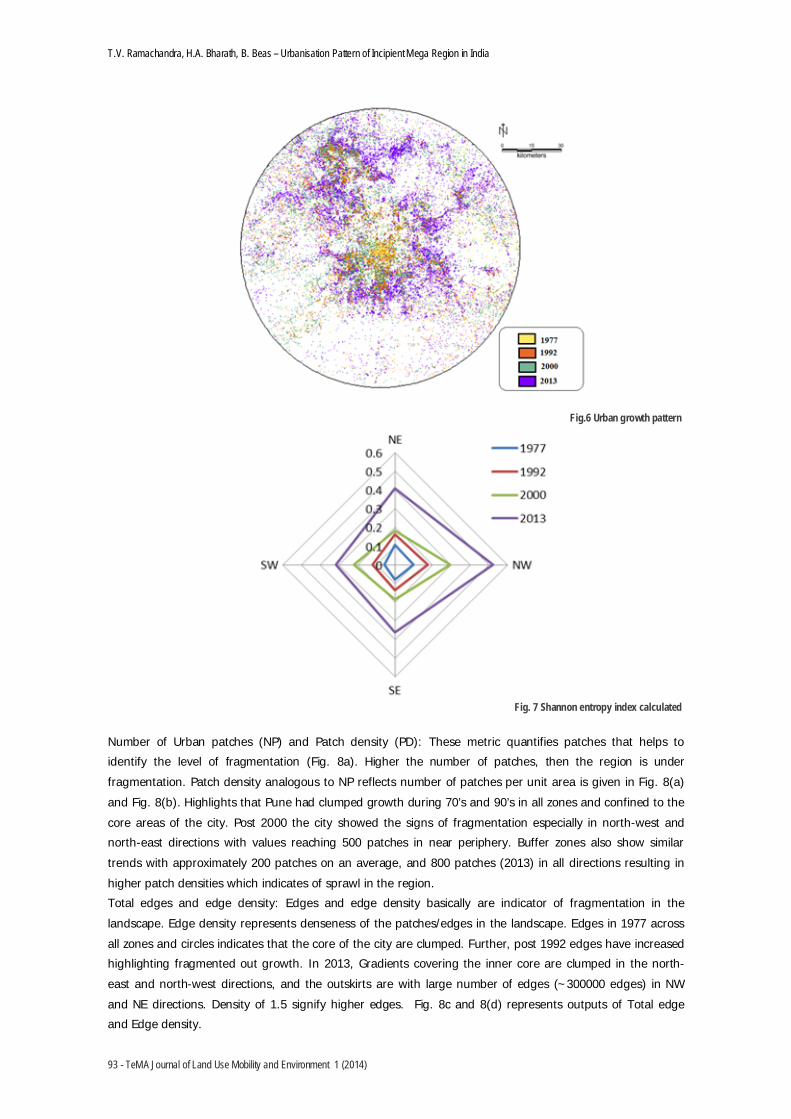
Shannon entropy: Shannon entropy was computed zone wise (by dividing the region into 4 parts based on
cardinal directions and with one km incremental radius from the center). The Values close to log of the
gradients in each direction explains that the region is completely fragmented and has experienced sprawl.
The values close to zero indicated clumped central core growth.
The results of the analysis are as shown in Fig. 6. The values show that there is influence sprawl in the
region especially in NW and NE directions.
T.V. Ramachandra, H.A. Bharath, B. Beas – Urbanisation Pattern of Incipient Mega Region in India
92 - TeMA Journal of Land Use Mobility and Environment 1 (2014)
Fig. 5 Land use of Pune with 10 km buffer
Land use in % Urban Water Vegetation Others 1977 2.96 0.92 22.49 73.63 1992 5.09 1.33 14.09 79.49 2000 9.46 1.21 12.13 80.10 2013 20.40 1.75 17.96 59.89
Table 4: Land use statistics for the study region
1977 1992 2000 2013OA OA OA OA
81 0.82 91.2 0.9 93.1 0.9 94.6 0.91 Table 5: Overall Accuracy and kappa statistics of classified images
The values are as high as 0.52 in NW and 0.41 in NE are just midway of log (22) (22 gradients) = 1.3.
Shannon Entropy highlights that the region is experiencing land transformation from centric growth to multi-
dimensional fragmented growth.
This growth might create more concentrated unconnected patch growths, leading to haphazard development
without basic facilities, thereby impacting the local environment.
This indicates that the region has to be monitored gradient wise to understand the specific pockets of
growth that will help city managers to plan further developments (Fig. 7). Thus an analysis of landscape
metrics gradient wise and zone wise was carried out.
Spatial patterns of urbanisation: Spatial pattern of urbanization were assessed zone-wise for each gradient
through select spatial metrics.
T.V. Ramachandra, H.A. Bharath, B. Beas – Urbanisation Pattern of Incipient Mega Region in India
93 - TeMA Journal of Land Use Mobility and Environment 1 (2014)
Fig.6 Urban growth pattern
Fig. 7 Shannon entropy index calculated
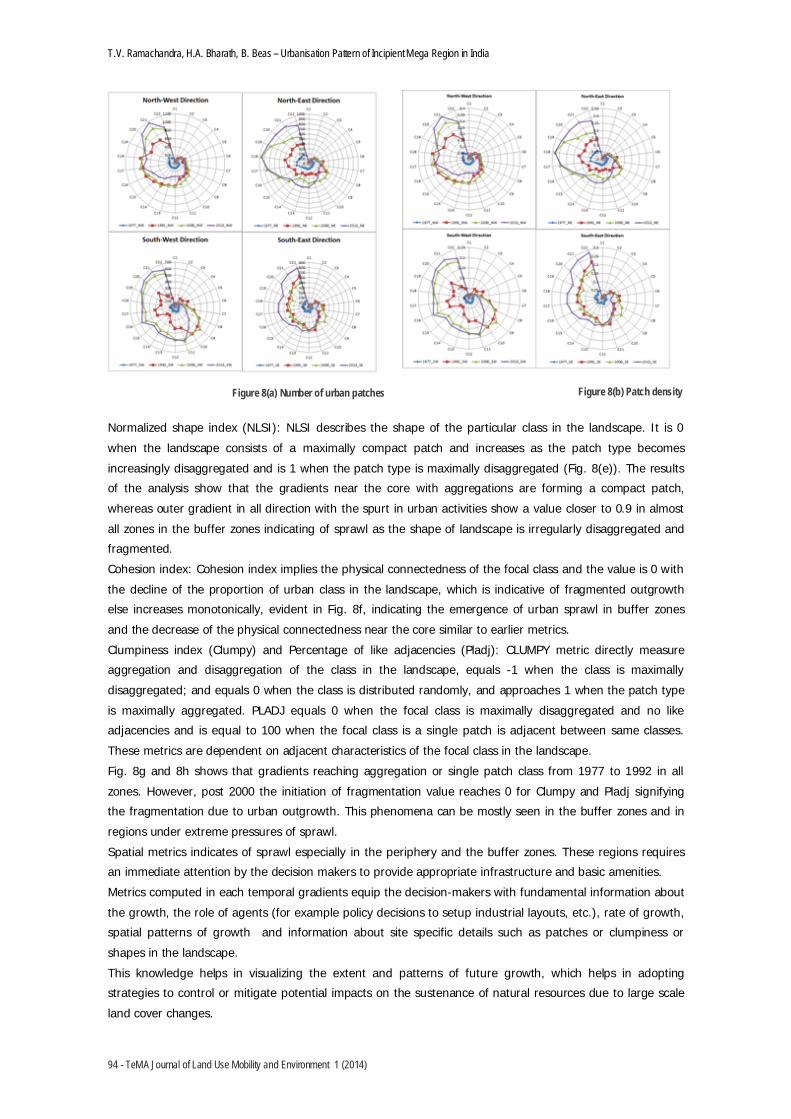
Number of Urban patches (NP) and Patch density (PD): These metric quantifies patches that helps to
identify the level of fragmentation (Fig. 8a). Higher the number of patches, then the region is under
fragmentation. Patch density analogous to NP reflects number of patches per unit area is given in Fig. 8(a)
and Fig. 8(b). Highlights that Pune had clumped growth during 70’s and 90’s in all zones and confined to the
core areas of the city. Post 2000 the city showed the signs of fragmentation especially in north-west and
north-east directions with values reaching 500 patches in near periphery. Buffer zones also show similar
trends with approximately 200 patches on an average, and 800 patches (2013) in all directions resulting in
higher patch densities which indicates of sprawl in the region.
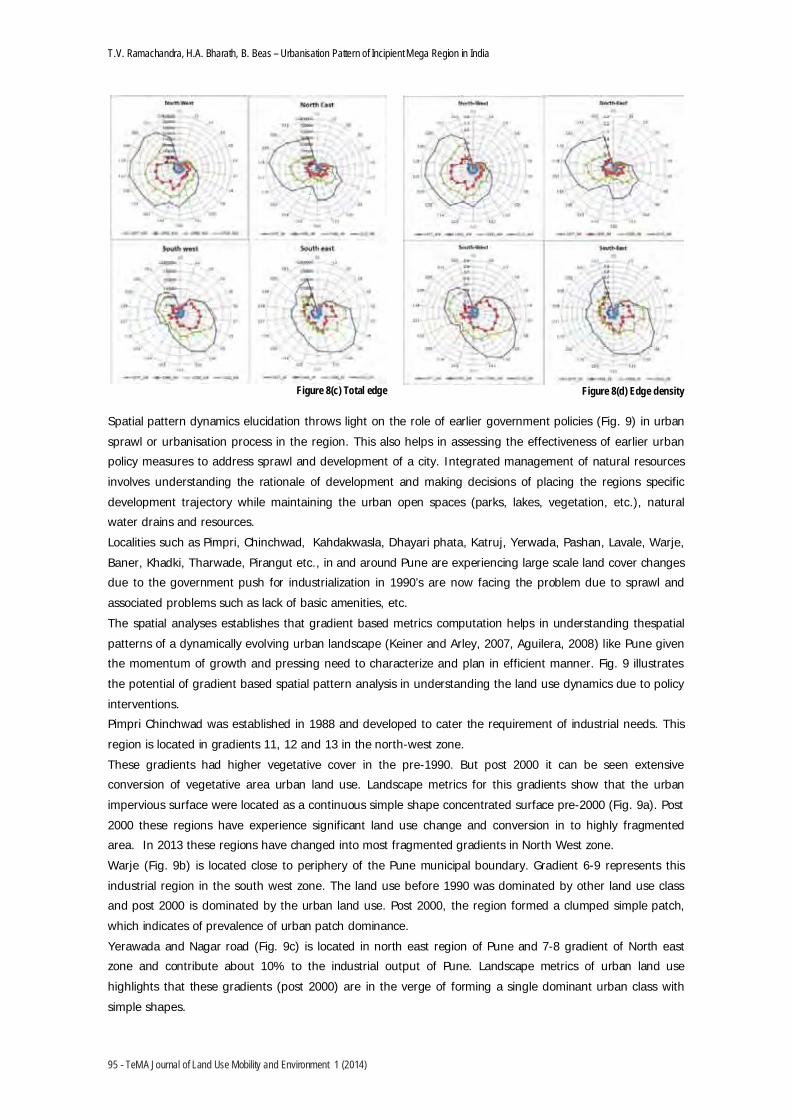
Total edges and edge density: Edges and edge density basically are indicator of fragmentation in the
landscape. Edge density represents denseness of the patches/edges in the landscape. Edges in 1977 across
all zones and circles indicates that the core of the city are clumped. Further, post 1992 edges have increased
highlighting fragmented out growth. In 2013, Gradients covering the inner core are clumped in the north-
east and north-west directions, and the outskirts are with large number of edges (~300000 edges) in NW
and NE directions. Density of 1.5 signify higher edges. Fig. 8c and 8(d) represents outputs of Total edge
and Edge density.
T.V. Ramachandra, H.A. Bharath, B. Beas – Urbanisation Pattern of Incipient Mega Region in India
94 - TeMA Journal of Land Use Mobility and Environment 1 (2014)
Figure 8(a) Number of urban patches Figure 8(b) Patch density
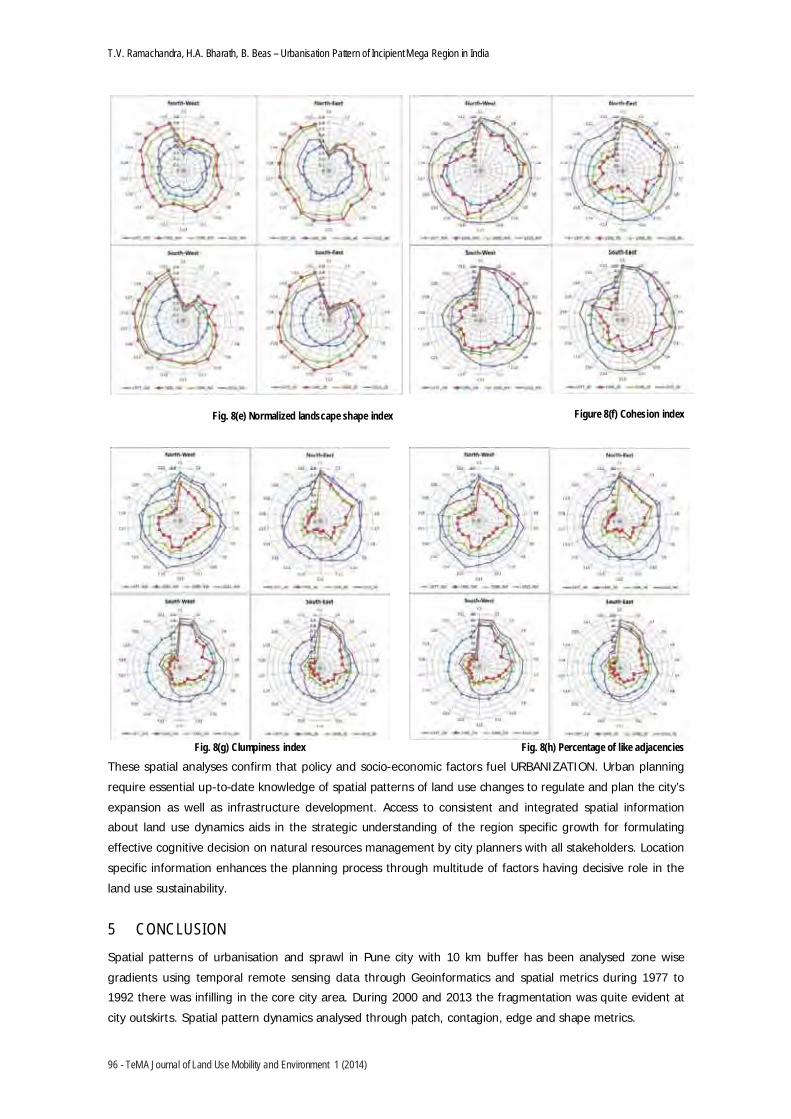
Normalized shape index (NLSI): NLSI describes the shape of the particular class in the landscape. It is 0
when the landscape consists of a maximally compact patch and increases as the patch type becomes
increasingly disaggregated and is 1 when the patch type is maximally disaggregated (Fig. 8(e)). The results
of the analysis show that the gradients near the core with aggregations are forming a compact patch,
whereas outer gradient in all direction with the spurt in urban activities show a value closer to 0.9 in almost
all zones in the buffer zones indicating of sprawl as the shape of landscape is irregularly disaggregated and
fragmented.
Cohesion index: Cohesion index implies the physical connectedness of the focal class and the value is 0 with
the decline of the proportion of urban class in the landscape, which is indicative of fragmented outgrowth
else increases monotonically, evident in Fig. 8f, indicating the emergence of urban sprawl in buffer zones
and the decrease of the physical connectedness near the core similar to earlier metrics.
Clumpiness index (Clumpy) and Percentage of like adjacencies (Pladj): CLUMPY metric directly measure
aggregation and disaggregation of the class in the landscape, equals -1 when the class is maximally
disaggregated; and equals 0 when the class is distributed randomly, and approaches 1 when the patch type
is maximally aggregated. PLADJ equals 0 when the focal class is maximally disaggregated and no like
adjacencies and is equal to 100 when the focal class is a single patch is adjacent between same classes.
These metrics are dependent on adjacent characteristics of the focal class in the landscape.
Fig. 8g and 8h shows that gradients reaching aggregation or single patch class from 1977 to 1992 in all
zones. However, post 2000 the initiation of fragmentation value reaches 0 for Clumpy and Pladj signifying
the fragmentation due to urban outgrowth. This phenomena can be mostly seen in the buffer zones and in
regions under extreme pressures of sprawl.
Spatial metrics indicates of sprawl especially in the periphery and the buffer zones. These regions requires
an immediate attention by the decision makers to provide appropriate infrastructure and basic amenities.
Metrics computed in each temporal gradients equip the decision-makers with fundamental information about
the growth, the role of agents (for example policy decisions to setup industrial layouts, etc.), rate of growth,
spatial patterns of growth and information about site specific details such as patches or clumpiness or
shapes in the landscape.
This knowledge helps in visualizing the extent and patterns of future growth, which helps in adopting
strategies to control or mitigate potential impacts on the sustenance of natural resources due to large scale
land cover changes.
T.V. Ramachandra, H.A. Bharath, B. Beas – Urbanisation Pattern of Incipient Mega Region in India
95 - TeMA Journal of Land Use Mobility and Environment 1 (2014)
Figure 8(c) Total edge Figure 8(d) Edge density
Spatial pattern dynamics elucidation throws light on the role of earlier government policies (Fig. 9) in urban
sprawl or urbanisation process in the region. This also helps in assessing the effectiveness of earlier urban
policy measures to address sprawl and development of a city. Integrated management of natural resources
involves understanding the rationale of development and making decisions of placing the regions specific
development trajectory while maintaining the urban open spaces (parks, lakes, vegetation, etc.), natural
water drains and resources.
Localities such as Pimpri, Chinchwad, Kahdakwasla, Dhayari phata, Katruj, Yerwada, Pashan, Lavale, Warje,
Baner, Khadki, Tharwade, Pirangut etc., in and around Pune are experiencing large scale land cover changes
due to the government push for industrialization in 1990’s are now facing the problem due to sprawl and
associated problems such as lack of basic amenities, etc.
The spatial analyses establishes that gradient based metrics computation helps in understanding thespatial
patterns of a dynamically evolving urban landscape (Keiner and Arley, 2007, Aguilera, 2008) like Pune given
the momentum of growth and pressing need to characterize and plan in efficient manner. Fig. 9 illustrates
the potential of gradient based spatial pattern analysis in understanding the land use dynamics due to policy
interventions.
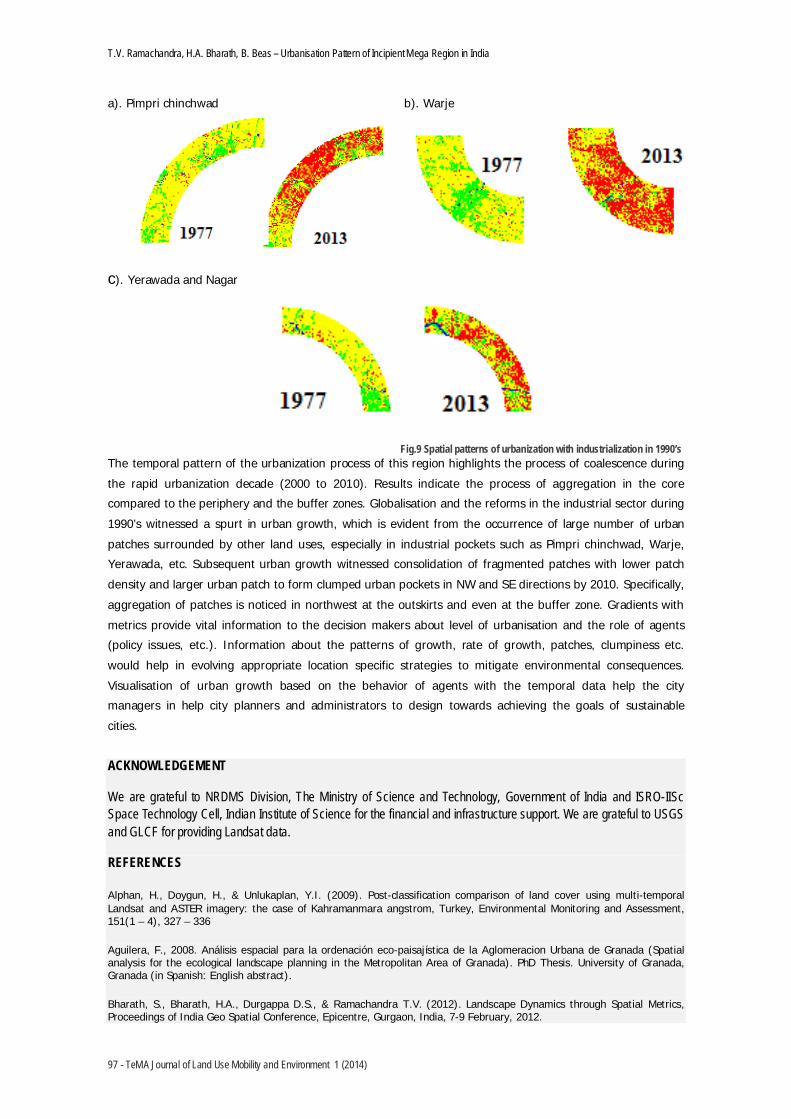
Pimpri Chinchwad was established in 1988 and developed to cater the requirement of industrial needs. This
region is located in gradients 11, 12 and 13 in the north-west zone.
These gradients had higher vegetative cover in the pre-1990. But post 2000 it can be seen extensive
conversion of vegetative area urban land use. Landscape metrics for this gradients show that the urban
impervious surface were located as a continuous simple shape concentrated surface pre-2000 (Fig. 9a). Post
2000 these regions have experience significant land use change and conversion in to highly fragmented
area. In 2013 these regions have changed into most fragmented gradients in North West zone.
Warje (Fig. 9b) is located close to periphery of the Pune municipal boundary. Gradient 6-9 represents this
industrial region in the south west zone. The land use before 1990 was dominated by other land use class
and post 2000 is dominated by the urban land use. Post 2000, the region formed a clumped simple patch,
which indicates of prevalence of urban patch dominance.
Yerawada and Nagar road (Fig. 9c) is located in north east region of Pune and 7-8 gradient of North east
zone and contribute about 10% to the industrial output of Pune. Landscape metrics of urban land use
highlights that these gradients (post 2000) are in the verge of forming a single dominant urban class with
simple shapes.
T.V. Ramachandra, H.A. Bharath, B. Beas – Urbanisation Pattern of Incipient Mega Region in India
96 - TeMA Journal of Land Use Mobility and Environment 1 (2014)
Fig. 8(e) Normalized landscape shape index Figure 8(f) Cohesion index
Fig. 8(g) Clumpiness index
Fig. 8(h) Percentage of like adjacencies
These spatial analyses confirm that policy and socio-economic factors fuel URBANIZATION. Urban planning
require essential up-to-date knowledge of spatial patterns of land use changes to regulate and plan the city’s
expansion as well as infrastructure development. Access to consistent and integrated spatial information
about land use dynamics aids in the strategic understanding of the region specific growth for formulating
effective cognitive decision on natural resources management by city planners with all stakeholders. Location
specific information enhances the planning process through multitude of factors having decisive role in the
land use sustainability.
5 CONCLUSION Spatial patterns of urbanisation and sprawl in Pune city with 10 km buffer has been analysed zone wise
gradients using temporal remote sensing data through Geoinformatics and spatial metrics during 1977 to
1992 there was infilling in the core city area. During 2000 and 2013 the fragmentation was quite evident at
city outskirts. Spatial pattern dynamics analysed through patch, contagion, edge and shape metrics.
T.V. Ramachandra, H.A. Bharath, B. Beas – Urbanisation Pattern of Incipient Mega Region in India
97 - TeMA Journal of Land Use Mobility and Environment 1 (2014)
a). Pimpri chinchwad b). Warje
c). Yerawada and Nagar
Fig.9 Spatial patterns of urbanization with industrialization in 1990’s The temporal pattern of the urbanization process of this region highlights the process of coalescence during
the rapid urbanization decade (2000 to 2010). Results indicate the process of aggregation in the core
compared to the periphery and the buffer zones. Globalisation and the reforms in the industrial sector during
1990’s witnessed a spurt in urban growth, which is evident from the occurrence of large number of urban
patches surrounded by other land uses, especially in industrial pockets such as Pimpri chinchwad, Warje,
Yerawada, etc. Subsequent urban growth witnessed consolidation of fragmented patches with lower patch
density and larger urban patch to form clumped urban pockets in NW and SE directions by 2010. Specifically,
aggregation of patches is noticed in northwest at the outskirts and even at the buffer zone. Gradients with
metrics provide vital information to the decision makers about level of urbanisation and the role of agents
(policy issues, etc.). Information about the patterns of growth, rate of growth, patches, clumpiness etc.
would help in evolving appropriate location specific strategies to mitigate environmental consequences.
Visualisation of urban growth based on the behavior of agents with the temporal data help the city
managers in help city planners and administrators to design towards achieving the goals of sustainable
cities.
ACKNOWLEDGEMENT
We are grateful to NRDMS Division, The Ministry of Science and Technology, Government of India and ISRO-IISc Space Technology Cell, Indian Institute of Science for the financial and infrastructure support. We are grateful to USGS and GLCF for providing Landsat data.
REFERENCES
Alphan, H., Doygun, H., & Unlukaplan, Y.I. (2009). Post-classification comparison of land cover using multi-temporal Landsat and ASTER imagery: the case of Kahramanmara angstrom, Turkey, Environmental Monitoring and Assessment, 151(1 – 4), 327 – 336
Aguilera, F., 2008. Análisis espacial para la ordenación eco-paisajística de la Aglomeracion Urbana de Granada (Spatial analysis for the ecological landscape planning in the Metropolitan Area of Granada). PhD Thesis. University of Granada, Granada (in Spanish: English abstract).
Bharath, S., Bharath, H.A., Durgappa D.S., & Ramachandra T.V. (2012). Landscape Dynamics through Spatial Metrics, Proceedings of India Geo Spatial Conference, Epicentre, Gurgaon, India, 7-9 February, 2012.

T.V. Ramachandra, H.A. Bharath, B. Beas – Urbanisation Pattern of Incipient Mega Region in India
98 - TeMA Journal of Land Use Mobility and Environment 1 (2014)
Bharath, H. A., Bharath, S., Sreekantha, S., Durgappa D.S., Ramachandra, T. V., (2012) “Spatial patterns of urbanization in Mysore: Emerging Tier II City in Karnataka, Proceedings of NRSC User Interaction Meet- 2012, 16th & 17th, Hyderabad, February 2012.
Bhaskar, P., (2012). Urbanization and changing green spaces in Indian cities (Case study – City of Pune), International Journal of Geology, Earth and Environmental Sciences, 2, 148- 156.
Bhatta, B., (2009). Analysis of urban growth pattern using remote sensing and GIS: A case study of Kolkata, India. International Journal of Remote Sensing, 30(18), 4733–4746.
Bhatta, B., Saraswati, S., & Bandyopadhyay, D., (2010a). Quantifying the degree-of-freedom, degree-of-sprawl, and degree-of-goodness of urban growth from remote sensing data. Applied Geography, 30(1), 96–111.
Bhatta, B., Saraswati, S., & Bandyopadhyay, D., (2010b). Urban sprawl measurement from remote sensing data. Applied Geography, 30(4), 731–740.
Census of India, available at http://censusindia.gov.in. Last accessed 10th June 2013
Chen, H.Y., Ganesan, S. & Jia, B.S., (2005). Environmental challenge for Post-reform housing development in Beijing”, Habitat International, Vol. 19, No. 3, pp. 571 – 589
City Development Plan (2006-2012), Jawaharlal Nehru National Urban Renewal Mission.
Clapman, Jr., W.B., (2003). Continuum-based classification of remotely sensed imagery to describe urban sprawl on a watershed scale, Remote Sensing of Environment, 86(3), 322 - 340
Codjoe, S.N.A., (2004). Population and land use/cover dynamics in the Volta River Basin of Ghana, 1960-2010, Ecology and Development Series No. 15, Cuvillier Verlag, Gottingen
Congalton, R. G., Oderwald, R. G., & Mead, R. A., 1983. Assessing Landsat classi accuracy using discrete multivariate analysis statistical techniques. Photogrammetric Engineering and Remote Sensing, 49, 1671-1678.
Congalton, R.G., & Green K., (2009). Assessing the Accuracy of Remotely Sensed Data: Principles and Practices. CRC Press Taylor & Francis Group, Boca Raton, FL
Congalton, R.G., (1991). A review of assessing the accuracy of classifications of remotely sensed data. Remote Sensing of Environment, 37 (1), 35-46.
Desai C.G, Patil M.B, Mahale V.D., & Umrikar, B., (2009). Application of remote sensing and geographic information system to study land use/land cover changes: a case study of Pune Metropolis, Advances in Computational Research, 1, 10 – 13.
Di Gregorio, A., & Jansen, L.J.M., (1997). A new concept for a land cover classification system, in Proceedings of the Earth Observation and Environmental Information 1997 Conference, held at Alexandria, Egypt, from 13-16 October, 1997
Duda, R.O., Hart, P.E., Stork, D.G., (2000). Pattern Classification, A Wiley-Interscience Publication, Second Edition, ISBN 9814-12-602-0.
Gillies, R.R., Box, J.B., Symanzik, J., Rodemaker, E.J., (2003). Effects of urbanization on the aquatic fauna of the Line Greek Watershed, Atlanta – a satellite perspective, Remote Sensing of the Environment, 86(3), 411 – 412
Girardet, H. (1996). The Gaia Atlas of Cities: new directions for sustainable urban living, Gaia Books Limited, London. 1st Edition, ISBN: 1856750973.
Global Land Cover Facility (http://www.glcf.umd.edu/index.shtml). Accessed on 10th January 2013.
Grimm, N.B., Grove, J.M., Pickett, S.T.A. and Redman, C.L. (2000). Integrated approach to long-term studies of urban ecological systems, BioScience, 50(7), 571 – 584
Gustafson, E.J., (1998). Quantifying landscape spatial pattern: what is the state of the art?, Ecosystems, 1, 143–156.
Herold, M., Goldstein, N., C., Clarke, K., C., (2003). The spatiotemporal form of urban growth: measurement, analysis and modeling. Remote Sensing of the Environment, 86, 286–302.
Jansen, L.J.M. & Di Gregorio, A., (1998). The problems with current land-cover classifications: development of a new approach, in Land-cover and land-use information systems for European Policy Needs, Office for the Official Publications of the European Communities, Luxembourg, 21 – 23

T.V. Ramachandra, H.A. Bharath, B. Beas – Urbanisation Pattern of Incipient Mega Region in India
99 - TeMA Journal of Land Use Mobility and Environment 1 (2014)
Ji, C.Y., Lin, P., Li, X., Liu, Q., Sun, D., & Wang, S., (2001). Monitoring urban expansion with remote sensing in China, International Journal of Remote Sensing, 22(8), 1441 – 1455
Kong, F., Yin, H., Nakagoshi, N., James, P., (2012). Simulating urban growth processes incorporating a potential model with spatial metrics, Ecological Indicators, 20, 82-91
Lata, K.M., Sankar Rao, C.H., Krishna Prasad, V., Badrinath, K.V.S., & Raghava Swamy, (2001). Measuring urban sprawl: a case study of Hyderabad, GIS Development, 5(12).
Lillesand T., Kiefer R., Chipman J. (2003). Remote sensing and image interpretation. Wiley, New York, Fifth edition.
Liu, J., Dietz, T., Carpenter, S.R., Alberti, M., Folke, C., Moran, E. & Taylor, W.W., (2007). Complexity of coupled human and natural systems, Science, 317(5844), 1513 – 1516.
Lopez, T. del M., Aide, T.M., & Thomlinson, J.R., (2001). Urban expansion and the loss of prime agricultural lands in Puerto Rico, Ambio, 30(1), 49-54
Keiner M. and Arley K., Transnational city networks for sustainability, Eur. Plann. Stud., 15 (2007), pp. 1368–1395
Martinuzzi, S., Gould, W.A., & Gonzalez O.M.R., (2007). Land development, land use, and urban sprawl in Puerto Rico integrating remote sensing and population census data, Landscape and Urban Planning, 79(3 – 4), 288-297
Massey, D. S., Arango, J., Hugo, G., Kouaouci, A., & Pellegrino, A., (1999). Worlds in Motion: Understanding International Migration at the End of the Millennium, Oxford university press, ISBN: 0199282765
McGarigal, K., & Marks, B. J., 1995. FRAGSTATS: spatial pattern analysis program for quantifying landscape structure. USDA Forest Service General Technical Report PNW-351.
Mitrakis, N.E., Topalogou, C.A., Alexandridis, T.K., Theocharis, J.B., & Zalidis, G.C., (2008). A novel self-organising neuro-fuzzy multi layered classifier for land cover classification of a VHR image. International Journal of Remote Sensing, 29, 4061
Molles, M., (2006). Ecology: Concepts and Applications, 4th ed. McGraw Hill, Boston, USA.
Pathan, S.K., Jothimani, P., Pendharkar, S.P. and Sampat Kumar, D., (1989). Urban land use mapping and zoning of Bombay Metropolitan Region using Remote Sensing data. J. Indian Soc. Remote Sensing, 17(3), 11-22.
Pathan, S.K., Shukla, V.K., Patel, R.G., Mehta, K, S., 1991. Urban land use mapping - A case study of Ahmedabad city and its environs. J Indian Soc Remote Sensing, 19(2), 95- 112.
Ramachandra, T.V., and Kumar, U., (2009). Geoinformatics for Urbanisation and Urban Sprawl pattern analysis, In Geoinformatics for natural resource management, Chapter 19, 235 – 272
Ramachandra, T.V., Bharath, A.H., & Durgappa, D.S., (2012a). Insights to urban dynamics through landscape spatial pattern analysis, Int. J Applied Earth Observation and Geoinformation, 18, 329-343
Ramachandra, T.V., Bharath, A.H., & Sreekantha, S., (2012b). Spatial Metrics based Landscape Structure and Dynamics Assessment for an emerging Indian Megalopolis, International Journal of Advanced Research in Artificial Intelligence, 1(1), 48-57.
Ramachandra, T.V., Bharath, H.A., & Vinay S., (2013). Comprehension of temporal land use dynamics in urbanising landscape., Proceedings of User Interaction Meet - 2013, Balanagar, Hyderabad, 21-22, February, 1-6.
Ramachandra, T.V., Bharath, H.A., (2012a). Spatio-Temporal Pattern of Landscape Dynamics in Shimoga, Tier II City, Karnataka State, India, International Journal of Emerging Technology and Advanced Engineering, 2(9), 563-570.
Ramachandra, T.V., Bharath, H.A., (2012d). Land Use Dynamics at Padubidri, Udupi District with the Implementation of Large Scale Thermal Power Project, International journal of Earth Sciences and Engineering, 5, 409-417.
Roth, M., Oke, T.R., & Emery, W.J., (1989). Satellite-derived Urban Heat Islands from Three Coastal Cities and the Utilization of Such Data in Urban Climatology, International Journal of Remote Sensing, 10(11), 1699 – 1720
Sudhira, H.S., Ramachandra, T.V., & Jagadish, K.S. (2003). Urban growth analysis using spatial and temporal data, Journal of the Indian Society of Remote Sensing, 31(4), 299 – 311
Sudhira, H.S., Ramachandra, T.V., & Jagadish, K.S., (2004). Urban sprawl: metrics, dynamics and modeling using GIS, International Journal of Applied Earth Observation and Geoinformation, 5(1), 29 – 39
T.V. Ramachandra, H.A. Bharath, B. Beas – Urbanisation Pattern of Incipient Mega Region in India
100 - TeMA Journal of Land Use Mobility and Environment 1 (2014)
Sutton, P.C., (2003). A scale adjusted measure of “Urban sprawl” using nighttime satellite imagery, Remote Sensing of Environment, 86(3), 353 - 369
Taubenbock, H., Wegmann, M., Roth, A., Mehl, H., & Dech, S., (2009). Urbanization in India: Spatiotemporal analysis using remote sensing data. Computers, Environment and Urban Systems, 33(3), 179–188.
Uuemaa, E., Antrop, M., Roosaare, J., Marja, R., Mander, U., (2009). Landscape metrics and indices: an overview of their use in landscape research. Landsc. Res. 3, 1–28
Verzosa, L.C.O. and Gonzalez, R.M. (2007). Remote sensing, geographic information systems and Shannon’s entropy: measuring urban sprawl in a mountainous environment, In: Wagner W., Szekely, B. (eds.): ISPRS TC VII Symposium – 100 Years ISPRS, Vienna, Austria, July 5–7, 2010, IAPRS, Vol. XXXVIII, Part 7A. Available at http://www.isprs.org/proceedings/xxxviii/part7/a/pdf/269_XXXVIII-part7A.pdf. Accessed on 1st Aug 2013.
Vinay, S., Bharath, H.A., Ramachandra, T.V., (2012). Spatio-temporal dynamics of Raichur City, LAKE 2012: National Conference on Conservation and Management of Wetland Ecosystems, 6-9th November 2012, School of Environmental Sciences Mahatma Gandhi University, Kottayam, Kerala.
Voogt, J.A., & Oke, T.R., (2003). Thermal Remote Sensing of Urban Areas, Remote Sensing of the Environment, 86, 370 – 384
World Urbanization Prospects revised, 2011. United nation department of socioeconomic affairs. Available at http://esa.un.org/unup. Last accessed on 04th Aug 2013.
Xiao, J., Shen, Y., Ge, J., Tateishi, R., Tang, C., Liang, Y., & Huang, Z., (2006). Evaluating urban expansion and land use change in Shijiazhuang, China, by using GIS and remote sensing, Landscape and Urban Planning, 75(1), 69 – 80
Yang, L., Xian, G., Klaver, J.M., & Deal, B., (2003). Urban land-cover change detection through sub-pixel imperviousness mapping using remotely sensed data, Photogrammetric Engineering and Remote Sensing, 69(9), 1003-1010.
Yeh, A.G.O., & Li. X., (1999). Economic development and agricultural land loss in the Pearl River Delta, China, Habitat International, 23(3), 373 – 390.
Yeh, A.G.O., & Li. X., (2001). Measurement and monitoring of urban sprawl in a rapidly growing region using entropy, Photogrammetric Engineering and Remote Sensing, 67(1), 83-90
AUTHOR’S PROFILE
Ramachandra T V
Dr. Ramachandra T V has Ph.D. in energy and environment from Indian Institute of Science. At present, Coordinator of Energy and Wetlands Research Group (EWRG), Convener of Environmental Information System (ENVIS) at Centre for Ecological Sciences (CES), Indian Institute of Science (IISc). He has made significant contributions in the area of energy and environment. His research area includes wetlands, conservation, restoration and management of ecosystems, environmental management, GIS, remote sensing, regional planning and decision support systems. During the past ten years he has established an active school of research in the area of energy and environment. He teaches principles of remote sensing, digital image processing and Natural resources management. He has published over 206 research papers in reputed peer reviewed international and national journals, 178 papers in the international and national symposiums as well as 14 books. In addition, he has delivered a number of plenary lectures at national and international conferences. He is a fellow of Institution of Engineers (India), IEE (UK), Senior member, IEEE (USA) and many similar institutions. Details of his research and copies of publications are available at http://ces.iisc.ernet.in/energy/, http://ces.iisc.ernet.in/grass
Bharath H Aithal
Bharath H Aithal, Electrical and Electronics Engineering graduate from Bangalore University. Currently, he is pursuing Ph.D at Indian Institute of Science. His area of interest are spatial pattern analysis, Urban growth modelling, natural disasters, geoinformatics, landscape modelling urban planning, open source GIS, digital image processing. He is a Graduate student member of the IEEE
Beas Barik M
Beas Barik M Tech at Symbiosis Institute of Geoinformatics, Pune. Her area of interest are spatial pattern analysis, geoinformatics, open source GIS, digital image processing.


