ELSEVIER Chemical Geology 135 (1997) 275-290 ,hvx”DIflG ISOTOPEGEOSCIENCE Temperature- and pH-dependence of albite dissolution rate at acid PH Yang Chen *, Susan L. Brantley Deparhnent of Geosciences, The Pennsylvania State University, University Park, PA 16802, USA Received 7 August 1995; accepted 21 August 1996 Abstract Albite dissolution experiments performed in solutions at pH below neutral at S’, 50” and 90°C combined with results from the literature for albite dissolution at other temperatures show that the pH- and temperature-dependence of dissolution can be modeled using the following equation for highly unsaturated (far-from-equilibrium) conditions: logr = -2.71 - 3410/T - OSpH where r is the dissolution rate in mol albite cm-’ s-l; and 7’is temperature in K. The above equation is valid between pH 1 and 5 and temperatures from 5” to 300°C. The activation energy of dissolution for albite for this temperature and pH range is 15.6 f 0.8 kcal mol-‘. However, in addition to pH, other species in solution also affect the feldspar dissolution rate: these variations may be modeled as a AC-effect or an ion-specific adsorption effect. Because our measurements were all completed for values of IAGI > 11 kcal mol-‘, where the affinity effect should be small (assuming a linear model), we used an ion inhibition model to describe our data. Assuming feldspar dissolution is controlled by competitive adsorption of hydrogen and aluminum on the feldspar surface, ‘we use a Langmuir competitive adsorption model to fit the data: r = k’[ K,{H+}/(l + K,{H+} + K,,(Al”+})]“* where k’ is the apparent rate constant (mol cm-* s-l); K, is the proton adsorption equilibrium constant; K,, is the Al adsorption equilibrium constant; and (H’} and {A13’} are activities of H+ and A13+ in solution, respectively. The temperature-dependent parameters (k’ , K,, KA,) are modeled using the Arrhenius and van’t Hoff equations. The values of AH are assumed equal to 8 and - 8 kcal mol- ’for A13’ and Hf, respectively. A value of 1O-o.97 is used for K, at 25°C. The values of k’ and K,, at 25°C have been determined by non-linear curve fitting to be 1.7 X lo-l4 mol cm-* s-’ and 2.0 X 10³, respectively. The adsorption model fits the experimental data more closely than the simpler rate model, indicating that the model is consistent with the observed pH-, Al- and temperature-dependence of feldspar dissolution between 5” and 300°C. More data are needed to evaluate competitive effects of Nat or other ions, or the effect of AG for near-equilibrium solutions. This model emphasizes that the effect of inhibition by adsorbed cations should be greater at higher temperature ( > 5O”C), due to the positive value of the adsorption enthalpy of cation adsorption on oxide surfaces. Keywords: Activation energy; Albite; Dissolution; Rates * Corresponding author. 0009-2541/97/$17.00 Copyright 0 1997 Elsevier Science B.V. All rights reserved. PII SOOO9-2541(96)00126-X
Transcript
ELSEVIER Chemical Geology 135 (1997) 275-290
,hvx”DIflG
ISOTOPEGEOSCIENCE
Temperature- and pH-dependence of albite dissolution rate at acid PH
Yang Chen *, Susan L. Brantley Deparhnent of Geosciences, The Pennsylvania State University, University Park, PA 16802, USA
Received 7 August 1995; accepted 21 August 1996
Abstract
Albite dissolution experiments performed in solutions at pH below neutral at S’, 50” and 90°C combined with results from the literature for albite dissolution at other temperatures show that the pH- and temperature-dependence of dissolution can be modeled using the following equation for highly unsaturated (far-from-equilibrium) conditions: logr = -2.71 - 3410/T - OSpH where r is the dissolution rate in mol albite cm-’ s-l; and 7’ is temperature in K. The above equation is valid between pH 1 and 5 and temperatures from 5” to 300°C. The activation energy of dissolution for albite for this temperature and pH range is 15.6 f 0.8 kcal mol-‘.
However, in addition to pH, other species in solution also affect the feldspar dissolution rate: these variations may be modeled as a AC-effect or an ion-specific adsorption effect. Because our measurements were all completed for values of IAGI > 11 kcal mol-‘, where the affinity effect should be small (assuming a linear model), we used an ion inhibition model to describe our data. Assuming feldspar dissolution is controlled by competitive adsorption of hydrogen and aluminum on the feldspar surface, ‘we use a Langmuir competitive adsorption model to fit the data: r = k’[ K,{H+}/(l + K,{H+} + K,,(Al”+})]“* where k’ is the apparent rate constant (mol cm-* s-l); K, is the proton adsorption equilibrium constant; K,, is the Al adsorption equilibrium constant; and (H’} and {A13’} are activities of H+ and A13+ in solution, respectively. The temperature-dependent parameters (k’, K,, KA,) are modeled using the Arrhenius and van’t Hoff equations. The values of AH are assumed equal to 8 and - 8 kcal mol- ’ for A13’ and Hf, respectively. A value of 1O-o.97 is used for K, at 25°C. The values of k’ and K,, at 25°C have been determined by non-linear curve fitting to be 1.7 X lo-l4 mol cm-* s-’ and 2.0 X 10³, respectively.
The adsorption model fits the experimental data more closely than the simpler rate model, indicating that the model is consistent with the observed pH-, Al- and temperature-dependence of feldspar dissolution between 5” and 300°C. More data are needed to evaluate competitive effects of Nat or other ions, or the effect of AG for near-equilibrium solutions. This model emphasizes that the effect of inhibition by adsorbed cations should be greater at higher temperature ( > 5O”C), due to the positive value of the adsorption enthalpy of cation adsorption on oxide surfaces.
0009-2541/97/$17.00 Copyright 0 1997 Elsevier Science B.V. All rights reserved. PII SOOO9-2541(96)00126-X
276 Y. Chen, XL. Brantlq/Chemical Geology 13.5 (19971275-290
1. Introduction
1.1. pH-dependence of mineral dissolution
The quantitative prediction of the rates of natural mineral-solution interactions is important in under- standing issues such as the chemical susceptibility of landscapes to acid deposition, release of nutrients from soils, the distribution of porosity and perme- ability in hydrocarbon reservoir rocks, as well as the evaluation of the long-term global carbon cycle (White and Brantley, 1995, and references therein). Many workers have noticed that mineral dissolution rates are strongly pH-dependent (e.g., Lasaga, 198 la; Helgeson et al., 1984). In its simplest form, the pH-dependence of dissolution reactions over a given pH range has been expressed as:
r=k{H+}” (1)
where k is the rate constant (mol cm-* s-‘1; {H+j is the activity of H+ in solution; and n is an empirical constant.
Fundamental understanding of the controls behind such an empirical rate model may rely upon elucida- tion of surface protonation models for mineral-water interfaces. Stumm and Furrer (1987) suggested that adsorption of protons on an oxide surface may ex- plain the pH-dependence of dissolution rates. Ac- cording to the Schindler model for oxide surface adsorption (Schindler, 1981), metal oxides are cov- ered with surface hydroxyl groups when exposed to water molecules. Surface reactions can be written as follows:
=SO-+H+ + =SOH (2)
=SOH+H+ G= =SOH; (3)
where = SOHi, = SOH, and = SO- represent the positively charged, neutral, and negatively charged surface complexes, respectively. Using this model, the dissolution rate, r, in acidic solutions can be related to surface speciation:
r=k[=SOHi]m (4)
Here, [ = SOHT] represents the concentration of pro- tonated surface sites on the mineral surface, and m is a constant.
Combining concepts of surface coordination chemistry with established models of lattice statistics
and activated complex theory, Wieland et al. (1988) extended these surface protonation models and pro- posed a rate law for the acid- and ligand-promoted dissolution of simple oxides:
r = kx, PjS (5)
where k stands for the appropriate rate constant; x, denotes the mole fraction of dissolution active sites; Pj represents the probability of a precursor complex; and S is the surface concentration of sites.
1.2. pH-dependence of feldspar dissolution
Chou and Wollast (1984) measured the rate of albite dissolution and showed that n (Eq. (1)) equals N 0.5. Blum and Lasaga (1988, 1991) performed dissolution and titration experiments for albite and found that both the dissolution rate and surface charge under acid conditions were proportional to {H+}“.5. They proposed that for albite at 25”C, n = 0.5 in Eq. (I), and that the dissolution rate was directly proportional to the concentration of the sur- face charge (m = 1 for Eq. (4)). However, the pre- diction of m = 1 contradicts Schott (1990) who sug- gested that m corresponds to the oxidation number of the central metal ion in the crystalline lattice, and that m = 3 for albite. This latter idea, that m corre- lates with the metal oxidation state, was first pro- posed by Stumm and coworkers (Furrer and Stumm, 1986; Zinder et al., 1986). Other values of m were proposed by other workers: e.g., Amrhein and Suarez (1988) suggested that m equals 4 for anorthite; Oxburgh et al. (1994) proposed that m equals 0.46, 1.2, and 2 for oligoclase, andesine, and bytownite, respectively, for pH < 5. These workers assumed only one type of site on the feldspar surface. Much of this work on feldspar dissolution has been re- cently reviewed by Blum and Stillings (1995).
1.3. Temperature effect on pH-dependence
Results from H+ and OH- adsorption experi- ments performed on simple oxides show that for oxides, the proton adsorption enthalpies are exother- mic, and that the pHpznpc decreases as temperature increases (Machesky, 1989; Brady and Walther, 1992). Here pHpznpc stands for pH of the point of zero net proton charge, or the pH at which the
Y. Chen, S.L. Brantley/Chemical Geology 13.5 (1997) 275-290 277
concentration of positively charged surface sites equals the concentration of negatively charged sur- face sites of the .mineral in the presence of no specifically adsorbeld cations or anions. These exper- iments show that, at constant pH, increased tempera- ture leads to increased cation adsorption and de- creased anion adsa’rption. As a result, Brady and Walther (1992) suggested that as temperature in- creases, the dissolution rates of minerals will become more pH-dependent. A similar increase in pH-depen- dence was also predicted by Casey and Sposito (1992) for dissolution of an oxide at pH values below the pHpznpc.
Investigations of feldspar hydration have also re- vealed that hydrogen ions penetrate into the surface when feldspars are leached in solutions at pH below neutral, and that the hydration may increase with increasing temperature and decreasing pH (Casey et al., 1988, 1989; Petit et al., 1990). Therefore, more protonated sites in .the surface layer may be created as a result of hydration at higher temperature due to protonation deep w:ithin the hydrated layer. Such an increase in protonation could suggest that an in- creased pH effect might be observed at higher tem- perature.
However, controversy exists concerning the tem- perature effect on the pH-dependence of dissolution of aluminosilicates. Carroll-Webb and Walther (1990) found that l.he kaolinite dissolution rate be- came more pH-dependent at higher temperature. In contrast, recent work by Ganor et al. (1995) con- cluded that kaolinite dissolution rate does not be- come more pH-dependent at higher temperature. Hellmann (1994), based on his experiments of albite dissolution at temperatures of loo”, 200” and 3OO”C, found that the absolute value of n of Eq. (1) in- creased from 0.2 to 0.6 as the temperature increased from 100” to 300°C. However, results of Chou and Wollast (1984) for albite dissolved at 25°C show that iz equals 0.5 for experiments below pH 5. Knauss and Wolery (1986) Iclaimed that the absolute value of n for albite dissolution equals I for 1 < pH < 3, and that n is 0 for 3 < pH < 8 at 70°C.
1.4. Effect of AG and cations on dissolution
Other species in solution may also promote or inhibit feldspar diss,olution (e.g., Chou and Wollast,
1985; Schweda, 1990; Oelkers et al., 1994). Several alternative models have therefore been proposed to account for the contribution from other species to the dissolution rate. To account for the decrease in net dissolution due to the precipitation rate (the back- ward reaction), Eq. (1) is often rewritten to explicitly include AG, the Gibbs free energy of dissolution (Aagaard and Helgeson, 1977; Lasaga, 1981b):
r = k{ H+}“[ 1 - exp( AG/RT)] (6)
where R is the gas constant; T is the temperature in K; and AG is the Gibbs free energy (kcal mol- ’ ) of the overall reaction. For example, for albite dissolu- tion, we can define AG:
NaAlSi,O, + 4H++ 4H,O
+ Na++ A13++ 3H,SiO, (7)
AG = RT ln( Q/K,,) (8)
where Q is the reaction activity quotient; and K,, is the equilibrium constant at the specified temperature and pressure. Eq. (6) suggests that at constant tem- perature, when the AG value is very large and negative, dissolution rate will be independent of AG.
Burch et al. (1993) suggested that albite dissolu- tion rate is only dependent on concentration of Na+, A13+, and H,Si04 through the free energy term. They proposed that albite dissolution rate can be written as follows:
r=k,[l -exp{-~z((AGI/RT)‘~‘}] +
k,[l -exp{ -(lAGI/RT)}]m2 (9) where k, and k, are rate constants (mol cmp2 s- ’ ); and n, m, and m2 are fitting parameters. This rate equation was proposed for 80°C dissolution near pH 8.8.
Oelkers et al. (1994) and Schott and Oelkers (1995) found that the rate of albite dissolution is dependent on both H+ and A13+ concentration in solution and upon AG at 150°C and pH 9, and suggested that dissolution rate could be modeled using the equation:
r= k [ (ag+/al;p+)nak,
i I {l + K(ap+/ai,,+)
X y 4, [ 1 - ew( -A/nsiRT)] ( 10)
278 Y. Chen, XL. Brantley/Chemical Geology 135 (1997) 275-290
where n refers to the number of Al ions in each potential surface precursor site; uA, stands for activ- ity of the ith aqueous species involved in the forma- tion of the precursor; ui represents the stoichiometric coefficient; aSi signifies the stoichiometric number of moles of Si in one mole of dissolving aluminosili- cate; K designates the equilibrium constant of the reaction describing formation of the precursor com- plex (involving exchange of Al and H on the mineral surface); and A is the affinity (= - AG). They assumed that the precursor consists of a silica-rich, Al-deficient surface species.
Brantley and Stillings (1996) proposed that feldspar dissolution in acidic solution far-from-equi- librium is related to competitive adsorption of HC and other cations on the surface of feldspar. They derived a rate equation based on a leached layer and Langmuir linear adsorption model, as given by:
r=k’ K,{H+)/(l +KH(Hf}
+ C&v&@+ )j]“’ i
(11)
where k’ is the apparent rate constant; Mf+ refers to adsorbing cations (i.e. A13+); and K, and K, refer to the equilibrium constants for adsorption of H+ and MF+ on the = SiOAl = surface site respec- tively. These constants are defined in the following equations:
(=SiOAl=)‘-+H+ $ (=SiOAl=)H’-‘;
K, = [( = SiOAl =)Hi-C]
/([=SiOAl=“-](H+}) (12)
(E SiOAl s)‘- + Mb+ Z$ ( z SiOAl ,)MbPC;
K, = [( = SiOAl =)Mb-c]
/([ = SiOAl = ‘-]{Mb+}) (13)
where = SiOAl = denotes a surface bridging oxy- gen between Si and Al. [Note that in Brantley and Stillings (1996) these reactions were not correctly charge balanced.]
1.5. Activation energy for dissolution
Several values for the activation energy of albite dissolved in acid solution have been proposed in the
literature, varying from as low as 4.1 (Rose, 1991), to an intermediate value of 9.1 (Helgeson et al., 19841, to as high as 28.5 kcal mall ’ (Knauss and Wolery, 1986). Blum and Stillings (1995) recently reviewed the published literature for albite dissolu- tion and concluded, based upon all available data, that the activation energy for albite dissolution equals 14.3 kcal mol-‘.
It is not clear whether the different values for both the estimated pH-dependence of feldspar dissolution rates and the activation energy of dissolution are indicative of the change of dissolution mechanisms at different temperatures, or are simply caused by the experimental uncertainties, such as errors in estimat- ing the surface area, errors in analyzing water sam- ples of very low solute concentrations, or the uncer- tainty of attainment of true steady state.
In this study, we have completed a series of experiments on albite dissolution at acid pH at tem- peratures of 5”, 50” and 90°C. The objectives were: (1) to extend the existing data base of albite dissolu- tion to 5”; (2) to test the prediction of an increased pH-dependence at high temperatures for albite disso- lution; (3) to determine the activation energy of dissolution for a wide range of pH and temperature conditions; and (4) to develop a rate equation for albite dissolution far-from-equilibrium in acid pH solutions.
2. Methods
2.1. Materials
Amelia albite purchased from Ward’s Natural Sci- ence, Inc. was used. The results of microprobe anal- ysis of the albite (Table 11 are very similar to those used by other workers for their experiments. Coarse crystals of albite were crushed with a hammer and
Y. Chen, XL. Brantley/Chemical Geology 135 (1997) 275-290 219
hand-picked to avoid impurities such as quartz and muscovite. The hand-picked albite was dry ground in an agate mortar, and sieved to 100-200 mesh (corre- sponding to the 150-75Km size fraction). This size-fractioned albite was then ultrasonically cleaned using ultrapure acetone to remove fine particles at- tached to the surface of large grains. This material was further treated with heavy liquid (bromoform) to remove any impurities with different specific gravi- ties. Prior to the dissolution experiments, the albite grains were thoroughly washed ultrasonically with acetone and heated in an oven at 105°C for over a month.
2.2. Experimental design
Dissolution experiments were performed using two kinds of continuously stirred flow-through reac- tion vessels (Fig. 1). The first type of reactor consists of a standard titanium autoclave (175 and 300-ml volume), either installed in an electrical oven or submerged in a water bath to maintain experiments at 90” f 1°C. Each reactor was continuously rotated to facilitate stirring. Fluid flow rate and pressure were maintained by syringe pumps (Harvard Appara- tus Inc. models 44 and 22) and back pressure regula- tors (Scientific Systems Inc. model 06-0120). The other type of reactor (described in Stillings, 1994; Stillings and Brantley, 1995) consisted of stirred
Pressure
Back Pressure
Sample Collector
\ / Reservoir P;f;(P
Fig. 1. Schematic of the continuously-stirred flow-through reac- tion system.
Nuclepore (or modified Nuclepore) cells fabricated from polycarbonate and Teflon, which were sub- merged in a water bath. The flow rates were main- tained by peristaltic pumps (Ismatec Reglo 100) and temperature was maintained at 25” + 0.5” or 5” + 0.5”C.
2.3. Solutions and chemical analysis
To avoid the formation of surface or solution complexes which might affect the dissolution of albite, no buffer solutions were used in this study. HCl solutions with various pH values were made using ultrapure HCl and distilled and deionized wa- ter.
The output solutions were collected continuously. pH values of solutions were measured using an Orion EA 940 pH meter with a Orion Ross combina- tion pH electrode with an accuracy of f 0.02 pH unit at room temperature. Si, Al, and Na were analyzed with a PC3000 Leeman Labs ICP emission spec- trometer, or were analyzed with a Spectronic 601 spectrophotometer (heteropoly blue method for Si, see Greenberg et al., 1985; catechol violet method for Al, see Dougan and Wilson, 1974) for lower concentration solutions. Analytical uncertainties were estimated at f 2-5%.
2.4. Surface area measurements
Surface area of albite particles were measured by three-point Kr BET (Quantasorb Sorption System by Quantachrome Corp.) before and after the experi- ments with an estimated precision of f 10%. Mea- surements after dissolution were completed on pow- der which was removed from the cell, cleaned using distilled and deionized water, and dried at 105°C.
2.5. Experimental conditions
Albite dissolution experiments at temperatures of 90”, 50” and 5°C were run at various pH values. To get an idea about the sensitivity of dissolution rate to cation concentration, we changed the solution chem- istry in a few experiments by changing the flow rate or by artificially adding sodium, aluminum, or sili-
280 Y. Chen, S.L. Brantley/Chemical Geology 135 (19971275-290
con into the initial solution. Table 2 summarizes all of the experimental conditions.
3. Results
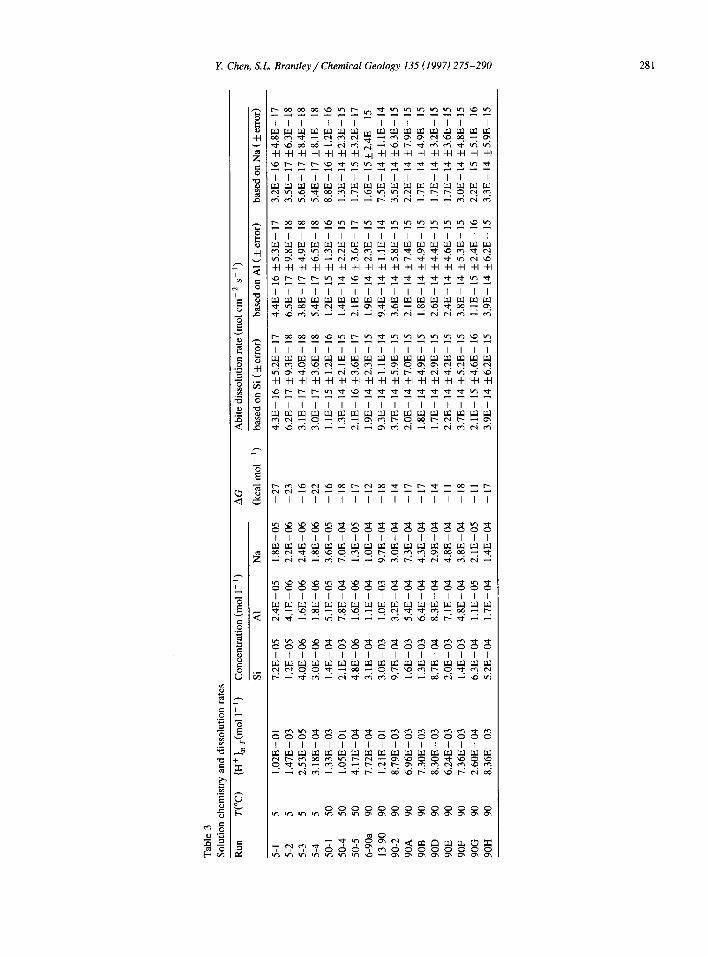
Dissolution was allowed to proceed until the con- centration of the effluent did not change with time within analytical uncertainty (within f 2-5%): reac- tion duration varied from 626 hr (90°C) to 6300 hr (5°C). Rate was determined by averaging the last 4-5 values of C X Q, where C is the concentration and Q the volumetric flow rate. The dissolution observed in all of the experiments was similar to that observed by many other workers: initially fast and non-stoichiometric dissolution, followed by a de- crease of dissolution rate, and eventual attainment of steady-state (and usually stoichiometric) dissolution after 600-2000 hr (90°C) to 4000-6000 hr (5” and 50°C). Steady-state dissolution was stoichiometric in Al and Si release (within propagated error) for all but a few cases, and was stoichiometric in Na release for most cases except those run at 5°C (Table 3). Lack of stoichiometry in some of the cases may indicate that the experiments did not fully attain steady state, even after the long run times.
Steady-state mineral dissolution rates in this study were calculated using the following equation:
ri = (Ci - Co) Q/( ‘vi) ( 14) where S refers to the final surface area of the mineral; Ci and C, are the output and input concen- trations, respectively, of the ith element in the solu- tion; Q is the volumetric flow rate; and u, is the stoichiometric coefficient of the ith element in the bulk mineral. Here, we have assumed that, when output concentration is constant, that surface area has also become constant, over the timescale of observa- tion (see Stillings and Brantley, 1995).
The chemistry of output solutions and the calcu- lated dissolution rates are listed in Table 3. Also included in Table 3 are AG values of Reaction (7) calculated using SOLMINEQ (Kbaraka et al., 1988).
4. Discussion
4.1. Temperature and pH-dependence of albite disso- lution rate
We observed that for most of the experiments, the Many workers have observed that feldspar disso- total surface area of the mineral increased with time lution rate is the lowest at near-neutral pH, and that
(Table 2). The greatest increase in surface area (fac- tor of 2) was observed for the experiments per- formed at lowest pH.
Tabl
e 3
Solu
tion
chem
istry
an
d di
ssol
utio
n ra
tes
Run
T(
“C)
(H+)
at
r(m
ol
I-‘)
C
once
ntra
tion
(mol
l-
‘)
AG
A
bite
di
ssol
utio
n ra
te (
mol
cm
- *
s-
’ )
Si
Al
Na
(kca
l m
ol-
’ )
base
d on
Si
( i-e
rror
) ba
sed
on A
l ( +
err
or)
base
d on
Na
( + e
rror
)
5-l
5 1.
02E-
01
7.2E
-05
2.4E
-
05
l.SE-
05
-27
4.3E
- 16
f5.
2E-
17
4.4E
- 16
+5.
3E-
17
3.2E
- 16
*4.
8E-
17
5-2
5 1.
47E
- 03
1.
2E-0
5 4.
1E-0
6 2.
2E-0
6 -2
3 6.
2E-
17 +
9.3E
- 18
6.
5E-
17 +
9.8E
- 18
3.
5E-
17 +
6.3E
- 18
5-
3 5
2.53
8 -
05
4.O
E -
06
1.6E
-06
2.4E
-06
-16
3.1E
- 17
+4.
OE-
18
3.
8E-
17 *
4.9E
- 18
5.
6E-
17 *
8.4E
- 18
5-
4 5
3.18
E-04
3.
OE-
06
l.SE-
06
l.SE-
06
-22
3.O
E-
17 *
3.6E
- 18
5.
4E-
17 *
6.5E
- 18
5.
4E-
17 +
S.lE
- 18
50
-I
50
1.33
E - 03
1.
4E-0
4 5.
lE-0
5 3.
6E-0
5 -1
6 l.l
E-
15 +
1.2
E-
16
1.2E
- 15
f
1.3E
- 16
S.
SE-
16 +
1.2
E-
16
50-4
50
l.O
5E-0
1 2.
lE-0
3 7.
8E-0
4 7.
OE
- 04
-
18
1.3E
- 14
+2.
lE-
15
1.4E
- 14
*2.
2E-
15
1.3E
- 14
+2.
3E-
15
50-5
50
4.
17E-
04
4.8E
-06
1.6E
-06
1.3E
-05
- 17
2.
lE-
16 f
3.6E
- 17
2.
lE-
16 *
3.6E
- 17
1.
7E-
15 +
3.2E
- 17
6-
90a
90
7.72
E-04
3.
lE-0
4 l.l
E-04
l.O
E-04
-
12
1.9E
- 14
+2.
3E-
15
1.9E
-14
t2.3
E-
15
1.6E
- 15
+2.4
E-
15
13-9
0 90
1.
2lE-
01
3.O
E-03
l.O
E-03
9.
7E -
04
-18
9.3E
- 14
+ l
.lE-
14
9.4E
- 14
* l
.lE-
14
7.5E
- 14
f
l.lE-
14
90
-2
90
8.79
E -
03
9.7E
-
04
3.2E
-04
3.O
E-04
-
14
3.7E
- 14
+5.
9E-
15
3.6E
- 14
+5.
8E-
15
3.5E
- 14
&6.
3E-
15
90A
90
6.
96E
- 03
1.
6E-0
3 5.
4E-0
4 7.
38-0
4 -1
7 2.
OE-
14
+7.
OE-
15
2.
lE-
14 +
7.4E
- 15
2.
2E-
14 +
7.9E
- 15
90
B
90
7.30
E -
03
1.3E
-03
6.4E
-
04
4.3E
-04
- 17
l.S
E-
14 *
4.9E
- 15
l.S
E-
14 +
4.9E
- 15
1.
7E-
14 *
4.9E
- 15
90
D
90
8.30
E -
03
8.7E
-04
8.3E
-04
2.9E
-04
- 14
1.
7E-
14 *
2.9E
- 15
2.
6E-
14 +
4.4E
- 15
1.
7E-1
4 +3
.2E-
15
90E
90
6.24
E -
03
2.O
E -
03
7.lE
-04
4.8E
-04
-II
2.2E
- 14
+4.
2E-
15
2.4E
- 14
+4.
6E-
15
1.7E
-14
&3.
6E-1
5 90
F 90
7.
36E-
03
l.SE-
03
4.8E
-04
3.8E
-04
-18
3.7E
- 14
+5.
2E-
15
3.8E
- 14
+.5
.3E-
15
3.
OE-
14
*4.
8E-
15
9OG
90
2.
60E-
04
6.3E
-04
l.lE-
05
2.lE
-05
-11
2.1E
- 15
&4.
6E-
16
l.lE-
15
+2.
4E-
16
2.2E
- 15
f5.
lE-
16
90H
90
8.
36E-
03
5.2E
-04
1.7E
-04
1.4E
-04
- 17
3.
9E-
14 *
6.2E
- 15
3.
9E-
14 +
6.2E
- 15
3.
3E-
14 +
5.9E
- 15
282 Y. Chen, S.L. Brantley/ Chemical Geology 135 (1997) 275-290
-l.sI , , < , , , , , 1 0 1 2 3 4 5
PH
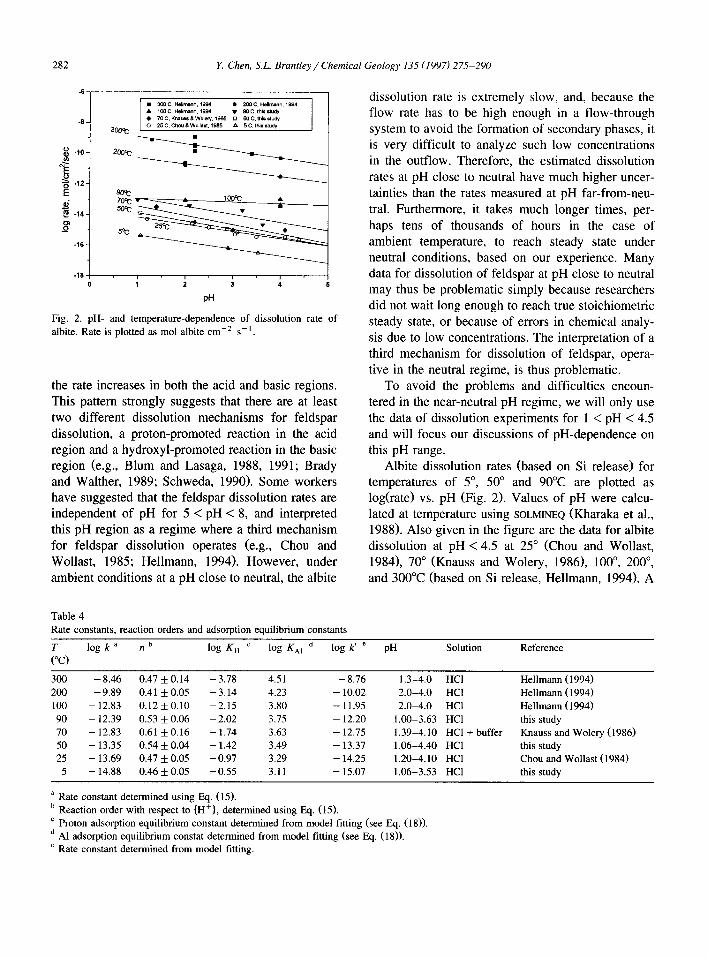
Fig. 2. pH- and temperature-dependence of dissolution rate of albite. Rate is plotted as mol albite cm-’ s- ’
the rate increases in both the acid and basic regions. This pattern strongly suggests that there are at least two different dissolution mechanisms for feldspar dissolution, a proton-promoted reaction in the acid region and a hydroxyl-promoted reaction in the basic region (e.g., Blum and Lasaga, 1988, 1991; Brady and Walther, 1989; Schweda, 1990). Some workers have suggested that the feldspar dissolution rates are independent of pH for 5 < pH < 8, and interpreted this pH region as a regime where a third mechanism for feldspar dissolution operates (e.g., Chou and Wollast, 1985; Hellmann, 1994). However, under ambient conditions at a pH close to neutral, the albite
dissolution rate is extremely slow, and, because the flow rate has to be high enough in a flow-through system to avoid the formation of secondary phases, it is very difficult to analyze such low concentrations in the outflow. Therefore, the estimated dissolution rates at pH close to neutral have much higher uncer- tainties than the rates measured at pH far-from-neu- tral. Furthermore, it takes much longer times, per- haps tens of thousands of hours in the case of ambient temperature, to reach steady state under neutral conditions, based on our experience. Many data for dissolution of feldspar at pH close to neutral may thus be problematic simply because researchers did not wait long enough to reach true stoichiometric steady state, or because of errors in chemical analy- sis due to low concentrations. The interpretation of a third mechanism for dissolution of feldspar, opera- tive in the neutral regime, is thus problematic.
To avoid the problems and difficulties encoun- tered in the near-neutral pH regime, we will only use the data of dissolution experiments for 1 < pH < 4.5 and will focus our discussions of pH-dependence on this pH range.
Albite dissolution rates (based on Si release) for temperatures of 5”, 50” and 90°C are plotted as log(rate) vs. pH (Fig. 2). Values of pH were calcu- lated at temperature using SOLMINEQ (Kharaka et al., 1988). Also given in the figure are the data for albite dissolution at pH < 4.5 at 25” (Chou and Wollast, 1984) 70” (Knauss and Wolery, 1986) loo”, 200”, and 300°C (based on Si release, Hellmann, 1994). A
Table 4 Rate constants, reaction orders and adsorption equilibrium constants
;o log k a n b log K, c log &I d log k’ e pH Solution Reference
0.12 + 0.10 -2.15 3.80 -11.95 2.0-4.0 HCl Hellmann ( 1994) 0.53 5 0.06 - 2.02 3.75 - 12.20 1.00-3.63 HCl this study 0.61 f 0.16 - 1.74 3.63 - 12.75 1.39-4.10 HCl + buffer Knauss and Wolery (1986) 0.54 f 0.04 - 1.42 3.49 - 13.37 1.06-4.40 HCl this study
0.47 f 0.05 - 0.97 3.29 - 14.25 1.20-4.10 HCl Chou and Wollast (1984) 0.46 f 0.05 -0.55 3.11 - 15.07 1.06-3.53 HCl this study
a Rate constant determined using Eq. (15). b Reaction order with respect to {H+), determined using Eq. (15). ’ Proton adsorption equilibrium constant determined from model fitting (see Eq. (18)). d Al adsorption equilibrium constat determined from model fitting (see Eq. (18)). e Rate constant determined from model fitting.
Y. Chen, S.L. Branrley/Chemical Geology 135 (1997) 275-290 283
linear regression is drawn through the data for each temperature.
At each tempera.ture from 5” to 3OO”C, a linear trend is observed between pH 1 and 4.5. Except for the measurements at 100°C the regressions of log(rate) vs. pH at each temperature are parallel and the average slope equals - 0.5 within the error of the regression (Table 4). The measurements at 100°C are inconsistent with the rest of the measurements; how- ever, we note that they are based on experiments at just two pH values.
This compilation suggests that, when temperature increases, albite dissolution does not become more pH-dependent. This conclusion is not in agreement with conclusions or predictions of Brady and Walther (1992) and Hellmann (1994).
4.2. Empirical rate law of albite dissolution
Taking the logarithm of both sides of Eq. (1) yields:
log r = log k + n log{ H’ } (15)
Thus, the rate constant k and the value of n can be estimated by plotting log r against pH. Calculated values of k and n are listed in Table 4.
The temperature-dependence of the dissolution constant can be expressed using the Arrhenius equa- tion (Laidler, 1987):
k = A exp( - E,/RT) (16)
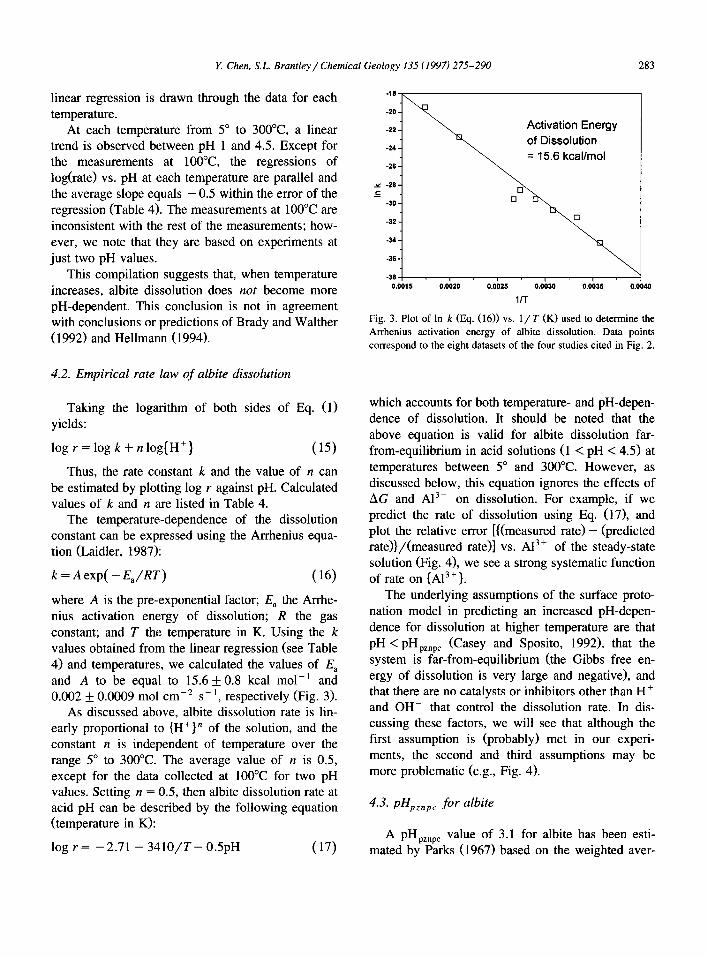
where A is the pre-exponential factor; E, the Arrhe- nius activation energy of dissolution; R the gas constant; and T the temperature in K. Using the k values obtained from the linear regression (see Table 4) and temperatures, we calculated the values of E, and A to be equal to 15.6 + 0.8 kcal mol-’ and 0.002 * 0.0009 mol cm-’ s- ‘, respectively (Fig. 3).
As discussed above, albite dissolution rate is lin- early proportional to {H+)” of the solution, and the constant n is independent of temperature over the range 5” to 300°C. The average value of 12 is 0.5, except for the data collected at 100°C for two pH values. Setting n = 0.5, then albite dissolution rate at acid pH can be described by the following equation (temperature in K):
log r = - 2.71 - 34.10/T - 0.5pH (17)
Activation Energy of Dissolution = 15.6 kcallmol
-36
\ -381 . , , , ,
0.0016 0.0020 0.0026 0.0030 0.0035 0.
Ill 40
Fig. 3. Plot of In k (IQ. (16)) vs. l/T (K) used to determine the Arrhenius activation energy of albite dissolution. Data points correspond to the eight datasets of the four studies cited in Fig. 2.
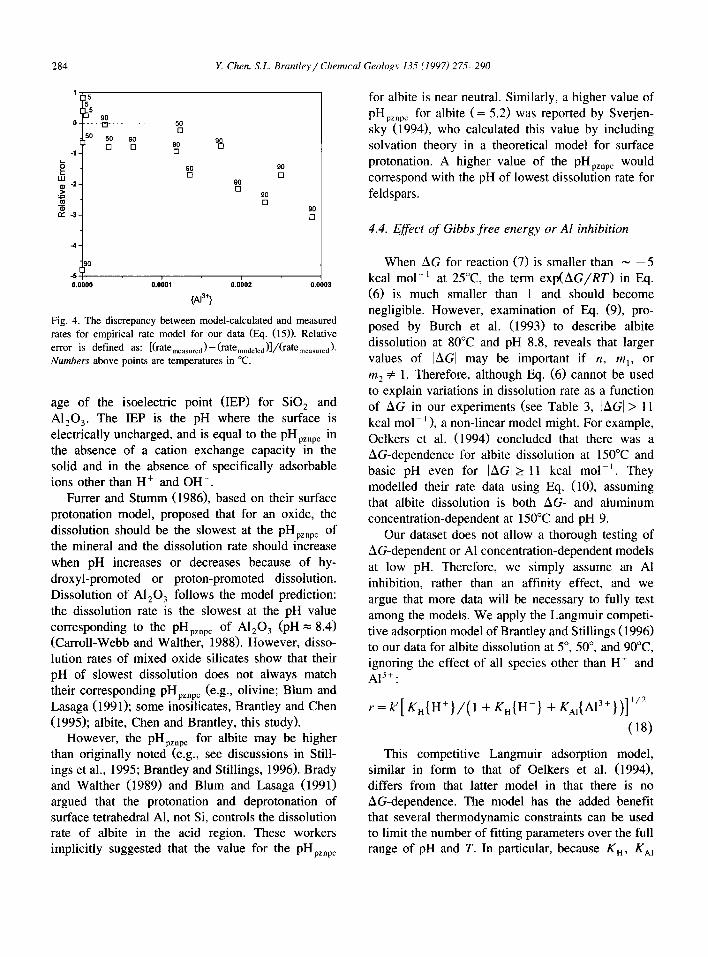
which accounts for both temperature- and pH-depen- dence of dissolution. It should be noted that the above equation is valid for albite dissolution far- from-equilibrium in acid solutions (1 < pH < 4.5) at temperatures between 5” and 300°C. However, as discussed below, this equation ignores the effects of AG and A13+ on dissolution. For example, if we predict the rate of dissolution using Eq. (171, and plot the relative error [{(measured rate> - (predicted rate))/(measured rate>] vs. A13+ of the steady-state solution (Fig. 4), we see a strong systematic function of rate on {A13’}.
The underlying assumptions of the surface proto- nation model in predicting an increased pH-depen- dence for dissolution at higher temperature are that
PH < PH pznpc (Casey and Sposito, 1992), that the system is far-from-equilibrium (the Gibbs free en- ergy of dissolution is very large and negative), and that there are no catalysts or inhibitors other than H+ and OH- that control the dissolution rate. In dis- cussing these factors, we will see that although the first assumption is (probably) met in our experi- ments, the second and third assumptions may be more problematic (e.g., Fig. 4).
4.3. pHpznpc for albite
A PHpznpc value of 3.1 for albite has been esti- mated by Parks (1967) based on the weighted aver-
284 Y. Chen, XL. Brantley/ Chemical Geology 135 (1997) 275-290
-4
4
i&o0 o.obo1 o.oboz o.oboa
{A13+}
Fig. 4. The discrepancy between model-calculated and measured rates for empirical rate model for our data (Eq. (15)). Relative error is defined as: [(rateWasured) - (ratemodeled)]/(ratemeasured). Numbers above points are temperatures in “C.
age of the isoelectric point (IEP) for SiO, and Al,O,. The IEP is the pH where the surface is electrically uncharged, and is equal to the pHpznpc in the absence of a cation exchange capacity in the solid and in the absence of specifically adsorbable ions other than H+ and OH-.
Furrer and Stumm (1986), based on their surface protonation model, proposed that for an oxide, the dissolution should be the slowest at the pHpznpc of the mineral and the dissolution rate should increase when pH increases or decreases because of hy- droxyl-promoted or proton-promoted dissolution. Dissolution of Al,O, follows the model prediction: the dissolution rate is the slowest at the pH value corresponding to the pHpznpc of Al,O, (pH = 8.4) (Carroll-Webb and Walther, 1988). However, disso- lution rates of mixed oxide silicates show that their pH of slowest dissolution does not always match their corresponding pHpznpc (e.g., olivine; Blum and Lasaga (1991); some inosilicates, Brantley and Chen (1995); albite, Chen and Brantley, this study).
However, the pHpznpc for albite may be higher than originally noted (e.g., see discussions in Still- ings et al., 1995; Brantley and Stillings, 1996). Brady and Walther (1989) and Blum and Lasaga (1991) argued that the protonation and deprotonation of surface tetrahedral Al, not Si, controls the dissolution rate of albite in the acid region. These workers implicitly suggested that the value for the pHpznpc
for albite is near neutral. Similarly, a higher value of
PH prnpc for albite (= 5.2) was reported by Svetjen- sky (19941, who calculated this value by including solvation theory in a theoretical model for surface protonation. A higher value of the pHpznpc would correspond with the pH of lowest dissolution rate for feldspars.
4.4. Effect of Gibbs free energy or Al inhibition
When AG for reaction (7) is smaller than - -5 kcal mol-’ at 25°C the term exp(AG/RT) in Eq. (6) is much smaller than 1 and should become negligible. However, examination of Eq. (9), pro- posed by Burch et al. (1993) to describe albite dissolution at 80°C and pH 8.8, reveals that larger values of IAGl may be important if n, m,, or m2 # 1. Therefore, although Eq. (6) cannot be used to explain variations in dissolution rate as a function of AG in our experiments (see Table 3, IAGI > 11 kcal mol- ’ ), a non-linear model might. For example, Oelkers et al. (1994) concluded that there was a AG-dependence for albite dissolution at 150°C and basic pH even for IAGI 2 11 kcal mol-‘. They modelled their rate data using Eq. (lo), assuming that albite dissolution is both AG- and aluminum concentration-dependent at 150°C and pH 9.
Our dataset does not allow a thorough testing of AG-dependent or Al concentration-dependent models at low pH. Therefore, we simply assume an Al inhibition, rather than an affinity effect, and we argue that more data will be necessary to fully test among the models. We apply the Langmuir competi- tive adsorption model of Brantley and Stillings (1996) to our data for albite dissolution at 5”, 50”, and 90°C ignoring the effect of all species other than H+ and A13+:
r = k’[ K,(H+}/(l + K,{H+) + K,,{A13+})]“*
(18)
This competitive Langmuir adsorption model, similar in form to that of Oelkers et al. (19941, differs from that latter model in that there is no AG-dependence. The model has the added benefit that several thermodynamic constraints can be used to limit the number of fitting parameters over the full range of pH and T. In particular, because K,, K,,
Y. Chen, XL. Brantley/Chemical Geology 135 (1997) 275-290 285
and k’ are assumed temperature-dependent, but pH- independent, we ca.n constrain these constants using the van’t Hoff and Arrhenius equations:
log( K,,/KH2) = AH,/2.303R( l/T, - l/T,)
(19)
log( G,,/G2) = ,sK,/2.303R(l/T, - l/T,)
(20)
k’ = k” exp( - E!JtZT) (21)
Here K,,, KH, and KA,,, K,.,,, are proton- and Al-adsorption equilibrium constants, respectively, at temperatures Tl and T,. k” is the pre-exponential factor of the appamnt dissolution rate constant, and AH,, AH,,, and 1;: are the adsorption enthalpies of the proton and Ai3-’ at the = SiOAl = site, and the apparent activation energy of reaction, respectively.
The value of K H (defined in Eq. (12)) at 25°C has been estimated by Brantley and Stillings (1996) using the MUSIC model as 10-“.97. Since there are no data available for enthalpies of proton and cation adsorption on feldspar, we assume that the enthalpies of adsorption on feldspar may be estimated from adsorption enthalpy data from simple oxides. Mach- esky (1989) found that the values of proton adsorp- tion enthalpies for oxides vary between - 12 to -4 kcal mol- ’ , and the values of cation adsorption enthalpies vary between 4 and 12 kcal mol- ‘. We take the average values of - 8 and 8 kcal mol- ’ for proton (AH, ) and aluminum (A HAI) adsorption en- thalpies, respectivel’y. We further assume that AH,, and AH, are constant over the temperature range between 5” and 90°C.
It should be noted that k’ in Eq. (18) is different from the rate constant k in Eq. (1) by a factor of K:5, assuming the denominator in Eq. (18) is close to 1. The activation energy El in Eq. (21) is there- fore different from. the activation energy that has been estimated in the previous section based on the experimental data. Assuming that k equals k’Kg5, the following relation is true:
Ei = E, - 0.5ln( K;,,/KH,,)R/( l/T, - l/T,)
(22)
Using the values of K, and AH, discussed above, the value of EL is constrained to equal 19.6 kcal
log k
Fig. 5. Comparison of rate constants determined from regression of rate vs. pH (k, IS+ (15) for each temperature as noted) with that determined from the Langmuir adsorption model (k’, Eq. (18)). The model fit for Eq. (18) used only data from 5”. 50”, and 90°C. The plotted line has a slope of unity.
mol-‘. Values of A13’ activities used in Eq. (18) were calculated using SOLMINEQ (Kharaka et al., 1988).
By model fitting the data at 5”, 50” and 90°C of this study, we obtained the following results: KA, (25°C) = 2.0 x 10³; k’ (25°C) = 1.7 X lo-l4 mol cm-’ s-l.
K,, K,, and k’ values at different temperatures have been calculated using Eqs. (19) and (20), and (211, respectively, and the results are listed in Table 4 with rate constants determined using Eq. (15). Comparison of the rate constant values obtained from the adsorption model fitting (based upon data at 5”, 50”, and 90°C) with those obtained from the empirical data regression (Eq. (15)) shows that val- ues at 25”, 70”, loo”, 200”, and 300°C are in good agreement, indicating that the competitive adsorption model can explain the observed pH- and tempera- ture-dependence of albite dissolution (Fig. 5).
Chou and Wollast (1985) reported that at 25°C the effect of Al inhibition is significant when Al concentration is low (< 10m5 mol l-‘> and that the inhibition decreases when Al concentration is higher (> 10m5 mol 1-l). In attempting to include their dataset showing an Al effect with our own in mod- elling the effect of Al, however, we were unable to simultaneously fit the large inhibitory effect they observed with the smaller effect we observed. We
286 Y. Chen, S.L. Brantley/Chemical Geology 135 (1997) 275-290
-10 I I
0 Data fmm Schindler & Stumm, 1997 ?? This study
-8 - 0
Mg”
Cd*+ -6 - 0
E +?+
d - PbZ+” ??
A?+
Fig. 6. Comparison of the model-predicted stability constant of Al adsorption to other cation adsorption data from the literature. Literature data from Schindler and Stumm (1987). Kyt is the intrinsic stability constant of surface adsorption and K,,, is the stability constant of hydroxo complexes in solution.
note that, in the Al inhibition experiments of Chou and Wollast (19851, dissolution was only continued for 544 hr (pH 3.5) to 1252 hr (pH 1.21, which, compared to our experiments (4000 hr at 5” or 50°C) suggests that steady-state dissolution was not reached. Therefore, we have elected to model only our own long-term Al data, but we anticipate that further research will be needed to fully constrain the effect of Al inhibition.
Several workers have found that there is a good relationship between the intrinsic stability constant (Kl”f) of the surface adsorption and the stability constant (K,,,) of hydroxo complexes in solution (e.g., Schindler and Stumm, 1987; Dzombak and Morel, 1990). Such a relationship can therefore be used to test whether our adsorption constant for Al is reasonable - although no data are available for feldspar adsorption constants, and adsorption on sil- ica must be analyzed instead. In Fig. 6 we plot log Kt”’ vs. log K,,, at 25°C from the data compiled by Schindler and Stumm (1987) for bi- and trivalent cation adsorption on the surface of amorphous silica, as well as the estimated value for Al adsorption from this study. The K, for Al plotted in Fig. 6 is defined as:
K,(A’) = KM/G (23)
where KA is the equilibrium constant of hydrogen adsorption on the = SO- surface, defined as [ = SOH]/([ = SO-]{H’}). The value of KA has been determined to be equal to 107.5 by Stillings (1994) using the MUSIC model for hydrogen adsorption on the = SiO- site of the feldspar surface. Using this value of Kf, , we calculated the value of log K ,(Al) to be equal to -4.2. Fig. 6 indicates that our estima- tion of Al adsorption is roughly compatible with other bi- and trivalent cations. It should be noted that the data are for adsorption of cations on amorphous silica, not on feldspar, because there are no data available for feldspar (or many other oxides). It should be noted as well that the value of K, which we calculate is the apparent stability constant ( Kapp) for surface adsorption, not the intrinsic constant (K int). Note the following relation:
Kapp = Ki”‘exp( -F!P/RT) (24) where F is the Faraday constant; !P is the surface potential; R is the gas constant; and T is temperature (Stumm and Morgan, 1981). For pH < pHpznpc, the surface potential ?P is positive in the absence of specifically adsorbed ions. Therefore, K int is ex- pected to be greater than 10m4.*, the value estimated for the apparent stability constant for Al adsorption.
To compare the fit of the Langmuir competitive
0.0000 0.000, 0.0002
{A13+}
Fig. 7. The discrepancy between model-calculated and measured rates for the Langmuir competitive adsorption model (Eq. (18)). Relative error is defined as: [(rate,,,,,,,,) - (rate modeled)I/(rate measured). Numbers above points are tempera- tures in “C.
Y. Chen, S.L. Brantley/Chemical Geology 135 (1997) 275-290 287
adsorption model with respect to the empirical rate equation (Eq. ( 15)), we calculate the relative error,
Results are plotted in Figs. 4 and 7. Comparison of Figs. 4 and 7 shows improvement of rate prediction when aluminum inhibition is considered. The major- ity of data are confined within the range of relative error = *OS. Note, however, that this relative error is still large. Although we have cited our propagated experimental error in Table 3, the precision of sur- face area measurements or errors in distinguishing true steady state may result in error on the order of f0.2 log unit, which is close to the relative error plotted in Fig. 7. Other researchers have concluded that error on the order of f0.2 log unit in dissolu- tion rate measurements for minerals is typical. For example, for measurements of inosilicate dissolution, Brantley and Chen (1995) summarize several work- ers who cite their experimental uncertainty as + 0.2- 0.25 log unit in rate.
4.5. Dependence of dissolution rate on {Al3 ‘1
Using the parameters obtained from the above model-fitting, we are able to estimate the {A13+}-de- pendence of dissolution rate at different temperatures assuming the Lan.gmuir competitive adsorption model. Using Eq. (18), we calculated the dissolution rates of albite at temperatures of 25”, 50”, 70” and 9O”C, assuming pH equals 4.5 (an arbitrary value). The model predictions are plotted on Fig. 8. Results show that with the assumed value of AHAl, alu- minum inhibition is not measurable at temperatures below 50°C according to this model. The model therefore implies tha.t under the conditions of surface weathering, aluminum may not inhibit the dissolu- tion of feldspar. The increased effect of Al inhibition with temperature at a given pH might explain the discrepancy between the work of Oelkers et al. (1994) at 150°C and that of Burch et al. (1993) at 80°C.
Based on the above model, the observed tempera- ture- and pH-dependence of dissolution rate can be explained as follows: the albite dissolution rate is proportional to the concentration of the positively
o.oow 0.000, 0.0002 0.0003 0.M
(Al"}
Fig. 8. The predicted effect of Al’+ adsorption on dissolution rate of albite at temperatures 25”, 50”, 70” and 90°C at pH 4.5. The plot shows that at temperatures below 50°C. aluminum inhibition is not important, according to the model, and the assumed values of the enthalpies of adsorption. Model parameters are set at: K,, 2ssc =O.ll, K,,. 2Jc =1.96X 10³, AH, = -8 kcal mol-‘, and AI&, = 8 kcal mol-‘.
protonated surface sites, which is a function of tem- perature and pH, as well as solution chemistry. Lower pH and a lower concentration of cations (other than H+) favor the formation of protonated surface sites. Because the increasing dissolution rate observed at higher temperature and lower pH also increases the concentrations of cations such as Al in laboratory experiments, and these cations compete for the same adsorption sites as H+, deconvolution of pH-depen- dence and cation inhibition may be more difficult at higher temperatures as compared to lower tempera- tures.
It should be noted that in the above Langmuir competitive adsorption model, only the effects of Hf and A13+ ions were considered. Evidence suggests that Na+ may also inhibit the dissolution of feldspar at high concentration of Na+ (see Table 3, and Stillings and Brantley, 1995). However, data from this study do not permit us to estimate the effect of Na+ on the dissolution rate, and we have limited the model to Al inhibition. Obviously, a much larger dataset is needed to quantitatively deconvolute the effects of pH, T, Na, Al, H,Si04, and AG on feldspar dissolution, and we have only included a preliminary attempt at modelling here.
288 Y. Chen, S.L. Brantlr~/Chemical Geology 135 (1997) 275-290
5. Summary
Based on the experimental data of albite dissolu- tion at temperatures from 5” to 90°C and literature data from 25” to 300°C at acid pH, if we ignore the AG- and/or Al-dependence of dissolution, albite dissolution rate can be described by the following equation:
log r = -2.71 - 3410/T- 0.5pH
where the activation energy of dissolution is deter- mined to be equal to 15.6 f 0.8 kcal mol-’ and independent of pH.
The results of this study as well as many others show that unlike simple oxides, feldspar dissolution is more complicated than predicted by the surface protonation model. We have modeled feldspar disso- lution in H,O + HCl fluids at 1 < pH < 4.5 as a competitive adsorption of protons (which promote dissolution) and aluminum ions (which inhibit disso- lution). If aluminum inhibition is important, as we have argued, then it may be difficult to measure albite dissolution in the “dissolution plateau” at high temperatures, except in solutions with insignifi- cant Al. Similarly, no “true pH-dependence” of dissolution rate can be measured, except in solutions with constant or insignificant Al concentrations.
Applying the Langmuir competitive adsorption model to our data, and assuming values for the enthalpy of adsorption, we estimate the surface ad- sorption equilibrium constant of Al on the albite surface. The model determined KA, value at 25°C and pressure of 1 atm is 2.0 X 10³. Much larger datasets are needed, however, to fully constrain such parameters, and to truly investigate the AG-depen- dence of dissolution.
Comparison of rates predicted from the Langmuir competitive adsorption model to that estimated from the empirical rate equation derived from linear re- gression shows an improvement when aluminum in- hibition is considered, especially at higher Al con- centrations. The model also predicts that, at rela- tively low temperature (< 50°C) the effect of Al inhibition is insignificant, indicating that under surfi- cial weathering conditions, Al may play only a very limited role in inhibiting feldspar dissolution. Be- cause the AH of adsorption of Al on an oxide is assumed to be negative (based on experimental re-
sults suggesting that cation adsorption enthalpies are consistently negative), Al inhibition increases with increasing temperature. Increased Al adsorption at high temperature implies that under the deep burial environment, feldspar dissolution may be affected by elevated concentrations of Al. The competitive ad- sorption model used for feldspar dissolution is poten- tially applicable to other polymerized silicate miner- als, although, currently available data for other sili- cates are very limited.
Acknowledgements
We wish to express our gratitude to D.E. Voigt of Penn State University for technical assistance during the entire course of research and for providing un- published data (Runs 6-90a and 13-90). Thanks are due to Drs. M.L. Machesky (Illinois State Water Survey) and L.L. Stillings (University of Wyoming) for informative discussions. All ICP measurements were performed by C. Perry of the Material Charac- terization Lab at Penn State. The authors would also like to thank Drs. Patrick Brady, John Walther and an anonymous reviewer for their critical comments which greatly improved the quality of this paper. This research was supported by grants from the National Science Foundation (EAR 9305141 and EAR 8657868), and from the David and Lucile Packard Foundation, to S.L.B.
References
Aagaard, P. and Helgeson, H.C., 1977. Thermodynamic and ki- netic conditions on the dissolution of feldspars. Geol. Sot. Am., Abstr. Prog., 9: 873.
Amrhein, C. and Suarez, D.L., 1988. The use of a surface complexation model to describe the kinetics of ligand-promo- ted dissolution of anorthite. Geochim. Cosmochim. Acta, 52: 2785-2793.
Blum, A.E. and Lasaga, A.C., 1988. Role of surface speciation in the low-temperature dissolution of minerals. Nature (London), 331: 431-433.
Blum, A.E. and Lasaga, A.C., 1991. The role of surface speciation in the dissolution of albite. Geochim. Cosmochim. Acta, 55: 2193-2201.
Blum, A.E. and Stillings, L.L., 1995. Feldspar dissolution kinet- ics. In: A.F. White and S.L. Brantley (Editors), Chemical
Y. Chen, XL.. Brantley/ Chemical Geology 135 (1997) 275-290 289
Weathering Rates of Silicate Minerals. Mineral. Sot. Am., face area, and the hydrolysis of feldspar. Geochim. Cos- Rev. Mineral., 31: 291-351. mochim. Acta, 48: 2405-2432.
Brady, P.V. and Walther, J.V., 1989. Controls on silicate dissolu- tion rates in neutral and basic pH solutions at 25’C. Geochim. Cosmochim. Acta, 53: 2823-2830.
Brady, P.V. and Walther, J.V., 1992. Surface chemistry and silicate dissolution at elevated temperatures. Am. J. Sci., 292: 639-658.
Brantley, S.L. and Chen. Y., 1995. Chemical weathering rates of pyroxenes and amphiboles. In: A.F. White and S.L. Brantley (Editors), Chemical Weathering Rates of Silicate Minerals. Mineral. Sot. Am., Rev. Mineral., 31.
Brantley, S.L. and Stillings, L., 1996. Feldspar dissolution at 25°C and low pH. Am. J. ,Sci., 296: 101-127.
Burch, T.E., Nagy, K.L. and Lasaga, A.C., 1993. Free energy dependence of albite dissolution kinetics at 80°C and pH 8.8. Chem. Geol., 105: 1117-162.
Hellmann, R., 1994. The albite-water system, Part I. The kinetics of dissolution as a function of pH at 100, 200, and 300°C. Geochim. Cosmochim. Acta, 58: 595-611.
Kharaka, Y.K., Gunter, W.D., Aggarwal, P.K., Perkins, E.H. and DeBraal, J.D., 1988. SOLMIN88: A computer program for geochemical modeling of water-rock interaction. U.S. Geol. Surv., Water-Resour. Invest. Rep. 88-4227.
Knauss, K.G. and Wolery, T.J., 1986. Dependence of albite dissolution kinetics on pH and time at 25°C and 70°C. Geochim. Cosmochim. Acta, 50: 2481-2497.
Laidler, K.J., 1987. Chemical Kinetics. Harper and Row, New York, N.Y., 513 pp.
Carroll-Webb, S.A. and Walther J.V., 1988. A surface complex model for the pH-dependence of corundum and kaolinite dissolution rates. Geochim. Cosmochim. Acta, 52: 2609-2623.
Carroll-Webb, S.A. and Walther, J.V., 1990. Kaolinite dissolution at 25”, 60”, and 8O’C. Am. J. Sci., 290: 797-810.
Casey, W.H. and Sposito, G., 1992. On the temperature depen- dence of mineral dissolution rates. Geochim. Cosmochim. Acta, 56: 3825-3830.
Casey, W.H., Westrich, H.R. and Arnold, G.W., 1988. Surface chemistry of labradorite feldspar reacted with aqueous solu- tions at pH = 2, 3 and 12. Geochim. Cosmochim. Acta, 52: 2795-2807.
Lasaga, A.C., 1981a. Rate laws of chemical reactions. In: A.C. Lasaga and R.J. Kirkpatrick (Editors), Kinetics of Geochemi- cal Processes. Mineral. Sot. Am., Rev. Mineral., 8: l-68.
Lasaga, A.C., 1981b. Transition state theory. In: A.C. Lasaga and R.J. Kirkpatrick (Editors), Kinetics of Geochemical Processes. Mineral. Sot. Am., Rev. Mineral., 8: 135-169.
Machesky, M.L., 1989. Influence of temperature on ion adsorp- tion by hydrous metal oxides. In: D.C. Melchior and R.L. Bassett (Editors), Chemical Modeling of Aqueous System, II. Am. Chem. Sot., Symp. Ser., 416: 282-292,.
Oelkers, E.H., Schott, J. and Devidal, J.L., 1994. The effect of aluminum, pH, and chemical affinity on the rates of alumi- nosilicate dissolution reactions. Geochim. Cosmochim. Acta, 58: 201 l-2024.
Casey, W.H., Westrich, H.R., Arnold, G.W. and Banfield, J.F., 1989. The surface chemistry of dissolving labradorite feldspar. Geochim. Cosmochim. Acta, 53: 821-832.
Chou, L. and Wollast, R , 1984. Study of the weathering of albite at room temperature and pressure with a fluidized bed reactor. Geochim. Cosmochim. Acta, 48: 2205-2217.
Chou, L. and Wollast, R., 1985. Steady-state kinetics and dissolu- tion mechanisms of a.lbite. Am. J. Sci., 285: 963-993.
Dougan, W.K. and Wilsc,n, A.L., 1974. The absorptiometric deter- mination of aluminum in water - A comparison of some chromogenic reagents and the development of an improved method. Analyst (London), 99: 413-430.
Dzombak, D.A. and Morel, F.M.M., 1990. Surface Complexation Modeling: Hydrous Ferric Oxide. Wiley, New York, N.Y., 393 pp.
Oxburgh, R., Drever, J.I. and Sun, Y., 1994. Mechanism of plagioclase dissolution in acid solution at 25°C. Geochim. Cosmochim. Acta, 58: 661-669.
Parks, G.A., 1967. Aqueous surface chemistry of oxides and complex oxide minerals. In: Equilibrium Concepts in Natural Water Systems. Am. Chem. Sot., Adv. Chem. Ser., 67: 121- 160.
Petit, J.-C., Dran, J.-C. and Della Mea, G., 1990. Energetic ion beam analysis in the earth sciences. Nature (London), 344: 621-626.
Rose, N.M., 1991. Dissolution rates of prehnite, epidote, and albite. Geochim. Cosmochim. Acta, 55: 3273-3286.
Schindler, P.W., 1981. Surface complexes at oxide-water inter- faces. In: M.A. Anderson and A.J. Rubin (Editors), Adsorption of Inorganics at Solid-Liquid Interfaces. Ann Arbor Science, Ann Arbor, Mich., pp. l-150.
Furrer, G. and Stumm, W., 1986. The coordination chemistry of weathering, I. Dissolution kinetics of &Al,O, and BeO. Geochim. Cosmochim. Acta, 50: 1847-1860.
Ganor, J., Mogollon, J.L. and Lasaga, A.C., 1995. The effect of pH on kaolinite dissolution rates and on activation energy. Geochim. Cosmochim. Acta, 59: 1037-1052.
Greenberg, A.E., Trussell, P.R. and Clesceri, L.S. (Editors), 1985. Standard Methods for the Examination of Water and Wastewa- ter. Am. Public Health Assoc., Washington D.C., 1268 pp. (see especially pp. 4610-4611.
Schindler, P.W. and Stumm, W., 1987. The surface chemistry of oxides, hydroxides, and oxide minerals. In: W. Stumm (Edi- tor), Aquatic Surface Chemistry - Chemical Processes at the Particle-Water Interface. Wiley, New York, N.Y., pp. 83-110.
Schott, J., 1990. Modeling of the dissolution of strained and unstrained multiple oxides: The surface speciation approach. In: W. Stumm (Editor), Aquatic Chemical Kinetics. Wiley, New York, N.Y., pp. 337-365.
Helgeson, H.C., Murphy, W.M. and Aagaard, P., 1984. Thermo- dynamic and kinetic (constraints on reaction rates among min- erals and aqueous solutions, II. Rate constants, effective sur-
Schott, J. and Oelkers, E.H., 1995. Dissolution and crystallization rates of silicate minerals as a function of chemical affinity. Pure Appl. Chem., 67: 903-910.
Schweda, P., 1990. Kinetics and mechanisms of alkali feldspar dissolution at low temperatures. Ph.D. Dissertation, Depart-
290 Y. Chen, XL. Branrley/Chemical Geology 135 (1997) 275-290
ment of Geology and Geochemistry, Stockholm University, Stockholm.
Stillings, L.L., 1994. The surface chemistry and dissolution kinet- ics of feldspar. Ph.D. Dissertation, Department of Geo- sciences, Penn State University, University Park, Pa.
Stillings, L.L. and Brantley, S.L., 1995. Feldspar dissolution at 25°C and pH 3: Reaction stoichiometry and the effect of cations. Geochim. Cosmochim. Acta, 59: 1483- 1496.
Stillings L.L., Brantley, S.L. and Machesky, M.L., 1995. Proton adsorption at an adularia feldspar surface. Geochim. Cos- mochim. Acta, 59: 1473-1482.
Stumm, W. and Furrer, G., 1987. The dissolution of oxides and aluminum silicates: Examples of surface-coordination-con- trolled kinetics. In: W. Stumm (Editor), Aquatic Surface Chemistry. Wiley, New York, N.Y., pp. 197-220.
Stumm, W. and Morgan, J.J., 1981. Aquatic Chemistry - An
Introduction Emphasizing Chemical Equilibria in Natural Wa- ters. Wiley, New York, N.Y., 780 pp.
Sverjensky, D.A., 1994. Zero-point-of-charge prediction from crystal chemistry and solvation theory. Geochim. Cosmochim. Acta, 58: 3123-3129.
White, A.F. and Brantley, S.L. (Editors), 1995. Chemical Weath- ering Rates of Silicate Minerals. Mineral. Sot. Am., Rev. Mineral., Vol. 31, 583 pp.
Wieland, E., Wehrli, B. and Stumm, W., 1988. The coordination chemistry of weathering, III. A generalization in the dissolu- tion rates of minerals. Geochim. Cosmochim. Acta, 52: 1969- 1981.
Zinder, B., Furrer, G. and Stumm, W., 1986. The coordination chemistry of weathering, II. Dissolution of Fe(III1 oxides. Geochim. Cosmochim. Acta, 50: I86 1 - 1870.