Psychological Bulletin 1989, Vol. 106, No. 1,74-96 Copyright 1989 by the American Psychological Association, Inc. 0033-2909/89/$00.75 Temperature and Aggression: Ubiquitous Effects of Heat on Occurrence of Human Violence Craig A. Anderson UniversityofMissouri-Columbia Outlines 5 models of the temperature-aggression hypothesis: negative affect escape, simple negative affect, excitation transfer/misattribution, cognitive neoassociation, and physiological-thermoregu- latory. Reviews relevant studies. Aggression measures include violent crime, spouse abuse, horn- honking, and delivery of electric shock. Analysis levels include geographic regional, seasonal, monthly, and daily variations in aggression, and concomitant temperature-aggression effects in field and laboratory settings. Field studies clearly show that heat increases aggression. Laboratory studies show inconsistencies, possibly because of several artifacts. Specific models have not been adequately tested, but the excitation transfer/misattribution and cognitive neoassociation approaches appear most promising, whereas the negative affect escape appears the least viable. Suggestions for future work are made. The minds of men do in the weather share, Dark or serene as the day'sfoul orfair.-Cicero I pray thee, good Mercutio, let's retire; The day is hot, the Capulets abroad, And, ifwemeet, we shall not 'scapeabrawl, For now, these hot days, is the mad blood stirring. hahakespeare, Romeo and Juliet For thousands of years, people have associated weather and human behaviors. For example, in Shakespeare's King Lear, the title character's madness is accompanied by violent storms. Of- ten, more specific causal linkages have been proposed, as are demonstrated by the epigraphs. The most common weather-behavior linkage is that between uncomfortably hot temperatures and violent or aggressive be- havior. Our language is replete with imagery that reflects this linkage. Tempers "flare" when we fight; we get "hot under the collar" when frustrated; or we "do a slow bum" when angered. The basic temperature-aggression hypothesis is that the pro- pensity for aggression increases at uncomfortably hot tempera- tures and that this propensity often overrides more rational con- siderations. As Shakespeare put it (in The Merchant of Venice), "the brain may devise laws for the blood, but a hot temper leaps o'er a cold decree." Though the idea that hot temperatures may promote aggres- sion has been around for ages, empirical tests of the idea awaited the development of a proper intellectual climate and corresponding technologies. In the late 1800s a number of so- cial philosophers and social geographers began examining sta- tistics on various types of crimes for evidence of temperature I thank the following individuals for their helpful comments on an earlier draft of this article: Len Berkowitz, Doug Kenrick, and three anonymous reviewers. A special "thank you" goes to Jim Rotton, for unusually extensive and insightful comments and for assistance in tracking down obscure references. Correspondence concerning this article should be addressed to Craig A. Anderson, Department of Psychology, University of Missouri-Co- lumbia, 210 McAlesterHall, Columbia, Missouri 65211. l effects. (See Aschaffenburg, 1903/1913, Dexter, 1899, and Lombroso, 1899/1911, for presentations of this early work, See also Brearley, 1932, Cohen, 1941, and Falk, 1952, for reviews.) Presumably, this interest was sparked in large part by the avail- ability of official criminal statistics as well as the speculations of Charles-Louis de Secondat de Montesquieu (in his De ['esprit des lois, 1748) and Henry Thomas Buckle (in his History of Civilization in England, 1857-1861). Interest in climate effects on crime and aggression waned as developments in the various social sciences pointed the way to other determinants, such as traits and attitudes, social condi- tions, and biological factors. Indeed, recent thinking assumes either that climate effects are trivial or that they exert only indi- rect influence, by influencing the number of opportunities for aggression. More recent work, however, suggests that tempera- ture effects are not trivial in magnitude and may not be simple by-products of aggression opportunity. Indeed, there is reason to believe that hot temperatures increase aggression through several (possibly related) psychological and biological pro- cesses. There is also reason to believe that considerably more focused research is needed. This review thus serves two func- tions: First, examination of the existing literature generates some answers to some very old questions about temperature and aggression; second, areas that need more work are identi- fied. Consider first what is meant by aggression. Many types of aggression have been identified in human and nonhuman re- search, A partial listing includes the following types: predatory, pain elicited, defensive, offensive, and instrumental. Different factors are involved in these different types, and probably differ somewhat between species. The temperature-aggression hy- pothesis applies primarily to those aggressive acts that are char- acterized by two motivational features. First, the motive to ag- gress is primarily affect based. Second, the motive is to harm the target in some way. Thus, predatory, pain-elicited, and in- strumental aggression do not provide appropriate tests of the temperature-aggression hypothesis. Organizational Scheme The empirical studies of the temperature-aggression hypoth- esis have been grouped in this article according to the basic 74
Transcript
Psychological Bulletin1989, Vol. 106, No. 1,74-96
Copyright 1989 by the American Psychological Association, Inc.0033-2909/89/$00.75
Temperature and Aggression:Ubiquitous Effects of Heat on Occurrence of Human Violence
Craig A. AndersonUniversityof Missouri-Columbia
Outlines 5 models of the temperature-aggression hypothesis: negative affect escape, simple negativeaffect, excitation transfer/misattribution, cognitive neoassociation, and physiological-thermoregu-latory. Reviews relevant studies. Aggression measures include violent crime, spouse abuse, horn-honking, and delivery of electric shock. Analysis levels include geographic regional, seasonal,monthly, and daily variations in aggression, and concomitant temperature-aggression effects in fieldand laboratory settings. Field studies clearly show that heat increases aggression. Laboratory studiesshow inconsistencies, possibly because of several artifacts. Specific models have not been adequatelytested, but the excitation transfer/misattribution and cognitive neoassociation approaches appearmost promising, whereas the negative affect escape appears the least viable. Suggestions for futurework are made.
The minds of men do in the weather share,Dark or serene as the day'sfoul orfair.-Cicero
I pray thee, good Mercutio, let's retire;The day is hot, the Capulets abroad,And, ifwemeet, we shall not 'scapeabrawl,For now, these hot days, is the mad blood stirring.
hahakespeare, Romeo and Juliet
For thousands of years, people have associated weather andhuman behaviors. For example, in Shakespeare's King Lear, thetitle character's madness is accompanied by violent storms. Of-ten, more specific causal linkages have been proposed, as aredemonstrated by the epigraphs.
The most common weather-behavior linkage is that betweenuncomfortably hot temperatures and violent or aggressive be-havior. Our language is replete with imagery that reflects thislinkage. Tempers "flare" when we fight; we get "hot under thecollar" when frustrated; or we "do a slow bum" when angered.The basic temperature-aggression hypothesis is that the pro-pensity for aggression increases at uncomfortably hot tempera-tures and that this propensity often overrides more rational con-siderations. As Shakespeare put it (in The Merchant of Venice),"the brain may devise laws for the blood, but a hot temper leapso'er a cold decree."
Though the idea that hot temperatures may promote aggres-sion has been around for ages, empirical tests of the ideaawaited the development of a proper intellectual climate andcorresponding technologies. In the late 1800s a number of so-cial philosophers and social geographers began examining sta-tistics on various types of crimes for evidence of temperature
I thank the following individuals for their helpful comments on anearlier draft of this article: Len Berkowitz, Doug Kenrick, and threeanonymous reviewers. A special "thank you" goes to Jim Rotton, forunusually extensive and insightful comments and for assistance intracking down obscure references.
Correspondence concerning this article should be addressed to CraigA. Anderson, Department of Psychology, University of Missouri-Co-lumbia, 210 McAlesterHall, Columbia, Missouri 65211.
l
effects. (See Aschaffenburg, 1903/1913, Dexter, 1899, andLombroso, 1899/1911, for presentations of this early work, Seealso Brearley, 1932, Cohen, 1941, and Falk, 1952, for reviews.)Presumably, this interest was sparked in large part by the avail-ability of official criminal statistics as well as the speculationsof Charles-Louis de Secondat de Montesquieu (in his De ['espritdes lois, 1748) and Henry Thomas Buckle (in his History ofCivilization in England, 1857-1861).
Interest in climate effects on crime and aggression waned asdevelopments in the various social sciences pointed the way toother determinants, such as traits and attitudes, social condi-tions, and biological factors. Indeed, recent thinking assumeseither that climate effects are trivial or that they exert only indi-rect influence, by influencing the number of opportunities foraggression. More recent work, however, suggests that tempera-ture effects are not trivial in magnitude and may not be simpleby-products of aggression opportunity. Indeed, there is reasonto believe that hot temperatures increase aggression throughseveral (possibly related) psychological and biological pro-cesses. There is also reason to believe that considerably morefocused research is needed. This review thus serves two func-tions: First, examination of the existing literature generatessome answers to some very old questions about temperatureand aggression; second, areas that need more work are identi-fied.
Consider first what is meant by aggression. Many types ofaggression have been identified in human and nonhuman re-search, A partial listing includes the following types: predatory,pain elicited, defensive, offensive, and instrumental. Differentfactors are involved in these different types, and probably differsomewhat between species. The temperature-aggression hy-pothesis applies primarily to those aggressive acts that are char-acterized by two motivational features. First, the motive to ag-gress is primarily affect based. Second, the motive is to harmthe target in some way. Thus, predatory, pain-elicited, and in-strumental aggression do not provide appropriate tests of thetemperature-aggression hypothesis.
Organizational Scheme
The empirical studies of the temperature-aggression hypoth-esis have been grouped in this article according to the basic
74
Craig A. Anderson
In creating this electronic reprint, we have attempted to keep the style, pagination, and format as close to the published form as possible. Nonetheless, some errors may have occurred. If you discover an error, please contact Craig Anderson using the following email address: [email protected]. This electronic reprint is provided as a courtesy. Please do not post or distribute this reprint in any fashion that may violate the copyright of the original publisher or the authors. Thank you for your interest in this work.
TEMPERATURE AND AGGRESSION 75
methodology used. Thus, there are studies looking at differ-ences in aggressive crime rates as a function of differences in(temperature related) geographic region. There also are studiesof crime rate differences during various time periods, such asseason, month, and day. Finally, there are studies in which tem-perature is measured concomitantly with the target behaviors.I
The overall logic of this review has a variety of names suchas "multiple operationism" or "triangulation" (e.g., Anderson,1987; Campbell & Fiske, 1959; Crano & Brewer, 1973; Feigl,1958; McGrath, Martin, & Kukla, 1982). Studies using differ-ent methodologies but addressing the same questions provideespecially stringent tests of hypotheses. When the weaknessesof a particular type of study do not apply to the other types,consistency of results favoring a particular hypothesis allowsone to triangulate or "home in" on a true causal factor. Thus,if the temperature-aggression hypothesis is supported in stud-ies of geographic region effects, time period effects, and con-comitant temperature-aggression effects, one can be fairly surethat hot temperatures do have a direct effect on aggression.
Exactly how that effect works may require further examina-tion of the types of studies. For instance, a biological theory ofthe temperature-aggression relation may posit that hotter am-bient temperatures lead to increased testosterone, which inturn increases aggressive tendencies. This predicts increases intestosterone during hot summer months, corresponding to in-creases in aggression. If testosterone fails to show such cycliceffects, or if the upswing part of the testosterone cycle beginsafter the aggression cycle begins, its validity would be in doubt.
Basic Issues
Is There a NonartifactualTemperature-Aggression Relation?
There are three basic issues. First, is there any evidence ofa direct temperature effect on aggressive tendencies? A directtemperature effect is one that operates at the level ofthe individ-ual, such as by increasing irritability or anger. Alternatively, areall findings of a temperature-aggression relation artifactual?Do increases in aggression occur in hot temperatures simplybecause both are associated with outdoor activities?
What is the Shape of theTemperature-Aggression Relation?
In the second issue, one assumes that there is a nonartifactualeffect and asks about the shape of the relation. Five possibilitieswarrant attention. The simplest is a straight linear function,with aggression increasing as temperature increases. This func-tion cannot be true at the extremes, because at extremely highand low temperatures the body cannot function properly, anddeath will ensue, precluding aggression. Thus, the shape ques-tion should be reframed and considered only within the normalrange of temperatures. In this sense, the linear function is pos-sible.
The J-shaped function also is conceptually simple. At lowtemperatures there may be little effect of temperature differ-ences on aggression, whereas at higher temperatures the effectmay be more pronounced. That is, the strength ofthe motive to
aggress may be essentially the same at 20 of and 30 of, but 80of may produce much stronger aggressive motives than 70 oF.
The inverted-U shape specifies that aggression tendenciespeak at some intermediate temperature (e.g., 85 OF) and de-crease as temperatures deviate from this inflection point. A re-lated shape is two inverted Us side by side (an M shape?). Ag-gression is low at very high and very low temperatures and atcomfortable intermediate ones as well. Such a prediction doesoccur in a prominent model of affect and aggression, as will beseen shortly.
The fifth possibility is simply U shaped. This means that ag-gressive tendencies are lowest at some intermediate tempera-ture (e.g., 65 OF)and increase as temperatures deviate from it.
Distinguishing among these functions is quite difficult, par-ticularly in field studies. This is because of asymmetries in hu-mans' abilities to handle nonoptimal hot and cold tempera-tures. It is easier to adjust to cold than to hot deviations fromthe ideal temperature (Persinger, 1980). Thus, even if the truefunctional relation between temperature and aggression was Ushaped, studies that do not prevent subjects from adapting tothe temperature (via clothing, for example) would tend to findeither J-shaped or linear functions. Distinguishing between J-shaped and linear functions also is difficult in field studies, pri-marily because very precise assessments of aggression and con-comitant temperatures are necessary. The most easily distin-guishable shape is the inverted U, because only it predicts a dropin aggression at the highest (normal) levels of temperature.Even here, though, there is some ambiguity because of the un-certainty of where the inflection point should be located. Anadditional problem in assessing the shape arises in many of thelaboratory studies. Typically, only two or three levels ofthe tem-perature variable are manipulated. A final problem in distin-guishing among shape functions arises from the uncertainty ofthe temperature at the time the aggressive behavior was per-formed and at the time the aggressive motivation (intention,mood, or affect) was developed. Many murders committed dur-ing hot periods of time (e.g., months) may actually have beencommitted at the cooler times of that period and thus could bethe result of an inverted-U-shaped function. On the other hand,even murders committed during the cooler parts of the timeperiod may have been instigated by aggressive motives engen-dered during the hotter part of the time period.
Theories Relating Temperature and Aggression
Negative Affect Escape Model
There are five basic psychological approaches to the tempera-ture-aggression relation.2 The most widely cited and most con-
I My original intent was to report all studies purportedly addressing
the temperature-aggression hypothesis. However, because of the num-
ber of such studies, space limitations, and the good sense of the review-
ers and the Editor, some selection was necessary. Omitted were severalwidely cited and many obscure articles with severe methodological and
interpretational problems.2 There must be effects at a sociological level as well, such as social
interaction opportunity differences mentioned earlier as artifacts. Be-
cause there is little evidence relevant to such sociological effects oftem-
perature on aggression, they will continue to be treated as artifacts to thepsychological approaches under consideration in this article. Obviously,
"~,,I
76 CRAIG A. ANDERSON
troversial model is Baron and Bell's negative affect escapemodel (see Baron, 1979). In this model, competing behavioraltendencies of aggression and escape are instigated by negativeaffect. At low to moderate levels of negative affect the aggressiontendency is stronger, so increases in negative affect produce in-creases in aggressive behavior. At high levels of negative affectthe escape tendency becomes stronger. Therefore, if escape ispossible, then further increases in negative affect produce bothincreases in escape behavior and decreases in aggression. Thisinverted-U-shaped model relates affect to aggression. If one isdealing with temperatures ranging from comfortably cool touncomfortably hot, and if escape is perceived as an option, thismodel also predicts an inverted U for the temperature-aggres-sion relation. The temperature at which a downturn in aggres-sion is expected is not constant but presumably varies as a func-tion of other factors producing negative affect. This inflectionpoint should be relatively higher when there is no other sourceof negative affect. Baron and Bell's works (see review in the Con-comitant Temperature section) suggest that the inflection pointshould be around 85 OFin most situations.
Another aspect of this model is important, though it has re-ceived little attention. Cold temperatures also produce negativeaffect. Therefore, another inverted-U shape is predicted as tem-peratures range from comfortably cool to unbearably cold.Thus, the negative affect escape model, by holding other sourcesof negative affect constant and with escape as a possible option,actually predicts an M-shaped function relating temperature toaggressive behavior.
This model is the most sophisticated one devoted to tempera-ture effects on aggression. But it suffers conceptually for thesame reason that it reveals something important. The predic-tion of decreases in aggression at extremely hot temperatures(and at extremely low ones as well) has to be true. Faced withthe choice of risking heat stroke (or freezing) to aggress againstan insulting target person versus escaping the situation but los-ing the aggression opportunity, most of us would choose escape.However, the desire or motive to aggress (the anger, hostility)may stilI be highest at the extremely hot (or cold) temperatures.
This example points out that the temperature-aggression hy-pothesis actually is more appropriately stated in terms of mo-tive to aggress. Once stated in terms of desire or motivation toaggress rather than of actual aggressive behavior, the negativeaffect escape model becomes the same as the next model to beconsidered, the simple negative affect model. However, the addi-tion of the assumption that escape motives increase with nega-tive affect at a faster rate than aggressive motives leads to quitedifferent behavioral predictions, which of course can be tested.That is, when escape is possible, the negative affect escapemodel predicts an inverted-U-shaped function between tem-perature and aggressive behavior as temperature ranges frommoderate to uncomfortably hot or from moderate to uncom-fortably cold.
It is important to note that because of difficulties in measur-ing motives to aggress, most scholars in this area have concen-trated on aggressive behavior measures as indicators of motives.The implicit assumption has been that all else is equal (includ-
such effects would be important in their own right, and relevant re-search is badly needed.
t
~
ing other motives and behavioral possibilities, such as escape).Baron and Bell's work and this conceptual analysis make clearthat all else is not necessarily equal in different situations.
Simple Negative Affect Model
This model is similar to the intuitive ideas passed down forgenerations. When people are hot, they are in bad moods. Thesemoods make people more likely to respond to frustrations ofvarious kinds by aggressing in some way. This model differsfrom the layperson's view primarily in that it applies symmetri-cally to cold temperatures as well. That is, negative affect resultsfrom being uncomfortably cold as well as uncomfortably hot.Thus, this model predicts a U-shaped function across the nor-mal range of temperatures.
Excitation TransferjMisattribution of Arousal Model
Zillmann's theory of excitation transfer (e.g., Zillmann,1983a, 1983b) is easily applied to the temperature-aggressionrelation. The theory assumes that excitatory reactions, primar-ily in terms of activation of the sympathetic nervous system,are largely nonspecific across emotions. When large changes inexcitatory reactions are experienced, people tend to link themto one salient inducing condition. Thus, arousal produced byexcessive temperatures (for instance) may be misattributed toanger at some provoking individual.
This theory has received considerable support in a varietyof contexts but has not been applied to temperature. Severalconditions must hold for this theory to apply. First, excessivetemperatures must lead to increases in arousal. Second, tem-perature-induced arousal must be misattributable; that is, hottemperatures must not be so salient a cause of arousal that theyare seen by people as the inducing condition. If temperature ismade salient as a cause of arousal, then portions of the totalarousal that are actually due to nontemperature sources suchas an insulting person may be misattributed to temperature,resulting in less anger at and artifactual decreases in aggressiontoward that person. If temperature remains nonsalient, though,hotter temperatures should produce misattributions of arousalto the annoying people in the context and increased aggressionagainst these people. This is most likely to occur in conditionsin which temperature is a background factor, which is true inmost field studies.
The same logic holds for increasingly cold temperatures aswell, assuming that the cold produces increased arousal andthat the experience of arousal is not attributed to the cold. Inmany respects, then, this model of the temperature-aggressionrelation is a sophisticated version of the simple negative affectmodel. One key difference is that Zillmann's theory assumesthat transfer effects on aggression can occur only if there is asalient target of aggression who instigates aggressive motives.The simple negative affect model assumes that the negativeaffect is itself sufficient to produce aggression without an inter-personal cause.
Cognitive Neoassociation Model
Berkowitz (I983a, 1983b, 1984) discussed several types ofaggression in both animals and humans. The analysis most rele-
TEMPERATURE AND AGGRESSION 77
vant to the temperature-aggression relation is the notion thatuncomfortable conditions may prime aggressive thoughts that,in turn, increase the motive to aggress. The main idea is thataggressive thoughts and emotions are associatively linked to avariety of aversive conditions and experiences (cf. Geen &O'Neal, 1969). These conditions and experiences can prime theaggressive thoughts and related emotions, even when they arenot particularly relevant or rational. These priming effects may,in turn, influence the person's interpretation of the situationand selection of behavioral alternatives. Thus, increasingly un-comfortable temperatures (hot or cold) should prime aggressivethoughts and produce more aggression, in a U-shaped function.
This prediction is essentially the same as that made by theexcitation transfer theory and the simple negative affect model.A key differentiating prediction for Berkowitz's model is thatuncomfortable temperatures should prime aggressive thoughtsregardless of the presence or absence of aggressive cues in thesituation. (Obviously, some situations may cue certain nonag-gressive thoughts so strongly that aggressive ones are effectivelyshut out.)
Zillmann (1983a, 1983b) has not explicitly addressed thepriming notion or temperature effects. But adding the assump-tion that arousal transfer can intensify dominant or salient cog-nitive processes leads to a prediction of increased aggressivethoughts at increasingly uncomfortable temperatures when thefollowing conditions hold: (a) Aggression cues are present, and(b) temperature is a background factor. When aggression cuesare absent, Zillmann's model would appear to predict no effectof temperature on frequency of aggressive thoughts. The simplenegative affect model is silent on these matters.
The Berkowitz and Zillmann theories also differ in the impor-tance of attributional processes. To excitation transfer theory,these processes are essential. The cognitive neoassociationmodel also states that controlled attributional processes, whenoperative, affect the motivation to aggress; it also claims thatsuch misattributions are not necessary for discomfort to in-crease aggression. Because attributions may result either fromconscious, accessible (and measurable) controlled processes orfrom spontaneous, inaccessible, and automatic processes (seeUleman, 1987), comparative tests of these two theories on thebasis of attributional results will be problematic.
Physiological- Thermoregulatory Model
This approach is best seen as a different level of analysis. Un-fortunately, the physiological literatures on temperature effects,temperature regulation, and aggression are far from clear. Theideas put forth here relating temperature to aggression via neu-ral and hormonal systems must be viewed as tentative. Indeed,the linkages necessary for any reasonable thermoregulatory the-ory of temperature and aggression are so complex and poorlyunderstood at the present time that testable predictions con-cerning shape or conditions of temperature-aggression effectsare impossible. The purpose of this section is to demonstratethat there may be important physiological-thermoregulatoryeffects underlying temperature effects on aggression and thatfurther thermoregulatory, neural, and neurohormonal researchspecifically addressing the temperature-aggression hypothesisis needed.
First, consider the basic effects of heat and cold on a variety of
physiological systems. Exposure to hot temperatures generallyproduces the following effects: increased heart rate, increasedrespiration rate, deeper respiration, increased blood circulationrate, slight decrease in heart stroke volume, skin blood vesseldilation, sweating, decrease in thyroid-stimulating hormoneand consequent decrease in basal metabolic rate, and increasein galvanic skin response (GSR) and skin conductance. Bloodpressure effects have been inconsistent. Often, warm tempera-tures lead to a drop in blood pressure, though there is also evi-dence that systolic blood pressure increases in prolonged heatexposure. This list of effects generally is consistent with relativesympathetic nervous system dominance, but of course the de-crease in blood pressure and the dilation of surface blood ves-sels are activated primarily by the parasympathetic system,contradicting such a general characterization. (For source ma-terial on these effects, see Bazett, 1927, Bloch, 1985, Hardy,1961, Oken et aI., 1962, Persinger, 1980, and Tromp, 1980.)
Exposure to cold produces a considerably shorter list ofknown effects: increase in heart stroke volume and consequentincrease in circulation rate, shivering, vasoconstriction, in-creased blood pressure, increase in thyroid-stimulating hor-mone and cortisone (via pituitary control over the thyroid andadrenal cortex), and increase in epinephrine and norepineph-rine (via the adrenal medulla). These last three hormones areall controlled to some extent by the hypothalamus, which is cen-tral in thermoregulation, and serve to increase basal metabo-lism. As with responses to heat, these effects reflect a complexinterplay of the sympathetic and parasympathetic nervous sys-tems. (For source material, see Bazett, 1927, Hardy, 1961, andTromp, 1980.)
The most important locus of thermoregulation is the hypo-thalamus, though temperature-sensitive systems are found else-where, especially in the upper spinal cord (Bligh, 1973). Tem-perature-sensitive cells are connected directly (i.e., neurally)and indirectly (Le., hormonally) to a variety of systems thatcontrol a variety of bodily and emotional functions. It is thisincredible complexity that thwarts current attempts at a com-plete analysis.
The primary neurotransmitters involved are norepineph-rine, epinephrine, serotonin, and acetecholine. When the firsttwo are released in the hypothalamus (especially the preopticregion), a variety of events occur that lead to decreases in corebody temperature. When the latter two are released in the hypo-thalamus, they trigger events leading to increases in body tem-perature.
All this is relevant to the temperature-aggression hypothesisin that many of the same neural and hormonal systems in-volved in temperature regulation are also implicated in aggres-sion, but the links are not clear. For instance, testosterone levelshave been linked to aggression in men and women (e.g., Blanch-ard & Blanchard, 1984; Olweus, Mattsson, Schalling, & Low,1980). Sweating produces an increase in various corticosteroidsfrom the adrenal cortex (Bligh, 1973). Corticosterone can sup-press testosterone synthesis (Blanchard & Blanchard, 1984). Atthe same time, a relative lack of cortisol (another corticosteroid)has been linked to increases in aggression (Brain, 1984).
Similarly, the neurotransmitter serotonin seems to inhibit ag-gression (Persinger, 1980; Reis, 1974), whereas acetecholine in-creases aggression (Reis, 1974). But both are involved in ther-moregulatory responses to cold (Bligh, 1973; Meyers, 1974).
78 CRAIG A. ANDERSON
What changes in aggression should be expected in cold becauseofthese contradictory neurotransmitter effects?
Finally, it is intriguing to note the neural interconnectednessof a variety of structures linked to aggression, emotion, andthermoregulation, including the hypothalamus, amygdala, andhippocampus. It may very well be that emotional and cognitiveeffects of temperature result from such linkages. The systemsare so complex, however, that there is little hope of understand-ing temperature-aggression effects at this level of analysis forquite some time. The area is promising, though, and more di-rect attacks on the temperature-aggression hypothesis fromthis perspective will undoubtedly yield new insights.
A Note on Arousal
A widely used construct in psychology is general arousal. Itfigures prominently in most treatments of emotion and motiva-tion. The positions on the temperature-aggression relation out-lined previously are no exception. A major problem with thisconstruct is that at a physiological level, convergent validity ishard to find. That is, various indicators of arousal (such as heartrate, blood pressure, respiration, GSR) often yield modest tolow (and sometimes negative) intercorrelations. Uncomfortablyhot temperatures yield physiological effects that are both arous-ing and sedative; so do cold temperatures. Thus, a seeminglysimple question such as "Do hot temperatures produce in-creases or decreases in arousal?" has no simple answer. Yet,such questions are crucial for many theories of the tempera-ture-aggression relation. For example, the misattribution ofarousal model applies only if there are perceived increases inarousal to be misattributed. Two solutions to this dilemma ap-pear promising (and have been used in other contexts). First,one can define arousal not in physiological terms but subjec-tively; that is, one can ask subjects to assess if they are feelingaroused. Second, one can test the arousing properties oftemper-ature by observing its effects on other behaviors. For example,Rotton (1985) convincingly demonstrated that people walkfaster when it is hot, even when motives to escape from the heatwere controlled.
Studies of Temperature-Aggression Hypothesis
Geographic Region Effects
The temperature-aggression hypothesis predicts that all elsebeing equal, regions with more hot days will yield more aggres-sive behavior. This may occur with a variety of measures of ag-gression, such as aggressive crimes (e.g., homicide, assault,rape) or more common forms of aggression (e.g., fightingamong children). Unfortunately, all else is seldom equal. A hostof socioeconomic variables (including demographic and cul-tural factors) undoubtedly affect the expression of aggressivetendencies. These potential confounds limit the value of studiesof geographic region effects. Such studies are particularly use-ful, though, if they have features that limit the confounds insome way. Thus, if the comparisons across regions with differenttemperatures are within the same country, the socioeconomicdifferences are likely to be reduced somewhat. The consistencywith which geographical region effects are found across studiesalso is important. If the same temperature-related effects are
found in several different countries, one's confidence that theyare truly temperature related should be enhanced.
Of the three basic issues discussed earlier (i.e., existence,shape, specific theory), only that concerning the existence ofa temperature effect on aggression can be cleanly tested. Onepossible finding would bear on the shape issue as well. Specifi-cally, if maximum aggression rates are observed in regions withmoderate climates, the linear, J-shaped, and U-shaped func-tions would be hard-pressed to explain them. However, a find-ing of maximal aggression in the hotter regions could be derivedby the inverted-U-shaped function as well as by the other threeshaped functions.
Studies With No Controls for Socioeconomic Factors
Numerous scholars have noted that aggressive crimes (Le.,interpersonal violence) are relatively more frequent in the hot-ter geographic regions of countries. Brearley (1932) presenteddata showing that the highest homicide rates in the UnitedStates from 1918 to 1929 were in the southern states. Otherscholars have shown that the hot region/high crime effect is spe-cific to violent crime. For instance, in the years 1826-1830,crimes against people (e.g., assault) were twice as prevalent insouthern France as in central or northern France, whereascrimes against property (e.g., burglary) were twice as prevalentin the north (Guerry, cited in Brearley, 1932). Similarly, Lom-broso (1899/1911) presented data showing that the homiciderate was relatively high in southern Italy (31 per 100,000 inhabi-tants), moderate in central Italy (15.24), and low in northernItaly (7.22), whereas aggravated theft was most common in cen-tral Italy (174.2) and equally less common in northern andsouthern Italy (143.4 and 143.3, respectively). Lombroso alsoreported that the 'homicide rate in the south of England wasalmost 10 times that of northern England. Finally, Lombrosocited some of his earlier work showing that homicide rates inEurope were higher in southern countries than in northernones.
These early studies did not, of course, include statistical testsof the temperature-aggression hypothesis. However, some ofthe data were reported in a form allowing reanalyses and roughtests ofthe hypothesis. Lombroso (1899/1911), forinstance, re-ported several aggressive crime rates by degrees latitude of theregion, for both Spain and Italy. In Italy, rates of homicide and"resistance to officers" (presumably law officers) correlated sig-nificantly with latitude (ps < .0 I), with the higher rates occur-ring in the hotter latitudes. The Spain data yielded essentiallyidentical results. 3
Although Brearley (1932) did no comparable latitude analy-sis on his homicide data in the United States, it is apparent fromthose data that a comparable effect would emerge. Using Brear-ley's data, I computed the average homicide rate across the1918-1929 time span for each of the northernmost and thesouthernmost states. (Note that expanding or shrinking thedefinitions of northernmost and southernmost states does notappreciably alter the results.) As was expected, the southern
3 All P levels are based on two-tailed tests. For all reanalyses, descrip-
tions of procedures and more specific results may be obtained by writ-ing the author.
TEMPERATURE AND AGGRESSION 79
states had dramatically higher homicide rates (M = 19.37 per100,000) than did the northern states (M = 3.55), t(16) = 7.93,p < 0101. Sometimes such effects have been dismissed as dueto the "culture of violence" in the U.S. south, resulting fromhistorical social factors. However, the fact that the same patternoccurred in France, Italy, Spain, and England makes this alter-native explanation considerably less tenable. Indeed, the datasuggest that the hotter climates may have been causal factors inthe development of cultures of violence (cf. the redux modelproposed by Rotton, 1986).
Two more recent studies also have examined the geographicregion effects without attempting to control for various socio-economic factors. Robbins, DeWalt, and Pelto (1972) exam-ined data bases containing aggression-related variables on vari-ous cultures around the world. They found that across cultures,warmer climates were associated with more indulgence of ag-gression, less induced anxiety in the socialization of aggression,more human agents of aggression in myths, and higher homi-cide rates (all ps < 1)1). Robbins et al. also reported severalvariables that did not show systematic variation as a functionof temperature. The aggression-related ones were feelings ofhostility in adults and incidence of warfare.
Schwartz (1968) briefly reported a study of political violence(e.g., revolts against the government) in 51 nations from 1948to 1964. Nations were classified into quartiles based on the tem-peratures of "representative sites" in the countries. The fre-quency of political violence was then assessed as a function ofthe temperature quartile of the nations. The results showed thatfor this sample, violence was not more prevalent in the hotternations. This study, like the Robbins et al. (1972) warfare re-sults, contradicts the temperature-aggression hypothesis. Thereason may be that the kinds of aggression studied (coups, polit-ical assassinations, terrorism, guerilla warfare, and revolts) aremore planful, politically instigated acts. In other words, thetemperature-aggression hypothesis applies to more spontane-ous forms of aggression than revolution.
Studies With Controls lor Socioeconomic Factors
Five studies have looked at geographic region temperatureeffects while simultaneously attempting to control for socioeco-nomic confounds. The first, by deFronzo (1984), examined the142 largest standard metropolitan statistical areas (SMSAs) inthe 1970 U.S. Census. Data on the seven major crimes reportedby the Federal Bureau ofInvestigation Uniform Crime Reports(UCR), climatological data, and 11 various demographic andsocioeconomic variables were compiled for each SMSA. TheUCR includes murder, rape, assault, robbery, burglary, larceny,and motor vehicle theft. Of particular relevance here was thefinding that a dummy variable reflecting the south/nonsouthstatus of each SMSA was highly correlated with both murderand assault rates (ps < 1)1). The rape/region correlation alsowas positive but nonsignificant. All three crimes were moreprevalent in the southern SMSAs. These effects disappearedwhen all other variables in the data set were statistically con-trolled. Unfortunately, the interpretation of these regionaleffects is clouded by the fact that two of the variables that werestatistically controlled were temperature-related variables (Le.,number of cold days in the year and number of hot days in theyear in each SMSA). Thus, partialing out these temperature
effects should reduce or eliminate region-based temperatureeffects. DeFronzo's data also yielded significant correlations be-tween the temperature variables and the violent crimes ofmur-der, assault, and rape. The number of hot days in an SMSAcorrelated positively and the number of cold days correlatednegatively with these violent crimes (all ps < 1)1). Once again,when the effects of all other variables were first partialed out,these temperature-aggression effects tended to disappear, be-cause the south/nonsouth variable is so strongly confoundedwith temperature.
Thus, at the level of zero-order correlations, deFronzo's dataprovide support for the temperature-aggression hypothesis.Southern cities and cities with warmer climates had relativelyhigh rates of murder, assault, and rape. The laudable attemptto control for a variety of social differences between cities failed,though, because those regression analyses also partialed outtemperature effects. (For other criticisms of deFronzo's analy-sis, see Rotton, 1986.)
Rosenfeld (1986) examined the seven UCR crime rates for1970. In one analysis (of 125 urban areas), four variables wereexamined as predictors of crime: region (south/nonsouth), pop-ulation, unemployment, and relative deprivation. Regressionanalyses revealed that southern cities had significantly higherrates of murder and assault but not of rape, robbery, burglary,larceny, or motor vehicle theft. In a second analysis (of 204 ur-ban areas), five variables were examined as predictors of crime:region, population, unemployment, welfare eligibility, and wel-fare dependency. The regression analysis revealed that southerncities had significantly higher rates of all seven crimes exceptmotor vehicle theft. The region effect was particularly strong,again, as a predictor of murder and assault.
Rotton (1986) examined the 1976 homicide rates of 41 coun-tries and included several climate and sociodemographic vari-ables. Specifically, he gathered 30-year average temperatures inJanuary and July in the capital cities ofthe countries and a vari-ety of other variables such as precipitation, life expectancy, lit-eracy, and kilowatts per capita. The regression analyses yieldedequivocal results, with some support for the temperature-ag-gression hypothesis. But a variety of methodological considera-tions (e.g., sample size, use of capital cities for assessing temper-ature distributions, use of 30-year average temperatures to pre-dict I-year homicide rates) make interpretation difficult. Thus,although the results provide some support for climatologicalmodels of homicide, this study is best viewed as too weak to bemore than suggestive.
Rotton, Barry, and Kimble (1985) conducted a similar analy-sis of the three violent crimes of homicide, rape, and assaultusing 1977 crime data from 858 cities in the United States. Theresults varied somewhat depending on the particular analysisused, but in general, significant temperature effects were ob-served for all violent-crime variables. Once again, this study didnot cleanly test the temperature-aggression hypothesis becausethe climate variables were inappropriate. Thirty-year averageswere used, and only temperatures in January and July weresampled. Thus, the number of hot days in each city during 1977was estimated only very poorly. The use of 30-year averages mayyield some insight into effects oflong-term climate on develop-ment of cultures of violence but may tell little of the directeffects of temperature within a given year.
The most extensive study of regional differences in aggression
80 CRAIG A. ANDERSON
also examined crime rates in the United States (Anderson,1987, Study 2). In that study, crime rates for each of260 SMSAs(called cities) in 1980 were examined. Several climate variableswere obtained for each city, including the number of hot days(90 of or more) that occurred in 1980. Also collected were 14social variables for each city such as unemployment, per capitaincome, education, age, and racial composition. In the first stepof the analysis, social models of crime rate differences amongU.S. cities were created for four violent and nonviolent crimeindices. The purpose of these models was to partial out effectsof potentially confounding variables. Thus, any variance sharedamong these predictors and temperature would be assigned tothe social variables, not to temperature variables. These modelswere quite effective; they accounted for 56% to 79% of crimedifferences among cities. In the second step, climate variableswere examined to see if any contributed unique variance in theprediction of crime, once the social model variables had beenentered. As was expected, the various temperature-related vari-ables all contributed significant unique variance to the predic-tion of violent crime (ps < 1)1). Temperature did not add any-thing to the prediction of nonviolent crime (ps > 2)2).
This study provides considerably stronger support for thetemperature-aggression hypothesis than previous studies be-cause it avoided many problems present in earlier work. Morecomplete social models of crime were created and statisticallycontrolled. Conservative tests of the unique contribution oftemperature to crime were used. The effects of temperature onviolent crimes were found to be significantly larger than corre-sponding effects on nonviolent crimes. Finally, region-basedtemperature effects were assessed at the more precise level ofcities (actually SMSAs) rather than a simple southfnonsouthdichotomy.
Summary
The studies of geographic region temperature effects on ag-gression provide impressive support for the temperature-ag-gression hypothesis. The major problem with such studies isthat at this level of analysis, there are numerous plausible alter-native explanations of both supportive and contradictory re-sults. For example, there may be historical development differ-ences in cultures between regions that produce different aggres-sion rates, and these differences may artifactually correlate withclimatological differences. However, there is support in a widevariety of studies dating back to the early 19th century. Hotterregions in a variety of countries have shown relatively higherviolent crime rates. Such high aggression is not paralleled bycomparably high nonviolent crime rates. These temperature-aggression effects remain even when numerous potentially con-founding factors are statistically controlled. Though such re-sults can never be totally conclusive, the variety of supportivestudies is suggestive of a strong, direct temperature-aggressionrelation. This type of work would benefit from replication at-tempts in very different settings. For instance, it would be quiteinformative to see analyses comparable to those presented byAnderson (1987) based on data from different parts of theworld.
The shape of the temperature-aggression function was notresolved by these data. Indeed, all one can say is that these stud-ies provided an opportunity for disconfirmation of the linear, J-
shaped, and U-shaped functions and that disconfirmation didnot occur. Similarly, the specific theories outlined earlier couldnot be tested.
Time Period Effects
The geographic region effects suffer from one additional in-terpretational problem, due to the level of analysis. Even thoughviolent or aggressive behavior is shown by those studies to berelatively more frequent in regions with hotter climates, thereis no evidence that the surplus violence occurred during hotterperiods of time. The temperature-aggression hypothesis pre-dicts, in decreasing order of time span, that hotter years, hotterquarters of the year, hotter months, and hotter days will be asso-ciated with relatively high levels of aggression, all else beingequal. Of course, all else is seldom equal. For instance, homi-cides increase dramatically in frequency around Christmas inmany regions, sometimes leading to an abnormally high bodycount for December and early January (e.g., Brearley, 1932;Rotton & Frey, 1985). The general strategy in examining timeperiod effects is again one of triangulation: By looking at a widevariety of aggression phenomena in different contexts, control-ling for as many potential confounds as possible, one may get agood overall look at the temperature-aggression hypothesis.
All the time period studies provide data relevant to the issueof the existence of temperature effects on aggression, of course.In addition, the studies in which the time period unit of analysisis days also allow an examination of the shape of the tempera-ture-aggression function. However, the problems of distin-guishing between the linear, J-shaped, and U-shaped functionsdiscussed earlier all apply. Nonetheless, the inverted-U-shapedfunction at higher temperatures can be clearly distinguishedand tested in some of the studies. Therefore, the Baron and Bellnegative affect escape model is examined and discussed, whereappropriate. These time period studies do not allow tests amongthe remaining four theories.
Effects of Hot Years and Seasons
Only one study was located in which differences in aggressionwere examined as a function of the hotness of years (Anderson,1987, Study 1). To find temperature-related differences in ag-gression among years requires a very large data base, so thatestimates of aggression will be reliable. Anderson (1987) stud-ied the relative frequency of violent and nonviolent crimes inthe United States (taken from the UCR) for a to-year period(1971-1980) as a function of quarter of the year and of year.Temperature data from 240 weather stations were sampled foreach year to estimate the differences in hotness among years.Thus, two types of predictions relevant to the temperature-ag-gression hypothesis were tested. First, it was expected that vio-lent crimes would be particularly frequent in the third and (toa lesser extent) second quarters and relatively inftequent in thefirst and fourth. Second, it was expected that hotter years woulddisplay higher violent-crime rates. Both predictions were con-firmed (ps < 00001). It was also predicted that temperature-related quarter and year effects on crime would be especiallypronounced on violent crimes (in relation to nonviolentcrimes). This specificity prediction was also strongly supported(ps < 00001).
TEMPERATURE AND AGGRESSION 81
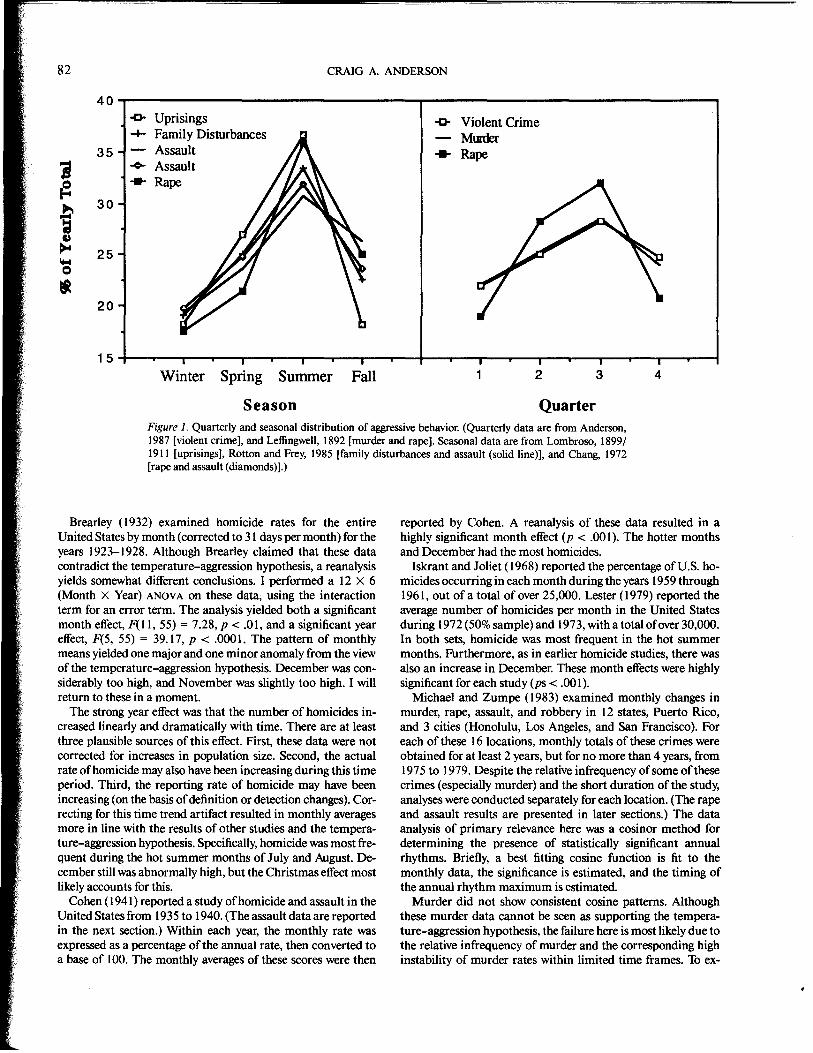
Leffingwell (1892) examined quarter-of-year effects on twobroad categories of violent crime in England and Wales for theyears 1878-1887. One category included murder, attemptedmurder, and manslaughter. After adjusting the data for theslightly different number of days that occur in the differentquarters, I performed a 10 X 4 (Year X Quarter) analysis ofvariance (ANOVA) and used the interaction as the error term.There was a significant quarter-of-year effect, F(3, 27) = 6.03,p < .0 I. As was expected from the temperature-aggression hy-pothesis, these "murderous assaults" were most frequent in thethird quarter (July, August, September). Indeed, the third-quar-ter mean was significantly higher than any of the other quarters(allps < 5)5).
The second category of violent crime reported by Leffingwellwas "Crimes Against Chastity," which included sexual assaultsand rape. The same 10 X 4 ANOVA was performed on thesedata, resulting in the same type of quarter effect, F(3, 27) =29.25, p < 00001. Once again, these violent crimes were signifi-cantly more frequent in the third quarter than in any other (allps < 5)5).
Though both types of crimes showed the same pattern andconfirmed the temperature-aggression hypothesis, it is interest-ing to note that the sexual assault data were considerably morereliable statistically than the homicide-related data. Althoughthere are several plausible interpretations for this, the simplestis that the former were much more frequent than the latter, andthus the quarter-to-quarter estimates may be relatively less in-fluenced by random fluctuations.
More recently, Cerbus (1970) failed to find a significant sea-sonal effect on homicide frequencies in Ohio for the period ofJune 1962 to May 1967. The total number of homicides duringthis period may have been too small to provide a sensitive test ofthe hypothesis. Interestingly, the peak did occur in the summermonths.
Lombroso ( 1899/1911) reported several data sets relevant tothe time period temperature-aggression hypothesis, includingseveral gathered by earlier researchers. Two types of violencemeasures amenable to statistical reanalysis were reported. Oneconcerned rapes by month of year and is examined in a latersection. The other concerned "uprisings," by which is probablymeant political rebellions and riots, by season of the year. Lom-broso's (1899/1911) report was based on an analysis of "the836 uprisings that took place in the whole world in the periodbetween 1791 and 1880" (p. 5). He found that on the wholesuch uprisings occurred more frequently in the summermonths. Lombroso (1899/ 1911) reported that "in Europe themaximum proved to be in July, and in South America in Janu-ary, which are respectively the two hottest months. The mini-mum falls in Europe in December and January, and in SouthAmerica in May and June, which again correspond in tempera-ture" (p. 6). The actual frequency of uprisings is reported onlyfor European countries (16) by season (spring, summer, au-tumn, and winter). In 10 of these countries there were fewerthan 25 uprisings, and they were thus deleted from my reanaly-sis. The remaining six countries were divided into the three hav-ing the highest frequency of uprisings (61 to 99) and the threehaving the lowest frequency of uprisings (25 to 29), and the datawere analyzed with a 4 X 2 (Seasons X High vs.low frequency)ANOVA. As was expected from Lombroso's description of theresults, a strong season effect emerged, with summer being the
most popular time period for uprisings, F(3, 16) = 7.55, p <.0 I. Indeed, the summer average was significantly higher thanany other period (all ps < 5)5).
One obvious question at this point is why Lombroso's (1899/1911) uprising data are so strongly related to season, given thatSchwartz (1968) found little evidence relating temperature topolitical violence. One possibility concerns methods. It may bethat in Schwartz's geographic regional analysis the political cli-mate of his sample of nations was correlated with temperatureand region in such a way as to hide any true temperature effects.Lombroso's seasonal analysis within countries eliminates manysuch confounds. Within Spain, for example, which experienced99 incidents, the political climate probably was pretty much thesame in the spring, summer, autumn, and winter.
A second possibility is that the definition of countable inci-dents varied between the two studies. Schwartz's (1968) defini-tion seemed to be based on planful acts of rebellion or revolu-tion rather than on more spontaneous forms of aggression. Inany case, Lombroso's (1899/1911) uprising data lend furthersupport to the temperature-aggression hypothesis, though thelack of specific methodological detail warrants some reserva-tions.
Rotton and Frey (1985) examined the relations among airpollution, temperature, humidity, and two types of aggressivebehavior (assaults and family disturbances) in Dayton, Ohio,for a 2-year period (1975-1976). A variety of complex regres-sion analyses were reported, most of which are beyond the scopeof this article. The basic findings of relevance here were thatboth types of aggressive behavior were significantly influencedby season (ps < 00001). Specifically, assaults and family distur-bances were most frequent in summer and least frequent inwinter.
Chang (1972) reported the frequency of three categories ofassault (assault, injury, other assault) and rape by season in Ko-rea in 1964. After correcting for slightly differing numbers ofdays in the seasons, I computed a chi-square for each type ofaggressive crime. In each case the summer months were associ-ated with the highest frequency of aggressive crimes (ps < 0101).
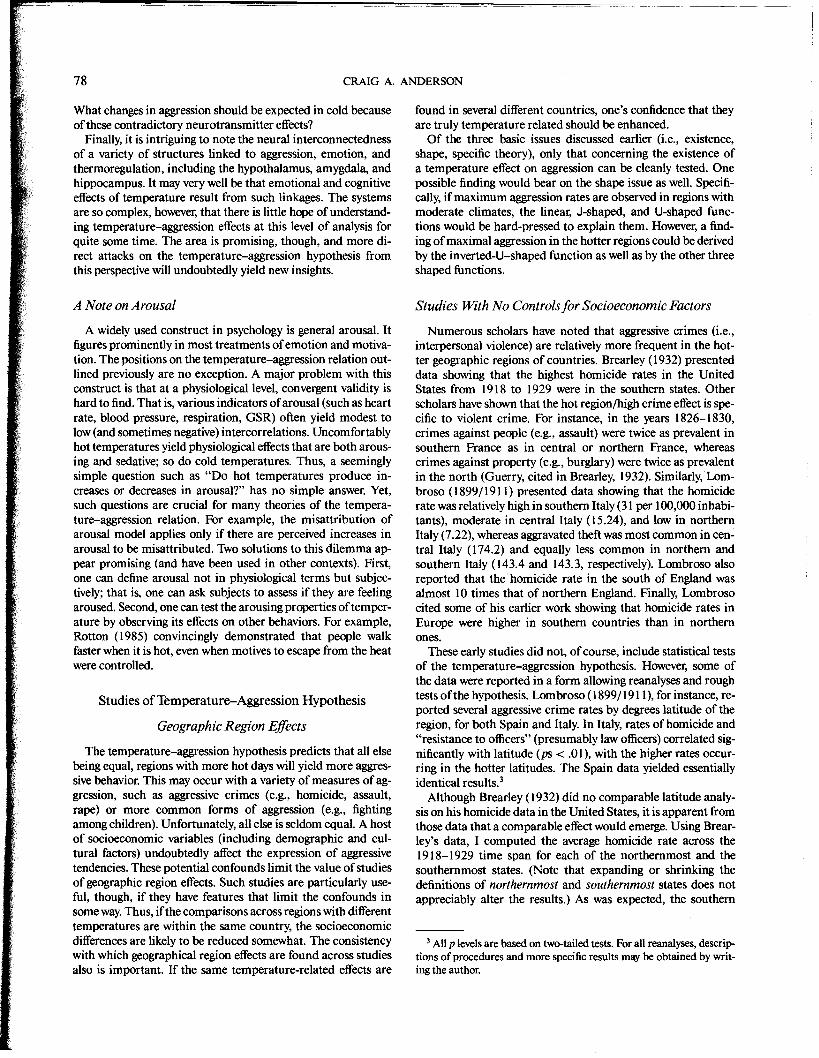
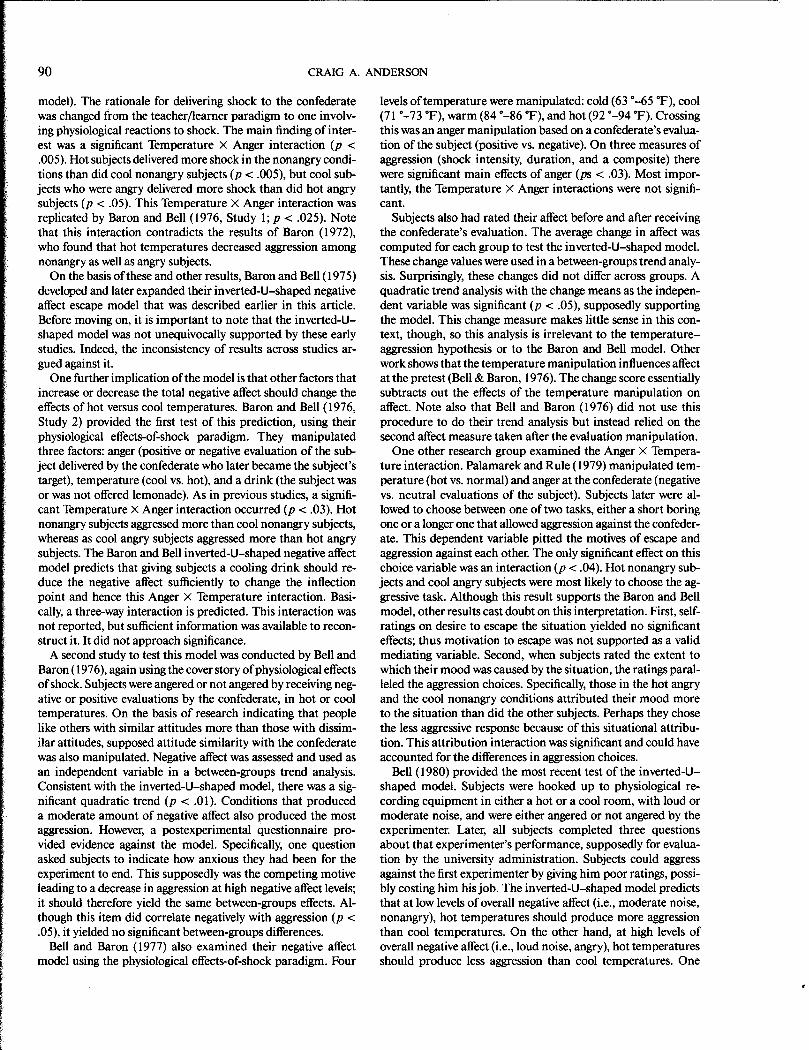
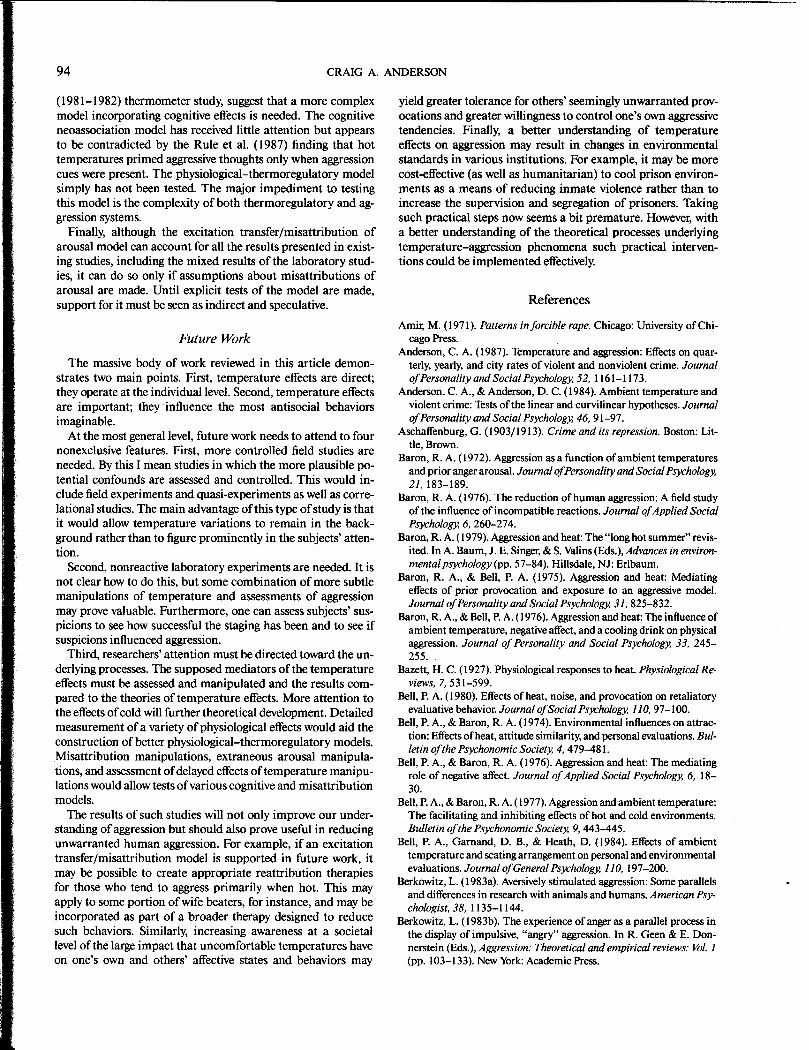
Figure 1 displays the results of these studies via a plot of thepercentage of the total violent incidents by time period. Notethat the Anderson (1987) and the Leffingwell (1892) results areby quarter; the others are by season.
Effects of Hot Months
The majority of time period studies used months as the unitof analysis. In this section all such studies having sufficient in-formation for statistical analysis by month are presented. Forease of exposition the studies are grouped by type of aggressionmeasure.
Homicide. Five studies each included large numbers ofhomi-cides and were gathered over periods of time ranging from 2 to6 years. Each of these five is reviewed briefly. Then, I present anaggregate analysis to get a good overall look at monthly effectson homicide. Such an analysis across studies and years is usefulboth as a meta-analytic tool and because it reduces any un-wanted distortions in observed effects due to extraneous factorssuch as unusual temperature patterns and unusual distributionof high-violence days (e.g., weekends) by month in a particularyear.
82
40I
-a- Uprisings-I- Family Disturbances
351-Assault
i -<>- Assault~....Rape
b 30
~It
~25....0
-20
CRAIG A. ANDERSON
15
Winter Spring Summer Fall
Season
-a- Violent Crime- MmderRape
2 3 4
QuarterFigure 1. Quarterly and seasonal distribution of aggressive behavior. (Quarterly data are from Anderson,1987 [violent crime], and Leffingwell, 1892 [murder and rape]. Seasonal data are from Lombroso, 1899/1911 [uprisings], Rotton and Frey, 1985 [family disturbances and assault (solid line)], and Chang, 1972[rape and assault (diamonds)].)
Brearley (1932) examined homicide rates for the entireUnited States by month (corrected to 31 days per month) for theyears 1923-1928. Although Brearley claimed that these datacontradict the temperature-aggression hypothesis, a reanalysisyields somewhat different conclusions. I performed a 12 X 6(Month X Year) ANOYAon these data, using the interactionterm for an error term. The analysis yielded both a significantmonth effect, F(ll, 55) = 7.28, p < 1,1, and a significant yeareffect, £(5, 55) = 39.17, p < 00001. The pattern of monthlymeans yielded one major and one minor anomaly from the viewof the temperature-aggression hypothesis. December was con-siderably too high, and November was slightly too high. I willreturn to these in a moment.
The strong year effect was that the number of homicides in-creased linearly and dramatically with time. There are at leastthree plausible sources of this effect. First, these data were notcorrected for increases in population size. Second, the actualrate of homicide may also have been increasing during this timeperiod. Third, the reporting rate of homicide may have beenincreasing (on the basis of definition or detection changes). Cor-recting for this time trend artifact resulted in monthly averagesmore in line with the results of other studies and the tempera-ture-aggression hypothesis. Specifically, homicide was most fre-quent during the hot summer months of July and August. De-cember still was abnormally high, but the Christmas effect mostlikely accounts for this.
Cohen ( 1941) reported a study of homicide and assault in theUnited States from 1935 to 1940. (The assault data are reportedin the next section.) Within each year, the monthly rate wasexpressed as a percentage of the annual rate, then converted toa base of 100. The monthly averages of these scores were then
reported by Cohen. A reanalysis of these data resulted in ahighly significant month effect (p < 0101). The hotter monthsand December had the most homicides.
Iskrant and Joliet (1968) reported the percentage of U.S. ho-micides occurring in each month during the years 1959 through1961, out of a total of over 25,000. Lester (1979) reported theaverage number of homicides per month in the United Statesduring 1972 (50% sample) and 1973, with a total of over 30,000.In both sets, homicide was most frequent in the hot summermonths. Furthermore, as in earlier homicide studies, there wasalso an increase in December. These month effects were highlysignificant for each study (ps < 0101).
Michael and Zumpe (1983) examined monthly changes inmurder, rape, assault, and robbery in 12 states, Puerto Rico,and 3 cities (Honolulu, Los Angeles, and San Francisco). Foreach of these 16 locations, monthly totals of these crimes wereobtained for at least 2 years, but for no more than 4 years, from1975 to 1979. Despite the relative infrequency of some of thesecrimes (especially murder) and the short duration of the study,analyses were conducted separately for each location. (The rapeand assault results are presented in later sections.) The dataanalysis of primary relevance here was a cosinor method fordetermining the presence of statistically significant annualrhythms. Briefly, a best fitting cosine function is fit to themonthly data, the significance is estimated, and the timing ofthe annual rhythm maximum is estimated.
Murder did not show consistent cosine patterns. Althoughthese murder data cannot be seen as supporting the tempera-ture-aggression hypothesis, the failure here is most likely due tothe relative infrequency of murder and the corresponding highinstability of murder rates within limited time frames. To ex-
9.0
8.8
i~b=~~\totQ
ttt
8.6
8.4
8.2
8.0
7.8
7.6
TEMPERATURE AND AGGRESSION 83
Jan. Mar. May July Sept. Nov.Feb. Apr. June Aug. Oct. Dec.
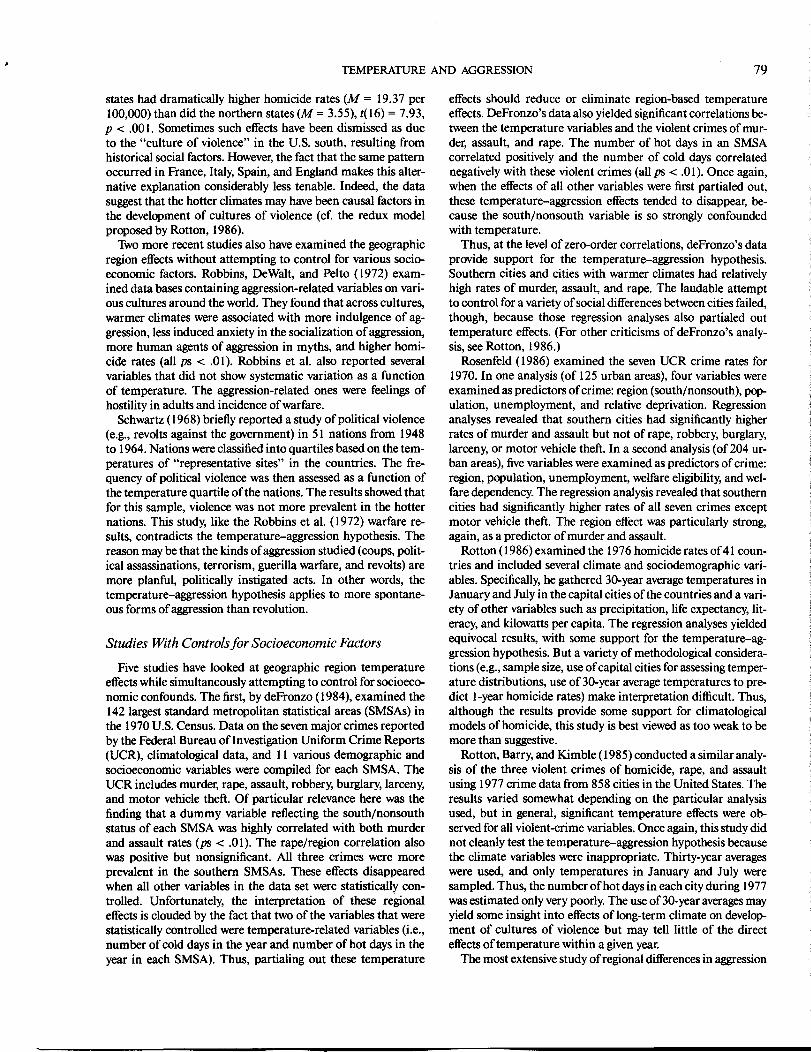
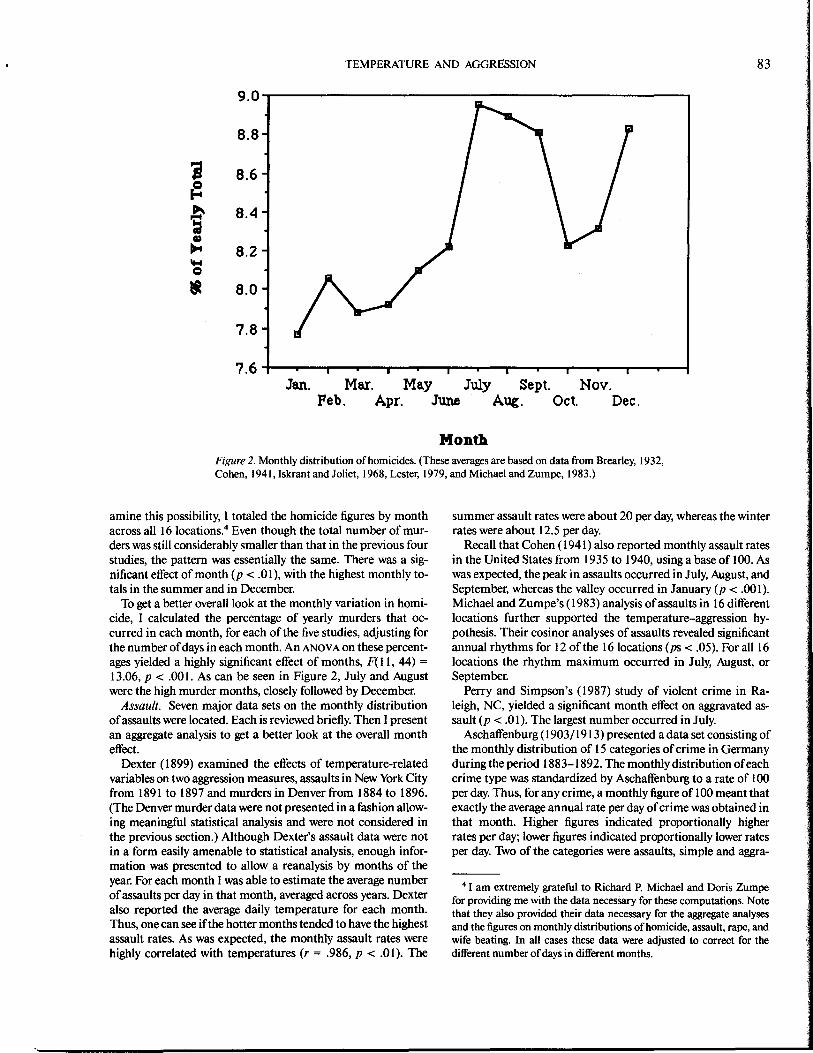
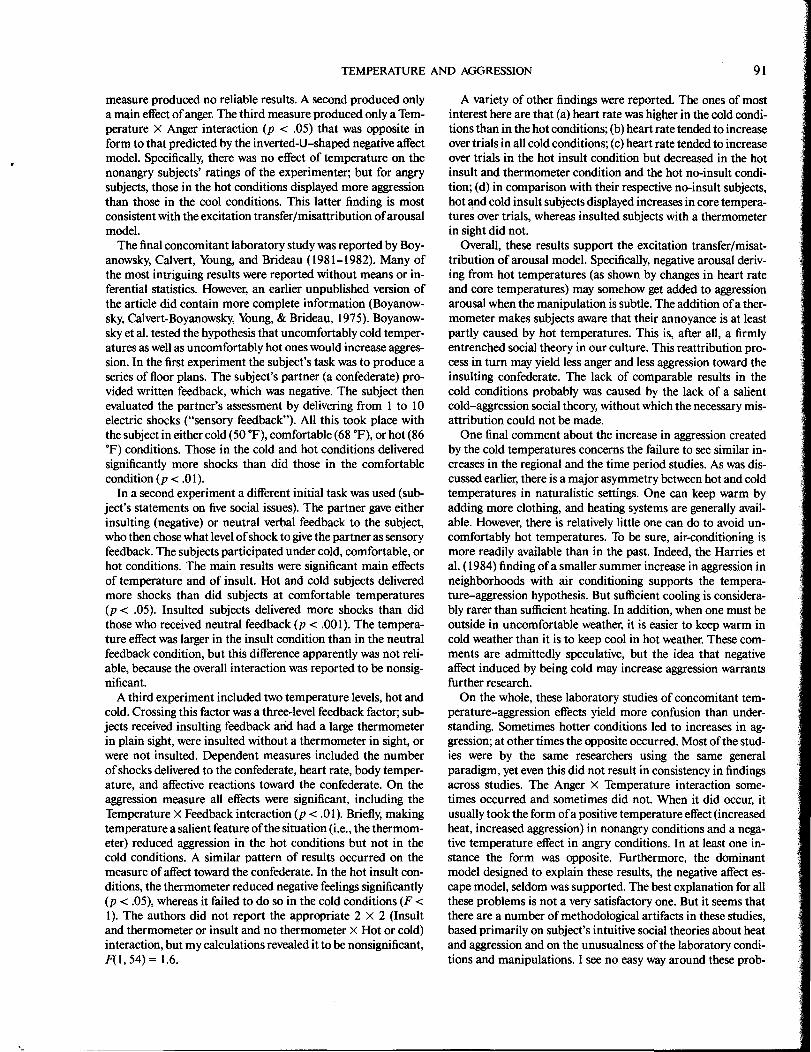
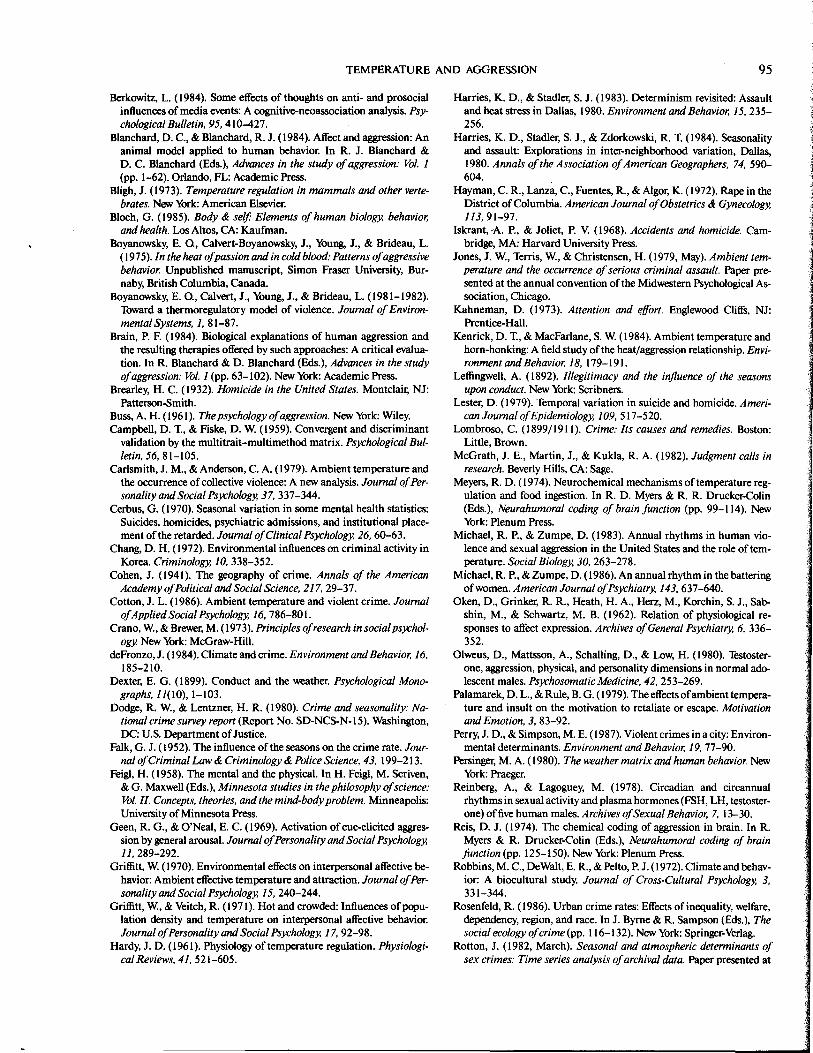
MonthFigure 2. Monthly distribution of homicides. (These averages are based on data from Brearley, 1932,Cohen, 1941, Iskrant and Joliet, 1968, Lester, 1979, and Michael and Zumpe, 1983.)
amine this possibility, I totaled the homicide figures by monthacross all 16 locations.4 Even though the total number of mur-ders was still considerably smaller than that in the previous fourstudies, the pattern was essentially the same. There was a sig-nificant effect of month (p < 1)1), with the highest monthly to-tals in the summer and in December.
To get a better overall look at the monthly variation in homi-cide, I calculated the percentage of yearly murders that oc-curred in each month, for each of the five studies, adjusting forthe number of days in each month. An ANOVAon these percent-ages yielded a highly significant effect of months, F( 11, 44) =13.06, p < 01.1. As can be seen in Figure 2, July and Augustwere the high murder months, closely followed by December.
Assault. Seven major data sets on the monthly distributionof assaults were located. Each is reviewed briefly. Then I presentan aggregate analysis to get a better look at the overall montheffect.
Dexter (1899) examined the effects of temperature-relatedvariables on two aggression measures, assaults in New York Cityfrom 1891 to 1897 and murders in Denver from 1884 to 1896.(The Denver murder data were not presented in a fashion allow-ing meaningful statistical analysis and were not considered inthe previous section.) Although Dexter's assault data were notin a form easily amenable to statistical analysis, enough infor-mation was presented to allow a reanalysis by months of theyear. For each month I was able to estimate the average numberof assaults per day in that month, averaged across years. Dexteralso reported the average daily temperature for each month.Thus, one can see if the hotter months tended to have the highestassault rates. As was expected, the monthly assault rates werehighly correlated with temperatures (r = 8686, p < 1)1). The
summer assault rates were about 20 per day, whereas the winterrates were about 12.5 per day.
Recall that Cohen (1941) also reported monthly assault ratesin the United States from 1935 to 1940, using a base of 100. Aswas expected, the peak in assaults occurred in July, August, andSeptember, whereas the valley occurred in January (p < 0101).Michael and Zumpe's (1983) analysis of assaults in 16 differentlocations further supported the temperature-aggression hy-pothesis. Their cosinor analyses of assaults revealed significantannual rhythms for 12 of the 16 locations (ps < 5)5). For all 16locations the rhythm maximum occurred in July, August, orSeptember.
Perry and Simpson's (1987) study of violent crime in Ra-leigh, NC, yielded a significant month effect on aggravated as-sault (p < 1)1). The largest number occurred in July.
Aschaffenburg (1903/1913) presented a data set consisting ofthe monthly distribution of 15 categories of crime in Germanyduring the period 1883-1892. The monthly distribution of eachcrime type was standardized by Aschaffenburg to a rate of 100per day. Thus, for any crime, a monthly figure of 100 meant thatexactly the average annual rate per day of crime was obtained inthat month. Higher figures indicated proportionally higherrates per day; lower figures indicated proportionally lower ratesper day. Two of the categories were assaults, simple and aggra-
4 I am extremely grateful to Richard P. Michael and Doris Zumpefor providing me with the data necessary for these computations. Notethat they also provided their data necessary for the aggregate analysesand the figures on monthly distributions of homicide, assault, rape, andwife beating. In all cases these data were adjusted to correct for thedifferent number of days in different months.
84 CRAIG A. ANDERSON
vated. In my reanalysis, each type of assault was treated as aseparate replication in a one-way ANOVA. As was expected, therelative frequency of both types of assaults peaked in the hottermonths, whereas the colder months displayed the fewest as-saults,F(II, 11)= 153,p<.001.
Dodge and Lentzner (1980) reported the assaults per monthin the United States for the 1973-1977 period. An ANOVAyielded highly significant month effects, F(11, 44) = 6.75, p <00001, with the most assaults occurring in the warmer months.
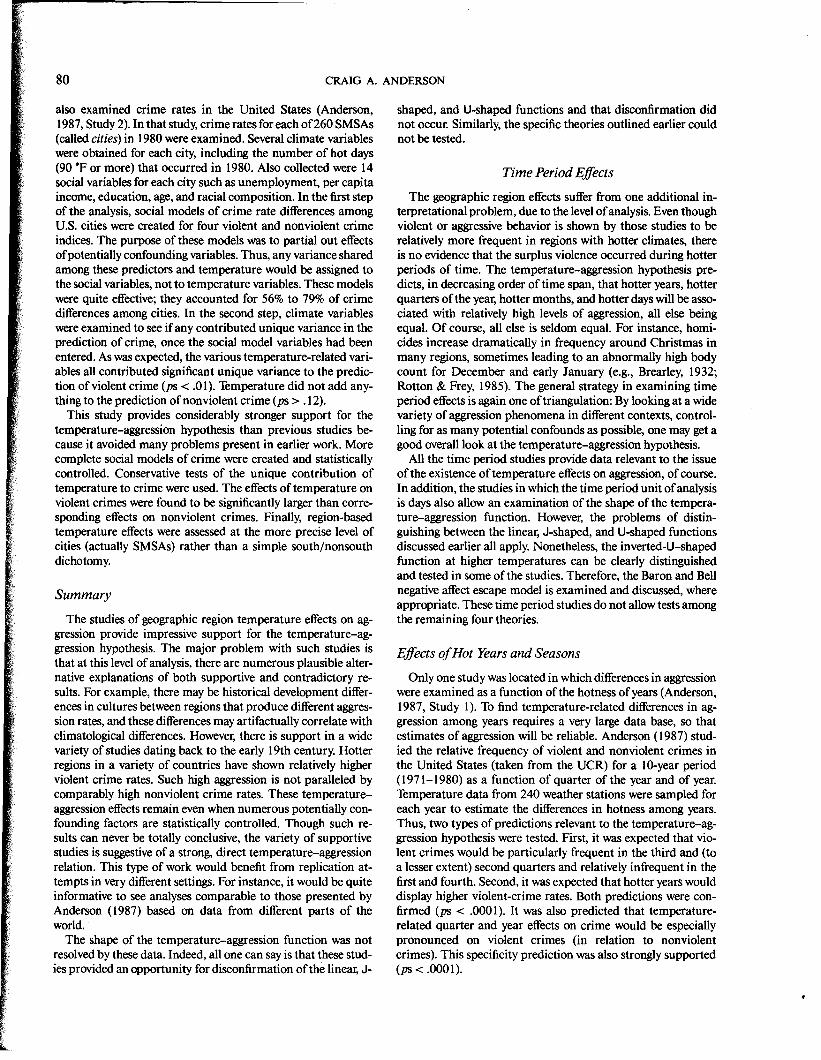
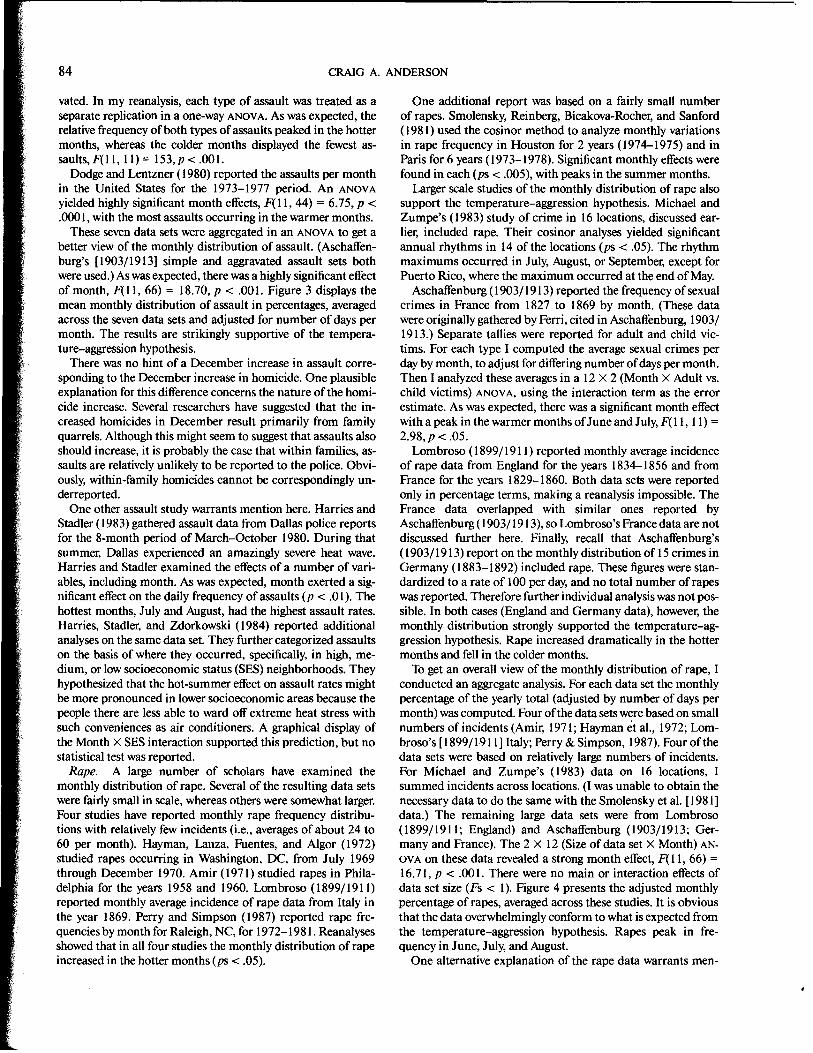
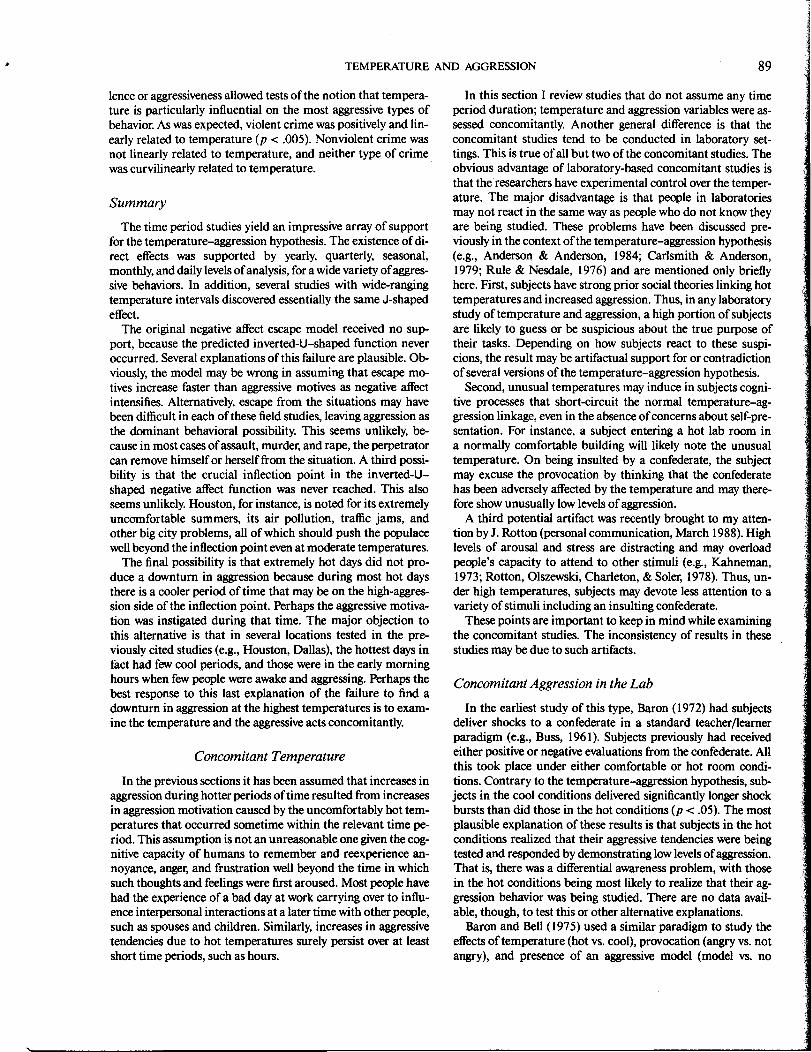
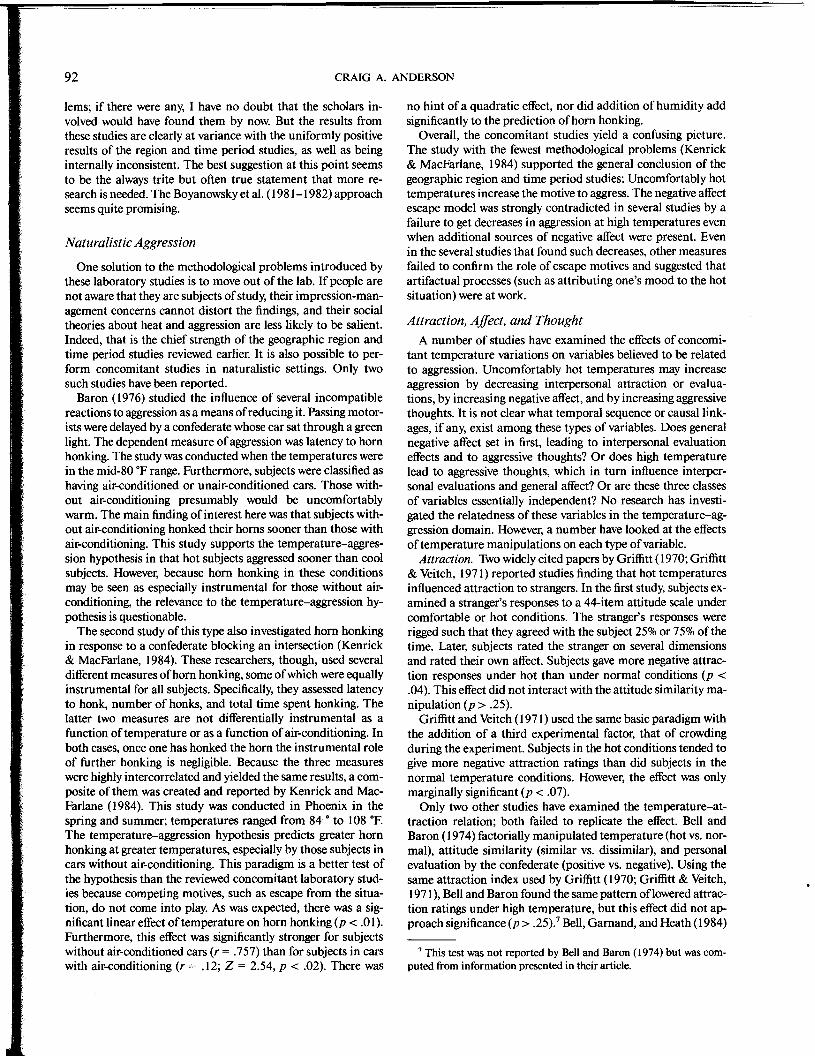
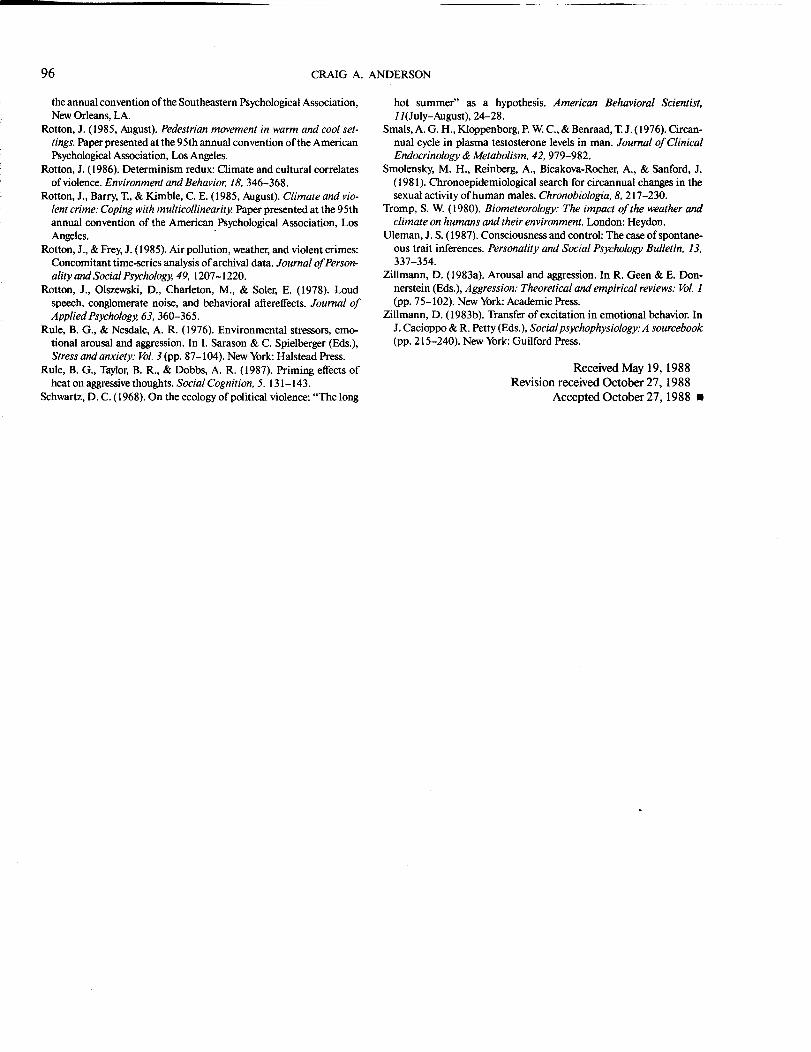
These seven data sets were aggregated in an ANOVA to get abetter view of the monthly distribution of assault. (Aschaffen-burg's [1903/1913] simple and aggravated assault sets bothwere used.) As was expected, there was a highly significant effectof month, F(11, 66) = 18.70, p < 01.1. Figure 3 displays themean monthly distribution of assault in percentages, averagedacross the seven data sets and adjusted for number of days permonth. The results are strikingly supportive of the tempera-ture-aggression hypothesis.
There was no hint of a December increase in assault corre-sponding to the December increase in homicide. One plausibleexplanation for this difference concerns the nature of the homi-cide increase. Several researchers have suggested that the in-creased homicides in December result primarily from familyquarrels. Although this might seem to suggest that assaults alsoshould increase, it is probably the case that within families, as-saults are relatively unlikely to be reported to the police. Obvi-ously, within-family homicides cannot be correspondingly un-derreported.
One other assault study warrants mention here. Harries andStadler (1983) gathered assault data from Dallas police reportsfor the 8-month period of March-October 1980. During thatsummer, Dallas experienced an amazingly severe heat wave.Harries and Stadler examined the effects of a number of vari-ables, including month. As was expected, month exerted a sig-nificant effect on the daily frequency of assaults (p < .0 I). Thehottest months, July and August, had the highest assault rates.Harries, Stadler, and Zdorkowski (1984) reported additionalanalyses on the same data set. They further categorized assaultson the basis of where they occurred, specifically, in high, me-dium, or low socioeconomic status (SES) neighborhoods. Theyhypothesized that the hot-summer effect on assault rates mightbe more pronounced in lower socioeconomic areas because thepeople there are less able to ward off extreme heat stress withsuch conveniences as air conditioners. A graphical display ofthe Month X SES interaction supported this prediction, but nostatistical test was reported.
Rape. A large number of scholars have examined themonthly distribution of rape. Several of the resulting data setswere fairly small in scale, whereas others were somewhat larger.Four studies have reported monthly rape frequency distribu-tions with relatively few incidents (i.e., averages of about 24 to60 per month). Hayman, Lanza, Fuentes, and Algor (1972)studied rapes occurring in Washington, DC, from July 1969through December 1970. Amir (1971) studied rapes in Phila-delphia for the years 1958 and 1960. Lombroso (1899/1911)reported monthly average incidence of rape data from Italy inthe year 1869. Perry and Simpson (1987) reported rape fre-quencies by month for Raleigh, NC, for 1972-1981. Reanalysesshowed that in all four studies the monthly distribution of rapeincreased in the hotter months (ps < 5)5).
One additional report was based on a fairly small numberof rapes. Smolensky, Reinberg, Bicakova-Rocher, and Sanford(1981) used the cosinor method to analyze monthly variationsin rape frequency in Houston for 2 years (1974-1975) and inParis for 6 years (1973-1978). Significant monthly effects werefound in each (ps < 0505), with peaks in the summer months.
Larger scale studies of the monthly distribution of rape alsosupport the temperature-aggression hypothesis. Michael andZumpe's (1983) study of crime in 16 locations, discussed ear-lier, included rape. Their cosinor analyses yielded significantannual rhythms in 14 of the locations (ps < 5)5). The rhythmmaximums occurred in July, August, or September, except forPuerto Rico, where the maximum occurred at the end of May.
Aschaffenburg (1903/1913) reported the frequency of sexualcrimes in France from 1827 to 1869 by month. (These datawere originally gathered by Ferri, cited in Aschaffenburg, 1903/1913.) Separate tallies were reported for adult and child vic-tims. For each type I computed the average sexual crimes perday by month, to adjust for differing number of days per month.Then I analyzed these averages in a 12 X 2 (Month X Adult vs.child victims) ANOVA, using the interaction term as the errorestimate. As was expected, there was a significant month effectwith a peak in the warmer months of June and July, F( 11, 11) =2.98,p < 5.5.
Lombroso (1899/1911) reported monthly average incidenceof rape data from England for the years 1834-1856 and fromFrance for the years 1829-1860. Both data sets were reportedonly in percentage terms, making a reanalysis impossible. TheFrance data overlapped with similar ones reported byAschaffenburg (1903/1913), so Lombroso's France data are notdiscussed further here. Finally, recall that Aschaffenburg's(1903/1913) report on the monthly distribution of 15 crimes inGermany (1883-1892) included rape. These figures were stan-dardized to a rate of lOOper day, and no total number of rapeswas reported. Therefore further individual analysis was not pos-sible. In both cases (England and Germany data), however, themonthly distribution strongly supported the temperature-ag-gression hypothesis. Rape increased dramatically in the hottermonths and fell in the colder months.
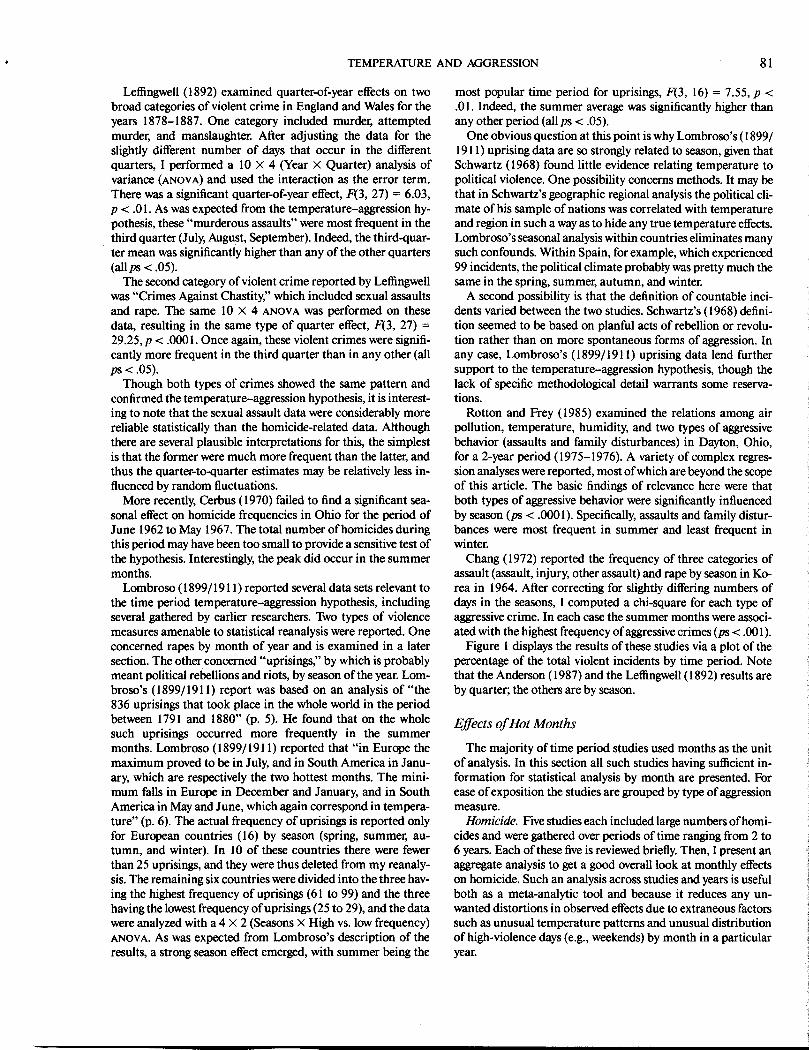
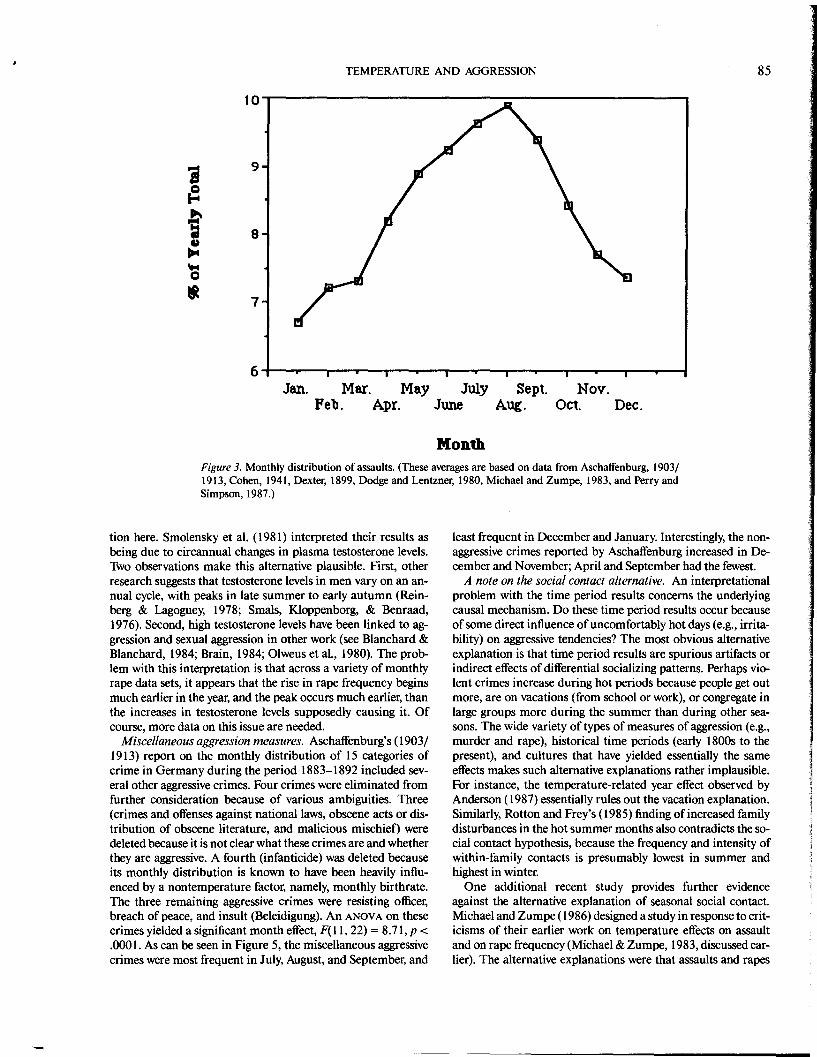
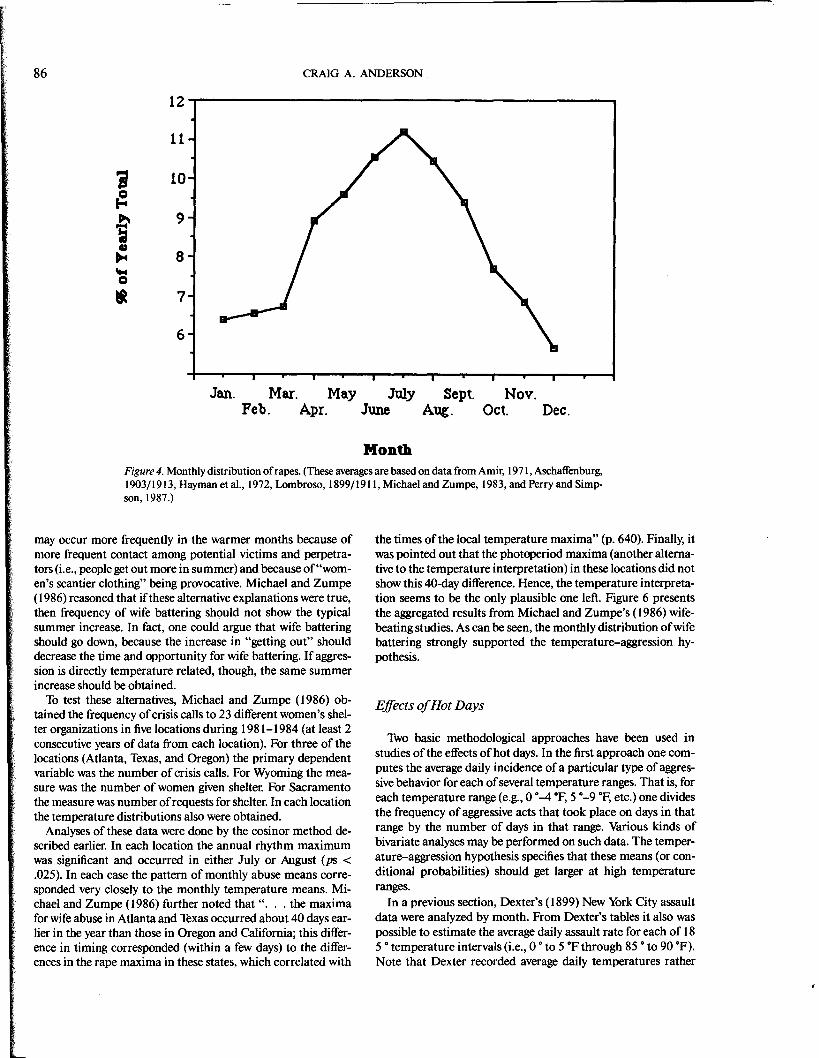
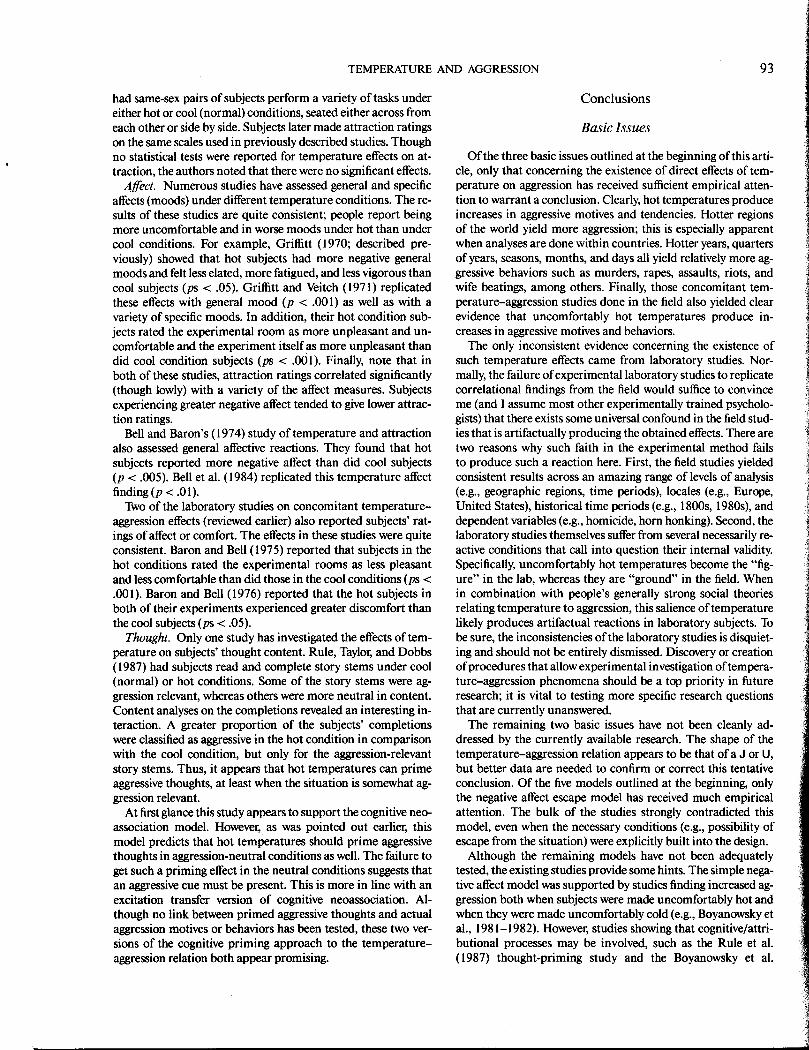
To get an overall view of the monthly distribution of rape, Iconducted an aggregate analysis. For each data set the monthlypercentage of the yearly total (adjusted by number of days permonth) was computed. Four ofthe data sets were based on smallnumbers of incidents (Amir, 1971; Hayman et aI., 1972; Lom-broso's [1899/1911] Italy; Perry & Simpson, 1987). Four ofthedata sets were based on relatively large numbers of incidents.For Michael and Zumpe's (1983) data on 16 locations, Isummed incidents across locations. (I was unable to obtain thenecessary data to do the same with the Smolensky et ai. [1981]data.) The remaining large data sets were from Lombroso(1899/1911; England) and Aschaffenburg (1903/1913; Ger-many and France). The 2 X 12 (Size of data set X Month) AN-OVAon these data revealed a strong month effect, F( 11, 66) =16.71, p < 0101. There were no main or interaction effects ofdata set size (Fs < 1). Figure 4 presents the adjusted monthlypercentage of rapes, averaged across these studies. It is obviousthat the data overwhelmingly conform to what is expected fromthe temperature-aggression hypothesis. Rapes peak in fre-quency in June, July, and August.
One alternative explanation of the rape data warrants men-
9.,
~~ia
G
~'to!CI
- 7
10
TEMPERATURE AND AGGRESSION 85
6Jan. Mar. May July Sept. Nov.
Feb. Apr. June Aug. Oct. Dec.
MonthFigure 3. Monthly distribution of assaults. (These averages are based on data from Aschaffenburg, 1903/1913, Cohen, 1941, Dexter, 1899, Dodge and Lentzner, 1980, Michael and Zumpe, 1983, and Perry andSimpson, 1987.)
tion here. Smolensky et al. (1981) interpreted their results asbeing due to circannual changes in plasma testosterone levels.Two observations make this alternative plausible. First, otherresearch suggests that testosterone levels in men vary on an an-nual cycle, with peaks in late summer to early autumn (Rein-berg & Lagoguey, 1978; Smals, Kloppenborg, & Benraad,1976). Second, high testosterone levels have been linked to ag-gression and sexual aggression in other work (see Blanchard &Blanchard, 1984; Brain, 1984; Olweus et aI., 1980). The prob-lem with this interpretation is that across a variety of monthlyrape data sets, it appears that the rise in rape frequency beginsmuch earlier in the year, and the peak occurs much earlier, thanthe increases in testosterone levels supposedly causing it. Ofcourse, more data on this issue are needed.
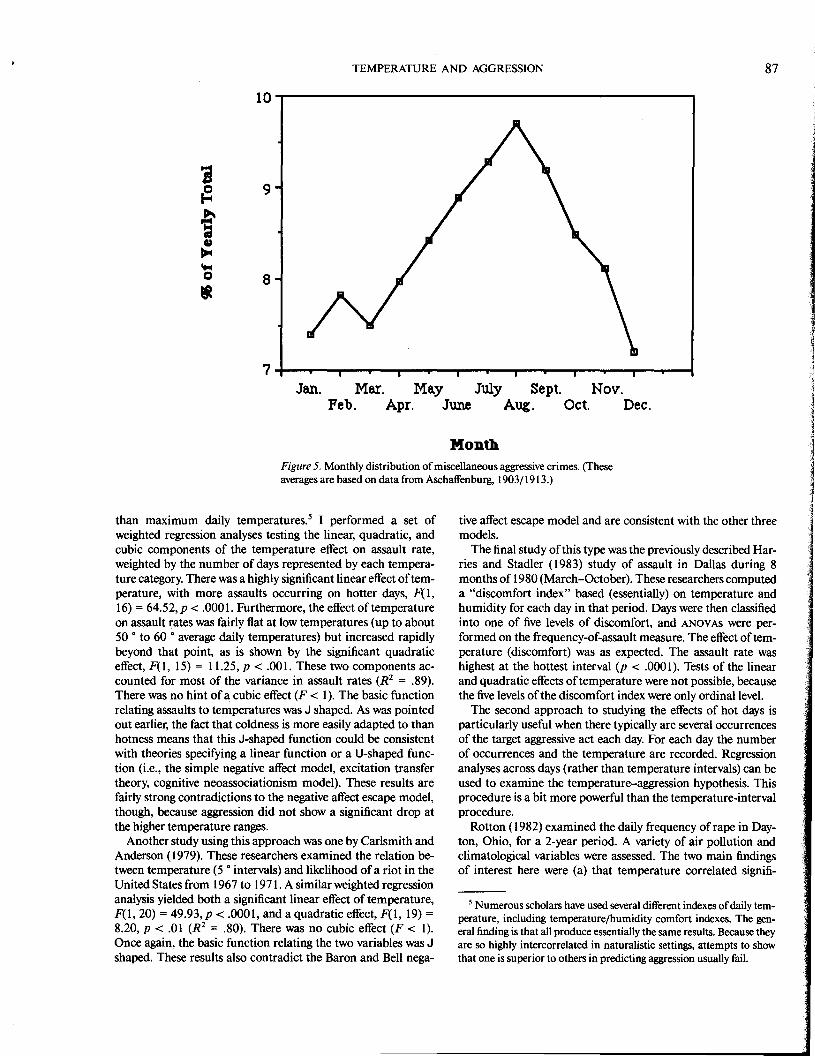
Miscellaneous aggression measures. Aschaffenburg's (1903/1913) report on the monthly distribution of 15 categories ofcrime in Germany during the period 1883-1892 included sev-eral other aggressive crimes. Four crimes were eliminated fromfurther consideration because of various ambiguities. Three(crimes and offenses against national laws, obscene acts or dis-tribution of obscene literature, and malicious mischief) weredeleted because it is not clear what these crimes are and whetherthey are aggressive. A fourth (infanticide) was deleted becauseits monthly distribution is known to have been heavily influ-enced by a nontemperature factor, namely, monthly birthrate.The three remaining aggressive crimes were resisting officer,breach of peace, and insult (Beleidigung). An ANOVA on thesecrimes yielded a significant month effect, F( II, 22) = 8.71, P <0000I. As can be seen in Figure 5, the miscellaneous aggressivecrimes were most frequent in July, August, and September, and
least frequent in December and January. Interestingly, the non-aggressive crimes reported by Aschaffenburg increased in De-cember and November; April and September had the fewest.
A note on the social contact alternative. An interpretationalproblem with the time period results concerns the underlyingcausal mechanism. Do these time period results occur becauseof some direct influence of uncomfortably hot days (e.g., irrita-bility) on aggressive tendencies? The most obvious alternativeexplanation is that time period results are spurious artifacts orindirect effects of differential socializing patterns. Perhaps vio-lent crimes increase during hot periods because people get outmore, are on vacations (from school or work), or congregate inlarge groups more during the summer than during other sea-sons. The wide variety of types of measures of aggression (e.g.,murder and rape), historical time periods (early 1800s to thepresent), and cultures that have yielded essentially the sameeffects makes such alternative explanations rather implausible.For instance, the temperature-related year effect observed byAnderson (1987) essentially rules out the vacation explanation.Similarly, Rotton and Frey's (1985) finding of increased familydisturbances in the hot summer months also contradicts the so-cial contact hypothesis, because the frequency and intensity ofwithin-family contacts is presumably lowest in summer andhighest in winter.
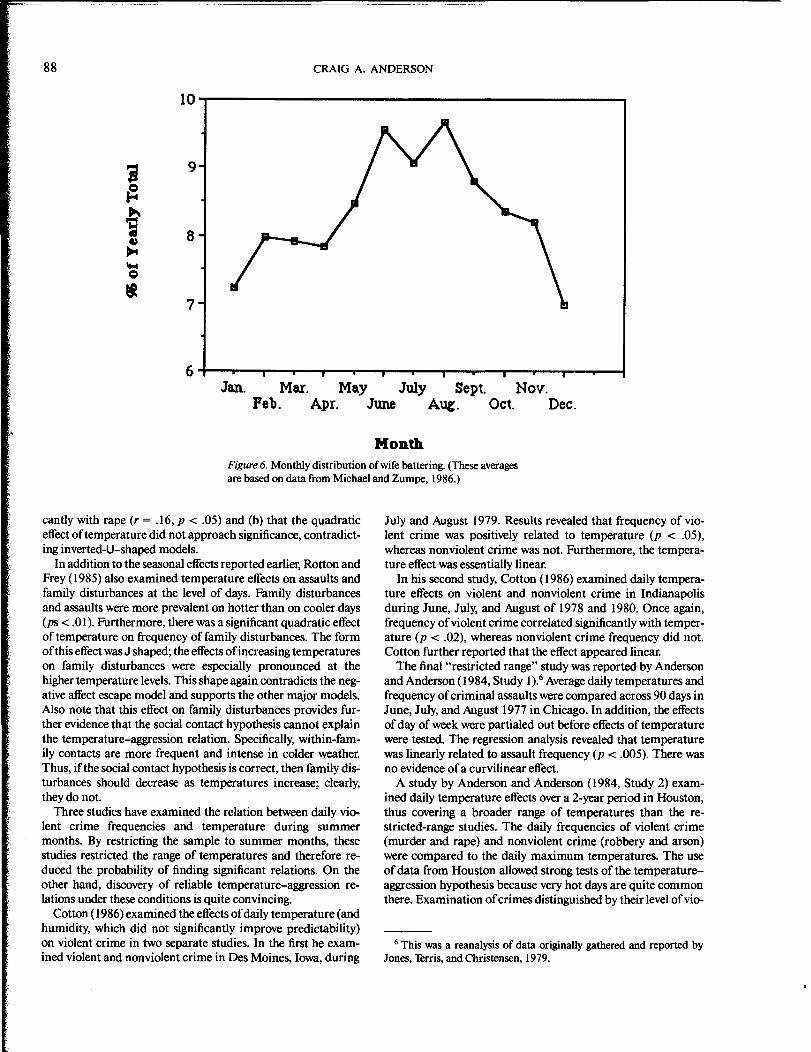
One additional recent study provides further evidenceagainst the alternative explanation of seasonal social contact.Michael and Zumpe (1986) designed a study in response to crit-icisms of their earlier work on temperature effects on assaultand on rape frequency (Michael & Zumpe, 1983, discussed ear-lier). The alternative explanations were that assaults and rapes
86
12
11
i 10
~b 9
~G~8
1M0
". 7
6
CRAIG A. ANDERSON
Jan. Mer. May July Sept. Nov.Feb. Apr. June Aug. Oct. Dec.
MonthFigure 4. Monthly distribution of rapes. (These averages are based on data from Amir, 1971, Aschaffenburg,1903/1913, Hayman et aI., 1972, Lombroso, 1899/1911, Michael and Zumpe, 1983, and Perry and Simp-son, 1987.)
may occur more frequently in the warmer months because ofmore frequent contact among potential victims and perpetra-tors (i.e., people get out more in summer) and because of"wom-en's scantier clothing" being provocative. Michael and Zumpe(1986) reasoned that if these alternative explanations were true,then frequency of wife battering should not show the typicalsummer increase. In fact, one could argue that wife batteringshould go down, because the increase in "getting out" shoulddecrease the time and opportunity for wife battering. If aggres-sion is directly temperature related, though, the same summerincrease should be obtained.
To test these alternatives, Michael and Zumpe (1986) ob-tained the frequency of crisis calls to 23 different women's shel-ter organizations in five locations during 1981-1984 (at least 2consecutive years of data from each location). For three of thelocations (Atlanta, Texas, and Oregon) the primary dependentvariable was the number of crisis calls. For Wyoming the mea-sure was the number of women given shelter. For Sacramentothe measure was number of requests for shelter. In each locationthe temperature distributions also were obtained.
Analyses of these data were done by the cosinor method de-scribed earlier. In each location the annual rhythm maximumwas significant and occurred in either July or August (ps <2525). In each case the pattern of monthly abuse means corre-sponded very closely to the monthly temperature means. Mi-chael and Zumpe (1986) further noted that ". . . the maximafor wife abuse in Atlanta and Texas occurred about 40 days ear-lier in the year than those in Oregon and California; this differ-ence in timing corresponded (within a few days) to the differ-ences in the rape maxima in these states, which correlated with
the times of the local temperature maxima" (p. 640). Finally, itwas pointed out that the photoperiod maxima (another alterna-tive to the temperature interpretation) in these locations did notshow this 40-day difference. Hence, the temperature interpreta-tion seems to be the only plausible one left. Figure 6 presentsthe aggregated results from Michael and Zumpe's (1986) wife-beating studies. As can be seen, the monthly distribution of wifebattering strongly supported the temperature-aggression hy-pothesis.
Effects of Hot Days
Two basic methodological approaches have been used instudies of the effects of hot days. In the first approach one com-putes the average daily incidence of a particular type of aggres-sive behavior for each of several temperature ranges. That is, foreach temperature range (e.g., 0 °-4 of, 5 °-9 of, etc.) one divides
the frequency of aggressive acts that took place on days in thatrange by the number of days in that range. Various kinds ofbivariate analyses may be performed on such data. The temper-ature-aggression hypothesis specifies that these means (or con-ditional probabilities) should get larger at high temperatureranges.
In a previous section, Dexter's (1899) New York City assaultdata were analyzed by month. From Dexter's tables it also waspossible to estimate the average daily assault rate for each of 185 o temperature intervals (i.e., 0 oto 5 of through 85 oto 90 OF).Note that Dexter recorded average daily temperatures rather
10
TEMPERATURE AND AGGRESSION 87
s~b=It~....0
-
9
8
7Jan. Mar. May July Sept. NoV'.
Feb. Apr. June Aug. Oct. Dec.
MonthFigure 5. Monthly distribution of miscellaneous aggressive crimes. (Theseaverages are based on data from Aschaffenburg, 1903/1913.)
than maximum daily temperatures.5 I performed a set ofweighted regression analyses testing the linear, quadratic, andcubic components of the temperature effect on assault rate,weighted by the number of days represented by each tempera-ture category. There was a highly significant linear effect oftem-perature, with more assaults occurring on hotter days, F( 1,16) = 64.52,p< 00001. Furthermore, the effect of temperatureon assault rates was fairly flat at low temperatures (up to about50 .to 60 .average daily temperatures) but increased rapidlybeyond that point, as is shown by the significant quadraticeffect, F(1, 15) = 11.25, p < 01.1. These two components ac-counted for most of the variancein assault rates (R2 = 9)9).There was no hint of a cubic effect (F < 1). The basic functionrelating assaults to temperatures was J shaped. As was pointedout earlier, the fact that coldness is more easily adapted to thanhotness means that this J-shaped function could be consistentwith theories specifying a linear function or a U-shaped func-tion (i.e., the simple negative affect model, excitation transfertheory, cognitive neoassociationism model). These results arefairly strong contradictions to the negative affect escape model,though, because aggression did not show a significant drop atthe higher temperature ranges.
Another study using this approach was one by Carlsmith andAnderson (1979). These researchers examined the relation be-tween temperature (5 .intervals) and likelihood of a riot in theUnited States from 1967 to 1971. A similar weighted regressionanalysis yielded both a significant linear effect of temperature,F(1, 20) = 49.93, p < 00001, and a quadratic effect, F(1, 19) =8.20, p < 101 (R2 = 0)0). There was no cubic effect (F < 1).Once again, the basic function relating the two variables was Jshaped. These results also contradict the Baron and Bell nega-
tive affect escape model and are consistent with the other threemodels.
The final study of this type was the previously described Har-ries and Stadler (1983) study of assault in Dallas during 8months of 1980 (March-October). These researchers computeda "discomfort index" based (essentially) on temperature andhumidity for each day in that period. Days were then classifiedinto one of five levels of discomfort, and ANOVAS were per-formed on the frequency-of-assault measure. The effect oftem-perature (discomfort) was as expected. The assault rate washighest at the hottest interval (p < 00001). Tests of the linearand quadratic effects oftemperature were not possible, becausethe five levels of the discomfort index were only ordinal level.
The second approach to studying the effects of hot days isparticularly useful when there typically are several occurrencesof the target aggressive act each day. For each day the numberof occurrences and the temperature are recorded. Regressionanalyses across days (rather than temperature intervals) can beused to examine the temperature-aggression hypothesis. Thisprocedure is a bit more powerful than the temperature-intervalprocedure.
Rotton (1982) examined the daily frequency of rape in Day-ton, Ohio, for a 2-year period. A variety of air pollution andclimatological variables were assessed. The two main findingsof interest here were (a) that temperature correlated signifi-
5Numerous scholars have used several different indexes of daily tem-perature, including temperature/humidity comfort indexes. The gen-eral finding is that all produce essentially the same results. Because theyare so highly intercorrelated in naturalistic settings, attempts to showthat one is superior to others in predicting aggression usually fail.
i 9
~b
~8
~~....0
- 7
88
10
CRAIG A. ANDERSON
6Jan. Mar. May July Sept. Nov.
Feb. Apr. June Aug. Oct. Dec.
MonthFigure 6. Monthly distribution of wife battering. (These averagesare based on data from Michael and Zumpe, 1986.)
cantly with rape (r = 6,6, p < 5)5) and (b) that the quadraticeffect oftemperature did not approach significance, contradict-ing inverted-U-shaped models.
In addition to the seasonal effects reported earlier, Rotton andFrey (1985) also examined temperature effects on assaults andfamily disturbances at the level of days. Family disturbancesand assaults were more prevalent on hotter than on cooler days(ps < .0 I). Furthermore, there was a significant quadratic effectof temperature on frequency of family disturbances. The formof this effect was J shaped; the effects ofincreasing temperatureson family disturbances were especially pronounced at thehigher temperature levels. This shape again contradicts the neg-ative affect escape model and supports the other major models.Also note that this effect on family disturbances provides fur-ther evidence that the social contact hypothesis cannot explainthe temperature-aggression relation. Specifically, within-fam-ily contacts are more frequent and intense in colder weather.Thus, if the social contact hypothesis is correct, then family dis-turbances should decrease as temperatures increase; clearly,they do not.
Three studies have examined the relation between daily vio-lent crime frequencies and temperature during summermonths. By restricting the sample to summer months, thesestudies restricted the range of temperatures and therefore re-duced the probability of finding significant relations. On theother hand, discovery of reliable temperature-aggression re-lations under these conditions is quite convincing.
Cotton (1986) examined the effects of daily temperature (andhumidity, which did not significantly improve predictability)on violent crime in two separate studies. In the first he exam-ined violent and nonviolent crime in Des Moines, Iowa, during
July and August 1979. Results revealed that frequency ofvio-lent crime was positively related to temperature (p < 5)5),whereas nonviolent crime was not. Furthermore, the tempera-ture effect was essentially linear.
In his second study, Cotton (1986) examined daily tempera-ture effects on violent and nonviolent crime in Indianapolisduring June, July, and August of 1978 and 1980. Once again,frequency of violent crime correlated significantly with temper-ature (p < 2)2), whereas nonviolent crime frequency did not.Cotton further reported that the effect appeared linear.
The final "restricted range" study was reported by Andersonand Anderson (1984, Study 1).6Average daily temperatures andfrequency of criminal assaults were compared across 90 days inJune, July, and August 1977 in Chicago. In addition, the effectsof day of week were partialed out before effects of temperaturewere tested. The regression analysis revealed that temperaturewas linearly related to assault frequency (p < 0505). There wasno evidence of a curvilinear effect.
A study by Anderson and Anderson (1984, Study 2) exam-ined daily temperature effects over a 2-year period in Houston,thus covering a broader range of temperatures than the re-stricted-range studies. The daily frequencies of violent crime(murder and rape) and nonviolent crime (robbery and arson)were compared to the daily maximum temperatures. The useof data from Houston allowed strong tests of the temperature-aggression hypothesis because very hot days are quite commonthere. Examination of crimes distinguished by their level of vio-
6 This was a reanalysis of data originally gathered and reported byJones, Terris, and Christensen, 1979.
TEMPERATURE AND AGGRESSION 89
lence or aggressiveness allowed tests of the notion that tempera-ture is particularly influential on the most aggressive types ofbehavior. As was expected, violent crime was positively and lin-early related to temperature (p < 0505). Nonviolent crime wasnot linearly related to temperature, and neither type of crimewas curvilinearly related to temperature.
Summary
The time period studies yield an impressive array of supportfor the temperature-aggression hypothesis. The existence of di-rect effects was supported by yearly, quarterly, seasonal,monthly, and daily levels of analysis, for a wide variety of aggres-sive behaviors. In addition, several studies with wide-rangingtemperature intervals discovered essentially the same J-shapedeffect.
The original negative affect escape model received no sup-port, because the predicted inverted-U-shaped function neveroccurred. Several explanations of this failure are plausible. Ob-viously, the model may be wrong in assuming that escape mo-tives increase faster than aggressive motives as negative affectintensifies. Alternatively, escape from the situations may havebeen difficult in each of these field studies, leaving aggression asthe dominant behavioral possibility. This seems unlikely, be-cause in most cases of assault, murder, and rape, the perpetratorcan remove himself or herself from the situation. A third possi-bility is that the crucial inflection point in the inverted-U-shaped negative affect function was never reached. This alsoseems unlikely. Houston, for instance, is noted for its extremelyuncomfortable summers, its air pollution, traffic jams, andother big city problems, all of which should push the populacewell beyond the inflection point even at moderate temperatures.
The final possibility is that extremely hot days did not pro-duce a downturn in aggression because during most hot daysthere is a cooler period of time that may be on the high-aggres-sion side of the inflection point. Perhaps the aggressive motiva-tion was instigated during that time. The major objection tothis alternative is that in several locations tested in the pre-viously cited studies (e.g., Houston, Dallas), the hottest days infact had few cool periods, and those were in the early morninghours when few people were awake and aggressing. Perhaps thebest response to this last explanation of the failure to find adownturn in aggression at the highest temperatures is to exam-ine the temperature and the aggressive acts concomitantly.
Concomitant Temperature
In the previous sections it has been assumed that increases inaggression during hotter periods of time resulted from increasesin aggression motivation caused by the uncomfortably hot tem-peratures that occurred sometime within the relevant time pe-riod. This assumption is not an unreasonable one given the cog-nitive capacity of humans to remember and reexperience an-noyance, anger, and frustration well beyond the time in whichsuch thoughts and feelings were first aroused. Most people havehad the experience of a bad day at work carrying over to influ-ence interpersonal interactions at a later time with other people,such as spouses and children. Similarly, increases in aggressivetendencies due to hot temperatures surely persist over at leastshort time periods, such as hours.
In this section I review studies that do not assume any timeperiod duration; temperature and aggression variables were as-sessed concomitantly. Another general difference is that theconcomitant studies tend to be conducted in laboratory set-tings. This is true of all but two of the concomitant studies. Theobvious advantage of laboratory-based concomitant studies isthat the researchers have experimental control over the temper-ature. The major disadvantage is that people in laboratoriesmay not react in the same way as people who do not know theyare being studied. These problems have been discussed pre-viously in the context of the temperature-aggression hypothesis(e.g., Anderson & Anderson, 1984; Carlsmith & Anderson,1979; Rule & Nesdale, 1976) and are mentioned only brieflyhere. First, subjects have strong prior social theories linking hottemperatures and increased aggression. Thus, in any laboratorystudy of temperature and aggression, a high portion of subjectsare likely to guess or be suspicious about the true purpose oftheir tasks. Depending on how subjects react to these suspi-cions, the result may be artifactual support for or contradictionof several versions of the temperature-aggression hypothesis.
Second, unusual temperatures may induce in subjects cogni-tive processes that short-circuit the normal temperature-ag-gression linkage, even in the absence of concerns about self-pre-sentation. For instance, a subject entering a hot lab room ina normally comfortable building will likely note the unusualtemperature. On being insulted by a confederate, the subjectmay excuse the provocation by thinking that the confederatehas been adversely affected by the temperature and may there-fore show unusually low levels of aggression.
A third potential artifact was recently brought to my atten-tion by J. Rotton (personal communication, March 1988). Highlevels of arousal and stress are distracting and may overloadpeople's capacity to attend to other stimuli (e.g., Kahneman,1973; Rotton, Olszewski, Charleton, & Soler, 1978). Thus, un-der high temperatures, subjects may devote less attention to avariety of stimuli including an insulting confederate.
These points are important to keep in mind while examiningthe concomitant studies. The inconsistency of results in thesestudies may be due to such artifacts.
Concomitant Aggression in the Lab
In the earliest study of this type, Baron (1972) had subjectsdeliver shocks to a confederate in a standard teacher/learnerparadigm (e.g., Buss, 1961). Subjects previously had receivedeither positive or negative evaluations from the confederate. Allthis took place under either comfortable or hot room condi-tions. Contrary to the temperature-aggression hypothesis, sub-jects in the cool conditions delivered significantly longer shockbursts than did those in the hot conditions (p < 5)5). The mostplausible explanation of these results is that subjects in the hotconditions realized that their aggressive tendencies were beingtested and responded by demonstrating low levels of aggression.That is, there was a differential awareness problem, with thosein the hot conditions being most likely to realize that their ag-gression behavior was being studied. There are no data avail-able, though, to test this or other alternative explanations.
Baron and Bell (1975) used a similar paradigm to study theeffects of temperature (hot vs. cool), provocation (angry vs. notangry), and presence of an aggressive model (model vs. no
90 CRAIG A. ANDERSON
model). The rationale for delivering shock to the confederatewas changed from the teacher/learner paradigm to one involv-ing physiological reactions to shock. The main finding of inter-est was a significant Temperature X Anger interaction (p <0505). Hot subjects delivered more shock in the nonangry condi-tions than did cool nonangry subjects (p < 0505), but cool sub-jects who were angry delivered more shock than did hot angrysubjects (p < 5)5). This Temperature X Anger interaction wasreplicated by Baron and Bell (1976, Study 1; p < 2525). Notethat this interaction contradicts the results of Baron (1972),who found that hot temperatures decreased aggression amongnonangry as well as angry subjects.
On the basis of these and other results, Baron and Bell (1975)developed and later expanded their inverted-U-shaped negativeaffect escape model that was described earlier in this article.Before moving on, it is important to note that the inverted-U-shaped model was not unequivocally supported by these earlystudies. Indeed, the inconsistency of results across studies ar-gued against it.
One further implication of the model is that other factors thatincrease or decrease the total negative affect should change theeffects of hot versus cool temperatures. Baron and Bell (1976,Study 2) provided the first test of this prediction, using theirphysiological effects-of-shock paradigm. They manipulatedthree factors: anger (positive or negative evaluation of the sub-ject delivered by the confederate who later became the subject'starget), temperature (cool vs. hot), and a drink (the subject wasor was not offered lemonade). As in previous studies, a signifi-cant Temperature X Anger interaction occurred (p < 3)3). Hotnonangry subjects aggressed more than cool nonangry subjects,whereas as cool angry subjects aggressed more than hot angrysubjects. The Baron and Bell inverted-U-shaped negative affectmodel predicts that giving subjects a cooling drink should re-duce the negative affect sufficiently to change the inflectionpoint and hence this Anger X Temperature interaction. Basi-cally, a three-way interaction is predicted. This interaction wasnot reported, but sufficient information was available to recon-struct it. It did not approach significance.
A second study to test this model was conducted by Bell andBaron ( 1976), again using the cover story of physiological effectsof shock. Subjects were angered or not angered by receiving neg-ative or positive evaluations by the confederate, in hot or cooltemperatures. On the basis of research indicating that peoplelike others with similar attitudes more than those with dissim-ilar attitudes, supposed attitude similarity with the confederatewas also manipulated. Negative affect was assessed and used asan independent variable in a between-groups trend analysis.Consistent with the inverted-U-shaped model, there was a sig-nificant quadratic trend (p < 1)1). Conditions that produceda moderate amount of negative affect also produced the mostaggression. However, a postexperimental questionnaire pro-vided evidence against the model. Specifically, one questionasked subjects to indicate how anxious they had been for theexperiment to end. This supposedly was the competing motiveleading to a decrease in aggression at high negative affect levels;it should therefore yield the same between-groups effects. Al-though this item did correlate negatively with aggression (p <5)5), it yielded no significant between-groups differences.
Bell and Baron (1977) also examined their negative affectmodel using the physiological effects-of-shock paradigm. Four
levels of temperature were manipulated: cold (63 °-65 OF),cool(71 °-73 OF),warm (84 °-86 OF),and hot (92 °-94 OF).Crossing
this was an anger manipulation based on a confederate's evalua-tion of the subject (positive vs. negative). On three measures ofaggression (shock intensity, duration, and a composite) therewere significant main effects of anger (ps < 3)3). Most impor-tantly, the Temperature X Anger interactions were not signifi-cant.
Subjects also had rated their affect before and after receivingthe confederate's evaluation. The average change in affect wascomputed for each group to test the inverted-U-shaped model.These change values were used in a between-groups trend analy-sis. Surprisingly, these changes did not differ across groups. Aquadratic trend analysis with the change means as the indepen-dent variable was significant (p < 5)5), supposedly supportingthe model. This change measure makes little sense in this con-text, though, so this analysis is irrelevant to the temperature-aggression hypothesis or to the Baron and Bell model. Otherwork shows that the temperature manipulation influences affectat the pretest (Bell & Baron, 1976). The change score essentiallysubtracts out the effects of the temperature manipulation onaffect. Note also that Bell and Baron (1976) did not use thisprocedure to do their trend analysis but instead relied on thesecond affect measure taken after the evaluation manipulation.
One other research group examined the Anger X Tempera-ture interaction. Palamarek and Rule (1979) manipulated tem-perature (hot vs. normal) and anger at the confederate (negativevs. neutral evaluations of the subject). Subjects later were al-lowed to choose between one of two tasks, either a short boringone or a longer one that allowed aggression against the confeder-ate. This dependent variable pitted the motives of escape andaggression against each other. The only significant effect on thischoice variable was an interaction (p < 4)4). Hot nonangry sub-jects and cool angry subjects were most likely to choose the ag-gressive task. Although this result supports the Baron and Bellmodel, other results cast doubt on this interpretation. First, self-ratings on desire to escape the situation yielded no significanteffects; thus motivation to escape was not supported as a validmediating variable. Second, when subjects rated the extent towhich their mood was caused by the situation, the ratings paral-leled the aggression choices. Specifically, those in the hot angryand the cool nonangry conditions attributed their mood moreto the situation than did the other subjects. Perhaps they chosethe less aggressive response because of this situational attribu-tion. This attribution interaction was significant and could haveaccounted for the differences in aggression choices.
Bell (1980) provided the most recent test of the inverted-U-shaped model. Subjects were hooked up to physiological re-cording equipment in either a hot or a cool room, with loud ormoderate noise, and were either angered or not angered by theexperimenter. Later, all subjects completed three questionsabout that experimenter's performance, supposedly for evalua-tion by the university administration. Subjects could aggressagainst the first experimenter by giving him poor ratings, possi-bly costing him his job. The inverted-U-shaped model predictsthat at low levels of overall negative affect (i.e., moderate noise,nonangry), hot temperatures should produce more aggressionthan cool temperatures. On the other hand, at high levels ofoverall negative affect (i.e., loud noise, angry), hot temperaturesshould produce less aggression than cool temperatures. One
TEMPERATURE AND AGGRESSION 91
measure produced no reliable results. A second produced onlya main effect of anger. The third measure produced only a Tem-perature X Anger interaction (p < 5)5) that was opposite in
form to that predicted by the inverted-U-shaped negative affectmodel. Specifically, there was no effect of temperature on thenonangry subjects' ratings of the experimenter; but for angrysubjects, those in the hot conditions displayed more aggressionthan those in the cool conditions. This latter finding is mostconsistent with the excitation transfer/misattribution of arousalmodel.
The final concomitant laboratory study was reported by Boy-anowsky, Calvert, Young, and Brideau (1981-1982). Many ofthe most intriguing results were reported without means or in-ferential statistics. However, an earlier unpublished version ofthe article did contain more complete information (Boyanow-sky, Calvert-Boyanowsky, Young, & Brideau, 1975). Boyanow-sky et al. tested the hypothesis that uncomfortably cold temper-atures as well as uncomfortably hot ones would increase aggres-sion. In the first experiment the subject's task was to produce aseries of floor plans. The subject's partner (a confederate) pro-vided written feedback, which was negative. The subject thenevaluated the partner's assessment by delivering from I to 10electric shocks ("sensory feedback"). All this took place withthe subject in either cold (50 OF),comfortable (68 OF),or hot (86OF) conditions. Those in the cold and hot conditions delivered
significantly more shocks than did those in the comfortablecondition (p < .0 I).
In a second experiment a different initial task was used (sub-ject's statements on five social issues). The partner gave eitherinsulting (negative) or neutral verbal feedback to the subject,who then chose what level of shock to give the partner as sensoryfeedback. The subjects participated under cold, comfortable, orhot conditions. The main results were significant main effectsof temperature and of insult. Hot and cold subjects deliveredmore shocks than did subjects at comfortable temperatures(p < 5)5). Insulted subjects delivered more shocks than didthose who received neutral feedback (p < 000I). The tempera-ture effect was larger in the insult condition than in the neutralfeedback condition, but this difference apparently was not reli-able, because the overall interaction was reported to be nonsig-nificant.
A third experiment included two temperature levels, hot andcold. Crossing this factor was a three-level feedback factor; sub-jects received insulting feedback arid had a large thermometerin plain sight, were insulted without a thermometer in sight, orwere not insulted. Dependent measures included the numberof shocks delivered to the confederate, heart rate, body temper-ature, and affective reactions toward the confederate. On theaggression measure all effects were significant, including theTemperature X Feedback interaction (p < 1)1). Briefly, makingtemperature a salient feature of the situation (i.e., the thermom-eter) reduced aggression in the hot conditions but not in thecold conditions. A similar pattern of results occurred on themeasure of affect toward the confederate. In the hot insult con-ditions, the thermometer reduced negative feelings significantly(p < 5)5), whereas it failed to do so in the cold conditions (F <I). The authors did not report the appropriate 2 X 2 (Insultand thermometer or insult and no thermometer X Hot or cold)interaction, but my calculations revealed it to be nonsignificant,F(l, 54) = 1.6.
'-
A variety of other findings were reported. The ones of mostinterest here are that (a) heart rate was higher in the cold condi-tions than in the hot conditions; (b) heart rate tended to increaseover trials in all cold conditions; (c) heart rate tended to increaseover trials in the hot insult condition but decreased in the hotinsult and thermometer condition and the hot no-insult condi-tion; (d) in comparison with their respective no-insult subjects,hot and cold insult subjects displayed increases in core tempera-tures over trials, whereas insulted subjects with a thermometerin sight did not.
Overall, these results support the excitation transfer/misat-tribution of arousal model. Specifically, negative arousal deriv-ing from hot temperatures (as shown by changes in heart rateand core temperatures) may somehow get added to aggressionarousal when the manipulation is subtle. The addition of a ther-mometer makes subjects aware that their annoyance is at leastpartly caused by hot temperatures. This is, after all, a firmlyentrenched social theory in our culture. This reattribution pro-cess in turn may yield less anger and less aggression toward theinsulting confederate. The lack of comparable results in thecold conditions probably was caused by the lack of a salientcold-aggression social theory, without which the necessary mis-attribution could not be made.
One final comment about the increase in aggression createdby the cold temperatures concerns the failure to see similar in-creases in the regional and the time period studies. As was dis-cussed earlier, there is a major asymmetry between hot and coldtemperatures in naturalistic settings. One can keep warm byadding more clothing, and heating systems are generally avail-able. However, there is relatively little one can do to avoid un-comfortably hot temperatures. To be sure, air-conditioning ismore readily available than in the past. Indeed, the Harries etal. (1984) finding of a smaller summer increase in aggression inneighborhoods with air conditioning supports the tempera-ture-aggression hypothesis. But sufficient cooling is considera-bly rarer than sufficient heating. In addition, when one must beoutside in uncomfortable weather, it is easier to keep warm incold weather than it is to keep cool in hot weather. These com-ments are admittedly speculative, but the idea that negativeaffect induced by being cold may increase aggression warrantsfurther research.
On the whole, these laboratory studies of concomitant tem-perature-aggression effects yield more confusion than under-standing. Sometimes hotter conditions led to increases in ag-gression; at other times the opposite occurred. Most ofthe stud-ies were by the same researchers using the same generalparadigm, yet even this did not result in consistency in findingsacross studies. The Anger X Temperature interaction some-times occurred and sometimes did not. When it did occur, itusually took the form of a positive temperature effect (increasedheat, increased aggression) in nonangry conditions and a nega-tive temperature effect in angry conditions. In at least one in-stance the form was opposite. Furthermore, the dominantmodel designed to explain these results, the negative affect es-cape model, seldom was supported. The best explanation for allthese problems is not a very satisfactory one. But it seems thatthere are a number of methodological artifacts in these studies,based primarily on subject's intuitive social theories about heatand aggression and on the unusualness of the laboratory condi-tions and manipulations. I see no easy way around these prob-
92 CRAIG A. ANDERSON
lems; if there were any, I have no doubt that the scholars in-volved would have found them by now. But the results fromthese studies are clearly at variance with the uniformly positiveresults of the region and time period studies, as well as beinginternally inconsistent. The best suggestion at this point seemsto be the always trite but often true statement that more re-search is needed. The Boyanowsky et al. (1981-1982) approachseems quite promising.
Naturalistic Aggression
One solution to the methodological problems introduced bythese laboratory studies is to move out of the lab. Ifpeople arenot aware that they are subjects of study, their impression-man-agement concerns cannot distort the findings, and their socialtheories about heat and aggression are less likely to be salient.Indeed, that is the chief strength of the geographic region andtime period studies reviewed earlier. It is also possible to per-form concomitant studies in naturalistic settings. Only twosuch studies have been reported.
Baron (1976) studied the influence of several incompatiblereactions to aggression as a means of reducing it. Passing motor-ists were delayed by a confederate whose car sat through a greenlight. The dependent measure of aggression was latency to hornhonking. The study was conducted when the temperatures werein the mid-80 of range. Furthermore, subjects were classified as
having air-conditioned or unair-conditioned cars. Those with-out air-conditioning presumably would be uncomfortablywarm. The main finding of interest here was that subjects with-out air-conditioning honked their horns sooner than those withair-conditioning. This study supports the temperature-aggres-sion hypothesis in that hot subjects aggressed sooner than coolsubjects. However, because horn honking in these conditionsmay be seen as especially instrumental for those without air-conditioning, the relevance to the temperature-aggression hy-pothesis is questionable.
The second study of this type also investigated horn honkingin response to a confederate blocking an intersection (Kenrick& MacFarlane, 1984). These researchers, though, used severaldifferent measures of horn honking, some of which were equallyinstrumental for all subjects. Specifically, they assessed latencyto honk, number of honks, and total time spent honking. Thelatter two measures are not differentially instrumental as afunction of temperature or as a function of air-conditioning. Inboth cases, once one has honked the horn the instrumental roleof further honking is negligible. Because the three measureswere highly intercorrelated and yielded the same results, a com-posite of them was created and reported by Kenrick and Mac-Farlane (1984). This study was conducted in Phoenix in thespring and summer; temperatures ranged from 84 o to 108 oF.The temperature-aggression hypothesis predicts greater hornhonking at greater temperatures, especially by those subjects incars without air-conditioning. This paradigm is a better test ofthe hypothesis than the reviewed concomitant laboratory stud-ies because competing motives, such as escape from the situa-tion, do not come into play. As was expected, there was a sig-nificant linear effect of temperature on horn honking (p < 1)1).Furthermore, this effect was significantly stronger for subjectswithout air-conditioned cars (r = 5757) than for subjects in carswith air-conditioning (r = 2;2; Z = 2.54, p < 2)2). There was
no hint of a quadratic effect, nor did addition of humidity addsignificantly to the prediction of horn honking.
Overall, the concomitant studies yield a confusing picture.The study with the fewest methodological problems (Kenrick& MacFarlane, 1984) supported the general conclusion of thegeographic region and time period studies: Uncomfortably hottemperatures increase the motive to aggress. The negative affectescape model was strongly contradicted in several studies by afailure to get decreases in aggression at high temperatures evenwhen additional sources of negative affect were present. Evenin the several studies that found such decreases, other measuresfailed to confirm the role of escape motives and suggested thatartifactual processes (such as attributing one's mood to the hotsituation) were at work.
Attraction, Affect, and Thought
A number of studies have examined the effects of concomi-tant temperature variations on variables believed to be relatedto aggression. Uncomfortably hot temperatures may increaseaggression by decreasing interpersonal attraction or evalua-tions, by increasing negative affect, and by increasing aggressivethoughts. It is not clear what temporal sequence or causal link-ages, if any, exist among these types of variables. Does generalnegative affect set in first, leading to interpersonal evaluationeffects and to aggressive thoughts? Or does high temperaturelead to aggressive thoughts, which in turn influence interper-sonal evaluations and general affect? Or are these three classesof variables essentially independent? No research has investi-gated the relatedness of these variables in the temperature-ag-gression domain. However, a number have looked at the effectsof temperature manipulations on each type ofvariable.
Attraction. Two widely cited papers by Griffitt (1970; Griffitt& Veitch, 1971) reported studies finding that hot temperaturesinfluenced attraction to strangers. In the first study, subjects ex-amined a stranger's responses to a 44-item attitude scale undercomfortable or hot conditions. The stranger's responses wererigged such that they agreed with the subject 25% or 75% of thetime. Later, subjects rated the stranger on several dimensionsand rated their own affect. Subjects gave more negative attrac-tion responses under hot than under normal conditions (p <4)4). This effect did not interact with the attitude similarity ma-nipulation (p > 5)5).
Griffitt and Veitch (1971) used the same basic paradigm withthe addition of a third experimental factor, that of crowdingduring the experiment. Subjects in the hot conditions tended togive more negative attraction ratings than did subjects in thenormal temperature conditions. However, the effect was onlymarginally significant (p < 7).7).
Only two other studies have examined the temperature-at-traction relation; both failed to replicate the effect. Bell andBaron (1974) factorially manipulated temperature (hot vs. nor-mal), attitude similarity (similar vs. dissimilar), and personalevaluation by the confederate (positive vs. negative). Using thesame attraction index used by Griffitt (1970; Griffitt & Veitch,1971), Bell and Baron found the same pattern oflowered attrac-tion ratings under high temperature, but this effect did not ap-proach significance (p > 5)5).7 Bell, Garnand, and Heath (1984)
7 This test was not reported by Bell and Baron (1974) but was com-puted from information presented in their article.
93TEMPERATURE AND AGGRESSION
had same-sex pairs of subjects perform a variety of tasks undereither hot or cool (normal) conditions, seated either across fromeach other or side by side. Subjects later made attraction ratingson the same scales used in previously described studies. Thoughno statistical tests were reported for temperature effects on at-traction, the authors noted that there were no significant effects.
Affect. Numerous studies have assessed general and specificaffects (moods) under different temperature conditions. The re-sults of these studies are quite consistent; people report beingmore uncomfortable and in worse moods under hot than undercool conditions. For example, Griffitt (1970; described pre-viously) showed that hot subjects had more negative generalmoods and felt less elated, more fatigued, and less vigorous thancool subjects (ps < 5)5). Griffitt and Veitch (1971) replicatedthese effects with general mood (p < 000I) as well as with avariety of specific moods. In addition, their hot condition sub-jects rated the experimental room as more unpleasant and un-comfortable and the experiment itself as more unpleasant thandid cool condition subjects (ps < 01)1). Finally, note that inboth of these studies, attraction ratings correlated significantly(though lowly) with a variety of the affect measures. Subjectsexperiencing greater negative affect tended to give lower attrac-tion ratings.
Bell and Baron's (1974) study of temperature and attractionalso assessed general affective reactions. They found that hotsubjects reported more negative affect than did cool subjects(p < 0505). Bell et al. (1984) replicated this temperature affectfinding (p < .0 I).
Two of the laboratory studies on concomitant temperature-aggression effects (reviewed earlier) also reported subjects' rat-ings of affect or comfort. The effects in these studies were quiteconsistent. Baron and Bell (1975) reported that subjects in thehot conditions rated the experimental rooms as less pleasantand less comfortable than did those in the cool conditions (ps <00001)Baron and Bell (1976) reported that the hot subjects inboth of their experiments experienced greater discomfort thanthe cool subjects (ps < 5)5).
Thought. Only one study has investigated the effects oftem-perature on subjects' thought content. Rule, Taylor, and Dobbs(1987) had subjects read and complete story stems under cool(normal) or hot conditions. Some of the story stems were ag-gression relevant, whereas others were more neutral in content.Content analyses on the completions revealed an interesting in-teraction. A greater proportion of the subjects' completionswere classified as aggressive in the hot condition in comparisonwith the cool condition, but only for the aggression-relevantstory stems. Thus, it appears that hot temperatures can primeaggressive thoughts, at least when the situation is somewhat ag-gression relevant.
At first glance this study appears to support the cognitive neo-association model. However, as was pointed out earlier, thismodel predicts that hot temperatures should prime aggressivethoughts in aggression-neutral conditions as well. The failure toget such a priming effect in the neutral conditions suggests thatan aggressive cue must be present. This is more in line with anexcitation transfer version of cognitive neoassociation. Al-though no link between primed aggressive thoughts and actualaggression motives or behaviors has been tested, these two ver-sions of the cognitive priming approach to the temperature-aggression relation both appear promising.
Conclusions
Basic Issues
Of the three basic issues outlined at the beginning of this arti-cle, only that concerning the existence of direct effects oftem-perature on aggression has received sufficient empirical atten-tion to warrant a conclusion. Clearly, hot temperatures produceincreases in aggressive motives and tendencies. Hotter regionsof the world yield more aggression; this is especially apparentwhen analyses are done within countries. Hotter years, quartersof years, seasons, months, and days all yield relatively more ag-gressive behaviors such as murders, rapes, assaults, riots, andwife beatings, among others. Finally, those concomitant tem-perature-aggression studies done in the field also yielded clearevidence that uncomfortably hot temperatures produce in-creases in aggressive motives and behaviors.
The only inconsistent evidence concerning the existence ofsuch temperature effects came from laboratory studies. Nor-mally, the failure of experimental laboratory studies to replicatecorrelational findings from the field would suffice to convinceme (and I assume most other experimentally trained psycholo-gists) that there exists some universal confound in the field stud-ies that is artifactually producing the obtained effects. There aretwo reasons why such faith in the experimental method failsto produce such a reaction here. First, the field studies yieldedconsistent results across an amazing range of levels of analysis(e.g., geographic regions, time periods), locales (e.g., Europe,United States), historical time periods (e.g., 1800s, 1980s), anddependent variables (e.g., homicide, horn honking). Second, thelaboratory studies themselves suffer from several necessarily re-active conditions that call into question their internal validity.Specifically, uncomfortably hot temperatures become the "fig-ure" in the lab, whereas they are "ground" in the field. Whenin combination with people's generally strong social theoriesrelating temperature to aggression, this salience of temperaturelikely produces artifactual reactions in laboratory subjects. Tobe sure, the inconsistencies of the laboratory studies is disquiet-ing and should not be entirely dismissed. Discovery or creationof procedures that allow experimental investigation oftempera-ture-aggression phenomena should be a top priority in futureresearch; it is vital to testing more specific research questionsthat are currently unanswered.
The remaining two basic issues have not been cleanly ad-dressed by the currently available research. The shape of thetemperature-aggression relation appears to be that of a J or U,but better data are needed to confirm or correct this tentativeconclusion. Of the five models outlined at the beginning, onlythe negative affect escape model has received much empiricalattention. The bulk of the studies strongly contradicted thismodel, even when the necessary conditions (e.g., possibility ofescape from the situation) were explicitly built into the design.
Although the remaining models have not been adequatelytested, the existing studies provide some hints. The simple nega-tive affect model was supported by studies finding increased ag-gression both when subjects were made uncomfortably hot andwhen they were made uncomfortably cold (e.g., Boyanowsky etal., 1981-1982). However, studies showing that cognitivejattri-butional processes may be involved, such as the Rule et al.(1987) thought-priming study and the Boyanowsky et al.
94 CRAIG A. ANDERSON
(1981-1982) thermometer study, suggest that a more complexmodel incorporating cognitive effects is needed. The cognitiveneoassociation model has received little attention but appearsto be contradicted by the Rule et al. (1987) finding that hottemperatures primed aggressive thoughts only when aggressioncues were present. The physiological-thermoregulatory modelsimply has not been tested. The major impediment to testingthis model is the complexity of both thermoregulatory and ag-gression systems.
Finally, although the excitation transfer/misattribution ofarousal model can account for all the results presented in exist-ing studies, including the mixed results of the laboratory stud-ies, it can do so only if assumptions about misattributions ofarousal are made. Until explicit tests of the model are made,support for it must be seen as indirect and speculative.
Future Work
The massive body of work reviewed in this article demon-strates two main points. First, temperature effects are direct;they operate at the individual level. Second, temperature effectsare important; they influence the most antisocial behaviorsimaginable.
At the most general level, future work needs to attend to fournonexclusive features. First, more controlled field studies areneeded. By this I mean studies in which the more plausible po-tential confounds are assessed and controlled. This would in-clude field experiments and quasi-experiments as well as corre-lational studies. The main advantage of this type of study is thatit would allow temperature variations to remain in the back-ground rather than to figure prominently in the subjects' atten-tion.
Second, nonreactive laboratory experiments are needed. It isnot clear how to do this, but some combination of more subtlemanipulations of temperature and assessments of aggressionmay prove valuable. Furthermore, one can assess subjects' sus-picions to see how successful the staging has been and to see ifsuspicions influenced aggression.
Third, researchers' attention must be directed toward the un-derlying processes. The supposed mediators of the temperatureeffects must be assessed and manipulated and the results com-pared to the theories of temperature effects. More attention tothe effects of cold will further theoretical development. Detailedmeasurement of a variety of physiological effects would aid theconstruction of better physiological-thermoregulatory models.Misattribution manipulations, extraneous arousal manipula-tions, and assessment of delayed effects of temperature manipu-lations would allow tests of various cognitive and misattributionmodels.
The results of such studies will not only improve our under-standing of aggression but should also prove useful in reducingunwarranted human aggression. For example, if an excitationtransfer/misattribution model is supported in future work, itmay be possible to create appropriate reattribution therapiesfor those who tend to aggress primarily when hot. This mayapply to some portion of wife beaters, for instance, and may beincorporated as part of a broader therapy designed to reducesuch behaviors. Similarly, increasing awareness at a societallevel of the large impact that uncomfortable temperatures haveon one's own and others' affective states and behaviors may
yield greater tolerance for others' seemingly unwarranted prov-ocations and greater willingness to control one's own aggressivetendencies. Finally, a better understanding of temperatureeffects on aggression may result in changes in environmentalstandards in various institutions. For example, it may be morecost-effective (as well as humanitarian) to cool prison environ-ments as a means of reducing inmate violence rather than toincrease the supervision and segregation of prisoners. Takingsuch practical steps now seems a bit premature. However, witha better understanding of the theoretical processes underlyingtemperature-aggression phenomena such practical interven-tions could be implemented effectively.
References
Amir, M. (1971). Patterns inforcible rape. Chicago: University of Chi-cago Press.
Anderson, C. A. (1987). Temperature and aggression: Effects on quar-terly, yearly, and city rates of violent and nonviolent crime. Journalof Personality and Social Psychology, 52, 1161-1173.
Anderson, C. A., & Anderson, D. C. (1984). Ambient temperature andviolent crime: Tests of the linear and curvilinear hypotheses. Journalof Personality and Social Psychology, 46, 91-97.
Aschaffenburg, G. (1903/1913). Crime and its repression. Boston: Lit-tle, Brown.
Baron, R. A. (1972). Aggression as a function of ambient temperaturesand prior anger arousal. Journal of Personality and Social Psychology,21, 183-189.
Baron, R. A. (1976). The reduction of human aggression: A field studyof the influence of incompatible reactions. Journal of Applied SocialPsychology, 6, 260-274.
Baron, R. A. (1979). Aggression and heat: The "long hot summer" revis-ited. In A. Baum, J. E. Singer, & S. Valins (Eds.), Advances in environ-mental psychology (pp. 57-84). Hillsdale, NJ: Erlbaum.
Baron, R. A., & Bell, P. A. (1975). Aggression and heat: Mediatingeffects of prior provocation and exposure to an aggressive model.Journal of Personality and Social Psychology, 31, 825-832.
Baron, R. A., & Bell, P. A. (1976). Aggression and heat: The influence ofambient temperature, negative affect, and a cooling drink on physicalaggression. Journal of Personality and Social Psychology, 33, 245-255.
Bazett, H. C. (1927). Physiological responses to heat. Physiological Re-views, 7,531-599.
Bell, P. A. (1980). Effects of heat, noise, and provocation on retaliatoryevaluative behavior. Journal of Social Psychology, 110,97-100.
Bell, P. A., & Baron, R. A. (1974). Environmental influences on attrac-tion: Effects of heat, attitude similarity, and personal evaluations. Bul-letin of the Psychonomic Society, 4, 479-481.
Bell, P. A., & Baron, R. A. (1976). Aggression and heat: The mediatingrole of negative affect. Journal of Applied Social Psychology, 6, 18-30.
Bell, P. A., & Baron, R. A. ( 1977). Aggression and ambient temperature:
The facilitating and inhibiting effects of hot and cold environments.Bulletin of the Psychonomic Society, 9,443-445.
Bell, P. A., Garnand, D. B., & Heath, D. (1984). Effects of ambienttemperature and seating arrangement on personal and environmentalevaluations. Journal of General Psychology, 110, 197-200.
Berkowitz, L. (1983a). Aversively stimulated aggression: Some parallelsand differences in research with animals and humans. American Psy-chologist, 38, 1135-1144.
Berkowitz, L. (1983b). The experience of anger as a parallel process inthe display of impulsive, "angry" aggression. In R. Geen & E. Don-nerstein (Eds.), Aggression: Theoretical and empirical reviews: HJI.1(pp. 103-133). New York: Academic Press.
TEMPERATURE AND AGGRESSION 95
Berkowitz, L (1984). Some effects of thoughts on anti- and prosocialinfluences of media events: A cognitive-neoassociation analysis. Psy-chological Bulletin. 95.410-427.
Blanchard, D. c., & Blanchard, R. J. (1984). Affect and aggression: Ananimal model applied to human behavior. In R. J. Blanchard &D. C. Blanchard (Eds.), Advances in the study of aggression: JfJI. 1(pp. 1-62). Orlando, FL: Academic Press.
Bligh, J. (1973). Temperature regulation in mammals and other verte-brates. New York: American Elsevier.
Bloch, G. (1985). Body & self: Elements of human biology. behavior.and health. Los Altos, CA: Kaufman.
Boyanowsky, E. Q, Calvert-Boyanowsky, J., Young, J., & Brideau, L(1975). In the heat of passion and in cold blood: Patterns ofaggressivebehavior. Unpublished manuscript, Simon Fraser University, Bur-naby, British Columbia, Canada.
Boyanowsky, E. 0., Calvert, J., Young, J., & Brideau, L. (1981-1982).Toward a thermoregulatory model of violence. Journal of Environ-mental Systems. 1.81-87.
Brain, P. F. (1984). Biological explanations of human aggression andthe resulting therapies offered by such approaches: A critical evalua-tion. In R. Blanchard & D. Blanchard (Eds.), Advances in the studyof aggression: JfJI.1 (pp. 63-102). New York: Academic Press.
Brearley, H. C. (1932). Homicide in the United States. Montclair, NJ:Patterson-Smith.
Buss, A. H. (1961). The psychology of aggression. New York: Wiley.Campbell, D. T., & Fiske, D. W. (1959). Convergent and discriminant
validation by the multitrait-multimethod matrix. Psychological Bul-letin. 56,81-105.
Carlsmith, J. M., & Anderson, C. A. (1979). Ambient temperature andthe occurrence of collective violence: A new analysis. Journal of Per-sonalityand Social Psychology. 37. 337-344.
Cerbus, G. (1970). Seasonal variation in some mental health statistics:Suicides, homicides, psychiatric admissions, and institutional place-ment of the retarded. Journal of Clinical Psychology. 26. 60-63.
Chang, D. H. (1972). Environmental influences on criminal activity inKorea. Criminology. 10. 338-352.
Cohen, J. (1941). The geography of crime. Annals of the AmericanAcademy of Political and Social Science. 217, 29-37.
Cotton, J. L (1986). Ambient temperature and violent crime. Journalof Applied Social Psychology. 16. 786-801.
Crano, w., & Brewer, M. (1973). Principles of research in social psychol-ogy. New York: McGraw-Hill.
deFronzo, J. (1984). Climate and crime. Environment and Behavior. 16.185-210.
Dexter, E. G. (1899). Conduct and the weather. Psychological Mono-graphs. 11(10), 1-103.
Dodge, R. W., & Lentzner, H. R. (1980). Crime and seasonality: Na-tional crime survey report (Report No. SD-NCS-N-15). Washington,DC: U.S. Department of Justice.
Falk, G. J. (1952). The influence of the seasons on the crime rate. Jour-nal of Criminal Law & Criminology & Police Science. 43, 199-213.
Feigl, H. (1958). The mental and the physical. In H. Feigl, M. Scriven,& G. Maxwell (Eds.), Minnesota studies in the philosophy of science:Vol.II. Concepts, theories. and the mind-body problem. Minneapolis:University of Minnesota Press.
Geen, R. G., & O'Neal, E. C. (1969). Activation of cue-elicited aggres-sion by general arousal. Journal of Personality and Social Psychology.11. 289-292.
Griffitt, W. (1970). Environmental effects on interpersonal affective be-havior: Ambient effective temperature and attraction. Journal of Per-sonality and Social Psychology. 15. 240-244.
Griffitt, W., & Veitch, R. (1971). Hot and crowded: Influences of popu-lation density and temperature on interpersonal affective behavior.Journal of Personality and Social Psychology. 17. 92-98.
Hardy, J. D. (1961). Physiology of temperature regulation. Physiologi-cal Reviews. 41,521-605.
'~
Harries, K. D., & Stadler, S. J. (1983). Determinism revisited: Assaultand heat stress in Dallas, 1980. Environment and Behavior. 15, 235-256.
Harries, K. D., Stadler, S. J., & Zdorkowski, R. T. (1984). Seasonalityand assault: Explorations in inter-neighborhood variation, Dallas,1980. Annals of the Association of American Geographers. 74.590-604. ,
Hayman, C. R., Lanza, c., Fuentes, R., & Algor, K. (1972). Rape in theDistrict of Columbia. American Journal of Obstetrics & Gynecology.113,91-97.
Iskrant, A P., & Joliet, P. V. (1968). Accidents and homicide. Cam-bridge, MA: Harvard University Press.
Jones, J. w., Terris, w., & Christensen, H. (1979, May). Ambient tem-perature and the occurrence of serious criminal assault. Paper pre-sented at the annual convention of the Midwestern Psychological As-sociation, Chicago.
Kahneman, D. (1973). Attention and effort. Englewood Giffs, NJ:Prentice-Hall.
Kenrick, D. T., & MacFarlane, S. W. (1984). Ambient temperature andhorn-honking: A field study of the heat/aggression relationship. Envi-ronment and Behavior. 18, 179-191.
Leffingwell, A. (1892). Illegitimacy and the influence of the seasonsupon conduct. New York: Scribners.
Lester, D. (1979). Temporal variation in suicide and homicide. Ameri-can Journal of Epidemiology. 109, 517-520.
Lombroso, C. (1899/1911). Crime: Its causes and remedies. Boston:Little, Brown.
McGrath, J. E., Martin, J., & Kukla, R. A. (1982). Judgment calls inresearch. Beverly Hills, CA: Sage.
Meyers, R. D. (1974). Neurochemical mechanisms of temperature reg-ulation and food ingestion. In R. D. Myers & R. R. Drucker-Colin(Eds.), Neurahumoral coding of brain function (pp. 99-114). NewYork: Plenum Press.
Michael, R. P., & Zumpe, D. (1983). Annual rhythms in human vio-lence and sexual aggression in the United States and the role oftem-perature. Social Biology. 30. 263-278.
Michael, R. P., & Zumpe, D. (1986). An annual rhythm in the batteringof women. American Journal of Psychiatry. 143, 637-640.
Oken, D., Grinker, R. R., Heath, H. A., Herz, M., Korchin, S. J., Sab-shin, M., & Schwartz, M. B. (1962). Relation of physiological re-sponses to affect expression. Archives of General Psychiatry. 6, 336-352.
Olweus, D., Mattsson, A., Schalling, D., & Low, H. (1980). Testoster-one, aggression, physical, and personality dimensions in normal ado-lescent males. Psychosomatic Medicine, 42. 253-269.
Palamarek, D. L, & Rule, B. G. (1979). The effects of ambient tempera-ture and insult on the motivation to retaliate or escape. Motivationand Emotion. 3. 83-92.
Perry, J. D., & Simpson, M. E. (1987). Violent crimes in a city: Environ-mental determinants. Environment and Behavior. 19, 77-90.
Persinger, M. A. (1980). The weather matrix and human behavior. NewYork: Praeger.
Reinberg, A., & Lagoguey, M. (1978). Circadian and circannualrhythms in sexual activity and plasma hormones (FSH, LH, testoster-one) offive human males. Archives of Sexual Behavior. 7. 13-30.
Reis, D. J. (1974). The chemical coding of aggression in brain. In R.Myers & R. Drucker-Colin (Eds.), Neurahumoral coding of brainfunction (pp. 125-150). New York: Plenum Press.
Robbins, M. c., DeWalt, E. R., & Pelto, P. J. (1972). Climate and behav-ior: A biocultural study. Journal of Cross-Cultural Psychology. 3,331-344.
Rosenfeld, R. (1986). Urban crime rates: Effects of inequality, welfare,dependency, region, and race. In J. Byrne & R. Sampson (Eds.), Thesocial ecology of crime (pp. 116-132). New York: Springer-Verlag.
Rotton, J. (1982, March). Seasonal and atmospheric determinants ofsex crimes: Time series analysis of archival data. Paper presented at
96 CRAIG A. ANDERSON
the annual convention of the Southeastern Psychological Association,New Orleans, LA.
Rotton, J. (1985, August). Pedestrian movement in warm and cool set-tings. Paper presented at the 95th annual convention of the AmericanPsychological Association, Los Angeles.
Rotton, J. (1986). Determinism redux: Climate and cultural correlatesof violence. Environment and Behavior, 18, 346-368.
Rotton, J., Barry, T., & Kimble, C. E. (1985, August). Climate and vio-lent crime: Coping with multicollinearity. Paper presented at the 95thannual convention of the American Psychological Association, LosAngeles.
.
Rotton, J., & Frey, J. (1985). Air pollution, weather, and violent crimes:Concomitant time-series analysis of archival data. Journal of Person-alityandSocialPsychology, 49,1207-1220.
Rotton, J., Olszewski, D., Charleton, M., & Soler, E. (1978). Loudspeech, conglomerate noise, and behavioral aftereffects. Journal ofApplied Psychology, 63, 360-365.
Rule, B. G., & Nesdale, A. R. (1976). Environmental stressors, emo-tional arousal and aggression. In I. Sarason & C. Spielberger (Eds.),Stress and anxiety: JfJI.3 (pp. 87-104). New York: Halstead Press.
Rule, B. G., Taylor, B. R., & Dobbs, A. R. (1987). Priming effects ofheat on aggressive thoughts. Social Cognition, 5, 131-143.
Schwartz, D. C. (1968). On the ecology of political violence: "The long
hot summer" as a hypothesis. American Behavioral Scientist,II(July-August), 24-28.
Smals, A. G. H., Kloppenborg, P. W. c., & Benraad, T. J. (1976). Circan-nual cycle in plasma testosterone levels in man. Journal of ClinicalEndocrinology & Metabolism, 42, 979-982.
Smolensky, M. H., Reinberg, A., Bicakova-Rocher, A., & Sanford, J.(1981). Chronoepidemiological search for circannual changes in thesexual activity of human males. Chronobiologia, 8, 217-230.
Tromp, S. W. (1980). Biometeorology: The impact of the weather andclimate on humans and their environment. London: Heydon.
Uleman, J. S. (1987). Consciousness and control: The case of spontane-ous trait inferences. Personality and Social Psychology Bulletin, 13,337-354.
Zillmann, D. (1983a). Arousal and aggression. In R. Geen & E. Don-nerstein (Eds.), Aggression: Theoretical and empirical reviews: JfJI.1(pp. 75-102). New York: Academic Press.
Zillmann, D. (1983b). Transfer of excitation in emotional behavior. InJ. Cacioppo & R. Petty (Eds.), Social psychophysiology: A sourcebook(pp. 215-240). New York: Guilford Press.
Received May 19, 1988Revision received October 27, 1988