Page 1
ORIGINAL RESEARCH
Temperature-dependent polymorphism of N-(4-fluorophenyl)-1,5-dimethyl-1H-imidazole-4-carboxamide 3-oxide: experimentaland theoretical studies on intermolecular interactionsin the crystal state
Agnieszka J. Rybarczyk-Pirek • Marlena Łukomska •
Krzysztof Ejsmont • Marcin Jasinski •
Marcin Palusiak
Received: 2 January 2014 / Accepted: 18 January 2014
� The Author(s) 2014. This article is published with open access at Springerlink.com
Abstract X-ray analysis of N-(4-fluorophenyl)-1,5-
dimethyl-1H-imidazole-4-carboxamide 3-oxide reveals the
temperature-dependent polymorphism associated with the
crystallographic symmetry conversion. The observed
crystal structure transformation corresponds to a symmetry
reduction from I41/a (I) to P43 (II) space groups. The
phase transition mainly concerns the subtle but clearly
noticeable reorganization of molecules in the crystal space,
with the structure of individual molecules left almost
unchanged. The Hirshfeld surface analysis shows that
various intermolecular contacts play an important role in
the crystal packing, revealing graphically the differences in
spatial arrangements of the molecules in both polymorphs.
The N-oxide oxygen atom acts as a formally negatively
charged hydrogen bonding acceptor in intramolecular
hydrogen bond of N–H…O- type. The combined crystal-
lographic and theoretical DFT methods demonstrate that
the observed intramolecular N-oxide N–H…O hydrogen
bond should be classified as a very strong charge-assisted
and closed-shell non-covalent interaction.
Keywords Polymorphism � Hydrogen bonding �N-oxide � X-ray diffraction � AIM approach � Hirshfeld
surface analysis
Introduction
Research on new imidazole and benzimidazole N-oxides
and their applications in biology has focused particular
interest in recent years [1]. Some of them exhibit biological
activity, e.g., as insecticides, plant growth regulators, anti-
inflammatory, and antiprotozoal agents [1–3]. More
importantly, imidazole N-oxides are highly attractive
intermediates for the preparation of diverse polyfunction-
alized imidazole-based compounds of biological signifi-
cance. For example, a series of protein kinase inhibitors [4]
was synthesized by the so-called ‘‘sulfur transfer reaction’’
[5], whereas direct palladium-catalyzed arylation protocol
opened up direct access to potent Tie2 tyrosine kinase
inhibitor [6]. Special attention was paid to the synthesis of
imidazole N-oxides with new substitution patterns, partic-
ularly the analogs lacking a substituent at carbon C(2) atom,
and their transformations into more complex derivatives [5,
7–9]. A large number of key 2-unsubstituted N-oxides
exhibit limited stability either under high temperature, UV
irradiation or in the presence of acylating agents, and can
undergo isomerization to the corresponding imidazol-2-
ones. Therefore, we turned our attention to derivatives
bearing hydrogen donor groups at the vicinal C(4) position,
namely amide [10, 11] and hydrazide [12, 13] moieties. The
presence of such groups and stable N-oxide function offers
an opportunity for their application in more complex
structures including biologically active compounds and
enables carrying out the reactions under harsh conditions.
Some reports on imidazole derivatives containing amide or
Electronic supplementary material The online version of thisarticle (doi:10.1007/s11224-014-0404-8) contains supplementarymaterial, which is available to authorized users.
A. J. Rybarczyk-Pirek (&) � M. Łukomska � M. Palusiak
Structural Chemistry and Crystallography Group, Department of
Theoretical and Structural Chemistry, University of Łodz, ul.
Pomorska 163/165, 90-236 Lodz, Poland
e-mail: [email protected]
K. Ejsmont
Faculty of Chemistry, University of Opole, ul. Oleska 48,
45-052 Opole, Poland
M. Jasinski
Department of Organic and Applied Chemistry, University of
Łodz, ul. Tamka 12, 91-403 Lodz, Poland
123
Struct Chem
DOI 10.1007/s11224-014-0404-8
Page 2
hydrazide groups as potential pharmaceuticals were also
published recently [14].
In this paper, we report the results of X-ray crystal
structure determination of N-(4-fluorophenyl)-1,5-dime-
thyl-1H-imidazole-4-carboxamide 3-oxide polymorphs
(Scheme 1). The title compound shows the temperature-
dependent polymorphism resulting from a rearrangement
of the molecules in the crystal due to temperature varia-
tions. A comparative characterization of both polymorphs
was performed, and details concerning structural differ-
ences between the polymorphic forms were discussed in
the context of intermolecular interactions present in the
crystal state. In addition, the result of temperature-depen-
dent X-ray measurement was presented in order to high-
light the details of the observed phase transition.
Intermolecular non-covalent interactions were studied by
means of Hirshfeld surface approach.
Methods
Synthesis and crystallization
The title compound was prepared according to the known
protocol [15–17] by cyclocondensation of a respective
N-aryl a-hydroxyimino-b-oxobutyramide and 1,3,5-trim-
ethylhexahydro-1,3,5-triazine in aqueous ethanol. The
synthesis was performed starting with commercially
available ethyl acetoacetate, paraformaldehyde, methyl-
amine (40 % aqueous solution), and 4-fluoroaniline. All
other reagents and solvents were purchased and used as
received without further purification. The crystals suitable
for X-ray analysis were obtained by slow evaporation of
the solvent from an ethanol solution.
X-ray structure determination
X-ray diffraction measurements were made on a four-circle
Oxford Diffraction Xcalibur diffractometer equipped with
a two-dimensional area CCD detector with the graphite
monochromatized MoKa radiation and a low-temperature
device Cryostream cooler Oxford Cryosystem. Integration
of the intensities and correction for Lorentz and polariza-
tion effects were performed using the CrysAlis RED soft-
ware [18].
The crystal structures were solved by direct methods
using the SHELXS program [19]. The appropriate choice
of a space group was based on the following tests: ana-
lysis of Wilson plot and the distributions of normalized
structure factors; checking Laue symmetry; and the ana-
lysis of systematic absences (details are given in the
supplement). The following space groups were proposed
as the most adequate candidate space groups: the centro-
symmetric I41/a tetragonal space group for room-temper-
ature data (293 K), and the non-centrosymmetric P43 one
for the low-temperature data (150 K). With this choice of
space groups, the use of direct methods provided proper
tentative crystal structure models (positions of all the non-
hydrogen atoms were found in both cases). As both
polymorphic structures are very similar to each other,
some problems could appear concerning the correctness of
space group assignment and the obtained crystal structure
models. The key problem here is to explain if the
observed differences are not due to erroneous data
reduction, inappropriate space group choice, or other
errors. To eliminate such a situation, we made some
attempts at finding crystal structure models in several
space groups (for details see supporting information file
associated with this paper). However, apart from the
above-mentioned space groups, other space groups
occurred to be interchangeably inadequate. Detailed
comparison of polymorphic structures is given in section
‘‘Temperature-dependent study of polymorphism.’’
The crystal structures were then refined by a full-matrix
least-squares method on F2 using the SHELXL-97 pro-
gram [20] implemented in WinGX [21] suite of programs.
The positions of NH hydrogen atoms were found on
Fourier difference map and refined. Hydrogen atoms of
the aromatic rings and methyl groups were introduced in
the calculated positions with idealized geometry. They
were constrained using a rigid body model with isotropic
displacement parameters equal to 1.2 or 1.5 of the
equivalent displacement parameters of the parent atoms.
For the appropriate modeling of methyl groups, disorder
in (I) two groups of hydrogen atoms were introduced and
constrained in staggered geometry (positions rotated rel-
ative each other by 60� and occupation factors were fixed
at 0.5 for each atom). Details of both refinements are
presented in Table 1.
A summary of relevant crystallographic data is given in
Table 1. The molecular geometry was calculated by
PARST [22] and Platon [23]. Selected bond distances and
Scheme 1 Structural diagram of the N-(4-fluorophenyl)-1,5-
dimethyl-1H-imidazole-4-carboxamide 3-oxide
Struct Chem
123
Page 3
angles are summarized in Table 2. Atomic coordinates,
displacement parameters, and structure factors are depos-
ited with Cambridge Crystallographic Data Centre CCDC.1
Theoretical computations
Theoretical quantum chemical calculations were performed
with the Gaussian 09 sets of codes [24]. The molecular
geometry taken from the X-ray studies was fully optimized.
For this purpose, DFT-B3LYP functional was used in
conjunction with 6-311??G(d,p) basis set. Further,
QTAIM calculations were done with the use of AIMAll
program [25].
Hirshfeld surface analysis
The Hirshfeld molecular surfaces and the associated fin-
gerprint plots were generated using CrystalExplorer 3.0
[26, 27] on the basis of X-ray results. The bonds of
hydrogen atoms were normalized to standard neutron val-
ues (C–H = 1.083 A, O–H = 0.983 A, N–H = 1.009 A)
[28]. For comparison of intermolecular interactions in the
crystal structures, the Hirshfeld surfaces were mapped with
normalized contact distances (dnorm). The Dnorm parameter
is based on di (the distance from the surface to the nearest
atom in the molecule itself), de (the distance from the
surface to the nearest atom in another molecule), and van
der Waals radii of the corresponding atoms (rivdW and
revdW). It is given by the Eq. (1).
dnorm ¼ di � rvdWi
� �=rvdW
i
� �þ de � rvdW
e
� �=rvdW
e
� �ð1Þ
All the presented graphical plots use the same red–
white–blue color scheme, where the red color highlights
the shortest intermolecular atomic contacts (negative dnorm
values), white is used for contacts around the van der
Waals separation, and blue corresponds to longer ones
(positive dnorm values). The Hirshfeld surface fingerprint
plots were generated using di and de as a pair of coordinates
at intervals of 0.01 A. A color gradient in the plots ranging
from blue to red represents the proportional contribution of
contact pairs in the global surface.
Results and discussion
Temperature-dependent study of polymorphism
On the basis of NMR spectroscopic data [11], it was
expected that there exists a relatively strong intramole-
cular hydrogen bond between N-oxide and N–H amide
groups. Our preliminary room-temperature X-ray results
unambiguously confirmed this suggestion. The molecular
structure of the title compound is presented in Fig. 1.
Using the same crystal, we additionally collected a new
diffraction data set at low temperature (150 K) in order to
investigate the behavior of proton within the intramole-
cular N–H…O hydrogen bridge. Surprisingly, the com-
parison of X-ray structure determination indicated
polymorphic transformation upon the change of
temperature.
The room-temperature polymorph (I) crystallizes in the
centrosymmetric I41/a tetragonal space group with one
molecule in a general position. However, this model of the
crystal structure proved to be completely inadequate for
refinements against low-temperature diffraction data. For
an appropriate crystal structure determination, we had to
establish a new structural model. The crystal structure of
1 The supplementary crystallographic data for this paper (932320,
932321 and 943140) can be obtained free of charge via http://www.
ccdc.cam.ac.uk/conts/retrieving.html or from the Cambridge Crys-
tallographic Data Centre, 12, Union Road, Cambridge CB2 1EZ, UK;
fax: ?44-1223-336033.
Table 1 Crystallographic data and structure refinement details
I II
Crystal data
Formula C12H12FN3O C12H12FN3O
Formula weight 249.25 249.25
Crystal system, space
group
Tetragonal, I41/a Tetragonal, P43
Unit cell (A, �) a = 14.0848(4)
c = 24.4912(9)
a = 14.0404(3)
c = 24.0800(7)
V (A3) 4858.6(3) 4747.0(2)
Z, dx (g/cm3) 16, 1.363 16, 1.395
l [mm-1] 0.11 0.11
F(000) 2,080 2,080
Crystal description colorless plate colorless plate
Crystal size [mm] 0.22 9 0.18 9 0.15 0.22 9 0.18 9 0.15
Data collection
Temperature 293 (2) 150 (2)
Radiation type/k [A] MoKa/0.71073 MoKa/0.71073
Data collected [R(int)] 15,281 [0.0325] 30,036 [0.0409]
h Range [�] 2.89–25.03 2.90–27.50
Completeness [%] 0.999 0.998
Refinement
Data unique/I [ 2r(I) 2,152/1,195 10,577/5,456
Parameters/restraints 168/8 671/1
Goodness-of-fit on F2 0.997 0.863
R/wR2 indices
[I [ 2r(I)]
0.0333/0.0705 0.0391/0.0903
R/wR2 indices (all data) 0.0835/0.0915 0.0714/0.0185
Dqmax/Dqmin (eA-3) 0.11/-0.10 0.20/-0.19
Struct Chem
123
Page 4
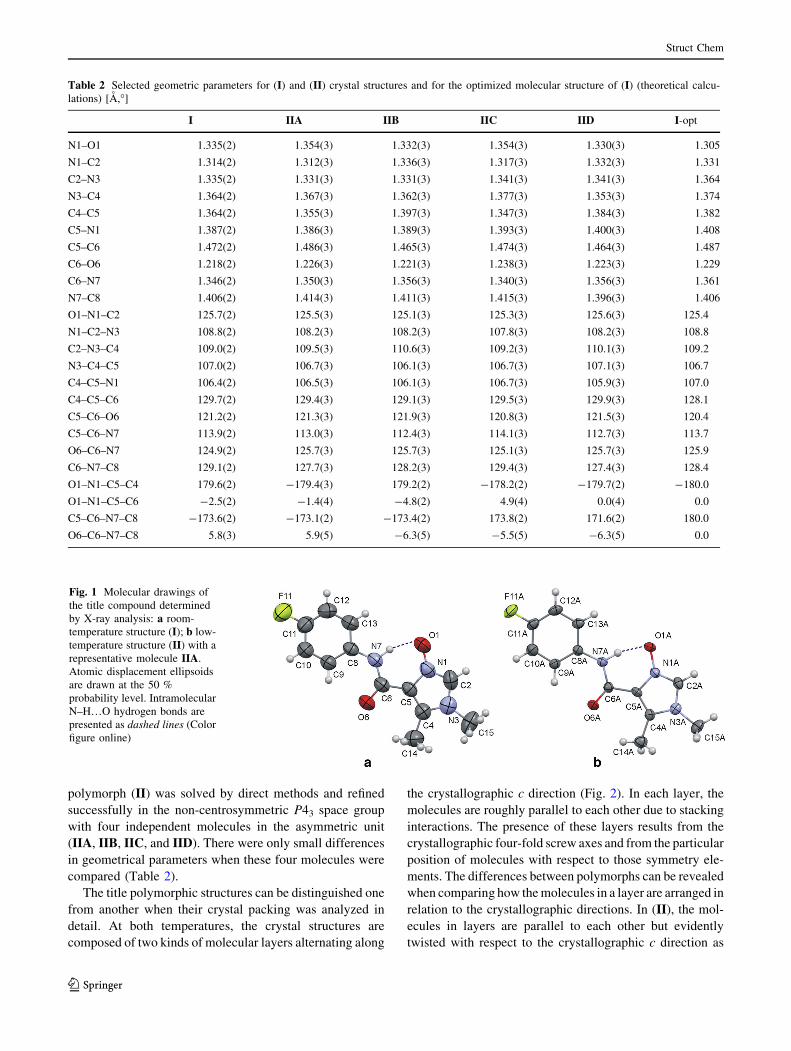
polymorph (II) was solved by direct methods and refined
successfully in the non-centrosymmetric P43 space group
with four independent molecules in the asymmetric unit
(IIA, IIB, IIC, and IID). There were only small differences
in geometrical parameters when these four molecules were
compared (Table 2).
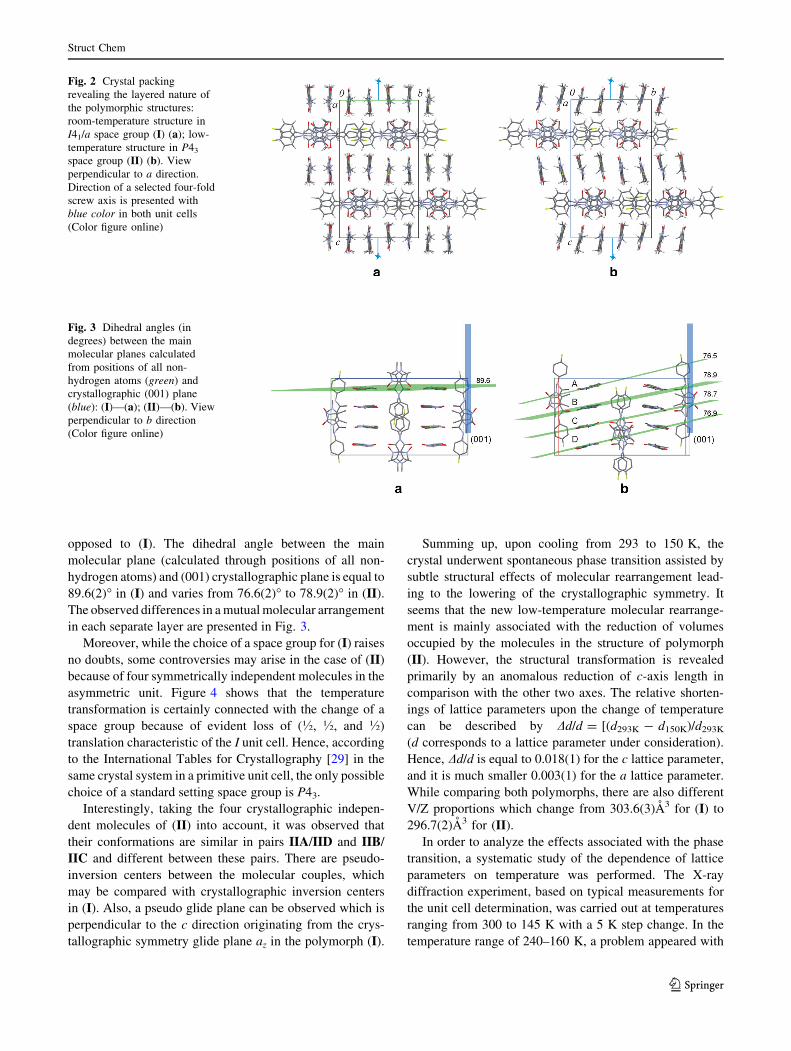
The title polymorphic structures can be distinguished one
from another when their crystal packing was analyzed in
detail. At both temperatures, the crystal structures are
composed of two kinds of molecular layers alternating along
the crystallographic c direction (Fig. 2). In each layer, the
molecules are roughly parallel to each other due to stacking
interactions. The presence of these layers results from the
crystallographic four-fold screw axes and from the particular
position of molecules with respect to those symmetry ele-
ments. The differences between polymorphs can be revealed
when comparing how the molecules in a layer are arranged in
relation to the crystallographic directions. In (II), the mol-
ecules in layers are parallel to each other but evidently
twisted with respect to the crystallographic c direction as
Table 2 Selected geometric parameters for (I) and (II) crystal structures and for the optimized molecular structure of (I) (theoretical calcu-
lations) [A,�]
I IIA IIB IIC IID I-opt
N1–O1 1.335(2) 1.354(3) 1.332(3) 1.354(3) 1.330(3) 1.305
N1–C2 1.314(2) 1.312(3) 1.336(3) 1.317(3) 1.332(3) 1.331
C2–N3 1.335(2) 1.331(3) 1.331(3) 1.341(3) 1.341(3) 1.364
N3–C4 1.364(2) 1.367(3) 1.362(3) 1.377(3) 1.353(3) 1.374
C4–C5 1.364(2) 1.355(3) 1.397(3) 1.347(3) 1.384(3) 1.382
C5–N1 1.387(2) 1.386(3) 1.389(3) 1.393(3) 1.400(3) 1.408
C5–C6 1.472(2) 1.486(3) 1.465(3) 1.474(3) 1.464(3) 1.487
C6–O6 1.218(2) 1.226(3) 1.221(3) 1.238(3) 1.223(3) 1.229
C6–N7 1.346(2) 1.350(3) 1.356(3) 1.340(3) 1.356(3) 1.361
N7–C8 1.406(2) 1.414(3) 1.411(3) 1.415(3) 1.396(3) 1.406
O1–N1–C2 125.7(2) 125.5(3) 125.1(3) 125.3(3) 125.6(3) 125.4
N1–C2–N3 108.8(2) 108.2(3) 108.2(3) 107.8(3) 108.2(3) 108.8
C2–N3–C4 109.0(2) 109.5(3) 110.6(3) 109.2(3) 110.1(3) 109.2
N3–C4–C5 107.0(2) 106.7(3) 106.1(3) 106.7(3) 107.1(3) 106.7
C4–C5–N1 106.4(2) 106.5(3) 106.1(3) 106.7(3) 105.9(3) 107.0
C4–C5–C6 129.7(2) 129.4(3) 129.1(3) 129.5(3) 129.9(3) 128.1
C5–C6–O6 121.2(2) 121.3(3) 121.9(3) 120.8(3) 121.5(3) 120.4
C5–C6–N7 113.9(2) 113.0(3) 112.4(3) 114.1(3) 112.7(3) 113.7
O6–C6–N7 124.9(2) 125.7(3) 125.7(3) 125.1(3) 125.7(3) 125.9
C6–N7–C8 129.1(2) 127.7(3) 128.2(3) 129.4(3) 127.4(3) 128.4
O1–N1–C5–C4 179.6(2) -179.4(3) 179.2(2) -178.2(2) -179.7(2) -180.0
O1–N1–C5–C6 -2.5(2) -1.4(4) -4.8(2) 4.9(4) 0.0(4) 0.0
C5–C6–N7–C8 -173.6(2) -173.1(2) -173.4(2) 173.8(2) 171.6(2) 180.0
O6–C6–N7–C8 5.8(3) 5.9(5) -6.3(5) -5.5(5) -6.3(5) 0.0
Fig. 1 Molecular drawings of
the title compound determined
by X-ray analysis: a room-
temperature structure (I); b low-
temperature structure (II) with a
representative molecule IIA.
Atomic displacement ellipsoids
are drawn at the 50 %
probability level. Intramolecular
N–H…O hydrogen bonds are
presented as dashed lines (Color
figure online)
Struct Chem
123
Page 5
opposed to (I). The dihedral angle between the main
molecular plane (calculated through positions of all non-
hydrogen atoms) and (001) crystallographic plane is equal to
89.6(2)� in (I) and varies from 76.6(2)� to 78.9(2)� in (II).
The observed differences in a mutual molecular arrangement
in each separate layer are presented in Fig. 3.
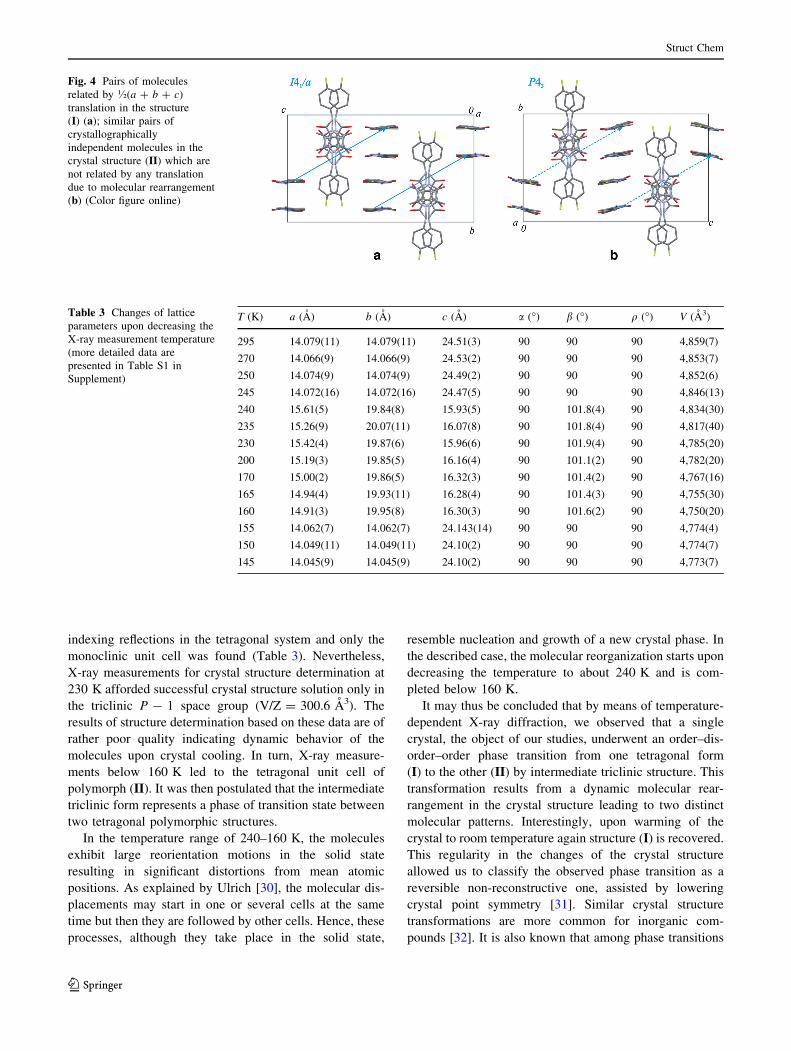
Moreover, while the choice of a space group for (I) raises
no doubts, some controversies may arise in the case of (II)
because of four symmetrically independent molecules in the
asymmetric unit. Figure 4 shows that the temperature
transformation is certainly connected with the change of a
space group because of evident loss of (�, �, and �)
translation characteristic of the I unit cell. Hence, according
to the International Tables for Crystallography [29] in the
same crystal system in a primitive unit cell, the only possible
choice of a standard setting space group is P43.
Interestingly, taking the four crystallographic indepen-
dent molecules of (II) into account, it was observed that
their conformations are similar in pairs IIA/IID and IIB/
IIC and different between these pairs. There are pseudo-
inversion centers between the molecular couples, which
may be compared with crystallographic inversion centers
in (I). Also, a pseudo glide plane can be observed which is
perpendicular to the c direction originating from the crys-
tallographic symmetry glide plane az in the polymorph (I).
Summing up, upon cooling from 293 to 150 K, the
crystal underwent spontaneous phase transition assisted by
subtle structural effects of molecular rearrangement lead-
ing to the lowering of the crystallographic symmetry. It
seems that the new low-temperature molecular rearrange-
ment is mainly associated with the reduction of volumes
occupied by the molecules in the structure of polymorph
(II). However, the structural transformation is revealed
primarily by an anomalous reduction of c-axis length in
comparison with the other two axes. The relative shorten-
ings of lattice parameters upon the change of temperature
can be described by Dd/d = [(d293K - d150K)/d293K
(d corresponds to a lattice parameter under consideration).
Hence, Dd/d is equal to 0.018(1) for the c lattice parameter,
and it is much smaller 0.003(1) for the a lattice parameter.
While comparing both polymorphs, there are also different
V/Z proportions which change from 303.6(3)A3 for (I) to
296.7(2)A3 for (II).
In order to analyze the effects associated with the phase
transition, a systematic study of the dependence of lattice
parameters on temperature was performed. The X-ray
diffraction experiment, based on typical measurements for
the unit cell determination, was carried out at temperatures
ranging from 300 to 145 K with a 5 K step change. In the
temperature range of 240–160 K, a problem appeared with
Fig. 2 Crystal packing
revealing the layered nature of
the polymorphic structures:
room-temperature structure in
I41/a space group (I) (a); low-
temperature structure in P43
space group (II) (b). View
perpendicular to a direction.
Direction of a selected four-fold
screw axis is presented with
blue color in both unit cells
(Color figure online)
Fig. 3 Dihedral angles (in
degrees) between the main
molecular planes calculated
from positions of all non-
hydrogen atoms (green) and
crystallographic (001) plane
(blue): (I)—(a); (II)—(b). View
perpendicular to b direction
(Color figure online)
Struct Chem
123
Page 6
indexing reflections in the tetragonal system and only the
monoclinic unit cell was found (Table 3). Nevertheless,
X-ray measurements for crystal structure determination at
230 K afforded successful crystal structure solution only in
the triclinic P - 1 space group (V/Z = 300.6 A3). The
results of structure determination based on these data are of
rather poor quality indicating dynamic behavior of the
molecules upon crystal cooling. In turn, X-ray measure-
ments below 160 K led to the tetragonal unit cell of
polymorph (II). It was then postulated that the intermediate
triclinic form represents a phase of transition state between
two tetragonal polymorphic structures.
In the temperature range of 240–160 K, the molecules
exhibit large reorientation motions in the solid state
resulting in significant distortions from mean atomic
positions. As explained by Ulrich [30], the molecular dis-
placements may start in one or several cells at the same
time but then they are followed by other cells. Hence, these
processes, although they take place in the solid state,
resemble nucleation and growth of a new crystal phase. In
the described case, the molecular reorganization starts upon
decreasing the temperature to about 240 K and is com-
pleted below 160 K.
It may thus be concluded that by means of temperature-
dependent X-ray diffraction, we observed that a single
crystal, the object of our studies, underwent an order–dis-
order–order phase transition from one tetragonal form
(I) to the other (II) by intermediate triclinic structure. This
transformation results from a dynamic molecular rear-
rangement in the crystal structure leading to two distinct
molecular patterns. Interestingly, upon warming of the
crystal to room temperature again structure (I) is recovered.
This regularity in the changes of the crystal structure
allowed us to classify the observed phase transition as a
reversible non-reconstructive one, assisted by lowering
crystal point symmetry [31]. Similar crystal structure
transformations are more common for inorganic com-
pounds [32]. It is also known that among phase transitions
Fig. 4 Pairs of molecules
related by �(a ? b ? c)
translation in the structure
(I) (a); similar pairs of
crystallographically
independent molecules in the
crystal structure (II) which are
not related by any translation
due to molecular rearrangement
(b) (Color figure online)
Table 3 Changes of lattice
parameters upon decreasing the
X-ray measurement temperature
(more detailed data are
presented in Table S1 in
Supplement)
T (K) a (A) b (A) c (A) a (�) b (�) q (�) V (A3)
295 14.079(11) 14.079(11) 24.51(3) 90 90 90 4,859(7)
270 14.066(9) 14.066(9) 24.53(2) 90 90 90 4,853(7)
250 14.074(9) 14.074(9) 24.49(2) 90 90 90 4,852(6)
245 14.072(16) 14.072(16) 24.47(5) 90 90 90 4,846(13)
240 15.61(5) 19.84(8) 15.93(5) 90 101.8(4) 90 4,834(30)
235 15.26(9) 20.07(11) 16.07(8) 90 101.8(4) 90 4,817(40)
230 15.42(4) 19.87(6) 15.96(6) 90 101.9(4) 90 4,785(20)
200 15.19(3) 19.85(5) 16.16(4) 90 101.1(2) 90 4,782(20)
170 15.00(2) 19.86(5) 16.32(3) 90 101.4(2) 90 4,767(16)
165 14.94(4) 19.93(11) 16.28(4) 90 101.4(3) 90 4,755(30)
160 14.91(3) 19.95(8) 16.30(3) 90 101.6(2) 90 4,750(20)
155 14.062(7) 14.062(7) 24.143(14) 90 90 90 4,774(4)
150 14.049(11) 14.049(11) 24.10(2) 90 90 90 4,774(7)
145 14.045(9) 14.045(9) 24.10(2) 90 90 90 4,773(7)
Struct Chem
123
Page 7
induced by the change of temperature, the highest tem-
perature modification as a rule has higher symmetry [30].
It is worth pointing out that, as it will also be demon-
strated, the phase transition results mostly from the changes
in crystal packing. In turn, the structural differences
observed for individual molecules are meaningless in
practice, which is described in detail in section ‘‘Molecular
structure’’.
Molecular structure
The molecular structures (I) and (II) are very similar.
Small discrepancies in the molecular conformations are
best described by the torsion angles including the atoms
O1, N1, C5, C6, N7, and C8. However, the corresponding
angle values, as listed in Table 2, do not differ by more
than 5�. In all the examined cases, the values of C5–C6–
N7–C8 torsion angles clearly confirmed the existence of
molecular trans conformations in central amide linkage.
Interestingly, the room-temperature studies revealed a
disorder of hydrogen atoms of both methyl groups in an
imidazole ring. In contrast to that, no such disorder was
observed for the low-temperature results; hence, this phe-
nomenon may also be related to the polymorphism.
The N-(4-fluorophenyl)-1,5-dimethyl-1H-imidazole-4-
carboxamide 3-oxide molecule can be divided into three
individual chemical fragments: a nitrone-like N-oxidoimi-
dazole part, a fluorine substituted phenyl ring, and an
amide moiety linking both aromatic systems. The dihedral
angles between phenyl and imidazole range from 10.5(1)�to 11.7(1)� in both polymorphs. In turn, the dihedral angles
of the imidazole rings and the amide planes are much
smaller (between 3.3(1)� and 5.5(1)�).
In order to describe the overall molecular shape, the
least-squares mean planes through positions of all non-
hydrogen atoms were calculated for each of the molecules.
In all the cases, the molecules could be best described as
almost planar with the maximum atomic deviation from the
main molecular plane of about 0.2 A.
The arrangement of single-double bonds in the molecule
and almost coplanar positions of the atoms forming the
main molecular skeleton both make possible p-communi-
cation between the aromatic rings, and therefore affect the
lengths of some covalent bonds. A particularly strong
interaction was observed for internal C–N and C–C bonds
of the imidazole rings. For example, the lengths of N1–C2
and C4–C5 bonds varied from 1.303(3)A to 1.354(3)A and
1.347(3)A to 1.397(3)A, respectively, in the analyzed
molecules. In turn, C4–C5 bond lengths ranged from
1.464(3)A to 1.487(3)A. Similarly, N1–O1 N-oxide bond
differentiation was also observed.
The observed small differences in geometrical parame-
ters between (I) and (II) (Table 3) can be related to
different refining strategies—refinement in different space
groups with Z’ = 1 (I) or Z’ = 4 (II) results in a different
data/parameter ratio. In general, the bond lengths observed
for (I) better resemble literature values [28].
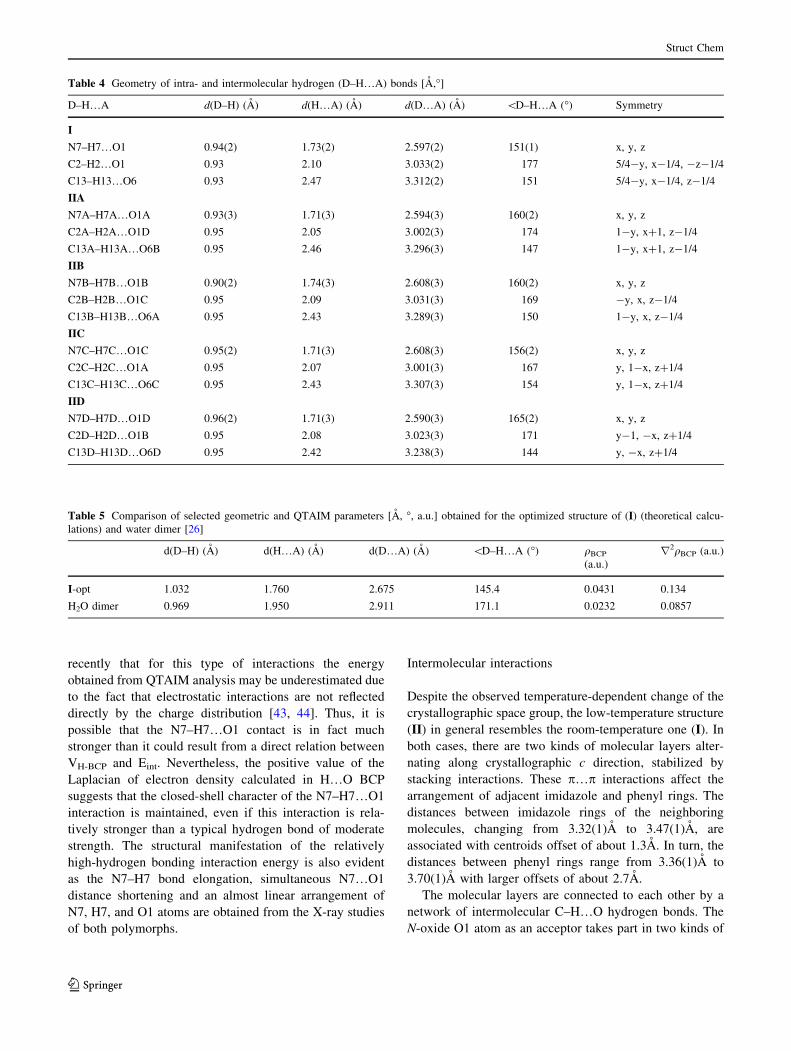
Intramolecular hydrogen bond
In both polymorphs, molecular trans conformations are
stabilized by intramolecular N7–H7…O1 hydrogen bonds
(Fig. 1). These interactions, closing six-membered rings,
can be formally classified as charge-assisted ones [33, 34].
The original reason of the temperature X-ray studies (293
and 150 K) was related to the comparative determination
of atom positions within N7–H7…O1 hydrogen bridges.
The relatively long N–H bond and a large value of N–
H…O bond angle in (I) allow one to classify this
intramolecular hydrogen bond as a strong one. Moreover,
the short N…O distance suggests that it could also be
considered as a low-barrier hydrogen bond [35, 36] similar
to intramolecular hydrogen bonds observed for benzopy-
rane derivatives [37–39]. To elucidate this observation,
low-temperature X-ray measurements were undertaken.
However, hydrogen bonding geometry obtained from those
studies, did not show any significant differences in com-
parison with room-temperature results, except for a little
higher N–H…O angle values (Table 4 and Figure S1 in the
Supplementary Material). Therefore, for a more detailed
analysis of intramolecular hydrogen bonds, we used the
methods of quantum chemistry.
In order to estimate the approximate interaction energy
in the investigated intramolecular N–H…O bridge, we used
the topological electron density approach. According to
this method, the hydrogen bonding energy can be calcu-
lated by equation Eint = -1/2VH-BCP in which VH-BCP is
the electron potential energy density measured in the
hydrogen bond critical bond [40]. In view of the fact that
the hydrogen atoms positions derived from X-ray mea-
surements were uncertain, the geometry of the molecule
taken from the crystal structure was fully optimized at the
B3LYP/6-311??G** level, and then the QTAIM analysis
was performed [41]. Selected geometrical and QTAIM
parameters obtained via theoretical calculations are col-
lected in Table 5.
The obtained interaction energy is equal to 12.1 kcal/
mol. Therefore, the QTAIM analysis confirmed the pre-
dictions made on the basis of the X-ray structural proper-
ties that the intramolecular N7–H7…O1 contact can be
classified as a strong hydrogen bond, especially when
compared with the binding energy of hydrogen bonds in
water dimer, which is about 4–5 kcal/mol [42]. As already
mentioned, the investigated hydrogen bond can be classi-
fied as a charge-assisted one and it has been demonstrated
Struct Chem
123
Page 8
recently that for this type of interactions the energy
obtained from QTAIM analysis may be underestimated due
to the fact that electrostatic interactions are not reflected
directly by the charge distribution [43, 44]. Thus, it is
possible that the N7–H7…O1 contact is in fact much
stronger than it could result from a direct relation between
VH-BCP and Eint. Nevertheless, the positive value of the
Laplacian of electron density calculated in H…O BCP
suggests that the closed-shell character of the N7–H7…O1
interaction is maintained, even if this interaction is rela-
tively stronger than a typical hydrogen bond of moderate
strength. The structural manifestation of the relatively
high-hydrogen bonding interaction energy is also evident
as the N7–H7 bond elongation, simultaneous N7…O1
distance shortening and an almost linear arrangement of
N7, H7, and O1 atoms are obtained from the X-ray studies
of both polymorphs.
Intermolecular interactions
Despite the observed temperature-dependent change of the
crystallographic space group, the low-temperature structure
(II) in general resembles the room-temperature one (I). In
both cases, there are two kinds of molecular layers alter-
nating along crystallographic c direction, stabilized by
stacking interactions. These p…p interactions affect the
arrangement of adjacent imidazole and phenyl rings. The
distances between imidazole rings of the neighboring
molecules, changing from 3.32(1)A to 3.47(1)A, are
associated with centroids offset of about 1.3A. In turn, the
distances between phenyl rings range from 3.36(1)A to
3.70(1)A with larger offsets of about 2.7A.
The molecular layers are connected to each other by a
network of intermolecular C–H…O hydrogen bonds. The
N-oxide O1 atom as an acceptor takes part in two kinds of
Table 4 Geometry of intra- and intermolecular hydrogen (D–H…A) bonds [A,�]
D–H…A d(D–H) (A) d(H…A) (A) d(D…A) (A) \D–H…A (�) Symmetry
I
N7–H7…O1 0.94(2) 1.73(2) 2.597(2) 151(1) x, y, z
C2–H2…O1 0.93 2.10 3.033(2) 177 5/4-y, x-1/4, -z-1/4
C13–H13…O6 0.93 2.47 3.312(2) 151 5/4-y, x-1/4, z-1/4
IIA
N7A–H7A…O1A 0.93(3) 1.71(3) 2.594(3) 160(2) x, y, z
C2A–H2A…O1D 0.95 2.05 3.002(3) 174 1-y, x?1, z-1/4
C13A–H13A…O6B 0.95 2.46 3.296(3) 147 1-y, x?1, z-1/4
IIB
N7B–H7B…O1B 0.90(2) 1.74(3) 2.608(3) 160(2) x, y, z
C2B–H2B…O1C 0.95 2.09 3.031(3) 169 -y, x, z-1/4
C13B–H13B…O6A 0.95 2.43 3.289(3) 150 1-y, x, z-1/4
IIC
N7C–H7C…O1C 0.95(2) 1.71(3) 2.608(3) 156(2) x, y, z
C2C–H2C…O1A 0.95 2.07 3.001(3) 167 y, 1-x, z?1/4
C13C–H13C…O6C 0.95 2.43 3.307(3) 154 y, 1-x, z?1/4
IID
N7D–H7D…O1D 0.96(2) 1.71(3) 2.590(3) 165(2) x, y, z
C2D–H2D…O1B 0.95 2.08 3.023(3) 171 y-1, -x, z?1/4
C13D–H13D…O6D 0.95 2.42 3.238(3) 144 y, -x, z?1/4
Table 5 Comparison of selected geometric and QTAIM parameters [A, �, a.u.] obtained for the optimized structure of (I) (theoretical calcu-
lations) and water dimer [26]
d(D–H) (A) d(H…A) (A) d(D…A) (A) \D–H…A (�) qBCP
(a.u.)
r2qBCP (a.u.)
I-opt 1.032 1.760 2.675 145.4 0.0431 0.134
H2O dimer 0.969 1.950 2.911 171.1 0.0232 0.0857
Struct Chem
123
Page 9
hydrogen bonding: N7–H7…O1 intramolecular bonding
and C2–H2…O1 intermolecular one. As a result of the
latter interaction (linking neighboring imidazole rings), a
molecular tetramer around inversion 4-fold axis is formed
(Fig. 5). According to the graph-set notation [45], it can be
designated by the R44(16) first-level motif. In turn, the C13-
H13…O6 interaction between phenyl rings and carbonyl
groups, orders molecules into C(4) chains extending along
the c axis. Small discrepancies between (I) and (II) in the
corresponding hydrogen bonding geometric parameters are
presented in Table 5.
Hirshfeld surface analysis
The observed polymorphism turned our attention to the
behavior of particular atoms as the centers of intermolec-
ular interactions. For a detailed analysis of the interactions
scheme, we calculated molecular Hirshfeld surfaces
(Fig. 6). The Hirshfeld surface of (I) is based on all
observed orientations of disordered methyl groups includ-
ing their partial occupancies. Obviously, the surfaces
obtained for the investigated molecules resemble each
other in shape, volume, and area (Table 6). It seems that
the differences in the volumes are mainly caused by the
change of temperature.
Mapping dnorm on Hirshfeld surfaces not only allows
one to decode dominant intermolecular interactions in the
crystal structures but also presents subtle differences in the
scheme of intermolecular contacts. On the surfaces calcu-
lated for each separate molecule, there are seen regions of
intermolecular C–H…O hydrogen bonds as the most
intensive large red circles near the oxygen and C–H
hydrogen atoms. There are also many short intermolecular
contacts involving fluorine and hydrogen atoms. The cor-
responding red circles occur in the vicinity of fluorine
atoms.
The right side of the Fig. 6 presents Hirshfeld surface
fingerprint plots. The dominant interactions between atoms
of neighboring molecules are shown as the bright areas
colored with light blue and green. A very useful thing is
that the fingerprint plots can be decomposed to highlight
the particular atom pairs in close intermolecular contacts.
Decomposition of individual types of intermolecular con-
tacts, based on Hirshfeld surface fingerprint plots, indicates
Fig. 5 C–H…O intermolecular
hydrogen bonding tetrameric
R44(16) motif: (I) (a); and (II)
(b). Hydrogen atoms, except
those taking part in hydrogen
bonding, are omitted for clarity
(Color figure online)
Fig. 6 Molecular Hirshfeld surfaces mapped with dnorm (left) with
the colored scale corresponding to the values ranging from -0.3 (red)
to 1.2 (blue) and the corresponding 2D fingerprint plots (right):
(I) (a); (IIA) (b); (IIB) (c); (IIC) (d); (IID) (e) (Color figure online)
Struct Chem
123
Page 10
the areas of H…F contacts. As the positions of hydrogen
atoms were constrained, detailed discussion on these
intermolecular contacts is not included. On the other hand,
a high proportional contribution of H…F contacts on all the
surfaces should be noticed here. In the fingerprint plots,
dominant intermolecular interactions (bright colored areas)
are attributed mainly to the C–H…O hydrogen bonds.
These interactions are represented by typical long- sharp
spikes of minimum de values below 1.2 A. Interestingly, in
the case of (I), there is also a central spike (about 1.2 A)
resulting from short H…H contacts.
The percentage of various intermolecular contacts in the
Hirshfeld surfaces is presented in Table 7. The relatively
high proportion of C/N/O…C/N/O contacts (around 10 %)
is attributed to p…p stacking interactions. The contribu-
tions of different intermolecular contacts can be treated as
indicators of discrepancies between the investigated mol-
ecules as interacting neighbors in the crystal state. Hence,
for (II) there is a growing contribution of intermolecular
contacts associated with stacking interactions.
The above results of Hirshfeld surface analysis clearly
show the changes in crystal packing, in particular when
comparing fingerprint plots estimated for individual mol-
ecules present in both polymorphs.
Conclusions
The results of X-ray structure determination revealed
molecular rearrangement in the title crystal upon change of
conditions. The observed phenomenon is defined as a
reversible order–disorder–order phase conversion associ-
ated with the lowering of crystallographic symmetry.
In both polymorphs, the observed molecular trans con-
formations are stabilized by intramolecular N–H…O
hydrogen bonds. These interactions were analyzed with the
help of QTAIM approach and turned out to be very strong
charge-assisted hydrogen bonds.
The use of the Hirshfeld surface analysis provided an
interesting insight into the crystal structure as it is seen by
the interacting neighboring molecules. Our studies showed
that, besides the C–H…O intermolecular hydrogen bonds
and p…p stacking interactions there is also a significant
contribution of H…F intermolecular contacts in each of the
investigated structures. The comparison of fingerprint plots
estimated for individual molecules gives graphical evi-
dence of the difference in crystal packing found for both
polymorphic phases.
Open Access This article is distributed under the terms of the
Creative Commons Attribution License which permits any use, dis-
tribution, and reproduction in any medium, provided the original
author(s) and the source are credited.
References
1. Begtrup M (2012) In: Diazole, Triazole, and Tetrazole N-Oxides.
Adv Heterocycl Chem 106:37; and the references cited therein
2. Cerecetto H, Gonzalez M (2002) Current Topic Med Chem
2:1187
3. Aguirre G, Boiani M, Cerecetto H, Gerpe A, Gonzalez M, Sainz
YF, Denicola A, de Ocariz CO, Nogal JJ, Montero D, Escario JA
(2004) Arch Pharm Pharm Med Chem 337:259
4. Dimova D, Iyer P, Vogt M, Totzke F, Kubbutat MHG, Schachtele
C, Laufer S, Bajorath J (2012) J Med Chem 55:11067
5. Campeau LC, Stuart DR, Leclerc JP, Bertrand-Laperle M,
Villemure E, Sun HY, Lasserre S, Guimond N, Lecavallier M,
Fagnou K (2009) J Am Chem Soc 131:3291
6. Mloston G, Gendek T, Heimgartner H (1998) Helv Chim Acta
81:1585
7. Mloston G, Jasinski M, Linden A, Heimgartner H (2006) Helv
Chim Acta 89:1304
8. Mloston G, Romanski J, Jasinski M, Heimgartner H (2009)
Tetrahedron: Asymmetry 20:1073
9. Mloston G, Jasinski M, Heimgartner H, Eur J Organ Chem (2011)
2542
10. Jasinski M, Mloston G, Linden A, Heimgartner H (2008) Helv
Chim Acta 91:1916
11. Mloston G, Jasinski M (2010) Collect Czech Chem Commun
75:871
12. Mloston G, Pieczonka AM, Kowalczyk E, Linden A, Heimgart-
ner H (2011) Helv Chim Acta 94:1764
13. Pieczonka AM, Mloston G, Heimgartner H (2012) Helv Chim
Acta 95:404
14. Lange JHM, van Stuivenberg HH, Coolen HKAC, Adolfs TJP,
McCreary AC, Keizer HG, Wals HC, Veerman W, Borst AJM, de
Looff W, Verveer PC, Kruse CG (2005) J Med Chem 48:1823
15. Hadizadeh F, Hosseinzadeh H, Sadat Motamed-Shariaty V, Seifi
M, Kazemi S (2008) Iran J Pharm Res 7:29
Table 6 Comparison of molecular Hirshfeld surfaces characteristics
Volume (A3) Area (A2) Globularity Asphericity
I 297.7 281.5 0.766 0.324
IIA 290.3 280.3 0.756 0.332
IIB 291.0 277.5 0.765 0.327
IIC 292.2 278.3 0.765 0.334
IID 289.3 278.5 0.760 0.328
Table 7 Distribution of intermolecular contacts from Hirshfeld sur-
face analysis [%]
C/N/O…C/
N/O
F…C H…C H…N H…O H…F H…H
I 8.6 3.1 12.8 3.9 19.4 11.4 40.7
IIA 9.7 3.8 13.2 4.5 18.9 11.3 38.6
IIB 9.2 2.4 14.3 3.9 19.0 11.7 39.5
IIC 9.5 2.6 14.8 4.0 19.5 11.8 38.0
IID 10.0 4.0 12.2 4.6 18.9 11.1 39.2
Struct Chem
123
Page 11
16. Pellei M, Gandin V, Marinelli M, Marzano C, Yousufuddin M,
Dias HVR, Santini C (2012) Inorg Chem 51:9873
17. Chae E, Shin YJ, Ryu EJ, Ji MK, Cho NR, Lee KH, Jeong HJ,
Kim SJ, Choi Y, Oh KS, Park CE, Yoon YS (2013) Bioorg Med
Chem Lett 23:2134
18. Oxford Diffraction (2008) CrysAlis CCD and CrysAlis RED.
Versions 1.171.32.29 Oxford Diffraction Ltd, Abingdon, England
19. Sheldrick GM (1986) SHELXS86 Program for Crystal Structure
Solution. University of Gottingen, Germany
20. Sheldrick GM (2008) Acta Cryst A64:112
21. Farrugia LJ (1999) J Appl Cryst 32:837
22. Nardelli M (1995) J Appl Cryst 28:659
23. Spek AL (2009) Acta Cryst D65:148
24. Frisch MJ, Trucks GW, Schlegel HB, Scuseria GE et al (2009)
Gaussian 09 (Revision A.02), Gaussian, Inc., Wallingford, CT
25. Keith TA, AIMAll Version 09.11.29, 2009 (aim.tkgristmill.com)
26. Spackman MA, McKinnon JJ, Jayatilaka D (2008) CrystEng-
Comm 10:377
27. Spackman MA, Jayatilaka D (2009) CrystEngComm 11:19
28. Allen FH, Kennard O, Watson DG, Brammer L, Orpen AG,
Taylor R (1987) J Chem Soc Perkin Trans 2:S1
29. International Tables for Crystallography (2006) Part A, Chap-
ter 3.1. Kluwer, Dordrecht, the Netherlands
30. Ulrich M (2008) Symmetry Relations between Crystal Structures.
Summer School on Mathmatical and Thoeretical Crystallogra-
phy, Gargano, Italy
31. Toledano JC, Janovec V, Kopsky V, Scott JF, Bocek P (2006)
International Tables for Crystallography, Part D, Chapter 3.1.
Kluwer, Dordrecht, the Netherlands
32. Bujak M, Angel RJ (2005) J Solid State Chem 178:2237
33. Gilli P, Gilli G (2000) J Mol Struct 552:1
34. Gilli P, Bertolasi V, Pretto L, Gilli G (2006) J Mol Struct 790:40
35. Frey PA, Whitt SA, Tobin JB (1994) Science 264:1927
36. Garcia-Viloca M, Gonzalez-Lafont A, Lluch JM (1997) J Am
Chem Soc 119:1081
37. Rybarczyk A, Olszak TA, Małecka M, Nawrot-Modranka J
(1999) Acta Crystallogr C55:1313
38. Rybarczyk-Pirek AJ, Małecka M, Grabowski SJ, Nawrot-Modr-
anka J (2002) Acta Crystallogr C58:o405
39. Rybarczyk-Pirek AJ, Dubis AT, Grabowski AJ, Nawrot-Modr-
anka J (2006) Chem Phys 320:247
40. Espinosa E, Molins E, Lecomte C (1998) Chem Phys Lett
285:170
41. Bader RFW (1990) Atoms in Molecules: A Quantum Theory.
University Press, New York, Oxford
42. Jabłonski M, Palusiak M (2012) J Phys Chem A 116:2322
43. Bankiewicz B, Palusiak M (2011) Comput Theor Chem 966:113
44. Bankiewicz B, Matczak P, Palusiak M (2012) J Phys Chem A
116:452
45. Etter MC, MacDonald JC, Bernstein J (1990) Acta Crystallogr
Sect B 46:256
Struct Chem
123


![Download [1,5 MB]](https://static.documents.pub/doc/80x56/585336331a28abfa398e9e4c/download-15-mb.jpg)


