Atlantic salmon Salmo salar L., brown trout (including the anadromous form, seatrout) Salmo trutta L. and Arctic charr Salvelinus alpinus (L.) provide important
†Author to whom correspondence should be addressed. Tel.: +44(0) 15394 87728; fax: +44(0) 1529446914; email: [email protected]
1794 J . M . E L L I OT T A N D J . A . E L L I OT T
commercial and sports fisheries in western Europe. They are also the only speciesin the subfamily Salmoninae (family Salmonidae) that are native to Britain andIreland. Klemetsen et al. (2003a) have produced a very comprehensive review ofsome aspects of their life histories and noted that several studies have raised concernas to how climate change, particularly global warming, will ultimately influence andaffect salmonid populations in various ways (Power & Power, 1994; Minns et al.,1995; Dempson et al., 2001). Graham & Harrod (2009) recently reviewed the impli-cations of climate change for the fishes of Britain and Ireland and concluded thatchanges in climate, especially water temperature, have and will continue to havean effect on fishes at all levels of biological organization. They add that the fishresponses will vary according to their tolerances and life stage and are complexand difficult to predict. They present overviews for several marine and freshwaterspecies, including S. salar and S. alpinus but, surprisingly, not S. trutta. Anotherrecent review examined the effects of water temperature and flow on anadromoussalmonids with emphasis on S. salar and S. trutta (Jonsson & Jonsson, 2009). It sum-marizes thermal and flow effects on activity, migrations and spawning, embryonicdevelopment, hatching, emergence, growth and life-history traits. There is inevitablysome overlap between these two large reviews and also Part I of the present overview.The latter, however, stresses comparative aspects of the thermal requirements ofS. salar, S. trutta and S. alpinus.
Temperature is often regarded simply as a factor affecting the physiology andbehaviour of a fish, but it is also a characteristic of its habitat, being one axis of itsmultidimensional niche (Magnuson et al., 1979). There is some evidence that rivertemperatures have already increased in several countries (Caissie, 2006). As watertemperature increases due to climate change, it is important to obtain quantitativeinformation on the thermal requirements of S. salar, S. trutta and S. alpinus sothat potential problems can be anticipated by those responsible for the conservationand sustainable management of the fisheries, and the maintenance of biodiversity infreshwater ecosystems.
Fishes are obligate poikilotherms (ectotherms) and can often perceive temperaturechanges of <0·5◦ C (Murray, 1971). Their gills are an effective heat exchanger, butmost heat transfer (70–90%) is by conduction directly through the body wall (Elliott,1981). When the water temperature changes, thermal equilibrium must occur in thefish, but there is a time lag. For example, in experiments with S. trutta, this timelag increased with fish mass so that the body temperature of larger fish was inde-pendent of small and rapid fluctuations in temperature (Elliott, 1981). It is thereforeevident that small S. trutta are much more susceptible to fluctuations in water tem-perature than larger S. trutta; being large is a useful buffer against sudden changes inwater temperature. Therefore, a large lake S. trutta could ascend rapidly from cooler,deeper water to take a prey item in the warmer, surface water and then descend againrapidly to cooler water without a major change in body temperature.
In spite of this buffering effect, there are clear temperature limits for different lifestages and functions of fishes, and these can vary markedly among species. There-fore, this overview starts in Part I by comparing the temperature limits for survival,feeding and growth of S. salar, S. trutta and S. alpinus, using data from Europe andNorth America. In Part II, it demonstrates the importance of obtaining long-termdata on water temperature and different life stages and emphasizes the importanceof developing predictive models, using data from a long-term study (1967–2000)
T H E R M A L N E E D S O F S . S A L A R , S . T RU T TA A N D S . A L P I N U S 1795
of a juvenile anadromous S. trutta population. Finally, a validated growth model isused to predict growth under different temperature regimes that may arise as a resultof climate change. Although these predictions are based on a growth model for aBritish population, they are probably applicable to populations of S. trutta in othercountries.
PART I: TEMPERATURE LIMITS FOR SURVIVAL, FEEDINGAND GROWTH
S U RV I VA L
Although fishes occur in habitats from −2·5◦ C (polar species) to 44◦ C (desertspecies), no species can survive over this range and each species has a characteristicthermal niche with upper and lower lethal limits. Freshwater teleosts in temperateregimes are usually found within the range 0–30◦ C. Minimum temperatures may fallto 0◦ C in upland and northern streams in winter and maximum values may exceed30◦ C in shallow ponds in summer or in waters that receive a thermal discharge.The thermal requirements of freshwater fishes may be species specific, and thereforegenetically fixed among populations of the same species. The basic parameter is thecritical thermal maximum for survival because it often correlates with other criticaltemperatures such as the optimum temperature for growth and the upper limits forfeeding and growth (Jobling, 1981).
Two categories of methods have been used to investigate the critical thermal limits(Kilgour & McCauley, 1986; Elliott, 1994, 1995). In the first group, the rapid-transfermethod, fishes are transferred abruptly from an acclimation temperature to a higher,or lower, constant temperature until a critical value for survival is found, usuallyfor 50% of the fishes. Thus, they are subjected to handling stress as well as thermalshock. In the second group, the slow-heating method, the critical value is determinedby changing the temperature at a constant rate from the acclimation value until thefish first shows signs of stress, usually equilibrium loss, or death occurs. Such meth-ods overcome the disadvantages of those in the first group but have a new problemthat the rate of temperature change can affect the final critical value. Arguments con-tinue over the equivalence of values determined by the two groups of methods, butKilgour & McCauley (1986) provided a reconciling view that was supported stronglyby the detailed experiments of Elliott & Elliott (1995). To add further complexity,two values for critical thermal limits occur in the literature (Kilgour & McCauley,1986; Elliott, 1994, 1995). The incipient lethal temperature (ILT) is that which fishes(usually 50% of the sample) can tolerate for a long period (7 days is usual standard),but beyond which they cannot survive indefinitely. The ultimate lethal temperature(ULT) is that which fishes cannot tolerate for even short time periods (10 min isthe usual standard time). The latter value is sometimes called the critical thermalmaximum or minimum.
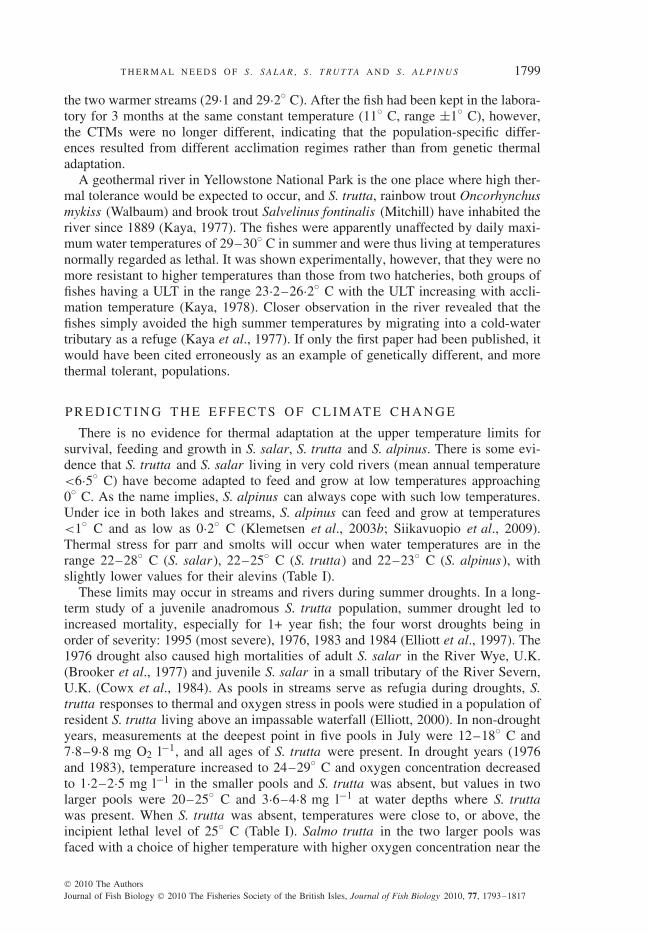
Critical temperatures for the survival of the different life stages of S. salar, S. truttaand S. alpinus are compared in Table I. Most values increase with the acclimationtemperature (Elliott, 1981, 1994), and the wide ranges for some values are due tothis and the different methodologies mentioned above. Salmo salar have the highesttemperature tolerance, followed by S. trutta and finally S. alpinus with the lowest
Alevins, hatched fish with yolk sac, feeding entirely on yolk, living in gravel nest; parr, after the yolksac has been fully absorbed and until smoltification begins; smolt, when seaward migration occurs.Values collated from references given in Elliott & Baroudy (1995) for all three species. Additionalreferences: Grande & Andersen (1991), Cunjak et al. (1993), Bremset (2000), Jonsson et al. (2001),Lund et al. (2002) and Finstad et al. (2004) for S. salar ; Grande & Andersen (1991), Bremset (2000) andOjanguren et al. (2001) for S. trutta (including sea trout); Brannas & Wiklund (1992), Lyytikainen et al.(1997), Thyrel et al. (1999), Elliott & Klemetsen (2002) and Klemetsen et al. (2003b) for S. alpinus.
tolerance to high temperatures. Salmo salar, however, has the poorest tolerance tolow temperatures compared with the other two species. The ultimate lower lethaltemperature is for the anadromous form of each species in sea water; S. alpinus cantolerate temperatures as low as −0·99◦ C compared with higher values of −0·81◦ Cfor S. trutta and −0·75◦ C for S. salar. Sea temperatures below the latter valuecaused high mortality in sea-caged S. salar on the north-east coast of North America.This problem was remedied by the introduction of an anti-freeze gene to producegenetically engineered freeze-resistant S. salar (Fletcher et al., 1988, 1992; Du et al.,1992). For all three species, the temperature tolerance for alevins is slightly lowerthan that for parr and smolts, and the eggs have the lowest tolerance. The egg stagewould be clearly the most vulnerable life stage to any increase in temperature as aresult of climate change.
In spite of the varied methodology and different acclimation temperatures usedby different workers, values are remarkably similar over a wide geographical range.For example, S. alpinus is the species most adapted to cold water, and it has beensuggested that southern populations of this species may have been selected to tol-erate warmer conditions than more northern populations (Swift, 1964). There isno evidence, however, to support this hypothesis. Recent work indicates negligi-ble geographical variation in the thermal limits for alevins and parr, with similarvalues for S. alpinus from four races (strictly gamodemes) from Windermere, U.K.at 54◦ N (Baroudy & Elliott, 1994a), from four lakes in Sweden between 63 and68◦ N (Thyrel et al., 1999), from Lake Inari at 69–70◦ N in Finland (Lyytikainenet al., 1997) and from the oligotrophic Fjellfrøsvatn at 69◦ N in Norway (Elliott& Klemetsen, 2002).
T H E R M A L N E E D S O F S . S A L A R , S . T RU T TA A N D S . A L P I N U S 1797
F E E D I N G A N D G ROW T H
The upper limits for feeding are also highest for S. salar and lowest for S. alpi-nus, while the lower limits are close to zero for all three species (Table I). Theupper limits, however, vary markedly among different studies with some work-ers reporting fishes continuing to feed at temperatures close to or even within theincipient and lethal temperature ranges. There have been several detailed experi-mental studies on the growth of the three species, and these provided estimates ofthe lower and upper temperature limits for growth as well as the optimum tem-perature for growth (Table II). They sometimes provided the temperature at whichthe conversion of energy intake into growth was most efficient. All these valuesfor S. salar are generally higher than those for the other two species. The opti-mum temperatures are for fishes feeding on maximum rations. It is important torealize, however, that the optimum temperature is not fixed but decreases withdecreasing energy intake (Elliott, 1994; Elliott & Hurley, 2000b). Therefore, theration level should always be given when defining an optimum temperature forgrowth.
The optimum temperature for growth in S. trutta also changes with diet, beingc. 3◦ C higher for piscivorous fish and fish feeding on pelleted food than for fishfeeding on invertebrates (Table II). Although the maximum conversion efficiency ishigher at 42% for piscivorous S. trutta than that of 32% for S. trutta feeding oninvertebrates, the temperatures at which these values occur are remarkably similarat close to 9◦ C (Table II). Furthermore, it is notable that the preferred temperaturefor 0+ and 1+ year parr of S. trutta in a temperature gradient (5–25◦ C) in the lab-oratory was 9–10◦ C, close to the temperature for maximum conversion efficiency
Table II. Temperature limits for growth, optimum temperature for growth on maximumrations and temperature for maximum growth efficiency, for Salmo salar, Salmo trutta andSalvelinus alpinus (◦ C). Maximum conversion efficiencies for growth energy as a percentageof energy intake are also given in parenthesis for S. salar (Norway), and for piscivorous
References: Elliott & Hurley (1997), Forseth et al. (2001), Jonsson et al. (2001) and Finstad et al. (2004)for S. salar ; Elliott et al. (1995), Forseth & Jonsson (1994), Elliott & Hurley (1999, 2000a, b), Ojangurenet al. (2001) and Forseth et al. (2009) for S. trutta (including sea trout); Larsson & Berglund (1998,2005) and Larsson et al. (2005) for S. alpinus.
1798 J . M . E L L I OT T A N D J . A . E L L I OT T
(J. M. Elliott, unpubl. data). Similarly, the preferred temperature for S. alpinus wasc. 12◦ C, a value lower than the optimum temperature (Larsson, 2005).
T H E R M A L A DA P TAT I O N
There are two hypotheses for thermal adaptation in ectotherms: (1) adaptation tolocal optima and (2) the countergradient variation hypothesis. The first hypothesis(Levinton, 1983) implies that natural selection can shift the optimum temperaturefor growth to match the prevailing temperature in a new or changed thermal regime.There is little support for this hypothesis from studies of salmonids (Elliott, 1991,1994; Forseth et al., 2001, 2009; Larsson et al., 2005; Jonsson & Jonsson, 2009). Thesecond hypothesis (Levins, 1969; Conover & Schultz, 1995) suggests that populationsfrom hostile environments (low temperatures, short season for growth and strongcompetition) perform better at all temperatures than conspecifics from benign envi-ronments. This hypothesis was supported by Norwegian and Spanish populations ofS. trutta from very cold rivers with a mean annual water temperature <6·5◦ C (Jensenet al., 2000; Nicola & Almodovar, 2004) and also by studies of growth bimodalityand digestive performance of juvenile S. salar from geographically disjunct popula-tions (Nicieza et al., 1994a, b). The statistical power of the latter studies, however,is low because only two populations were used. It is also notable that heritabilityfor tolerance to high water temperatures was detected in an experimental study withChinook salmon Oncorhynchus tshawytscha (Walbaum) from a northern cold-waterstream but not from a southern warm-water stream (Beacham & Withler, 1991). Incontrast, experimental growth data provided no indication of thermal adaptation orof support for the countergradient hypothesis for S. alpinus from 11 European waterbodies between 54 and 70◦ N (Larsson et al., 2005) and for anadromous, stream-resident and lake-resident S. trutta from Norway and Sweden (Forseth et al., 2009).Similarly, Jonsson et al. (2001) investigated possible thermal adaptation of S. salarparr from five Norwegian rivers and found no correlations between either latitude orthe thermal conditions in the river of origin and the temperature limits for growth,thermal growth optima or maximum growth. They did find, however, that growthrate varied significantly among populations. Since growth was not generally higherin these Norwegian populations than in the British populations studied by Elliott& Hurley (1997), there was no support for either hypothesis for thermal adapta-tion. Finstad et al. (2004), however, found that S. salar from three very cold riversin north Norway (mean annual temperatures: 4, 6 and 9◦ C, respectively) fed andgrew at temperatures in the range 1–6◦ C, whereas the models developed from theexperiments of Jonsson et al. (2001) predicted a cessation of feeding and growth attemperatures <5◦ C. In the absence of further studies, the general conclusion is thatsalmonids show little intraspecific variation to support either of the two hypothesesfor thermal adaptation, except in very cold rivers. The adaptive variation in growthpotential appears to be related to life-history characteristics influencing reproductivesuccess rather than their thermal conditions (Jonsson & Jonsson, 2009).
It is easy to conclude erroneously that thermal adaptation has occurred. Forexample, juvenile coho salmon Oncorhynchus kisutch (Walbaum) from three popu-lations were heated in a tank alongside the stream to determine their critical thermalmaximum (CTM) (Konecki et al., 1995). Tolerances varied among the populationswith the fish from the coolest stream having a lower CTM (28·2◦ C) than fish from
T H E R M A L N E E D S O F S . S A L A R , S . T RU T TA A N D S . A L P I N U S 1799
the two warmer streams (29·1 and 29·2◦ C). After the fish had been kept in the labora-tory for 3 months at the same constant temperature (11◦ C, range ±1◦ C), however,the CTMs were no longer different, indicating that the population-specific differ-ences resulted from different acclimation regimes rather than from genetic thermaladaptation.
A geothermal river in Yellowstone National Park is the one place where high ther-mal tolerance would be expected to occur, and S. trutta, rainbow trout Oncorhynchusmykiss (Walbaum) and brook trout Salvelinus fontinalis (Mitchill) have inhabited theriver since 1889 (Kaya, 1977). The fishes were apparently unaffected by daily maxi-mum water temperatures of 29–30◦ C in summer and were thus living at temperaturesnormally regarded as lethal. It was shown experimentally, however, that they were nomore resistant to higher temperatures than those from two hatcheries, both groups offishes having a ULT in the range 23·2–26·2◦ C with the ULT increasing with accli-mation temperature (Kaya, 1978). Closer observation in the river revealed that thefishes simply avoided the high summer temperatures by migrating into a cold-watertributary as a refuge (Kaya et al., 1977). If only the first paper had been published, itwould have been cited erroneously as an example of genetically different, and morethermal tolerant, populations.
P R E D I C T I N G T H E E F F E C T S O F C L I M AT E C H A N G E
There is no evidence for thermal adaptation at the upper temperature limits forsurvival, feeding and growth in S. salar, S. trutta and S. alpinus. There is some evi-dence that S. trutta and S. salar living in very cold rivers (mean annual temperature<6·5◦ C) have become adapted to feed and grow at low temperatures approaching0◦ C. As the name implies, S. alpinus can always cope with such low temperatures.Under ice in both lakes and streams, S. alpinus can feed and grow at temperatures<1◦ C and as low as 0·2◦ C (Klemetsen et al., 2003b; Siikavuopio et al., 2009).Thermal stress for parr and smolts will occur when water temperatures are in therange 22–28◦ C (S. salar), 22–25◦ C (S. trutta) and 22–23◦ C (S. alpinus), withslightly lower values for their alevins (Table I).
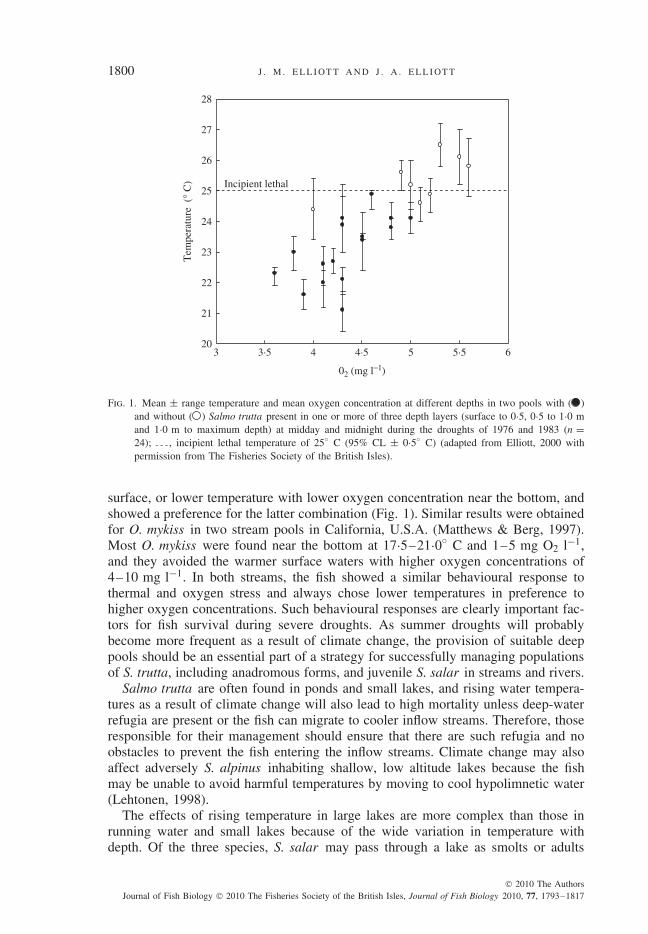
These limits may occur in streams and rivers during summer droughts. In a long-term study of a juvenile anadromous S. trutta population, summer drought led toincreased mortality, especially for 1+ year fish; the four worst droughts being inorder of severity: 1995 (most severe), 1976, 1983 and 1984 (Elliott et al., 1997). The1976 drought also caused high mortalities of adult S. salar in the River Wye, U.K.(Brooker et al., 1977) and juvenile S. salar in a small tributary of the River Severn,U.K. (Cowx et al., 1984). As pools in streams serve as refugia during droughts, S.trutta responses to thermal and oxygen stress in pools were studied in a population ofresident S. trutta living above an impassable waterfall (Elliott, 2000). In non-droughtyears, measurements at the deepest point in five pools in July were 12–18◦ C and7·8–9·8 mg O2 l−1, and all ages of S. trutta were present. In drought years (1976and 1983), temperature increased to 24–29◦ C and oxygen concentration decreasedto 1·2–2·5 mg l−1 in the smaller pools and S. trutta was absent, but values in twolarger pools were 20–25◦ C and 3·6–4·8 mg l−1 at water depths where S. truttawas present. When S. trutta was absent, temperatures were close to, or above, theincipient lethal level of 25◦ C (Table I). Salmo trutta in the two larger pools wasfaced with a choice of higher temperature with higher oxygen concentration near the
1800 J . M . E L L I OT T A N D J . A . E L L I OT T
20
21
22
23
24
25
26
27
28
3 3·5 4 4·5 5 5·5 6
02 (mg l−1)
Tem
pera
ture
(° C
) Incipient lethal
Fig. 1. Mean ± range temperature and mean oxygen concentration at different depths in two pools with ( )and without ( ) Salmo trutta present in one or more of three depth layers (surface to 0·5, 0·5 to 1·0 mand 1·0 m to maximum depth) at midday and midnight during the droughts of 1976 and 1983 (n =24); , incipient lethal temperature of 25◦ C (95% CL ± 0·5◦ C) (adapted from Elliott, 2000 withpermission from The Fisheries Society of the British Isles).
surface, or lower temperature with lower oxygen concentration near the bottom, andshowed a preference for the latter combination (Fig. 1). Similar results were obtainedfor O. mykiss in two stream pools in California, U.S.A. (Matthews & Berg, 1997).Most O. mykiss were found near the bottom at 17·5–21·0◦ C and 1–5 mg O2 l−1,and they avoided the warmer surface waters with higher oxygen concentrations of4–10 mg l−1. In both streams, the fish showed a similar behavioural response tothermal and oxygen stress and always chose lower temperatures in preference tohigher oxygen concentrations. Such behavioural responses are clearly important fac-tors for fish survival during severe droughts. As summer droughts will probablybecome more frequent as a result of climate change, the provision of suitable deeppools should be an essential part of a strategy for successfully managing populationsof S. trutta, including anadromous forms, and juvenile S. salar in streams and rivers.
Salmo trutta are often found in ponds and small lakes, and rising water tempera-tures as a result of climate change will also lead to high mortality unless deep-waterrefugia are present or the fish can migrate to cooler inflow streams. Therefore, thoseresponsible for their management should ensure that there are such refugia and noobstacles to prevent the fish entering the inflow streams. Climate change may alsoaffect adversely S. alpinus inhabiting shallow, low altitude lakes because the fishmay be unable to avoid harmful temperatures by moving to cool hypolimnetic water(Lehtonen, 1998).
The effects of rising temperature in large lakes are more complex than those inrunning water and small lakes because of the wide variation in temperature withdepth. Of the three species, S. salar may pass through a lake as smolts or adults
T H E R M A L N E E D S O F S . S A L A R , S . T RU T TA A N D S . A L P I N U S 1801
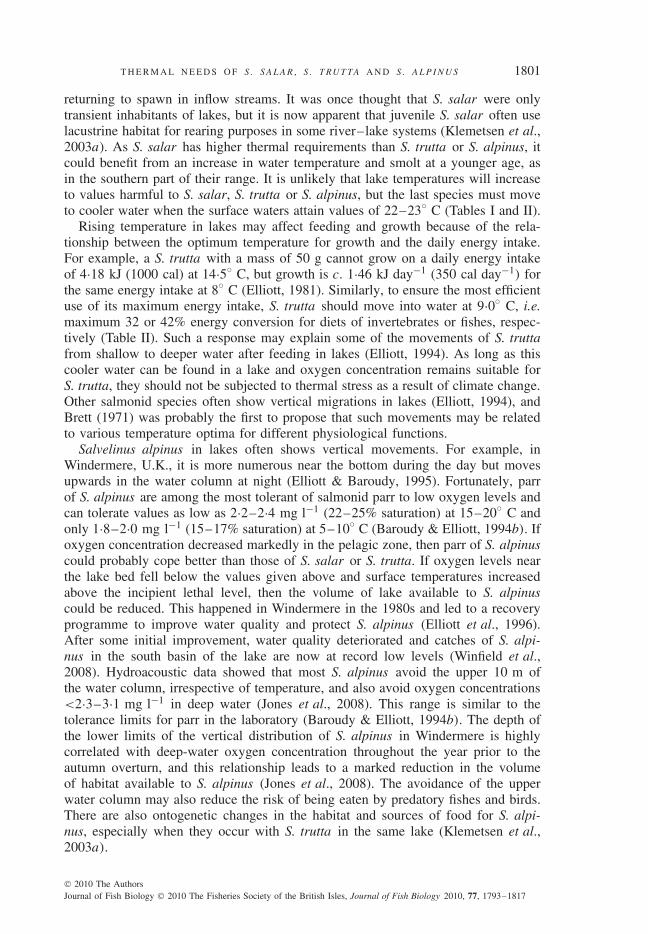
returning to spawn in inflow streams. It was once thought that S. salar were onlytransient inhabitants of lakes, but it is now apparent that juvenile S. salar often uselacustrine habitat for rearing purposes in some river–lake systems (Klemetsen et al.,2003a). As S. salar has higher thermal requirements than S. trutta or S. alpinus, itcould benefit from an increase in water temperature and smolt at a younger age, asin the southern part of their range. It is unlikely that lake temperatures will increaseto values harmful to S. salar, S. trutta or S. alpinus, but the last species must moveto cooler water when the surface waters attain values of 22–23◦ C (Tables I and II).
Rising temperature in lakes may affect feeding and growth because of the rela-tionship between the optimum temperature for growth and the daily energy intake.For example, a S. trutta with a mass of 50 g cannot grow on a daily energy intakeof 4·18 kJ (1000 cal) at 14·5◦ C, but growth is c. 1·46 kJ day−1 (350 cal day−1) forthe same energy intake at 8◦ C (Elliott, 1981). Similarly, to ensure the most efficientuse of its maximum energy intake, S. trutta should move into water at 9·0◦ C, i.e.maximum 32 or 42% energy conversion for diets of invertebrates or fishes, respec-tively (Table II). Such a response may explain some of the movements of S. truttafrom shallow to deeper water after feeding in lakes (Elliott, 1994). As long as thiscooler water can be found in a lake and oxygen concentration remains suitable forS. trutta, they should not be subjected to thermal stress as a result of climate change.Other salmonid species often show vertical migrations in lakes (Elliott, 1994), andBrett (1971) was probably the first to propose that such movements may be relatedto various temperature optima for different physiological functions.
Salvelinus alpinus in lakes often shows vertical movements. For example, inWindermere, U.K., it is more numerous near the bottom during the day but movesupwards in the water column at night (Elliott & Baroudy, 1995). Fortunately, parrof S. alpinus are among the most tolerant of salmonid parr to low oxygen levels andcan tolerate values as low as 2·2–2·4 mg l−1 (22–25% saturation) at 15–20◦ C andonly 1·8–2·0 mg l−1 (15–17% saturation) at 5–10◦ C (Baroudy & Elliott, 1994b). Ifoxygen concentration decreased markedly in the pelagic zone, then parr of S. alpinuscould probably cope better than those of S. salar or S. trutta. If oxygen levels nearthe lake bed fell below the values given above and surface temperatures increasedabove the incipient lethal level, then the volume of lake available to S. alpinuscould be reduced. This happened in Windermere in the 1980s and led to a recoveryprogramme to improve water quality and protect S. alpinus (Elliott et al., 1996).After some initial improvement, water quality deteriorated and catches of S. alpi-nus in the south basin of the lake are now at record low levels (Winfield et al.,2008). Hydroacoustic data showed that most S. alpinus avoid the upper 10 m ofthe water column, irrespective of temperature, and also avoid oxygen concentrations<2·3–3·1 mg l−1 in deep water (Jones et al., 2008). This range is similar to thetolerance limits for parr in the laboratory (Baroudy & Elliott, 1994b). The depth ofthe lower limits of the vertical distribution of S. alpinus in Windermere is highlycorrelated with deep-water oxygen concentration throughout the year prior to theautumn overturn, and this relationship leads to a marked reduction in the volumeof habitat available to S. alpinus (Jones et al., 2008). The avoidance of the upperwater column may also reduce the risk of being eaten by predatory fishes and birds.There are also ontogenetic changes in the habitat and sources of food for S. alpi-nus, especially when they occur with S. trutta in the same lake (Klemetsen et al.,2003a).
1802 J . M . E L L I OT T A N D J . A . E L L I OT T
Finally, possible problems with egg development have to be addressed becausethis is the life stage with the lowest thermal tolerance for all three species (Table I).All three species usually spawn in late autumn and winter in Britain and Ireland,and water temperatures will not exceed the upper limits for egg survival unless thereis a thermal discharge. Very few eggs, however, hatch at the upper limit, and theoptimum range over which the highest percentage of eggs hatch is much lower at4–7◦ C for S. salar, 1–8◦ C for S. trutta and 1–5◦ C for S. alpinus (Peterson et al.,1977; Humpesch, 1985). Stream temperatures in southern Britain have increasedover 26 years (1980–2006) by 2·1–2·9◦ C in winter to values close to or exceeding8◦ C (Durance & Ormerod, 2009). Such a high value is at the upper limit for eggs ofS. salar and S. trutta. Autumn-spawning S. alpinus in Britain and Ireland often laytheir eggs in shallow (water depth: 1–3 m) well-oxygenated water on the lake shorefrom late September to December, and their eggs and alevins require at least 9 mgO2 l−1 (=70% saturation) at 5◦ C, a much higher value than that for parr (Elliott &Baroudy, 1995). If climate change leads to water temperatures >5◦ C and reducedoxygen levels in the spawning habitat, then the result could be catastrophic for thesurvival of S. alpinus. This is the most vulnerable of the three species to climatechange, especially the egg and alevin stages. A recent survey of five Scottish popu-lations, five English populations and one Welsh population in the U.K. has shown adecline in abundance, except for the most northerly Scottish population that showeda significant increase (Winfield et al., 2010). It would be tragic to lose populationsof S. alpinus, a species recognized to hold significant biodiversity conservation valuein Britain and Ireland (Maitland et al., 2007).
PART II: LONG-TERM DATA AND PREDICTIVE MODELS
T H E I M P O RTA N C E O F L O N G - T E R M S T U D I E SA N D A M O D E L L I N G A P P ROAC H
Most ecologists agree that long-term studies are important but few conduct them.There are many reasons why they are rare. They are often more difficult to plan andexecute than short-term studies and rarely yield immediate publications. They alsorequire secure, long-term funding and such funding is rare. As ecology has movedfrom being a qualitative descriptive science to becoming a quantitative predictive sci-ence, awareness of the importance of long-term studies has increased. Elliott (1994)summarized some examples of how they have provided critical data on a numberof practical issues that are of concern to society. Long-term studies are essential toprovide estimates of baseline variation (it is naıve to assume a constant baseline),to detect long-term trends in the mean level of the baseline, to detect and evaluatethe effects of rare events (e.g. droughts and spates) and to provide information formeaningful, testable hypotheses.
There is a strong link between long-term studies and mathematical modelling. Thedevelopment of ecological theory is necessary for the advancement of the scienceand long-term studies are required for the testing of the theory. Both provide essen-tial knowledge for the conservation and management of biodiversity in the naturalenvironment. It must be remembered that all mathematical models are simplificationsof reality. Complex models require many parameters and it is easy to become lost
T H E R M A L N E E D S O F S . S A L A R , S . T RU T TA A N D S . A L P I N U S 1803
in this complexity. The basic role of a model is to predict a baseline from whichchanges can be assessed. Modelling in population ecology is an iterative processin which a useful model is constantly tested and refined, then re-tested. Hence, theneed for long-term data. Two case studies illustrate the importance of long-termstudies and the development of predictive models, using data from a long-term study(1967–2000) of a juvenile anadromous S. trutta population in Black Brows Beck, asmall stream in Cumbria, U.K. (Elliott, 1994). The first predicts the emergence periodof fry and the second predicts the growth of juvenile S. trutta during the freshwa-ter phase of their life cycle. Finally, the latter growth model is used to predict thepossible effects of climate change on the growth of S. trutta.
C A S E S T U DY I : E M E R G E N C E O F F RY
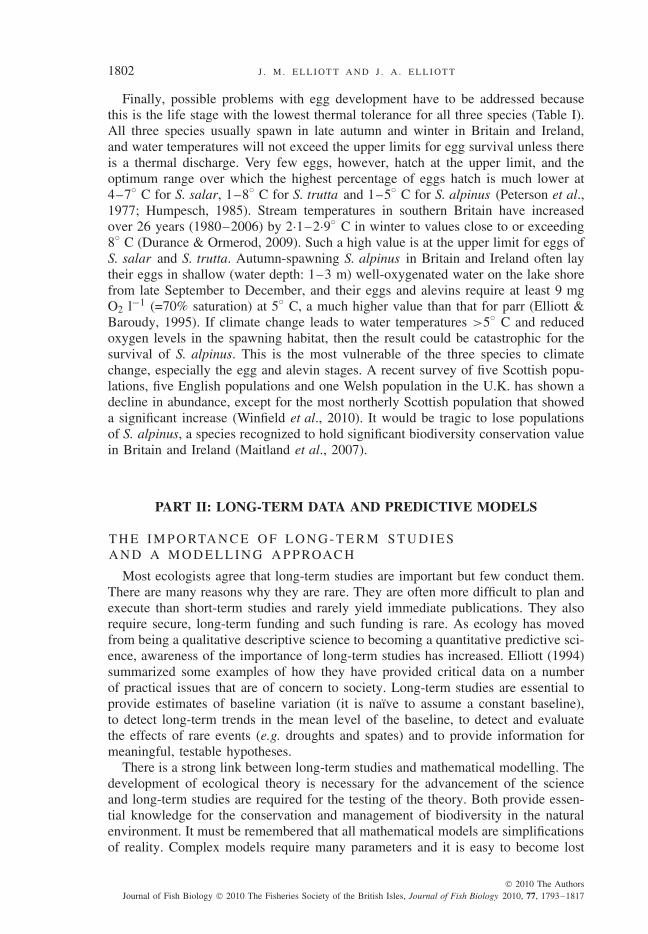
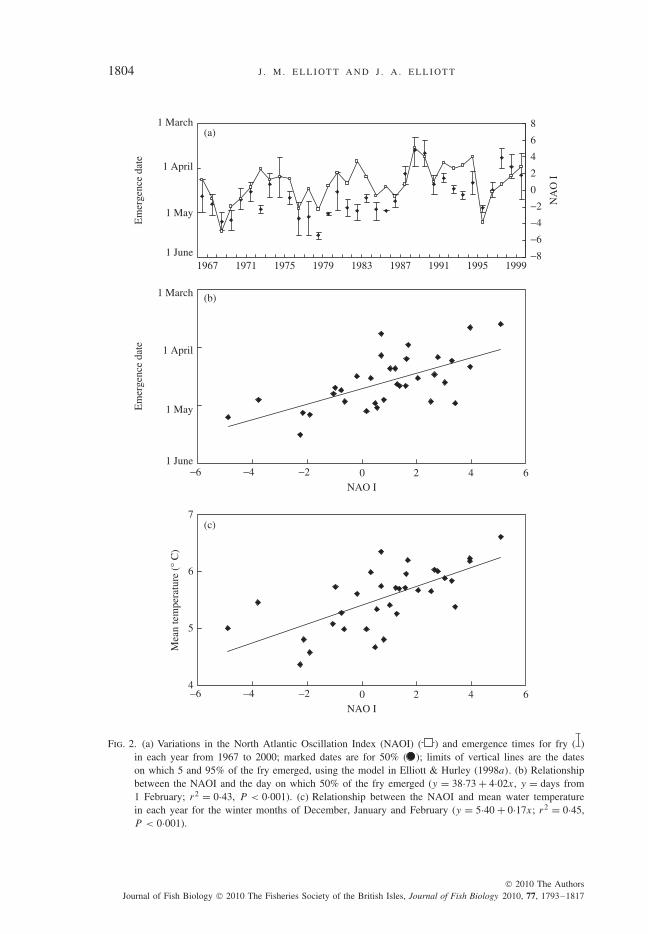
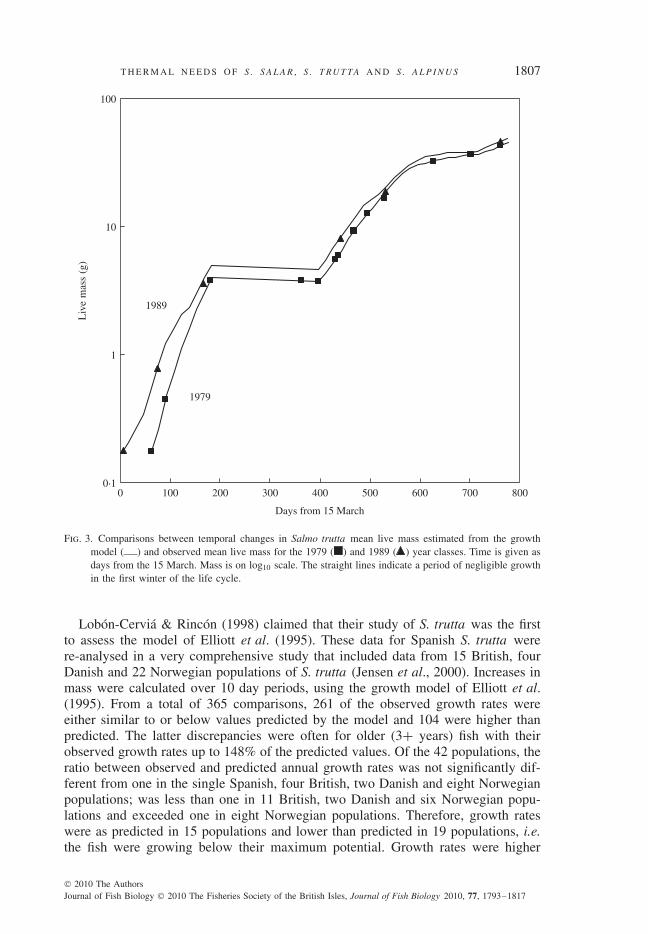
Individual-based models were developed to predict the emergence period forS. trutta fry and their size at emergence (Elliott & Hurley, 1998a, b). The fry stagewas defined as the short transition stage when the juveniles emerge from the safety ofthe gravel nest (or redd) and start to feed and disperse. Each model was developedfrom laboratory experiments and validated by field data for 8 years (1967–1971,1974, 1975 and 1980). The first model was used to predict in each year the mediandate for fry emergence (50% emerged) and the dates on which 5 and 95% of the fryemerged [Fig. 2(a)]. Predicted values over 34 years (1967 to 2000) revealed a largevariation in the timing of emergence with a difference of nearly 2 months betweenthe extreme values for median emergence time (i.e. 22 March 1989 and 18 May1979). Most of the variation in median emergence date was due to variations inwater temperature with spawning date as a minor secondary factor; the latter, how-ever, had a greater effect on the length of the emergence period (Elliott & Hurley,1998a).
It was shown later that the emergence period correlated significantly (r = 0·66,P < 0·001) with the North Atlantic Oscillation Index (NAOI) [Fig. 2(a), (b)], andstream temperature during winter also correlated significantly (r = 0·67, P < 0·001)with the NAOI [Fig. 2(c)], providing a probable causal link (Elliott et al., 2000).Therefore, the interannual variations in emergence may not be unique to this onestream, but may be typical of other S. trutta streams with similar climatic conditions.If fry emergence becomes consistently earlier as a result of warmer winters, then thelength of the growth period in the first year of the life cycle could be extended. Thiscould affect subsequent life stages, especially the timing of smoltification.
The North Atlantic Oscillation is a well-known climate pattern associated withchanges in the strength of the surface westerly winds across the North Atlanticonto Europe. It has been observed for centuries through its effect on winter tem-peratures and affects a wide range of biota (Ottersen et al., 2001). The NAOI isprimarily a winter phenomenon, so its connection with wind, temperature and pre-cipitation is strongest during winter. Therefore, attempts to link biological eventsto the NAOI in other seasons may not be successful. The NAOI used here is thewinter index (December to March) based on the difference of normalized sea-levelpressures between Lisbon, Portugal and Stykkisholmur, Reykjavik, Iceland (Hurrell,1995). Positive indices are associated with stronger than average westerly winds overEurope, resulting in mild, wet winters. Conversely, negative values are associatedwith weaker westerly winds over the North Atlantic and correspondingly colder than
1804 J . M . E L L I OT T A N D J . A . E L L I OT T
(a)
1967
Em
erge
nce
date
−8
−6
−4
−2
0
2
4
6
8
NA
O I
1 June
1 May
1 April
1 March
1971 1975 1979 1983 1987 1991 1995 1999
(b)
−6
NAO I
Em
erge
nce
date
1 June
1 May
1 April
1 March
−4 −2 0 2 4 6
(c)
4
5
6
7
Mea
n te
mpe
ratu
re (
° C)
−6
NAO I
−4 −2 0 2 4 6
Fig. 2. (a) Variations in the North Atlantic Oscillation Index (NAOI) ( ) and emergence times for fry ( )in each year from 1967 to 2000; marked dates are for 50% ( ); limits of vertical lines are the dateson which 5 and 95% of the fry emerged, using the model in Elliott & Hurley (1998a). (b) Relationshipbetween the NAOI and the day on which 50% of the fry emerged (y = 38·73 + 4·02x, y = days from1 February; r2 = 0·43, P < 0·001). (c) Relationship between the NAOI and mean water temperaturein each year for the winter months of December, January and February (y = 5·40 + 0·17x; r2 = 0·45,P < 0·001).
T H E R M A L N E E D S O F S . S A L A R , S . T RU T TA A N D S . A L P I N U S 1805
normal winters (Hurrell, 1996; Osborn, 2006). It is obvious from Fig. 2 that morevalues have been positive than negative in most years.
In their review of the earlier literature, Jonsson, B. & Jonsson (2004) cited severalstudies that identified the NAOI in winter as an important factor affecting the marineproduction of S. salar. Post-smolt growth in four stocks of S. salar in England andWales, U.K. was also positively related to the index (Davidson & Hazlewood, 2005).The proportion of S. salar returning as grilse to a Norwegian river was positivelyrelated to the NAOI for the winter after their smoltification (i.e. warmer marineconditions during positive NAOI), as was also the total number of returning fish(Jonsson, N. & Jonsson, 2004). The mass increment of these grilse also correlatedpositively with the NAOI during spring and early summer (May to July) when thesmolts first entered the sea. The positive NAOI, and hence warmer conditions forthe smolts promoted rapid growth with better survival and feeding and facilitated thedevelopment of energy reserves for gonadal development after just one winter at sea.Hence, there was an increase in the number of S. salar returning as grilse. Parr growthand the proportion of 1 year-old smolts also correlated positively with the NAOI inthe same population (Jonsson et al., 2005). These relationships with the NAOI clearlydemonstrate the widespread effects of climate change on the life cycle of S. trutta andS. salar. They also show that the NAOI can be used as a useful indicator of climatechange in the future. It is not the only factor operating. For example, the coefficientof determination (r2) in Fig. 2(b) indicates that variation in the NAOI could explain43% of the variation in emergence times, 57% was due to other factors.
C A S E S T U DY I I : A G ROW T H M O D E L F O R S . T RU T TA
Unlike most vertebrates, many fish species exhibit indeterminate growth so thatthe mass of fish of similar age in the same species can vary considerably amongpopulations. For example, the mass of 3 year-old mature female S. trutta can varyfrom only 75–100 g for resident stream fish to 5 kg or more for anadromous fishreturning to spawn in fresh water (Elliott, 1994). As it shows such a wide variationin size, S. trutta is an ideal subject for studying the complexity of factors affectingits growth. In his comprehensive review of growth in fishes, Ricker (1979) empha-sized the importance of developing mathematical models for growth. He showedthat the early growth models were empirical equations fitting a course of growth inrelation to time or age, usually at annual intervals, e.g. von Bertalanffy, Gompertz,Johnson and Richards growth curves. More than one model will often be found todescribe satisfactorily the same set of observations, especially when applied to annualgrowth. These models also assume that growth is asymptotic, i.e. the size of a fishwill tend towards some fixed limit no matter how long a fish lives. This assumptionis clearly invalid for salmonids. Ricker (1979) concluded that more realistic modelsare required to describe growth over short periods of time and thus to determine iffishes are growing at their maximum potential.
It is 35 years since a predictive model was developed for the growth of S. trutta(Elliott, 1975). This model has now been used to investigate growth in at least 40populations of S. trutta. In most populations, the fish were growing at or below theirmaximum potential with only a few populations in which they grew faster than themaximum rates predicted by the model (Elliott, 1994). The model underestimatedgrowth of S. trutta at sea, however, and was thus not suitable for predicting sea
1806 J . M . E L L I OT T A N D J . A . E L L I OT T
growth of anadromous S. trutta (L’Abee-Lund et al., 1989). Although the modelhas been widely used, it was developed from experimental data for a small sampleof S. trutta and required a large number of parameters, only one of which, themass exponent, had any biological significance. Therefore, more experiments wereperformed to increase the database to values for 185 fish feeding on maximumrations of invertebrate food at different temperatures in the range 3·8–21·7◦ C, anda new model was developed (Elliott et al., 1995). This model is continuous overthe temperature range 3·8–21·7◦ C and has five parameters, all of which can beinterpreted in biological terms: the optimum temperature for growth, the lower andupper temperatures at which growth is zero, the mass exponent for transformationof mass that produces linear growth with time and the growth rate of a 1 g fish atthe optimum temperature. The model was validated by comparing values estimatedfrom it with observed values for both mean mass and growth rate in 34 year classes(1967–2000) of juvenile anadromous S. trutta in Black Brows Beck (Elliott, 2009).These values were for the 2 years of the life cycle spent in fresh water. The dateand mean mass at the start of the growth period were defined as the median datefor fry emergence and their mean mass at emergence, both being estimated from theindividual-based models mentioned earlier (Elliott & Hurley, 1998a, b).
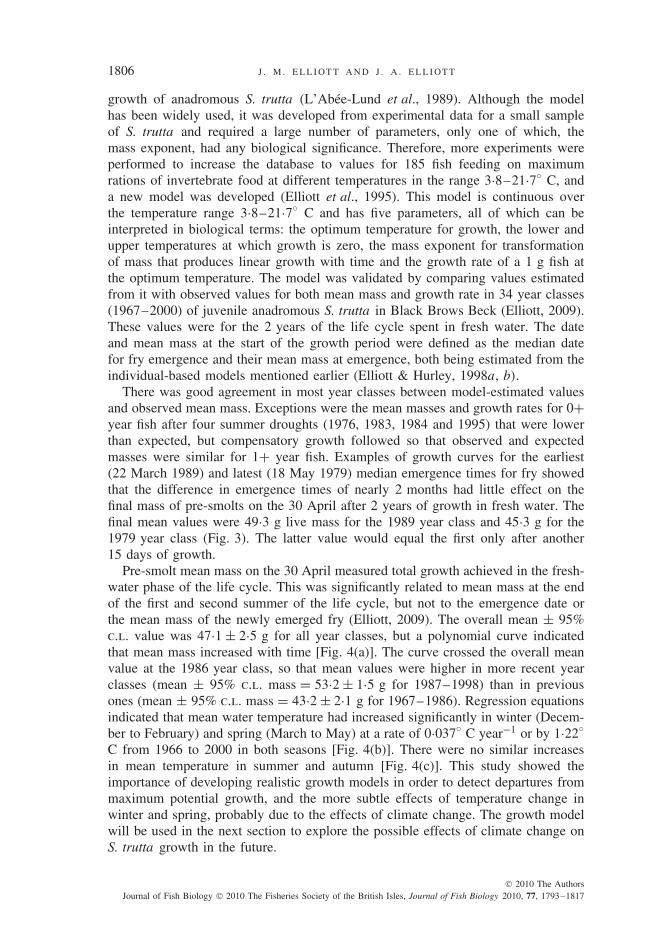
There was good agreement in most year classes between model-estimated valuesand observed mean mass. Exceptions were the mean masses and growth rates for 0+year fish after four summer droughts (1976, 1983, 1984 and 1995) that were lowerthan expected, but compensatory growth followed so that observed and expectedmasses were similar for 1+ year fish. Examples of growth curves for the earliest(22 March 1989) and latest (18 May 1979) median emergence times for fry showedthat the difference in emergence times of nearly 2 months had little effect on thefinal mass of pre-smolts on the 30 April after 2 years of growth in fresh water. Thefinal mean values were 49·3 g live mass for the 1989 year class and 45·3 g for the1979 year class (Fig. 3). The latter value would equal the first only after another15 days of growth.
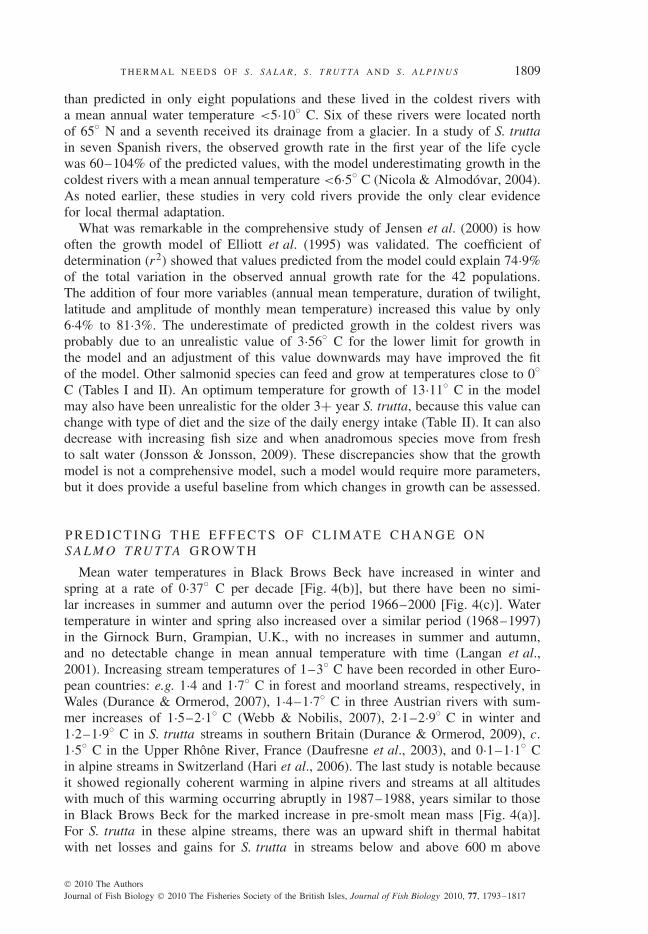
Pre-smolt mean mass on the 30 April measured total growth achieved in the fresh-water phase of the life cycle. This was significantly related to mean mass at the endof the first and second summer of the life cycle, but not to the emergence date orthe mean mass of the newly emerged fry (Elliott, 2009). The overall mean ± 95%c.l. value was 47·1 ± 2·5 g for all year classes, but a polynomial curve indicatedthat mean mass increased with time [Fig. 4(a)]. The curve crossed the overall meanvalue at the 1986 year class, so that mean values were higher in more recent yearclasses (mean ± 95% c.l. mass = 53·2 ± 1·5 g for 1987–1998) than in previousones (mean ± 95% c.l. mass = 43·2 ± 2·1 g for 1967–1986). Regression equationsindicated that mean water temperature had increased significantly in winter (Decem-ber to February) and spring (March to May) at a rate of 0·037◦ C year−1 or by 1·22◦
C from 1966 to 2000 in both seasons [Fig. 4(b)]. There were no similar increasesin mean temperature in summer and autumn [Fig. 4(c)]. This study showed theimportance of developing realistic growth models in order to detect departures frommaximum potential growth, and the more subtle effects of temperature change inwinter and spring, probably due to the effects of climate change. The growth modelwill be used in the next section to explore the possible effects of climate change onS. trutta growth in the future.
T H E R M A L N E E D S O F S . S A L A R , S . T RU T TA A N D S . A L P I N U S 1807
0·1
1
10
100
0 100 200 300 400 500 600 700 800
Days from 15 March
Liv
e m
ass
(g)
1979
1989
Fig. 3. Comparisons between temporal changes in Salmo trutta mean live mass estimated from the growthmodel ( ) and observed mean live mass for the 1979 ( ) and 1989 ( ) year classes. Time is given asdays from the 15 March. Mass is on log10 scale. The straight lines indicate a period of negligible growthin the first winter of the life cycle.
Lobon-Cervia & Rincon (1998) claimed that their study of S. trutta was the firstto assess the model of Elliott et al. (1995). These data for Spanish S. trutta werere-analysed in a very comprehensive study that included data from 15 British, fourDanish and 22 Norwegian populations of S. trutta (Jensen et al., 2000). Increases inmass were calculated over 10 day periods, using the growth model of Elliott et al.(1995). From a total of 365 comparisons, 261 of the observed growth rates wereeither similar to or below values predicted by the model and 104 were higher thanpredicted. The latter discrepancies were often for older (3+ years) fish with theirobserved growth rates up to 148% of the predicted values. Of the 42 populations, theratio between observed and predicted annual growth rates was not significantly dif-ferent from one in the single Spanish, four British, two Danish and eight Norwegianpopulations; was less than one in 11 British, two Danish and six Norwegian popu-lations and exceeded one in eight Norwegian populations. Therefore, growth rateswere as predicted in 15 populations and lower than predicted in 19 populations, i.e.the fish were growing below their maximum potential. Growth rates were higher
1808 J . M . E L L I OT T A N D J . A . E L L I OT T
0
10
20
30
40
50
60
70
1967
1969
1971
1973
1975
1977
1979
1981
1983
1985
1987
1989
1991
1993
1995
1997
Year class
Year
Est
imat
ed m
ean
mas
s (g
) Pre-smolt 30 April(a)
0
2
4
6
8
10
12
14
16
18
20
1967
1969
1971
1973
1975
1977
1979
1981
1983
1985
1987
1989
1991
1993
1995
1997
1999
Wat
er te
mpe
ratu
re (
° C)
(c)June to August
September to November
0
2
4
6
8
10
12
1967
1969
1971
1973
1975
1977
1979
1981
1983
1985
1987
1989
1991
1993
1995
1997
1999
Wat
er te
mpe
ratu
re (
° C
)
(b)
December to Februrary
March to May
Fig. 4. (a) Estimated mean mass of Salmo trutta pre-smolts on the 30 April for all year classes (1967 to1998); horizontal line indicates the arithmetic mean ±95% c.l. of 47·1 ± 2·5 g for all year classes ( ).The increase in mean mass (W , g) with time (x, years) was well described by the polynomial curvegiven by: W = 0·02x2 − 0·17x + 43·07 (r2 = 0·40, P < 0·001). (b) Mean water temperature for winter(December to February) and spring (March to May) in each year. The increase in temperature (T , ◦ C)with time (x, years) was well described by the regression: T = 0·04x + 4·15 (r2 = 0·13, P < 0·05) forwinter and T = 0·04x + 7·60 (r2 = 0·37, P < 0·001) for spring. (c) Mean water temperature for summer(June to August) and autumn (September to November) in each year. Neither regression was significantlydifferent from a horizontal line (r2 = 0·01 for summer, r2 = 0·04 for autumn, both P > 0·05).
T H E R M A L N E E D S O F S . S A L A R , S . T RU T TA A N D S . A L P I N U S 1809
than predicted in only eight populations and these lived in the coldest rivers witha mean annual water temperature <5·10◦ C. Six of these rivers were located northof 65◦ N and a seventh received its drainage from a glacier. In a study of S. truttain seven Spanish rivers, the observed growth rate in the first year of the life cyclewas 60–104% of the predicted values, with the model underestimating growth in thecoldest rivers with a mean annual temperature <6·5◦ C (Nicola & Almodovar, 2004).As noted earlier, these studies in very cold rivers provide the only clear evidencefor local thermal adaptation.
What was remarkable in the comprehensive study of Jensen et al. (2000) is howoften the growth model of Elliott et al. (1995) was validated. The coefficient ofdetermination (r2) showed that values predicted from the model could explain 74·9%of the total variation in the observed annual growth rate for the 42 populations.The addition of four more variables (annual mean temperature, duration of twilight,latitude and amplitude of monthly mean temperature) increased this value by only6·4% to 81·3%. The underestimate of predicted growth in the coldest rivers wasprobably due to an unrealistic value of 3·56◦ C for the lower limit for growth inthe model and an adjustment of this value downwards may have improved the fitof the model. Other salmonid species can feed and grow at temperatures close to 0◦
C (Tables I and II). An optimum temperature for growth of 13·11◦ C in the modelmay also have been unrealistic for the older 3+ year S. trutta, because this value canchange with type of diet and the size of the daily energy intake (Table II). It can alsodecrease with increasing fish size and when anadromous species move from freshto salt water (Jonsson & Jonsson, 2009). These discrepancies show that the growthmodel is not a comprehensive model, such a model would require more parameters,but it does provide a useful baseline from which changes in growth can be assessed.
P R E D I C T I N G T H E E F F E C T S O F C L I M AT E C H A N G E O NS A L M O T RU T TA G ROW T H
Mean water temperatures in Black Brows Beck have increased in winter andspring at a rate of 0·37◦ C per decade [Fig. 4(b)], but there have been no simi-lar increases in summer and autumn over the period 1966–2000 [Fig. 4(c)]. Watertemperature in winter and spring also increased over a similar period (1968–1997)in the Girnock Burn, Grampian, U.K., with no increases in summer and autumn,and no detectable change in mean annual temperature with time (Langan et al.,2001). Increasing stream temperatures of 1–3◦ C have been recorded in other Euro-pean countries: e.g. 1·4 and 1·7◦ C in forest and moorland streams, respectively, inWales (Durance & Ormerod, 2007), 1·4–1·7◦ C in three Austrian rivers with sum-mer increases of 1·5–2·1◦ C (Webb & Nobilis, 2007), 2·1–2·9◦ C in winter and1·2–1·9◦ C in S. trutta streams in southern Britain (Durance & Ormerod, 2009), c.
1·5◦ C in the Upper Rhone River, France (Daufresne et al., 2003), and 0·1–1·1◦ Cin alpine streams in Switzerland (Hari et al., 2006). The last study is notable becauseit showed regionally coherent warming in alpine rivers and streams at all altitudeswith much of this warming occurring abruptly in 1987–1988, years similar to thosein Black Brows Beck for the marked increase in pre-smolt mean mass [Fig. 4(a)].For S. trutta in these alpine streams, there was an upward shift in thermal habitatwith net losses and gains for S. trutta in streams below and above 600 m above
1810 J . M . E L L I OT T A N D J . A . E L L I OT T
mean sea level, respectively. Extensive catch data for S. trutta indicated that theseclimate-related population changes have already occurred in Switzerland.
These different values for increasing water temperature were taken into accountwhen using the growth model of Elliott et al. (1995) to predict possible futurechanges in S. trutta growth. In validating the model with data from Black BrowsBeck, it soon became obvious that growth was negligible during the first, but not thesecond, winter of the life cycle. The estimated mass on the 15 September before thefirst winter was close to the observed mean mass on the 15 April after the winterin each year class with the latter value being consistently 93% of the value on theprevious 15 September. Therefore, the estimated mean mass was adjusted to 93% ofthe value on the 15 September and thus agreed with the observed value. This was theonly adjustment required in the growth model, and there was good agreement in allsubsequent observed and estimated values in most year classes except those affectedby summer droughts (Elliott, 2009). The earliest date for fry emergence was 22 March1989 [Fig. 2(a)] after the warmest winter on record (1967–2000) with a mean watertemperature of 6·85◦ C [Fig. 4(b)]. Therefore, this year class was used as a baselinefor all subsequent model predictions. If winter and spring mean water temperaturescontinue to increase as shown by the regressions [Fig. 4(b)], then they would bothhave increased by 2·3◦ C from 1989 to 2050. Average water temperatures would be7·2◦ C in winter and 10·7◦ C in spring 2050, both higher than the maximum valuesattained from 1967 to 2000: 6·85◦ C in winter of 1989, 9·3◦ C in spring of 1990.
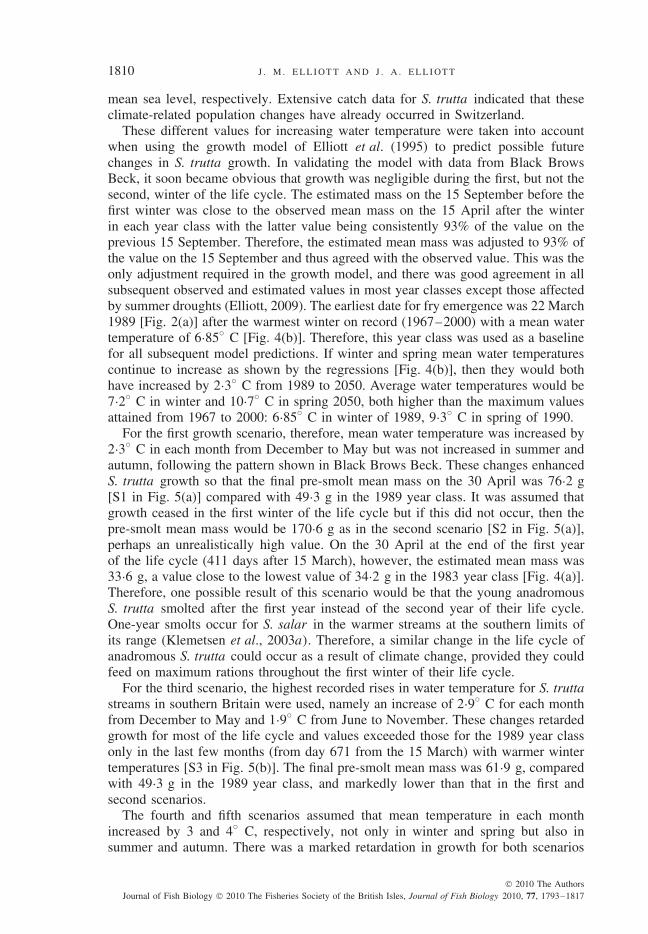
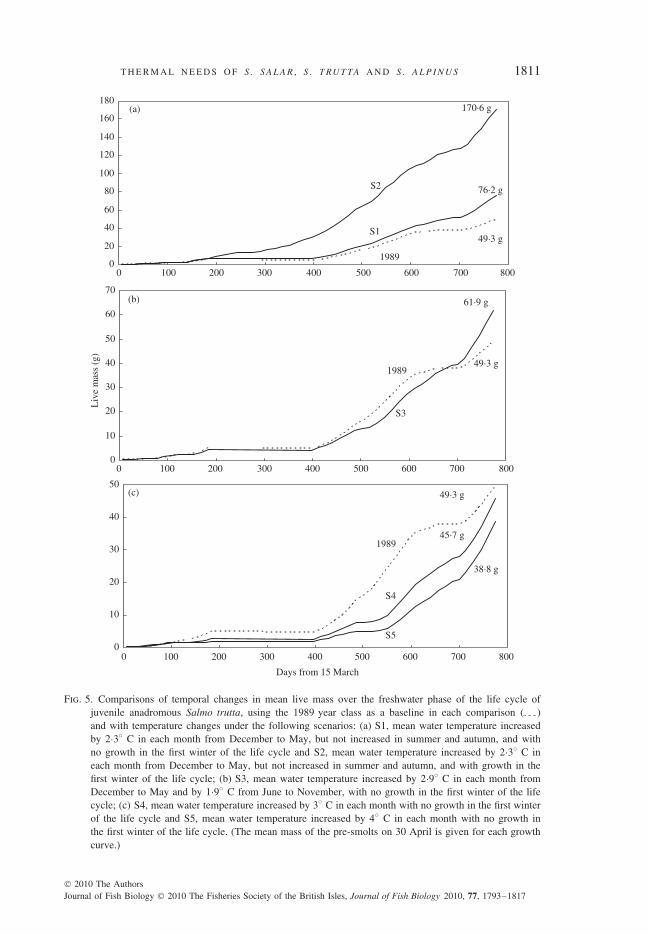
For the first growth scenario, therefore, mean water temperature was increased by2·3◦ C in each month from December to May but was not increased in summer andautumn, following the pattern shown in Black Brows Beck. These changes enhancedS. trutta growth so that the final pre-smolt mean mass on the 30 April was 76·2 g[S1 in Fig. 5(a)] compared with 49·3 g in the 1989 year class. It was assumed thatgrowth ceased in the first winter of the life cycle but if this did not occur, then thepre-smolt mean mass would be 170·6 g as in the second scenario [S2 in Fig. 5(a)],perhaps an unrealistically high value. On the 30 April at the end of the first yearof the life cycle (411 days after 15 March), however, the estimated mean mass was33·6 g, a value close to the lowest value of 34·2 g in the 1983 year class [Fig. 4(a)].Therefore, one possible result of this scenario would be that the young anadromousS. trutta smolted after the first year instead of the second year of their life cycle.One-year smolts occur for S. salar in the warmer streams at the southern limits ofits range (Klemetsen et al., 2003a). Therefore, a similar change in the life cycle ofanadromous S. trutta could occur as a result of climate change, provided they couldfeed on maximum rations throughout the first winter of their life cycle.
For the third scenario, the highest recorded rises in water temperature for S. truttastreams in southern Britain were used, namely an increase of 2·9◦ C for each monthfrom December to May and 1·9◦ C from June to November. These changes retardedgrowth for most of the life cycle and values exceeded those for the 1989 year classonly in the last few months (from day 671 from the 15 March) with warmer wintertemperatures [S3 in Fig. 5(b)]. The final pre-smolt mean mass was 61·9 g, comparedwith 49·3 g in the 1989 year class, and markedly lower than that in the first andsecond scenarios.
The fourth and fifth scenarios assumed that mean temperature in each monthincreased by 3 and 4◦ C, respectively, not only in winter and spring but also insummer and autumn. There was a marked retardation in growth for both scenarios
T H E R M A L N E E D S O F S . S A L A R , S . T RU T TA A N D S . A L P I N U S 1811
0
20
40
60
80
100
120
140
160
180
1989
S1
S2
49·3 g
76·2 g
170·6 g(a)
0
10
20
30
40
50
60
70
Days from 15 March
Liv
e m
ass
(g)
1989
S3
61·9 g(b)
49·3 g
0
10
20
30
40
50
0 100 200 300 400 500 600 700 800
0 100 200 300 400 500 600 700 800
0 100 200 300 400 500 600 700 800
(c)
1989
S4
S5
49·3 g
45·7 g
38·8 g
Fig. 5. Comparisons of temporal changes in mean live mass over the freshwater phase of the life cycle ofjuvenile anadromous Salmo trutta, using the 1989 year class as a baseline in each comparison ( )and with temperature changes under the following scenarios: (a) S1, mean water temperature increasedby 2·3◦ C in each month from December to May, but not increased in summer and autumn, and withno growth in the first winter of the life cycle and S2, mean water temperature increased by 2·3◦ C ineach month from December to May, but not increased in summer and autumn, and with growth in thefirst winter of the life cycle; (b) S3, mean water temperature increased by 2·9◦ C in each month fromDecember to May and by 1·9◦ C from June to November, with no growth in the first winter of the lifecycle; (c) S4, mean water temperature increased by 3◦ C in each month with no growth in the first winterof the life cycle and S5, mean water temperature increased by 4◦ C in each month with no growth inthe first winter of the life cycle. (The mean mass of the pre-smolts on 30 April is given for each growthcurve.)
1812 J . M . E L L I OT T A N D J . A . E L L I OT T
with final values for pre-smolt mean mass of 45·7 g [S4 in Fig. 5(c)] and 38·8 g(S5), both below the value of 49·3 g in the 1989 year class.
These comparisons have shown that a small increase in water temperature in winterand spring (<2·5◦ C) could have a positive effect on the growth of S. trutta. Theyalso showed that water temperatures would have to increase by c. 4◦ C in winter andspring, and 3◦ C in summer and autumn before they had a marked negative effecton growth.
GENERAL CONCLUSIONS
The following key conclusions are relevant to those responsible for the conserva-tion and management of valuable stocks of S. salar, S. trutta and S. alpinus, includinganadromous stocks of the three species: (1) water temperatures in rivers, streams,lakes and ponds have increased in recent years and will probably continue to increaseas a result of climate change. Although there is some evidence for thermal adaptationto very low temperatures in cold rivers (mean annual temperature <6·5◦ C), thereis no corresponding adaptation to increasing temperature, even in a hot geothermalriver. (2) When water temperatures exceed 22–28◦ C for S. salar, 22–25◦ C for S.trutta and 22–23◦ C for S. alpinus, the fishes will soon die unless they can move tocooler water. Deep pools with cooler water near the bottom serve as refugia in streamsand rivers and should be maintained or even created when scarce. Cooler inflowstreams are also refugia in hot weather and access to them should be ensured. Oxygenconcentrations in the deep-water refugia of lakes should be monitored and, if S. alpi-nus is present, management should ensure that they remain >2–3 mg l−1. (3) Thereis limited evidence to suggest that the preferred temperature for the fish is lower thanthe optimum temperature, but close to the temperature for maximum conversion effi-ciency. This hypothesis has to be tested further. (4) The egg stage is the life stagewith the lowest thermal tolerance and few eggs will survive if temperatures exceedc. 7–8◦ C for S. salar and S. trutta, and 5◦ C for S. alpinus. If winter stream temper-atures in southern Britain and Ireland continue to increase at their present rate, thenthey will soon exceed the lethal limit for egg development in S. salar and S. trutta.Eggs and alevins of S. alpinus are probably the most vulnerable to increasing temper-ature and efforts must be made to maintain this species that holds significant biodi-versity conservation value. (5) Long-term studies and the development of predictivemodels are essential for the sustainable management of all three species. A validatedgrowth model for S. trutta was used to predict growth under possible future temper-ature conditions. These showed that small increases (<2·5◦ C) in winter and springcould be beneficial for growth, provided there is an adequate supply of food. Theyalso showed that water temperatures would have to increase by c. 4◦ C in winter andspring, and 3◦ C in summer and autumn before they had a marked negative effect ongrowth.
Parts of the experimental study to develop the growth model for trout and the long-termstudy in Black Brows Beck were financed by the Freshwater Biological Association, NaturalEnvironment Research Council, Ministry of Agriculture, Fisheries and Food, Atlantic SalmonTrust, Environment Agency (north-west region) and the European Commission under theFAIR Programme (Contract no. CT95-0009). We also thank the guest editor and two refereesfor their perceptive comments, resulting in an improved text.
T H E R M A L N E E D S O F S . S A L A R , S . T RU T TA A N D S . A L P I N U S 1813
References
Baroudy, E. & Elliott, J. M. (1994a). The critical thermal limits for juvenile Arctic charrSalvelinus alpinus. Journal of Fish Biology 45, 1041–1053.
Baroudy, E. & Elliott, J. M. (1994b). Tolerance of parr of Arctic charr, Salvelinus alpinus,to reduced dissolved oxygen concentrations. Journal of Fish Biology 44, 736–738.
Beacham, T. D. & Withler, R. E. (1991). Genetic variation in mortality of chinook salmon,Oncorhynchus tshawytscha (Walbaum), challenged with high water temperatures. Aqua-culture and Fisheries Management 22, 125–133.
Brannas, E. & Wiklund, B. S. (1992). Low temperature growth potential of Arctic charr andrainbow trout. Nordic Journal of Freshwater Research 67, 77–81.
Bremset, G. (2000). Seasonal and diel changes in behaviour, microhabitat use and preferencesby young pool-dwelling Atlantic salmon, Salmo salar, and brown trout, Salmo trutta.Environmental Biology of Fishes 59, 163–179.
Brett, J. R. (1971). Energetic responses of salmon to temperature: a study of some thermalrelations in the physiology and freshwater ecology of sockeye salmon (Oncorhynchusnerka). American Zoologist 11, 99–113.
Brooker, M. P., Morris, D. L. & Hemsworth, R. J. (1977). Mass mortalities of adult salmon,Salmo salar, in the R. Wye 1976. Journal of Applied Ecology 14, 409–417.
Caissie, D. (2006). The thermal regime of rivers. Freshwater Biology 51, 1389–1406.Conover, D. O. & Schultz, E. T. (1995). Phenotypic similarity and the evolutionary signifi-
cance of countergradient variation. Trends in Ecology & Evolution 10, 248–252.Cowx, I. G., Young, W. O. & Hellawell, J. M. (1984). The influence of drought on the fish
and invertebrate populations of an upland stream in Wales. Freshwater Biology 14,165–177.
Cunjak, R. A., Caissie, D., El-Jabi, N., Hardie, P., Conlon, J. H., Pollock, T. L., Gibson, D. J.& Komadina-Douthwright, S. (1993). The Catamaran Brook (New Brunswick) habitatresearch project: biological, physical and chemical conditions (1990 –1992). CanadianTechnical Report of Fisheries and Aquatic Sciences 1914.
Daufresne, M., Roger, M. C., Capra, H. & Lamouroux, N. (2003). Long-term changes withinthe invertebrate and fish communities of the Upper Rhone River: effects of climaticfactors. Global Change Biology 10, 124–140.
Davidson, I. C. & Hazlewood, M. S. (2005). Effect of climate change on salmon fisheries.Science Report W2-047/SR. Bristol: Environment Agency.
Dempson, J. B., O’Connell, M. F. & Cochrane, N. M. (2001). Potential impact of climatewarming on recreational fishing opportunities for Atlantic salmon, Salmo salar L. inNewfoundland, Canada. Fisheries Management and Ecology 8, 69–82.
Du, S. J., Gong, Z., Fletcher, G. L., Shears, M. A. & Hew, C. L. (1992). Growth hormonegene transfer in Atlantic salmon: use of fish antifreeze/growth hormone chimeric geneconstruct. In Transgenic Fish (Hew, C. L. & Fletcher, G. L., eds), pp. 176–189. Sin-gapore: World Scientific Publishing Co.
Durance, I. & Ormerod, S. J. (2007). Climate change effects on upland stream macroinver-tebrates over a 25-year period. Global Change Biology 13, 942–957.
Durance, I. & Ormerod, S. J. (2009). Trends in water quality and discharge confound long-term warming effects on river macroinvertebrates. Freshwater Biology 54, 388–405.
Elliott, J. A. (1995). A comparison of thermal polygons for British freshwater teleosts. Fresh-water Forum 5, 178–184.
Elliott, J. M. (1975). The growth rate of brown trout (Salmo trutta L.) fed on maximumrations. Journal of Animal Ecology 44, 805–821.
Elliott, J. M. (1981). Some aspects of thermal stress on freshwater teleosts. In Stress and Fish(Pickering, A. D., ed.), pp. 209–245. London: Academic Press.
Elliott, J. M. (1991). Tolerance and resistance to thermal stress in juvenile Atlantic salmon,Salmo salar. Freshwater Biology 25, 61–70.
Elliott, J. M. (1994). Quantitative Ecology and the Brown Trout. Oxford: Oxford UniversityPress.
Elliott, J. M. (2000). Pools as refugia for brown trout during two summer droughts: troutresponses to thermal and oxygen stress. Journal of Fish Biology 56, 938–948.
1814 J . M . E L L I OT T A N D J . A . E L L I OT T
Elliott, J. M. (2009). Validation and implications of a growth model for brown trout, Salmotrutta, using long-term data from a small stream in Northwest England. FreshwaterBiology 54, 2263–2275.
Elliott, J. M. & Baroudy, E. (1995). The ecology of Arctic charr, Salvelinus alpinus, andbrown trout, Salmo trutta, in Windermere (northwest England). Nordic Journal ofFreshwater Research 71, 33–48.
Elliott, J. M. & Elliott, J. A. (1995). The effect of the rate of temperature increase on thecritical thermal maximum for parr of Atlantic salmon and brown trout. Journal of FishBiology 47, 917–919.
Elliott, J. M. & Hurley, M. A. (1997). A functional model for maximum growth of Atlanticsalmon parr, Salmo salar, from two populations in Northwest England. FunctionalEcology 11, 592–603.
Elliott, J. M. & Hurley, M. A. (1998a). An individual-based model for predicting the emer-gence period of sea-trout fry in a Lake District stream. Journal of Fish Biology 53,414–433.
Elliott, J. M. & Hurley, M. A. (1998b). Predicting fluctuations in the size of newly-emergedsea-trout fry in a Lake District stream. Journal of Fish Biology 53, 1120–1133.
Elliott, J. M. & Hurley, M. A. (1999). A new energetics model for brown trout, Salmo trutta.Freshwater Biology 42, 235–246.
Elliott, J. M. & Hurley, M. A. (2000a). Daily energy intake and growth of piscivorous browntrout, Salmo trutta. Freshwater Biology 44, 237–245.
Elliott, J. M. & Hurley, M. A. (2000b). Optimum energy intake and gross efficiency of energyconversion for brown trout, Salmo trutta, feeding on invertebrates or fish. FreshwaterBiology 44, 605–615.
Elliott, J. M. & Klemetsen, A. (2002). The upper critical thermal limits for alevins of Arcticcharr from a Norwegian lake north of the Arctic circle. Journal of Fish Biology 60,1338–1341.
Elliott, J. M., Hurley, M. A. & Fryer, R. J. (1995). A new, improved growth model for browntrout, Salmo trutta. Functional Ecology 9, 290–298.
Elliott, J. M., Fletcher, J. M., Elliott, J. A. Cubby, P. R. & Baroudy, E. (1996). Changes inthe population density of pelagic salmonids in relation to changes in lake enrichmentin Windermere (northwest England). Ecology of Freshwater Fish 5, 153–162.
Elliott, J. M., Hurley, M. A. & Elliott, J. A. (1997). Variable effects of droughts on the densityof a sea-trout Salmo trutta population over 30 years. Journal of Applied Ecology 34,1229–1238.
Elliott, J. M., Hurley, M. A. & Maberly, S. C. (2000). The emergence period of sea trout fryin a Lake District stream correlates with the North Atlantic Oscillation. Journal of FishBiology 56, 208–210.
Finstad, A. G., Naesje, T. F. & Forseth, T. (2004). Seasonal variation in the thermal perfor-mance of juvenile Atlantic salmon (Salmo salar). Freshwater Biology 49, 1459–1467.
Fletcher, G. L., Shears, M. A., King, M. J., Davies, P. L. & Hew, C. L. (1988). Evidence forantifreeze protein gene transfer in Atlantic salmon (Salmo salar). Canadian Journal ofFisheries and Aquatic Sciences 45, 352–357.
Fletcher, G. L., Davies, P. L. & Hew, C. L. (1992). Genetic engineering of freeze-resistantAtlantic salmon. In Transgenic Fish (Hew, C. L. & Fletcher, G. L., eds), pp. 190–208.Singapore: World Scientific Publishing Co.
Forseth, T. & Jonsson, B. (1994). The growth and food ration of piscivorous brown trout(Salmo trutta). Functional Ecology 8, 171–177.
Forseth, T., Hurley, M. A., Jensen, A. J. & Elliott, J. M. (2001). Functional models for growthand food consumption of Atlantic salmon parr, Salmo salar, from a Norwegian river.Freshwater Biology 46, 173–186.
Forseth, T., Larsson, S., Jensen, A. J., Jonsson, B., Naslund, I. & Berglund, I. (2009). Ther-mal growth performance of juvenile brown trout Salmo trutta: no support for thermaladaptation hypotheses. Journal of Fish Biology 74, 133–149.
Graham, C. T. & Harrod, C. (2009). Implications of climate change for the fishes of theBritish Isles. Journal of Fish Biology 74, 1143–1205.
Grande, M. & Andersen, S. (1991). Critical thermal maxima for young salmonids. Journalof Freshwater Ecology 5, 275–279.
T H E R M A L N E E D S O F S . S A L A R , S . T RU T TA A N D S . A L P I N U S 1815
Hari, R. E., Livingstone, D. M., Siber, R., Burkhardt-Holm, P. & Guttinger, H. (2006). Con-sequences of climatic change for water temperature and brown trout populations inAlpine rivers and streams. Global Change Biology 12, 10–26.
Humpesch, U. H. (1985). Inter- and intra-specific variation in hatching success and embry-onic development of five species of salmonids and Thymallus thymallus. Archiv furHydrobiologie 104, 129–144.
Hurrell, J. W. (1995). Decadal trends in the North Atlantic Oscillation: regional temperaturesand precipitation. Science 269, 676–679.
Hurrell, J. W. (1996). Influence of variations in extratropical wintertime teleconnections onNorthern Hemisphere temperatures. Geophysical Research Letters 23, 665–668.
Jensen, A. J., Forseth, T. & Johnsen, B. O. (2000). Latitudinal variation in growth of youngbrown trout Salmo trutta. Journal of Animal Ecology 69, 1010–1020.
Jobling, M. (1981). Temperature tolerance and the final preferendum – rapid methods for theassessment of optimum growth temperatures. Journal of Fish Biology 19, 439–455.
Jones, I. D., Winfield, I. J. & Carse, F. (2008). Assessment of long-term changes in habitatavailability for Arctic charr (Salvelinus alpinus) in a temperate lake using oxygenprofiles and hydroacoustic surveys. Freshwater Biology 53, 393–402.
Jonsson, B. & Jonsson, N. (2004). Factors affecting marine production of Atlantic salmon(Salmo salar). Canadian Journal of Fisheries and Aquatic Sciences 61, 2369–2383.
Jonsson, B. & Jonsson, N. (2009). A review of the likely effects of climate change onanadromous Atlantic salmon Salmo salar and brown trout Salmo trutta, with particularreference to water temperature and flow. Journal of Fish Biology 75, 2381–2447.
Jonsson, B., Forseth, T., Jensen, A. J. & Naesje, T. F. (2001). Thermal performance in juve-nile Atlantic salmon, Salmo salar L. Functional Ecology 15, 701–711.
Jonsson, N. & Jonsson, B. (2004). Size and age of maturity of Atlantic salmon correlate withthe North Atlantic Oscillation. Journal of Fish Biology 64, 241–247.
Jonsson, N., Jonsson, B. & Hansen, L. P. (2005). Does climate during embryonic develop-ment influence parr growth and age of seaward migration in Atlantic salmon (Salmosalar)? Canadian Journal of Fisheries and Aquatic Sciences 62, 2502–2508.
Kaya, C. M. (1977). Reproductive biology of rainbow and brown trout in a geothermallyheated stream: the Firehole River of Yellowstone National Park. Transactions of theAmerican Fisheries Society 106, 354–361.
Kaya, C. M. (1978). Thermal resistance of rainbow trout from a permanently heated stream,and of two hatchery strains. Progressive Fish-Culturist 40, 138–142.
Kaya, C. M., Kaeding, L. R. & Burkhalter, D. E. (1977). Use of a cold-water refuge by rain-bow and brown trout in a geothermally heated stream. Progressive Fish-Culturist 39,37–39.
Kilgour, D. M. & McCauley, R. W. (1986). Reconciling the two methods of measuring upperlethal temperatures in fishes. Environmental Biology of Fishes 17, 281–290.
Klemetsen, A., Amundsen, P.-A., Dempson, J. B., Jonsson, B., Jonsson, N., O’Connell, M. F.& Mortensen, E. (2003a). Atlantic salmon Salmo salar L., brown trout Salmo truttaL. and Arctic charr Salvelinus alpinus (L.): a review of aspects of their life histories.Ecology of Freshwater Fish 12, 1–59.
Klemetsen, A., Knudsen, R., Staldvik, F. J. & Amundsen, P.-A. (2003b). Habitat, diet andfood assimilation of Arctic charr under the winter ice in two subarctic lakes. Journalof Fish Biology 62, 1082–1098.
Konecki, J. T., Woody, C. A. & Quinn, T. P. (1995). Critical thermal maxima of coho salmon(Oncorhynchus kisutch) fry under field and laboratory acclimation regimes. CanadianJournal of Zoology 73, 993–996.
L’Abee-Lund, J. H., Jonsson, B., Jensen, A. J., Saettem, L. M., Heggberget, T. G., Johnsen,B. O. & Naesje, T. F. (1989). Latitudinal variation in life-history characteristics ofsea-run migrant brown trout Salmo trutta. Journal of Animal Ecology 58, 525–542.
Langan, S. J., Johnston, L., Donaghy, M. J., Youngson, A. F., Hay, D. W. & Soulsby, C.(2001). Variation in river water temperatures in an upland stream over a 30-year period.The Science of the Total Environment 265, 195–207.
Larsson, S. (2005). Thermal preference of Arctic charr, Salvelinus alpinus, and brown trout,Salmo trutta – implications for their niche segregation. Environmental Biology of Fishes73, 89–96.
1816 J . M . E L L I OT T A N D J . A . E L L I OT T
Larsson, S. & Berglund, I. (1998). Growth and food consumption of 0+ Arctic charr fedpelleted or natural food at six different temperatures. Journal of Fish Biology 52,230–242.
Larsson, S. & Berglund, I. (2005). The effect of temperature on the energetic growth efficiencyof Arctic charr (Salvelinus alpinus (L.)) from four Swedish populations. Journal ofThermal Biology 30, 29–36.
Larsson, S., Forseth, T., Berglund, I., Jensen, A. J., Naslund, I., Elliott, J. M. & Jonsson, B.(2005). Thermal adaptation of Arctic charr: experimental studies of growth in elevencharr populations from Sweden, Norway and Britain. Freshwater Biology 50, 353–368.
Lehtonen, H. (1998). Does global warming threat the existence of Arctic charr, Salvelinusalpinus (Salmonidae), in northern Finland. Italian Journal of Zoology 65 (Suppl.),471–474.
Levins, R. (1969). Thermal acclimation and heat resistance in Drosophila species. AmericanNaturalist 103, 483–499.
Levinton, J. S. (1983). The latitudinal compensation hypothesis: growth data and a model oflatitudinal growth differentiation based upon energy budgets. I. Interspecific compari-son of Ophryotrocha (Polychaeta: Dorvilleidea). Biological Bulletin 165, 686–698.
Lobon-Cervia, J. & Rincon, P. A. (1998). Field assessment of the influence of temperatureon growth rate in a brown trout population. Transactions of the American FisheriesSociety 127, 718–728.
Lund, S. G., Caissie, D., Cunjak, R. A., Vijayan, M. M. & Tufts, B. L. (2002). The effects ofenvironmental heat stress on heat-shock mRNA and protein expression in MiramichiAtlantic salmon (Salmo salar) parr. Canadian Journal of Fisheries and Aquatic Sci-ences 59, 1553–1562.
Lyytikainen, T., Koskela, J. & Rissanen, I. (1997). Thermal resistance and upper lethal tem-peratures of underyearling Lake Inari Arctic charr. Journal of Fish Biology 51,515–525.
Magnuson, J. J., Crowder, L. B. & Medvick, P. A. (1979). Temperature as an ecologicalresource. American Zoologist 19, 331–343.
Maitland, P. S., Winfield, I. J., McCarthy, I. D. & Igoe, F. (2007). The status of Arctic charrSalvelinus alpinus in Britain and Ireland. Ecology of Freshwater Fish 16, 6–19.
Matthews, K. R. & Berg, N. H. (1997). Rainbow trout responses to water temperature and dis-solved oxygen stress in two southern California stream pools. Journal of Fish Biology50, 50–67.
Minns, C. K., Randall, R. G., Chadwick, E. M. P., Moore, J. E. & Green, R. (1995). Poten-tial impact of climate change on the habitat and population dynamics of juvenileAtlantic salmon, Salmo salar L., in eastern Canada. In Climate Change and NorthernFish Populations (Beamish, R. J., ed.), pp. 699–708. Canadian Special Publication ofFisheries and Aquatic Sciences 121.
Murray, R.W. (1971). Temperature receptors. In Fish Physiology, Vol. 5 (Hoar, W. S. &Randall, D. J., eds), pp. 121–133. London: Academic Press.
Nicieza, A. G., Reiriz, L. & Brana, F. (1994a). Variation in digestive performance betweengeographically disjunct populations of Atlantic salmon: countergradient in passage timeand digestion rate. Oecologia 99, 243–251.
Nicieza, A. G., Reyes-Gavilan, F. G. & Brana, F. (1994b). Differentiation in juvenile growthand bimodality patterns between northern and southern populations of Atlantic salmon(Salmo salar L.). Canadian Journal of Zoology 72, 1603–1610.
Nicola, G. G. & Almodovar, A. (2004). Growth pattern of stream-dwelling brown trout undercontrasting thermal conditions. Transactions of the American Fisheries Society 133,66–78.
Ojanguren, A. F., Reyes-Gavilan, F. G. & Brana, F. (2001). Thermal sensitivity of growth,food intake and activity of juvenile brown trout. Journal of Thermal Biology 26,165–170.
Osborn, T. J. (2006). Recent variations in the winter North Atlantic Oscillation. Weather 61,353–355.
Ottersen, G., Planque, B., Belgrano, A., Post, E., Reid, P. C. & Stenseth, N. C. (2001). Eco-logical effects of the North Atlantic Oscillation. Oecologia 128, 1–14.
T H E R M A L N E E D S O F S . S A L A R , S . T RU T TA A N D S . A L P I N U S 1817
Peterson, R. H., Spinney, H. C. E. & Sreedharan, A. (1977). Development of Atlantic salmon(Salmo salar) eggs and alevins under varied temperature regimes. Journal of the Fish-eries Research Board of Canada 34, 31–43.
Power, M. & Power, G. (1994). Modelling the dynamics of smolt production in Atlanticsalmon. Transactions of the American Fisheries Society 123, 535–548.
Ricker, W. E. (1979). Growth rates and models. In Fish Physiology, Vol. 8 (Hoar, W. S.,Randall, D. J. & Brett, J. R., eds), pp. 677–743. New York, NY: Academic Press.
Siikavuopio, S. I., Knudsen, R., Winger, A. C. & Kristoffersen, R. (2009). Is the winter peri-od a severe bottleneck of anadromous riverine Arctic charr parr? Ecology of FreshwaterFish 18, 126–131.
Swift, D. R. (1964). The effect of temperature and oxygen on the growth rate of the Winder-mere char (Salvelinus alpinus willughbii ). Comparative Biochemistry and Physiology12, 179–183.
Thyrel, M., Berglund, I., Larsson, S. & Naslund, I. (1999). Upper thermal limits for feedingand growth of 0+ Arctic charr. Journal of Fish Biology 55, 199–210.
Webb, B. W. & Nobilis, F. (2007). Long-term changes in river temperature and the influenceof climatic and hydrological factors. Hydrological Sciences 52, 74–85.
Winfield, I. J., Fletcher, J. M. & James, J. B. (2008). The Arctic charr (Salvelinus alpinus)populations of Windermere, UK: population trends associated with eutrophication, cli-mate change and increased abundance of roach (Rutilus rutilus). Environmental Biologyof Fishes 83, 25–35.
Winfield, I. J., Hateley, J., Fletcher, J. M. & James, J. B., Bean, C. W. & Clabburn, P. (2010).Population trends of Arctic charr (Salvelinus alpinus) in the UK: assessing the evidencefor a widespread decline in response to climate change. Hydrobiologia 650, 55–65.doi: 10.1007/s10750-009-0078-1