Page 1
ANALYSIS OF MUD MOTOR STALLS AND ITS IMPACT ON PERFORMANCE IN HIGH
TEMPERATURE UNCONVENTIONAL RESERVOIRS
A Thesis
by
ZACHARY IRA HOPKINS
Submitted to the Office of Graduate and Professional Studies of
Texas A&M University
in partial fulfillment of the requirements for the degree of
MASTER OF SCIENCE
Chair of Committee, Samuel Noynaert
Committee Members, Matthew Kuttolomadom
Eduardo Gildin
Head of Department, Jeff Spath
August 2018
Major Subject: Petroleum Engineering
Copyright 2018 Zachary Ira Hopkins
brought to you by COREView metadata, citation and similar papers at core.ac.uk
provided by Texas A&M Repository
Page 2
ii
ABSTRACT
The objective of this study was to perform analysis in to the mechanisms of motor failure
in the curve lateral portion of an operators high temperature Eagleford shale wells. This was
achieved through multiple high frequency downhole sensors that collected drilling dynamics and
vibration data. The high frequency downhole sensors were able to provide evidence of 21 motor
stalls which began in the last 1,200 ft of the lateral section.
The motor stall discussed in this paper appeared to be caused by a sudden increase in
weight applied downhole, which caused the torque required to rotate the bit to exceed the torque
that was supplied to the bit. The stall was only released once the string shortened from the
continued top drive rotation which allowed the weight applied and subsequent indentation depth
of the bit to be reduced and allow the bit to rotate. Additionally the pressure required to stall the
motor was decreased as the motor experienced stalls and became damaged.
Surface measurements during the stall did not reflect the true conditions downhole due to
the nature of the 1 Hz recording capability. Surface measured differential pressures were
hundreds of psi below actual downhole differential pressure, and did not demonstrate the extent
of the damage that the motor was seeing.
Motor damage and fatigue was correlated through the use of MSEbit and pressure
normalized rate of penetration (ROP). These metrics were able to provide the approximate depth
of the onset of motor stalls and show the progression of performance loses throughout the lateral.
Motor stalls cannot be eliminated completely but design changes can be made to lessen
the frequency, and improve motor life. Design changes including bottom hole assembly (BHA)
Page 3
iii
design, motor configurations, as well as a real-time deration practice are presented in a workflow
to manage motor stalls.
Page 4
iv
ACKNOWLEDGEMENTS
I would like to thank my committee chair, Dr. Noynaert, and my committee members,
Prof. of Engineering Practice Fred Dupriest, and Dr. Kuttolamadom for all their input and
recommendations towards this research.
Thanks also goes to my family and friends for their continued encouragement throughout
my time at Texas A&M University.
Page 5
v
CONTRIBUTORS AND FUNDING SOURCES
This work was supported by a research committee consisting of Professor Sam F.
Noynaert (advisor), Professor Fred Dupriest of the Department of Petroleum Engineering,
Professor Eduardo Gildin of the Department of Petroleum Engineering, and Professor Matthew
Kuttolamadom of the Department of Manufacturing and Mechanical Engineering Technology.
The graphs discussed in Section 1.3 were performed by Samba et al and were published
in (2016) in a paper listed in the references section. The figure discussed in Section 1.1 was
published by Cresecent Directional Drilling in 2011 and edited by Weimar in a handbook listed
in the references section.
Graduate study was supported by a Graduate Assistant Research position funded by
Marathon Oil.
Page 6
vi
TABLE OF CONTENTS
Page
ABSTRACT .................................................................................................................................... ii
ACKNOWLEDGEMENTS ........................................................................................................... iv
CONTRIBUTORS AND FUNDING SOURCES ...........................................................................v
TABLE OF CONTENTS ............................................................................................................... vi
LIST OF FIGURES ...................................................................................................................... vii
1. INTRODUCTION .......................................................................................................................1
1.1 Problem Background .............................................................................................................1 1.2 Mud Motors ...........................................................................................................................3 1.3 Mud Motor Failure Mechanisms ...........................................................................................5 1.4 Mechanical Specific Energy ..................................................................................................9
2. FIELD TRIALS .........................................................................................................................13
2.1 Motor Stalls ..........................................................................................................................13 2.2 Surface Detection of Motor Stalls .......................................................................................21 2.3 Motor Fatigue ......................................................................................................................23
3. DESIGN CHANGES .................................................................................................................30
4. CONCLUSIONS........................................................................................................................36
REFERENCES ..............................................................................................................................38
Page 7
vii
LIST OF FIGURES
Page
Fig. 1 - Operator drilling activity 6/17 to 6/18................................................................................ 1
Fig. 2 – Typical BHA design and motor configuration including 2.12° bend 7/8 lobe and 9.4
stages ............................................................................................................................... 3
Fig. 3 – Mud motor assembly (reprinted from Weimar, 2011) ...................................................... 4
Fig. 4 – Upper stages of power section with little elastomer chunking .......................................... 6
Fig. 5 – Lower stages of power section with elastomer chunking .................................................. 7
Fig. 6 – Stress strain relationship of an elastomer demonstrating material nonlinearity during
loading and unloading with a closed hysteresis loop (reprinted from Samba et al,
2016) ................................................................................................................................ 8
Fig. 7 – The effect of flowrate on elastomer temperature demonstrating hysteresis heating and
run away heat effect (reprinted from Samba et al, 2016) ................................................ 9
Fig. 8 – WOB raised in 5,000 lbf steps (A) as differential pressure increases (B) and the
subsequent reduction in MSEbit and MSEsurface (C) as whirl is suppressed and
MSEbit remains constant indicating efficient drilling. ................................................. 11
Fig. 9 – String RPM reaching zero and remaining stationary....................................................... 14
Fig. 10 – Differential pressure reaches a value suitable to stall motor ......................................... 15
Fig. 11 – X accelerations hold constant during stall indicating the string nor the motor rotating 15
Fig. 12 – String torque peaks and remains constant as torque supplied through the motor and
string is not suitable to rotate the bit ............................................................................. 16
Fig. 13 – Sudden weight transfer to initiate stall and reduction in weight to release stall ........... 17
Fig. 14 – Differential pressure peaking to a value less than the previous stall ............................. 18
Fig. 15 – String RPM reaching zero in similar manner to first stall ............................................. 19
Fig. 16 - X accelerations again remain constant indication zero rotation of string and motor ..... 19
Fig. 17 – Torque reaches a peak that is less than the previous stall ............................................. 20
Fig. 18 – Reduction in downhole and surface stall pressure ......................................................... 21
Page 8
viii
Fig. 19 – WOB drops as differential pressure peaks at 1280 psi .................................................. 22
Fig. 20 – MSEbit response at the beginning of lateral showing baseline response ...................... 24
Fig. 21 – MSEbit response near the end of the lateral with higher baseline response.................. 24
Fig. 22 – Majority of MSEbit is less than 80,000 psi as expected ................................................ 26
Fig. 23 – MSEbit increases over the next 3 hours of drilling as motor is damaged ..................... 26
Fig. 24 – MSEbit continues increasing as motor damage accumulates ........................................ 27
Fig. 25 – Over 50% of drilling in the last 3 hours is above our baseline response in the lateral .. 27
Fig. 26 – The slope of pressure normalized ROP becomes is flat before the stalls and becomes
negative once the stalls begin ........................................................................................ 28
Fig. 27 – Suspected start of motor stalls occurring at 12,800 ft and increased in performance
when motor was replaced at 16,400 ft. .......................................................................... 29
Fig. 28 – Bit external temperature cools down during slide from 17,745 to 17,785 ft ................. 31
Fig. 29 – Accelerations remain constant before beginning of stalls (A) and slightly increase
after stalls begin (B) until quickly climbing towards the end of the lateral (C) ............ 32
Fig. 30 – Proposed workflow to mitigate motor stalls .................................................................. 35
Page 9
1
1. INTRODUCTION
1.1 Problem Background
The operator involved with this project has been seeing a significant number of mud
motor failures in the curve and lateral sections of their wells. Along with the increased number of
failures there has also been variability in performance of the motors across their acreage. The
formation of interest is the Eagleford shale, an unconventional reservoir in South Texas. The
wells drilled by the operator within the last year are located within the counties of Atascosa, Live
Oak, and Karne shown in Fig. 1. Many of the wells in the acreage are considered high
temperature ranging from 290°F to 330°F.
Fig. 1 - Operator drilling activity 6/17 to 6/18
The wells located in Fig. 1 total 78, and have experienced 22 motor failures with a rate of
close to 30%, often times experiencing failures in the same well. The bottomhole temperatures
regularly exceeded 300°F during failures but some wells did experience failures in sub 300°F
Page 10
2
environments. The operator has progressed to motors with a larger amount of stages which has
had little effect on the incidence of failure.
The high temperature encountered during drilling requires the fit of the motor to be
changed and the allowable differential pressure to be de-rated (Dyck, 2011). The fit of the motor
is a function of the rotor, elastomer, and stator diameter displayed in Eq. 1. The fit of the motor
has a drastic effect on the performance and life of a mud motor (Dyck, 2011). If the fit of the
motor is too loose the performance of the motor is reduced, because the rotor and elastomer will
not create discrete cavities and allow fluid to flow through. If the fit of the motor is too tight then
the contact pressure between the rotor and elastomer will be too high which will cause fatigue to
the elastomer. The increased temperature seen in the Eagleford wells causes the elastomer to
swell and tightens the fit. The motors are designed with a looser fit to account for the increased
temperature.
𝐹𝑖𝑡 = (𝑅𝑜𝑡𝑜𝑟 𝑀𝑎𝑗𝑜𝑟 𝐷𝑖𝑎𝑚𝑒𝑡𝑒𝑟 − 𝐿𝑜𝑏𝑒 𝐻𝑒𝑖𝑔ℎ𝑡) − 𝑆𝑡𝑎𝑡𝑜𝑟 𝑀𝑖𝑛𝑜𝑟 𝐷𝑖𝑎𝑚𝑒𝑡𝑒𝑟…………...…(1)
The BHA design for a majority of the operator’s wells involves an unstablized BHA with
a bent motor ranging in bends from 2° to 2.12°. A typical BHA configuration can be seen in Fig.
2. Motor configurations include power sections ranging from 6 to 11 stages, and stator rotor lobe
configurations of 5/6 and 7/8.
Page 11
3
Fig. 2 – Typical BHA design and motor configuration including 2.12° bend 7/8 lobe and 9.4
stages
1.2 Mud Motors
Mud motors are progressive cavity displacement pumps placed in the drill string which
provides additional power to the bit, and when built with a bent housing for the universal joint,
give the ability to directionally steer. They traditionally consist of a top sub connecting the motor
to the drill string, a power section containing a rotor inside an elastomer lined stator, and a
transmission section to convert the eccentric power of the motor to concentric power to the bit as
Page 12
4
seen in Fig. 3. The rotor of the power section will have one fewer lobe than the stator to enable
discrete amounts of fluid to be pumped and allow the rotor to rotate driving the bit.
Fig. 3 – Mud motor assembly (reprinted from Weimar, 2011)
To allow the bit to steer there is a bend in the housing of the motor, which enables
directional control when not rotating the string. When the string is rotated during normal drilling
operation a mass imbalance is created which creates an oscillating sine wave in the BHA
(Dupriest et al, 2009). This is a common cause of drilling inefficiency, known as whirl, which
creates violent collisions of the bit and BHA with the borehole wall. These oscillations induce
Page 13
5
premature tool fatigue and damage. In addition to the damage whirl provides it also increases the
temperature of tools and negatively affects the elastomer within the power section.
1.3 Mud Motor Failure Mechanisms
The two most common failure mechanisms of mud motors are in the power section and
the bearing assembly. Failures in the bearing assembly occur from high torque events. A bit that
is experiencing full stick will create large torque events when the bit comes to a complete stop,
and must torque up to break free as demonstrated by Craig et al (2010). This large torque event
will create stress inside the bearing assembly and cause premature failure.
Failures in the power section can occur through debonding of the elastomer from the
stator, or what is commonly called “chunking”. Elastomer debonding is a problem that involves
the incompatibility of the drilling fluid and the elastomer as noted by John (1997). While
common in some areas, elastomer debonding is not usually encountered in the wells this study
covers. The common problem seen and studied in this work is the chunking of the elastomer.
As fluid is pumped through the motor, pressure differences within the lobes of the stator
create rotation of the rotor. If the motor is operating efficiently, and the fit of the motor is
designed correctly, the cavities will be sealed from one another. If the differential pressure of the
motor is high enough the elastomer will deform and there will no longer be discrete cavities
within the motor. A large amount of fluid flowing across the elastomer will increase erosion of
the rubber, and also decrease volumetric efficiency as less fluid is rotating the rotor (Anyanwu,
2012. Samba et al, 2016). Increased differential pressure across the motor has other negative
effects other than erosion and a reduction in volumetric efficiency. As the rotor turns inside of
the stator, the differential pressure deforms the elastomer in a cyclic process. This cyclic loading
Page 14
6
of the elastomer creates stress induced cracks (Samba et al, 2016). These stress cracks can
propagate and may become large enough to fragment the elastomer leading to motor chunking. A
motor that has been chunked can be seen in Fig. 4 and Fig. 5. The elastomer will begin to fail
from the lower stages of the power section towards the top, as the lower stages perform more
work than the stages higher in the power section investigated by Denney et al (2012). From
previous wells investigated, all motors do have some form of elastomer chunking. The severity
of chunking will determine whether the motor can drill to total depth (TD) or not.
Fig. 4 – Upper stages of power section with little elastomer chunking
Page 15
7
Fig. 5 – Lower stages of power section with elastomer chunking
Hysteresis heating is also a concern of high differential pressure loading. The elastomer
located inside of the stator is a nonlinear material and follows a different path along the stress
strain curve during loading and unloading as shown by Samba et al (2016 ) in his Fig. 6. As the
rotor rotates each section of the elastomer is continuously loaded and unloaded and will see
hundreds of thousands of cycles for a typical length bit run. The closed loop of the stress strain
curve is known as a hysteresis loop, and the energy contained within the loop is converted to
heat. Hysteresis heating is the result of the thermal energy created during the cyclic loading
further evidenced by Beeh et al (2018). Therefore the higher the flowrate through the motor, and
in turn the higher the RPM, the higher the temperature that will be seen within the elastomer.
Page 16
8
Fig. 6 – Stress strain relationship of an elastomer demonstrating material nonlinearity
during loading and unloading with a closed hysteresis loop (reprinted from Samba et al,
2016)
In some instances, there is a processes of runaway heat caused by hysteresis heating seen
with high differential pressure and high motor rpms further investigated by Samba et al (2016)
and Beeh et al (2018). The differential pressure must be suitably high to create large strain
energy which is then converted to heat during cyclic loading. As stated earlier with an increase in
temperature the elastomer swells and the fit between the elastomer and rotor is tighter. This
tighter interference fit enables for a higher contact pressure, and in turn further increases strain
energy. This process continues and the temperature begins to run away and never stabilizes.
Samba et al, (2016) demonstrates this in his Fig. 7. Regardless of the flowrate, the temperature
within the elastomer will increase resulting from hysteresis heating and cause the elastomer to
continue swelling.
Page 17
9
Fig. 7 – The effect of flowrate on elastomer temperature demonstrating hysteresis heating
and run away heat effect (reprinted from Samba et al, 2016)
1.4 Mechanical Specific Energy
Mechanical Specific Energy or better known as MSE, is a measure of the energy used per
volume of rock drilled shown by Teale (1965). MSE is used to quantify drilling efficiency and
can be utilized through surveillance and forensics to determine areas of drilling inefficiency and
damage occurring downhole.
𝑀𝑆𝐸𝑠𝑢𝑟𝑓𝑎𝑐𝑒 (𝑝𝑠𝑖) =480∗𝑇𝑜𝑟𝑞𝑢𝑒∗𝑅𝑃𝑀
𝐷2∗𝑅𝑂𝑃+
4∗𝑊𝑂𝐵
𝜋∗𝐷2 …………………………………………………(2a)
𝑀𝑆𝐸𝑏𝑖𝑡 (𝑝𝑠𝑖) =480∗𝐵𝑖𝑡 𝑇𝑜𝑟𝑞𝑢𝑒∗𝐵𝑖𝑡 𝑅𝑃𝑀
𝐷2∗𝑅𝑂𝑃+
4∗𝑊𝑂𝐵
𝜋∗𝐷2 ……………………………………………..…(2b)
Page 18
10
Two forms of the MSE equation can be used which are MSEsurface and MSEbit shown in
Eq. 2a, and Eq. 2b. MSEsurface uses surface measured torque and RPM and does not accurately
reflect the energy actually being expended downhole for rock cutting. The torque and drag in the
system will increase significantly as the bit begins to drill the curve and into the lateral.
Therefore, all of the torque measured at the surface is not being used to cut the rock; some of it is
lost through drillstring-wellbore wall contact in the curve and lateral.
A more accurate measurement of the energy expended to break the rock is MSEbit. This
measure of MSE replaces the surface torque and RPM measurements with the theoretical
amounts generated by the motor at the current operating parameters. A mud motor’s performance
is defined by power curves generated by the manufacturer which have a rotation and torque
rating based on differential pressure and flowrate. With the flowrate and differential pressure
across the motor known, the equivalent downhole torque and additional RPM can be found that
is powering the bit. MSEbit is a much more accurate representation, and when plotted against
MSEsurface, MSEbit will be the lower of the two. When plotted against each other the two curves
should follow the same trends and be offset by the amount of inefficiencies in the system above
the motor.
During perfectly efficient drilling, MSEbit will equal the unconfined compressive strength
of the rock as shown by Teale (1965). This means that that all of the energy supplied to the bit is
being used to remove the rock. When used on a drilling rig, the value of MSEbit does not equal
the rock strength because of drilling inefficiencies or mud motor degradation. This is the reason
MSEbit is used in a relative sense instead of looking at the absolute numbers output by the MSE
equation. In general, if the bit is drilling efficiently then ROP should increase linearly as either
weight on bit (WOB) or rotation of the top drive in revolutions/min (RPM) are increased. As
Page 19
11
long as the response is linear, the MSE will remain the same. This is because there may be more
energy going into the system but there is a proportional response in ROP. If the MSE increases,
then the system is drilling less efficiently than before and some form of dysfunction is now
present in the system causing a nonlinear response in performance. If MSE decreases then the
system is becoming more efficient, likely resulting from the reduction or elimination of a
dysfunction that was present. Fig. 8 shows the MSE response during a WOB step test.
Fig. 8 – WOB raised in 5,000 lbf steps (A) as differential pressure increases (B) and the
subsequent reduction in MSEbit and MSEsurface (C) as whirl is suppressed and MSEbit
remains constant indicating efficient drilling.
During a step test WOB is increased in 5,000 lbf increments and the MSEbit response is
observed to find the WOB that has the most efficient drilling, through the blue curve on the
A B
C
Page 20
12
fourth track. When low WOB is applied the MSEbit response is high because the cutters of the bit
are not engaged fully and the bit is experiencing whirl (Dupriest et al, 2009). As the weight
continues to increase the MSE response stays flat. This is an indication of efficient drilling and
that increasing weight is not introducing any drilling inefficiency. The flat portion of the MSEbit
response can be used as a baseline to determine the most efficient drilling. The measure of
MSEbit enables it to be used to determine the presence of drilling inefficiency and also reflects on
the performance of the motor.
Page 21
13
2. FIELD TRIALS
2.1 Motor Stalls
The objective of this study was to find evidence of damaging events that impact the
performance and life of a mud motor and any measure that can be taken to reduce them. To
achieve this task a well was chosen to run high frequency drilling dynamic sensors in the curve
and lateral section of the well. One sensor was located 7 ft above the motor measuring drillstring
torque, drillstring pressure, drillstring RPM, WOB, and tri-axial accelerations. The second sensor
was placed within the bit and measured tri-axial accelerations. The well investigated did not have
a failure as determined by the operator, but did provide evidence of motor stalls and was found to
have lost a significant portion of elastomer as determined by the motor vendor. The high
frequency sensors were able to provide evidence of at least 21 motor stalls which predominantly
occurred in the last 1,200 ft of the lateral.
Motor stalls are the event that is primarily investigated in this paper and causes
significant damage to the power section of the mud motor. Theoretically, the torque relationship
of a mud motor is linear, and as differential pressure is applied across the motor torque is
produced that is supplied to the bit. Motor stalls occur when the torque required to rotate the bit
exceeds torque that is supplied to the bit. Explained earlier, as the differential pressure increases
the elastomer is deformed which enables the fluid to bypass the motor reducing volumetric
efficiency. Once a certain differential pressure across the motor is reached there will be zero
rotational output from the motor and it will effectively be stalled discussed by Anyanwu (2012).
Guidroz (2011) and Alattar (2017). These events are very damaging to the motor components
and occur many times during the drilling of a well.
Page 22
14
The sensor placed above the motor recorded high frequency measurements in a two
second burst window. Fig. 9, Fig. 10, Fig. 11, and Fig. 12 below are of a two second burst
window recorded at 04:10 a.m. at a depth of 13,415 ft roughly 2,000 ft in to the lateral containing
a motor stall.
Fig. 9 – String RPM reaching zero and remaining stationary
Page 23
15
Fig. 10 – Differential pressure reaches a value suitable to stall motor
Fig. 11 – X accelerations hold constant during stall indicating the string nor the motor
rotating
Page 24
16
Fig. 12 – String torque peaks and remains constant as torque supplied through the motor
and string is not suitable to rotate the bit
During a motor stall we expect to see the differential pressure reach a value suitable to
stall the motor and stop rotation of the bit. As the differential pressure is spiking we should see
the torque reach a peak and remain constant signifying the available torque the top drive and
motor are able to supply. We also expect to see the string stop rotating and remain stationary as
the motor is stalling and the bit is not rotating. Since the string is not rotating and the rotor of the
motor is not rotating we should also expect the accelerations above the motor to flatten
signifying a lack of vibration created from rotation.
The motor stalls observed were characterized by a halt in rotation of the string seen in
Fig. 9. The string RPM is experiencing speed oscillation as expected and is a common
occurrence seen while drilling (Dupriest et al, 2009). The speed oscillations stop and the string
RPM approaches zero and comes to a complete stop. The differential pressure in Fig. 10 above
Page 25
17
the motor is experiencing the same oscillations that the string RPM is experiencing, and then
quickly climbs as the bit comes to a stop. It then reaches a peak of 1,600 psi which is well above
the stall pressure of 1,100 psi as reported by the motor manufacturer. The torque in Fig. 12 also
peaks to 16,000 ft-lbf and remains flat. The X accelerations seen in Fig. 11 show the string
vibrating before the stall and once the stall occurs the accelerations stop and remain constant.
The apparent cause of this stall can be seen as a sudden increase in weight that was applied due
to weight transfer issues within the system shown in Fig. 13.
Fig. 13 – Sudden weight transfer to initiate stall and reduction in weight to release stall
The sensor readings for WOB are negative which was caused by an issue with the sensor,
but the relative changes in WOB are correct. Beginning at 22 seconds a sudden increase in
weight is applied which causes the motor stall. During the stall the top drive is still rotating the
string and in turn is shortening it. The string has to shorten enough such that the torque required
to rotate the bit reaches the value of torque supplied to the bit.
Page 26
18
As the motor begins becoming damaged and losing elastomer we should expect the
differential pressure required to stall to decrease, and stalls to become more frequent. As shown
in Fig. 14 the differential pressure during a stall 3 hours after the stall presented above has a
lower differential pressure.
Fig. 14 – Differential pressure peaking to a value less than the previous stall
Page 27
19
Fig. 15 – String RPM reaching zero in similar manner to first stall
Fig. 16 - X accelerations again remain constant indication zero rotation of string and motor
Page 28
20
Fig. 17 – Torque reaches a peak that is less than the previous stall
The motor stall displayed in Fig. 14, Fig. 15, Fig. 16, and Fig. 17 follows a similar
process and shape to the previous stall. The only distinguishing feature in this stall is that the
differential pressure required to stall and subsequent available torque is less. This is the cause of
the frequency of motor stalls towards the end of lateral. Temperature continues to increase
during drilling and as elastomer is lost the requirements to induce a stall are reduced. Fig. 18
shows the average downhole stall pressure and surface pressure as well as the number of stalls
during the last 8 hours of drilling.
Page 29
21
Fig. 18 – Reduction in downhole and surface stall pressure
The first four hours experienced 28% of the observed stalls and had an average downhole
stall pressure of 1,546 psi. The latter four hours contained 72% of the observed stalls and the
average stall pressure dropped to 1,419 psi. The 127 psi drop in average stall pressure is due to
the damage the motor is incurring and the reduction of elastomer as discussed above.
2.2 Surface Detection of Motor Stalls
The difficulty with micro stalls of less than one second is being able to identify them at
the surface because of the 1 Hz recording rate. One minute of WOB and differential pressure
surface measurements recorded during the stall referenced in Figs. 9, 10, 11, and 12 is shown
below in Fig. 19.
0
1
2
3
4
5
6
7
8
9
0
200
400
600
800
1000
1200
1400
1600
19 20 21 22 23 24 25 26
Nu
mb
er o
f St
alls
Stal
l Pre
ssu
re,
(psi
)
Motor Rotating Hours, (hour)
Downhole Stall Pressure Surface Stall Pressure Number of Stalls
Page 30
22
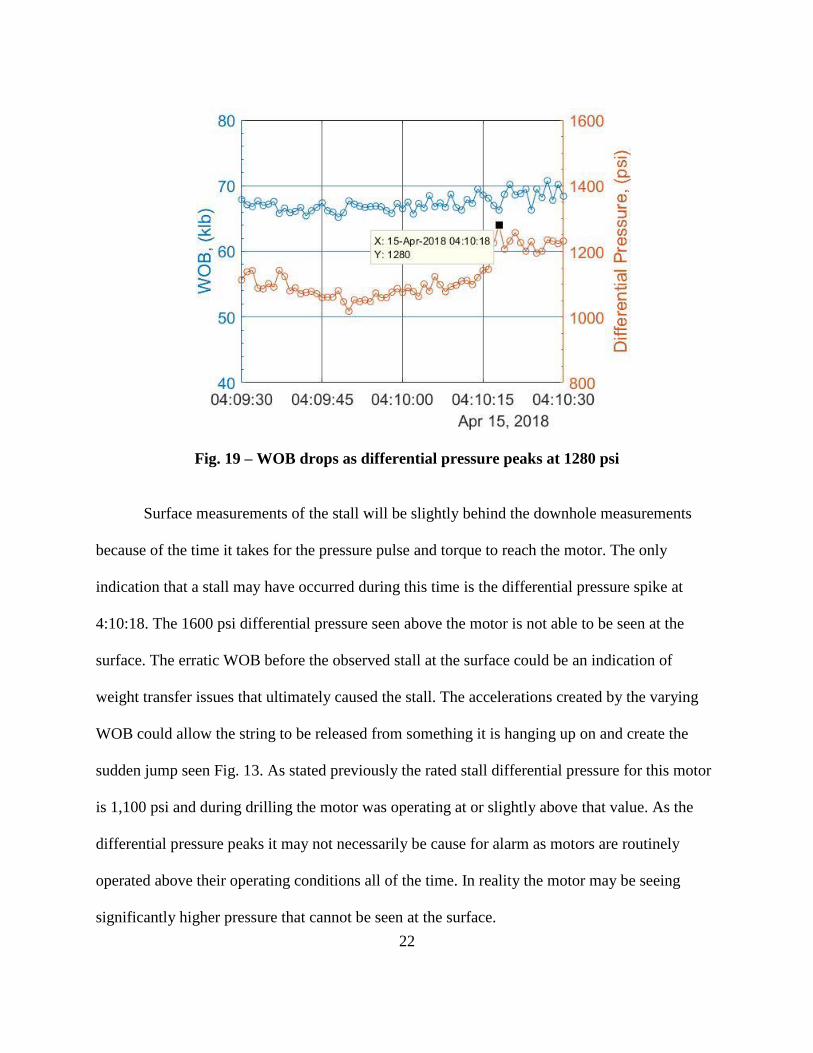
Fig. 19 – WOB drops as differential pressure peaks at 1280 psi
Surface measurements of the stall will be slightly behind the downhole measurements
because of the time it takes for the pressure pulse and torque to reach the motor. The only
indication that a stall may have occurred during this time is the differential pressure spike at
4:10:18. The 1600 psi differential pressure seen above the motor is not able to be seen at the
surface. The erratic WOB before the observed stall at the surface could be an indication of
weight transfer issues that ultimately caused the stall. The accelerations created by the varying
WOB could allow the string to be released from something it is hanging up on and create the
sudden jump seen Fig. 13. As stated previously the rated stall differential pressure for this motor
is 1,100 psi and during drilling the motor was operating at or slightly above that value. As the
differential pressure peaks it may not necessarily be cause for alarm as motors are routinely
operated above their operating conditions all of the time. In reality the motor may be seeing
significantly higher pressure that cannot be seen at the surface.
Page 31
23
2.3 Motor Fatigue
With the difficulty of detecting motor stalls at the surface is there another measure we
can use to quantify motor damage? Determining damage of a mud motor is a difficult task and is
only determined when a drop in ROP is noticed along with rubber coming across the shale
shakers. MSEbit has already been demonstrated to quantify drilling efficiency, which also
encompasses the performance of the motor. If the motor begins to lose elastomer and in turn
loses performance, we should be able to see this reflected in the the MSEbit response, if the
formation has not changed and the bit is undamaged. An increase in MSEbit response could result
from damage to the motor or damage to the bit. This creates a difficult situation in trying to
determine whether damage to the motor or to the bit is driving increases in MSEbit. If drilling
inefficiencies are managed and whirl is suppressed as much as possible then it can be safe to
assume that the majority of the increase to MSEbit can be contributed to the degrading motor
performance. In this instance, the well studied did not have significant bit damage that would
throw this analysis off. If the motor has been damaged, for a given WOB and theoretical bit
torque we will be drilling slower than previously which would create a higher response in
MSEbit.
A simple way to perform this analysis is to observe the MSEbit response over a stand
while drilling the lateral. The MSEbit response will have a baseline value for that stand which you
can compare with stands deeper in the lateral, if drilling inefficiencies have not changed and the
formation is the same. One stand of drilling at a depth of 11,258 ft at the beginning of the lateral
is displayed in Fig. 20.
Page 32
24
Fig. 20 – MSEbit response at the beginning of lateral showing baseline response
We can see that as we drill with 70,000 lbf WOB we are seeing an MSEbit response
ranging from 60,000 to 80,000 psi. As long as we are actively managing drilling inefficiencies
and trying to keep the MSEbit low we can use this value as the benchmark of motor performance
using our current drilling parameters. We can make this same plot of a stand to see our baseline
MSEbit response further along the lateral. Fig. 21 is from a depth of 14,180 ft, 2,922 ft from the
previous stand.
Fig. 21 – MSEbit response near the end of the lateral with higher baseline response
In this stand we are drilling with a similar WOB as with the previous stand ranging
between 60,000 and 70,000 lbf WOB. We should expect to see the same baseline response as in
Page 33
25
Fig. 20 if the motor has not been damaged and barring any changes in rock strength and drilling
inefficiencies present. In this instance we see a much higher MSEbit response, ranging from
90,000 psi to 140,000 psi. Step tests performed further in the lateral show that the overall
inefficiency in the system has not changed much and that these plots demonstrate that the motor
has been damaged and is not producing the same torque and rotation that it once was. The MSEbit
response naturally increases in the lateral due to weight transfer issues, but because the well has
a shorter than average lateral length this issue should not create the significant change as shown
in Fig. 20 and Fig. 21.
Another technique involves grouping the lateral in to sections and viewing the MSEbit
response over a discrete time period through histograms. The length of the lateral was grouped in
to 3 hour sections and plotted using histograms with bins ranging from 40,000 to 100,000 psi. If
the whole lateral was drilled with an undamaged motor and no changes in rock strength and
drilling inefficiencies, we would expect to see the majority of measurements falling in to the
40,000 – 60,000 psi and 60,000-80,000 psi bin. The histograms containing 3 hours of drilling
from the beginning of the lateral to TD are presented below in Fig. 22, Fig. 23, Fig. 24, and Fig.
25.
Page 34
26
Fig. 22 – Majority of MSEbit is less than 80,000 psi as expected
Fig. 23 – MSEbit increases over the next 3 hours of drilling as motor is damaged
0.00%
25.00%
50.00%
75.00%
100.00%
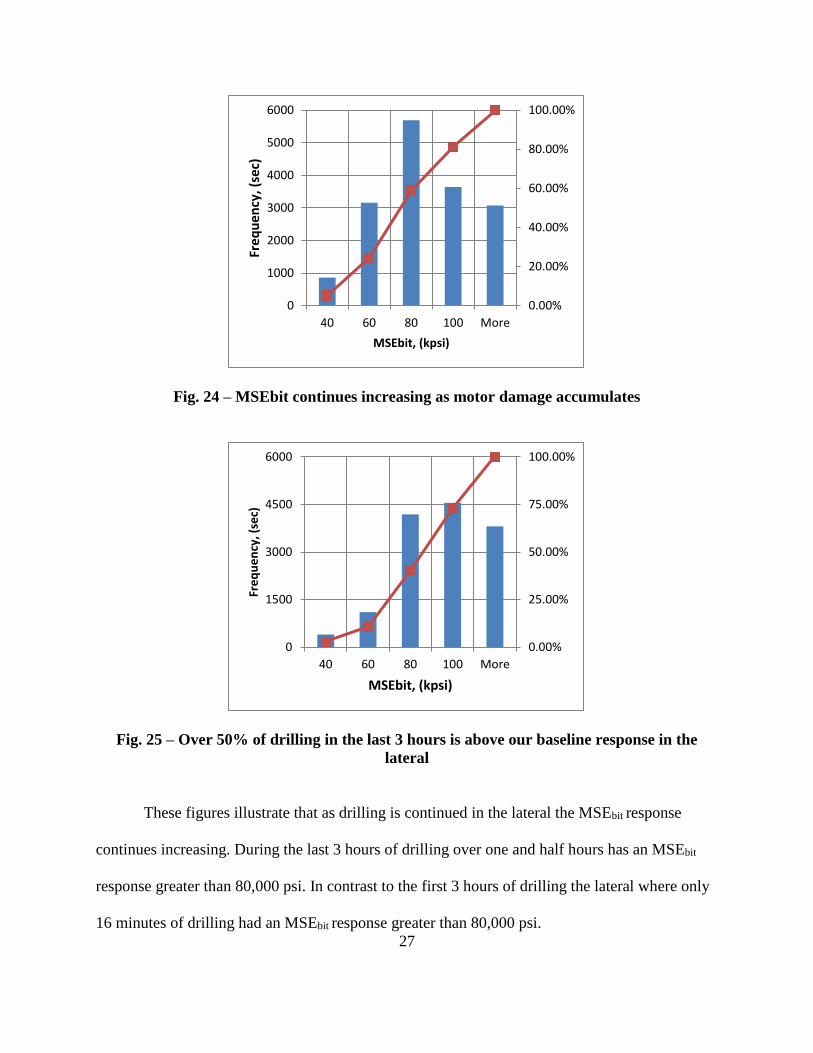
0
1500
3000
4500
6000
40 60 80 100 More
Fre
qu
en
cy, (
sec)
MSEbit, (kpsi)
0.00%
25.00%
50.00%
75.00%
100.00%
0
1500
3000
4500
6000
7500
9000
40 60 80 100 More
Fre
qu
en
cy, (
sec)
MSEbit, (kpsi)
Page 35
27
Fig. 24 – MSEbit continues increasing as motor damage accumulates
Fig. 25 – Over 50% of drilling in the last 3 hours is above our baseline response in the
lateral
These figures illustrate that as drilling is continued in the lateral the MSEbit response
continues increasing. During the last 3 hours of drilling over one and half hours has an MSEbit
response greater than 80,000 psi. In contrast to the first 3 hours of drilling the lateral where only
16 minutes of drilling had an MSEbit response greater than 80,000 psi.
0.00%
20.00%
40.00%
60.00%
80.00%
100.00%
0
1000
2000
3000
4000
5000
6000
40 60 80 100 More
Fre
qu
en
cy, (
sec)
MSEbit, (kpsi)
0.00%
25.00%
50.00%
75.00%
100.00%
0
1500
3000
4500
6000
40 60 80 100 More
Fre
qu
en
cy, (
sec)
MSEbit, (kpsi)
Page 36
28
ROP can also be normalized by differential pressure and plotted alongside MSEbit in 100
ft averages to determine the approximate depth that the stalls begin to occur. Fig. 26 shows the
point at which the stalls began to occur and the reduction in ROP per 100 psi differential
pressure applied to the motor.
Fig. 26 – The slope of pressure normalized ROP becomes is flat before the stalls and
becomes negative once the stalls begin
At the beginning of the lateral section the normalized ROP is fairly constant and does not
appear to trend down. At approximately 13,000 ft measured depth, the stalls begin and the slope
of pressure normalized ROP begins to become negative indicating damage.
This same motor design was run on another well and the motor became damaged to the
point that it had to be replaced. Fig. 27 is a plot of pressure normalized ROP as well as MSEbit in
100 foot averages.
0
20
40
60
80
100
120
0
20
40
60
80
100
120
11200 11700 12200 12700 13200 13700 14200 RO
P/1
00
psi
of
Dif
fere
nti
al P
ress
ure
, (f
t/h
r/1
00
psi
)
MSE
bit
, (kp
si)
Measured Depth, (ft)
MSEbit Normalized ROP
Beginning of Motor Stalls
Page 37
29
Fig. 27 – Suspected start of motor stalls occurring at 12,800 ft and increased in
performance when motor was replaced at 16,400 ft.
Following the same logic as on the previous well, once motor stalls begin to occur,
pressure normalized ROP should begin to drop. This places the suspected beginning of stalls
occurring at 12,800 ft, at which point performance degrades until the motor had to be replaced at
16,300 ft. Once the motor was replaced the pressure normalized ROP and MSEbit values
improved significantly because the motor is undamaged, but then quickly begin to degrade
within 300 feet indicating that motor stalls are once again occurring. Using this approach to find
the approximate depth that motor stalls begin occurring, allows operating parameters to be
reduced to reduce the frequency of stalls and prolong life of the motor.
0
20
40
60
80
100
120
0
20
40
60
80
100
120
12000 13000 14000 15000 16000 17000 18000 RO
P/1
00
psi
of
Dif
fere
nti
al P
ress
ure
(f
t/h
r/1
00
psi
)
MSE
bit
, (kp
si)
Measured Depth, (ft)
MSEbit Normalized ROP
New Motor
Suspected
Beginning of
Motor Stalls
Page 38
30
3. DESIGN CHANGES
As discussed previously temperature is harmful to the elastomer of the motor causing it to
swell and increasing the contact pressure between itself and the rotor. Increased temperature
requires the fit of the motor to be changed and subsequently derated to a lower operating
differential pressure. Currently there is not a practice implemented to continuously derate the
motor operating parameters during drilling as the temperature of the motor heats up and damage
occurs. We know that motor stalls cannot be eliminated completely but what we can do is reduce
the temperature of the motor, and subsequently increase the pressure required to stall the motor.
A previous well was investigated with high frequency sensors located in the bit which showed
the extent of the temperature differences during rotating and sliding. As discussed earlier, when
rotating a bent motor a mass imbalance is present that creates vibration within the BHA. The
violent oscillations of the string create heat which raises the temperature. During sliding the
string is not being rotated and the bit is only being driven by the motor. This eliminates the whirl
that was present during rotation and will enable the bit and other tools to cool down as shown in
Fig. 28.
Page 39
31
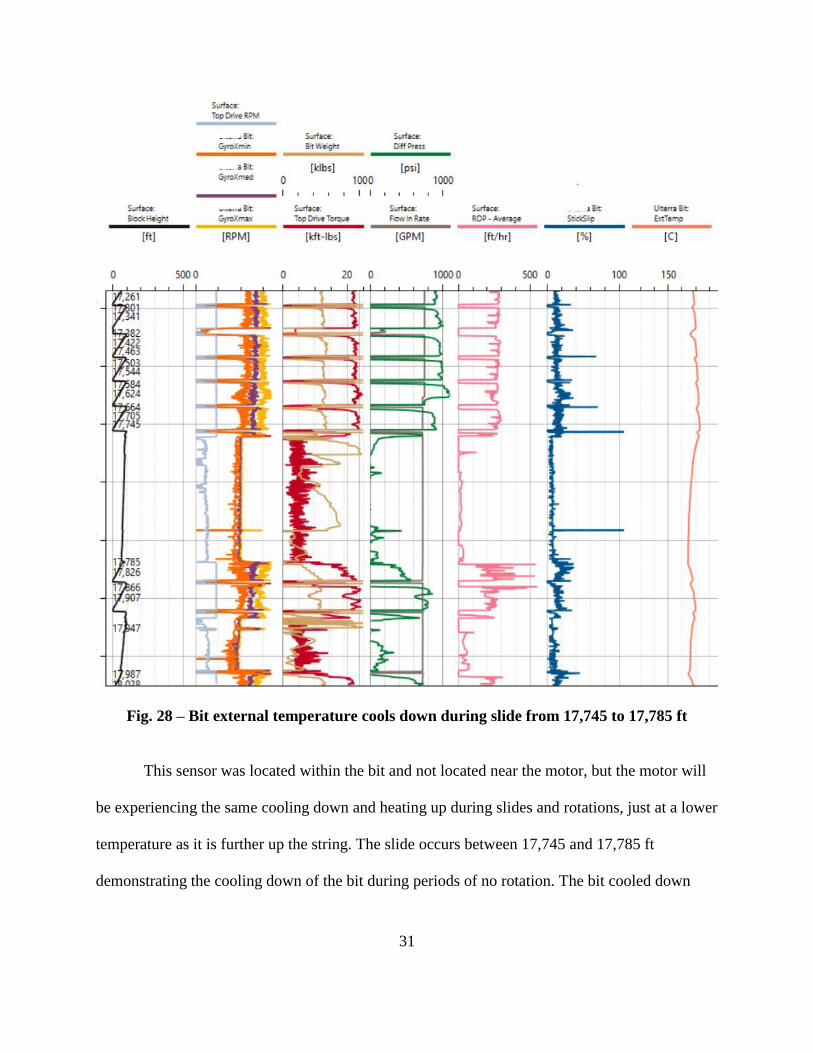
Fig. 28 – Bit external temperature cools down during slide from 17,745 to 17,785 ft
This sensor was located within the bit and not located near the motor, but the motor will
be experiencing the same cooling down and heating up during slides and rotations, just at a lower
temperature as it is further up the string. The slide occurs between 17,745 and 17,785 ft
demonstrating the cooling down of the bit during periods of no rotation. The bit cooled down
Page 40
32
roughly 14°F which may not seem like much, but when temperature is 300°F plus, a small
reduction in temperature can have a big effect on motor damage and stalls.
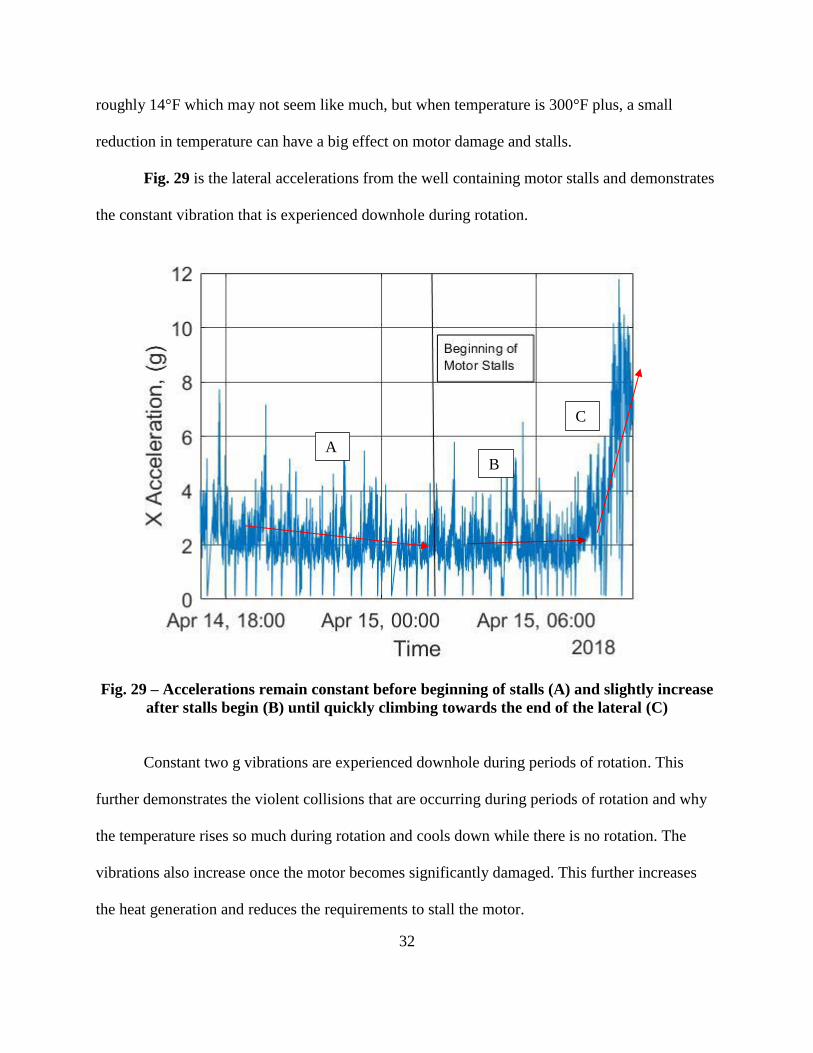
Fig. 29 is the lateral accelerations from the well containing motor stalls and demonstrates
the constant vibration that is experienced downhole during rotation.
Fig. 29 – Accelerations remain constant before beginning of stalls (A) and slightly increase
after stalls begin (B) until quickly climbing towards the end of the lateral (C)
Constant two g vibrations are experienced downhole during periods of rotation. This
further demonstrates the violent collisions that are occurring during periods of rotation and why
the temperature rises so much during rotation and cools down while there is no rotation. The
vibrations also increase once the motor becomes significantly damaged. This further increases
the heat generation and reduces the requirements to stall the motor.
A B
C
Page 41
33
Knowing the temperature differences seen downhole during sliding versus rotating means
ideally we would want to drill the entire lateral sliding to keep temperature as low as possible
and prolong the life of tools, but this isn’t feasible. What can be done is trying to lessen the
magnitude of the vibrations that are seen during rotation. Using a stabilized assembly the
oscillating sine wave can be constrained which lessens the impact of vibrations, and reduces te
temperature the motor experiences. Work performed by Bailey (2010), Craig (2010) and Bybee
(2008) demonstrates that a stabilized BHA can greatly reduce the magnitude of the vibrations
experienced downhole.
Another simple approach to combat the effect of the temperature generated through
downhole vibrations while rotating is lowering the bend angle of the motor. A lower bend angle
motor will oscillate at a lower magnitude and will reduce the impact forces the motor
experiences and the heat generated. Bybee et al (2010) demonstrated this by showing the
increased running time of motors with lower bend angles. Oftentimes motor designs will be
selected which have higher than needed bend angles because they are drilled slick without any
stabilizers, which produces a directionally unpredictable assembly. A stabilized BHA will drill
predictably and will not need as high of a bend angle in the motor (Dupriest, 2009).
Lastly to combat motor stalls depth of cut control (DOCC) can be implemented behind
the cutters of the bit. DOCC reduces the aggressiveness of the bit at a certain indentation depth
of the cutters of the bit (Detournay et al, 1992). Once a certain weight is applied to the cutters of
the bit, the DOCC behind the cutters will indent in to the surface of the rock. Once the DOCC is
indented the contact area between the bit and rock is increased, but only the cutters themselves
are performing the work of breaking the rock. This allows the bit to perform as designed until the
DOCC are engaged, at which point it becomes less aggressive. This would solve the issues of a
Page 42
34
sudden increase in weight that stalls the motor. This same increase in weight would not need as
much torque to rotate with DOCC implemented.
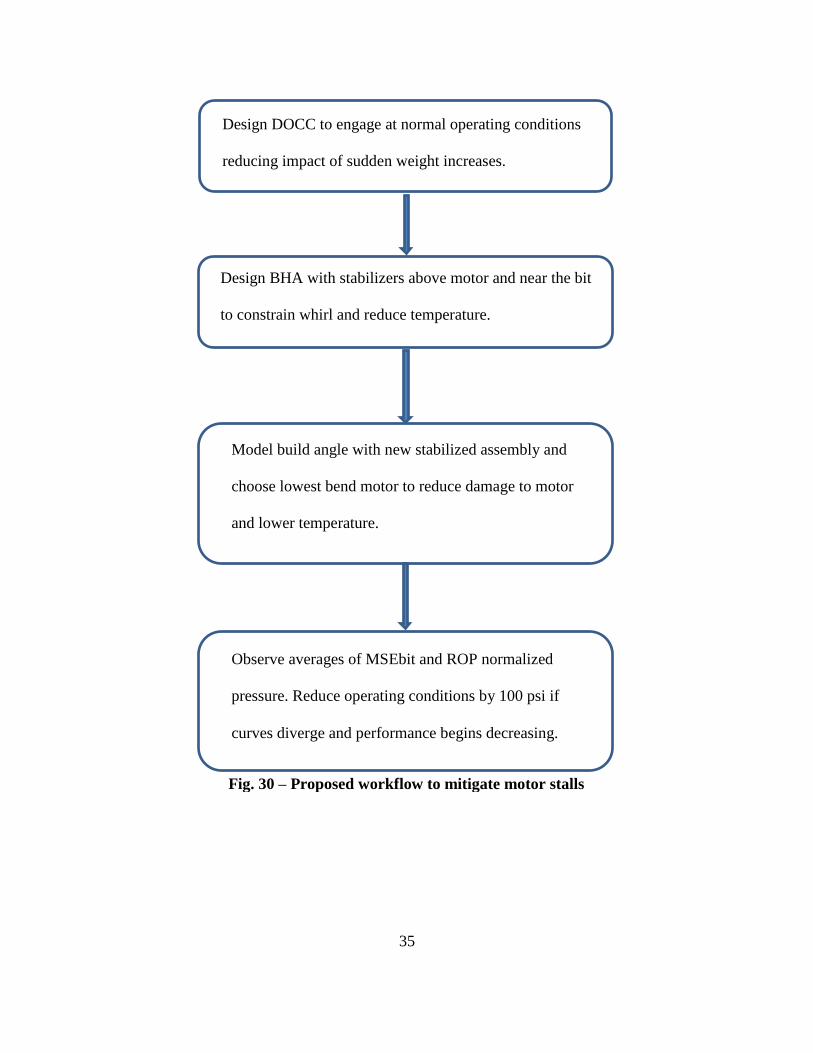
Finally a real-time practice that can be used is the deration of the motors operating
conditions when a decline in motor performance is observed. Using running 100 ft averages of
MSEbit and pressure normalized ROP shown in Fig. 26 and, Fig. 27 the depth of significant
motor damage can be seen. Once the slope of pressure normalized ROP begins trending negative
and the slope of MSEbit begins trending positive, the operating parameters of the motor should be
reduced to slow the damage of the motor. The suggested workflow involving all of the proposed
design changes and real-time practices is presented in Fig. 30.
Page 43
35
Design DOCC to engage at normal operating conditions
reducing impact of sudden weight increases.
Design BHA with stabilizers above motor and near the bit
to constrain whirl and reduce temperature.
Model build angle with new stabilized assembly and
choose lowest bend motor to reduce damage to motor
and lower temperature.
Observe averages of MSEbit and ROP normalized
pressure. Reduce operating conditions by 100 psi if
curves diverge and performance begins decreasing.
Fig. 30 – Proposed workflow to mitigate motor stalls
Page 44
36
4. CONCLUSIONS
High frequency downhole sensors were run in an attempt to find evidence of damaging
events that impact the performance of a mud motor. The operator themselves has chosen to move
towards higher stage motors to combat the issue but has not seen significant success. Adding
additional stages to motor is a band aid fix and will not necessarily reduce the rate of failure if
the main causes of damage are not mitigated.
The burst capability of the sensors were able to capture motor stalls upwards of one
second. The stalls were characterized by a sharp drop in rotation by the string, a spike in
differential pressure and torque, as well as the elimination of vibrations above the motor. The
stall investigated in Figs. 9 through 12 appeared to be caused by a sudden increase in weight
applied downhole. This sudden weight transfer caused the cutters of the bit to indent to a point
where the torque required to rotate the bit exceeded the torque being supplied to the bit. This stall
was only released when the string shortened enough from the top drive rotation to allow the
weight applied downhole to be reduced enough to begin rotating the bit.
The stalls only began in the last 1,200 ft of the lateral after 19 hours of drilling and within
8 hours of reaching the TD of the well. Of the last 8 hours of drilling the first four had an average
stall pressure of 1,549 psi and the last four hours had an average stall pressure of 1,419 psi. This
reduction in stall pressure is due to the damage the motor is experiencing, the increasing
temperature of the motor.
Surface measurements during the stall period were examined and only appeared as a
differential pressure spike of 1,280 psi which was 320 psi less than the differential pressure
across the motor at downhole conditions. The nature of surface measurements being recorded at
1 Hz makes it difficult to see the full effect of the stall if it is less than one second.
Page 45
37
Metrics for determining motor damage were investigated and MSEbit was shown to be a
reliable tool to gauge the performance of the motor if drilling inefficiencies are managed and the
formation is not changing. Pressure normalized ROP can also be used to gauge the damage of the
motor, and when plotted along with MSEbit can show the approximate depth where motor stalls
began occurring and the loss of performance began.
Lastly design changes were proposed including: DOCC, stabilized BHAs, lower bend
angle motors, and a continuous motor deration based on MSEbit and pressure normalized ROP. A
workflow centered on these changes and practices was also introduced with the intention of
reducing the aggressiveness of the bit at high WOB through DOCC, reducing the overall
temperature the motor is experiencing through stabilizers and lower bend angles, and finally
reducing the operating conditions of the motor once damage is observed. All the steps in the
workflow work together to increase drilling efficiency and limit the damage to the motor as
much as possible leading to a longer life of the motor.
Page 46
38
REFERENCES
Alattar, A. Mustafa, M. Applegate, N.R. et al. 2017. New Positive Displacement Motor
Technology Significantly Improves the Drilling Performance through Challenging and
Abrasive Strata in Northern Kuwait. Paper SPE 188937 presented at the Abu Dhabi
International Petroleum Exhibition and Conference held in Abu Dhabi, UAE,
13-16 November. http://dx.doi.org/10.2118/188937-MS
Anyanwu, O. N. Klotz, C. Labrecque, D. et al. 2012. Optimized Downhole Mud Motor Delivers
Outstanding Performance Improvement in Alaska Coiled Tubing Drilling. Paper SPE
153474 presented at the SPE/ICoTA Coiled Tubing & Well Intervention Conference
& Exhibition held in the Woodlands, Texas, 27-29 March. http://
dx.doi.org/10.2118/153474-MS
Bailey, J.R. and Remmert, S.M. 2010. Managing Drilling Vibrations Through BHA Design
Optimization. SPE Drilling and Completion 25. 458-471. SPE-139426-
PA. http://dx.doi.org/10.2118/1210-0087-JPT
Beeh, H.A. Nobre, D. Ba, S. Yan, X. et al. 2018. Drilling a Challenging Kviteborn Field 5 ¾ in.
Section in a Single Run Using a New Mud Motor Modeling Engineering Workflow and
New Long-Life Elastomer. Paper SPE-191331-MS presented at the SPE Norway One
Day Seminar held in Bergen, Norway, 18 April. http://dx.doi.org/10.2118/191331-MS
Bybee, K. 2010. The Performance of Mud Motors With Two Different Bent Housings. Journal of
Petroleum Technology 62. 84-86. SPE-1210-0084-JPT. http://
dx.doi.org/10.2118/1210-0084-JPT
Bybee, K. 2008. Drilling Vibrations Modeling and Field Validation. Journal of Petroleum
Technology 60. 73-75. SPE-1208-0073-JPT. http://dx.doi.org/10.2118/1208-0073-JPT
Craig, A.D. Goodship, R. and Shearer, D.R. 2010. High Frequency Downhole Dynamic
Measurements Provide Greater Understanding of Drilling Vibration in Performance Motor
Assemblies. Paper SPE 128211 presented at the IADC/SPE Drilling Conference and
Exhibition held in New Orleans, Louisiana, 2-4 February.
http://dx.doi.org/10.2118/128211-MS
Denney, D. Pressure Distribution in Progressing-Cavity Pumps: Performance and Run Life.
Journal Of Petroleum Technology 64. 85-87. SPE-0712-0085-JPT.
http://dx.doi.org/10.2118/0712-0085-JPT
Detournay, E. and Defourny, P. 1992. A Phenomenological Model for the Drilling Action of Drag
Bits. Oil & Gas Facilities 29(1): 13-23. http://dx.doi.org/10.1016/0148-9062(92)91041-3
Page 47
39
Dupriest, F.E. and Sowers, S.F. 2009. Maintaining Steerability While Extending Gauge Length to
Manage Whirl. Paper SPE 119625 presented at the SPE/IADC Drilling Conference and
Exhibition held in Amsterdam, The Netherlands, 17-19 March.
http://dx.doi.org/10.2118/119625-PA
Dyck, T. ed. 2011. National Oilwell Varco Motor Handbook, 32-42.
Guidroz, B. Barton, S. and Hussain, M. 2011. Can You Protect Your Motor Without Sacrificing
Performance? Paper SPE 146575 presented at the SPE Annual Technical Conference and
Exhibition Held in Denver, Colorado 30 October – 2 November.
http://dx.doi.org/10.2118/146576-MS
Samba, BA, Pushkarev, M, Kolyshkin, A. et al. 2016. Positive Displacement Motor Modeling:
Skyrocketing the Way We Design, Select, and Operate Mud Motors. Paper SPE 183298-
MS presented at the Abu Dhabi International Petroleum Exhibition and Conference, Abu
Dhabi, UAE, 7-10 December. http://dx.doi.org/10.2118/183298-MS
Teale, R. 1965. The Concept of Specific Energy in Rock Drilling. Intl. J. Rock Mech. Mining Sci.
2. 57-73. http://dx.doi.org/10.1016/0148-9062(65)90022-7
Weimar, B. ed 2011. Crescent Directional Drilling Motor Handbook, 8.