ANNUAL REPORT AND SHAREHOLDER LETTER TEMPLETON EMERGING MARKETS SMALL CAP FUND A Series of Templeton Global Investment Trust March 31, 2021 Sign up for electronic delivery at franklintempleton.com/edelivery
Transcript
ANNUAL REPORT AND SHAREHOLDER LETTER
TEMPLETON EMERGING MARKETS SMALL CAP FUNDA Series of Templeton Global Investment Trust
March 31, 2021
Sign up for electronic delivery at franklintempleton.com/edelivery
Not FDIC Insured May Lose Value No Bank Guarantee
franklintempleton.com Not part of the annual report 1
SHAREHOLDER LETTERDear Shareholder:
A year has now passed since the stock market correction of March 2020, when financial markets first recognized the implications of a global pandemic. The 12 months ended March 31, 2021, have seen more disruptions than entire decades in ordinary times. Emerging markets, led by Asia, have remained relatively resilient, with many countries having successfully adapted to or mitigated the novel coronavirus (COVID-19) pandemic. In contrast, a return to economic normality in the West is dependent almost wholly on vaccines. While we are seeing rapid progress with vaccinations in the U.S. and the U.K., the European Union remains far behind amid continued lockdowns and economic stagnation.
At the early stages of the pandemic, we emphasized China’s resilience—borne of drastic policy measures—which suggested even at an early stage that among large global economies, China could ultimately be among the least affected by COVID-19. We saw far greater risks associated with demand destruction in the West and a subsequent deflationary shock. We also harbored doubts whether the massive monetary and fiscal packages unveiled in developed markets would prove effective. This caution hinged on whether developed markets would be able to successfully contain COVID-19. During the period, many countries in the West failed on the factors outlined above, albeit the extent to which we would see divergence with the more successful emerging Asian economies has taken us by surprise.
The concept of a world-leading emerging market company has evolved from an aspiration to a reality over the last decade—a trend reinforced during the pandemic. Taiwanese and South Korean semiconductor companies dominate the global semiconductor industry, Chinese biotechnology firms have gained global credibility, and India’s internet space remains largely untapped. Taken together, evidence of emerging market companies scaling the value chain has increased, and we see durable growth characteristics in many of these firms.
From the height of the pandemic through the current early stage of recovery, our conviction in the growing structural advantages of emerging markets, led by key Asian economies, has strengthened.
We are committed to our long-term perspective and disciplined investment approach as we conduct a rigorous, fundamental analysis of securities with a regular emphasis on investment risk management.
Historically, patient investors have achieved rewarding results by evaluating their goals, diversifying their assets globally and maintaining a disciplined investment program, all hallmarks of the Templeton investment philosophy. We continue to recommend investors consult financial professionals and review their portfolios to design a long-term strategy and portfolio allocation that meet their individual needs, goals and risk tolerance.
Templeton Emerging Markets Small Cap Fund’s annual report includes more detail about prevailing conditions and a discussion about investment decisions during the period. Please remember all securities markets fluctuate, as do mutual fund share prices.
We thank you for investing with Franklin Templeton, welcome your questions and comments, and look forward to serving your investment needs in the years ahead.
Sincerely,
Manraj S. Sekhon, CFAChief Investment OfficerFranklin Templeton Emerging Markets Equity
This letter reflects our analysis and opinions as of March 31, 2021, unless otherwise indicated. The information is not a complete analysis of every aspect of any market, country, industry, security or fund. Statements of fact are from sources considered reliable.
CFA® is a trademark owned by CFA Institute.
franklintempleton.comAnnual Report2
ContentsAnnual ReportTempleton Emerging Markets Small Cap Fund .....................3Performance Summary..........................................................7Your Fund’s Expenses .........................................................10Financial Highlights and Statement of Investments.............11Financial Statements ...........................................................20Notes to Financial Statements.............................................24Report of Independent Registered Public Accounting Firm ........................................................34Tax Information ....................................................................35Board Members and Officers...............................................36Shareholder Information ......................................................41
Visit franklintempleton.com for fund updates, to access your account, or to find helpful financial planning tools.
3franklintempleton.com Annual Report
ANNUAL REPORT
Templeton Emerging Markets Small Cap FundThis annual report for Templeton Emerging Markets Small Cap Fund covers the fiscal year ended March 31, 2021.
Your Fund’s Goal and Main InvestmentsThe Fund seeks long-term capital appreciation. Under normal market conditions, the Fund invests at least 80% of its net assets in securities of small-cap companies located in emerging market countries, as defined in the Fund’s prospectus. For this Fund, small-cap companies are companies with a market capitalization at the time of purchase within the range of the market capitalizations of companies included in the MSCI Emerging Markets (EM) Small Cap Index.
Performance OverviewThe Fund’s Class A shares posted a +78.52% cumulative total return for the 12 months under review. In comparison, the Fund’s benchmark, the MSCI EM Small Cap Index-NR, which measures stock performance of small-cap stocks in emerging markets, posted a +87.13% total return.1 Please note index performance information is provided for reference and we do not attempt to track any index but rather undertake investments on the basis of fundamental research. In addition, the Fund’s return reflects the effect of fees and expenses for professional management, while an index does not have such costs. You can find the Fund’s long-term performance data in the Performance Summary beginning on page 7.
Performance data represent past performance, which does not guarantee future results. Investment return and principal value will fluctuate, and you may have a gain or loss when you sell your shares. Current performance may differ from figures shown. For most recent month-end performance, go to franklintempleton.com or call (800) 342-5236.
Economic and Market OverviewThe novel coronavirus (COVID-19) pandemic pushed the economies of many emerging market countries into contractions during the 12 months ended March 31, 2021,
Geographic Composition3/31/21
% of Total Net Assets
Asia 80.1% Latin America & Caribbean 8.1% Europe 6.0% Middle East & Africa 4.3% Short-Term Investments & Other Net Assets 1.5%
with the notable exception of China. In response, many emerging market central banks lowered interest rates early in the period and adopted more accommodative monetary policies in an effort to foster economic growth. Emerging market small-cap equities posted significant gains for the 12-month period, rebounding from pandemic-related declines immediately preceding the period. Investors were encouraged by economic reopenings in many countries, fiscal and monetary stimulus measures, and the development and deployment of vaccines. Surges in COVID-19 infections, U.S.-China tensions and concerns about inflation held back investor enthusiasm at certain times during the period.
Regarding individual countries, China’s economy grew year-on-year in the second quarter of 2020 after businesses reopened following COVID-19 lockdowns. The country’s year-on-year growth rate then accelerated in 2020’s third and fourth quarters and 2021’s first quarter, driven by retail sales, industrial production and increasing global demand. Taiwan’s year-on-year growth rate slowed in the second quarter of 2020 as its export-dependent economy was impacted by decreased global demand. Government stimulus and foreign demand for electronics parts helped accelerate growth in the third and fourth quarters. South Korea’s year-on-year growth rates contracted in the second, third and fourth quarters of 2020, partly due to negative growth in construction, consumption and exports. The country’s economy returned to growth in the first quarter of 2021 due in part to a recovery in private consumption and acceleration in government spending. The year-on-year growth rates of India contracted in the second and third quarters of 2020 before growing modestly in the fourth quarter, aided by recoveries in private and public spending, manufacturing and construction.
1. Source: Morningstar. The index is unmanaged and includes reinvestment of any income or distributions. It does not reflect any fees, expenses or sales charges. One cannot invest directly in an index, and an index is not representative of the Fund’s portfolio. Net Returns (NR) include income net of tax withholding when dividends are paid.See www.franklintempletondatasources.com for additional data provider information.The dollar value, number of shares or principal amount, and names of all portfolio holdings are listed in the Fund’s Statement of Investments (SOI).The SOI begins on page 16.
TEMPLETON EMERGING MARKETS SMALL CAP FUND
4 franklintempleton.comAnnual Report
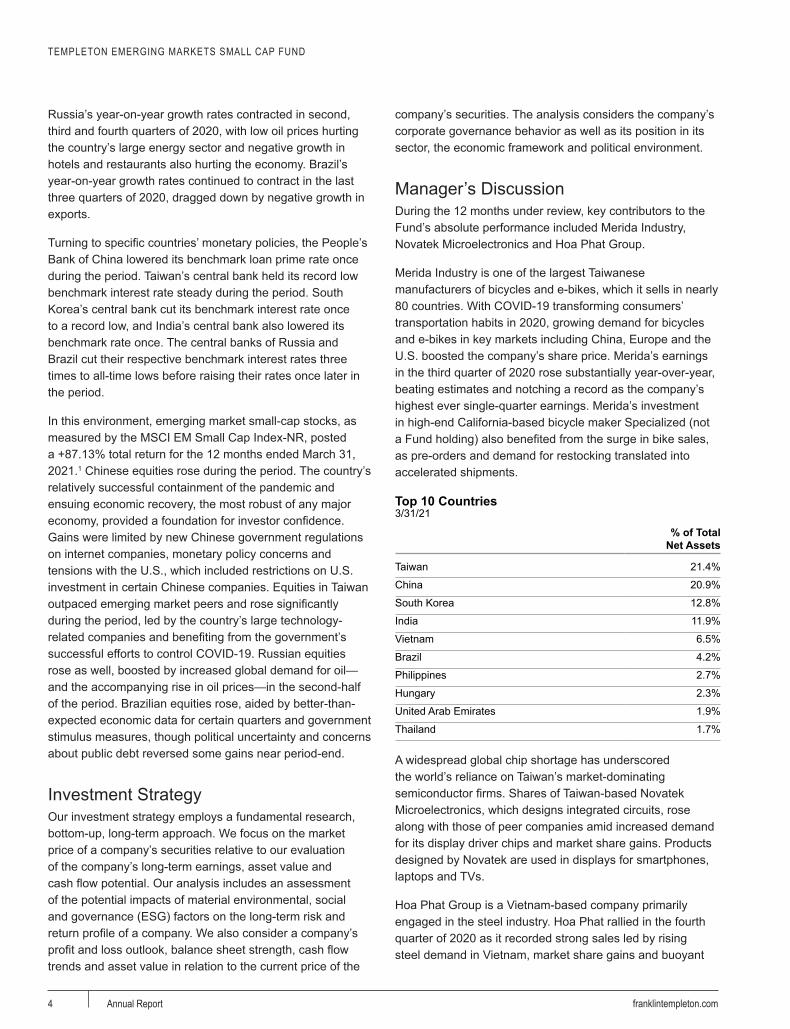
Russia’s year-on-year growth rates contracted in second, third and fourth quarters of 2020, with low oil prices hurting the country’s large energy sector and negative growth in hotels and restaurants also hurting the economy. Brazil’s year-on-year growth rates continued to contract in the last three quarters of 2020, dragged down by negative growth in exports.
Turning to specific countries’ monetary policies, the People’s Bank of China lowered its benchmark loan prime rate once during the period. Taiwan’s central bank held its record low benchmark interest rate steady during the period. South Korea’s central bank cut its benchmark interest rate once to a record low, and India’s central bank also lowered its benchmark rate once. The central banks of Russia and Brazil cut their respective benchmark interest rates three times to all-time lows before raising their rates once later in the period.
In this environment, emerging market small-cap stocks, as measured by the MSCI EM Small Cap Index-NR, posted a +87.13% total return for the 12 months ended March 31, 2021.1 Chinese equities rose during the period. The country’s relatively successful containment of the pandemic and ensuing economic recovery, the most robust of any major economy, provided a foundation for investor confidence. Gains were limited by new Chinese government regulations on internet companies, monetary policy concerns and tensions with the U.S., which included restrictions on U.S. investment in certain Chinese companies. Equities in Taiwan outpaced emerging market peers and rose significantly during the period, led by the country’s large technology-related companies and benefiting from the government’s successful efforts to control COVID-19. Russian equities rose as well, boosted by increased global demand for oil—and the accompanying rise in oil prices—in the second-half of the period. Brazilian equities rose, aided by better-than-expected economic data for certain quarters and government stimulus measures, though political uncertainty and concerns about public debt reversed some gains near period-end.
Investment StrategyOur investment strategy employs a fundamental research, bottom-up, long-term approach. We focus on the market price of a company’s securities relative to our evaluation of the company’s long-term earnings, asset value and cash flow potential. Our analysis includes an assessment of the potential impacts of material environmental, social and governance (ESG) factors on the long-term risk and return profile of a company. We also consider a company’s profit and loss outlook, balance sheet strength, cash flow trends and asset value in relation to the current price of the
company’s securities. The analysis considers the company’s corporate governance behavior as well as its position in its sector, the economic framework and political environment.
Manager’s DiscussionDuring the 12 months under review, key contributors to the Fund’s absolute performance included Merida Industry, Novatek Microelectronics and Hoa Phat Group.
Merida Industry is one of the largest Taiwanese manufacturers of bicycles and e-bikes, which it sells in nearly 80 countries. With COVID-19 transforming consumers’ transportation habits in 2020, growing demand for bicycles and e-bikes in key markets including China, Europe and the U.S. boosted the company’s share price. Merida’s earnings in the third quarter of 2020 rose substantially year-over-year, beating estimates and notching a record as the company’s highest ever single-quarter earnings. Merida’s investment in high-end California-based bicycle maker Specialized (not a Fund holding) also benefited from the surge in bike sales, as pre-orders and demand for restocking translated into accelerated shipments.
Top 10 Countries3/31/21
a% of Total
Net Assetsa a
Taiwan 21.4%
China 20.9%
South Korea 12.8%
India 11.9%
Vietnam 6.5%
Brazil 4.2%
Philippines 2.7%
Hungary 2.3%
United Arab Emirates 1.9%
Thailand 1.7%
A widespread global chip shortage has underscored the world’s reliance on Taiwan’s market-dominating semiconductor firms. Shares of Taiwan-based Novatek Microelectronics, which designs integrated circuits, rose along with those of peer companies amid increased demand for its display driver chips and market share gains. Products designed by Novatek are used in displays for smartphones, laptops and TVs.
Hoa Phat Group is a Vietnam-based company primarily engaged in the steel industry. Hoa Phat rallied in the fourth quarter of 2020 as it recorded strong sales led by rising steel demand in Vietnam, market share gains and buoyant
TEMPLETON EMERGING MARKETS SMALL CAP FUND
5franklintempleton.com Annual Report
steel prices. We believe Hoa Phat’s position as one of the largest steel makers in Vietnam has given it scale and cost advantages, which could help the company gain further market share.
Conversely, major detractors from absolute performance included Medy-tox, Ser Educacional and Fanhua.
Medy-tox, a South Korean pharmaceutical company, produces botulinum toxin (BTX), hyaluronic acid filler and other related products. For years, Medy-tox has been embroiled in a legal battle with another South Korean company, Daewoong Pharmaceutical (not a Fund holding), with Medy-tox alleging that Daewoong had stolen the source of a BTX strain used in its cosmetic treatment products. While the United States International Trade Commission found in favor of this claim in December 2020, it also determined that the strain was not a trade secret, a blow to Medy-tox’s competitive position. This was not the first setback for Medy-tox in the past year. In October, South Korea’s Ministry of Food and Drug Safety ordered the company to suspend sales of some of its BTX products after finding it had sold them in China without export approval. These regulatory and legal woes contributed to substantial declines in Medy-tox’s share price.
Ser Educacional is a Brazil-based education company with a focus on post-secondary, vocational and higher education institutions. In September 2020, the company’s
share price jumped on news of its impending purchase of the Brazilian assets of U.S.-based Laureate Education (not a Fund holding), which owned and operated higher education institutions in Brazil that collectively enroll more than 250,000 students. One month later, Laureate accepted an offer from Anima (not a Fund holding), another education provider, terminating the earlier deal with Ser, whose share price subsequently dropped. With the COVID-19 pandemic increasing student drop-out rates, year-over-year revenues for Ser declined in both the second and third quarters of 2020. In February 2021, Ser’s shares fell sharply along with most of the Brazilian equity market, as well as the country’s currency and bonds, after President Jair Bolsonaro ousted the head of Petrobras (not a Fund holding), the state-owned oil company.
Fanhua operates an independent insurance agency in China, offering a broad range of products underwritten by multiple insurers. The company’s product line includes wealth management, property, casualty and life products. The COVID-19 pandemic had a severe negative impact on China's life insurance industry, and Fanhua’s total net revenues for 2020 declined from 2019.
In the past 12 months, we added a number of new positions to the Fund as we continued to identify what we considered to be attractive companies with sustainable earnings power and which trade at a discount to their intrinsic worth within the small-cap investment universe in emerging markets. Key additions included Daqo New Energy, a Chinese manufacturer of polysilicon for solar power equipment; China Education Group Holdings, a private operator of universities and vocational colleges; momo.com, a Taiwanese provider of online retail services; and Poya International, a retail chain based in Taiwan that sells personal products and housewares. We also added to an existing investment in Zinus, a South Korean wholesaler of mattresses and household furniture.
Meanwhile, we decreased the Fund’s investments across several markets to raise funds for redemptions and in favor of opportunities we found more compelling. Holdings in India, Taiwan and Hong Kong were reduced the most. Reductions were also undertaken in the health care, information technology, consumer discretionary and materials sectors. In terms of key sales, we closed positions in U.S.-based IMAX, which designs and manufactures premium theater systems; India’s Glenmark Pharmaceuticals, a maker of generic drugs; Hankook Technology Group, the holding company for Hankook Tire, South Korea’s largest tire manufacturer; and the aforementioned Fanhua and Medy-tox. We also reduced our position in the previously mentioned Novatek.
TEMPLETON EMERGING MARKETS SMALL CAP FUND
6 franklintempleton.comAnnual Report
Thank you for your continued participation in Templeton Emerging Markets Small Cap Fund. We look forward to serving your future investment needs.
Chetan Sehgal, CFAPortfolio Manager
The foregoing information reflects our analysis, opinions and portfolio holdings as of March 31, 2021, the end of the reporting period. The way we implement our main investment strategies and the resulting portfolio holdings may change depending on factors such as market and economic conditions. These opinions may not be relied upon as investment advice or an offer for a particular security. The information is not a complete analysis of every aspect of any market, country, industry, security or the Fund. Statements of fact are from sources considered reliable, but the investment manager makes no representation or warranty as to their completeness or accuracy. Although historical performance is no guarantee of future results, these insights may help you understand our investment management philosophy.
Performance Summary as of March 31, 2021
TEMPLETON EMERGING MARKETS SMALL CAP FUND
7franklintempleton.com Annual Report
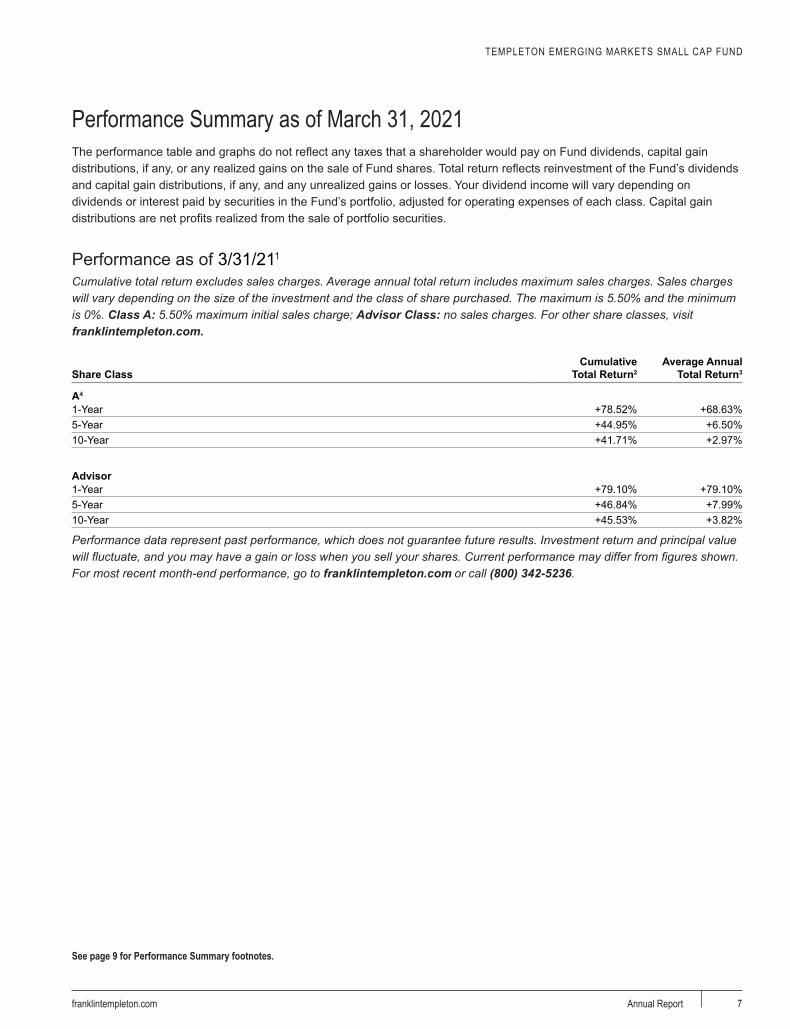
The performance table and graphs do not reflect any taxes that a shareholder would pay on Fund dividends, capital gain distributions, if any, or any realized gains on the sale of Fund shares. Total return reflects reinvestment of the Fund’s dividends and capital gain distributions, if any, and any unrealized gains or losses. Your dividend income will vary depending on dividends or interest paid by securities in the Fund’s portfolio, adjusted for operating expenses of each class. Capital gain distributions are net profits realized from the sale of portfolio securities.
Performance as of 3/31/211
Cumulative total return excludes sales charges. Average annual total return includes maximum sales charges. Sales charges will vary depending on the size of the investment and the class of share purchased. The maximum is 5.50% and the minimum is 0%. Class A: 5.50% maximum initial sales charge; Advisor Class: no sales charges. For other share classes, visit franklintempleton.com.
Performance data represent past performance, which does not guarantee future results. Investment return and principal value will fluctuate, and you may have a gain or loss when you sell your shares. Current performance may differ from figures shown. For most recent month-end performance, go to franklintempleton.com or call (800) 342-5236.
See page 9 for Performance Summary footnotes.
TEMPLETON EMERGING MARKETS SMALL CAP FUNDPERFORMANCE SUMMARY
8 franklintempleton.comAnnual Report
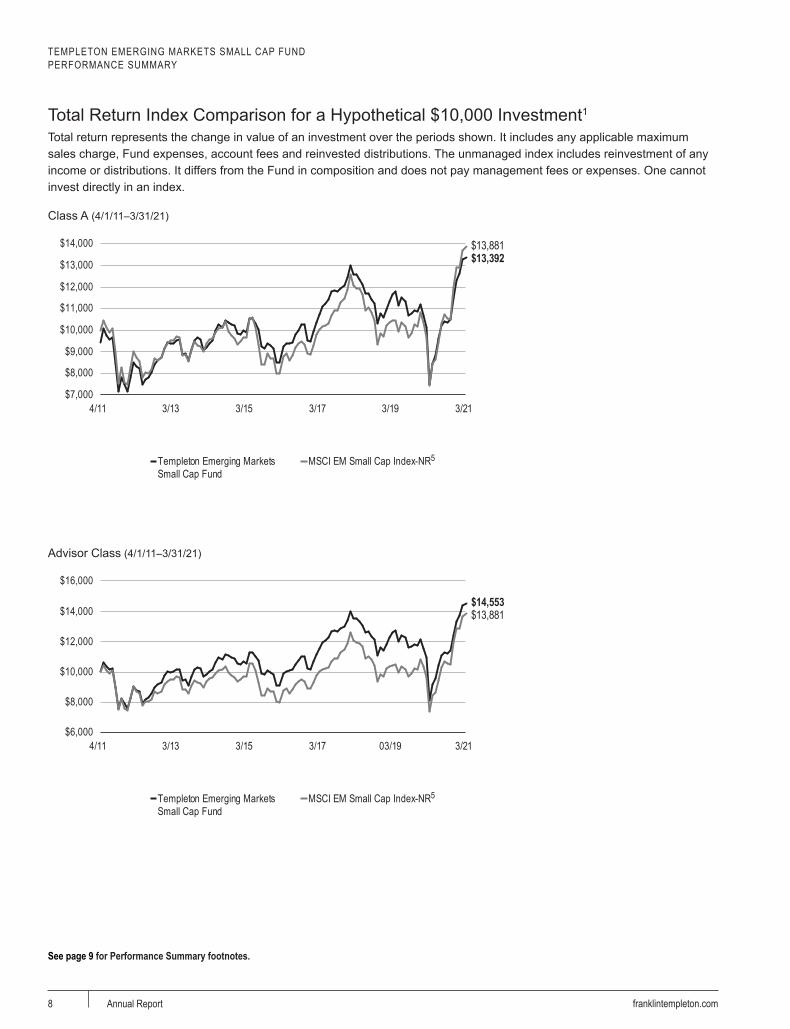
Total Return Index Comparison for a Hypothetical $10,000 Investment1
Total return represents the change in value of an investment over the periods shown. It includes any applicable maximum sales charge, Fund expenses, account fees and reinvested distributions. The unmanaged index includes reinvestment of any income or distributions. It differs from the Fund in composition and does not pay management fees or expenses. One cannot invest directly in an index.
Class A (4/1/11–3/31/21)
$7,000
$8,000
$9,000
$10,000
$11,000
$12,000
$13,000
$14,000 $13,881 $13,392
4/11 3/13 3/15 3/17 3/19 3/21
Templeton Emerging MarketsSmall Cap Fund
Templeton Emerging MarketsSmall Cap Fund
MSCI EM Small Cap Index-NR5MSCI EM Small Cap Index-NR5
Advisor Class (4/1/11–3/31/21)
$6,000
$8,000
$10,000
$12,000
$14,000
$16,000
$14,553 $13,881
4/11 3/13 3/15 3/17 03/19 3/21
Templeton Emerging MarketsSmall Cap Fund
Templeton Emerging MarketsSmall Cap Fund
MSCI EM Small Cap Index-NR5MSCI EM Small Cap Index-NR5
See page 9 for Performance Summary footnotes.
TEMPLETON EMERGING MARKETS SMALL CAP FUNDPERFORMANCE SUMMARY
9franklintempleton.com Annual Report
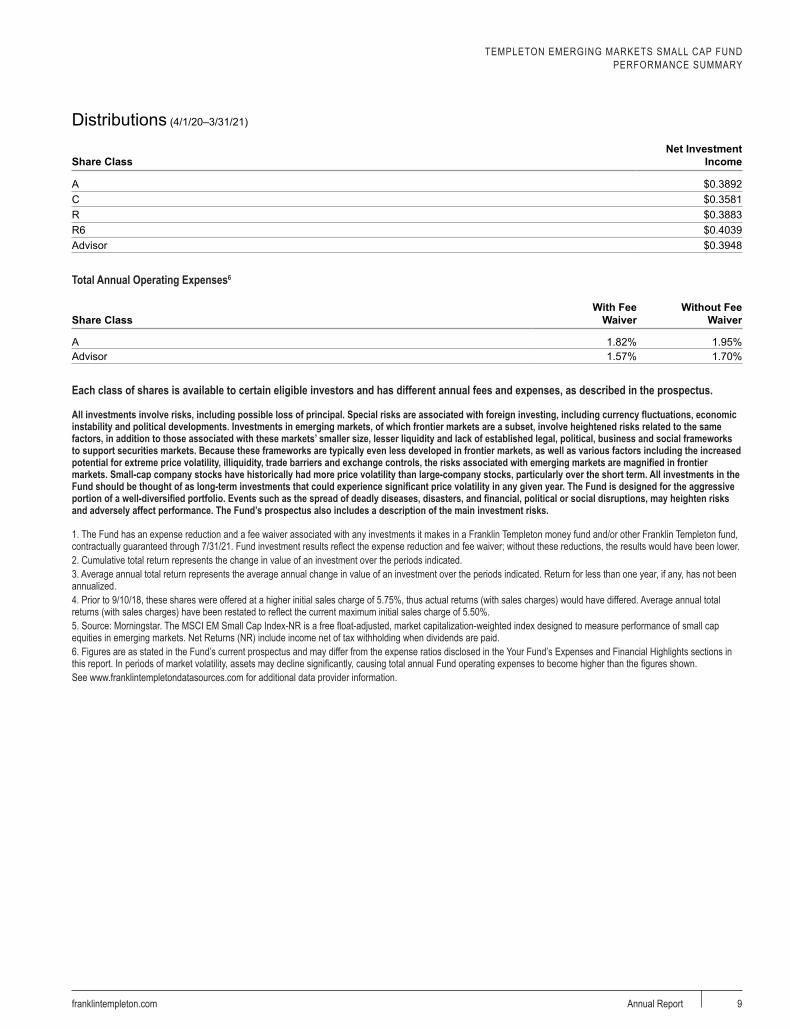
Distributions (4/1/20–3/31/21)
Share ClassNet Investment
Income
A $0.3892C $0.3581R $0.3883R6 $0.4039Advisor $0.3948
Total Annual Operating Expenses6
Share ClassWith Fee
WaiverWithout Fee
Waiver
A 1.82% 1.95%Advisor 1.57% 1.70%
Each class of shares is available to certain eligible investors and has different annual fees and expenses, as described in the prospectus.
All investments involve risks, including possible loss of principal. Special risks are associated with foreign investing, including currency fluctuations, economic instability and political developments. Investments in emerging markets, of which frontier markets are a subset, involve heightened risks related to the same factors, in addition to those associated with these markets’ smaller size, lesser liquidity and lack of established legal, political, business and social frameworks to support securities markets. Because these frameworks are typically even less developed in frontier markets, as well as various factors including the increased potential for extreme price volatility, illiquidity, trade barriers and exchange controls, the risks associated with emerging markets are magnified in frontier markets. Small-cap company stocks have historically had more price volatility than large-company stocks, particularly over the short term. All investments in the Fund should be thought of as long-term investments that could experience significant price volatility in any given year. The Fund is designed for the aggressive portion of a well-diversified portfolio. Events such as the spread of deadly diseases, disasters, and financial, political or social disruptions, may heighten risks and adversely affect performance. The Fund’s prospectus also includes a description of the main investment risks.
1. The Fund has an expense reduction and a fee waiver associated with any investments it makes in a Franklin Templeton money fund and/or other Franklin Templeton fund, contractually guaranteed through 7/31/21. Fund investment results reflect the expense reduction and fee waiver; without these reductions, the results would have been lower.2. Cumulative total return represents the change in value of an investment over the periods indicated.3. Average annual total return represents the average annual change in value of an investment over the periods indicated. Return for less than one year, if any, has not been annualized.4. Prior to 9/10/18, these shares were offered at a higher initial sales charge of 5.75%, thus actual returns (with sales charges) would have differed. Average annual total returns (with sales charges) have been restated to reflect the current maximum initial sales charge of 5.50%.5. Source: Morningstar. The MSCI EM Small Cap Index-NR is a free float-adjusted, market capitalization-weighted index designed to measure performance of small cap equities in emerging markets. Net Returns (NR) include income net of tax withholding when dividends are paid.6. Figures are as stated in the Fund’s current prospectus and may differ from the expense ratios disclosed in the Your Fund’s Expenses and Financial Highlights sections in this report. In periods of market volatility, assets may decline significantly, causing total annual Fund operating expenses to become higher than the figures shown. See www.franklintempletondatasources.com for additional data provider information.
Your Fund’s Expenses
TEMPLETON EMERGING MARKETS SMALL CAP FUND
10 franklintempleton.comAnnual Report
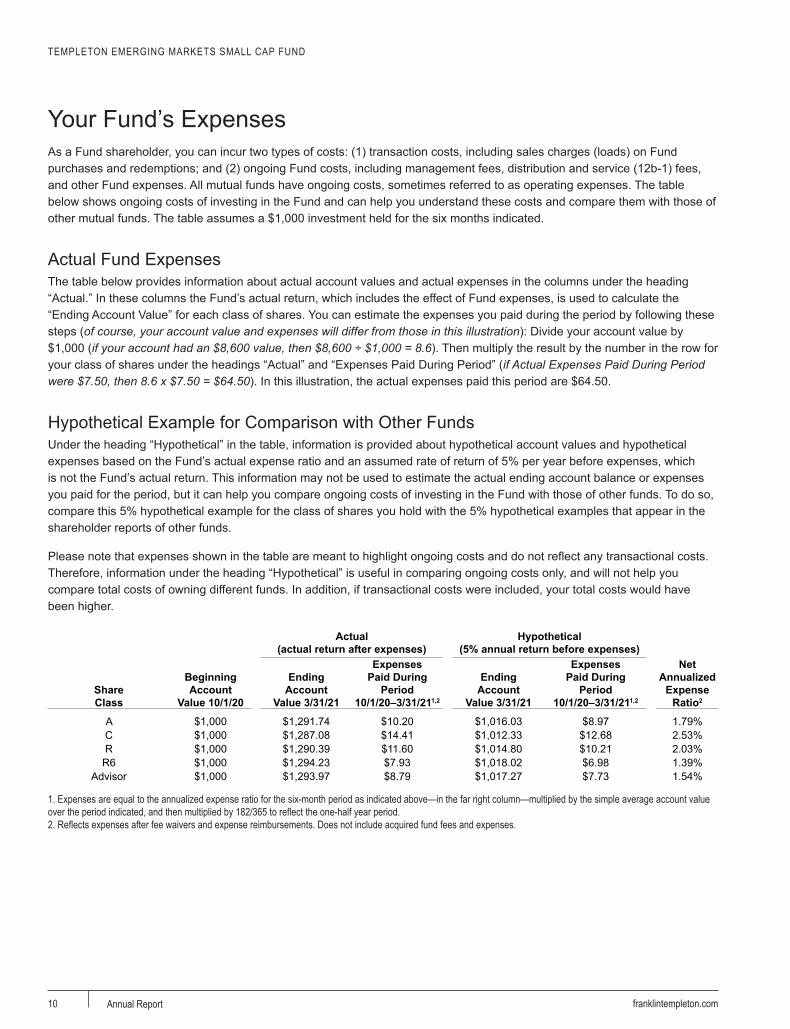
As a Fund shareholder, you can incur two types of costs: (1) transaction costs, including sales charges (loads) on Fund purchases and redemptions; and (2) ongoing Fund costs, including management fees, distribution and service (12b-1) fees, and other Fund expenses. All mutual funds have ongoing costs, sometimes referred to as operating expenses. The table below shows ongoing costs of investing in the Fund and can help you understand these costs and compare them with those of other mutual funds. The table assumes a $1,000 investment held for the six months indicated.
Actual Fund ExpensesThe table below provides information about actual account values and actual expenses in the columns under the heading “Actual.” In these columns the Fund’s actual return, which includes the effect of Fund expenses, is used to calculate the “Ending Account Value” for each class of shares. You can estimate the expenses you paid during the period by following these steps (of course, your account value and expenses will differ from those in this illustration): Divide your account value by $1,000 (if your account had an $8,600 value, then $8,600 ÷ $1,000 = 8.6). Then multiply the result by the number in the row for your class of shares under the headings “Actual” and “Expenses Paid During Period” (if Actual Expenses Paid During Period were $7.50, then 8.6 x $7.50 = $64.50). In this illustration, the actual expenses paid this period are $64.50.
Hypothetical Example for Comparison with Other FundsUnder the heading “Hypothetical” in the table, information is provided about hypothetical account values and hypothetical expenses based on the Fund’s actual expense ratio and an assumed rate of return of 5% per year before expenses, which is not the Fund’s actual return. This information may not be used to estimate the actual ending account balance or expenses you paid for the period, but it can help you compare ongoing costs of investing in the Fund with those of other funds. To do so, compare this 5% hypothetical example for the class of shares you hold with the 5% hypothetical examples that appear in the shareholder reports of other funds.
Please note that expenses shown in the table are meant to highlight ongoing costs and do not reflect any transactional costs. Therefore, information under the heading “Hypothetical” is useful in comparing ongoing costs only, and will not help you compare total costs of owning different funds. In addition, if transactional costs were included, your total costs would have been higher.
1. Expenses are equal to the annualized expense ratio for the six-month period as indicated above—in the far right column—multiplied by the simple average account value over the period indicated, and then multiplied by 182/365 to reflect the one-half year period.2. Reflects expenses after fee waivers and expense reimbursements. Does not include acquired fund fees and expenses.
TEMPLETON GLOBAL INVESTMENT TRUST
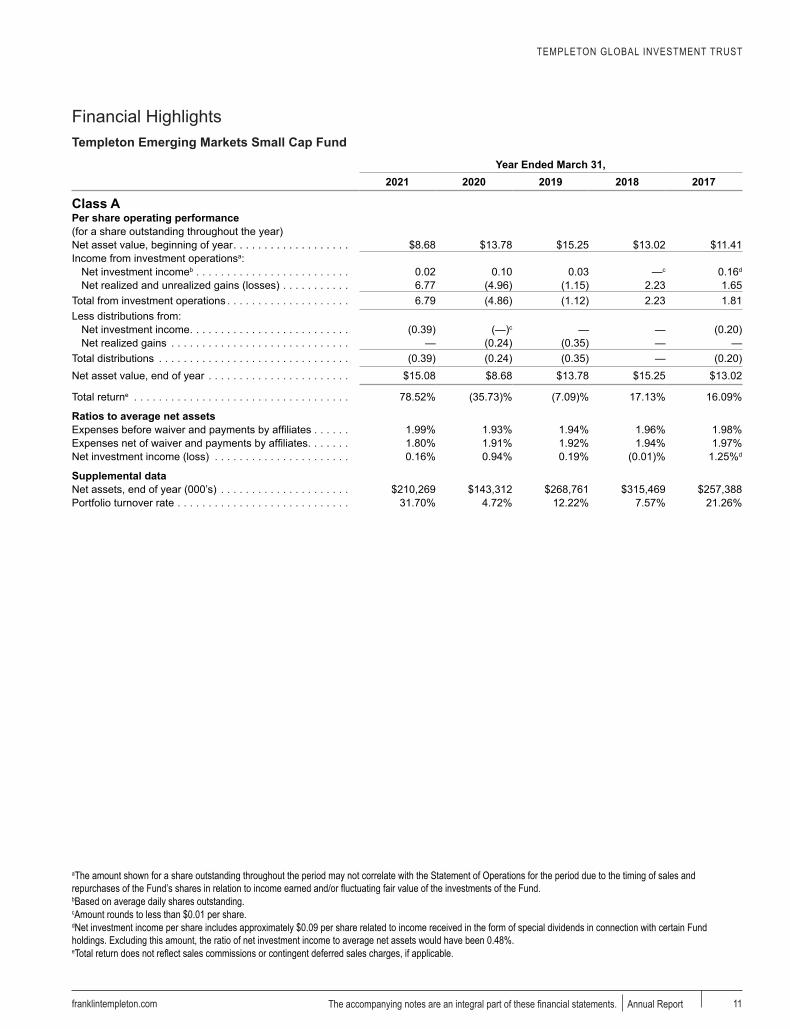
Financial HighlightsTempleton Emerging Markets Small Cap Fund
franklintempleton.com The accompanying notes are an integral part of these financial statements. Annual Report 11
aYear Ended March 31,
2021 2020 2019 2018 2017
Class APer share operating performance(for a share outstanding throughout the year)Net asset value, beginning of year . . . . . . . . . . . . . . . . . . . $8.68 $13.78 $15.25 $13.02 $11.41Income from investment operationsa:
aThe amount shown for a share outstanding throughout the period may not correlate with the Statement of Operations for the period due to the timing of sales and repurchases of the Fund’s shares in relation to income earned and/or fluctuating fair value of the investments of the Fund.bBased on average daily shares outstanding.cAmount rounds to less than $0.01 per share.dNet investment income per share includes approximately $0.09 per share related to income received in the form of special dividends in connection with certain Fund holdings. Excluding this amount, the ratio of net investment income to average net assets would have been 0.48%.eTotal return does not reflect sales commissions or contingent deferred sales charges, if applicable.
TEMPLETON GLOBAL INVESTMENT TRUSTFINANCIAL HIGHLIGHTS
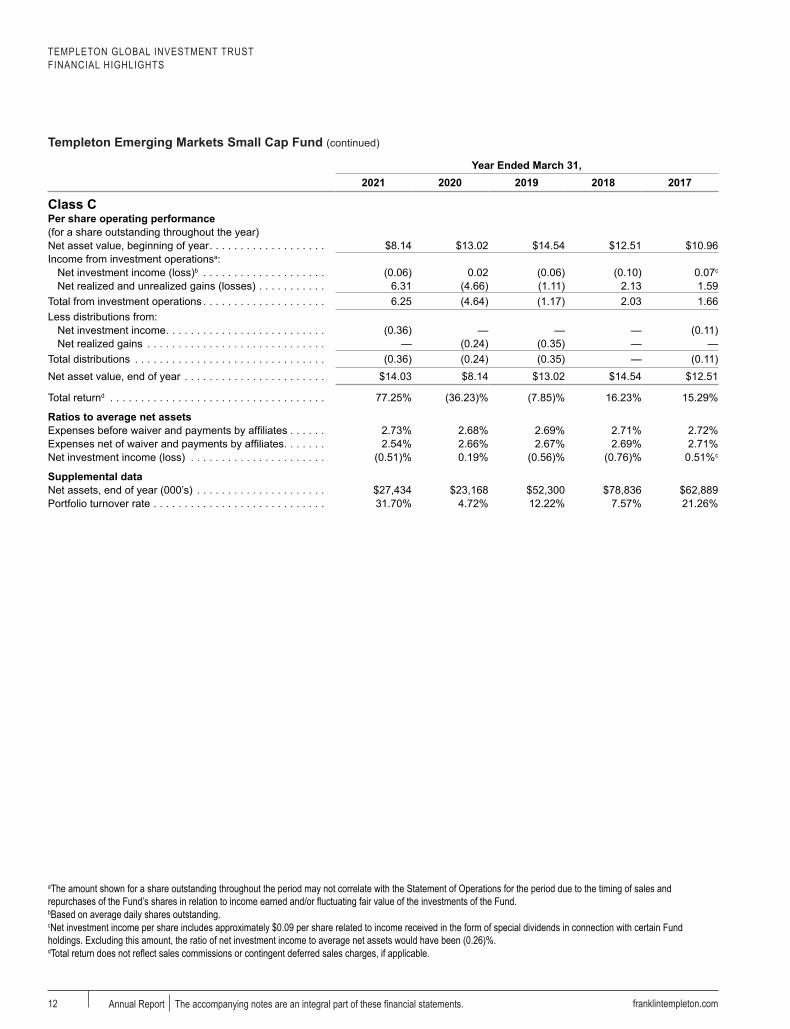
Templeton Emerging Markets Small Cap Fund (continued)
franklintempleton.comAnnual Report The accompanying notes are an integral part of these financial statements.12
aYear Ended March 31,
2021 2020 2019 2018 2017
Class CPer share operating performance(for a share outstanding throughout the year)Net asset value, beginning of year . . . . . . . . . . . . . . . . . . . $8.14 $13.02 $14.54 $12.51 $10.96Income from investment operationsa:
aThe amount shown for a share outstanding throughout the period may not correlate with the Statement of Operations for the period due to the timing of sales and repurchases of the Fund’s shares in relation to income earned and/or fluctuating fair value of the investments of the Fund.bBased on average daily shares outstanding.cNet investment income per share includes approximately $0.09 per share related to income received in the form of special dividends in connection with certain Fund holdings. Excluding this amount, the ratio of net investment income to average net assets would have been (0.26)%.dTotal return does not reflect sales commissions or contingent deferred sales charges, if applicable.
TEMPLETON GLOBAL INVESTMENT TRUSTFINANCIAL HIGHLIGHTS
Templeton Emerging Markets Small Cap Fund (continued)
franklintempleton.com The accompanying notes are an integral part of these financial statements. Annual Report 13
aYear Ended March 31,
2021 2020 2019 2018 2017
Class RPer share operating performance(for a share outstanding throughout the year)Net asset value, beginning of year . . . . . . . . . . . . . . . . . . . $8.56 $13.62 $15.11 $12.93 $11.33Income from investment operationsa:
aThe amount shown for a share outstanding throughout the period may not correlate with the Statement of Operations for the period due to the timing of sales and repurchases of the Fund’s shares in relation to income earned and/or fluctuating fair value of the investments of the Fund.bBased on average daily shares outstanding.cNet investment income per share includes approximately $0.09 per share related to income received in the form of special dividends in connection with certain Fund holdings. Excluding this amount, the ratio of net investment income to average net assets would have been 0.23%.
TEMPLETON GLOBAL INVESTMENT TRUSTFINANCIAL HIGHLIGHTS
Templeton Emerging Markets Small Cap Fund (continued)
franklintempleton.comAnnual Report The accompanying notes are an integral part of these financial statements.14
a
Year Ended March 31, Period Ended March 31,
2018a2021 2020 2019
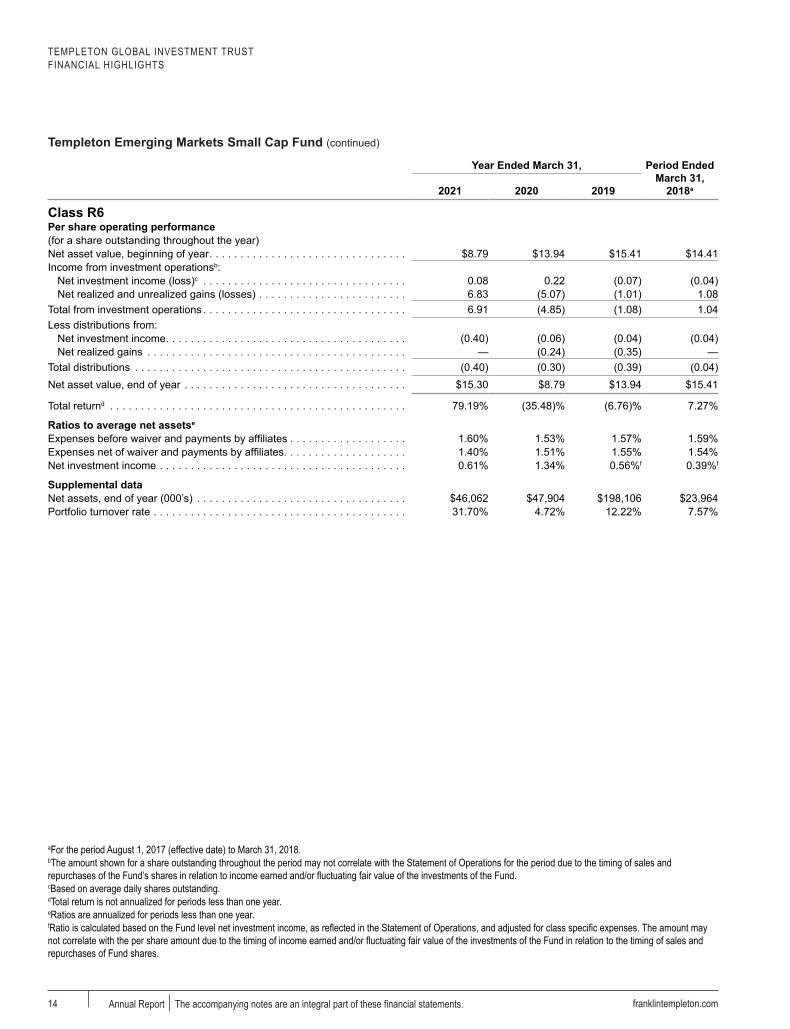
Class R6Per share operating performance(for a share outstanding throughout the year)Net asset value, beginning of year . . . . . . . . . . . . . . . . . . . . . . . . . . . . . . . . $8.79 $13.94 $15.41 $14.41Income from investment operationsb:
aFor the period August 1, 2017 (effective date) to March 31, 2018.bThe amount shown for a share outstanding throughout the period may not correlate with the Statement of Operations for the period due to the timing of sales and repurchases of the Fund’s shares in relation to income earned and/or fluctuating fair value of the investments of the Fund.cBased on average daily shares outstanding.dTotal return is not annualized for periods less than one year.eRatios are annualized for periods less than one year.fRatio is calculated based on the Fund level net investment income, as reflected in the Statement of Operations, and adjusted for class specific expenses. The amount may not correlate with the per share amount due to the timing of income earned and/or fluctuating fair value of the investments of the Fund in relation to the timing of sales and repurchases of Fund shares.
TEMPLETON GLOBAL INVESTMENT TRUSTFINANCIAL HIGHLIGHTS
Templeton Emerging Markets Small Cap Fund (continued)
franklintempleton.com The accompanying notes are an integral part of these financial statements. Annual Report 15
aYear Ended March 31,
2021 2020 2019 2018 2017
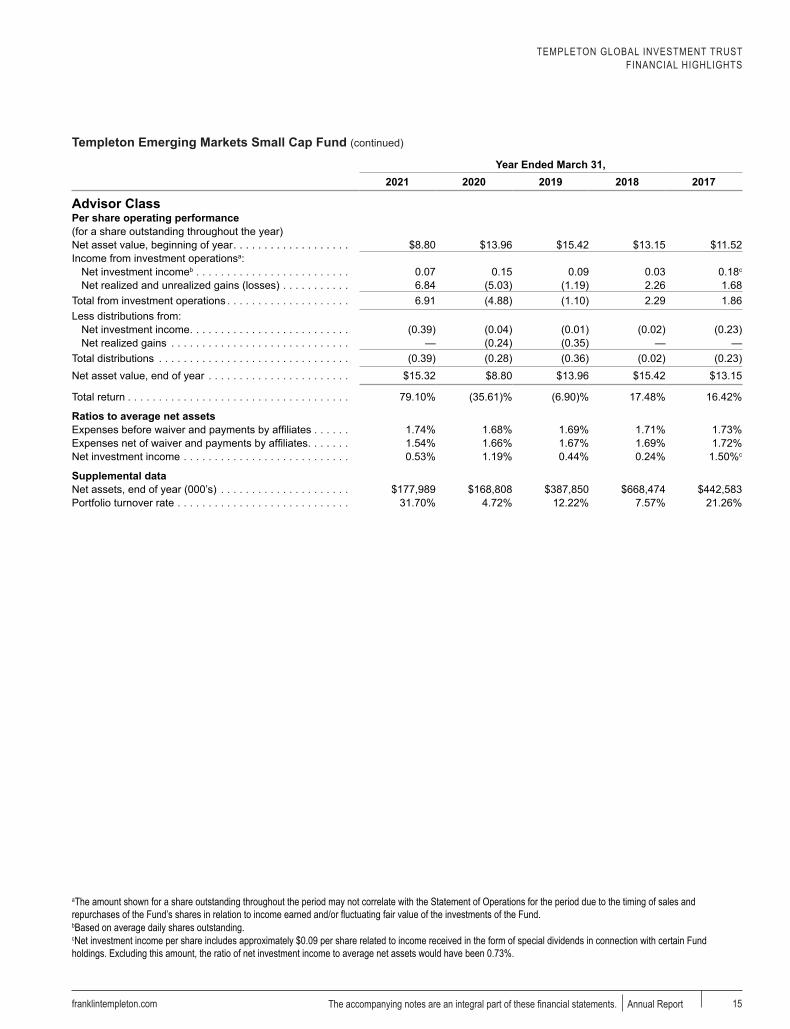
Advisor ClassPer share operating performance(for a share outstanding throughout the year)Net asset value, beginning of year . . . . . . . . . . . . . . . . . . . $8.80 $13.96 $15.42 $13.15 $11.52Income from investment operationsa:
aThe amount shown for a share outstanding throughout the period may not correlate with the Statement of Operations for the period due to the timing of sales and repurchases of the Fund’s shares in relation to income earned and/or fluctuating fair value of the investments of the Fund.bBased on average daily shares outstanding.cNet investment income per share includes approximately $0.09 per share related to income received in the form of special dividends in connection with certain Fund holdings. Excluding this amount, the ratio of net investment income to average net assets would have been 0.73%.
TEMPLETON GLOBAL INVESTMENT TRUST
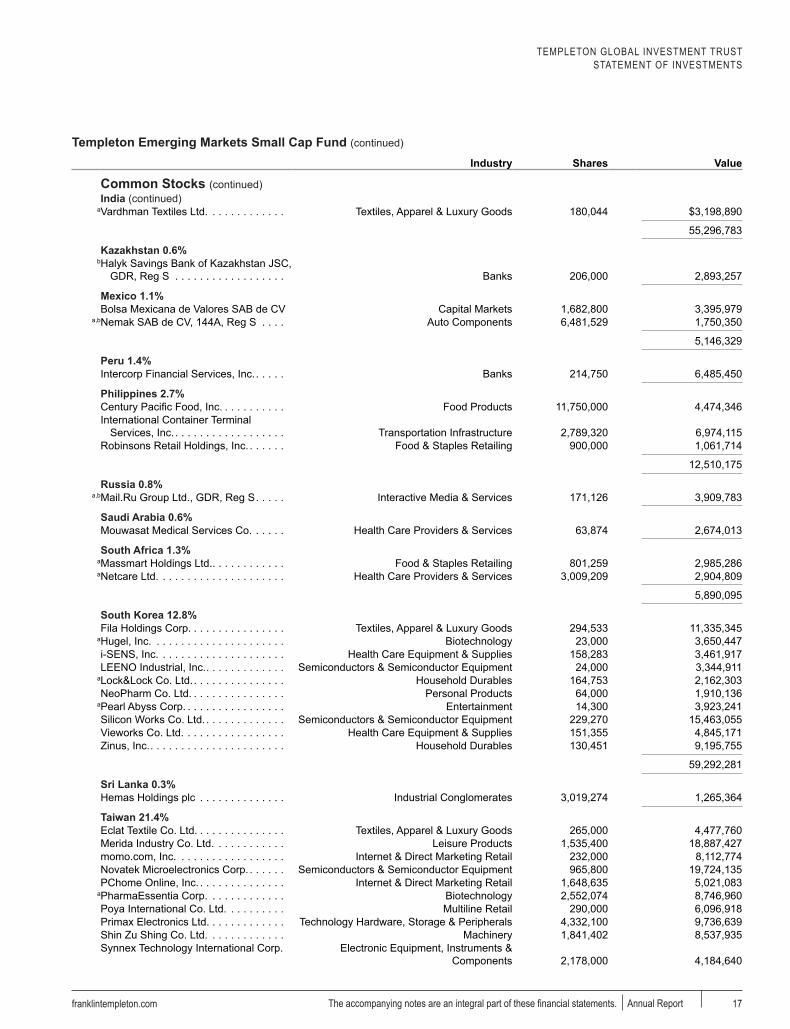
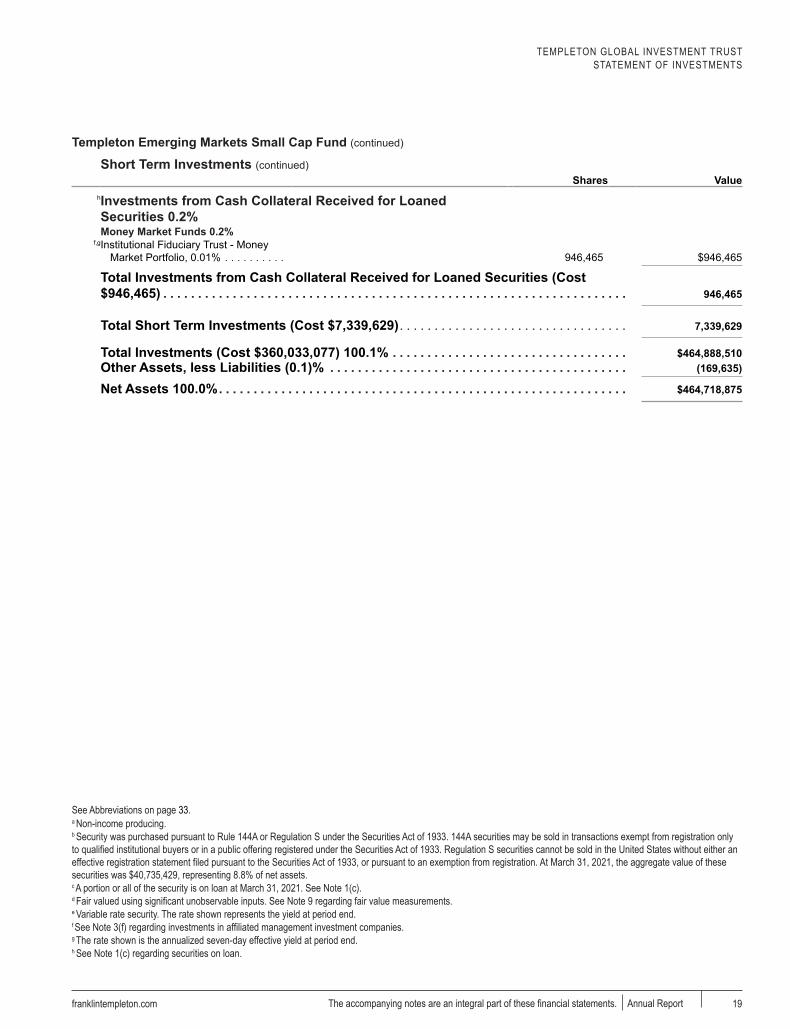
Statement of Investments, March 31, 2021Templeton Emerging Markets Small Cap Fund
franklintempleton.comAnnual Report The accompanying notes are an integral part of these financial statements.16
a a Industry Shares a Value a
Common Stocks 97.6% Brazil 4.2%Arezzo Industria e Comercio SA . . . . . Textiles, Apparel & Luxury Goods 236,100 $2,950,725Duratex SA . . . . . . . . . . . . . . . . . . . . . Paper & Forest Products 1,819,000 6,039,636Grendene SA . . . . . . . . . . . . . . . . . . . Textiles, Apparel & Luxury Goods 1,544,611 2,167,779Iguatemi Empresa de Shopping Centers
See Abbreviations on page 33.a Non-income producing.b Security was purchased pursuant to Rule 144A or Regulation S under the Securities Act of 1933. 144A securities may be sold in transactions exempt from registration only to qualified institutional buyers or in a public offering registered under the Securities Act of 1933. Regulation S securities cannot be sold in the United States without either an effective registration statement filed pursuant to the Securities Act of 1933, or pursuant to an exemption from registration. At March 31, 2021, the aggregate value of these securities was $40,735,429, representing 8.8% of net assets.c A portion or all of the security is on loan at March 31, 2021. See Note 1(c).d Fair valued using significant unobservable inputs. See Note 9 regarding fair value measurements.e Variable rate security. The rate shown represents the yield at period end.f See Note 3(f) regarding investments in affiliated management investment companies.g The rate shown is the annualized seven-day effective yield at period end.h See Note 1(c) regarding securities on loan.
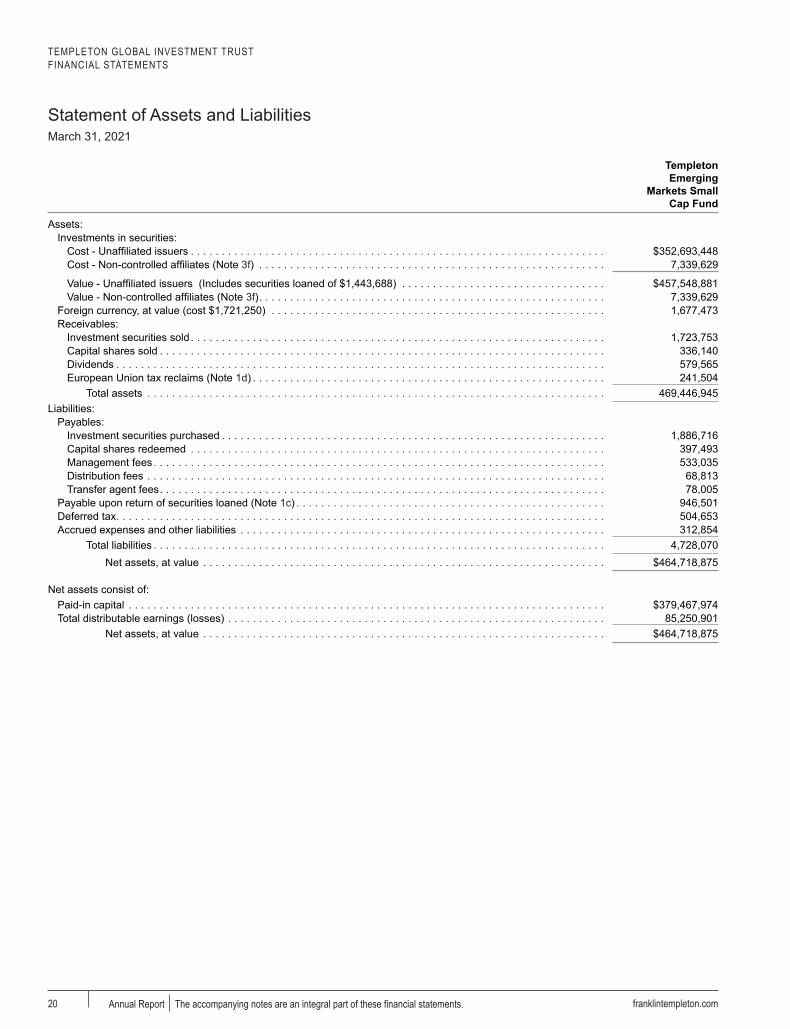
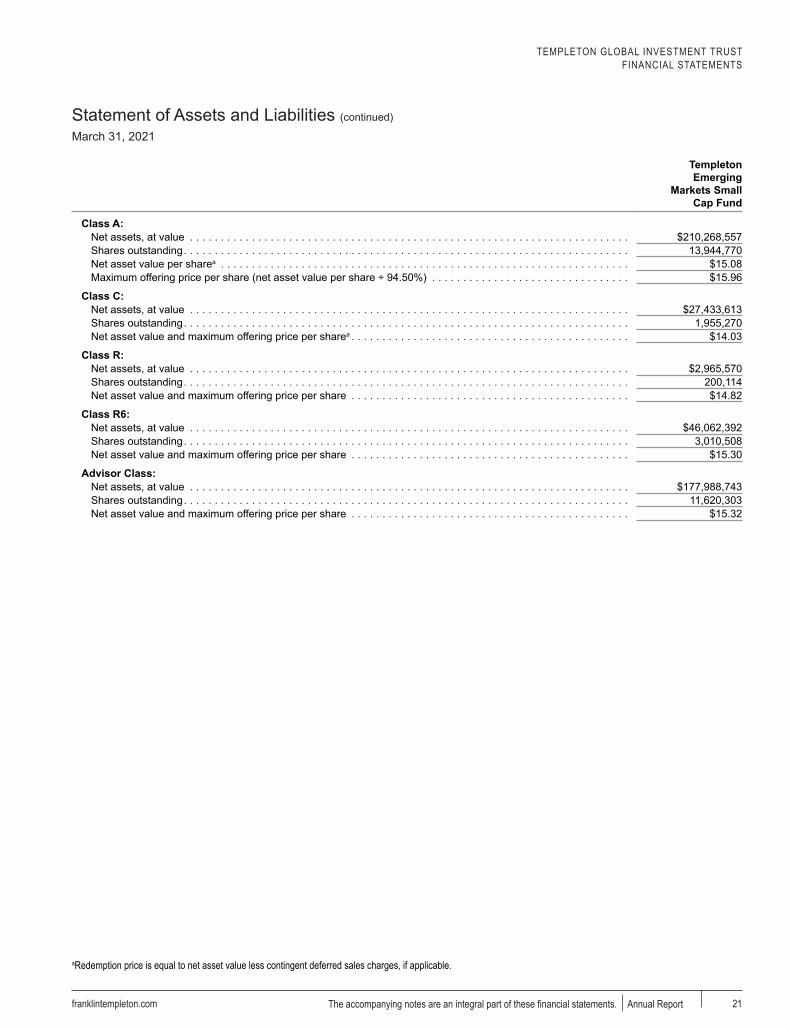
TEMPLETON GLOBAL INVESTMENT TRUSTFINANCIAL STATEMENTS
Statement of Assets and LiabilitiesMarch 31, 2021
franklintempleton.comAnnual Report The accompanying notes are an integral part of these financial statements.20
Notes to Financial StatementsTempleton Emerging Markets Small Cap Fund
24 franklintempleton.comAnnual Report
1.OrganizationandSignificantAccountingPolicies
Templeton Global Investment Trust (Trust) is registered under the Investment Company Act of 1940 (1940 Act) as an open-end management investment company, consisting of two separate funds and applies the specialized accounting and reporting guidance in U.S. Generally Accepted Accounting Principles (U.S. GAAP). Templeton Emerging Markets Small Cap Fund (Fund) is included in this report. The Fund offers five classes of shares: Class A, Class C, Class R, Class R6 and Advisor Class. Class C shares automatically convert to Class A shares after they have been held for 10 years. Each class of shares may differ by its initial sales load, contingent deferred sales charges, voting rights on matters affecting a single class, its exchange privilege and fees due to differing arrangements for distribution and transfer agent fees.
The following summarizes the Fund’s significant accounting policies.
a. Financial Instrument Valuation The Fund's investments in financial instruments are carried at fair value daily. Fair value is the price that would be received to sell an asset or paid to transfer a liability in an orderly transaction between market participants on the measurement date. The Fund calculates the net asset value (NAV) per share each business day as of 4 p.m. Eastern time or the regularly scheduled close of the New York Stock Exchange (NYSE), whichever is earlier. Under compliance policies and procedures approved by the Trust's Board of Trustees (the Board), the Fund's administrator has responsibility for oversight of valuation, including leading the cross-functional Valuation Committee (VC). The Fund may utilize independent pricing services, quotations from securities and financial instrument dealers, and other market sources to determine fair value.
Equity securities listed on an exchange or on the NASDAQ National Market System are valued at the last quoted sale price or the official closing price of the day, respectively. Foreign equity securities are valued as of the close of trading on the foreign stock exchange on which the security is primarily traded, or as of 4 p.m. Eastern time. The value is then converted into its U.S. dollar equivalent at the foreign exchange rate in effect at 4 p.m. Eastern time on the day that the value of the security is determined. Over-the-counter (OTC) securities are valued within the range of the most recent quoted bid and ask prices. Securities that trade
in multiple markets or on multiple exchanges are valued according to the broadest and most representative market. Certain equity securities are valued based upon fundamental characteristics or relationships to similar securities.
Investments in open-end mutual funds are valued at the closing NAV.
The Fund has procedures to determine the fair value of financial instruments for which market prices are not reliable or readily available. Under these procedures, the Fund primarily employs a market-based approach which may use related or comparable assets or liabilities, recent transactions, market multiples, book values, and other relevant information for the investment to determine the fair value of the investment. An income-based valuation approach may also be used in which the anticipated future cash flows of the investment are discounted to calculate fair value. Discounts may also be applied due to the nature or duration of any restrictions on the disposition of the investments. Due to the inherent uncertainty of valuations of such investments, the fair values may differ significantly from the values that would have been used had an active market existed.
Trading in securities on foreign securities stock exchanges and OTC markets may be completed before 4 p.m. Eastern time. In addition, trading in certain foreign markets may not take place on every Fund's business day. Events can occur between the time at which trading in a foreign security is completed and 4 p.m. Eastern time that might call into question the reliability of the value of a portfolio security held by the Fund. As a result, differences may arise between the value of the Fund's portfolio securities as determined at the foreign market close and the latest indications of value at 4 p.m. Eastern time. In order to minimize the potential for these differences, an independent pricing service may be used to adjust the value of the Fund’s portfolio securities to the latest indications of fair value at 4 p.m. Eastern time. At March 31, 2021, certain securities may have been fair valued using these procedures, in which case the securities were categorized as Level 2 inputs within the fair value hierarchy (referred to as “market level fair value”). See the Fair Value Measurements note for more information.
When the last day of the reporting period is a non-business day, certain foreign markets may be open on those days that the Fund's NAV is not calculated, which could result in differences between the value of the Fund's portfolio securities on the last business day and the last calendar day
TEMPLETON GLOBAL INVESTMENT TRUSTNOTES TO FINANCIAL STATEMENTS
25franklintempleton.com Annual Report
Templeton Emerging Markets Small Cap Fund (continued)
of the reporting period. Any security valuation changes due to an open foreign market are adjusted and reflected by the Fund for financial reporting purposes.
b. Foreign Currency Translation Portfolio securities and other assets and liabilities denominated in foreign currencies are translated into U.S. dollars based on the exchange rate of such currencies against U.S. dollars on the date of valuation. The Fund may enter into foreign currency exchange contracts to facilitate transactions denominated in a foreign currency. Purchases and sales of securities, income and expense items denominated in foreign currencies are translated into U.S. dollars at the exchange rate in effect on the transaction date. Portfolio securities and assets and liabilities denominated in foreign currencies contain risks that those currencies will decline in value relative to the U.S. dollar. Occasionally, events may impact the availability or reliability of foreign exchange rates used to convert the U.S. dollar equivalent value. If such an event occurs, the foreign exchange rate will be valued at fair value using procedures established and approved by the Board.
The Fund does not separately report the effect of changes in foreign exchange rates from changes in market prices on securities held. Such changes are included in net realized and unrealized gain or loss from investments in the Statement of Operations.
Realized foreign exchange gains or losses arise from sales of foreign currencies, currency gains or losses realized between the trade and settlement dates on securities transactions and the difference between the recorded amounts of dividends, interest, and foreign withholding taxes and the U.S. dollar equivalent of the amounts actually received or paid. Net unrealized foreign exchange gains and losses arise from changes in foreign exchange rates on foreign denominated assets and liabilities other than investments in securities held at the end of the reporting period.
c. Securities LendingThe Fund participates in an agency based securities lending program to earn additional income. The Fund receives collateral in the form of cash and/or U.S. Government and Agency securities against the loaned securities in an amount equal to at least 102% of the fair value of the loaned securities. Collateral is maintained over the life of the loan in an amount not less than 100% of the fair value of loaned securities, as determined at the close of Fund business each day; any additional collateral required due to changes in security values is delivered to the Fund on the next business day. Any cash collateral received is deposited into a joint cash account with other funds and is used to invest in a money market fund managed by Franklin Advisers, Inc., an affiliate of the Fund. Additionally, the Fund received $624,467 in U.S. Government and Agency securities as collateral. The Fund may receive income from the investment of cash collateral, in addition to lending fees and rebates paid by the borrower. Income from securities loaned, net of fees paid to the securities lending agent and/or third-party vendor, is reported separately in the Statement of Operations. The Fund bears the market risk with respect to any cash collateral investment, securities loaned, and the risk that the agent may default on its obligations to the Fund. If the borrower defaults on its obligation to return the securities loaned, the Fund has the right to repurchase the securities in the open market using the collateral received. The securities lending agent has agreed to indemnify the Fund in the event of default by a third party borrower.
d. Income and Deferred Taxes It is the Fund's policy to qualify as a regulated investment company under the Internal Revenue Code. The Fund intends to distribute to shareholders substantially all of its taxable income and net realized gains to relieve it from federal income and excise taxes. As a result, no provision for U.S. federal income taxes is required.
The Fund may be subject to foreign taxation related to income received, capital gains on the sale of securities and certain foreign currency transactions in the foreign jurisdictions in which it invests. Foreign taxes, if any, are recorded based on the tax regulations and rates that exist in the foreign markets in which the Fund invests. When a capital gain tax is determined to apply, the Fund records an estimated deferred tax liability in an amount that would be payable if the securities were disposed of on the valuation date.
TEMPLETON GLOBAL INVESTMENT TRUSTNOTES TO FINANCIAL STATEMENTS
26 franklintempleton.comAnnual Report
Templeton Emerging Markets Small Cap Fund (continued)
As a result of several court cases, in certain countries across the European Union, the Fund filed additional tax reclaims for previously withheld taxes on dividends earned in those countries (EU reclaims). These additional filings are subject to various administrative proceedings by the local jurisdictions’ tax authorities within the European Union, as well as a number of related judicial proceedings. Income recognized, if any, for EU reclaims is reflected as other income in the Statement of Operations and any related receivable, if any, is reflected as European Union tax reclaims in the Statement of Assets and Liabilities. When uncertainty exists as to the ultimate resolution of these proceedings, the likelihood of receipt of these EU reclaims, and the potential timing of payment, no amounts are reflected in the financial statements. For U.S. income tax purposes, EU reclaims received by the Fund, if any, reduce the amounts of foreign taxes Fund shareholders can use as tax credits in their individual income tax returns.
The Fund may recognize an income tax liability related to its uncertain tax positions under U.S. GAAP when the uncertain tax position has a less than 50% probability that it will be sustained upon examination by the tax authorities based on its technical merits. As of March 31, 2021, the Fund has determined that no tax liability is required in its financial statements related to uncertain tax positions for any open tax years (or expected to be taken in future tax years). Open tax years are those that remain subject to examination and are based on the statute of limitations in each jurisdiction in which the Fund invests.
e. Security Transactions, Investment Income, Expenses and DistributionsSecurity transactions are accounted for on trade date. Realized gains and losses on security transactions are determined on a specific identification basis. Estimated expenses are accrued daily. Dividend income is recorded on the ex-dividend date except for certain dividends from securities where the dividend rate is not available. In such cases, the dividend is recorded as soon as the information is received by the Fund. Distributions to shareholders are recorded on the ex-dividend date. Distributable earnings are determined according to income tax regulations (tax basis) and may differ from earnings recorded in accordance
with U.S. GAAP. These differences may be permanent or temporary. Permanent differences are reclassified among capital accounts to reflect their tax character. These reclassifications have no impact on net assets or the results of operations. Temporary differences are not reclassified, as they may reverse in subsequent periods.
Common expenses incurred by the Trust are allocated among the Funds based on the ratio of net assets of each Fund to the combined net assets of the Trust or based on the ratio of number of shareholders of each Fund to the combined number of shareholders of the Trust. Fund specific expenses are charged directly to the Fund that incurred the expense.
Realized and unrealized gains and losses and net investment income, excluding class specific expenses, are allocated daily to each class of shares based upon the relative proportion of net assets of each class. Differences in per share distributions by class are generally due to differences in class specific expenses.
f. Accounting EstimatesThe preparation of financial statements in accordance with U.S. GAAP requires management to make estimates and assumptions that affect the reported amounts of assets and liabilities at the date of the financial statements and the amounts of income and expenses during the reporting period. Actual results could differ from those estimates.
g.GuaranteesandIndemnificationsUnder the Trust’s organizational documents, its officers and trustees are indemnified by the Trust against certain liabilities arising out of the performance of their duties to the Trust. Additionally, in the normal course of business, the Trust, on behalf of the Fund, enters into contracts with service providers that contain general indemnification clauses. The Trust's maximum exposure under these arrangements is unknown as this would involve future claims that may be made against the Trust that have not yet occurred. Currently, the Trust expects the risk of loss to be remote.
aMay include a portion of Class C shares that were automatically converted to Class A.
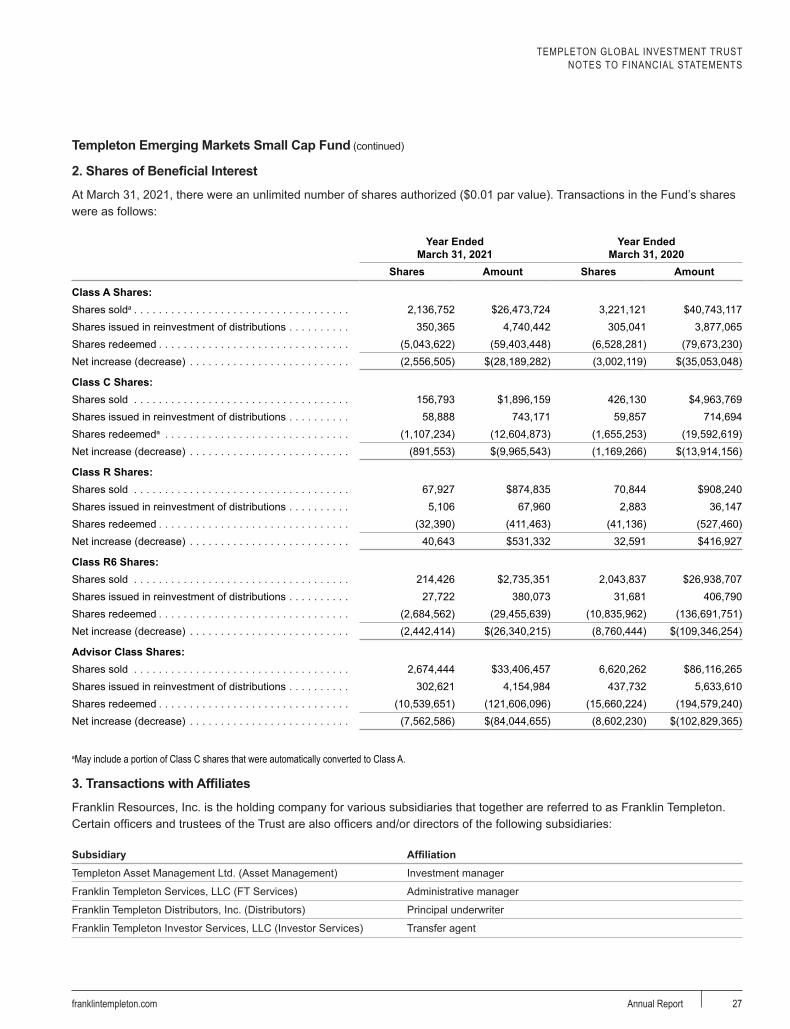
3.TransactionswithAffiliates
Franklin Resources, Inc. is the holding company for various subsidiaries that together are referred to as Franklin Templeton. Certain officers and trustees of the Trust are also officers and/or directors of the following subsidiaries:
Franklin Templeton Services, LLC (FT Services) Administrative manager
Franklin Templeton Distributors, Inc. (Distributors) Principal underwriter
Franklin Templeton Investor Services, LLC (Investor Services) Transfer agent
TEMPLETON GLOBAL INVESTMENT TRUSTNOTES TO FINANCIAL STATEMENTS
28 franklintempleton.comAnnual Report
Templeton Emerging Markets Small Cap Fund (continued)
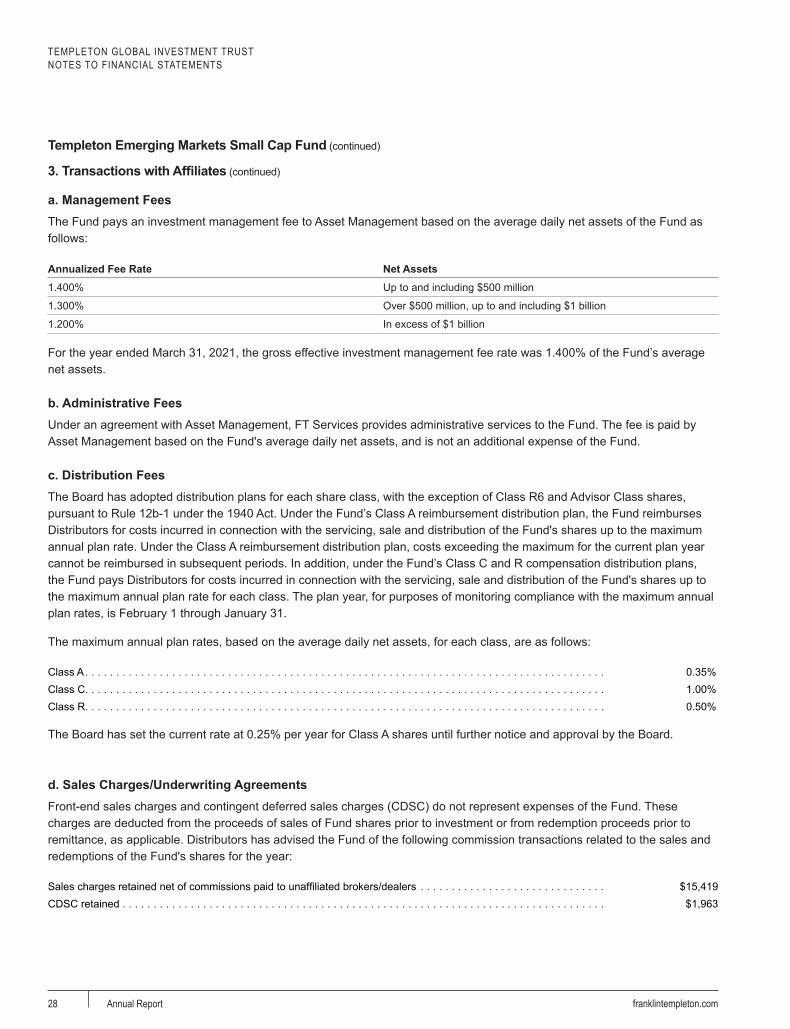
a. Management FeesThe Fund pays an investment management fee to Asset Management based on the average daily net assets of the Fund as follows:
Annualized Fee Rate Net Assets1.400% Up to and including $500 million
1.300% Over $500 million, up to and including $1 billion
1.200% In excess of $1 billion
For the year ended March 31, 2021, the gross effective investment management fee rate was 1.400% of the Fund’s average net assets.
b. Administrative FeesUnder an agreement with Asset Management, FT Services provides administrative services to the Fund. The fee is paid by Asset Management based on the Fund's average daily net assets, and is not an additional expense of the Fund.
c. Distribution FeesThe Board has adopted distribution plans for each share class, with the exception of Class R6 and Advisor Class shares, pursuant to Rule 12b-1 under the 1940 Act. Under the Fund’s Class A reimbursement distribution plan, the Fund reimburses Distributors for costs incurred in connection with the servicing, sale and distribution of the Fund's shares up to the maximum annual plan rate. Under the Class A reimbursement distribution plan, costs exceeding the maximum for the current plan year cannot be reimbursed in subsequent periods. In addition, under the Fund’s Class C and R compensation distribution plans, the Fund pays Distributors for costs incurred in connection with the servicing, sale and distribution of the Fund's shares up to the maximum annual plan rate for each class. The plan year, for purposes of monitoring compliance with the maximum annual plan rates, is February 1 through January 31.
The maximum annual plan rates, based on the average daily net assets, for each class, are as follows:
The Board has set the current rate at 0.25% per year for Class A shares until further notice and approval by the Board.
d. Sales Charges/Underwriting AgreementsFront-end sales charges and contingent deferred sales charges (CDSC) do not represent expenses of the Fund. These charges are deducted from the proceeds of sales of Fund shares prior to investment or from redemption proceeds prior to remittance, as applicable. Distributors has advised the Fund of the following commission transactions related to the sales and redemptions of the Fund's shares for the year:
TEMPLETON GLOBAL INVESTMENT TRUSTNOTES TO FINANCIAL STATEMENTS
29franklintempleton.com Annual Report
Templeton Emerging Markets Small Cap Fund (continued)
e. Transfer Agent FeesEach class of shares pays transfer agent fees to Investor Services for its performance of shareholder servicing obligations. The fees are based on an annualized asset based fee of 0.02% plus a transaction based fee. In addition, each class reimburses Investor Services for out of pocket expenses incurred and, except for Class R6, reimburses shareholder servicing fees paid to third parties. These fees are allocated daily based upon their relative proportion of such classes' aggregate net assets. Class R6 pays Investor Services transfer agent fees specific to that class.
For the year ended March 31, 2021, the Fund paid transfer agent fees of $700,685, of which $265,029 was retained by Investor Services.
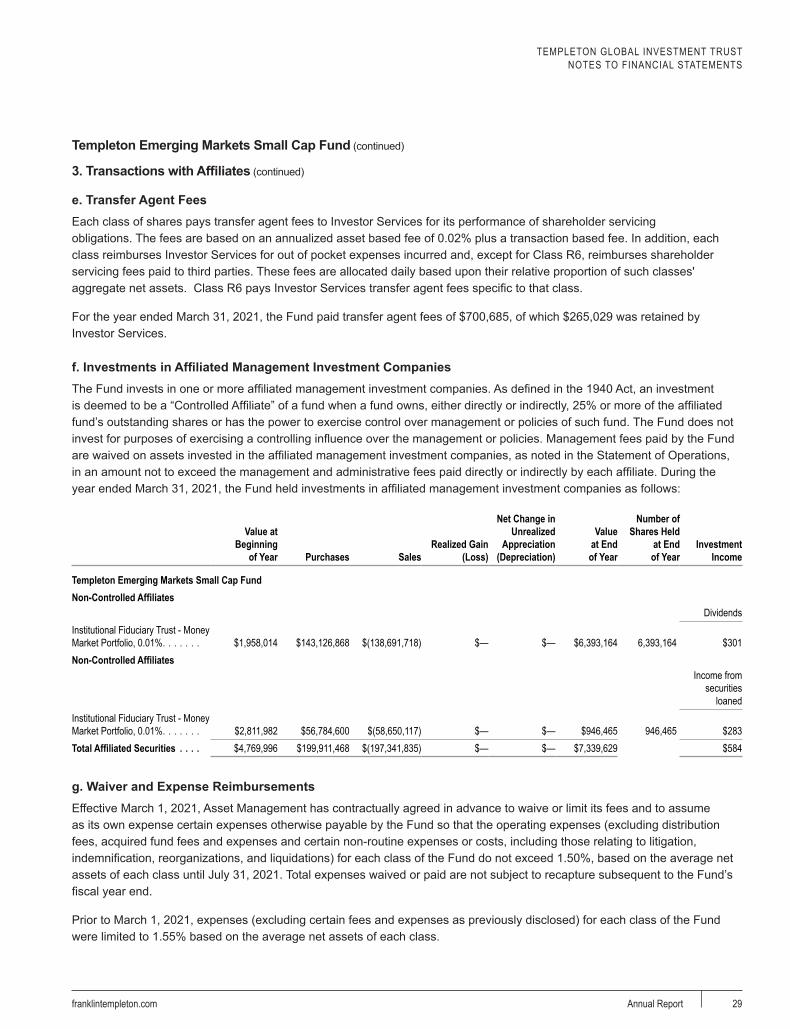
f.InvestmentsinAffiliatedManagementInvestmentCompaniesThe Fund invests in one or more affiliated management investment companies. As defined in the 1940 Act, an investment is deemed to be a “Controlled Affiliate” of a fund when a fund owns, either directly or indirectly, 25% or more of the affiliated fund’s outstanding shares or has the power to exercise control over management or policies of such fund. The Fund does not invest for purposes of exercising a controlling influence over the management or policies. Management fees paid by the Fund are waived on assets invested in the affiliated management investment companies, as noted in the Statement of Operations, in an amount not to exceed the management and administrative fees paid directly or indirectly by each affiliate. During the year ended March 31, 2021, the Fund held investments in affiliated management investment companies as follows:
aa
Value at Beginning
of Year Purchases SalesRealized Gain
(Loss)
Net Change in Unrealized
Appreciation (Depreciation)
Value at End of Year
Number of Shares Held
at End of Year
Investment Income
a a a a a a a a
Templeton Emerging Markets Small Cap FundNon-Controlled Affiliates
g. Waiver and Expense ReimbursementsEffective March 1, 2021, Asset Management has contractually agreed in advance to waive or limit its fees and to assume as its own expense certain expenses otherwise payable by the Fund so that the operating expenses (excluding distribution fees, acquired fund fees and expenses and certain non-routine expenses or costs, including those relating to litigation, indemnification, reorganizations, and liquidations) for each class of the Fund do not exceed 1.50%, based on the average net assets of each class until July 31, 2021. Total expenses waived or paid are not subject to recapture subsequent to the Fund’s fiscal year end.
Prior to March 1, 2021, expenses (excluding certain fees and expenses as previously disclosed) for each class of the Fund were limited to 1.55% based on the average net assets of each class.
3.TransactionswithAffiliates (continued)
TEMPLETON GLOBAL INVESTMENT TRUSTNOTES TO FINANCIAL STATEMENTS
30 franklintempleton.comAnnual Report
Templeton Emerging Markets Small Cap Fund (continued)
Investor Services has contractually agreed in advance to waive or limit its fees so that the Class R6 transfer agent fees do not exceed 0.03% based on the average net assets of the class until July 31, 2021.
4. Income Taxes
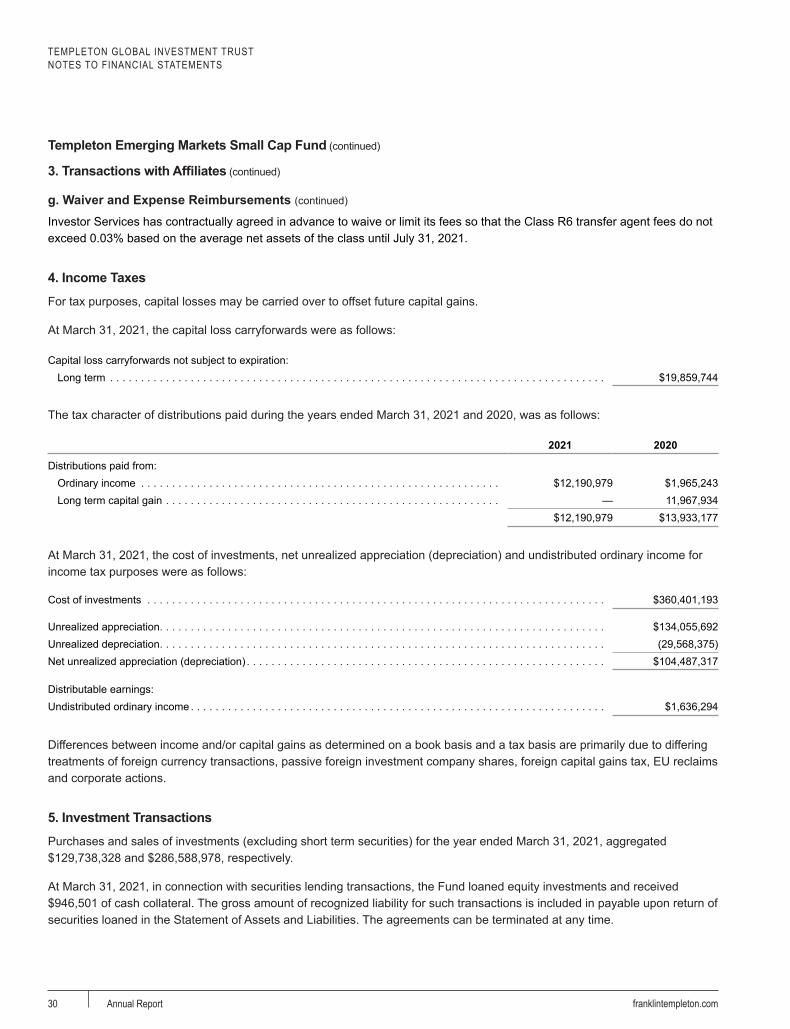
For tax purposes, capital losses may be carried over to offset future capital gains.
At March 31, 2021, the capital loss carryforwards were as follows:
At March 31, 2021, the cost of investments, net unrealized appreciation (depreciation) and undistributed ordinary income for income tax purposes were as follows:
Differences between income and/or capital gains as determined on a book basis and a tax basis are primarily due to differing treatments of foreign currency transactions, passive foreign investment company shares, foreign capital gains tax, EU reclaims and corporate actions.
5. Investment Transactions
Purchases and sales of investments (excluding short term securities) for the year ended March 31, 2021, aggregated $129,738,328 and $286,588,978, respectively.
At March 31, 2021, in connection with securities lending transactions, the Fund loaned equity investments and received $946,501 of cash collateral. The gross amount of recognized liability for such transactions is included in payable upon return of securities loaned in the Statement of Assets and Liabilities. The agreements can be terminated at any time.
3.TransactionswithAffiliates (continued)
g. Waiver and Expense Reimbursements (continued)
TEMPLETON GLOBAL INVESTMENT TRUSTNOTES TO FINANCIAL STATEMENTS
31franklintempleton.com Annual Report
Templeton Emerging Markets Small Cap Fund (continued)
6. Concentration of Risk
Investing in foreign securities may include certain risks and considerations not typically associated with investing in U.S. securities, such as fluctuating currency values and changing local, regional and global economic, political and social conditions, which may result in greater market volatility. Political and financial uncertainty in many foreign regions may increase market volatility and the economic risk of investing in foreign securities. In addition, certain foreign securities may not be as liquid as U.S. securities.
7. Novel Coronavirus Pandemic
The global outbreak of the novel coronavirus disease, known as COVID-19, has caused adverse effects on many companies, sectors, nations, regions and the markets in general, and may continue for an unpredictable duration. The effects of this pandemic may materially impact the value and performance of the Fund, its ability to buy and sell fund investments at appropriate valuations and its ability to achieve its investment objectives.
8. Credit Facility
The Fund, together with other U.S. registered and foreign investment funds (collectively, Borrowers), managed by Franklin Templeton, are borrowers in a joint syndicated senior unsecured credit facility totaling $2.675 billion (Global Credit Facility) which matures on February 4, 2022. This Global Credit Facility provides a source of funds to the Borrowers for temporary and emergency purposes, including the ability to meet future unanticipated or unusually large redemption requests.
Under the terms of the Global Credit Facility, the Fund shall, in addition to interest charged on any borrowings made by the Fund and other costs incurred by the Fund, pay its share of fees and expenses incurred in connection with the implementation and maintenance of the Global Credit Facility, based upon its relative share of the aggregate net assets of all of the Borrowers, including an annual commitment fee of 0.15% based upon the unused portion of the Global Credit Facility. These fees are reflected in other expenses in the Statement of Operations. During the year ended March 31, 2021, the Fund did not use the Global Credit Facility.
9. Fair Value Measurements
The Fund follows a fair value hierarchy that distinguishes between market data obtained from independent sources (observable inputs) and the Fund's own market assumptions (unobservable inputs). These inputs are used in determining the value of the Fund's financial instruments and are summarized in the following fair value hierarchy:
• Level 1 – quoted prices in active markets for identical financial instruments
• Level 2 – other significant observable inputs (including quoted prices for similar financial instruments, interest rates, prepayment speed, credit risk, etc.)
• Level 3 – significant unobservable inputs (including the Fund's own assumptions in determining the fair value of financial instruments)
TEMPLETON GLOBAL INVESTMENT TRUSTNOTES TO FINANCIAL STATEMENTS
32 franklintempleton.comAnnual Report
Templeton Emerging Markets Small Cap Fund (continued)
The input levels are not necessarily an indication of the risk or liquidity associated with financial instruments at that level.
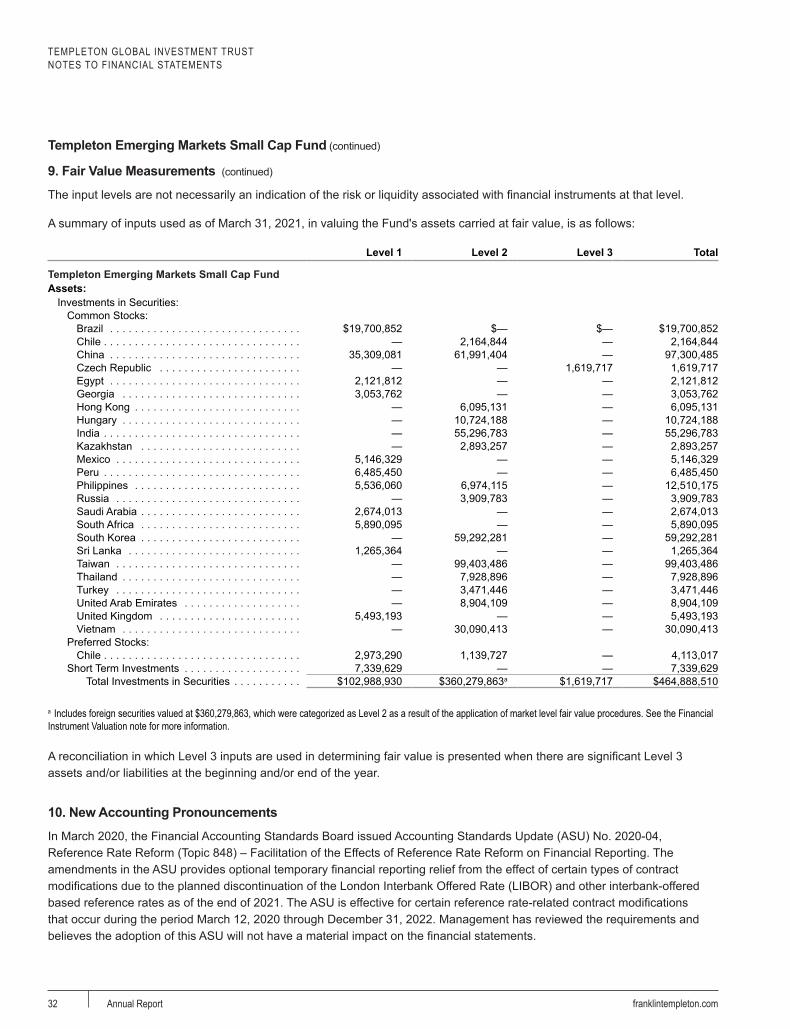
A summary of inputs used as of March 31, 2021, in valuing the Fund's assets carried at fair value, is as follows:
a Includes foreign securities valued at $360,279,863, which were categorized as Level 2 as a result of the application of market level fair value procedures. See the Financial Instrument Valuation note for more information. A reconciliation in which Level 3 inputs are used in determining fair value is presented when there are significant Level 3 assets and/or liabilities at the beginning and/or end of the year.
10. New Accounting Pronouncements
In March 2020, the Financial Accounting Standards Board issued Accounting Standards Update (ASU) No. 2020-04, Reference Rate Reform (Topic 848) – Facilitation of the Effects of Reference Rate Reform on Financial Reporting. The amendments in the ASU provides optional temporary financial reporting relief from the effect of certain types of contract modifications due to the planned discontinuation of the London Interbank Offered Rate (LIBOR) and other interbank-offered based reference rates as of the end of 2021. The ASU is effective for certain reference rate-related contract modifications that occur during the period March 12, 2020 through December 31, 2022. Management has reviewed the requirements and believes the adoption of this ASU will not have a material impact on the financial statements.
9. Fair Value Measurements (continued)
TEMPLETON GLOBAL INVESTMENT TRUSTNOTES TO FINANCIAL STATEMENTS
33franklintempleton.com Annual Report
Templeton Emerging Markets Small Cap Fund (continued)
11. Subsequent Events
The Fund has evaluated subsequent events through the issuance of the financial statements and determined that no events have occurred that require disclosure.
Abbreviations
Selected PortfolioADR American Depositary ReceiptGDR Global Depositary Receipt
TEMPLETON GLOBAL INVESTMENT TRUST
Report of Independent Registered Public Accounting Firm
34 franklintempleton.comAnnual Report
To the Board of Trustees of Templeton Global Investment Trust of and Shareholders of Templeton Emerging Markets Small Cap Fund
Opinion on the Financial Statements
We have audited the accompanying statement of assets and liabilities, including the statement of investments, of Templeton Emerging Markets Small Cap Fund (one of the funds constituting Templeton Global Investment Trust, hereafter collectively referred to as the "Fund") as of March 31, 2021, the related statement of operations for the year ended March 31, 2021, the statement of changes in net assets for each of the two years in the period ended March 31, 2021, including the related notes, and the financial highlights for each of the periods indicated therein (collectively referred to as the “financial statements”). In our opinion, the financial statements present fairly, in all material respects, the financial position of the Fund as of March 31, 2021, the results of its operations for the year then ended, the changes in its net assets for each of the two years in the period ended March 31, 2021 and the financial highlights for each of the periods indicated therein in conformity with accounting principles generally accepted in the United States of America.
Basis for Opinion
These financial statements are the responsibility of the Fund’s management. Our responsibility is to express an opinion on the Fund’s financial statements based on our audits. We are a public accounting firm registered with the Public Company Accounting Oversight Board (United States) (“PCAOB”) and are required to be independent with respect to the Fund in accordance with the U.S. federal securities laws and the applicable rules and regulations of the Securities and Exchange Commission and the PCAOB.
We conducted our audits of these financial statements in accordance with the standards of the PCAOB. Those standards require that we plan and perform the audit to obtain reasonable assurance about whether the financial statements are free of material misstatement, whether due to error or fraud.
Our audits included performing procedures to assess the risks of material misstatement of the financial statements, whether due to error or fraud, and performing procedures that respond to those risks. Such procedures included examining, on a test basis, evidence regarding the amounts and disclosures in the financial statements. Our audits also included evaluating the accounting principles used and significant estimates made by management, as well as evaluating the overall presentation of the financial statements. Our procedures included confirmation of securities owned as of March 31, 2021 by correspondence with the custodian, transfer agent and brokers; when replies were not received from the brokers, we performed other auditing procedures. We believe that our audits provide a reasonable basis for our opinion.
PricewaterhouseCoopers LLP
San Francisco, CaliforniaMay 20, 2021
We have served as the auditor of one or more investment companies in the Franklin Templeton Group of Funds since 1948.
TEMPLETON GLOBAL INVESTMENT TRUST
Tax Information (unaudited)
35franklintempleton.com Annual Report
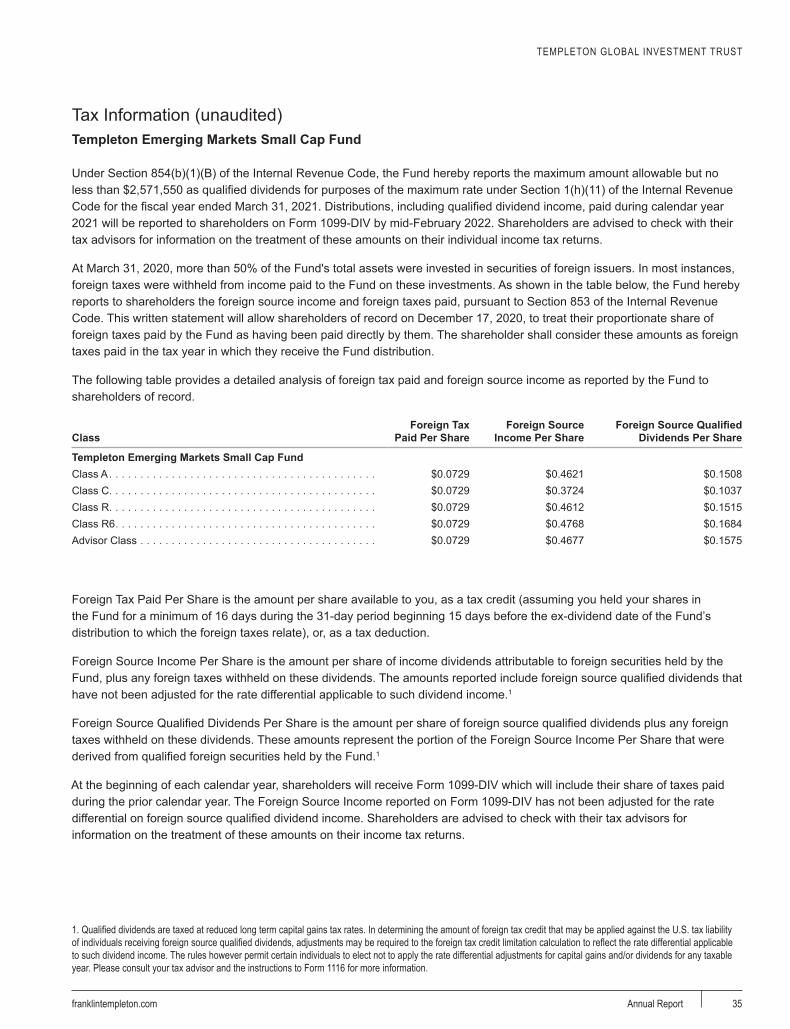
Templeton Emerging Markets Small Cap Fund Under Section 854(b)(1)(B) of the Internal Revenue Code, the Fund hereby reports the maximum amount allowable but no less than $2,571,550 as qualified dividends for purposes of the maximum rate under Section 1(h)(11) of the Internal Revenue Code for the fiscal year ended March 31, 2021. Distributions, including qualified dividend income, paid during calendar year 2021 will be reported to shareholders on Form 1099-DIV by mid-February 2022. Shareholders are advised to check with their tax advisors for information on the treatment of these amounts on their individual income tax returns.
At March 31, 2020, more than 50% of the Fund's total assets were invested in securities of foreign issuers. In most instances, foreign taxes were withheld from income paid to the Fund on these investments. As shown in the table below, the Fund hereby reports to shareholders the foreign source income and foreign taxes paid, pursuant to Section 853 of the Internal Revenue Code. This written statement will allow shareholders of record on December 17, 2020, to treat their proportionate share of foreign taxes paid by the Fund as having been paid directly by them. The shareholder shall consider these amounts as foreign taxes paid in the tax year in which they receive the Fund distribution.
The following table provides a detailed analysis of foreign tax paid and foreign source income as reported by the Fund to shareholders of record.
Foreign Tax Paid Per Share is the amount per share available to you, as a tax credit (assuming you held your shares in the Fund for a minimum of 16 days during the 31-day period beginning 15 days before the ex-dividend date of the Fund’s distribution to which the foreign taxes relate), or, as a tax deduction.
Foreign Source Income Per Share is the amount per share of income dividends attributable to foreign securities held by the Fund, plus any foreign taxes withheld on these dividends. The amounts reported include foreign source qualified dividends that have not been adjusted for the rate differential applicable to such dividend income.1
Foreign Source Qualified Dividends Per Share is the amount per share of foreign source qualified dividends plus any foreign taxes withheld on these dividends. These amounts represent the portion of the Foreign Source Income Per Share that were derived from qualified foreign securities held by the Fund.1
At the beginning of each calendar year, shareholders will receive Form 1099-DIV which will include their share of taxes paid during the prior calendar year. The Foreign Source Income reported on Form 1099-DIV has not been adjusted for the rate differential on foreign source qualified dividend income. Shareholders are advised to check with their tax advisors for information on the treatment of these amounts on their income tax returns.
1. Qualified dividends are taxed at reduced long term capital gains tax rates. In determining the amount of foreign tax credit that may be applied against the U.S. tax liability of individuals receiving foreign source qualified dividends, adjustments may be required to the foreign tax credit limitation calculation to reflect the rate differential applicable to such dividend income. The rules however permit certain individuals to elect not to apply the rate differential adjustments for capital gains and/or dividends for any taxable year. Please consult your tax advisor and the instructions to Form 1116 for more information.
TEMPLETON GLOBAL INVESTMENT TRUST
Board Members and Officers
36 franklintempleton.comAnnual Report
The name, year of birth and address of the officers and board members, as well as their affiliations, positions held with the Trust, principal occupations during at least the past five years and number of U.S. registered portfolios overseen in the Franklin Templeton fund complex, are shown below. Generally, each board member serves until that person’s successor is elected and qualified.
Independent Board Members
Name, Year of Birth and Address Position
Length of Time Served
Number of Portfolios in Fund Complex Overseen by Board Member*
Other Directorships Held During at Least the Past 5 Years
Harris J. Ashton (1932) Trustee Since 1994 126 Bar-S Foods (meat packing company) (1981-2010).300 S.E. 2nd Street
Fort Lauderdale, FL 33301-1923
Principal Occupation During at Least the Past 5 Years:Director of various companies; and formerly, Director, RBC Holdings, Inc. (bank holding company) (until 2002); and President, Chief Executive Officer and Chairman of the Board, General Host Corporation (nursery and craft centers) (until 1998).
Ann Torre Bates (1958) Trustee Since 2008 30 Ares Capital Corporation (specialty finance company) (2010-present), United Natural Foods, Inc. (distributor of natural, organic and specialty foods) (2013-present), formerly, Allied Capital Corporation (financial services) (2003-2010), SLM Corporation (Sallie Mae) (1997-2014) and Navient Corporation (loan management, servicing and asset recovery) (2014-2016).
300 S.E. 2nd Street Fort Lauderdale, FL 33301-1923
Principal Occupation During at Least the Past 5 Years:Director of various companies; and formerly, Executive Vice President and Chief Financial Officer, NHP Incorporated (manager of multifamily housing) (1995-1997); and Vice President and Treasurer, US Airways, Inc. (until 1995).
Mary C. Choksi (1950) Trustee Since 2017 126 Omnicom Group Inc. (advertising and marketing communications services) (2011-present) and White Mountains Insurance Group, Ltd. (holding company) (2017-present); and formerly, Avis Budget Group Inc. (car rental) (2007-2020).
300 S.E. 2nd Street Fort Lauderdale, FL 33301-1923
Principal Occupation During at Least the Past 5 Years:Director of various companies; and formerly, Founder and Senior Advisor, Strategic Investment Group (investment management group) (2015-2017); Founding Partner and Senior Managing Director, Strategic Investment Group (1987-2015); Founding Partner and Managing Director, Emerging Markets Management LLC (investment management firm) (1987-2011); and Loan Officer/Senior Loan Officer/Senior Pension Investment Officer, World Bank Group (international financial institution) (1977-1987).
TEMPLETON GLOBAL INVESTMENT TRUST
37franklintempleton.com Annual Report
Name, Year of Birth and Address Position
Length of Time Served
Number of Portfolios in Fund Complex Overseen by Board Member*
Other Directorships Held During at Least the Past 5 Years
Edith E. Holiday (1952) LeadIndependent Trustee
Trustee since 1996 and Lead Independent Trustee since 2007
126 Hess Corporation (exploration of oil and gas) (1993-present), Canadian National Railway (railroad) (2001-present), White Mountains Insurance Group, Ltd. (holding company) (2004-present), Santander Consumer USA Holdings, Inc. (consumer finance) (2016-present); Santander Holdings USA (holding company) (2019-present); and formerly, RTI International Metals, Inc. (manufacture and distribution of titanium) (1999-2015) and H.J. Heinz Company (processed foods and allied products) (1994-2013).
300 S.E. 2nd Street Fort Lauderdale, FL 33301-1923
Principal Occupation During at Least the Past 5 Years:Director or Trustee of various companies and trusts; and formerly, Assistant to the President of the United States and Secretary of the Cabinet (1990-1993); General Counsel to the United States Treasury Department (1989-1990); and Counselor to the Secretary and Assistant Secretary for Public Affairs and Public Liaison-United States Treasury Department (1988-1989).
J. Michael Luttig (1954) Trustee Since 2009 126 Boeing Capital Corporation (aircraft financing) (2006-2010).300 S.E. 2nd Street
Fort Lauderdale, FL 33301-1923
Principal Occupation During at Least the Past 5 Years:Private investor; and formerly, Counselor and Senior Advisor to the Chairman, CEO, and Board of Directors, of The Boeing Company (aerospace company), and member of the Executive Council (May 2019-January 1, 2020); Executive Vice President, General Counsel and member of the Executive Council, The Boeing Company (2006-2019); and Federal Appeals Court Judge, United States Court of Appeals for the Fourth Circuit (1991-2006).
David W. Niemiec (1949) Trustee Since 2006 30 Hess Midstream LP (oil and gas midstream infrastructure) (2017-present).
300 S.E. 2nd Street Fort Lauderdale, FL 33301-1923
Principal Occupation During at Least the Past 5 Years:Advisor, Saratoga Partners (private equity fund); and formerly, Managing Director, Saratoga Partners (1998-2001) and SBC Warburg Dillon Read (investment banking) (1997-1998); Vice Chairman, Dillon, Read & Co. Inc. (investment banking) (1991-1997); and Chief Financial Officer, Dillon, Read & Co. Inc. (1982-1997).
Larry D. Thompson (1945) Trustee Since 2006 126 Graham Holdings Company (education and media organization) (2011-present); and formerly, The Southern Company (energy company) (2014-2020; previously 2010-2012) and Cbeyond, Inc. (business communications provider) (2010-2012).
300 S.E. 2nd Street Fort Lauderdale, FL 33301-1923
Principal Occupation During at Least the Past 5 Years:Director of various companies; Counsel, Finch McCranie, LLP (law firm) (2015-present); John A. Sibley Professor of Corporate and Business Law, University of Georgia School of Law (2015-present; previously 2011-2012); and formerly, Independent Compliance Monitor and Auditor, Volkswagen AG (manufacturer of automobiles and commercial vehicles) (2017- 2020); Executive Vice President - Government Affairs, General Counsel and Corporate Secretary, PepsiCo, Inc. (consumer products) (2012-2014); Senior Vice President - Government Affairs, General Counsel and Secretary, PepsiCo, Inc. (2004-2011); Senior Fellow of The Brookings Institution (2003-2004); Visiting Professor, University of Georgia School of Law (2004); and Deputy Attorney General, U.S. Department of Justice (2001-2003).
Independent Board Members (continued)
TEMPLETON GLOBAL INVESTMENT TRUST
38 franklintempleton.comAnnual Report
Name, Year of Birth and Address Position
Length of Time Served
Number of Portfolios in Fund Complex Overseen by Board Member*
Other Directorships Held During at Least the Past 5 Years
Constantine D. Tseretopoulos (1954)
Trustee Since 2001 19 None
300 S.E. 2nd Street Fort Lauderdale, FL 33301-1923
Principal Occupation During at Least the Past 5 Years:Physician, Chief of Staff, owner and operator of the Lyford Cay Hospital (1987-present); director of various nonprofit organizations; and formerly, Cardiology Fellow, University of Maryland (1985-1987); and Internal Medicine Resident, Greater Baltimore Medical Center (1982-1985).
Robert E. Wade (1946) Trustee Since 2006 30 El Oro Ltd (investments) (2003-2019).300 S.E. 2nd Street
Fort Lauderdale, FL 33301-1923
Principal Occupation During at Least the Past 5 Years:Attorney at law engaged in private practice as a sole practitioner (1972-2008) and member of various boards.
Interested Board Members and Officers**Gregory E. Johnson (1961)
Trustee Since 2006 137 None
One Franklin ParkwaySan Mateo, CA 94403-1906
Principal Occupation During at Least the Past 5 Years:Executive Chairman, Chairman of the Board and Director, Franklin Resources, Inc.; officer and/or director or trustee, as the case may be, of some of the other subsidiaries of Franklin Resources, Inc. and of 39 of the investment companies in Franklin Templeton; Vice Chairman, Investment Company Institute; and formerly, Chief Executive Officer (2013-2020) and President (1994-2015), Franklin Resources, Inc.
**Rupert H. Johnson, Jr. (1940)
Chairman of the Board, Trustee and Vice President
Chairman of the Board and Trustee since 2013 and Vice President since 1996
126 None
One Franklin ParkwaySan Mateo, CA 94403-1906
Principal Occupation During at Least the Past 5 Years:Director (Vice Chairman), Franklin Resources, Inc.; Director, Franklin Advisers, Inc.; and officer and/or director or trustee, as the case may be, of some of the other subsidiaries of Franklin Resources, Inc. and of 37 of the investment companies in Franklin Templeton.
Alan Bartlett (1970) President and Chief Executive Office – Investment Management
Since 2019 Not Applicable NoneLyford CayNassau, Bahamas
Principal Occupation During at Least the Past 5 Years:President and Director, Templeton Global Advisors Limited; Chief Investment Officer of Templeton Global Equity Group; officer of five of the investment companies in Franklin Templeton; Chairman of the Board, Goodhart Partners; and formerly, Chief Executive Officer, Goodhart Partners (2009-2019).
Alison E. Baur (1964) Vice President Since 2012 Not Applicable Not ApplicableOne Franklin ParkwaySan Mateo, CA 94403-1906
Principal Occupation During at Least the Past 5 Years:Deputy General Counsel, Franklin Templeton; and officer of some of the other subsidiaries of Franklin Resources, Inc. and of 42 of the investment companies in Franklin Templeton.
Independent Board Members (continued)
TEMPLETON GLOBAL INVESTMENT TRUST
39franklintempleton.com Annual Report
Name, Year of Birth and Address Position
Length of Time Served
Number of Portfolios in Fund Complex Overseen by Board Member*
Other Directorships Held During at Least the Past 5 Years
Breda M. Beckerle (1958) Chief Compliance Officer
Since October 2020 Not Applicable Not Applicable280 Park Avenue New York, NY 10017
Principal Occupation During at Least the Past 5 Years:Chief Compliance Officer, Fiduciary Investment Management International, Inc., Franklin Advisers, Inc., Franklin Advisory Services, LLC, Franklin Mutual Advisers, LLC, Franklin Templeton Institutional, LLC; and officer of 42 of the investment companies in Franklin Templeton
Steven J. Gray (1955) Vice President Since 2009 Not Applicable Not ApplicableOne Franklin ParkwaySan Mateo, CA 94403-1906
Principal Occupation During at Least the Past 5 Years:Senior Associate General Counsel, Franklin Templeton; Vice President, Franklin Templeton Distributors, Inc. and FASA, LLC; and officer of 42 of the investment companies in Franklin Templeton.
Matthew T. Hinkle (1971) Chief Executive Officer – Finance and Administration
Since 2017 Not Applicable Not ApplicableOne Franklin ParkwaySan Mateo, CA 94403-1906
Principal Occupation During at Least the Past 5 Years:Senior Vice President, Franklin Templeton Services, LLC; officer of 42 of the investment companies in Franklin Templeton; and formerly, Vice President, Global Tax (2012-April 2017) and Treasurer/Assistant Treasurer, Franklin Templeton (2009-2017).
Robert G. Kubilis (1973) Chief Financial Officer, Chief Accounting Officer and Treasurer
Since 2017 Not Applicable Not Applicable300 S.E. 2nd Street Fort Lauderdale, FL 33301-1923
Principal Occupation During at Least the Past 5 Years:Treasurer, U.S. Fund Administration & Reporting and officer of 39 of the investment companies in Franklin Templeton.
Robert Lim (1948) Vice President – AML Compliance
Since 2016 Not Applicable Not ApplicableOne Franklin ParkwaySan Mateo, CA 94403-1906
Principal Occupation During at Least the Past 5 Years:Vice President, Franklin Templeton Companies, LLC; Chief Compliance Officer, Franklin Templeton Distributors, Inc. and Franklin Templeton Investor Services, LLC; and officer of 42 of the investment companies in Franklin Templeton.
NavidJ.Tofigh(1972) Vice President Since 2015 Not Applicable Not ApplicableOne Franklin ParkwaySan Mateo, CA 94403-1906
Principal Occupation During at Least the Past 5 Years:Associate General Counsel and officer of 42 of the investment companies in Franklin Templeton.
Craig S. Tyle (1960) Vice President Since 2005 Not Applicable Not ApplicableOne Franklin ParkwaySan Mateo, CA 94403-1906
Principal Occupation During at Least the Past 5 Years:General Counsel and Executive Vice President, Franklin Resources, Inc.; and officer of some of the other subsidiaries of Franklin Resources, Inc. and of 42 of the investment companies in Franklin Templeton.
Interested Board Members and Officers (continued)
TEMPLETON GLOBAL INVESTMENT TRUST
40 franklintempleton.comAnnual Report
Name, Year of Birth and Address Position
Length of Time Served
Number of Portfolios in Fund Complex Overseen by Board Member*
Other Directorships Held During at Least the Past 5 Years
Lori A. Weber (1964) Vice President and Secretary
Vice President since 2011 and Secretary since 2013
Not Applicable Not Applicable300 S.E. 2nd Street Fort Lauderdale, FL 33301-1923
Principal Occupation During at Least the Past 5 Years:Senior Associate General Counsel, Franklin Templeton; Assistant Secretary, Franklin Resources, Inc.; Vice President and Secretary, Templeton Investment Counsel, LLC; and officer of 42 of the investment companies in Franklin Templeton.
*We base the number of portfolios on each separate series of the U.S. registered investment companies within the Franklin Templeton fund complex. These portfolios have a common investment manager or affiliated investment managers.**Gregory E. Johnson is considered to be an interested person of the Fund under the federal securities laws due to his position as an officer and director of Franklin Resources, Inc. (Resources), which is the parent company of the Fund’s investment manager and distributor. Rupert H. Johnson, Jr. is considered to be an interested person of the Fund under the federal securities laws due to his position as an officer and director and major shareholder of Resources.Note 1: Rupert H. Johnson, Jr. is the uncle of Gregory E. Johnson.Note 2: Officer information is current as of the date of this report. It is possible that after this date, information about officers may change.
The Sarbanes-Oxley Act of 2002 and Rules adopted by the U.S. Securities and Exchange Commission require the Fund to disclose whether the Fund’s Audit Committee includes at least one member who is an audit committee financial expert within the meaning of such Act and Rules. The Fund’s Board has determined that there is at least one such financial expert on the Audit Committee and has designated each of Ann Torre Bates and David W. Niemiec as an audit committee financial expert. The Board believes that Ms. Bates and Mr. Niemiec qualify as such an expert in view of their extensive business background and experience. Ms. Bates has served as a member of the Fund Audit Committee since 2008. She currently serves as a director of Ares Capital Corporation (2010-present) and United Natural Foods, Inc. (2013-present) and was formerly a director of Navient Corporation from 2014 to 2016, SLM Corporation from 1997 to 2014 and Allied Capital Corporation from 2003 to 2010, Executive Vice President and Chief Financial Officer of NHP Incorporated from 1995 to 1997 and Vice President and Treasurer of US Airways, Inc. until 1995. Mr. Niemiec has served as a member of the Fund Audit Committee since 2006, currently serves as an Advisor to Saratoga Partners and was formerly its Managing Director from 1998 to 2001 and serves as a director of Hess Midstream Partners LP (2017-present). Mr. Niemiec was formerly a director of Emeritus Corporation from 1999 to 2010 and OSI Pharmaceuticals, Inc. from 2006 to 2010, Managing Director of SBC Warburg Dillon Read from 1997 to 1998, and was Vice Chairman from 1991 to 1997 and Chief Financial Officer from 1982 to 1997 of Dillon, Read & Co. Inc. As a result of such background and experience, the Board believes that Ms. Bates and Mr. Niemiec have each acquired an understanding of generally accepted accounting principles and financial statements, the general application of such principles in connection with the accounting estimates, accruals and reserves, and analyzing and evaluating financial statements that present a breadth and level of complexity of accounting issues generally comparable to those of the Fund, as well as an understanding of internal controls and procedures for financial reporting and an understanding of audit committee functions. Ms. Bates and Mr. Niemiec are independent Board members as that term is defined under the applicable U.S. Securities and Exchange Commission Rules and Releases.
The Statement of Additional Information (SAI) includes additional information about the board members and is available, without charge, upon request. Shareholders may call (800) DIAL BEN/342-5236 to request the SAI.
Interested Board Members and Officers (continued)
TEMPLETON GLOBAL INVESTMENT TRUST
Shareholder Information
41franklintempleton.com Annual Report
Board Approval of Investment Management AgreementsTEMPLETON GLOBAL INVESTMENT TRUSTTempleton Emerging Markets Small Cap Fund(Fund)
At a meeting held on February 23, 2021 (Meeting), the Board of Trustees (Board) of Templeton Global Investment Trust (Trust), including a majority of the trustees who are not “interested persons” as defined in the Investment Company Act of 1940 (Independent Trustees), reviewed and approved the continuance of the investment management agreement between Templeton Asset Management Ltd. (Manager) and the Trust, on behalf of the Fund (Management Agreement) for an additional one-year period. The Independent Trustees received advice from and met separately with Independent Trustee counsel in considering whether to approve the continuation of the Management Agreement.
In considering the continuation of the Management Agreement, the Board reviewed and considered information provided by the Manager at the Meeting and throughout the year at meetings of the Board and its committees. The Board also reviewed and considered information provided in response to a detailed set of requests for information submitted to the Manager by Independent Trustee counsel on behalf of the Independent Trustees in connection with the annual contract renewal process. In addition, prior to the Meeting, the Independent Trustees held a telephonic contract renewal meeting at which the Independent Trustees conferred amongst themselves and Independent Trustee counsel about contract renewal matters and, in some cases, requested additional information from the Manager relating to the contract. The Board reviewed and considered all of the factors it deemed relevant in approving the continuance of the Management Agreement, including, but not limited to: (i) the nature, extent and quality of the services provided by the Manager; (ii) the investment performance of the Fund; (iii) the costs of the services provided and profits realized by the Manager and its affiliates from the relationship with the Fund; (iv) the extent to which economies of scale are realized as the Fund grows; and (v) whether fee levels reflect these economies of scale for the benefit of Fund investors.
In approving the continuance of the Management Agreement, the Board, including a majority of the Independent Trustees, determined that the terms of the Management Agreement are fair and reasonable and that the continuance of such Management Agreement is in
the best interests of the Fund and its shareholders. While attention was given to all information furnished, the following discusses some primary factors relevant to the Board’s determination.
Nature, Extent and Quality of ServicesThe Board reviewed and considered information regarding the nature, extent and quality of investment management services provided by the Manager and its affiliates to the Fund and its shareholders. This information included, among other things, the qualifications, background and experience of the senior management and investment personnel of the Manager, as well as information on succession planning where appropriate; the structure of investment personnel compensation; oversight of third-party service providers; investment performance reports and related financial information for the Fund; reports on expenses and shareholder services; legal and compliance matters; risk controls; pricing and other services provided by the Manager and its affiliates; and management fees charged by the Manager and its affiliates to US funds and other accounts, including management’s explanation of differences among accounts where relevant. The Board also reviewed and considered an annual report on payments made by Franklin Templeton (FT) or the Fund to financial intermediaries, as well as a memorandum relating to third-party servicing arrangements, which included discussion of the changing distribution landscape for the Fund. The Board noted management’s continuing efforts and expenditures in establishing effective business continuity plans and developing strategies to address areas of heightened concern in the mutual fund industry, such as cybersecurity in the current work-from-home environment and liquidity risk management.
The Board also reviewed and considered the benefits provided to Fund shareholders of investing in a fund that is part of the FT family of funds. The Board noted the financial position of Franklin Resources, Inc. (FRI), the Manager’s parent, and its commitment to the mutual fund business as evidenced by its reassessment of the fund offerings in response to the market environment and project initiatives and capital investments relating to the services provided to the Fund by the FT organization. The Board specifically noted FT’s commitment to enhancing services and controlling costs, as reflected in its outsourcing of certain administrative functions, and growth opportunities,
TEMPLETON GLOBAL INVESTMENT TRUSTSHAREHOLDER INFORMATION
42 franklintempleton.comAnnual Report
as evidenced by its recent acquisition of the Legg Mason companies. The Board also noted FT’s attention focused on expanding the distribution opportunities for all funds in the FT family of funds.
Following consideration of such information, the Board was satisfied with the nature, extent and quality of services provided by the Manager and its affiliates to the Fund and its shareholders.
Fund PerformanceThe Board reviewed and considered the performance results of the Fund over various time periods ended November 30, 2020. The Board considered the performance returns for the Fund in comparison to the performance returns of mutual funds deemed comparable to the Fund included in a universe (Performance Universe) selected by Broadridge Financial Solutions, Inc. (Broadridge), an independent provider of investment company data. The Board received a description of the methodology used by Broadridge to select the mutual funds included in a Performance Universe. The Board also considered the performance returns for the Fund in comparison to the performance returns of a customized peer group (Performance Customized Peer Group) selected by the Manager. The Board further reviewed and considered Fund performance reports provided and discussions that occurred with portfolio managers at Board meetings throughout the year. A summary of the Fund’s performance results is below.
The Performance Universe for the Fund included the Fund and all retail and institutional emerging markets funds. The Performance Customized Peer Group for this Fund also provided for the Board’s consideration included only emerging markets funds that invest only in stocks that have total market cap within the range of the market capitalizations of companies in the MSCI Emerging Markets Small Cap Index at the time of purchase. The Board noted that the Fund’s annualized total return for the one-, three-, five- and ten-year periods was below the median and in the fifth quintile (worst) of its Performance Universe. The Board also noted that the Fund’s annualized total return was below the median of its Performance Customized Peer Group for each reporting period, except the 10-year period for which it was equal to the median of its Performance Customized Peer Group because the Fund was the only fund in the Performance Customized Peer Group that had 10-year performance. The Board discussed this performance with management and management explained that the Performance Universe was not directly comparable to the Fund as the Performance Universe included global emerging market funds and was not limited to small cap funds. Management further explained that in comparison to
the Performance Universe, the Fund’s investments had one of the lowest average market capitalizations. Management noted that during the one-, three- and five-year periods, emerging market large-capitalization securities outperformed emerging market small-capitalization securities, which has been a headwind for the Fund’s performance. Management also explained that the Fund’s underperformance relative to its Performance Customized Peer Group was based on stock selection as described below. Management further explained that the Fund’s underperformance during the one-year period was primarily due to the Fund’s stock selection and underweight position in Korea, while the Fund’s longer-term underperformance was primarily due to the Fund’s stock selection in Taiwan and Turkey and the healthcare and consumer staples sectors. The Board discussed the steps management had underway to address the underperformance of the Fund, including making specific changes to the Fund’s portfolio holdings and enhancements to the Fund’s investment personnel and stock selection process. The Board concluded that the Fund’s Management Agreement should be continued for an additional one-year period, and management’s efforts should continue to be closely monitored.
Comparative Fees and ExpensesThe Board reviewed and considered information regarding the Fund’s actual total expense ratio and its various components, including, as applicable, management fees; transfer agent expenses; underlying fund expenses; Rule 12b-1 and non-Rule 12b-1 service fees; and other non-management fees. The Board also noted the quarterly and annual reports it receives on all marketing support payments made by FT to financial intermediaries. The Board considered the actual total expense ratio and, separately, the contractual management fee rate, without the effect of fee waivers, if any (Management Rate) of the Fund in comparison to the median expense ratio and median Management Rate, respectively, of other mutual funds deemed comparable to and with a similar expense structure to the Fund selected by Broadridge (Expense Group). Broadridge fee and expense data is based upon information taken from each fund’s most recent annual report, which reflects historical asset levels that may be quite different from those currently existing, particularly in a period of market volatility. While recognizing such inherent limitation and the fact that expense ratios and Management Rates generally increase as assets decline and decrease as assets grow, the Board believed the independent analysis conducted by Broadridge to be an appropriate measure of comparative fees and expenses. The Broadridge Management Rate includes administrative charges, and the actual total expense ratio, for comparative consistency,
TEMPLETON GLOBAL INVESTMENT TRUSTSHAREHOLDER INFORMATION
43franklintempleton.com Annual Report
was shown for Class A shares for the Fund and for Class A shares and Class M shares for each other fund in the Expense Group. The Board received a description of the methodology used by Broadridge to select the mutual funds included in an Expense Group.
The Expense Group for the Fund included the Fund and 17 other emerging markets funds. The Board noted that the Management Rate and actual total expense ratio for the Fund were above the medians and in the fifth quintile (most expensive) of its Expense Group. The Board discussed the expenses of this Fund with management and management explained that the Expense Group was not directly comparable to the Fund as the Expense Group was comprised of funds that had an average allocation of 20% of their investments to small- or mid-capitalization companies, whereas the Fund allocates approximately 85% to such companies. Management explained that the Fund’s specialized focus on the small capitalization segment of the market generally carried higher management costs. The Board then noted that the Fund’s actual total expense ratio reflected a fee waiver from management. The Board also noted that management has agreed to increase its fee waiver to further reduce the Fund’s actual total expense ratio. In light of the above, the Board concluded that the Management Rate charged to the Fund is reasonable.
ProfitabilityThe Board reviewed and considered information regarding the profits realized by the Manager and its affiliates in connection with the operation of the Fund. In this respect, the Board considered the Fund profitability analysis provided by the Manager that addresses the overall profitability of FT’s US fund business, as well as its profits in providing investment management and other services to each of the individual funds during the 12-month period ended September 30, 2020, being the most recent fiscal year-end for FRI. The Board noted that although management continually makes refinements to its methodologies used in calculating profitability in response to organizational and product-related changes, the overall methodology has remained consistent with that used in the Fund’s profitability report presentations from prior years. The Board further noted management’s representation that the profitability analysis excluded the impact of the recent acquisition of the Legg Mason companies and that management expects to incorporate the legacy Legg Mason companies into the profitability analysis beginning next year. The Board also noted that PricewaterhouseCoopers LLP, auditor to FRI
and certain FT funds, has been engaged by the Manager to periodically review and assess the allocation methodologies to be used solely by the Fund’s Board with respect to the profitability analysis.
The Board noted management’s belief that costs incurred in establishing the infrastructure necessary for the type of mutual fund operations conducted by the Manager and its affiliates may not be fully reflected in the expenses allocated to the Fund in determining its profitability, as well as the fact that the level of profits, to a certain extent, reflected operational cost savings and efficiencies initiated by management. As part of this evaluation, the Board considered management’s outsourcing of certain operations, which effort has required considerable upfront expenditures by the Manager but, over the long run is expected to result in greater efficiencies. The Board also noted management’s expenditures in improving shareholder services provided to the Fund, as well as the need to implement systems and meet additional regulatory and compliance requirements resulting from recent US Securities and Exchange Commission and other regulatory requirements.
The Board also considered the extent to which the Manager and its affiliates might derive ancillary benefits from fund operations, including revenues generated from transfer agent services, potential benefits resulting from personnel and systems enhancements necessitated by fund growth, as well as increased leverage with service providers and counterparties. Based upon its consideration of all these factors, the Board concluded that the level of profits realized by the Manager and its affiliates from providing services to the Fund was not excessive in view of the nature, extent and quality of services provided to the Fund.
Economies of ScaleThe Board reviewed and considered the extent to which the Manager may realize economies of scale, if any, as the Fund grows larger and whether the Fund’s management fee structure reflects any economies of scale for the benefit of shareholders. With respect to possible economies of scale, the Board noted the existence of management fee breakpoints, which operate generally to share any economies of scale with the Fund’s shareholders by reducing the Fund’s effective management fees as the Fund grows in size. The Board considered the Manager’s view that any analyses of potential economies of scale in managing a particular fund are inherently limited in light of the joint and common costs and investments the Manager incurs across the FT family of funds as a whole. The Board concluded
TEMPLETON GLOBAL INVESTMENT TRUSTSHAREHOLDER INFORMATION
44 franklintempleton.comAnnual Report
that, to the extent economies of scale may be realized by the Manager and its affiliates, the Fund’s management fee structure provided a sharing of benefits with the Fund and its shareholders as the Fund grows.
ConclusionBased on its review, consideration and evaluation of all factors it believed relevant, including the above-described factors and conclusions, the Board unanimously approved the continuation of the Management Agreement for an additional one-year period.
Proxy Voting Policies and ProceduresThe Fund’s investment manager has established Proxy Voting Policies and Procedures (Policies) that the Fund uses to determine how to vote proxies relating to portfolio securities. Shareholders may view the Fund’s complete Policies online at franklintempleton.com. Alternatively, shareholders may request copies of the Policies free of charge by calling the Proxy Group collect at (954) 527-7678 or by sending a written request to: Franklin Templeton Companies, LLC, 300 S.E. 2nd Street, Fort Lauderdale, FL 33301, Attention: Proxy Group. Copies of the Fund’s proxy voting records are also made available online at franklintempleton.com and posted on the U.S. Securities and Exchange Commission’s website at sec.gov and reflect the most recent 12-month period ended June 30.
Quarterly Statement of InvestmentsThe Trust, on behalf of the Fund, files a complete statement of investments with the U.S. Securities and Exchange Commission for the first and third quarters for each fiscal year as an exhibit to its report on Form N-PORT. Shareholders may view the filed Form N-PORT by visiting the Commission’s website at sec.gov. The filed form may also be viewed and copied at the Commission’s Public Reference Room in Washington, DC. Information regarding the operations of the Public Reference Room may be obtained by calling (800) SEC-0330.
Householding of Reports and ProspectusesYou will receive, or receive notice of the availability of, the Fund’s financial reports every six months. In addition, you will receive as an annual updated summary prospectus (detail prospectus available upon request). To reduce Fund expenses, we try to identify related shareholders in a household and send only one copy of the financial reports (to the extent received by mail) and summary prospectus.
This process, called “householding,” will continue indefinitely unless you instruct us otherwise. If you prefer not to have these documents householded, please call us at (800) 632-2301. At any time you may view current prospectuses/summary prospectuses and financial reports on our website. If you choose, you may receive these documents through electronic delivery.
Authorized for distribution only when accompanied or preceded by a summary prospectus and/or prospectus. Investors should carefully consider a fund’s investment goals, risks, charges and expenses before investing. A prospectus contains this and other information; please read it carefully before investing.
To help ensure we provide you with quality service, all calls to and from our service areas are monitored and/or recorded.
Annual Report and Shareholder LetterTempleton Emerging Markets Small Cap Fund