37
Long Term Resource Monitoring Program Technical Report 98-T001 Temporal Analyses of Select Macroinvertebrates in the Upper Mississippi River System, 1992–1995 April 1998

Long Term Resource Monitoring Program
Technical Report98-T001
Temporal Analyses of SelectMacroinvertebrates in the
Upper Mississippi River System,1992–1995
April 1998

LTRMP Technical Reports provide Long Term Resource Monitoring Programpartners with scientific and technical support.
All reports in this series receive anonymous peer review.
Environmental ManagementTechnical Center
CENTER DIRECTORRobert L. Delaney
APPLIED RIVER SCIENCEACTING DIRECTOR
Ken Lubinski
PROGRAM OPERATIONSACTING DIRECTOR
Linda E. Leake
REPORT EDITORDeborah K. Harris
Cover graphic by Mi Ae Lipe-Butterbrodt
Mention of trade names or commercial products does not constitute endorsementor recommendation for use by the U.S. Geological Survey, U.S. Department of the Interior.
Printed on recycled paper

Temporal Analyses of SelectMacroinvertebrates in the
Upper Mississippi River System,1992–1995
by
Jennifer S. Sauer
April 1998
U.S. Geological SurveyEnvironmental Management Technical Center
575 Lester AvenueOnalaska, Wisconsin 54650

Suggested citation:
Sauer, J. 1998. Temporal analyses of select macroinvertebrates in the Upper Mississippi River System, 1992–1995. U.S.Geological Survey, Environmental Management Technical Center, Onalaska, Wisconsin, April 1998. LTRMP 98-T001.26 pp. + Appendix
Additional copies of this report may be obtained from the National Technical Information Service, 5285 Port Royal Road,Springfield, VA 22161 (1-800-553-6847 or 703-487-4650). Also available to registered users from the Defense TechnicalInformation Center, Attn: Help Desk, 8725 Kingman Road, Suite 0944, Fort Belvoir, VA 22060-6218 (1-800-225-3842 or703-767-9050).

iii
Contents
Page
Preface . . . . . . . . . . . . . . . . . . . . . . . . . . . . . . . . . . . . . . . . . . . . . . . . . . . . . . . . . . . . . . . . . . . . . . . . . v
Abstract . . . . . . . . . . . . . . . . . . . . . . . . . . . . . . . . . . . . . . . . . . . . . . . . . . . . . . . . . . . . . . . . . . . . . . . . 1
Introduction . . . . . . . . . . . . . . . . . . . . . . . . . . . . . . . . . . . . . . . . . . . . . . . . . . . . . . . . . . . . . . . . . . . . . 1
Methods . . . . . . . . . . . . . . . . . . . . . . . . . . . . . . . . . . . . . . . . . . . . . . . . . . . . . . . . . . . . . . . . . . . . . . . . 2Study Area and Spatial Design . . . . . . . . . . . . . . . . . . . . . . . . . . . . . . . . . . . . . . . . . . . . . . . . . . . . 2Sampling Methods . . . . . . . . . . . . . . . . . . . . . . . . . . . . . . . . . . . . . . . . . . . . . . . . . . . . . . . . . . . . . 3Site Information . . . . . . . . . . . . . . . . . . . . . . . . . . . . . . . . . . . . . . . . . . . . . . . . . . . . . . . . . . . . . . . 4Statistical Analysis . . . . . . . . . . . . . . . . . . . . . . . . . . . . . . . . . . . . . . . . . . . . . . . . . . . . . . . . . . . . . 4
Results . . . . . . . . . . . . . . . . . . . . . . . . . . . . . . . . . . . . . . . . . . . . . . . . . . . . . . . . . . . . . . . . . . . . . . . . . 5
Quality Assurance . . . . . . . . . . . . . . . . . . . . . . . . . . . . . . . . . . . . . . . . . . . . . . . . . . . . . . . . . . . . . . . . 6
Select Macroinvertebrates . . . . . . . . . . . . . . . . . . . . . . . . . . . . . . . . . . . . . . . . . . . . . . . . . . . . . . . . . . 6Ephemeroptera (Mayflies) . . . . . . . . . . . . . . . . . . . . . . . . . . . . . . . . . . . . . . . . . . . . . . . . . . . . . . . 6Sphaeriidae (Fingernail Clams) . . . . . . . . . . . . . . . . . . . . . . . . . . . . . . . . . . . . . . . . . . . . . . . . . . . 7Chironomidae (Midges) . . . . . . . . . . . . . . . . . . . . . . . . . . . . . . . . . . . . . . . . . . . . . . . . . . . . . . . . . 7Corbicula fluminea (Asiatic Clam) and Dreissena polymerpha (Zebra Mussels) . . . . . . . . . . . . . 7
Discussion . . . . . . . . . . . . . . . . . . . . . . . . . . . . . . . . . . . . . . . . . . . . . . . . . . . . . . . . . . . . . . . . . . . . . . 8
Acknowledgments . . . . . . . . . . . . . . . . . . . . . . . . . . . . . . . . . . . . . . . . . . . . . . . . . . . . . . . . . . . . . . . . 9
References . . . . . . . . . . . . . . . . . . . . . . . . . . . . . . . . . . . . . . . . . . . . . . . . . . . . . . . . . . . . . . . . . . . . . . 9
Appendix. Macroinvertebrate Collection Sheet . . . . . . . . . . . . . . . . . . . . . . . . . . . . . . . . . . . . . . . . A-1
Tables
Table 1. Macroinvertebrate random sample sites by study area and aquatic area—parenthesesindicate numbers of historical (fixed) sites . . . . . . . . . . . . . . . . . . . . . . . . . . . . . . . . . . . 13
Table 2. Sampling dates for macroinvertebrate sampling . . . . . . . . . . . . . . . . . . . . . . . . . . . . . . . 14
Table 3. Results of analysis of covariance on weighted pool/reachwide means with year, studyarea, and their interactions as independent variables . . . . . . . . . . . . . . . . . . . . . . . . . . . . 14
Table 4. Estimated mean number of Corbicula fluminea and zebra mussels per square meter byyear and study area, weighted by areas of strata . . . . . . . . . . . . . . . . . . . . . . . . . . . . . . . 15

iv
Table 5. Reachwide estimated mean number of Ephemeroptera, Sphaeriidae, and Chironomidaeper square meter by year and study area, weighted by areas of strata . . . . . . . . . . . . . . . 16
Table 6. Mean number of organisms per square meter by study area and aquatic area with allyears combined . . . . . . . . . . . . . . . . . . . . . . . . . . . . . . . . . . . . . . . . . . . . . . . . . . . . . . . . 17
Table 7. Mean number of organisms per square meter by study area and substrate type . . . . . . . . 21
Figures
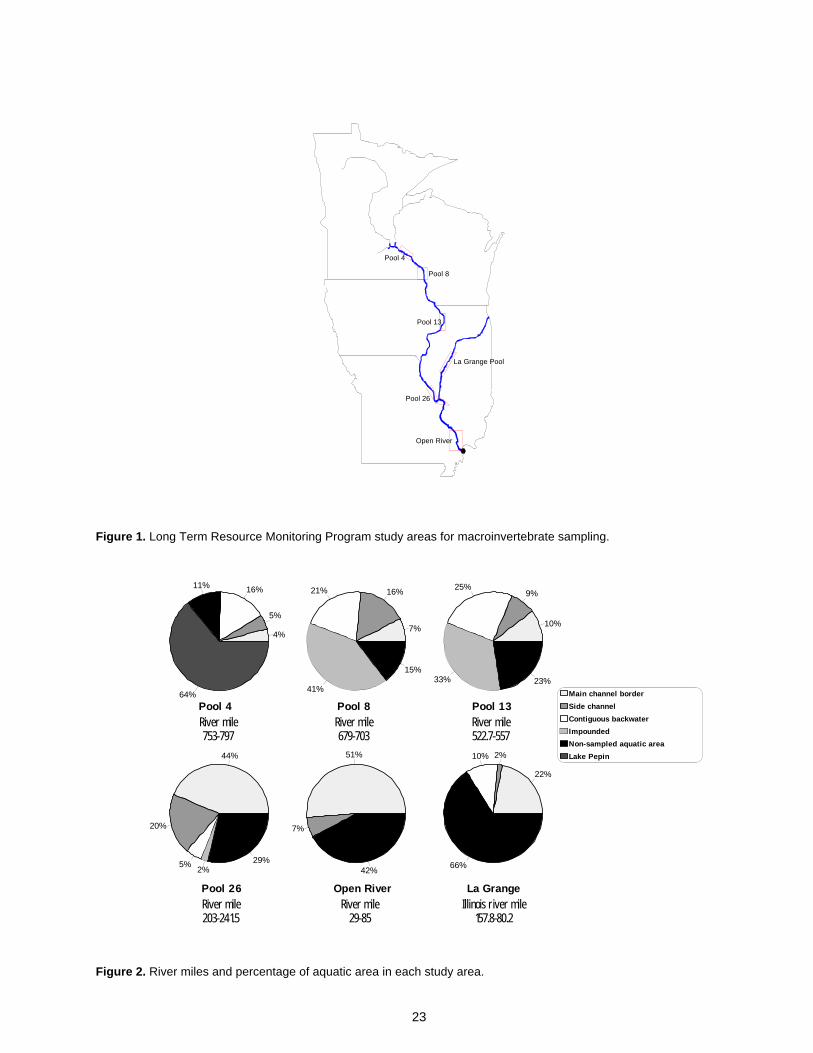
Figure 1. Long Term Resource Monitoring Program study areas for macroinvertebrate sampling . 22
Figure 2. River miles and percentage of aquatic area in each study area . . . . . . . . . . . . . . . . . . . . . 22
Figure 3. Frequency of target organisms in samples, 1992–1995 . . . . . . . . . . . . . . . . . . . . . . . . . . 23
Figure 4. Percent composition of target organisms: 1 = Zebra mussel sampling initiated in 1995,2 = Midge sampling initiated in 1993 . . . . . . . . . . . . . . . . . . . . . . . . . . . . . . . . . . . . . . . 23
Figure 5. Estimated mean number of Ephemeroptera per square meter by study area, weighted byarea of strata . . . . . . . . . . . . . . . . . . . . . . . . . . . . . . . . . . . . . . . . . . . . . . . . . . . . . . . . . . 24
Figure 6. Estimated mean number of Sphaeriidae per square meter by study area, weighted byarea of strata . . . . . . . . . . . . . . . . . . . . . . . . . . . . . . . . . . . . . . . . . . . . . . . . . . . . . . . . . . 25
Figure 7. Estimated mean number of Chironomidae per square meter by study area, weightedby area of strata . . . . . . . . . . . . . . . . . . . . . . . . . . . . . . . . . . . . . . . . . . . . . . . . . . . . . . . . 26
v
Preface
The Long Term Resource Monitoring Program (LTRMP) was authorized under theWater Resources Development Act of 1986 (Public Law 99-662) as an element of the U.S.Army Corps of Engineers’ Environmental Management Program. The LTRMP is beingimplemented by the Environmental Management Technical Center, a U.S. GeologicalSurvey science center, in cooperation with the five Upper Mississippi River System(UMRS) States of Illinois, Iowa, Minnesota, Missouri, and Wisconsin. The U.S. ArmyCorps of Engineers provides guidance and has overall Program responsibility. The mode ofoperation and respective roles of the agencies are outlined in a 1988 Memorandum ofAgreement.
The UMRS encompasses the commercially navigable reaches of the Upper MississippiRiver, as well as the Illinois River and navigable portions of the Kaskaskia, Black, St. Croix,and Minnesota Rivers. Congress has declared the UMRS to be both a nationally significantecosystem and a nationally significant commercial navigation system. The mission of theLTRMP is to provide decision makers with information for maintaining the UMRS as asustainable large river ecosystem given its multiple-use character. The long-term goals ofthe Program are to understand the system, determine resource trends and effects, developmanagement alternatives, manage information, and develop useful products.
This trend and spatial analysis report supports Task 2.2.7.6, Evaluate and Summarize 5-Year Trends, as specified in Goal 2, Monitor Resource Change of the LTRMP OperatingPlan (U.S. Fish and Wildlife Service 1993). This report was developed with fundingprovided by the Long Term Resource Monitoring Program.

Temporal Analyses of SelectMacroinvertebrates in the
Upper Mississippi River System,1992–1995
by
Jennifer S. Sauer
Abstract
The annual variability in mayflies (Ephemeroptera), fingernail clams (Sphaeriidae), and midges (Chironomidae) in six study areasof the Upper Mississippi River System from 1992 to 1995 was examined. Spatial distribution is also discussed for these organismsalong with the Asiatic clam (Corbicula fluminea) and the zebra mussel (Dreissena polymorpha). Sample allocation within each reachwas based on a stratified random design where strata were aquatic areas. No significant linear trends across years were found inestimated reachwide mean number of organisms. However, the overall test for differences in intercepts among study areas wasstatistically significant (P < 0.05) for mayflies, fingernail clams, and midges. No statistical difference in trend slopes among reacheswere detected. In 1993, the estimated mean density of fingernail clams in Pool 13 was 35 times that found in other study areas.Overall, impounded aquatic areas and silt clay substrates supported higher numbers of the select macroinvertebrates.
Introduction
In 1986, Congress designated the Upper Mississippi River System (UMRS), which consists of the UpperMississippi and Illinois Rivers and several important tributaries, as both a nationally significant ecosystemand a nationally significant navigation system. Macroinvertebrates and other aquatic organisms play a majorrole in the aquatic ecosystem. Mayflies (Ephemeroptera), fingernail clams (Sphaeriidae), and midges(Chironomidae), part of the soft-sediment substrate fauna, were chosen as target organisms for the LongTerm Resource Monitoring Program (LTRMP) because of their important ecological role in the UMRS. Forexample, Thompson (1973) found that in fall, lesser scaup (Aythya affinis) gizzard contents contained76% sphaeriids and about 13% mayflies. Thompson also found the target organisms to be important tocanvasbacks (Aythya valisneria), ring-necked ducks (Aythya collaris), and American coots (Fulicaamericana) feeding in open water. A number of fish, including commercial and recreational fish, utilize thetarget organisms (Hoopes 1960; Jude 1968; Ranthum 1969). Researchers have also traditionally usedmacroinvertebrates as biological indicators of river water quality (Fremling 1964, 1973, 1989; Myslinski andGinsburg 1977; Rosenberg and Resh 1993; Steingraber and Weiner 1995). An indicator species can bedefined as a species that has particular requirements with regard to a known set of physical or chemicalparameters. Macroinvertebrates also perform an important ecological function by digesting organic materialand recycling nutrients (Reice and Wohlenberg 1992). The Asiatic clam (Corbicula fluminea) and zebramussel (Dreissena polymorpha), both non-native freshwater clams, were chosen for monitoring because ofpossible detrimental effects they may have on the economy and biology of the UMRS (Tucker 1995a, b), andtheir status is of concern to river managers.
Few long-term studies on the distribution and abundance of mayflies, fingernail clams, and midges havebeen published, and the majority of information that is available is scattered in unpublished governmentreports and theses. Several areas of the UMRS have been sampled sporadically for benthicmacroinvertebrates by various researchers (Fremling 1964; Carlander et al. 1967; Gale 1969; Hubert et al.1983; Eckblad and Lehtinen 1991; Brewer 1992; Hornbach et al. 1993). Although these studies containvaluable information, they were collected by different methods and over relatively short periods, making itimpossible to evaluate long-term trends. Long-term monitoring is needed to detect population trends andlocal changes to direct management actions or measure the effectiveness of management actions.

2
The objective of this report is to document spatial and temporal patterns in select benthicmacroinvertebrates from samples collected from the UMRS by field stations of the LTRMP. Thisdocumentation will provide baseline data for future reference on the distribution and abundance of selectmacroinvertebrates in the UMRS and provide data for other analyses (e.g., synthesis among LTRMPcomponents). Also, these first years of monitoring will be used to establish a scientifically acceptableprocedure, using consistent protocols, for the long-term collection of macroinvertebrates in the UMRS.
The publicly available data and annual status reports (Sauer 1996, 1997aSd) are the most basic LTRMPproducts. Annual status reports provide more detailed summaries of macroinvertebrate data than are includedin this trend report, but they lack analyses or syntheses. The trend report and the status reports are best usedas information sources for the assessment of background variation (Lubinski 1993), identification ofmanagement problems, and formulation of hypotheses. The ultimate goal of the LTRMP is not simply toreport status and trends, but to improve the understanding and management of the UMRS. That goal can bestbe achieved by the integration of routine monitoring with experimental research directed at identifying thecauses of and solutions to specific problems. Future LTRMP efforts will integrate more narrowly focusedanalyses of data from all LTRMP monitoring components (limnology, bathymetry, sediments, aquatic plants,and fisheries) with the results of experimental studies to identify causes of problems and opportunities forimproved management.
Methods
Study Area and Spatial Design
In 1992, macroinvertebrate sampling was initiated in six study areas on the UMRS. The six LTRMP studyareas represent the variety of aquatic areas within the UMRS. They range in size (calculated from geographicinformation system coverage; Lowenberg 1993) from Pool 8 (19,000 ha) to the Open River (107,000 ha).Long Term Resource Monitoring Program study areas are referred to herein by the navigation pooldesignations according to the U.S. Army Corps of Engineers lock and dam system and include: Pools 4 (rivermile 752 to 797), 8 (679 to 703), 13 (523 to 557), and 26 (202 to 242); the Open River Reach (29 to 80) of theMississippi River; and La Grange Pool (80 to 158) of the Illinois River (Figure 1). The choice of thesestudy areas was based on several criteria (Jackson et al. 1981):
1. Monitoring locations were either representative of major UMRS habitat types or capable of influencinga significant portion of the system.
2. A historical database was available.
3. Selected pools or reaches were recognized as important fish and wildlife resources.
4. Monitoring locations were established with regard to availability of workers and facilities.
The first year of macroinvertebrate sampling was used to refine the sampling design, and changes havebeen documented in the Procedures Manual for the LTRMP (Thiel and Sauer 1995). Initially, mayflies,fingernail clams, and C. fluminea were selected for monitoring. Midges were added to monitoring in 1993,and zebra mussels were added in 1995.
Sampling was conducted yearly at about 125 sites per study area. Sample allocation was based on astratified random design, where strata were aquatic areas (Figure 2) as defined by Wilcox (1993):

3
C contiguous backwaters (BWC), which are areas having apparent surface-water connection with the restof the river;
C main channel borders (MCB), the area between the navigational buoys and the riverbank (not includingrevetments and channel-training structures);
C impounded areas (IMP), the large, mostly open water areas located in the downstream portion of thenavigational pools;
C side channels (SC), which are channels that carry less flow than the navigational channel; and
C tributary delta lake (TDL), which in Pool 4 is Lake Pepin, an impounded area formed by the ChippewaRiver.
A spatial database of aquatic areas was developed at the Environmental Management Technical Center(Owens and Ruhser 1996) based on aerial photography made in 1989; this database is used for randomizedselection of sampling sites and the quantification of sampling strata reported herein. This database is updatedat appropriate intervals. Sampling maps are updated, as needed, from direct observations made by thesampling crews.
Sample sites also included some historical (fixed) sites, where benthic samples were collected by previousresearchers (Paloumpis and Starrett 1960; Fremling 1973; Emge et al. 1974; Colbert et al. 1975; Anderson1977; Elstad 1977; Hubert et al. 1983; Brewer 1992).
In 1992, stratified random sampling sites were distributed equally in each aquatic area. After analysis ofthe 1992 data—where 57% of the samples contained no target organisms—it was decided to more heavilysample the particular habitat of the target organisms (i.e., soft-sediment substrate; Table 1). All sites weresampled in spring to characterize the benthic community before mayfly emergence (Table 2).
Sampling Methods
Macroinvertebrate sampling procedures are described in detail in the LTRMP Procedures Manual (Thieland Sauer 1995). Benthic samples were collected with a winch-mounted 0.052-m standard Ponar grab2
sampler (Ponar Grab Dredge, Wildlife Supply Company, Saginaw, Michigan). The wash frame sieve size waschanged from a U.S. Standard Sieve no. 30 (595 Fm), used in 1992, to a U.S. Standard Sieve no. 16(1.18 mm) in 1993 to increase sorting efficiency in the field. Thus, inferences in macroinvertebrate numbersmade from these data are restricted to the larger organisms of the population whole (Dukerschein et al. 1996).Mayflies, fingernail clams, midges, C. fluminea, and zebra mussels were picked and counted in the field.After the picking process was complete, leaving only detritus and organisms other than the target organisms,it was determined by random draw whether the sample would be brought back to the laboratory for qualityassurance (Norris and Georges 1992). A total of 10% of the sites sampled within each aquatic area werebrought back to the laboratory to evaluate field-picking efficiency without the aid of magnification or staining.

yst '1N jL
h' 1 Nh yh
s 2(yst) '1
N 2jLh' 1 Nh Nh& nh
s 2h
nh
s 2h '
jn h
i' 1 (yhi& yh )2
nh& 1
(DS)
DS
DS
yst
yhyst
yst s ( yst )
4
(1)
(2)
Site Information
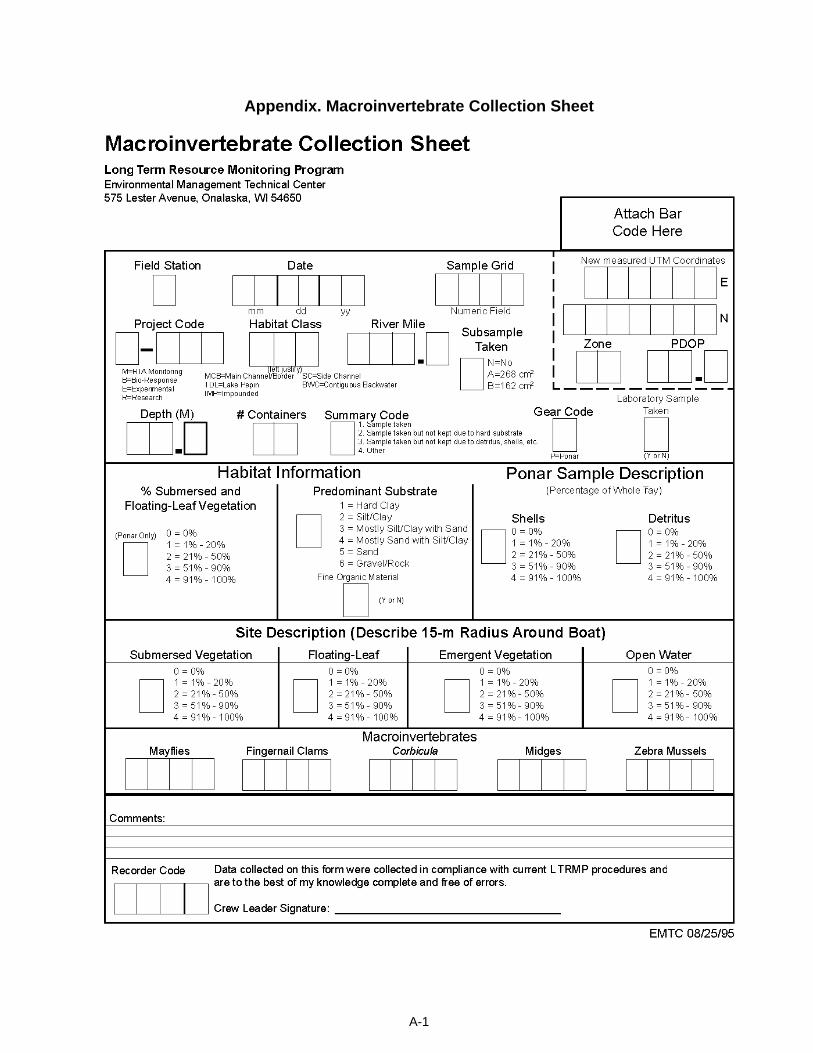
At each site, substrate composition was noted according to subjective characterization. Six categories ofsubstrate composition were used: hard clay, silt clay, silt clay with sand, sand with silt clay, sand, and gravelrock. The absence or percentage of submersed and floating-leaved aquatic vegetation in the column of waterand sediment through which the Ponar dredge fell was estimated. The type and percentage of vegetation andopen water in a 15-m radius from the boat were qualitatively characterized. Water depth was measured ateach site (Appendix).
Statistical Analysis
Density was recorded for each target taxa from individual Ponar samples. Whenever a taxa was not caughtin a sample, the catch for that taxa in that sample is zero.
Analyses of densities (DS) were based on estimates of mean densities obtained by pooling data over allstrata. In this way, the analyses track the broadest possible spatial scale for trends in relative densities. Thepooling probably presents a truer image of reachwide trends in densities because it does not rely only onparticularly favorable habitats. If the quantity of preferred habitat declines through time while densities inthose preferred habitats remains constant, then these pooled estimated mean densities statistics shouldalso reflect that decline, whereas mean density statistics from only the preferred habitats would not. If thequantity of that aquatic area class preferred by a particular species declines through time while theabundances within each aquatic area remain constant, then the pooled statistics should also reflect theresulting decline in reachwide abundance, whereas mean density statistics from only the preferred aquaticarea would not.
The estimates of pooled reachwide were obtained from the conventional design-based estimator forstratified random samples (Cochran 1977). For an arbitrary random variable denoted y (for this report y isDS), the pooled mean, denoted (st represents stratified) is given by
where N is the number of sampling units within stratum h, N = E N , and denotes the estimator of theh h=1 hL
simple mean of y for stratum h. The estimator of the variance of is
where
is the usual estimator of the variance of y and n is the number of samples taken in stratum h (Cochranh h
1977). The standard error of is therefore . For LTRMP macroinvertebrate monitoring, randomsample sites are selected from grids whose cells are 50 m .2

DS rt ' J0 % $1 tr % J0r % $1r tr % ,rt ,
DS rt
DS rt
s &2 ( yst ) DS rt
DS rtDS rt
DS rt
DS rt
5
(3)
Equation (1) is used to obtain estimates of overall mean densities of 1992–95 random sampling. In randomsamples, equation (1) yields unbiased estimates of the pooled means regardless of the probability distributionof y (Cochran 1977).
For this report, the presence of differences among LTRMP study areas and simple linear trends was tested.Because only the first 4 years of data obtained by the LTRMP were examined in this report, it is impossibleto perform sophisticated time-series and trend analyses because the existing series are still too short.However, under some simplifying assumptions, it is possible to test for simple linear trends (straight-lineincreases or decreases) over the 4-year period and also to make useful comparisons of these trends amongthe six LTRMP study areas.
To place inference in terms of the reachwide estimates of mean densities, the observed obtainedfrom equation (1) to make inferences about the unknown true values of reachwide mean densities statisticaltests were constructed assuming the general linear model given by
where denotes reachwide mean abundance for reach r during year t, J is the parameter for the overall0
intercept for all reaches combined, $ is the parameter for the overall slope (linear trend) for all reaches1
combined, the J are six parameters for reach-specific deviations from t the $ are six parameters for0r 0, 1r
reach-specific deviations from $ and , is random error. For these data, it is assumed that the , are1, rt rt,
independently and normally distributed with mean zero and diagonal covariance matrix having elementsF , where F is variance from model-based sources. That is, the observations of in equation2 2
(3) are assumed to be serially independent but are weighted by the reciprocals of their variances fromequation (2) to obtain constant model-based variance F . Although data are not normally distributed,2
the Central Limit Theorem (DeGroot 1975) implies that the are approximately normally distributed;however, model assumptions only require that the , are approximately normally distributed. Equation (3)rt
is an extension of the analysis of covariance model that accounts for heterogeneity of variance in theresponse variable and for the possibility linear trend slopes differ among LTRMP study areas.
Three tests based on Type I sums of squares from equation (3) are relevant (Littell et al. 1991). The F testfor study area r examines the differences due to different intercepts J (adjusted treatment differences)0r
assuming equal trend slopes. The F test for the main effect t examines the significance of a single trendr
regression of on t that prevails over the six study areas. Last, the F test for the interaction betweenr
study area and time, denoted by the term $ t in equation (3) examines the significance of differences in1r r
trend coefficients $ among study areas. If this last F test is not statistically significant, then one concludes1r
that among-reach differences in trend slopes could not be detected.
Results
More than 2,400 Ponar collections were made from the six study areas in summers 1992, 1993, 1994, and1995. Frequency distributions varied among years; in 1992 low densities (#20 organisms per sample) werecommon, and higher densities (>20) occurred in about 4% of the samples (Figure 3). However, after theexperimental design was changed in 1993, the number of organisms per sample were more evenly distributedbetween low and high densities.
(DS)DS DS
DS
6
Percent composition of target organisms varied among years within study areas. Pool 8 consistently hadhigher percentages of mayflies than any of the other four target organisms, whereas Pool 13 had highpercentages of fingernail clams in 1993, 1994, and 1995 when compared with other target organisms.Pools 4, 8, and 13 had similar temporal patterns for percent composition, but the magnitude of thepercentages varied widely (Figure 4).
Measured depths at sampling sites ranged from 0.20 to 8.3 m with a mean of 1.8 m. More than 93% ofthe sample sites were unvegetated. Visual classification of sediments indicated that sample sites in Pools 4,8, 13, 26, and La Grange Pool were dominated by silt clay, which constituted 46.6% of the sample sites. TheOpen River had a predominance of sand at sampling sites. All aquatic areas except main channel borders andside channels (sand) were dominated by silt clay.
Quality Assurance
More than 60% of the samples brought back to the laboratory for quality assurance had zero mayflies, andnearly 60% of the samples had zero fingernail clams. Measurement of the laboratory specimens indicatedthat 92% of the mayflies and 80% of the fingernail clams were less than or equal to 4 mm in length; meanlengths were 25.3 mm in field-picked mayflies and 6.5 mm in fingernail clams.
Select Macroinvertebrates
No statistically significant linear trend existed in the overall mean densities of mayflies (P = 0.89),fingernail clams (P = 0.79), and midges (P = 0.52) across years or the interation between study areas andyears (P = 0.11, P = 0.53, P = 0.13, respectively). However, the overall test for differences in interceptsamong study areas was statistically significant (P < 0.05) for all three organisms (Table 3). That is,differences in estimated mean densities of mayflies, fingernail clams, and midges that occurred among studyareas were significant. Corbicula fluminea and zebra mussels were not included in the trendanalyses because of low numbers found during sampling (Table 4).
Ephemeroptera (Mayflies)
Pool 13 contained the highest estimated mean densities of mayflies in 1992, 1993, and 1995followed by Pool 4 (Table 5; Figure 5). In 1994, Pool 4 had slightly higher of mayflies. The lowest of mayflies were from Pool 26, the Open River Reach, and La Grange Pool. No estimated mean densities ofmayflies were calculated for Pool 26 in 1995; field crews were not able to sample certain sites because ofhigh water. Pool 4 had the largest range in (143.7 m ) compared with other study areas. -2
Although mean densities of mayflies varied over the years among aquatic areas, the IMP aquatic areas,including the naturally impounded Lake Pepin in Pool 4, and BWC areas supported the highest mean numberof mayflies in Pools 4, 8, 13, and 26 (Table 6). Side channel areas had the highest mayfly densities in theLa Grange Pool study area in 1992–95. Overall, MCB areas supported the lowest densities of mayflies.
The silt clay substrate supported the highest mean numbers of mayflies in all study areas (Table 7). Thelarge-particle substrates (i.e., sand and gravel rock) had the lowest numbers of mayflies.
DS DS
DSDS
DS
7
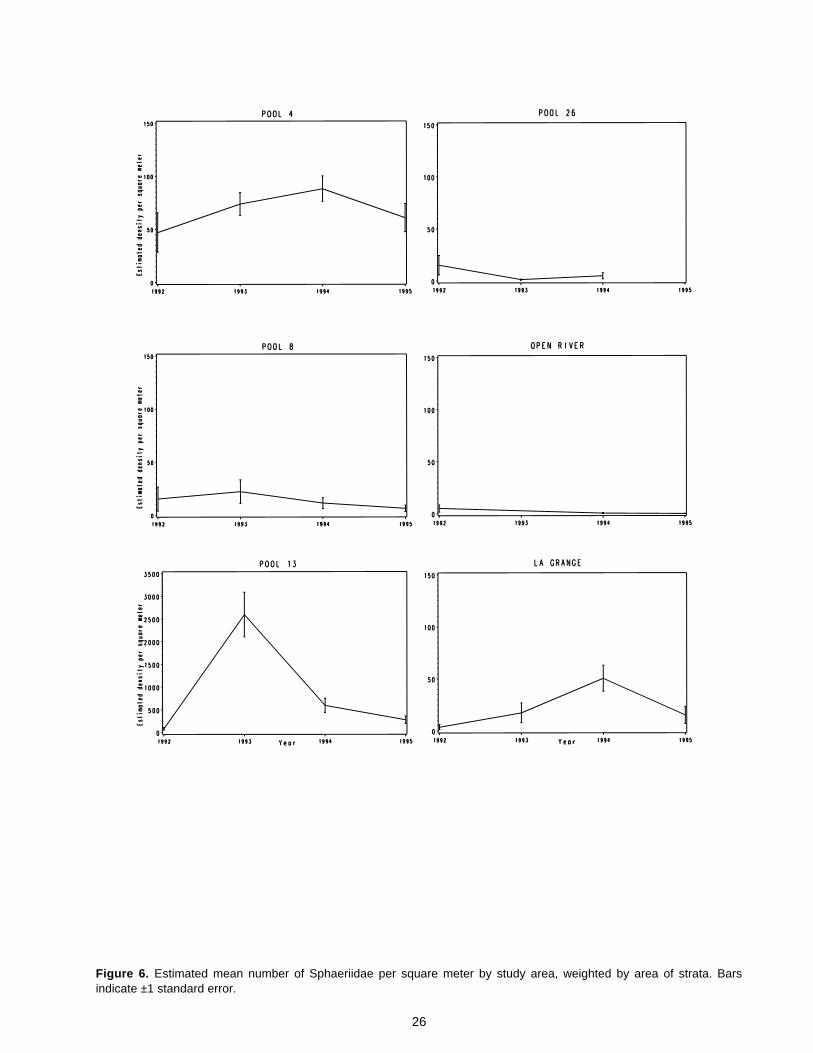
Sphaeriidae (Fingernail Clams)
Pool 13 contained the highest of fingernail clams in all years (Table 5; Figure 6). In 1993, the offingernail clams in Pool 13 was 35 times that found in other study areas for the same year (Table 5). Thiswide variability is largely because of the high numbers of fingernail clams found in the impounded area ofPool 13 in 1993 (Table 6). More than 75% of the samples from Pools 8, 26, and the Open River had zerofingernail clams.
Within Pool 8, the BWC aquatic area supported the most fingernail clams, whereas Pools 4, 13, and 26of the IMP aquatic areas, including the naturally impounded Lake Pepin, supported the highest number offingernail clams (Table 6). Side channel areas had the highest fingernail clam densities in the Open River.Densities were less than 14.5 m in 1992 and dropped to less than 1.0 m in 1994 and 1995. Side channel-2 -2
areas also supported the highest number of fingernail clams in the La Grange Pool, although MCB areas hadclose to the same densities in 1994. In 1993–95, the IMP area of Pool 13 supported 35, 7.2, and4.6 (respectively) times the number of fingernail clams when compared with the next most productive area.
The silt clay substrate supported the highest number of fingernail clams except in Pool 26 where silt claywith sand had the highest mean densities (Table 7). The large-particle substrates (sand and gravel rock)supported the lowest densities of fingernail clams.
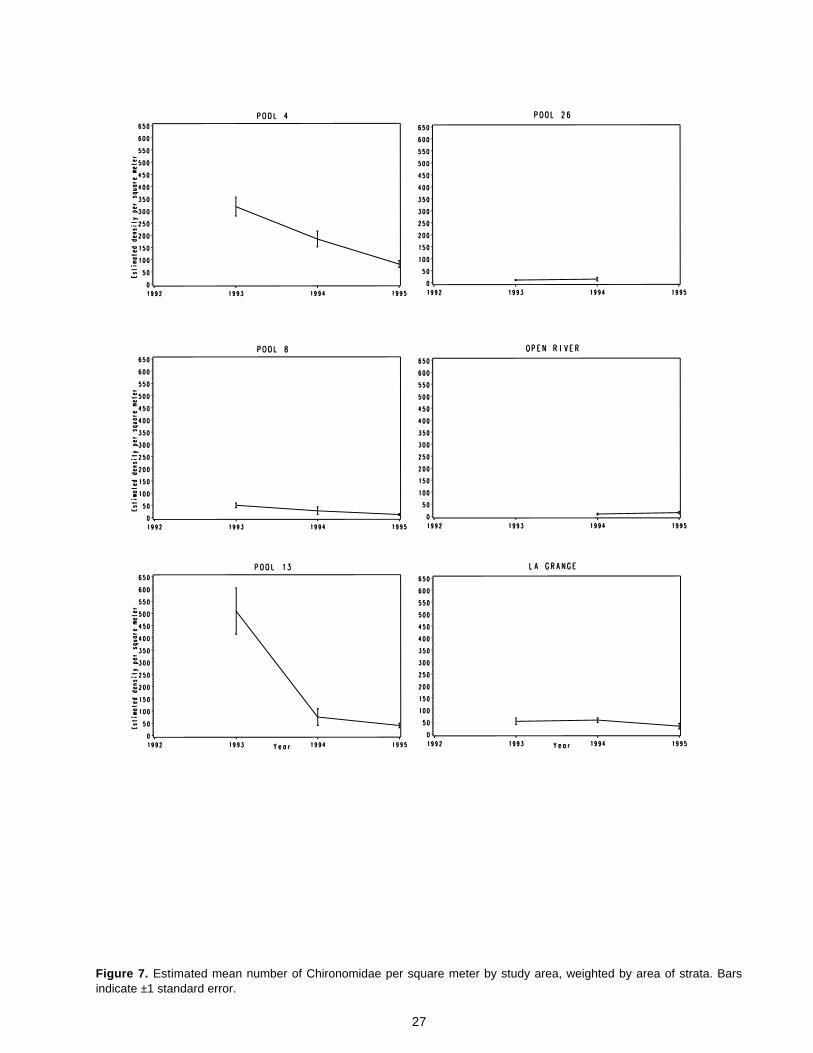
Chironomidae (Midges)
The monitoring of midge densities began in 1993. Although no significant linear trends were detected,Pools 4, 8, and 13 experienced year-to-year declines in midge densities. Pools 4 and 13 contained the highest of midges (Table 5; Figure 7). The lowest of midges were from Pool 26 and the Open River. Themaximum estimated mean densities found in these study areas were less than 15 m . Pool 13 had the largest-2
range in (469.6 m ) compared with other study areas.-2
Midge densities varied widely among aquatic areas over years and study areas. For example, in Pool 8high midge densities were found in the IMP area in 1993; in 1994, however, the highest midge densities werefound in SC areas (Table 6).
The small-particle substrates (silt clay, silt clay with sand, and sand with silt clay) supported the highestmean number of midges in all study areas (Table 7). The large-particle substrates (i.e., sand and gravel rock)along with hard clay had the lowest number of midges.
Corbicula fluminea (Asiatic Clam) and Dreissena polymerpha (Zebra Mussels)
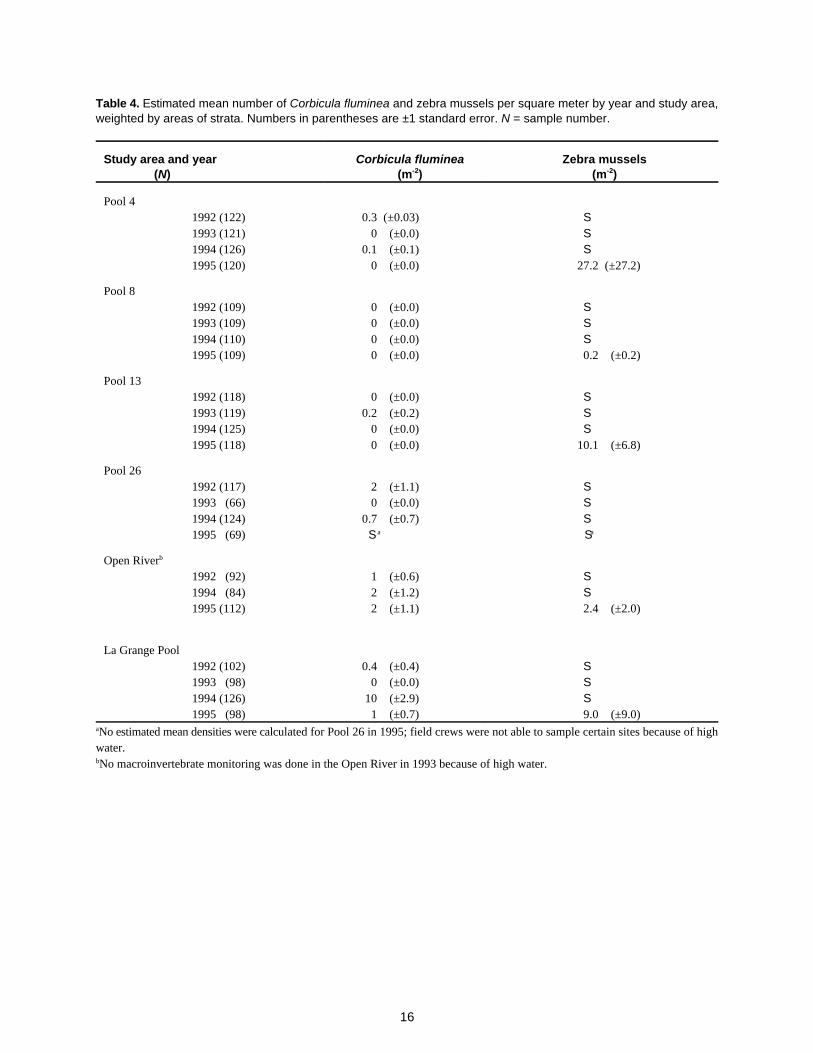
Because of the low number of C. fluminea and zebra mussels, no statistical analyses were undertaken(Table 4). Low numbers of C. fluminea were found in all study areas. More than 95% of the samplescontained zero C. fluminea and zebra mussels. No study areas had samples with more than 115 m-2
C. fluminea (6 individuals). A TDL aquatic area sample site in Pool 4 contained the highest density of zebramussels (1,500 m ; 78 individuals). Densities of zebra mussels are most likely under-represented because-2
of the sampling method.

8
Discussion
The most widespread annual collections of macroinvertebrates in the UMRS are now being made underthe LTRMP. The Program’s stratified random design is intended to estimate unbiased mean densities ofselect macroinvertebrates within aquatic area strata of each study area.
To sample such a large geographic area with large sample sizes, field-picking the macroinvertebrates wasconsidered the quickest and most economical process. Evaluation of quality control samples showed thatfield-picking was adequate for monitoring mayflies and midges and adult fingernail clams greater than 4.0mm in shell length (Gale 1969; Dukerschein et al. 1996).
Are the target organism densities observed during the 4 years of LTRMP monitoring low or high inrelation to long-term means? Although LTRMP data yield adequate mean estimates for the trend analysisreaches, few similar comprehensive inventories were made in the past, and therefore direct comparisons topre-LTRMP monitoring are difficult. Four years of monitoring indicate that a great deal of temporal andspatial variability exist in mayflies, fingernail clams, and midges populations.
We did not detect statistically significant linear trends across the 4 years within study areas formacroinvertebrates greater than 1.18 mm. Midge densities showed a decline, although not statisticallysignificant, in each study area. Compared with work done by Hornbach et al. (1993) midge densities reportedin this study seem low. Hornbach found midge densities greater than 4,000 m in a backwater lake in Pool-2
2. Few studies have examined the abundance and distribution of midges on the UMRS. Midges can constitutea large portion of the benthic community (Eckblad 1986).
Differences between study areas were detectable, especially in the high densities of fingernail clams foundin Pool 13. Two possible explanations for Pool 13 having the highest densities of fingernail clams are that(1) Pool 13 is at the lower end of a pollution gradient that extends downstream from Minneapolis–St. Paul(Wilson et al. 1995), or that (2) the substrates of the lower, very broad impounded area—3,555 ha—ofPool 13 are especially suitable for fingernail clams. Clearly, other factors are involved, since Pool 8, whichis also downstream from Minneapolis–St. Paul and is more than 3,500 ha, has relatively low densities offingernail clams (<25 m ). An explanation of this phenomenon becomes more complicated when one-2
considers that mean densities of fingernail clams at specific sites in Lake Onalaska in Pool 7 and areas inPool 9 have reached more than 1,000 m in the fall of the year (Eric Nelson, U.S. Fish and Wildlife Service,-2
personal communication) while mean densities in Pool 8 fall sampling were below 15 m . Gale (1969)-2
reported fingernail clam population densities for Pool 19 at more than 5,000 m . Sphaeriidae populations-2
in several backwater lakes in Pool 9 varied from 631.8 m in 1976 to 11.3 m in 1989 and then increased-2 -2
to 78.0 m in 1990 (Eckblad and Lehtinen 1991). -2
The densities of mayflies collected in LTRMP sampling are well within the ranges reported by paststudies. Mayfly densities were highly variable, with concentrations as high as 340 m in certain habitats-2
(Fremling and Johnson 1990). Fremling (1989) detected the rebound of Hexagenia in Pool 2 and Lake Pepinin Pool 4 during the 1980s and a subsequent population decline in 1988. Carlander et al. (1967) showed howdynamic Hexagenia populations can be in Pool 19 from year to year with estimated whole pool populationsof 3.6 billion in 1959 to 23.6 billion in 1962. Carlander found Hexagenia density ranges in June samplingof zero to 1,292 m along his transects. -2
Some local studies suggest that mayfly and fingernail clam densities have been declining (Eckblad 1991;Wilson et al. 1995). The results from the stratified random sampling of the LTRMP suggest that relativelylow densities throughout the river could be the rule rather than the exception. This apparent conflict of

9
findings is likely due in part to differing purposes and spatial scopes of the studies. Local studies are oftendesigned to quantify change—often already under way—in a localized area known for its value as a sourcefor macroinvertebrates and considered at risk because of some destructive event or activity. The stratifiedrandom design of the LTRMP macroinvertebrate component ensures that results from every stratum areunbiased, enabling the monitoring of trends over whole strata and study areas (Gutreuter 1993).
Declines in macroinvertebrate densities indicated in the localized studies are a cause for concern. Thevalue of the river macroinvertebrate community as a source of food for fish and waterfowl cannot beoverstated. For example, Mills et al. (1966) reported a decline in the number of fingernail clams thatcoincided with a similar decline in the number of diving ducks utilizing the Illinois River. Long-termmonitoring is intended to provide a better understanding of the conditions needed to support viablemacroinvertebrate populations at levels adequate for sustaining native fish and migrating waterfowl.
Acknowledgments
The Long Term Resource Monitoring Program is a cooperative effort by the Biological ResourcesDivision of the U.S. Geological Survey, the U.S. Army Corps of Engineers, the Minnesota Department ofNatural Resources, the Illinois Department of Conservation, the Illinois Natural History Survey, the IowaDepartment of Natural Resources, the Missouri Department of Conservation, and the Wisconsin Departmentof Natural Resources. Monitoring is conducted by the participating State resource management and researchagencies. Thanks go to these agencies and field station staff, especially K. Douglas Blodgett, Robert Burdis,Troy Clemment, Lesly Conaway, Steve DeLain, J. Terry Dukerschein, Russ Gent, Robert Hrabik, MattO'Hara, Walter Popp, Dirk Soergel, Michael Stueck, Chuck Theiling, and John Tucker. Special appreciationgoes to Pam Thiel, U.S. Fish and Wildlife Service, for the initiation of the macroinvertebrate monitoringprogram in 1992 and Steve Gutreuter, U.S. Geological Survey, for statistical assistance.
References
Anderson, K. B. 1977. Musculium transversum in the Illinois River and an acute potassium bioassay methodfor the species. M.S. Thesis, Western Illinois University, Macomb. 79 pp.
Brewer, S. K. 1992. Community structure of benthic macroinvertebrates in Navigation Pool No. 8, UpperMississippi River: Comparisons between 1975 and 1990. M.S. Thesis, University of Wisconsin–LaCrosse. 47 pp.
Carlander, K. D., C. A. Carlson, V. Gooch, and T. L. Wenke. 1967. Populations of Hexagenia naiads inPool 19, Mississippi River, 1959–1963. Ecology 48:873–878.
Carlson, C. A. 1968. Summer bottom fauna of the Mississippi River, above Dam 19, Keokuk, Iowa. Ecology49:162–169.
Cochran, W. G. 1977. Sampling techniques. 3rd edition. John Wiley & Sons, New York.
Colbert, B. K., J. E. Scott, J. H. Johnson, and R. C. Solomon. 1975. Environmental inventory and assessmentof Navigation Pools 24, 25, and 26, Upper Mississippi and Lower Illinois Rivers: An aquatic analysis.Technical Report Y-75-2, U.S. Army Corps of Engineers, Waterways Experiment Station, Vicksburg,Mississippi. 137 pp. + Appendixes
10
DeGroot, M. H. 1975. Probability and statistics. Addison-Wesley, Reading, Massachusetts. 607 pp.
Dukerschein, J. T., R. Gent, and J. Sauer. 1996. Recovery of macroinvertebrates by screening in the field:A comparison between coarse (1.18 mm)- and fine (0.66 mm)-mesh sieves. Journal of Freshwater Ecology11:61–65.
Eckblad, J. W. 1986. The ecology of Pools 11–13 of the Upper Mississippi River: A community profile.U.S. Fish and Wildlife Service Biological Report 85. 90 pp.
Eckblad, J. W. 1991. LTRMP Observational Bulletin No. 1. Status of macroinvertebrate populations of theUpper Mississippi River. Report by Luther College, Decorah, Iowa, for the U.S. Fish and WildlifeService, Environmental Management Technical Center, Onalaska, Wisconsin, April 1991. EMTC 91-03.8 pp. (NTIS # PB91-197863)
Eckblad, J. W., and S. F. Lehtinen. 1991. Decline in fingernail clam populations (Family Sphaeriidae) frombackwater lakes of the Upper Mississippi River. Journal of Freshwater Ecology 6:353–361.
Elstad, C. A. 1977. Macrobenthic survey of Navigation Pool No. 8 of the Upper Mississippi River, withspecial reference to ecological relationships. M.S. Thesis, University of Wisconsin–La Crosse. 231 pp.
Emge, W. P., R. C. Solomon, J. H. Johnson, C. R. Bingham, B. K. Colbert, and R. W. Hall. 1974. Physical,biological, and chemical inventory of twenty-three side channels and four river border areas, middleMississippi River. Technical Report Y-74-5, U.S. Army Corps of Engineers, Waterways ExperimentStation, Vicksburg, Mississippi. 163 pp. + Appendixes
Fremling, C. R. 1964. Mayfly distribution indicates water quality on the Upper Mississippi River. Science
146:1164–1166.
Fremling, C. R. 1973. Factors influencing the distribution of burrowing mayflies along the Mississippi River.Pages 12–15 in W. L. Peters and J. G. Peters, editors. Proceedings of the First International Conferenceon Ephemeroptera. E. J. Brill Publishers, Leiden, Netherlands.
Fremling, C. R. 1989. Hexagenia mayflies: Biological monitors of water quality in the Upper MississippiRiver. Journal Minnesota Academy of Science 55:139–143.
Fremling, C. R., and D. K. Johnson. 1990. Recurrence of Hexagenia mayflies demonstrates improved waterquality in Pool 2 and Lake Pepin, Upper Mississippi River. Pages 243–248 in Mayflies and stoneflies:Proceedings of the Fifth International Ephemeroptera Conference and the Ninth International PlecopteraConference. J. C. Campbell, editor. Kluwer Academic Publishers, Belgium.
Gale, W. F. 1969. Bottom fauna of Pool 19, Mississippi River with emphasis on the life history of thefingernail clam, Sphaerium transversum. Ph.D. Dissertation, Iowa State University, Ames. 234 pp.
Gutreuter, S. 1993. A statistical review of sampling of fishes in the Long Term Resource MonitoringProgram. National Biological Survey, Environmental Management Technical Center, Onalaska,Wisconsin, December 1993. EMTC 93-T004. 15 pp. (NTIS # PB94-150828)
Hoopes, D. T. 1960. Utilization of mayflies and caddisflies by some Mississippi River fishes. Transactionsof the American Fisheries Society 89:32–34.
11
Hornbach, D. J., T. Deneka, M. Hu, B. S. Payne, and A. C. Miller. 1993. Temporal and spatial variabilityin midge assemblages from a backwater lake in Pool 2, Mississippi River. Hydrobiologia 252:133–141.
Hubert, W. A., G. E. Darnell, and D. E. Dalk. 1983. Evaluation of wintering benthic macroinvertebrates ofPool 13 of the Upper Mississippi River. U.S. Army Corps of Engineers, Rock Island District, Rock Island,Illinois. Letter Order NCR-LO-83-C12. 30 pp.
Jackson, G. A., C. E. Korschgen, P. A. Thiel, J. M. Besser, D. W. Steffeck, and M. H. Bockenhauer. 1981.A long-term resource monitoring plan for the Upper Mississippi River System. Volume 1. Contract Report14-16-009-81-903 for the Upper Mississippi River Basin Commission, Bloomington, Minnesota. 966 pp.+ Appendixes
Jude, D. J. 1968. Bottom fauna utilization and distribution of ten species of fish in Pool 19, Mississippi River.M.S. Thesis, Iowa State University, Ames. 238 pp.
Littell, R. C., R. J. Freund, and P. C. Spector. 1991. SAS System for linear models. 3rd edition. SAS®
Institute Inc., Cary, North Carolina. 329 pp.
Lowenberg, C. 1993. 1989 Systemic land cover/land use data in EPPL7 format. National BiologicalSurvey, Environmental Management Technical Center, Onalaska, Wisconsin, December 1993.EMTC 93-P008. 6 pp. + 2 diskettes
Lubinski, K. S. 1993. A conceptual model of the Upper Mississippi River ecosystem. U.S. Fish and WildlifeService, Environmental Management Technical Center, Onalaska, Wisconsin. EMTC 93-T001. 23 pp.
Mills, H. B., W. C. Starrett, and F. C. Bellrose. 1966. Man's effect on the fish and wildlife of the IllinoisRiver. Illinois Natural History Survey, Biological Notes 57. 24 pp.
Myslinski, E., and W. Ginsburg. 1977. Macroinvertebrates as indicators of pollution. American Water WorksAssociation Journal 69:538–544.
Norris, R. H., and A. Georges. 1992. Analysis and interpretation of benthic macroinvertebrate surveys. Pages234–286 in Freshwater biomonitoring and benthic macroinvertebrates. D. M. Rosenberg and V. H. Resh,editors. Chapman and Hall, New York.
Owens, T., and J. J. Ruhser. 1996. Long Term Resource Monitoring Program standard operating procedures:Aquatic areas database production. National Biological Service, Environmental Management TechnicalCenter, Onalaska, Wisconsin, March 1996. LTRMP 95-P008-6. 4 pp. + Appendix (NTIS # PB96-172267)
Paloumpis, A. A., and W. C. Starrett. 1960. An ecological study of benthic organisms in three Illinois Riverflood plain lakes. American Midland Naturalist 64:406–435.
Ranthum, R. G. 1969. Distribution and food habits of several species of fish in Pool 19, Mississippi River.M.S. Thesis, Iowa State University, Ames. 207 pp.
Reice, S. R., and M. Wohlenberg. 1992. Monitoring freshwater benthic macroinvertebrates and benthicprocesses: Measures for assessment of ecosystem health. Pages 287–305 in Freshwater biomonitoringand benthic macroinvertebrates, D. M. Rosenberg and V. H. Resh, editors. Chapman and Hall, New York.

12
Rosenberg, D. M., and V. H. Resh. 1993. Freshwater biomonitoring and benthic macroinvertebrates.Chapman and Hall, New York.
Sauer, J. 1996. Annual status report: 1992 macroinvertebrate sampling. National Biological Service,Environmental Management Technical Center, Onalaska, Wisconsin, February 1996. LTRMP 96-P001.18 pp. + Appendix A (NTIS # PB96-158860)
Sauer, J. S. 1997a. Annual status report, 1993: Macroinvertebrate sampling. U.S. Geological Survey,Environmental Management Technical Center, Onalaska, Wisconsin, February 1997. LTRMP 97-P001.17 pp. (NTIS #PB97-153662)
Sauer, J. 1997b. Annual status report, 1994: Macroinvertebrate sampling. U.S. Geological Survey,Environmental Management Technical Center, Onalaska, Wisconsin, February 1997. LTRMP 97-P002.19 pp. (NTIS #PB97-153670)
Sauer, J. 1997c. Annual status report, 1995: Macroinvertebrate sampling. U.S. Geological Survey,Environmental Management Technical Center, Onalaska, Wisconsin, April 1997. LTRMP 97-P003.18 pp. (NTIS #PB97-159719)
Sauer, J. 1997d. Annual status report, 1996: Macroinvertebrate sampling. U.S. Geological Survey,Environmental Management Technical Center, Onalaska, Wisconsin, April 1997. LTRMP97-P004. 18 pp.
Steingraber, M. T., and J. G. Wiener. 1995. Bioassessment of contaminant transport and distribution inaquatic ecosystems by chemical analysis of burrowing mayflies (Hexagenia). Regulated Rivers: Research& Management 11:201–209.
Thiel, P. A., and J. S. Sauer. 1995. Long Term Resource Monitoring Program procedures: Macroinvertebratemonitoring. National Biological Service, Environmental Management Technical Center, Onalaska,Wisconsin, August 1995. LTRMP 95-P002-2. 9 pp. + Appendixes A–G
Thompson, D. 1973. Feeding ecology of diving ducks on Keokuk Pool, Mississippi River. Journal ofWildlife Management 37:367–381.
Tucker, J. K. 1995a. Windrow formation of two snails (Families Viviparidae and Pleuroceridae) colonizedby the exotic zebra mussel, Dreissena polymorpha. Journal of Freshwater Ecology 9:85–86.
Tucker, J. K. 1995b. Colonization of unionid bivalves by the zebra mussel, Dreissena polymorpha, inPool 26 of the Mississippi River. Journal of Freshwater Ecology 9:129–134.
U.S. Fish and Wildlife Service. 1993. Operating Plan for the Upper Mississippi River System Long TermResource Monitoring Program. Environmental Management Technical Center, Onalaska, Wisconsin,Revised September 1993. EMTC 91-P002R. 179 pp. (NTIS #PB94-160199)
Wilcox, D. B. 1993. An aquatic habitat classification system for the Upper Mississippi River System.U.S. Fish and Wildlife Service, Environmental Management Technical Center, Onalaska, Wisconsin, May1993. EMTC 93-T003. 9 pp. + Appendix A (NTIS # PB93-208981)

13
Wilson, D. M., T. J. Naimo, J. G. Weiner, R. V. Anderson, M. B. Sandheinrich, and R. E. Sparks. 1995.Declining populations of the fingernail clam Musculium transversum in the Upper Mississippi River.Hydrobiologia 304:209–220.
Table 1. Macroinvertebrate random sample sites by study area and aquatic area—parentheses indicate numbers ofhistorical (fixed) sites.
Study area and floodplain Contiguous channelyear shallow backwater Impounded Side channel border
Contiguous Main
a
Pool 41992 22 (3) 25 24 (1) 25 251993 S 57 (3) 44 (1) 10 101994 S 57 (3) 44 (1) 10 101995 S 57 (3) 44 (1) 10 10
b
Pool 81992 24 (1) 23 (2) 14 (11) 23 (2) 251993 S 34 49 (11) 19 (2) 101994 S 34 49 (11) 19 (2) 101995 S 34 49 (11) 19 (2) 10
Pool 131992 25 23 (2) 24 (1) 20 (4) 251993 S 43 (2) 46 (1) 14 (4) 151994 S 43 (2) 46 (1) 14 (4) 151995 S 43 (2) 46 (1) 14 (4) 15
Pool 261992 S 30 31 29 (3) 27 (4)1993 S 40 27 34 (3) 17 (4)1994 S 40 27 34 (3) 17 (4)1995 S 40 27 34 (3) 17 (4)
Open River1992 S S S 32 (16) 46 (2)1993 S S S 64 (16) 43 (2)1994 S S S 64 (16) 43 (2)1995 S S S 64 (16) 43 (2)
La Grange Pool1992 S 23 (18) S 35 (7) 41 (1)1993 S 22 (18) S 35 (7) 40 (1)1994 S 22 (18) S 35 (7) 40 (1)1995 S 22 (18) S 35 (7) 40 (1)
CFS was reclassified into other aquatic areas in 1993.a
Impounded for Pool 4 is defined as Lake Pepin.b

14

15
Table 2. Sampling dates for macroinvertebrate sampling.
Sampling period
Study area and year Starting date Ending date
Pool 41992 June 13 June 301993 May 3 May 141994 May 2 May 101995 May 9 May 11
Pool 81992 June 15 June 261993 May 24 June 101994 May 23 June 61995 May 22 June 2
Pool 131992 June 2 June 231993 April 12 June 11994 May 10 June 11995 May 11 May 19
Pool 261992 June 2 June 261993 April 12 June 101994 May 10 May 311995 May 11 May 19
Open River1992 June 1 June 121993a
1994 April 4 April 121995 April 3 April 17
La Grange Pool1992 June 8 June 241993 April 28 May 121994 May 2 May 121995 May 1 May 10
Not sampled because of flooding.a
Table 3. Results of analysis of covariance on weighted pool/reachwide means with year, study area, andtheir interactions as independent variables. Those independent variables shown with an * significantly (P < 0.05)influenced the dependent variables.
Dependent variables
Independent variable Ephemeroptera Sphaeriidae Chironomidae
Year P = 0.89 P = 0.79 P = 0.52
Study area *P = 0.0001 *P = 0.0095 *P = 0.0341
Year*study area P = 0.11 P = 0.53 P = 0.13
16
Table 4. Estimated mean number of Corbicula fluminea and zebra mussels per square meter by year and study area,weighted by areas of strata. Numbers in parentheses are ±1 standard error. N = sample number.
Study area and year Corbicula fluminea Zebra mussels (N) (m ) (m )-2 -2
Pool 41992 (122) 0.3 (±0.03) S 1993 (121) 0 (±0.0) S 1994 (126) 0.1 (±0.1) S 1995 (120) 0 (±0.0) 27.2 (±27.2)
Pool 81992 (109) 0 (±0.0) S 1993 (109) 0 (±0.0) S 1994 (110) 0 (±0.0) S 1995 (109) 0 (±0.0) 0.2 (±0.2)
Pool 131992 (118) 0 (±0.0) S 1993 (119) 0.2 (±0.2) S 1994 (125) 0 (±0.0) S 1995 (118) 0 (±0.0) 10.1 (±6.8)
Pool 261992 (117) 2 (±1.1) S 1993 (66) 0 (±0.0) S 1994 (124) 0.7 (±0.7) S 1995 (69) S S a a
Open Riverb
1992 (92) 1 (±0.6) S 1994 (84) 2 (±1.2) S 1995 (112) 2 (±1.1) 2.4 (±2.0)
La Grange Pool1992 (102) 0.4 (±0.4) S 1993 (98) 0 (±0.0) S 1994 (126) 10 (±2.9) S 1995 (98) 1 (±0.7) 9.0 (±9.0)
No estimated mean densities were calculated for Pool 26 in 1995; field crews were not able to sample certain sites because of higha
water.No macroinvertebrate monitoring was done in the Open River in 1993 because of high water.b

17
Table 5. Reachwide estimated mean number of Ephemeroptera, Sphaeriidae, and Chironomidae per square meter byyear and study area, weighted by areas of strata. Numbers in parentheses are ±1 standard error. N = sample number.
Study area and year Ephemeroptera Sphaeriidae Chironomidae (N) (m ) (m ) (m )-2 -2 -2
Pool 41992 (122) 59 (±18.2) 47 (±18.5) S
1993 (121) 128 (±36.2) 74 (±10.8) 317 (±39.0)1994 (126) 203 (±50.0) 88 (±12.2) 184 (±32.5)1995 (120) 178 (±35.9) 61 (±13.3) 81 (±13.9)
Pool 81992 (109) 51 (±24.6) 15 (±11.4) S
1993 (109) 118 (±40.9) 22 (±11.0) 50 (±9.4)1994 (110) 86 (±27.6) 11 (±5.0) 27 (±15.8)1995 (109) 55 (±14.2) 6 (±3.0) 11 (±3.9)
Pool 131992 (118) 120 (±30.5) 84 (±27.6) S
1993 (119) 155 (±39.3) 2,596 (±494.3) 509 (±94.8)1994 (125) 194 (±35.8) 594 (±156.5) 75 (±34.1)1995 (118) 182 (±51.7) 276 (±81.9) 40 (±9.4)
Pool 261992 (117) 21 (±9.5) 15 (±9.4) S
1993 (66) 7 (±1.9) 1 (±0.5) 10 (±2.1)1994 (124) 21 (±6.3) 5 (±2.9) 14 (±7.7)1995 (69) S S Sa
Open River1992 (92) 22 (±12.0) 5 (±3.4) S
1993 S S Sb
1994 (84) 19 (±8.6) 1 (±0.5) 8 (±3.6)1995 (112) 12 (±5.5) 0 (±0.0) 14 (±5.0)
La Grange Pool1992 (102) 13 (±6.3) 4 (±2.4) S
1993 (98) 11 (±4.8) 17 (±9.5) 52 (±14.3)1994 (126) 27 (±8.5) 51 (±12.5) 57 (±9.9)1995 (98) 6 (±3.5) 15 (±8.2) 32 (±12.1)
No estimated reach wide densities since sampling was not completed because of flooding.a
Not sampled because of flooding.b

18
Table 6. Mean number of organisms per square meter by study area and aquatic area with all years combined. Numbers in parentheses below target organisms are±1 standard error. N = sample number. BWC = contiguous backwaters, MCB = main chanel borders, IMP = impounded areas, SC = side channels, and TDL = tributarydelta lake.
Study and year Ephemeroptera Sphaeriidae Chironomidae Corbicula sp. Zebra musselsarea (N) (m ) (m ) (m ) (m ) (m )
Aquatic area
-2 -2 -2 -2 -2
Pool 4 BWC1992 (25) 116.2 (±35.9) 25.4 (±8.7) S 0.0 (±0.0) S1993 (57) 74.2 (±18.4) 12.8 (±2.9) 202.8 (±32.2) 0.0 (±0.0) S 1994 (60) 103.8 (±20.7) 22.8 (±5.8) 233.0 (±61.2) 0.3 (±0.3) S 1995 (56) 55.6 (±12.6) 8.2 (±2.6) 116.1 (±16.5) 0.0 (±0.0) 0.7 (±0.7)
a b
MCB1992 (25) 31.5 (±27.6) 15.4 (±9.2) S 0.8 (±0.8) S 1993 (10) 1.9 (±1.9) 1.9 (±1.9) 40.4 (±34.2) 0.0 (±0.0) S 1994 (10) 25.0 (±25.0) 0.0 (±0.0) 23.1 (±21.0) 0.0 (±0.0) S 1995 (11) 57.7 (±57.7) 7.0 (±3.9) 10.5 (±6.0) 0.0 (±0.0) 17.5 (±17.5)
SC1992 (24) 29.6 (±10.7) 7.2 (±3.4) S 0.0 (±0.0) S 1993 (10) 28.8 (±20.5) 1.9 (±1.9) 86.5 (±50.3) 0.0 (±0.0) S 1994 (10) 103.8 (±101.7) 1.9 (±1.9) 134.6 (±80.2) 0.0 (±0.0) S 1995 (10) 21.2 (±12.3) 11.5 (±9.6) 11.5 (±5.1) 0.0 (±0.0) 0.0 (±0.0)
TDL1992 (24) 48.1 (±14.6) 58.4 (±23.5) S 0.0 (±0.0) S 1993 (44) 149.9 (±42.0) 94.4 (±13.3) 364.1 (±38.4) 0.0 (±0.0) S 1994 (46) 235.4 (±52.4) 111.2 (±14.7) 178.5 (±21.6) 0.0 (±0.0) S 1995 (43) 218.2 (±40.3) 77.4 (±16.0) 79.2 (±13.9) 0.0 (±0.0) 34.9 (±34.9)
Pool 8 BWC1992 (23) 42.6 (±19.3) 6.7 (±3.7) S 0.0 (±0.0) S 1993 (29) 149.2 (±65.2) 41.1 (±31.1) 39.8 (±10.5) 0.0 (±0.0) S 1994 (32) 105.2 (±30.0) 14.4 (±8.0) 38.5 (±11.0) 0.0 (±0.0) S 1995 (31) 62.0 (±19.5) 9.9 (±6.3) 12.2 (±3.6) 0.0 (±0.0) 0.0 (±0.0)

Table 6. Continued
Study and year Ephemeroptera Sphaeriidae Chironomidae Corbicula sp. Zebra musselsarea (N) (m ) (m ) (m ) (m ) (m )
Aquatic area
-2 -2 -2 -2 -2
19
IMP1992 (14) 46.7 (±26.3) 17.9 (±15.0) S 0.0 (±0.0) S 1993 (52) 123.5 (±25.4) 20.7 (±3.9) 66.2 (±7.6) 0.0 (±0.0) S 1994 (49) 110.7 (±34.6) 12.2 (±4.4) 12.2 (±6.6) 0.0 (±0.0) S 1995 (49) 82.4 (±16.3) 7.5 (±2.2) 13.3 (±3.5) 0.0 (±0.0) 0.0 (±0.0)
MCB1992 (25) 14.6 (±6.3) 0.8 (±0.8) S 0.0 (±0.0) S 1993 (10) 0.0 (±0.0) 3.8 (±2.6) 9.6 (±7.7) 0.0 (±0.0) S 1994 (10) 1.9 (±1.9) 0.0 (±0.0) 3.8 (±2.6) 0.0 (±0.0) S 1995 (10) 1.9 (±1.9) 3.8 (±3.8) 0.0 (±0.0) 0.0 (±0.0) 0.0 (±0.0)
SC1992 (23) 10.9 (±6.3) 0.8 (±0.8) S 0.0 (±0.0) S 1993 (18) 111.1 (±61.4) 7.5 (±3.5) 41.7 (±12.8) 0.0 (±0.0) S 1994 (19) 61.7 (±36.1) 10.1 (±4.5) 56.7 (±49.6) 0.0 (±0.0) S 1995 (19) 8.1 (±7.1) 0.0 (±0.0) 9.1 (±7.1) 0.0 (±0.0) 1.0 (±1.0)
Pool 13 BWC1992 (23) 36.0 (±14.1) 109.5 (±50.1) S 0.0 (±0.0) S 1993 (41) 93.8 (±24.7) 118.2 (±36.2) 264.1 (±59.2) 0.0 (±0.0) S 1994 (48) 392.2 (±60.2) 176.3 (±39.3) 143.8 (±43.3) 0.0 (±0.0) S 1995 (44) 153.8 (±32.4) 117.1 (±29.2) 93.1 (±18.0) 0.0 (±0.0) 1.3 (±1.0)
IMP1992 (24) 199.5 (±45.2) 81.7 (±16.1) S 0.0 (±0.0) S 1993 (45) 221.4 (±43.5) 6047.9 (±1104.7) 939.3 (±132.3) 0.4 (±0.4) S 1994 (47) 137.9 (±33.3) 1270.5 (±337.9) 43.4 (±33.0) 0.0 (±0.0) S 1995 (48) 238.4 (±52.8) 536.6 (±154.6) 18.0 (±6.9) 0.0 (±0.0) 16.0 (±9.2)
MCB1992 (25) 34.6 (±15.2) 10.0 (±5.0) S 0.0 (±0.0) S 1993 (15) 64.1 (±47.8) 175.6 (±128.9) 189.7 (±135.1) 0.0 (±0.0) S 1994 (15) 1.3 (±1.3) 2.6 (±1.7) 50.0 (±39.8) 0.0 (±0.0) S 1995 (15) 110.3 (±87.7) 59.0 (±37.3) 2.6 (±1.7) 0.0 (±0.0) 17.9 (±15.3)

Table 6. Continued
Study and year Ephemeroptera Sphaeriidae Chironomidae Corbicula sp. Zebra musselsarea (N) (m ) (m ) (m ) (m ) (m )
Aquatic area
-2 -2 -2 -2 -2
20
SC1992 (21) 54.0 (±25.1) 80.6 (±43.3) S 0.0 (±0.0) S 1993 (18) 191.2 (±56.0) 157.1 (±48.6) 32.1 (±15.6) 0.0 (±0.0) S 1994 (15) 23.1 (±11.1) 43.6 (±20.8) 7.7 (±3.7) 0.0 (±0.0) S 1995 (11) 134.6 (±62.3) 47.2 (±24.5) 1.7 (±1.7) 0.0 (±0.0) 5.2 (±5.2)
Pool 26 BWC1992 (30) 0.6 (±0.6) 3.2 (±2.1) S 0.0 (±0.0) S 1993 (32) 37.9 (±10.4) 7.8 (±3.0) 81.1 (±16.6) 0.0 (±0.0) S 1994 (40) 151.9 (±32.0) 13.5 (±6.8) 88.0 (±25.6) 0.5 (±0.5) S 1995 (41) 5.2 (±2.4) 0.9 (±0.7) 46.0 (±17.6) 0.0 (±0.0) 0.0 (±0.0)
IMP1992 (31) 47.8 (±23.2) 94.9 (±39.1) S 7.4 (±4.2) S 1993 (27) 121.1 (±36.8) 22.1 (±9.4) 136.0 (±26.4) 0.0 (±0.0) S 1994 (27) 118.2 (±36.4) 40.6 (±23.3) 45.6 (±14.7) 0.0 (±0.0) S 1995 (27) 21.4 (±11.2) 0.7 (±0.7) 31.3 (±15.0) 0.0 (±0.0) 3.6 (±2.9)
MCB1992 (27) 21.4 (±9.4) 17.1 (±12.0) S 2.1 (±1.6) S 1993 (3) 0.0 (±0.0) 0.0 (±0.0) 0.0 (±0.0) 0.0 (±0.0) S 1994 (19) 5.1 (±2.9) 4.0 (±2.8) 9.1 (±8.1) 1.0 (±1.0) S 1995 S S S S S c
SC1992 (29) 21.2 (±9.8) 1.3 (±0.9) S 0.0 (±0.0) S 1993 (4) 0.0 (±0.0) 0.0 (±0.0) 0.0 (±0.0) 0.0 (±0.0) S 1994 (38) 9.1 (±3.7) 0.0 (±0.0) 1.5 (±0.9) 0.0 (±0.0) S 1995 (1) 0.0 0.0 (±0.0) 0.0 0.0 (±0.0) 0.0 (±0.0)
Open River MCB1992 (46) 18.4 (±10.8) 3.8 (±3.0) S 0.8 (±0.6) S 1993 S S S S S 1994 (35) 20.9 (±9.4) 0.5 (±0.5) 8.2 (±3.9) 1.6 (±1.2) S 1995 (42) 11.9 (±5.8) 0.0 (±0.0) 10.1 (±4.1) 1.8 (±1.1) 2.7 (±2.3)
d

Table 6. Continued
Study and year Ephemeroptera Sphaeriidae Chironomidae Corbicula sp. Zebra musselsarea (N) (m ) (m ) (m ) (m ) (m )
Aquatic area
-2 -2 -2 -2 -2
21
SC1992 (46) 47.7 (±20.3) 14.2 (±6.9) S 1.7 (±1.0) S 1993 S S S S S 1994 (49) 7.1 (±2.8) 0.4 (±0.4) 3.9 (±1.6) 2.4 (±1.1) S 1995 (70) 10.4 (±3.5) 0.0 (±0.0) 41.5 (±12.1) 1.6 (±0.9) 0.0 (±0.0)
La Grange BWCPool 1992 (23) 20.9 (±9.9) 4.2 (±3.0) S 0.8 (±0.8) S
1993 (25) 16.9 (±7.0) 13.8 (±8.0) 91.5 (±22.4) 0.0 (±0.0) S 1994 (42) 44.0 (±13.0) 39.4 (±13.4) 54.0 (±9.6) 0.5 (±0.5) S 1995 (24) 1.6 (±1.1) 6.4 (±3.0) 54.5 (±24.1) 0.0 (±0.0) 0.0 (±0.0)
MCB1992 (41) 8.0 (±4.1) 2.8 (±1.7) S 0.0 (±0.0) S 1993 (38) 5.6 (±3.2) 17.2 (±9.1) 27.3 (±9.6) 0.0 (±0.0) S 1994 (42) 11.4 (±4.9) 57.2 (±12.0) 57.7 (±9.9) 16.5 (±4.6) S 1995 (39) 7.9 (±5.2) 19.7 (±11.5) 14.8 (±3.8) 2.5 (±1.3) 15.8 (±15.8)
SC1992 (38) 8.6 (±3.0) 10.6 (±6.3) S 1.0 (±0.7) S 1993 (35) 22.0 (±7.1) 48.9 (±27.8) 26.4 (±5.2) 0.0 (±0.0) S 1994 (42) 67.3 (±14.7) 61.8 (±11.4) 74.6 (±13.7) 11.7 (±3.0) S 1995 (35) 12.6 (±3.9) 33.0 (±11.7) 50.0 (±14.0) 0.5 (±0.5) 1.6 (±1.6)
Chironomidae not sampled in 1992.a
Zebra mussels not sampled in 1992–1994.b
Pool 26, MCB not sampled in 1995 because of flooding.c
Open River not sampled in 1993 because of flooding.d

22
Table 7. Mean number of organisms per square meter by study area and substrate type. Numbers in parentheses belowtarget organisms are ±1 standard error. N = sample number.
Study Predominant Ephemeroptera Sphaeriidae Chironomidaearea substrate (N) (m ) (m ) (m )-2 -2 -2
Pool 4 Hard clay (6) 16.0 (±16.0) 6.4 (±4.1) 72.1 (±6.0)
Silt clay (226) 170.9 (±17.0) 57.5 (± 5.8 ) 164.9 (±21.4)
Silt clay w/sand (93) 109.6 (±18.5) 48.8 (± 7.4 ) 265.0 (±27.4)
Sand w/silt clay (36) 23.0 (±8.6) 7.5 (±2.7) 273.5 (±65.5)
Sand (113) 1.9 (±0.6) 6.0 (±2.0) 63.9 (±15.8)
Gravel rock (13) 1.5 (±1.5) 0.0 (±0.0) 23.7 (±14.5)
Pool 8 Hard clay (18) 84.4 (±83.3) 17.1 (±6.2) 22.4 (±10.0)
Silt clay (142) 159.3 (±18.7) 17.5 (±3.4) 35.8 (±5.6)
Silt clay w/sand (104) 66.4 (±13.2) 14.8 (±8.8) 49.0 (±14.3)
Sand w/silt clay (72) 15.0 (±5.2) 10.7 (±2.2) 23.3 (±5.1)
Sand (100) 2.7 (±1.1) 1.0 (±0.4) 5.7 (±2.0)
Gravel rock (1) 134.6 (±0.0) 0.0 19.2
Pool 13 Hard clay (6) 22.4 (±12.6) 2,717.9 (±2,660.4) 22.4 (±18.9)
Silt clay (253) 248.1 (±19.6) 1,089.2 (±217.3) 260.0 (±38.9)
Silt clay w/sand (104) 118.0 (±20.9) 836.5 (±274.7) 236.7 (±64.0)
Sand w/silt clay (50) 5.8 (±1.9) 245.0 (±92.2) 110.8 (±48.6)
Sand (63) 2.1 (±1.4) 29.3 (±17.1) 0.8 (±0.6)
Gravel rock (4) 0.0 (±0.0) 9.6 (±9.6) 0.0
Pool 26 Hard clay (32) 37.3 ( ±21.8) 2.4 (1.7) 29.8 (±13.0)
Silt clay (213) 64.1 (±9.4) 23.8 (±6.8) 77.6 (±9.8)
Silt clay w/sand (33) 61.8 ±23.9) 28.0 (±12.2) 30.8 (±25.4)
Sand w/silt clay (9) 6.4 (±4.5) 4.3 (±4.3) 6.4 (±4.5)
Sand (82) 7.0 (±3.1) 0.5 (±0.3) 0.0 (±0.0)
Gravel rock (7) 22.0 (±19.0) 0.0 (±0.0) 6.4 (±6.4)
Open River Hard clay (20) 11.5 (±3.2) 0.0 (±0.0) 7.5 (±3.9)
Silt clay (76) 60.0 (±14.3) 9.1 (±4.2) 56.9 (±16.7)
Silt clay w/sand (28) 7.6 (±4.0) 4.8 (±4.8) 41.4 (±12.5)
Sand w/silt clay (14) 5.5 (±4.2) 0.0 (±0.0) 0.0 (±0.0)
Sand (115) 1.8 (±1.4) 0.3 (±0.2) 3.6 (±1.4)
Gravel rock (35) 1.6 (±0.9) 0.0 (±0.0) 2.7 (±2.1)
La Grange Pool Hard clay (28) 2.1 (±1.1) 27.5 (±6.5) 48.1 (±18.1)
Silt clay (225) 30.9 (±4.3) 35.0 (±6.4) 56.8 (±6.2)
Silt clay w/sand (89) 13.8 (±3.3) 29.2 (±5.9) 50.3 (±7.9)
Sand w/silt clay (24) 5.6 (±5.6) 18.4 (±7.8) 26.4 (±8.0)
Sand (56) 1.7 (±0.9) 6.9 (±4.3) 31.2 (±11.3)
Gravel rock (–) 0.0 (±0.0) 0.0 (±0.0) 0.0 (±0.0)
Pool 4
Pool 8
Pool 13
La Grange Pool
Pool 26
Open River
4%
5%
16%11%
64%
7%
16%21%
41%
15%
10%
9%25%
33% 23%
44%
20%
5%2%
29%
51%
7%
42%
22%
2%10%
66%
Main channel border
Side channel
Contiguous backwater
Impounded
Non-sampled aquatic area
Lake Pepin
Illinois river mile 157.8-80.2
La GrangeRiver mile
29-85
Open RiverRiver mile 203-241.5
Pool 26
River mile 753-797
Pool 4River mile 679-703
Pool 8River mile 522.7-557
Pool 13
23
Figure 1. Long Term Resource Monitoring Program study areas for macroinvertebrate sampling.
Figure 2. River miles and percentage of aquatic area in each study area.

1992 1993 1994 19950%
20%
40%
60%
80%
100%
1992 1993 1994 19950%
20%
40%
60%
80%
100%
1992 1993 1994 19950%
20%
40%
60%
80%
100%
1992 1993 1994 19950%
20%
40%
60%
80%
100%
1992 1993 1994 19950%
20%
40%
60%
80%
100%
1992 1993 1994 19950%
20%
40%
60%
80%
100%Pool 4
Pool 8
Pool 13
Pool 26
Open River
La Grange Pool
1
2
Sphaeriidae
Chironomidae
Corbicula fluminea
Dreissena polymorpha
Ephemeroptera
24
Figure 3. Frequency of target organisms in samples, 1992–1995.
Figure 4. Percent composition of target organisms: 1 = Zebra mussel sampling initiated in 1995, 2 = Midge samplinginitiated in 1993.

25
Figure 5. Estimated mean number of Ephemeroptera per square meter by study area, weighted by area of strata. Barsindicate ±1 standard error.
26
Figure 6. Estimated mean number of Sphaeriidae per square meter by study area, weighted by area of strata. Barsindicate ±1 standard error.
27
Figure 7. Estimated mean number of Chironomidae per square meter by study area, weighted by area of strata. Barsindicate ±1 standard error.
A-1
Appendix. Macroinvertebrate Collection Sheet

REPORT DOCUMENTATION PAGE Form ApprovedOMB No. 0704-0188
Public reporting burden for this collection of information is estimated to average 1 hour per response, including the time for reviewing instructions, searching existingdata sources, gathering and maintaining the data needed, and completing and reviewing the collection of information. Send comments regarding this burden estimate orany other aspect of this collection of information, including suggestions for reducing this burden, to Washington Headquarters Services, Directorate for InformationOperations and Reports, 1215 Jefferson Davis Highway, Suite 1204, Arlington, VA 22202-4302, and to the Office of Management and Budget, Paperwork ReductionProject (0704-0188), Washington, D.C. 20503
1. AGENCY USE ONLY (Leave blank) 2. REPORT DATE 3. REPORT TYPE AND DATES COVERED
April 1998
4. TITLE AND SUBTITLE 5. FUNDING NUMBERS
Temporal analyses of select macroinvertebrates in the Upper Mississippi River System, 1992–1995
6. AUTHOR(S)
Jennifer S. Sauer
7. PERFORMING ORGANIZATION NAME AND ADDRESS 8. PERFORMING ORGANIZATION
U.S. Geological Survey Environmental Management Technical Center575 Lester AvenueOnalaska, Wisconsin 54650
REPORT NUMBER
9. SPONSORING/MONITORING AGENCY NAME(S) AND ADDRESS(ES) 10. SPONSORING/MONITORING
U.S. Geological Survey Environmental Management Technical Center 98-T001575 Lester AvenueOnalaska, Wisconsin 54650
AGENCY REPORT NUMBER
11. SUPPLEMENTARY NOTES
12a. DISTRIBUTION/AVAILABILITY STATEMENT 12b. DISTRIBUTION CODE
Release unlimited. Available from National Technical Information Service, 5285 Port Royal Road, Springfield, VA 22161 (1-800-553-6847 or 703-487-4650. Available to registered users from the Defense Technical Information Center, Attn: Help Desk, 8725 Kingman Road, Suite 0944, Fort Belvoir, VA 22060-6218 (1-800-225-3842 or 703-767-9050).
13. ABSTRACT (Maximum 200 words)
The annual variability in mayflies (Ephemeroptera), fingernail clams (Sphaeriidae), and midges (Chironomidae) in six study areas of the Upper Mississippi River Systemfrom 1992 to 1995 was examined. Spatial distribution is also discussed for these organisms along with the Asiatic clam (Corbicula fluminea) and the zebra mussel(Dreissena polymorpha). Sample allocation within each reach was based on a stratified random design where strata were aquatic areas. No significant linear trendsacross years were found in estimated reachwide mean number of organisms. However, the overall test for differences in intercepts among study areas was statisticallysignificant (P < 0.05) for mayflies, fingernail clams, and midges. No statistical difference in trend slopes among reaches were detected. In 1993, the estimated mean densityof fingernail clams in Pool 13 was 35 times that found in other study areas. Overall, impounded aquatic areas and silt clay substrates supported higher numbers of theselect macroinvertebrates.
14. SUBJECT TERMS 15. NUMBER OF PAGES
Asiatic clam (Corbicula fluminea) benthic aquatic macroinvertebrates, Corbicula, fingernail claims (Sphaeriidae), mayflies 26 pp. + Appendix(Ephemeroptera), midges (Chironomidae), Mississippi River, zebra mussel (Dreissena polymorpha)
16. PRICE CODE
17. SECURITY CLASSIFICATION 18. SECURITY CLASSIFICATION 19. SECURITY CLASSIFICATION 20. LIMITATION OF ABSTRACT OF REPORT OF THIS PAGE OF ABSTRACT
Unclassified Unclassified Unclassified

The Long Term Resource Monitoring Program (LTRMP) for the Upper MississippiRiver System was authorized under the Water Resources Development Act of 1986 as an element of the Environmental Management Program. The mission of the LTRMPis to provide river managers with information for maintaining the Upper Mississippi River System as a sustainable large river ecosystem given its multiple-use character.The LTRMP is a cooperative effort by the U.S. Geological Survey, the U.S. Army Corpsof Engineers, and the States of Illinois, Iowa, Minnesota, Missouri, and Wisconsin.


