The Journal of Neuroscience, November 1992, 12(11): 43094326 Temporal and Harmonic Combination-Sensitive Neurons in the Zebra Finch’s HVc Daniel Margoliash and Eric S. Fortune Department of Organismal Biology and Anatomy, University of Chicago, Chicago, Illinois 60637 Song learning shapes the response properties of auditory neurons in the song system to become highly selective for the individual bird’s own (“autogenous”) song. The auditory representation of autogenous song is achieved in part by neurons that exhibit facilitated responses to combinations of components of song. To understand the circuits that un- derlie these complex properties, the combination sensitivity of single units in the hyperstriatum ventrale, pars caudale (HVc) of urethane-anesthetized zebra finches was studied. Some neurons exhibited nonlinear temporal summation, spectral summation, or both. The majority of these neurons exhibited low spontaneous rates and phasic responses. Most combination-sensitive neurons required highly accurate copies of sounds derived from the autogenous song and responded weakly to tone bursts, combinations of simple stimuli, or conspecific songs. Temporal combination-sen- sitive (TCS) neurons required either two or more segments of a single syllable, or two or more ,syllables of the autog- enous song, to elicit a facilitated, excitatory response. TCS neurons integrated auditory input over periods ranging from 80 to 350 msec, although this represents a lower limit. Har- monic combination-sensitive (HCS) neurons required com- binations of two harmonics with particular frequency and temporal characteristics that were similar to autogenous song syllables. Both TCS and HCS neurons responded much more weakly when the dynamical spectral features of the autog- enous song or syllables were modified ‘than when the dy- namical amplitude (waveform) features of the songs were modified. These results suggest that understanding the tem- poral dynamics of auditory responses in HVc may provide insight into neuronal circuits modified by song learning. A wide range of behavioral experiments in both humans (e.g., Stevens and Newman, 1936; Liberman et al., 198 1) and other animals (e.g., Griffin, 1958; Capranica, 1965; Heiligenberg et al., 1978; Knudsen and Konishi, 1979) demonstrate that a com- mon strategy for signal identification and localization is sensi- tivity to two or more spectral or temporal components of the signal. Detection of such combinations can release instinctive behaviors (Tinbergen, 195 1). Compelling evidence for neuronal Received Jan. 29, 1992; revised May 29, 1992; accepted June 2, 1992. We thank Mitchell L. Sutter, Bettina Diekamp, Philip S. Ulinski, and two anonymous reviewers for providing useful critiques of the manuscript. This work was supported by grants to D.M. from the NIH (1 RO 1 NS25677) and the Searle Scholars Program/Chicago Community Trust. Address correspondence to Dr. Daniel Margoliash, Department of Organismal Biology and Anatomy, The University ofchicago, 1025 East 57th Street, Chicago, IL 60637. Copyright 0 I992 Society for Neuroscience 0270-6474/92/124309-18$05.00/O mechanisms underlying these strategies is the selective and fa- cilitated, or nonlinear response of a neuron to combined ele- ments of a signal as compared to the responses to the individual elements. In the auditory system, such combination-sensitive (CS) neurons have been described extensively in echolocating bats (O’Neill and Suga, 1979; Suga et al., 1979, 1983; Sullivan, 1982; Tsuzuki and Suga, 1988; see Suga, 1990, for a recent review), and to a lesser degree in frogs (Fuzessery and Feng, 1982, 1983) and songbirds (Langner et al., 198 1; Margoliash, 1983). Neuronal combination sensitivity has often been de- scribed in the context of species-specific vocalizations, but is also important in target localization/identification in barn owls (Moiseff and Konishi, 198 1) and electric fish (Heiligenberg and Rose, 1985). The sites of neuronal combination sensitivity are often necessary for the behaviors under investigation, or project to motor areas that can initiate those behaviors (Bastian and Yuthas, 1984; Masino and Knudsen, 1990; Riquimaroux et al., 199 1; see also Brenowitz, 199 1). In the avian song system, CS neurons are found in the fore- brain nucleus hyperstriatum ventrale, pars caudale (HVc). HVc is part of the motor pathway for song production (Nottebohm et al., 1976; McCasland and Konishi, 198 l), but neurons in HVc also receive auditory input (Katz and Gurney, 1981). A subset of HVc neurons of adult white-crowned sparrows (Zo- notrichia leucophrys) are “song-specific” temporal combina- tion-sensitive (TCS) neurons that require sequential pairs of sounds for excitation (Margoliash, 1983). These neurons are highly selective for complex, idiosyncratic features of the in- dividual bird’s own (“autogenous”) song, and are embedded in a larger population of HVc neurons that exhibit somewhat less selectivity for autogenous song (Margoliash, 1983, 1986). Each bird’s autogenous song is a strongly excitatory stimulus for TCS neurons in the HVc of that bird, but typically elicits much weaker responses from TCS neurons of the HVc of conspecific birds. The idiosyncracy of these neuronal response properties reflects the idiosyncratic nature of song learning (Margoliash, 1986) and presumably is a result of complex interactions of auditory feedback and motor programs during song learning (Margoliash, 1987; see also Volman and Konishi, 1987). The detailed single-unit analysis of auditory neurons in the song system is limited to a single study of TCS neurons (Mar- goliash, 1983) and although many species, including zebra finches (Taeniopygia guttutu), produce songs rich in harmonics, there has been no evidence to date regarding harmonic combination- sensitive (HCS) neurons in the song system. Here, we describe the response properties of TCS and HCS neurons in adult male zebra finches. The response properties of these neurons share several features with those previously described for white- crowned sparrows. The song selectivity and specificity for acous-
Transcript
The Journal of Neuroscience, November 1992, 12(11): 43094326
Temporal and Harmonic Combination-Sensitive Neurons in the Zebra Finch’s HVc
Daniel Margoliash and Eric S. Fortune
Department of Organismal Biology and Anatomy, University of Chicago, Chicago, Illinois 60637
Song learning shapes the response properties of auditory neurons in the song system to become highly selective for the individual bird’s own (“autogenous”) song. The auditory representation of autogenous song is achieved in part by neurons that exhibit facilitated responses to combinations of components of song. To understand the circuits that un- derlie these complex properties, the combination sensitivity of single units in the hyperstriatum ventrale, pars caudale (HVc) of urethane-anesthetized zebra finches was studied. Some neurons exhibited nonlinear temporal summation, spectral summation, or both. The majority of these neurons exhibited low spontaneous rates and phasic responses. Most combination-sensitive neurons required highly accurate copies of sounds derived from the autogenous song and responded weakly to tone bursts, combinations of simple stimuli, or conspecific songs. Temporal combination-sen- sitive (TCS) neurons required either two or more segments of a single syllable, or two or more ,syllables of the autog- enous song, to elicit a facilitated, excitatory response. TCS neurons integrated auditory input over periods ranging from 80 to 350 msec, although this represents a lower limit. Har- monic combination-sensitive (HCS) neurons required com- binations of two harmonics with particular frequency and temporal characteristics that were similar to autogenous song syllables. Both TCS and HCS neurons responded much more weakly when the dynamical spectral features of the autog- enous song or syllables were modified ‘than when the dy- namical amplitude (waveform) features of the songs were modified. These results suggest that understanding the tem- poral dynamics of auditory responses in HVc may provide insight into neuronal circuits modified by song learning.
A wide range of behavioral experiments in both humans (e.g., Stevens and Newman, 1936; Liberman et al., 198 1) and other animals (e.g., Griffin, 1958; Capranica, 1965; Heiligenberg et al., 1978; Knudsen and Konishi, 1979) demonstrate that a com- mon strategy for signal identification and localization is sensi- tivity to two or more spectral or temporal components of the signal. Detection of such combinations can release instinctive behaviors (Tinbergen, 195 1). Compelling evidence for neuronal
Received Jan. 29, 1992; revised May 29, 1992; accepted June 2, 1992. We thank Mitchell L. Sutter, Bettina Diekamp, Philip S. Ulinski, and two
anonymous reviewers for providing useful critiques of the manuscript. This work was supported by grants to D.M. from the NIH (1 RO 1 NS25677) and the Searle Scholars Program/Chicago Community Trust.
Address correspondence to Dr. Daniel Margoliash, Department of Organismal Biology and Anatomy, The University ofchicago, 1025 East 57th Street, Chicago, IL 60637. Copyright 0 I992 Society for Neuroscience 0270-6474/92/124309-18$05.00/O
mechanisms underlying these strategies is the selective and fa- cilitated, or nonlinear response of a neuron to combined ele- ments of a signal as compared to the responses to the individual elements. In the auditory system, such combination-sensitive (CS) neurons have been described extensively in echolocating bats (O’Neill and Suga, 1979; Suga et al., 1979, 1983; Sullivan, 1982; Tsuzuki and Suga, 1988; see Suga, 1990, for a recent review), and to a lesser degree in frogs (Fuzessery and Feng, 1982, 1983) and songbirds (Langner et al., 198 1; Margoliash, 1983). Neuronal combination sensitivity has often been de- scribed in the context of species-specific vocalizations, but is also important in target localization/identification in barn owls (Moiseff and Konishi, 198 1) and electric fish (Heiligenberg and Rose, 1985). The sites of neuronal combination sensitivity are often necessary for the behaviors under investigation, or project to motor areas that can initiate those behaviors (Bastian and Yuthas, 1984; Masino and Knudsen, 1990; Riquimaroux et al., 199 1; see also Brenowitz, 199 1).
In the avian song system, CS neurons are found in the fore- brain nucleus hyperstriatum ventrale, pars caudale (HVc). HVc is part of the motor pathway for song production (Nottebohm et al., 1976; McCasland and Konishi, 198 l), but neurons in HVc also receive auditory input (Katz and Gurney, 1981). A subset of HVc neurons of adult white-crowned sparrows (Zo- notrichia leucophrys) are “song-specific” temporal combina- tion-sensitive (TCS) neurons that require sequential pairs of sounds for excitation (Margoliash, 1983). These neurons are highly selective for complex, idiosyncratic features of the in- dividual bird’s own (“autogenous”) song, and are embedded in a larger population of HVc neurons that exhibit somewhat less selectivity for autogenous song (Margoliash, 1983, 1986). Each bird’s autogenous song is a strongly excitatory stimulus for TCS neurons in the HVc of that bird, but typically elicits much weaker responses from TCS neurons of the HVc of conspecific birds. The idiosyncracy of these neuronal response properties reflects the idiosyncratic nature of song learning (Margoliash, 1986) and presumably is a result of complex interactions of auditory feedback and motor programs during song learning (Margoliash, 1987; see also Volman and Konishi, 1987).
The detailed single-unit analysis of auditory neurons in the song system is limited to a single study of TCS neurons (Mar- goliash, 1983) and although many species, including zebra finches (Taeniopygia guttutu), produce songs rich in harmonics, there has been no evidence to date regarding harmonic combination- sensitive (HCS) neurons in the song system. Here, we describe the response properties of TCS and HCS neurons in adult male zebra finches. The response properties of these neurons share several features with those previously described for white- crowned sparrows. The song selectivity and specificity for acous-
4310 Margoliash and Fortune l Combination-Sensitive Neurons in HVc
zf-30
1.
j::. :.. .:.
. . . . :,:;j :::I.. ,:,. “.:f
, j:.:.;., r;>:: ,:::..,.
1 1'
l-z
. . .:y,, . . .:.:
,.
.( ,. .: .(.,. :;’ ., z;:;:::.. . . . . .:::::.
.,.. :.;::::..: ..,. ,. ! ,. .p:.::r . . . . . .
.: .;
:. . . .
3obfW2 $.;:': :j:'-. ,,: .'.
j..:
zf-16
Figure 1. The response of single-syllable TCS neuron 30b/5/2. For this and all other figures, response histograms show sequential 30 msec bins of the summed activity to 20 repetitions of the stimulus. a, The stimulus is the autogenous song (zf_30). The histogram (top) is shown time aligned with the sonograph (frequency vs time, middle) of the autogenous song and the oscillograph (amplitude vs time, bottom) of the autogenous song. The time bar beneath the oscillograph in a represents 100 msec; the histogram shows 2 set of response. The number of each syllable appears below
The Journal of Neuroscience, November 1992. 72(11) 4311
tic parameters of song of CS neurons in the HVc make the description of these response properties in terms of classical auditory mechanisms challenging.
Some of these data have previously appeared in abstract form (Fortune and Margoliash, 1989; Margoliash, 1989).
Materials and Methods Songs. Male zebra finches were acquired from a breeder (Magnolia Bird Farm) and maintained in small groups in cages in a general aviary. Prior to days of experiments, birds were transferred to small sound attenuation booths (Industrial Acoustics Corp.) equipped with microphones and electronics. The birds’ songs were transmitted 30 m from the animal facility to the laboratory, processed as a differential signal to eliminate noise, subjected to anti-alias filtering (9 kHz, 4 pole), and digitally re- corded at 20 kHz sampling rate with a 15bit-resolution analog-to-digital subsystem (Preston GMAD-2A). Song stimuli were visualized as spec- trograms and as other frequency-domain and time-domain analyses on a computer with a graphics terminal (VAXstation 3200, DEC) coupled to an array processor (CSPI Mini-Map XL). A more detailed description ofthe custom-built recording and signal processing systems can be found elsewhere (Margoliash et al., 199 1). Signals were also analyzed with the ESPS/WAVES+ (Entropic Research), MATLAB (The Math Works), and MATHEMATICA (Wolfram Research) programs.
Zebra finch songs comprise a sequence of vocal gestures, or “sylla- bles,” separated by silent intervals. For example, the song of Figure 1 a had 15 syllables. Songs typically started with “introductory” syllables (ea.. Fia. la. svllables 1, 1’. 2) followed bv one or more “motifs”- ~ I I
identical or uearly identical repeated sequences of syllables (e.g., Fig. la, syllables 3-7, 3’-7’). (In the nomenclature adopted here, the prime notation designates repeated syllables of the same type. Thus, 3’ refers to the second occurrence of syllable 3 in the song.) For some songs, motifs were separated by other syllables (e.g., Fig. la, syllables 8, 9) and/or by introductory syllables. Although most birds delivered song with a variable number of motifs during bouts of singing, typically each bird had a preferred number of motifs. Using this description of song, a single song exemplar that was loud, well formed, and contained two or three motifs was chosen for each bird based on visual inspection and analysis of 1 O-200 sonographs. This song is referred to as the autogenous song.
Experimentalprocedures. After recording a bird’s song, the bird was anesthetized (pentobarbital/chloral hydrate) and a small stainless-steel pin was implanted onto the lower shelf of the skull centered 1.5 mm posterior to the bifurcation of the midsagittal sinus. One to several days later, birds were anesthetized with 7 wl/gm 20% urethane (Sigma), wrapped in a loose cloth jacket, and supported on a foam couch. The head was fixed into stereotaxic coordinates by capturing the pin with a small screw. Body temperature was maintained with external heating. Plati- num-iridium electrodes coated with solder glass (Coming) with tip ex- posures of 5-10 pm (l-2 MQ) were lowered in a dorsal approach into HVc using a hydraulic microdrive (Narishige). Single-unit isolation was achieved with a time and level window discriminator (M. Walsh Elec- tronics). Only well-isolated single units were accepted for analysis. The computer that delivered the stimuli also recorded the times of action potentials and displayed on-line rasters and histogram analyses of the spike data.
Sound stimuli were delivered free-field in a double-walled 7 foot IAC sound-attenuation chamber whose inner surfaces were covered with foam (Ilbruck) to achieve anechoic conditions at the frequencies of interest. The frequency response of the overall sound system was +4.5 dB from 500 Hz to 8 kHz. calibrated with a 1 inch Bruel and Kiaer microphone (model 4 145). ‘Amplitude was calibrated with a Bruel and Kjaer sound level calibrator (model 4230). All amplitude measurements reported here are referenced to 20 PPa (0 dB). Songs, tone bursts, and
t
other artificial stimuli were generated by a computer (VAXstation 3200, DEC) using custom-built software. Digital representations of these stim- uli were converted to analog waveforms with 12-bit resolution at 20 kHz (Data Translation model 275 l), and filtered with a 7-pole elliptical switch-capacitor filter (XR 10 16). Harmonic speaker distortion was 40- 45 dB below the fundamental between 2 and 8 kHz, as measured with a wave analyzer (Hewlett Packard model 3581C).
During experiments, fiduciary points were marked with electrolytic lesions (5 PA for 5 set). At the end of an experiment, birds were ad- ministered a lethal dose of anesthetic (sodium pentobarbital) and then exsanguinated with 4% formal-saline. Lesions were reliably recovered in standard frozen section histology with cresyl violet staining of 50 Km sections. The locations ofthe lesions confirmed that recording sites were within the borders of HVc.
Signal processing and stimulus repertoires. The starting and ending times of all the syllables of autogenous song were determined. Each syllable was extracted from the autogenous song and the initial and terminal 5 msec segments were ramped to minimize transient distor- tions. A song or song segment was synthesized as a series of syllables. In most cases, we did not broadcast the background noise ofthe intervals between syllables. Where the intervals between syllables were very short or absent, two or more syllables were presented as a unit (e.g., Fig. la, syllables 4-5,6-7,4’-5’, 6’-7’). For purposes of analysis, however, these units were treated as sequences of their constituent syllables.
Three modifications of syllables were developed to help isolate pa- rameters of song to which HVc neurons were sensitive. The first mod- ification, termed “Reverse,” was composed of a sequence of one or more syllables in the natural order, each syllable reversed in time. This manipulation modified both the time-varying frequency and amplitude of syllables while maintaining the temporal order of the syllables and their overall spectrum. The second modification, termed “Noise,” sub- stituted wideband noise for each syllable of the signal without changing the time-varying amplitude (envelope) of the signal. Thus, each syllable of Noise had the same envelope but different dynamic (and overall) spectral properties compared to the original syllable. The third modi- fication, termed “LinAM,” imposed a simple amplitude envelope on each syllable. Thus. all syllables of LinAM had the same amolitude envelope. At any point in-time, the relative power of different spectral components of LinAM syllables was the same as the relative power of different spectral components of the corresponding original syllables, but the absolute power of the spectra differed.
Neurons were tested with numerous stimuli, including tone bursts (500 Hz to 6.0 kHz, 500 Hz steps; 100, 200, or 400 msec duration; 70 and occasionally 55 dB), noise bursts, complex artificial stimuli devel- oped on line on an ad hoc basis, artificial stimuli based on models of autogenous song syllables, autogenous song, up to five conspecific songs, individual syllables and syllable sequences, segments of syllables, and Reverse, Noise, and LinAM modifications of songs and/or syllable se- quences. Songs, syllable sequences, and Reverse and Noise stimuli were typically delivered with peak amplitudes of 80 dB. LinAM stimuli were typically delivered with peak amplitudes of 70 dB. In several cases, we also measured the rate-intensity functions for autogenous song, syllables of autogenous song, and LinAM stimuli (50-90 dB, 10 dB steps). For cells that did not respond to tone bursts, we attempted to develop an artificial model that elicited strong excitation from the neuron. System- atic variants of this“canonica1” model were presented. This approach was successful for those cells that required only simple frequency mod- ulations (FMs), but many HVc neurons required sufficiently complex stimuli that we were unable to stimulate them effectively with artificial stimuli.
It should be noted that we explicitly biased our sample by using autogenous song as the search stimulus, and in many cases did not extensively characterize tone burst-responding cells. Thus, questions regarding the relative frequency of HVc neurons that do not respond to autogenous song, or do not respond to tone bursts, are not fully
the sonograph. Note the strong, phasic responses, especially after syllables 6 and 8. &g and i-l, Only histograms and oscillographs are shown. The histograms show 1 set of response (kg), or 2 set of response (i-l). The time bar under the oscillograph in d represents 100 msec. b, The stimulus is syllable 8. Note the strong response at the end of the syllable, somewhat stronger than for syllable 8 in a. For the other panels, the stimuli are first part of syllable 8 (c); second part of syllable 8 (d); syllable 8 presented in reverse (e); Noise-modified syllable 8 (see Materials and Methods) v); LinAM-modified syllable 8 (see Materials and Methods) (g); conspecific songs zf-15, zf-16, zf-17, and zf-18 (i-l, respectively). Note that all other stimuli elicit weak responses. h, No or very weak response to tone bursts. The total number of spikes over 20 repetitions of each 200 msec tone burst is plotted as a function of the tone burst frequency. The broken line represents the spontaneous rate.
4312 Margoliash and Fortune * Combination-Sensitive Neurons in HVc
addressed by this study. Furthermore, since the analysis of cells with complex response properties was time consuming, we could not address questions of topographic organization in this study.
Spike analysis. All spike rates (SRs; spikes see-I repetition-l) were calculated by counting spikes over a specified time interval and adjusting for spontaneous rate. To measure the response to a song, the duration of the song was used as the time interval. To measure temporal facili- tation (see below), spike rates were calculated over entire syllables, syllables plus subsequent intervals, subsequent intervals alone, or parts of svllables alone on an ad hoc, ner cell basis (see Discussion). For all cells, the time interval over which spikes were counted is reported. Throughout this article, spike rates (and spike rate ratios; see below) are reported as means + SD. To compare spike rates and spike rate ratios, p values are reported for two-tailed, unpaired t tests unless oth- erwise indicated.
When estimating spike counts for individual syllables within song or a sequence of syllables, the time interval was adjusted for the cell’s latency. Latency was estimated using the response at best frequency (BF) for each cell that responded to tone bursts. Since tone burst re- sponses tended to be weak, latencies at BF were estimated by visual inspection of raster and peristimulus time histogram displays (0.5 msec resolution). Latencies ranged from 13.0 to 25.5 msec (n = 68). Three other cells had latencies of > 50 msec. For cells that did not respond to tones, we used a default latency of 13.5 msec.
Quantitative analysis of these data often required comparing a neu- ron’s response to autogenous stimuli-autogenous song or a normal sequence of autogenous syllables-with the neuron’s response to “test” stimuli-conspecific songs, modified autogenous songs, or modified au- togenous syllables. To make these comparisons, we calculated ratios of the spike rates for the test stimuli over the spike rates for the autogenous stimuli. For almost all cells reported in this study, the autogenous stimuli elicited positive SRs stronger than the test stimuli. Thus, the spike rate ratios (“SR ratios”) varied from near 1 .O (same response to autogenous and test stimuli) to ~0 (test stimuli elicit overall responses less than the spontaneous rate). These and other off-line analyses were facilitated by the use of a relational database management system (SYBASE).
Results Autogenous song was presented to 329 cells recorded from the HVc of 24 birds. Most cells were 200-800 pm below the surface and were recorded as positive-going biphasic or triphasic spike waveforms. Many aspects of HVc physiology in the zebra finch were similar to those reported in other species (McCasland and Konishi, 198 1; Margoliash, 1983). These properties included relatively strong responses to autogenous song, weaker responses to most other stimuli, and a characteristic spontaneous bursting activity. These physiological properties were reliable indicators distinguishing HVc from the surrounding neostriatum (e.g., Margoliash, 1987). Here, we report on the subset of CS neurons. Details of the population data will be presented later (D. Mar- goliash and E. S. Fortune, unpublished observations).
Temporal combination-sensitive neurons
Forty-eight cells were TCS, responding strongly to a temporal sequence of sounds but poorly or not at all to the sounds pre- sented in isolation. The components of song that elicited exci- tation from TCS neurons varied widely across birds and across neurons within birds. Some neurons required two segments of a complex syllable, other units required two distinct syllables in temporal sequence, and yet others required a sequence of several syllables for excitation. Assigning neurons to one of these classes was in some cases rather arbitrary, however, because some neurons exhibited properties of more than one class (see Discussion).
The responses of TCS cells to syllables or syllable segments presented in isolation typically were less reliable on a repetition- by-repetition basis and exhibited more temporal jitter than the responses to the syllables or syllable segments presented in the
context of a longer sequence of sounds. The majority of these cells (N = 30) had low spontaneous rates (12.5 spikes see-I) and responded in a highly phasic fashion to syllables of song (N = 29). TCS neurons were typically inhibited, or not excited, by tone bursts.
Three classes of TCS neurons were identified: single-syllable, syllable-pair, and multiple-syllable neurons. In subsequent sec- tions, individual neurons that exemplify various TCS properties are described in detail, followed by population data.
Single-syllable TCS neurons
Single-syllable TCS neuron 3Ob/5/2. The cell 30b/5/2 respond- ed with phasic on and/or phasic off excitation to several syllables of autogenous song, especially syllables 6, 8, and 6’, which were spectrally similar to each other (Fig. la). The neuron exhibited a strong, phasic off response to syllable 8 presented in isolation (Fig. 1 b). Syllable 8 was composed of two segments (see below). Neither the first nor the second segment of syllable 8 presented in isolation elicited significant excitatory responses from the neuron (Fig. lc,d, respectively).
The specific acoustic features of syllable 8 were important for eliciting excitation. Reversing the syllable abolished the facili- tated response (Fig. 1 e), as did presenting broadband noise with the same amplitude envelope as syllable 8 (Fig. lfl. Unusual for single-syllable TCS neurons, the facilitated response after the second segment of syllable 8 for this neuron was also largely attenuated by modifying the syllable to have a linear amplitude envelope (Fig. lg). Thus, this neuron was sensitive not only to the slope of the FMs, but also to the shape of the amplitude envelope or the relative amplitude of the parts of syllable 8.
Neuron 30b/5/2 exhibited no responses to tone bursts at most frequencies from 500 Hz to 5 kHz (Fig. 1 h). The strongest phasic response to tone bursts (7 spikes in 30 msec over 20 repetitions), at 1 .O and 3.5 kHz, was only 17.5% (7 of 40) of the corresponding response to syllable 8. We presented five conspecific songs to the neuron (Fig. li-k one song not shown). Most syllables of most of these songs did not elicit a response, and the strongest responses elicited were weak excitations barely above back- ground. Thus, the temporal combination sensitivity of this neu- ron for specific components of autogenous song endowed this neuron with a great deal of selectivity.
Syllable 8 had an initial broadband segment with some evi- dence of harmonic structure that glided into a harmonically structured second segment. The second segment had rapidly downward-sweeping harmonically related FMs that glided into a constant-frequency harmonic stack, ending with a short down- ward-sweeping FM (see Fig. 2b for detail). We tested the neuron with modifications of syllable 8, systematically eliminating parts of the starting or ending segments by altering the starting and/ or ending point of the syllable. The facilitated response was measured as the spike count for 36 msec after the syllable offset, which corresponded to the natural interval between syllables 8 and 9 in the autogenous song. The variation in response to the unmodified syllable (mean SR, 1.80 + 0.40; N = 8; 20 repeti- tions per trial) was measured over all catch trials throughout the recordings from this neuron. The response to modified syl- lables decreased nearly monotonically as a function of the start- ing or ending position of the syllable (Fig. 2a). Eliminating most of the first segment or just the final, short FM following the harmonic stack ofthe second segment (see Fig. 2b) was sufficient to suppress the facilitated response of the neuron (Fig. 2~). The harmonic stack presented in isolation also did not elicit a fa-
The Journal of Neuroscience. November 1992, 12(11) 4313
cilitated response (Fig. 2~). Those stimuli that did not elicit a facilitated response typically elicited only a weak onset or offset response (see also Fig. 1 c-g).
Population properties of‘single-syllable TCS neurons. Eleven of 48 TCS cells (23%) exhibited similar properties: responding to individual, complex syllables of autogcnous song, but re- quiring several parts ofthe syllable for excitation. These neurons typically exhibited a phasic, facilitated response after the onset of the second of a sequence of two parts of a syllable. In some cases the facilitated response occurred at the end of the syllable (e.g., Fig. 3a,b), whereas in other cases the facilitated response occurred within the syllable (e.g., Fig. 3~). There was also one case where a neuron exhibited a strong phasic response at syl- lable onset followed by a facilitated phasic/tonic response after the second note in the syllable (Fig. 3d). Across the population of single-syllable TCS neurons, the facilitated responses oc- curred from 80 msec to 280 msec after the onset of the syllable (Table 1). This represents a lower-bound estimate of the intc- gration time of these neurons (see Discussion).
Most single-syllable TCS neurons responded about as strongly to the syllable within the context of song as to the syllable presented in isolation (Table I), although them were clear ex- ceptions (e.g., neuron 30b/5/2, Fig. 1). The population differ- ences in spike counts between the responses to isolated syllables and syllables-in-song was not significant (Table 1).
Single-syllable TCS neurons were quite selective (see Fig. 3), exhibiting almost no excitatory response to tone bursts. On average, conspecific songs elicited about half the response of autogenous song (Table 1). Reverse syllables and Noise syllables also elicited much weaker responses than the unmodified syl- lables (Table 1). These differences are highly significant for both Reverse syllables and Noise syllables (Table 1). The strongest response across all Noise and Reverse tests was elicited from neuron 30b/5/2, a weak onset response (SR ratio = 0.25) to Noise syllable 8 (Fig. lfl. In contrast, single-syllable TCS neu- rons exhibited reasonably strong responses to the LinAM syl- lables (Table 1; see Fig. 3). The strongest response to an LinAM syllable (SR ratio = 1.4) was from neuron 29b/1/2 (Fig. 3~). Compared to the responses to unmodified syllables, the re- sponses to the LinAM syllables were also significantly weaker (Table 1). The SR responses to LinAM syllables, however, were significantly stronger than the responses to Noise syllables (p = 0.002 1; paired t = 4.26; df = 9) or Reverse syllables (p = 0.0087; paired t = 3.34; df = 9). Thus, these neurons were much more sensitive to modifications of time-varying spectral features of the syllables than to modifications of amplitude features of the syllables.
The response of single-syllable TCS neurons to LinAM syl- lables could be explained on the basis of the neurons’ amplitude response properties. The rate-intensity functions of responses to single syllables were mostly monotonic, with saturation be- tween 65 and 80 dB (Fig. 4). LinAM syllables were delivered with a root mean square (RMS) amplitude ranging from 75.0 -84.8 dB (peak amplitude = 70 dB). If the only differences in responses to linearized syllables were based on RMS amplitude, then the linearized syllables should have elicited responses sim- ilar to those elicited by the unmodified syllables delivered at 75-85 dB. The slight decreases in response to LinAM syllables demonstrate that most TCS neurons were relatively insensitive to changes in the amplitude envelope and to changes in the relative amplitude of different parts of syllabics. This result also indicates that the manipulation to produce linearized AM sig-
Figure 2. The effect of truncation of syllable 8 on the response of neuron 30b/5/2 of Figure I. Data points in u representing the starting or ending time of the syllable are time aligned with the sonograph in b. Response is measured as the total spike count for 36 msec following the end of each stimulus, 20 repetitions/stimulus, corrected for spon- taneous activity. u, The response is suppressed by truncating the begin- ning (solid circles) or the end (solid triangles) of the syllable. The broken line represents the weak rcsponsc to a middle portion of the syllable. The response to the unmodified syllable across eight different trials (20 repetitions per trial) was 36 + 8. I spikes (data points with error bars). b, An expanded sonograph of syllable 8. The transition between the first and second segment is marked by arrows.
nals did not introduce spurious spectral components with sig- nificant power.
Syllable-pair TCS neurons
Syllable-pair TCS neuron 12/l/2. For some cells, the optimal excitatory stimulus was a sequence of two consecutive syllables taken from autogcnous song. For example, the neuron 12/l/2 responded weakly after the initial syllable of autogenous song but exhibited a strong, facilitated response after the second syl- lable of autogenous song (Fig. 5~). Both syllables were dcsccnd- ing FMs that were very similar to each other. The neuron rc- sponded with weak offset excitation to either syllable presented in isolation (Fig. 5b,c). Compared to the response to song, the responses to single syllabics were generally less phasic, and oc- casionally appeared to have a second component where the following syllable would have occurred in song (e.g., compare Fig. 5b.d). Single tone bursts and broadband noise elicited either no excitatory response or a very weak offset excitation (not shown). When presented with a sequence of two identical ar- tificial FMs modeled to approximate the introductory syllables
4314 Margoliash and Fortune * Combination-Sensitive Neurons in HVc
--f-bc ab c dSSSLRN
-d
-a -b a b S SS L N R
04-a -b a b S SS L N F
a a’ b S SS L N R
I 32/l/3 ’
r
Olo O!S Time (set)
I!0
Figure 3. Response properties of four single-syllable TCS neurons. u-d, In each panel, 1 set of response histogram (top) is shown time aligned with the syllable (bottom) from the autogenous song. The box next to the syllable shows the response (total number of spikes over 20 repetitions) to different segments of the syllables a, b. c, or d, to the syllable presented in isolation (s) or within the song (SS’), and to modifications of the syllable: LinAM (L), Noise (NJ or Reverse (R). The vertical bar above S represents SD for several trials, 20 repetitions per trial, of the isolated syllable (a, N = 5; b, N = 3; c, N = 3). The vertical bar next to each box represents 10 spikes. All cells required at least two segments of a syllable for excitation. Note that most cells had phasic responses. Responses to S, SS, and L were generally strong.
of autogenous song, however, the neuron exhibited weak offset excitation to the first FM and a facilitated response at the offset of the second FM (Fig. 5e). This neuron was highly selective, exhibiting no response to the syllable pair presented in reverse, to noise bursts with an amplitude envelope identical to the syllable pair, or to any of five conspecific songs tested (not shown).
Integration time of syllable-pair TCS neurons. Similar tem- poral facilitation properties were observed for the other 25 TCS cells that required a temporal sequence of two distinct syllables
for excitation. The facilitated response occurred either at the beginning (e.g., Fig. 6a), middle (e.g., Fig. 6b), or end (e.g., Fig. 6~) of the second syllable of the appropriate syllable pair. Thus, judged strictly on the basis of the timing of the response to syllable pairs drawn from autogenous song, the integration time for facilitation (time from onset of first syllable to start of fa- cilitated response) was very long for these neurons, ranging from 140 msec to 340 msec (Table 1). The integration time for fa- cilitation of syllable-pair TCS neurons is somewhat longer,
The Journal of Neuroscience, November 1992, 72(11) 4315
therefore, than for single-syllable TCS neurons, and the differ- ence in the two samples is significant (Table 1).
To quantify the strength of facilitation, we defined a period of time for each neuron relative to the onset of the facilitated syllable during which the facilitation occurred when autogenous song was presented. We calculated spike counts over this time interval for the facilitated syllable in the context of song, for the facilitated syllable when presented with the preceding syllable of song (i.e., a syllable pair), and for each of the two syllables presented in isolation (see Table 1 for population data). The syllable pair elicited a strong response during or after the second syllable. In contrast, the response to the first or second (facili- tatory) syllable presented in isolation was almost always weak, with the second syllable typically eliciting a slightly stronger response than the first syllable. The facilitated response at the second syllable of the syllable pair was significantly stronger than the response to the second syllable in isolation (Table 1). The facilitated response at the second syllable of the syllable pair, however, was somewhat weaker than the response at that syllable in the context of song (Table 1). The difference in re- sponses to the syllable pairs in isolation and in the context of song was highly significant (Table 1). Thus, the integration time for facilitation of syllable-pair TCS neurons was sufficiently long that the syllables of song preceding the syllable pair had an excitatory effect on the responses. This stands in contrast to the population of single-syllable TCS neurons.
Selectivity of syllable-pair TCS neurons. Syllable-pair TCS neurons were highly sensitive to modifications of the spectral or temporal features of the syllables. As with single-syllable TCS neurons, the response of syllable-pair TCS neurons was typically abolished by presenting the Reverse syllable pair or the Noise syllable pair (Table 1). Compared to the responses to the un- modified syllable pairs, the weaker responses to Reverse and Noise syllable pairs were highly statistically significant (Table
50 60 70 80
dB SPL
Figure 4. Response (total spikes over duration of syllable plus follow- ing intersyllable interval) as a function of syllable amplitude for six cells (20 repetitions per point).
1). Syllable-pair TCS neurons also exhibited statistically signif- icantly weaker responses to LinAM syllable pairs than to the unmodified syllable pairs (Table 1). LinAM syllable pairs typ- ically elicited stronger SR responses than Reverse or Noise syl- lable pairs, however, and these differences were statistically sig- nificant (Reverse: p = 0.0099, t = 3.5 1, df = 7; Noise: p = 0.011, t = 3.43, df = 7). Thus, as with single-syllable TCS neurons, syllable-pair TCS neurons were less sensitive to changes in the envelope of the syllables than in manipulation of the spectral content of the syllables.
Syllable-pair TCS neurons were highly selective for autoge- nous song, typically responding with weak excitation or inhi-
Table 1. Average responses (mean f SD) of single-syllable and syllable-pair TCS neurons
Single syllable Svllable oair
Integration time (msec)
Syllable context (SR) In song
In isolation First syllable (SR)
Second syllable (SR)
Conspecific songs (SR ratio)
Reverse (SR ratio)
Noise (SR ratio)
LinAM (SR ratio)
NA, not applicable. ” Paired I test.
172 -t 52; N= 11 235 k 73; N= 25 Cp = 0.0381; t = 2.157; df = 34p
16.4 ? 12.2; N = 11 8.61 & 7.41; N = 25 @ = 0.45; t = 0.79; df = 10) (p = 0.0043; t = 3.29; df = 17) 18.0 & 12.5; N = 11 5.85 t 6.37; N = 20 NA 0.36 k 1.10; N = 8
@ = 0.016; t = 3.17; df = 7)” NA 1.44 + 3.14; N = 24
(p = 0.0004; t = 4.39; df = 18)” 0.50 f 0.24; N = 34 0.28 k 0.35; N = 35
(p = 0.0038, t = 3.001; df = 67)’ 0.057 k 0.13; N= 10 0.017 2 0.13; N= 10 (p = 0.0017; t = 4.41; df = 9) (p = 0.0001; t = 6.97; df = 9y 0.012 f 0.12; N= 10 -0.04 + 0.15; N = 10 0, = 0.0024; t = 4.16; df = 9) (p = 0.0001; t = 7.25; df = 9y 0.48 I!Z 0.39; N = 10 0.41 ? 0.43; N = 8 @ = 0.02; t = 2.81; df = 9) (p = 0.027; t = 2.79; df = 7p
* Paired t test comparing SR response to single and paired syllables in isolation. ( Paired t test comparing SR response to natural and modified syllables in isolation.
4316 Margoliash and Fortune l Combination-Sensitive Neurons in HVc
oJ. 1 1' 234 5 6
O!O Ok ll0
Time (set) Figure 5. Syllable-pair TCS neuron 12/l/2. In a and b, at the top is a raster plot; tick marks represent the time of occurrence of each spike. The neuron exhibited a strong response at syllable 1’ of the autogenous song (a), but responded only with weak offset excitation to syllable 1 (b) or syllable I’ (c) presented in isolation. The neuron responded strongly to the syllable pair l-l’ (d). The neuron responded only after the second of two identical FMs (e). The response to autogenous song (f) was subsequently confirmed.
The Journal of Neuroscience, November 1992, 72(11) 4317
bition to conspecific songs. The average response to conspecific songs was only about 25% of the response to autogenous song (Table 1). Nine conspecific songs (four cells) elicited overall inhibition; only three conspecific songs (two cells) elicited more than 80% of the response to autogenous song. Comparing SR ratios, the increase in song selectivity of syllable-pair TCS neu- rons compared to single-syllable TCS neurons is highly signif- icant (Table 1).
Multiple-syllable TCS neurons: the efect of temporal context of song
The preceding analysis of temporal combination sensitivity is based on neurons’ responses to isolated syllables or syllable pairs, and demonstrates considerable selectivity for specific acoustic features of autogenous song. Syllables could be excit- atory in the context of song, however, in ways that were not easily predicted by the responses to single syllables and syllable pairs. The long integration time of nine TCS neurons endowed them with selectivity for a temporal sequence of more than two syllables.
Response peaks may depend on prior excitation. Neuron 28/ 6/l responded well during syllables 2, 5, and 5’ and after syl- lables 6 and 6’ of autogenous song (Fig. 7a). The song had three introductory, notes followed by two motifs (Fig. 7a, syllables 3- 6, 3’-6’). The neuron did not respond at syllable 2’ of song, which was similar to syllable 2. The neuron responded to syllable 2 presented in isolation (Fig. 7b) as well as to syllable 2’ pre- sented in isolation (not shown), however, and exhibited a weak facilitated response to syllables 1 and 2 (Fig. 7~). These results suggested that this neuron responded to single syllables of song, and exhibited only weak temporal combination sensitivity. The lack of response at syllable 2’ in autogenous song suggests that following excitation to syllable 2, the neuron was inhibited for at least 100 msec. Interestingly, the neuron did not respond to syllable 5’ presented in isolation whatsoever (Fig. 7d), or to the syllable pair 4’-5’ (Fig. 7e). As a control, the strong response to autogenous song was confirmed immediately thereafter (Fig. 7j). Thus, for this neuron the response at syllable 5’ was dependent on interactions that occurred over three or more preceding syl- lables in song. Presumably, the response at syllable 5, which was spectrally similar to syllable 5’, was also dependent on prior activity in song. The weak offset excitation to song (Fig. 7a,d- f;h) suggests a role for inhibition followed by offset excitation in shaping the response properties of neuron 28/6/l (Margo- liash, 1983; see Discussion).
Neuron 28/6/l did not exhibit any response whatsoever to three conspecific songs or to any tone burst between 500 Hz and 6 kHz (not shown). A fourth conspecific song, however, elicited a weak response at the second syllable of that song (Fig. 7g). Although the response to that conspecific song was com- parable to the initial response to syllable 2 of autogenous song (compare with Fig. 7a), latter syllables of the conspecific song elicited no excitation whatsoever. Thus, the responses to latter syllables of autogenous song (syllables 5 and 5’) exhibited at least some stimulus specificity. This conclusion was confirmed by presenting modified versions of various syllable sequences and modified versions of autogenous song. The neuron did not respond to Noise autogenous song, but responded strongly to LinAM autogenous song (not shown). In response to Reverse autogenous song, however, the neuron exhibited no response at reversed syllable 2, a very weak excitatory response at reversed syllable 5, and a much stronger excitatory response at reversed
-b a b S SS
40 - (b)
20 -
0 a,
33/1/l 1
I
I -b a b S SS L N R
I I 1 0.0 0.5 1.0
Time (set)
Figure 6. Response properties of three syllable-pair TCS neurons, as in Figure 3.
4318 Margoliash and Fortune * Combination-Sensitive Neurons in HVc
30 (a) 1 I
zf-28
10 26/6/l
5
n 1 22'345 6 3'4'5' 6
12 30 (9)
Y 'g 15 1
”
11'2 3 4 2' 3' 4' 56
1 (cl
zf-28
1 2 2'34 5 6 3'4'5' 6'
30 - (h)
15 -
zf-28 Reverse
1 2 2' 3 4 5 6 3' 4' 5' 6'
r~- 0.0 I!0 210
Time (set)
Figure 7. The effect of prior excitation on the response to song. a, TCS neuron 28/6/l exhibited phasic responses at syllables 2, 5, and 5’ and an offset response after syllables 6 and 6’ of autogenous song. There was a good response to syllable 2 presented in isolation (b) that was slightly facilitated by presenting the syllable sequence l-2 (c). Neither syllable 5’ (4 nor syllables 4’-5’ (e) elicited any excitation, h0wever.f; The response to the autogenous song was subsequently confirmed. g, A conspecific song (zf_23) elicited a weak response at the second syllable but no responses to subsequent syllables. h, The Reverse autogenous song elicited weak responses at syllables 5 and 5’ but little or no response from previous syllables.
Figure 8. Response properties of multiple-syllable TCS neuron 31/l/3. a, Response to autogenous song. The strongest response was at the last syllable of each motif (syllables 6, 6’. 6”). There was weak or no response to either the first syllable (b) or the last four syllables (c) of the last motif, and strong response to the entire motif (4. e, Increasing the interval between syllable 2” and syllables Y-6” decreases the facilitated response at syllable 6” almost monotonically. The facilitated response to the unmodified interval (48 msec) was 2 18 ? 78 spikes. Effects of Reverse and Noise modifications (f-i): weak or no responses to Reverse 2” followed by 3”-6” (J; to 2” followed by Reverse 3”-6” (g); to Noise 2” followed by 3”-6” (h); and to 2” followed by Noise 3”-6” (i). In contrast, there was moderate response to LinAM modification of 2” followed by 3”-6” (I), and weak
The Journal of Neuroscience, November 1992, 72(11) 4319
3” 4” 5” 6”
0 100 200 300 400 500 123456
Interval (msec) Freq (kHz) response to 2” followed by LinAM 3”-6” (k). 1, No responses to tone bursts of any frequency at 55 dB (open circles), and weak responses to tone bursts at 3.5 and 4.0 kHz, 70 dB (solid circles). Broken lines in e and I represent spontaneous rate.
4320 Margoliash and Fortune * Combination-Sensitive Neurons in HVc
60 - (a)
30 -
OJ 02/l I1
: . -:,
a 10
si5
$ t
0 3 FM
g 400 ;
l-l (c) 1
zf 0 100
3 Y 0
1
‘zi - v) w1234
n
Harmonic combinations
Figure 9. HCS neuron 02/ 1 / 1. a, Strong, tonic response to autogenous song starting at syllable 3 of song. b, Strong, phasic/tonic response to four FMs in harmonic relationship, 100 msec duration. This is the“canonical” model. Calibration, 200 msec. c, Parameters of har- monic combination sensitivity: response (spike counts over 400 msec following stimulus onset) as a function of harmonic combinations of the canonical model of 6. All trials were 20 repetitions. Solid bars represent the spike counts up to the spontaneous rate; shaded bars represent the spike counts up to 1 SD above spontaneous rate; open bars represent remaining response above spontaneous rate + 1 SD. The harmonic composition of the stimuli is indicated by the numbers be- neath the bars; for example, 1, 2 was the stimulus with the first and second harmonics. wn, white noise. All stimuli that contained the second and third harmonics (surrounded by boxes) elicited a strong response above spontaneous; all stimuli that did not contain either the second or the third harmonic elicited weak or no response. The vertical bar above stimulus 1-l represents SD of four trials.
syllable 5’ (Fig. 7h). (Syllables 5 and 5’ were temporally sym- metric, whereas syllable 2 was not.) Potentially, the weak re- sponse at reversed syllable 5 facilitated a stronger response at reversed syllable 5’.
Requirement for multiple syllables: neuron 31/l/3. The neu- ron 3 I/ l/3 exhibited a strong response to each of three motifs following the introductory syllables of autogenous song (Fig. 8a). The response in song was strongest at syllables 6, 6’, and 6”, which were the final syllables of each motif. The neuron gave weak responses to syllable 2” presented in isolation (Fig. 8b) and to the syllable sequence 3”-6” (Fig. 8~). Most remarkably, the neuron required an entire motif for excitation, exhibiting a strong response to the syllable sequence 2”-6” (Fig. 8d). The time between the onset of syllable 2” and the onset of the fa- cilitated response was about 350 msec. The integration time for facilitation of this neuron was longer than 350 msec, however, because the facilitated response was maintained as the interval between syllable 2” and sequence 3”-6” was increased (Fig. 8e). The facilitated response decreased almost monotonically as the interval was increased up to 400 msec (Fig. 8e).
The role of syllable 2” in shaping the response at syllable 6” was confirmed by manipulation of spectral/temporal features of syllable 2”. For example, the neuron responded weakly to the syllable sequence 2”-6” when syllable 2” was reversed (Fig. 8f, or when Noise was substituted for syllable 2” (Fig. 8h). In con- trast, the neuron gave a stronger response when just the wave- form of syllable 2” was manipulated (LinAM; Fig. Sj). The facilitated response at syllable 6” was also largely abolished by the corresponding manipulations of the syllable sequence 3”-6” (Fig. 8g-k). It should be noted the response of this neuron was relatively reliable; a strong response to the unmodified syllable sequence 2”-6” was elicited after the presentation of the stimuli described above (not shokn). Not surprisingly, this neuron ex- hibited almost no responses to tone bursts from 500 Hz to 6 kHz at either 70 dB or 55 dB (Fig. 81).
Harmonic combination-sensitive cells
Forty-two cells that responded to single syllables of autogenous song but did not respond to tone or noise bursts were tested with complex FMs in harmonic relationship. Only 10 of those cells exhibited excitation to complex harmonic FM stimuli mod- eled after the syllables; the other cells were not excited by any artificial stimulus we tested. We attribute this failure to inad- equate modeling of the syllables (see Discussion). In the 10 cases where artificial models were effective stimuli, neurons required combinations of the first, second, or third harmonics for exci- tation. Two particularly well-characterized neurons are pre- sented below.
Tuning to parameters of autogenous song
The unit 02/1/l was a high-spontaneous-rate harmonic com- bination-sensitive (HCS) neuron that exhibited a vigorous tonic response throughout all but the introductory notes ofautogenous song (Fig. 9a). The neuron also exhibited a very strong, tonic response to a model comprising four 100 msec downward- sweeping FMs in harmonic relationship and of equal amplitude (Fig. 9b). All possible combinations of the four FMs of the model were presented to the neuron (Fig. SC). None of the single FMs elicited excitation. All stimuli that lacked either the second or third harmonic elicited weak or no response. Only two of these stimuli (harmonics 1,2, and 1, 3,4) elicited a response that was statistically significantly different from spontaneous activity (p
The Journal of Neuroscience, November 1992, 12(11) 4321
< 0.05; Fig. SC). In contrast, all stimuli incorporating both the second and third harmonics elicited strong excitation that was much greater than the sum of the excitation to the individual harmonics. The responses to all these stimuli were highly sta- tistically significantly different from spontaneous activity (p < 0.0001; Fig. SC). Thus, this neuron exhibited a reliable, facili- tated response to the second and third harmonics presented simultaneously, and was harmonic combination sensitive.
The neuron 02/1/l was also tested for sensitivity to param- eters of the FM harmonics. In one series of tests, the four har- monics were presented with constant duration (100 msec) and equal amplitude (70 dB) but with varying rate of the FMs. (The fundamental always passed through 850 Hz at 50 msec.) The neuronal response was measured as total spikes over 400 msec (since the neuron had a tonic response) and was plotted as a function of the difference between starting and ending frequen- cies of the FMs. Only downward-sweeping FMs over a limited range of frequencies elicited strong excitation, whereas down- ward-sweeping FMs outside of this range and all upward-sweep- ing FMs elicited weak or no response (Fig. lOa, open circles). In another series of tests, the rate of the harmonic FMs was kept constant while the absolute frequency of the fundamental was altered. Increases or decreases of as little as 100 Hz in the fun- damental caused a significant decrease in the neuron’s response (Fig. lob, open circles).
To compare the FM parameters for maximal neuronal stim- ulation with the corresponding parameters of autogenous song, cross-correlations of the artificial FM stimuli and the autoge- nous song were calculated. For each cross-correlation, the peak of the correlellogram (maximum correlation) was plotted as a function of the FM frequency difference (Fig. lOa, solid trian- gles). This function shows two peaks, one centered near 0 Hz frequency difference that corresponds to the constant frequency harmonic stacks of song, and a second peak centered near 1 kHz frequency difference that corresponds to the FM harmonic stacks of the autogenous song. The position, width, and shape of the second peak in the correlation analysis match reasonably well the position, width, and shape of the neuronal tuning to FM parameters (Fig. lOa). Thus, neuron 02/1/l was tuned to FM parameters of autogenous song.
In another series of tests, the neuron was presented with four harmonics at constant FM (fundamental: 1200 Hz to 500 Hz) and constant amplitude (70 dB) and with varying duration. The neuron responded well to a relatively broad range of durations
Figure IO. Sensitivity of 021 I/ I to parameters of the canonical model. a, Etfect of modifying the slope of the FMs of the canonical model: response (open circles) as a function of the initial FM frequency minus the final FM frequency (frequency difference, or slope) of the funda- mental. Note that only a small range ofslopes elicited a strong response. Correlation between model and autogenous song: the maximum of the correlellogram (peak correlation in arbitrary units) is plotted as a func- tion of the slope of the stimulus (solid triangles), and has two maxima (see Results). Note that the maximum response of the neuron approx- imately matches the second maximum. b, Response of neuron 02/l/l as a function of the absolute frequency of the FMs. The change in the fundamental frequency is plotted. The neuron was sharply tuned to the parameters of the canonical model. c, Response of the neuron as a function of the duration of FMs. The starting and ending frequencies were kept constant. The neuron shows relatively broad tuning to FM duration. The solid circle and bar show mean and SD of durations of syllables with prominent FMs in the autogenous song. d, Approximate correspondence between FM slope sensitivity derived from a (open circles) and c (solid triangles).
iii @ 400 E
8 300 d
5 200
z
3 100
Y 'i3. 0 co
z! 5 1.0
P .i 0.6
'?ii E L 0.4
zo
1.0
0.8
0.6
0.4
0.2
0.0
Slope (kHz / set) -20 -10 0 10 a
-2 -1 0 12 f2 - fl (kHz)
_ (b) L/l
I I I I
4 I I
-200 -100 0 100 200
Frequency shift (Hz)
Slope (kHz / set) 14 7 4.7 3.5 I I (4
I$ J
I I
0 100 200 Duration (msec)
zo -20 -10 0 1-o ;
Slope (kHz/Sec)
4322 Margoliash and Fortune - Combination-Sensitive Neurons in HVc
OC -60 -40 -20 0 20 40
dB Re. 60dB " -120 21 22 23 24
-5o;., . , . , . , .I 0 20 40 60 80 100
Time (msec)
Figure I I. Sensitivity to relative amplitude of harmonics. The stimuli had second and third FM harmonics with frequency and timing param- eters of the canonical model. a, The amplitude of the second harmonic was systematically changed while the amplitude of the third harmonic was kept constant at 60 dB (A2 + 3, solid triangles), and vice versa (2+A3, open circles). Note that the two curves are similar but displaced by about 10 dB: the neuron responded best when the amplitude of the two har- monics was the same or the amplitude of the second harmonic was 10 dB lower than the amplitude of the third harmonic. b, The amplitude of the second and third harmonic of syllable I of the autogenous song (see Fig. 9~) was estimated from spectra (256-point fast Fourier trans- forms) taken every 5 msec throughout the syllable. The second harmonic is about 10 dB louder than the third harmonic.
(Fig. 10~). The average duration of syllables with prominent FMs in the autogenous song (86.9 f 27.0 msec; syllable types 4, 6, 7) approximately matched the optimal FM duration for neuronal response (Fig. 10~). Thus, as well as requiring the second and third harmonics, the neuron was optimally stimu- lated by a small range of FM rates, and was more narrowly tuned to frequency than timing parameters of the stimulus. The excitatory range of FM rates as determined by changing the duration at constant FM approximately matched the excitatory range of FM rates as determined by changing the starting and ending frequencies at constant duration (Fig. 1 Od).
Finally, neuron 02/1/l was tested with the second and third harmonics of the canonical model in different amplitude rela- tionships. At an amplitude of 60 dB for the second harmonic, the neuron responded optimally when the third harmonic was presented at 50-60 dB (Fig. 1 la). At an amplitude of 60 dB for the third harmonic, the neuron responded optimally when the second harmonic was presented at 60-70 dB (Fig. 1 la). Thus, as well as requiring second and third harmonics with appropriate
061314
10.; : 1. .\ -:>.:. : /. I, : ;' ,: g:.-
(c)
3 3 B t
Time (set)
Figure 12. Response of HCS neuron 06/3/4. a, Moderate response to autogenous song. b, Strong phasic/tonic response to syllable 24 presented in isolation. c, Strong phasic/tonic response to a canonical model com- prising six FMs. Note similarity of response in b and c.
rate of FM, this neuron also required the third harmonic to be O-l 0 dB less than the second harmonic. We attempted to com- pare the amplitude tuning of the neuron with the amplitude relationships of different elements of song. It was difficult to assess accurately the relative amplitude relationships of the FMs of the syllables, in part because of inherent AflAt limitations of the Fourier transform and in part because of resonances created by the small sound isolation chamber in which the autogenous
The Journal of Neuroscience, November 1992, 12(11) 4323
song was recorded. Thus, the relative amplitude relationships were assessed for constant frequency (CF) harmonic stack syl- lables, for which the AflAt and resonance problems are mini- mized. For CF syllables 1, l’, and 5, the second harmonic was from 0 to 10 dB louder than the third harmonic (e.g., Fig. 11 b), and for CF syllable 5’ the second and third harmonics were of about equal amplitude. [These relationships can be observed qualitatively by examining the sonograph of the song in Fig. 9~; the size of the illustration limits the amount of information in the sonograph, however. Note that the first harmonic (funda- mental) is very faint and does not reproduce well.] Thus, the relative sensitivity of the neuron to the third harmonic com- pared to the second harmonic approximately matched the spec- tral organization of autogenous song.
Complex temporal and spectral requirements
Some HCS neurons exhibited complex harmonic and temporal requirements. For example, the neuron 06/3/4 responded rel- atively weakly at syllable 24 of autogenous song (Fig. 12~). Bird zf-06 commonly sang a long song with many motifs and slight variations among the motifs. No part of the autogenous song, including other copies of syllable 24, elicited strong response (not shown). Neuron 06/3/4 nevertheless exhibited a strong re- sponse to syllable 24 presented in isolation (Fig. 12b). A model of syllable 24 was constructed with multiple harmonic FMs, each harmonic comprising four connected linear FM segments. This stimulus also elicited strong excitation, although not as strong as the natural syllable (Fig. 12~). The neuron exhibited a weak but statistically significant response to all stimuli, in- cluding noise bursts, many tone bursts, and individual harmonic components of the model (Fig. 13b). All stimuli that included both the second and third harmonic components, however, elic- ited a much stronger, reliable, facilitated response (Fig. 13b). Thus, this neuron was harmonic combination sensitive.
The neuron was also presented with combinations oftemporal components (“segments”) of the model (see Fig. 13~). The in- dividual segments elicited only weak or no response (Fig. 13~) comparable to the nonspecific response of the neuron to tones and noise bursts. Sequential pairs of segments from the model and novel pairs of segments also did not elicit strong responses. When the first three segments of the model were presented in proper order, however, the full excitatory response ofthe neuron was elicited (Fig. 13~). Thus, this neuron required a complex temporal sequence of FMs for excitation.
HCS population data
All 10 neurons that responded to complex artificial stimuli but not to tone bursts were harmonic combination sensitive. Four of these had phasic responses to song, and three of the four had TCS properties as well. (The fourth was not tested for TCS properties.) In total, seven HCS neurons were presented with three to five conspecific songs. These neurons were unresponsive to conspecific songs (mean SR ratio = 0.10 1 f 0.173; N = 29). Five of these neurons were tested with unmodified, Noise, and Reverse syllables of autogenous song; all responded weakly to the modified syllables (mean Reverse SR ratio = 0.125 f 0.101; mean Noise SR ratio = 0.061 f 0.095). Only three cells were tested with LinAM syllables; two of these exhibited stronger responses than to the natural syllables. These preliminary data suggest that HCS neurons exhibit selectivities and specificities similar to those for TCS neurons; however, any conclusion about HCS population data awaits larger sample sizes.
u ;o do 40 Time (msec)
400 . I
0 combination&
~ 1 1 I - .
5 t
cn
0 . . . . . . . . . . . A B C D A A A’ B C A A
BCCCDBB cc
Temporal D
combinations Figure 13. Sensitivity of neuron 06/3/4 to parameters of the canonical model. a, The canonical model was composed of four complex, mul- tipart FMs in harmonic relationship (1-4). Each F’M had four linear FM segments (A-0). b, Parameters of harmonic combination sensitivity, as in Figure 9c. Neuron required second and third harmonics. wn, white noise; syl, syllable 24. The sample sizes (20 repetitions per trial) asso- ciated with the error bars (SD), were, for harmonics 2-3, N = 4; 24, N = 2; 111, N = 4; and syl, N = 2. The response to tone bursts (tb) was
weak at all frequencies tested (mean, SD, minimum, and maximum responses are shown). c, Sensitivity to temporal combinations. The stimuli comprised one or more segments. Each segment had all four harmonics. The neuron responded best when all segments or the first three segments were presented. Response to pairs of segments or single segments was weak. A’, a variant of segment A.
4324 Margoliash and Fortune * Combination-Sensitive Neurons in HVc
Discussion We have described single units in the HVc of the adult male zebra finch that are highly sensitive to the temporal and spectral parameters of autogenous song syllables. The very long inte- gration times ofthese neurons-in some cases spanning multiple syllables-the complexity of the spectral properties, as well as the existence of temporal and harmonic combination sensitivity suggest that the high degree of stimulus (song) specificity of HVc neurons results from sensitivity to dynamical properties of the stimuli. Although time-varying parameters are an essential com- ponent of most songs, concomitant neuronal properties have been studied relatively infrequently (e.g., Margoliash, 1983). Elucidation of the circuits underlying the response properties of CS HVc neurons may help to identify neuronal elements that are involved in song learning. These circuits may also contribute to the perception of song in the adult.
Classes of TCS neurons
TCS neurons were classified as single syllable, syllable pair, or multiple syllable based on their minimal excitatory require- ments for sequences of sounds. Single-syllable TCS neurons exhibited shorter integration times than syllable-pair or mul- tiple-syllable neurons. Consistent with the differences in inte- gration time, single-syllable TCS neurons responded about equally to isolated syllables as to those syllables presented in song, whereas syllable-pair TCS neurons were more excited by the syllable pairs in the context of song than in isolation. The longer integration times of syllable-pair TCS neurons were also associated with a decrease in response to conspecific songs. Thus, for these neurons, longer integration times were associated with greater song selectivity. Since our tests for stimulus specificity (Noise, Reverse, LinAM) were conducted on isolated syllables and syllable pairs, we may have failed to detect potential dif- ferences in the stimulus specificity of single-syllable and syllable- pair TCS neurons when assessed in the context of song.
The most challenging features of the response properties pre- sented here are the long integration times combined with high degrees of stimulus specificity. This was especially apparent for multiple-syllable TCS neurons. One neuron required an entire motif comprising five syllables for excitation. In other cases, TCS neurons exhibited response peaks late in song that were dependent on prior stimulation three or more syllables earlier in song. Although these neurons integrated over hundreds of milliseconds, they were very selective for the particular syllable sequences of autogenous song. In bats, higher-order neurons that are CS for multiple components of the pulse/echo pair have integration times of up to about 30 msec, reflecting the behav- ioral requirements for echolocation (Tsuzuki and Suga, 1988). To the best of our knowledge, the combined qualities of a very high degree of stimulus specificity and very long integration time have only been described for single units in song birds (see Margoliash, 1983).
The distinction among classes of TCS neurons has proven useful for purposes of analysis, but nevertheless is somewhat arbitrary. The classification of any given unit reflected the con- duct of the experiment. Operationally, after isolating a unit, presenting autogenous song, and quickly investigating the peak responses to song, we focused detailed analysis on a particular response peak. Thus, we could not exclude the possibility that a neuron exhibited other properties for other response peaks.
Indeed, some single-syllable TCS neurons had some response peaks at the beginnings of syllables, suggesting they were inte- grating across syllables. The difference in integration time be- tween single-syllable and syllable-pair TCS neurons is poten- tially biased by the same procedure (see above). It is likely that there is a more graded set of TCS neurons than implied by the categorical terminology we adopted here for operational reasons.
Relationship between TCS and HCS properties
It is difficult to estimate the relative frequency of various classes of HVc neurons because the complexity of HVc response prop- erties requires lengthy recordings to characterize individual cells. In the case of HCS neurons, however, our small sample is very likely to be a significant underestimate. Zebra finch syllables are complex and are difficult to model. HVc cells tended to respond selectively to the more complex, elaborate syllables of a song (Margoliash and Fortune, unpublished observations), further complicating the modeling effort. The majority of TCS neurons required at least two syllables for excitation, which imposes a yet more rigorous modeling requirement. Furthermore, the soft- ware we developed to model zebra finch syllables assumed har- monic relationships, but there is evidence in some species that interactions of two nonharmonically related fundamentals is an important mechanism for vocal production (Nowicki and Ca- pranica, 1986). CS neurons that require components in non- harmonic relationship have been described in bats (e.g., Suga et al., 1979). A proper estimate of the number of HCS cells in HVc awaits the development of better modeling techniques.
In our small sample, HCS neurons were highly selective for specific features of autogenous song. The response properties of these neurons-weak responses to conspecific songs, Reverse and Noise syllables, and stronger responses to LinAM sylla- bles-are similar to the response properties of TCS neurons. In a few cases we were able to demonstrate that TCS neurons also exhibited HCS properties. It may be the case that many or most TCS neurons are also harmonic combination sensitive but not vice versa. Tentatively, the non-TCS neurons with HCS prop- erties are apparently distinguished on the basis of tonic re- sponses to song and a high spontaneous rate (>2.5 spikes set-I).
Song selectivity of CS neurons in H Vc
Both TCS and HCS neurons in HVc are highly selective for autogenous song. All CS neurons responded more strongly to autogenous song than to virtually any conspecific song tested. A total of 15 different conspecific songs were used as test stimuli across the entire data set; 10 of these were also the autogenous songs of birds that contributed to the data of this report. Thus, the observed selectivity for autogenous song cannot result from using abnormal or suboptimal conspecific test songs. Similar selectivity for autogenous song has also been reported in the HVc of white-crowned sparrows (Margoliash, 1983, 1986; Mar- goliash and Konishi, 1985). The development of selectivity for autogenous song presumably is related to auditory feedback mechanisms during song learning (Volman and Konishi, 1986; see Margoliash, 1987). Since a role for auditory feedback during song learning may be ubiquitous in oscine passerines (see Kon- ishi, 1985), so might the selectivity for autogenous song in HVc.
It is improbable that the strong selectivity for autogenous song results from sampling bias introduced by using autogenous song as the search stimulus. Throughout HVc, autogenous song elic- ited strong responses and conspecific songs elicited weaker or no responses. Our criterion for recording from a neuron was a
The Journal of Neuroscience, November 1992, 12(11) 4325
response to autogenous song, but we found that virtually all neurons preferred autogenous as compared to conspecific songs. In contrast, in recordings from the field L complex of white- crowned sparrows, many multiunit clusters that responded to autogenous song exhibited stronger responses to conspecific songs (Margoliash, 1986). Single-unit recordings in the thalamic nu- cleus ovoidalis recorded in urethane-anesthetized zebra finches also exhibited essentially no selectivity for autogenous song (B. Diekamp and D. Margoliash, unpublished observations).
In the young bird, the autogenous response properties of HVc neurons may be established by sensory-motor interactions dur- ing song learning (Volman and Konishi, 1987; see Margoliash, 1987). Since the autogenous song is generally unique to that individual, what is the behavioral significance of neurons in adult birds that are highly selective for the autogenous song? It has been hypothesized that male birds use an internal reference of their own songs in assessing the songs of conspecifics (Morton, 1982). Field experiments tend to support this hypothesis (McGregor et al., 1983; McGregor and Falls, 1984; McGregor and Krebs, 1984). Many of the TCS neurons reported here ex- hibited some responses to conspecific songs, and weaker re- sponses to abnormal (modified) songs and to artificial stimuli (see below). The spatiotemporal pattern of recruitment of HVc neurons in response to a conspecific song is presumably a mea- sure of similarity between that song and the autogenous song (Margoliash, 1986). Song-specific auditory neurons in HVc may therefore contribute to conspecific song recognition by serving as an“autogenous reference” (Margoliash, 1987) although this has yet to be experimentally tested. Female canaries with bi- lateral lesions of the HVc exhibit a degradation in their ability to discriminate conspecific songs (Brenowitz, 199 1). Female ca- naries do not sing or they sing few and simple songs, however, and the song selectivity of their HVc has yet to be explored.
The role of time-varying spectral cues
HVc neurons are particularly sensitive to modification of the dynamic spectral properties of song. The responses of CS neu- rons in HVc to modified syllables of autogenous song gave in- sight into the set of acoustic parameters underlying those re- sponses. All TCS neurons exhibited essentially no response to broadband noise with the identical amplitude envelope of the syllable. Thus, in the absence of dynamical spectral cues drawn from autogenous song, the normal amplitude envelope of the syllable or syllable pair (Noise stimuli) was insufficient to excite TCS neurons. For both single-syllable and syllable-pair TCS neurons, modification of the amplitude envelope of an excit- atory syllable while leaving the spectral cues unaltered (LinAM stimuli) reduced the response by about 50%, on average. Thus, in the presence of normal spectral cues, the relative amplitude of parts of a syllable had some effect on the response of TCS neurons. The effect of changing the waveform was probably not a simple effect of absolute amplitude, because TCS neurons exhibited relatively constant, saturated excitatory responses to stimuli in the range of 60-80 dB. The specificity of HCS neurons for complex FMs in harmonic relationship confirms the im- portance of dynamical spectral cues for HVc neurons.
On average, single-syllable and syllable-pair TCS neurons ex- hibited responses to conspecific songs of about 50% and 28%, respectively, of the response to autogenous song. Thus, non- autogenous songs incorporating species-typical spectral cues were more effective at exciting TCS neurons than were stimuli in- corporating abnormal cues never heard in the wild. This result
is particularly compelling for the Reverse modification, which maintained the overall spectral content of syllables. Although the effectiveness of autogenous song in stimulating HVc neurons has frequently been stressed, it is important to note that these neurons can also provide useful information regarding spectral/ temporal cues of conspecific songs.
Integration time of TCS neurons
The integration time for TCS neurons in HVc-the time be- tween the onset of the first stimulus and the onset of the facil- itated response-was very long, ranging from 80 to 350 msec. This definition of the integration time identifies only a lower limit, however. Syllable-pair TCS neurons could be quite in- sensitive to changes in the intersyllable intervals, maintaining a strong facilitated response as the interval was increased by hundreds of milliseconds. A similar phenomenon has been not- ed in white-crowned sparrows (Margoliash, 1983). Furthermore, the complexity of the responses of some TCS neurons within the context of song precluded assessment of the maximum in- tegration time. An analysis of the integration time of one re- sponse peak in the song did not imply that the integration time of the next peak was not considerably longer. Thus, it is rea- sonable to assume that we failed to detect the longest integration times for some of the neurons we recorded from.
Previous measures of temporal combination sensitivity are somewhat inappropriate for the very long integration time of TCS neurons in HVc. Neuronal temporal combination sensi- tivity was first described for FM-FM neurons of the auditory cortex of mustached bats (O’Neill and Suga, 1979). Most of those neurons responded most strongly to two short-duration (-4 msec) FMs of appropriate frequencies separated by a spe- cific interval in the range of 4-18 msec. For those neurons, temporal combination sensitivity was defined as the nonlinear or facilitated response to the FM pair compared with the sum of the responses to the individual FMs. This definition is difficult to apply to some HVc neurons that nevertheless have TCS properties, however, because in birdsong the duration of the stimuli can be much longer than the duration of the facilitated response. For example, consider a hypothetical example of a TCS neuron that gives a phasic facilitated response lasting 20- 40 msec that occurs 300 msec after the onset of the first syllable of a syllable pair. Each syllable may be 125 msec long, separated by an interval of 50 msec. Comparing the facilitated response with the sum of the spikes over the stimulus duration, or du- ration plus offset, of each syllable presented in isolation can dilute the measure of facilitated response with counts of non- specific background activity over hundreds of milliseconds. Conversely, counting the spikes over a 20-40 msec time interval 175 msec after the offset of the first syllable ignores the role of the dynamics of the second syllable in eliciting the factilitated response. For long-duration stimuli, we found a better measure of temporal combination sensitivity to be the response of the cell to the second element of the pair presented in isolation with the response to that element in the context of a sequence of sounds.
Concluding remarks
A simple model has previously been proposed to explain the responses of TCS neurons in white-crowned sparrows (Mar- goliash, 1983). In that model, offset excitation of one (presyn- aptic) selective input channel is hypothesized to combine with onset/sustained excitation of a second selective input channel
4326 Margoliash and Fortune * Combination-Sensitive Neurons in HVc
to produce a suprathreshold response in a TCS neuron. In the white-crowned sparrow model, the mechanism for each chan- nel’s selectivity was not described. The present data, especially the very long integration times over multiple syllables, the mul- tiple response peaks, and the sensitivity to dynamical spectral cues, suggest that the input selectivity may be the result of complex interactions. Although many extensions of the model are possible, it is noteworthy that HVc neurons also participate in song production (Nottebohm et al., 1976; McCasland 1987). One possibility, therefore, is that central pattern generators (CPGs) that are recruited during singing may also be recruited when a song is heard. Activation of a CPG, recruited by hearing one or more syllables, may provide patterned activity over the time course of one or more following syllables. The activity of these CPGs could be combined with ongoing auditory input to produce the facilitated response of TCS neurons. The data to support such a hypothesis are fragmentary, although recent re- sults suggest that there is a common overall pattern in HVc, unique to each bird, in response to autogenous song (Sutter and Margoliash, 1992). The excitement of testing such a hypothesis lies in elucidating unusual neuronal response properties and topography, in gaining insight into the sites and organization of circuit modifications during song learning, and potentially in understanding at the neuronal level the relationships between song production and perception.
References Bastian J, Yuthas J (1984) The jamming avoidance response of Ei-
gemaniu: properties of a diencephalic link between sensory pro- cessing and motor output. J Comp Physiol A 154:895-908.
Brenowitz EA (1991) Altered perception of species-specific song by female birds after lesions of a forebrain nucleus. Science 251:303- 305.
Capranica RR (1965) Research monograph 33, The evoked vocal response of the bullfrog. Cambridge. MA: MIT Press.
Fortune ES, Margoliash D (1989) Combination-sensitive neurons in the zebra finch’s HVc. Sot Neurosci Abstr 15:6 17.
Fuzessery ZM, Feng AS (1982) Frequency selectivity in the aunuran auditory midbrain: single unit responses to single and multiple tone stimulation. J Comp Physiol 146:47 1484.
Fuzessery ZM, Feng AS (1983) Mating call selectivity in the thalamus and midbrain of the leopard frog (Rana p. pipiens): single and mul- tiunit analyses. J Comp Physiol 150:333-344.
Griffin DR (1958) Listening in the dark. New Haven, CT: Yale UP. Heiligenberg W, Rose G (1985) Phase and amplitude computations
in the midbrain of an electric fish: intracellular studies of neurons participating in the jamming avoidance response of Eigenmunnia. J Neurosci 5:5 15-53 1.
Heiligenberg W, Baker C, Matsubara J (1978) The jamming avoidance response in Eigenmunnia revisited: the structure of a neuronal de- mocracy. J Comp Physiol 127:267-286.
Katz LC, Gurney ME (198 1) Auditory responses in the zebra finch’s motor system for song. Brain Res 2 11: 192-l 97.
Knudsen EI, Konishi M (1979) Mechanisms of sound localization in the barn owl (Tyto alba). J Comp Physiol 133: 13-2 1.
Konishi M (1985) Birdsong: from behavior to neuron. Annu Rev Neurosci 8: 125-l 70.
Langner G, Bonke D, Scheich H (198 1) Neuronal discrimination of natural and synthetic vowels in field L of trained mynah birds. Exp Brain Res 43: I l-24.
Liberman A, Isenberg D, Rakerd B (198 1) Duplex perception of cues for stop consonants: evidence for a phonetic module. Percept Psy- chophys 30:133-143.
Margoliash D (1983) Acoustic parameters underlying the responses of song-specific neurons in the white-crowned sparrow. J Neurosci 3: 1039-1057.
Margoliash D (1986) Preference for autogenous song by auditory neu- rons in a song system nucleus of the white-crowned sparrow. J Neu- rosci 6:1643-1661.
Margoliash D (1987) Neural plasticity in birdsong learning. In: Im- printing and cortical plasticity (Rauschecker JP, Marler P, eds), pp 23-54. New York: Wiley.
Margoliash D (1989) Neural mechanism and behavioral plasticity in birdsong learning. In: Proceedings of the 2d International Congress of Neuroethology, Neural mechanisms of behavior (Erber J, Menzel R, Pfuger H-J, Todt D, eds), pp 149-150. Stuttgart: Thieme.
Margoliash D, Konishi M (1985) Auditory representation of autoge- nous song in the song-system of white-crowned sparrows. Proc Nat1 Acad Sci USA 82:5997-6000.
Margoliash D, Staicer CA, Inoue SA (199 1) Stereotyped and plastic song in adult indigo buntings, Pusserinu cyuneu. Anim Behav 42:367- 388.
Masino T, Knudsen EI (1990) Horizontal and vertical component of head movements are controlled by distinct neuronal circuits in the barn owl. Nature 345:434-437.
McCasland JS (1987) Neuronal control of bird song production. J Neurosci 7:23-39.
McCasland JS, Konishi M (1981) Interaction between auditory and motor activities in an avian song control nucleus. Proc Nat1 Acad Sci USA 78:7815-1819.
McGregor PK, Falls JB (1984) The response of western meadowlarks (Sturndu neglecta) to the playback of undearaded and dearaded sonas. Can J Zoo1 62:2125-2128. -
McGregor PK, Krebs JR (1984) Sound degradation as a distance cue in great tit sona. Behav Ecol Sociobiol 16:49-56.
McGregor PK, Krebs JR, Ratcliffe LM (1983) The reaction of great tits (Paw major) to playback of degraded and undegraded songs: the effect of familiarity with the stimulus song type. AUK 100:898-906.
Moiseff A, Konishi M (198 1) Neuronal and behavioral sensitivity to binaural time differences in the owl. J Neurosci 1:4048.
Morton ES (1982) Grading, discreteness, redundancy, and motiva- tion-structural rules. In: Acoustic communication in birds, Vol 1, Production, perception, and design features of sounds (Kroodsma DE, Miller EH, eds), pp 183-2 13. New York: Academic.
Nottebohm F, Stokes TM, Leonard CM (1976) Central control of song in the canary, Serinus cunurius. J Comp Neurol 165:457486.
Nowicki S, Capranica RR (1986) Bilateral syringeal coupling during phonation of a songbird. J Neurosci 6:3595-3610.
O’Neill WE, Suga N (1979) Target range-sensitive neurons in the auditory cortex of the mustache bat. Science 203:69-73.
Riquimaroux H, Gaioni SJ, Suga N (1991) Cortical computational maps control auditory perception. Science 25 1:565-568.
Stevens SS, Newman EB (1936) The localization of actual sources of sound. Am J Psycho1 48:297-306.
Suga N (1990) Cortical computational maps for auditory imaging. Neural Networks 3:3-2 1.
Suga N, O’Neill WE, Manabe T (1979) Harmonic-sensitive neurons in the auditory cortex of the mustache bat. Science 203:270-274.
Suga N, O’Neill WE, Kujirai K, Manabe T (1983) Specificity of com- bination-sensitive neurons for processing of complex biosonar signals in auditory cortex of the mustached bat. J Neuroohvsiol 49:1573- 1626. -
- <
Sullivan WE III (1982) Neural representation of target distance in auditory cortex of the echolocating bat Myotis lucz&us. J Neuro- physiol 48:lOl l-1032.
Sutter ML, Margoliash D (1992) Auditory representation of song syl- lables in zebra finch HVc: is temporal context of syllables topograph- ically encoded? AR0 Abstr 15:25.
Tinbergen N (195 1) The study of instinct. Oxford: Oxford UP. Tsuzuki K, Suga N (1988) Combination-sensitive neurons in the ven-
troanterior area of the auditory cortex of the mustached bat. J Neu- rophysiol 60: 1908-l 923.
Volman SF, Konishi M (1986) Development of auditory selectivity in a song-system nucleus during song learning. Sot Neurosci Abstr 12:954.
Volman SF, Konishi M (1987) Auditory selectivity in the song-control nucleus HVc appears with the onset of plastic song. Sot Neurosci Abstr 13:870.


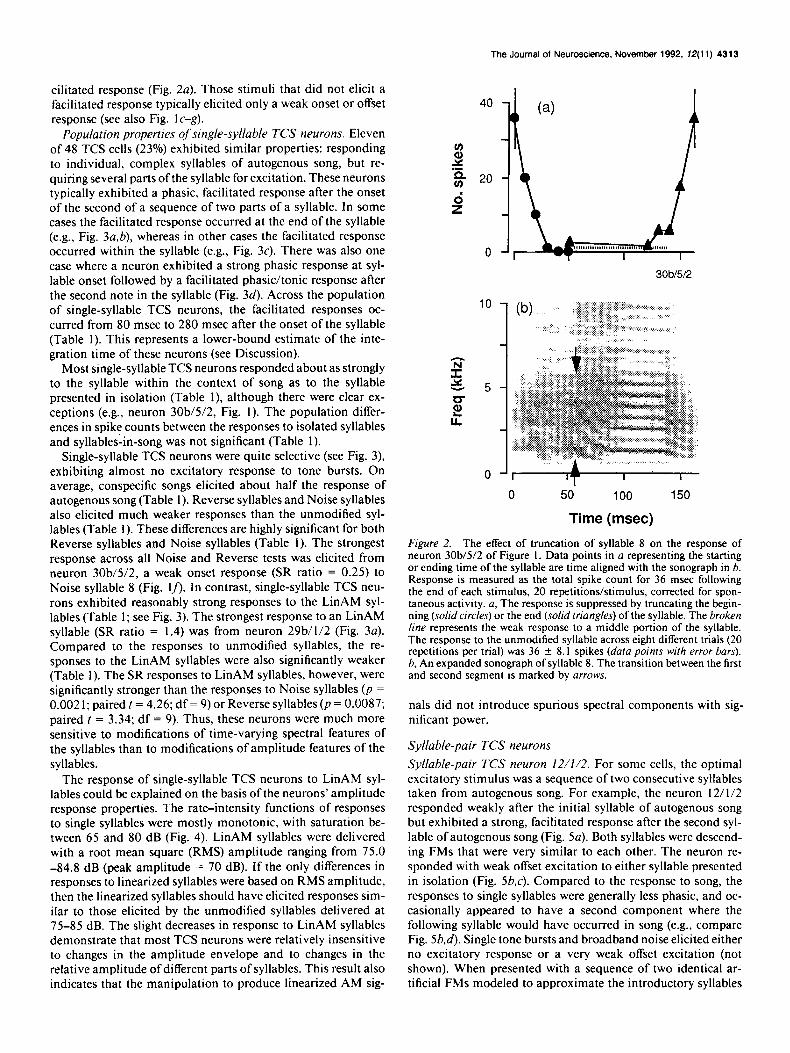
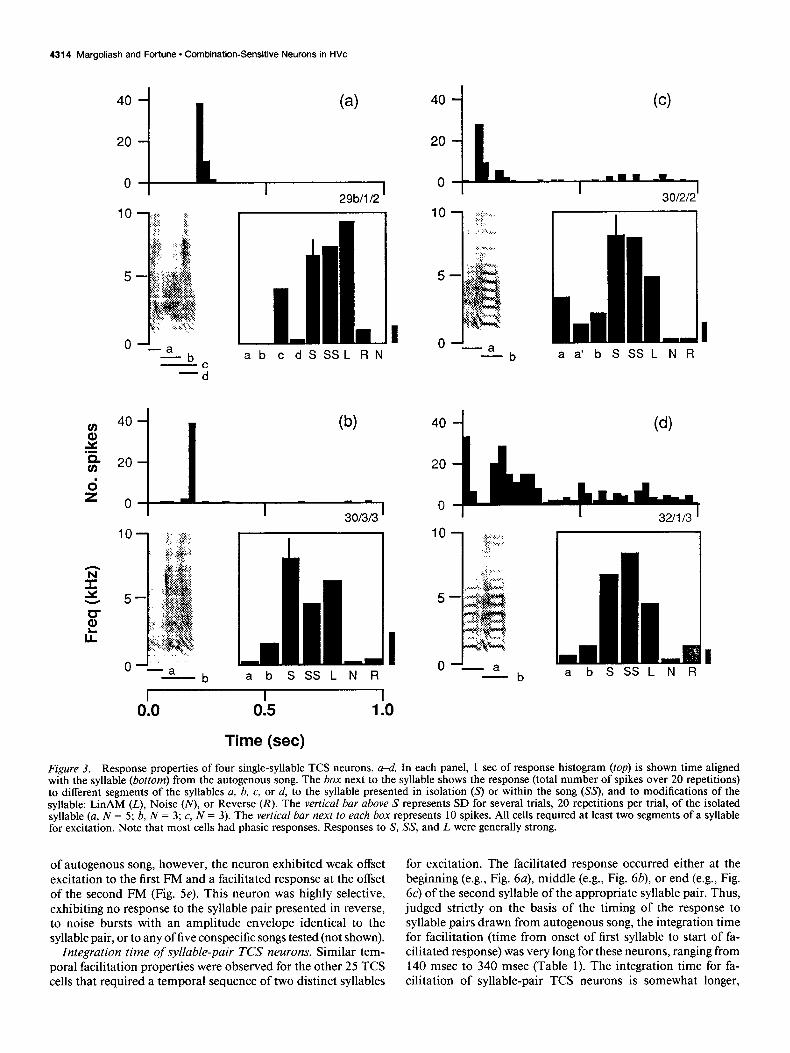

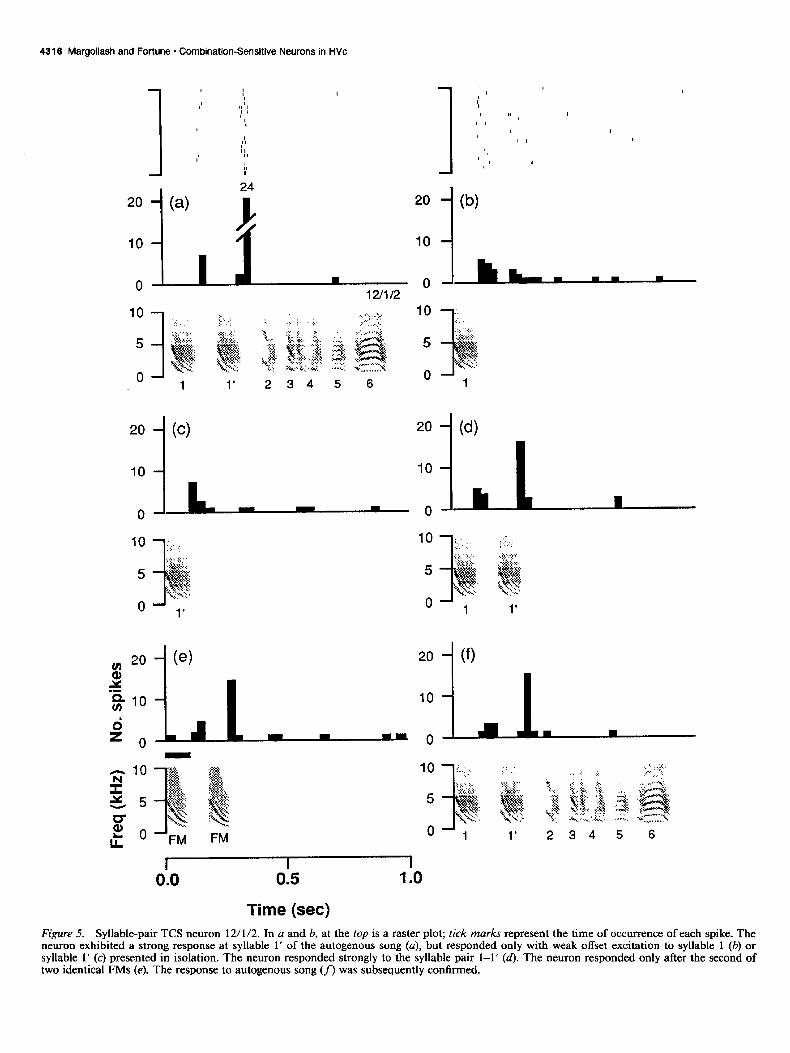

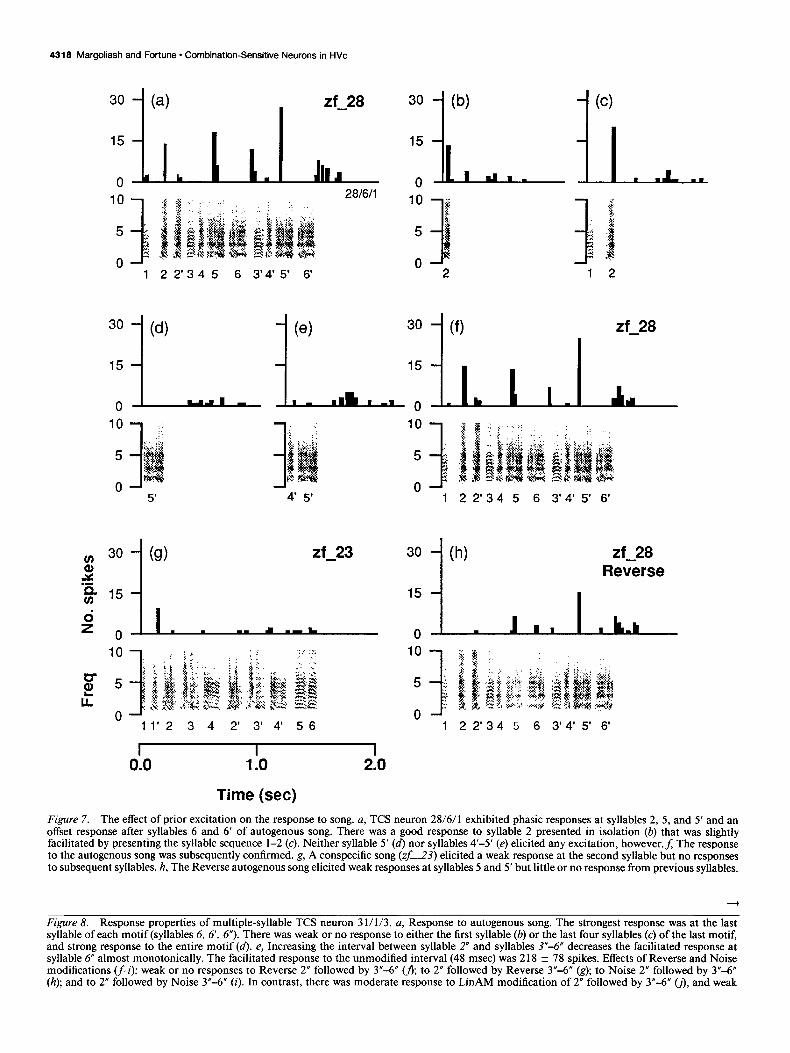

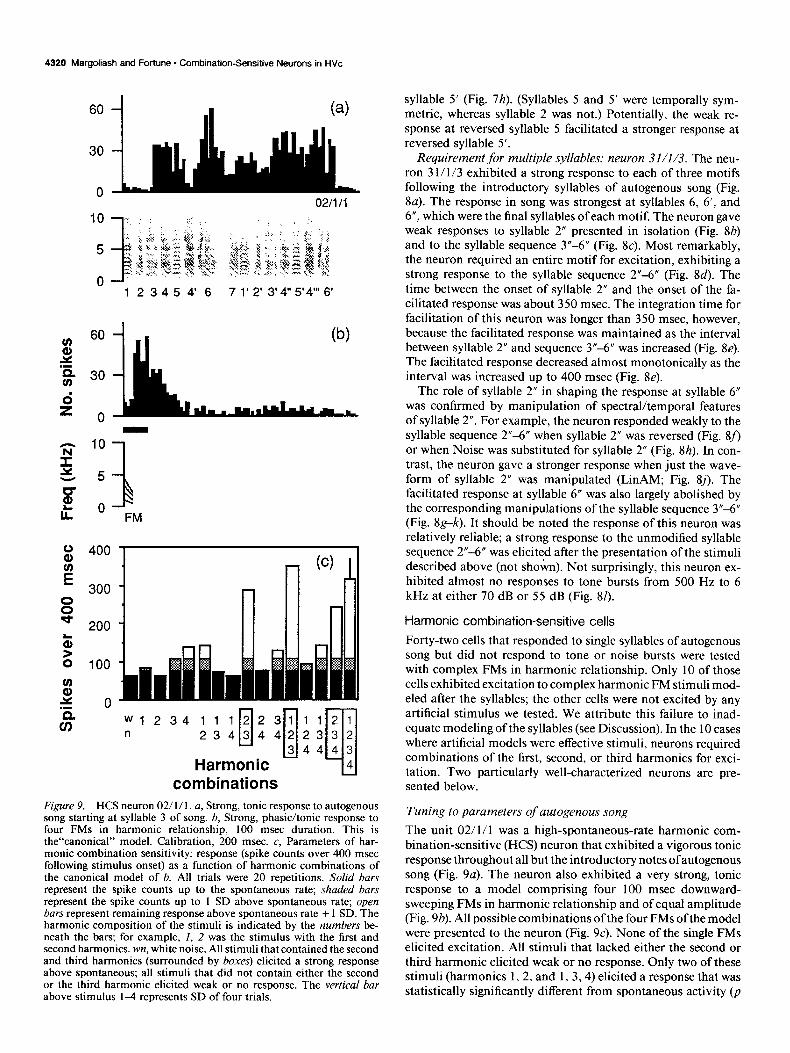


![i .] APPROXIMATING HARMONIC FUNCTIONS 499€¦ · APPROXIMATING HARMONIC FUNCTIONS 499 THE APPROXIMATION OF HARMONIC FUNCTIONS BY HARMONIC POLYNOMIALS AND BY HARMONIC RATIONAL FUNCTIONS*](https://static.documents.pub/doc/80x56/5f0873ba7e708231d42214c2/i-approximating-harmonic-functions-499-approximating-harmonic-functions-499-the.jpg)


