2990 J. Opt. Soc. Am. A/Vol. 11, No. 11/November 1994
Temporal-color space analysis of reflection
Yoichi Sato
The Robotics Institute, Carnegie Mellon University, Pittsburgh, Pennsylvania 15213
Katsushi Ikeuchi
School of Computer Science, Carnegie Mellon University, Pittsburgh, Pennsylvania 15213
Received July 22, 1993; revised manuscript received June 17, 1994; accepted June 27, 1994We propose a novel method to analyze a sequence of color images. A series of color images is examined in afour-dimensional space, which we call the temporal-color space, whose axes are the three color axes red, green,and blue and one temporal axis. The significance of the temporal-color space lies in its ability to representthe change of image color with time. A conventional color space analysis yields a histogram of the colorsin an image, only for an instant of time. Conceptually, the two reflection components from the dichromatic-reflection model, the specular-reflection component and the body-reflection component, form two subspacesin temporal-color space. These two components can be extracted at each pixel in the image locally. Usingthis fact, we analyzed real color images and separated the two reflection components successfully. We didnot make any assumptions about surface properties or the global distribution of surface normals. Finally,object shape was recovered.
1. INTRODUCTION
Color spaces, especially the red-green-blue (RGB)color space, have been widely used by the computervision community to analyze color images. The firstapplication of color space analysis was image segmen-tation by partitioning a color histogram into Gauss-ian clusters.' Shafer proposed that, illuminated by asingle light source, a cluster of uniformly colored di-electric objects in the color space forms a parallelo-gram defined by two color vectors, namely, the specular-reflection vector and the body-reflection vector.2 This isalso known as the dichromatic-reflectance model.3 Sub-sequently, Klinker et al.
4 5 demonstrated that the clusteractually forms a T shape instead of a parallelogram inthe color space, and they separated the body-reflectioncomponent and the specular-reflection component bygeometrically clustering a scatterplot of the image inthe RGB color space. They used the separated body-reflection component for segmentation of a color imagewithout its suffering from disturbances of highlights inthe image. This method is based on the assumptionthat the directions of the surface normals in an image arewidely distributed in all directions. This assumptionguarantees that both the body-reflection vector and thespecular-reflection vector will be visible. Therefore theiralgorithm cannot handle cases in which only a few planarsurface patches exist in the image. Recently Novak6 ex-amined the features of clusters caused by surface rough-ness and interreflection.
Techniques to separate the two reflection componentsby using a polarization filter have also been studied.Wolff7 has shown that the specular-reflection componentcan be successfully separated from the body-reflectioncomponent in a black-and-white image by use of apolarization filter. Recently Nayar et al.8 introducedthe technique to separate the two reflection components
by using polarization in the case of a color image andproduced impressive experimental results.
Recently, Funt and Drew introduced an algorithm toseparate two different body-reflection components, no-bounce body reflection and one-bounce body reflection,from reflection on convex surfaces of uniform color anddiffuse reflectance.9 We found that the algorithm thatwe introduce in this paper is equivalent to their algorithmin the sense that one can separate two reflection compo-nents by using their different colors.
Two other techniques that have been used to analyzeimages are shape-from-shading and photometric stereo.The shape-from-shading technique introduced by Horn' 0
recovers object shapes from a single intensity image.In this method one can calculate surface orientations,starting from a chosen point whose orientation is knowna priori, by using the characteristic strip expansionmethod. Ikeuchi and Horn" developed a shape-from-shading technique that uses occluding boundaries ofan object to calculate surface orientation iteratively.Woodham' 2 proposed a new technique for shape re-covery that uses multiple images with different lightsource locations. His technique does not rely on assump-tions such as the surface smoothness constraint. Nayaret al.'3 developed a technique for recovering object shapeand reflectance without any knowledge of surface re-flectance. The techniques used by Woodham and Nayarare collectively called photometric stereo; the object shapeis recovered based on intensity change that is due to dif-ferent light source directions.
In this paper we propose a new technique to analyzeobject shape and surface properties from color images.We observe how the color of the image changes with amoving light source in a four-dimensional RGB-plus-light-direction space, which we call the temporal-color space.(The temporal-color space is defined in Subsection 2.C.)The proposed technique does not require any knowledge
Vol. 11, No. 11/November 1994/J. Opt. Soc. Am. A 2991
of surface reflectance. Only local information is neededin our analysis. In other words we can recover the sur-face orientation and reflectance based on color changeat each pixel individually. This method has been suc-cessfully applied to real color images, resulting in thedecomposition of pixel intensities into the specular- andbody-reflection components, which are subsequently usedto recover surface orientation and reflectance.
In Section 2 the temporal-color space is introduced andcompared with the spaces currently used in color andphotometric analysis. Our proposed algorithm to decom-pose reflection into the two reflection components in thetemporal-color space is described in Section 3. The re-sults of experiments conducted using objects of differenttypes of material are presented in Section 4. Finally, weconclude this paper in Section 5.
2. TEMPORAL-COLOR SPACE
The spaces most commonly used in color space analysisand in photometric stereo are the RGB color space andthe I-Os (image intensity-light source direction) space,respectively. In this paper we propose a new space calledthe temporal-color space in order to analyze color changewith time, which cannot be analyzed in either the RGBcolor space or the -O,, space. In this section we de-scribe these three spaces and their relationships with oneanother. Note that, in this paper, the term pixel valuerefers to pixel intensity.
A. RGB Color SpaceAn image intensity I is determined by the spectral distri-bution of incident light to the camera h(A) and the cameraresponse to the various wavelengths s(A), i.e.,
I = s(A)h(A)dA. (1)
A color camera has color filters attached in front of its sen-sor device. Each color filter has a transmittance functionr(A) that determines the fraction of light transmitted ateach wavelength A. Then, pixel intensities IR, IG, and1B from red, green, and blue channels of the color cameraare given by the following integrations:
IR = f TR(A)s(A)h(A)dA,
I = f ro(A)s(A)h(A)dA,
IB = f TB(A)S(A)h(A)dA,
shape (Fig. 1). They clustered the two components of theT shape in order to separate the specular-reflection com-ponent and the body-reflection component.
A significant limitation of the method is that it worksonly when surface normals in the image are well dis-tributed in all directions. Suppose that the image hasonly one planar object illuminated by a light source thatis located far away from the object. Then, all the pixelson the object are mapped to a single point in the colorspace because observed color is constant over the objectsurface. The T shape converges to a single point in theRGB color space that represents the color of the object, be-cause the plane has uniform color. As a result, we can-not separate the reflection components. This indicatesthe dependence of the method on global information, andthus it cannot be applied locally.
B. I-O. (Intensity-Light Source Direction) SpaceNayar et al. 13 analyzed an image sequence given by a mov-ing light source in the I-Os space. They consider howthe pixel intensity changes as the light source direction Osvaries in the viewer-centered coordinate system (Fig. 2).
The pixel intensity from a monochrome camera is writ-ten as a function of Os:
I(0,,) = g(0,) f s(A)h(A)dA, (4)
where g(O,,) represents intensity change with respect to
- r-…------- -- - - - - - - - - - - -
I I I2
i t ~ ~~~ I
200/' -__ -
RED
Fig. 1. T shape in the RGB color space (synthesized data).
camera
(2)
where rR(A), r 0 (A), and rB (A) are the transmittance func-tions of the red, green, and blue filters, respectively. Thethree intensities IR, IG, and IB form a 3 X 1 color vector Cthat represents the color of a pixel in the RGB color space:
FIR F f TR(A)s(A)h(A)dA
C I; X TG (A)s(A)h(A)dA * (3)
|B TB (A)s(A)h(A)dA
Klinker et al.4,5 demonstrated that the histogram of di-
electric object color in the RGB color space forms a T
8n
light source
as
object
Fig. 2. Viewer-centered coordinate system. n is a surface nor-mal, and 0, and 0,, denote the angle between the viewing direc-tion and the light source direction and the angle between theviewing direction and the surface normal, respectively.
BLUE
Y. Sato and K. Ikeuchi
I-1II
2992 J. Opt. Soc. Am. A/Vol. 11, No. 11/November 1994
I (,)
a£
Fig. 3. -0 , space.
a light source direction ,. Note that the spectral dis-tribution of incident light to the camera h(A) is generallydependent on geometric relations such as the viewing di-rection and the illumination direction. However, as anapproximation, we assume that the function h(A) is inde-pendent of these factors. The vector p[0,, I(0,)] showshow pixel intensity changes with respect to light-sourcedirection in 1-0,, space (Fig. 3).
As opposed to analysis in the RGB color space, the 1-O,space analysis is applied locally. All the necessary in-formation is extracted from the intensity change at eachindividual pixel. Nayar et al. used the 1-0, space toseparate the surface-reflection component and the body-reflection component, using a priori knowledge of thegeometry of the photometric sampler.' 3
C. Temporal-Color SpaceNeither the RGB color space nor the I-0, space canbe used to separate the two reflection components byusing local pixel information without resorting to rela-tively strong assumptions. To address this weaknesswe propose a new four-dimensional space, which we callthe temporal-color space. The four-dimensional spaceis spanned by the R, G, B, and 0 axes. The termtemporal-color space implies an augmentation of the RGBcolor space with an additional dimension that varies withtime. This dimension represents the geometric relation-ship among the viewing direction, the illumination direc-tion, and the surface normal. Here we keep the viewingdirection and the surface normal orientation fixed. Wevary the illumination direction with time, taking a newimage at each new illumination direction. (The same in-formation could be obtained if we kept the illuminationdirection and the surface normal's orientation fixed andvaried the viewing direction or if we kept the viewing di-rection and the illumination direction fixed and variedthe surface normal orientation.)
The temporal-color space can be thought of as a unionof the RGB color space and the 1-0, space. When the 0,axis is omitted, the temporal-color space becomes equiva-lent to the RGB color space, and when two color axes areomitted, the temporal-color space becomes the I - 0, space.Each point in the space is represented by the light sourcedirection 0, and the color vector C(0,), which is a functionof 0,:
pI0,, C(0,)] , (5)
FIR (60) g(0 0)f Tr (A)s(A)h(A)dA
C(0s) = LIG(os) = iL()fG TG((A)h(A)dA] (6)
JB(Os) - g(O,)| B(A)s(A)h(A)dA
The temporal-color space represents how the observedcolor of a pixel C(0,) changes with time while the directionof the light source ,, changes (Fig. 4). Note that, inFig. 4, the dimensions of the temporal-color space arereduced from four to three for clarity. In this diagramone axis of the RGB color space is ignored.
3. DECOMPOSITION OF REFLECTION
A. Reflectance ModelThe hybrid reflectance model (Appendix A) proposed byNayar et al. 3 is used as the reflectance model for dielec-tric materials in our experiments. From Eqs. (A8) and(A9) of Appendix A, the pixel value 1(0,) in the viewer-centered coordinate system (Fig. 2) is given by
1(0s) = Ibody(0s,) + Ispecular(0s)
= KLL(0,, - 0)cos(0,, - 0)
+ KsL(O, - 0)8(20n - ,,),
KL = f s(A)c(A)CL(A)dA,
Ks = c f, s(A)c(A)dA,
(7)
(8)
where c(A) is the spectral distribution of incident light,L(08 - 0n) is the geometrical term of the incident light[Eq. (A6)], s(A) is the spectral response of the camera, andcL(A) and c are the spectral reflectance distributions ofthe body-reflection component and the specular-reflectioncomponent, respectively [Eq. (A3)]. In Eqs. (7) and (8),L(0,, - 0)cos(0,, - 0n) and L(O - )8i(2On - ,) corre-spond to g(0,) in Eq. (4); c(A)cL(A) and cc(A) correspondto h(A) in Eq. (4).
1(0,) for an extended light source obeys the followingformula (Appendix B):
I(0S,) = KL cos(0, - On) + KsL(, - 20n). (9)
The hybrid reflectance model is valid when there is nointerreflection and there is only one light source. There-fore our algorithm cannot be applied when there is in-terreflection or when there are multiple light sourceswith different spectral distributions. Our algorithmcan be applied only to images taken under the illumi-nation of a single spectral distribution in the absenceof interreflection.
-r - - - - - - - - - -_
__ _ _ _ _ _ _ _ _ _ I
200 I I
BLUE | I II I
20 *? ~I 100 I II
II
I / _ * I Ia e I, II
THETA (dsgj
Fig. 4. Temporal-color space (synthesized data).
Y. Sato and K. Ikeuchi
Vol. 11, No. 11/November 1994/J. Opt. Soc. Am. A 2993
150.0
O red+ reen
100.0 0 +~++0+ +
50.0 4 x .
°:+ ' " o&xxxxxxxxx _
*-°81 )-° 20.0 120.0Theta [deg]
Fig. 5. Measurement at one pixel (synthesized data).
B. Decomposition of Reflection inthe Temporal-Color SpaceIn this subsection the algorithm used to separate thetwo reflection components in the temporal-color spaceis described. Red, green, and blue filters are used; thecoefficients KL and K,, in Eq. (8) become two linearly in-dependent vectors, KL and Ks, unless the colors of thetwo reflection components are accidentally the same:
where the two vectors DL and D represent the in-tensity values of the body- and specular-reflection com-ponents with respect to the light source direction A.Vector KL represents the body-reflection color vector; vec-tor Ks represents the specular-reflection color vector.We call the two matrices D and XC the geometry ma-trix and the color matrix, respectively. The color vectorsand the 0, axis span the space in the temporal-color space.We call the space spanned by the color vector KsT and the0, axis the body-reflection plane, and the space spannedby the color vector KsT and the 0, axis the specular-reflection plane.
In the case of a conductive material, such as metal,Eq. (12) becomes
I = [IR IG IB
L(f.s1 - 2.)L( 2- 2)
= . k[kSRksGksB]
L(Osm - 2.)
= DsKsT (13)
J fR(A)s(A)c(A)CL(A)dA
KL = rkLG] = |f TO (A)s(A)c(A)L(A)dA (10)
JA TB(A)s(A)c(A)CL(A)dA
csf TR(A)s(A)c(A)dA
KS= [k = CS TG(A)s(A)c(A)dA (11)
CSf rB(A)s(A)c(A)dA
These two vectors represent the colors of the body- andspecular-reflection components in the dichromatic re-flectance model.3
First, the pixel intensities in the R, G, and B channelswith m different light-source directions are measured atone pixel. It is important to note that all the intensitiesare measured at the same pixel. The intensity valuesare shown in Fig. 5.
The three sequences of intensity values are stored inthe columns of an m X 3 matrix I. The matrix is calledthe temporal-color matrix. Considering the hybrid re-flectance model and two color vectors in Eqs. (9)-(11), theintensity values in the R, G, and B channels can be rep-resented as
I = [IRIG IB]
cos(0 81 - O)
cOs(0 2 - On)
COS(Osm - n)
L(09 1 - 2 ,)1
L(Os2 - 20n) FkLRkLGkLB 1kSR kSG ksB j
L(Osm - 2.) j
= [DLDs] =T DX,
because only the secular-reflection component exists.Suppose we have an estimation of the color matrix
X. Then we can obtain the two reflection componentsrepresented by the geometry matrix D by projecting theobserved reflection stored in I onto the two color vectorsKL and KS:
D = IX+, (14)
where X + is a 3 X 2 pseudoinverse matrix of the colormatrix X.
This derivation is based on the assumption that thecolor matrix X is known. It can be seen from Eq. (11)that the specular-reflection color vector is the same as alight source color vector. Several algorithms have beenproposed to estimate illuminant color.141 5
1. Estimation of Illuminant Color(1) According to the dichromatic reflection model,3 thecolor of reflection from a dielectric object is a linearcombination of the body-reflection component and thespecular-reflection component. The color of the specular-reflection component is equal to the illuminant color.In the x-y chromaticity diagram, the observed color ofthe dielectric object lies on a segment whose end pointsrepresent the colors of the body- and specular-reflectioncomponents. By representing the color of each object asa segment in the chromaticity diagram, one can deter-mine the illuminant color from the intersection of thetwo segments attributed to the two objects of interest(Fig. 6).14,15
(2) Tominaga and Wandell15 indicated that the spectralpower distributions of all possible observed color of a di-electric object with a highlight exist on the plane spannedby the spectral power distributions of the body-reflectioncomponent and the specular-reflection component. Theycalled this plane the color signal plane. Each object colorforms its own color plane. The spectral power distribu-tion of the specular-reflection component, which is the
Y. Sato and K. Ikeuchi
2994 J. Opt. Soc. Am. A/Vol. 11, No. 11/November 1994
0.5
>_ 0.4 \ < p/(r,gtb)=(0.353, 0.334, 0.313)
0.3
.22 0.3 0.4 0.5Color X
Fig. 6. Estimation of illuminant color in the x-y chromaticitydiagram. The three pixels of different colors are manuallyselected in the image (see Fig. 7).
Fig.7. Multicoloredobject. The threepixels of differentolorsare manually selected in the image.
same as the spectral power distribution of the illuminant,can be obtained by taking the intersection of the colorplanes. The singular-value decomposition technique wasused to determine the intersection of color planes.
In our experiment we estimate the row Ks5 T of the colormatrix X, which represents illumination color, using amethod that is similar to the first method described above.
First, several pixels of different colors in the imageare manually selected (Fig. 7). The observed reflectioncolor from those selected pixels is a linear combination ofthe body-reflection component and the specular-reflectioncomponent. By plotting the observed reflection color ofeach pixel in the x-y chromaticity diagram over theimage sequence, we obtain several line segments in thex-y chromaticity diagram. The illuminant color canthen be determined by the intersection of those line seg-ments in the diagram. This is shown in Fig. 6 for thecase of the real image shown in Fig. 7.
This techique is imited to th e case for wihich there areobjects of different colors in the image. In other words,if the image contains objects of only one color the light-source color cannot be estimated. In these cases one
can obtain the illumination color by measuring the colorvector of the light source directly.
However, the other row KL T of the color matrix cannotbe obtained in the same manner because it depends on thematerial of the object. Fortunately, to solve this problemwe can use the fact that the distribution of the specular-reflection component for the extended light source is lim-ited to a fixed angle 2a!, determined by the geometricrelation between the diffuser and the point light source[Eqs. (Bi) and (B2) of Appendix B]. This fact results inthe following important lemma.
2. Estimation of the Color Vector of theBody-Reflection ComponentIf two vectors, w = [IRJGiBImY (i = 1, 2), are sampled onthe 0, axis at an interval greater than 2, at least oneof these vectors is equal to the color vector of the body-reflection component KL'. This vector has no specular-reflection component. It is guaranteed that both vectorswi exist in the row space of the color matrix X§ spannedby the base KLT and KsT . Therefore the desired colorvector of the body-reflection component KLT is the vectorwi that subtends the largest angle with respect to thevector KsT (Fig. 8). The angle between the two colorvectors can be calculated as
/3 = cos' KS T WI (15)
Once we get the color matrix XC, the geometry matrix Dcan be calculated from Eq. (14) (Fig. 9).
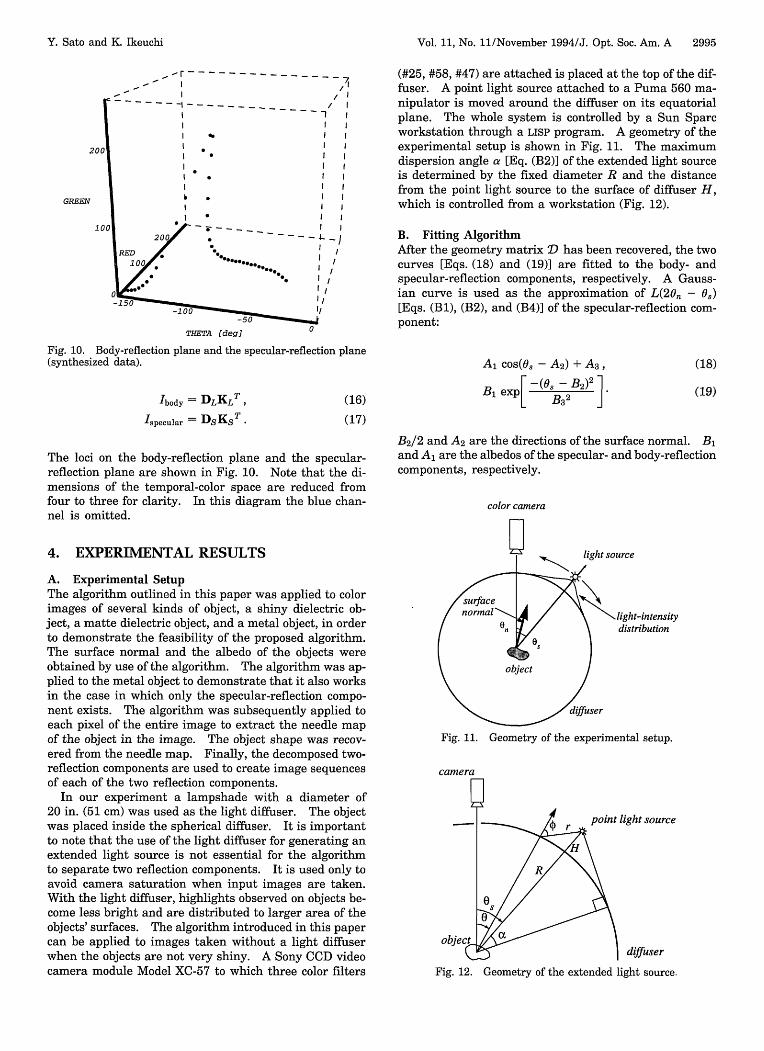
Once matrix D has been obtained, the loci of the body-reflection component and the specular-reflection compo-nent in the temporal-color space can be extracted asshown in Eqs. (16) and (17):
row space of I
1 WYFigI - 2
Fig. 8. Estimation of the color vector K],.
C
1 1DL D2
D = [PL P] D L DS..D ...
Drn DM
Fig. 9. Geometry matrix D (synthesized+, column 2.
+ * f +
+ , . +* . * ,.
heta [e 'Theta [deg]
data): 0, column 1;
Y. Sato and K. Ikeuchi
Vol. 11, No. 11/November 1994/J. Opt. Soc. Am. A 2995
20i
GREEN
I I
I *I
I * - I
I . II *I
II . I-
.~ ~ ~ * I
-1.
/ I/ I
I
I,'I'I
Ij
I /III/-101
THETA [deg]
Fig. 10. Body-reflection plane and the specular-reflection plane(synthesized data).
Ibody = DLKL ,
Ispecular = DsKs
(16)
(17)
(#25, #58, #47) are attached is placed at the top of the dif-fuser. A point light source attached to a Puma 560 ma-nipulator is moved around the diffuser on its equatorialplane. The whole system is controlled by a Sun Sparcworkstation through a LISP program. A geometry of theexperimental setup is shown in Fig. 11. The maximumdispersion angle a [Eq. (B2)] of the extended light sourceis determined by the fixed diameter R and the distancefrom the point light source to the surface of diffuser H,which is controlled from a workstation (Fig. 12).
B. Fitting AlgorithmAfter the geometry matrix D has been recovered, the twocurves [Eqs. (18) and (19)] are fitted to the body- andspecular-reflection components, respectively. A Gauss-ian curve is used as the approximation of L(20, - 0s)[Eqs. (B1), (B2), and (B4)] of the specular-reflection com-ponent:
Al cos(6, - A2) + A3 ,
B1 exp ( 2 B2 )2]
(18)
(19)
The loci on the body-reflection plane and the specular-reflection plane are shown in Fig. 10. Note that the di-mensions of the temporal-color space are reduced fromfour to three for clarity. In this diagram the blue chan-nel is omitted.
4. EXPERIMENTAL RESULTS
A. Experimental SetupThe algorithm outlined in this paper was applied to colorimages of several kinds of object, a shiny dielectric ob-ject, a matte dielectric object, and a metal object, in orderto demonstrate the feasibility of the proposed algorithm.The surface normal and the albedo of the objects wereobtained by use of the algorithm. The algorithm was ap-plied to the metal object to demonstrate that it also worksin the case in which only the specular-reflection compo-nent exists. The algorithm was subsequently applied toeach pixel of the entire image to extract the needle mapof the object in the image. The object shape was recov-ered from the needle map. Finally, the decomposed two-reflection components are used to create image sequencesof each of the two reflection components.
In our experiment a lampshade with a diameter of20 in. (51 cm) was used as the light diffuser. The objectwas placed inside the spherical diffuser. It is importantto note that the use of the light diffuser for generating anextended light source is not essential for the algorithmto separate two reflection components. It is used only toavoid camera saturation when input images are taken.With the light diffuser, highlights observed on objects be-come less bright and are distributed to larger area of theobjects' surfaces. The algorithm introduced in this papercan be applied to images taken without a light diffuserwhen the objects are not very shiny. A Sony CCD videocamera module Model XC-57 to which three color filters
B2/2 and A2 are the directions of the surface normal. B1and Al are the albedos of the specular- and body-reflectioncomponents, respectively.
color camera
light source
0su face 4 /\<light-intensity
distribution
object
\s>,/di,,g~dfuser
Fig. 11. Geometry of the experimental setup.
camera
Y! point light source
v 1K | diffuser
Fig. 12. Geometry of the extended light source.
Y. Sato and K. Ikeuchi
2996 J. Opt. Soc. Am. A/Vol. 11, No. 11/November 1994
the temporal-color space (Fig. 14) has been successfullydecomposed into the body- and specular-reflection compo-nents by use of our algorithm described in Subsection 3.B.
The body-reflection plane and the specular-reflectionplane are shown in Fig. 17. This diagram is the resultof viewing Fig. 16 along the , axis. Note that the slopeof the specular-reflection plane is 45' in the diagram.This is because the specular-reflection vector [Eq. (11)]has been normalized to
Ks( = a ) (20)
Fig. 13. Green shiny plastic cylinder.
BLUE
,-' I ,
- -1- /--
I I
l
I . I I
* rI * ,
I It
, 1~~~~~~I
THETA (dog) +
Fig. 14. Measured intensities in the temporal-color space.
C. Shiny Dielectric ObjectA green plastic cylinder with a relatively smooth surfacewas used in this experiment (Fig. 13). Figure 14 showsthe measured intensities plotted in the temporal-colorspace with the blue axis omitted. The intensity valueswere normalized by use of the sensor model explainedin Ref. 16. Note that the intensity values around themaximum intensity contain both the body-reflection com-ponent and the specular-component [Eq. (9)1. On theother hand, the intensity values for 0, > -60° containonly the body-reflection component. The curve for 0,, >-60° and 0, < -140° lies inside the body-reflection planein the temporal-color space, whereas the curve for - 140°< 0, < -60° does not lie inside the body-reflection plane.This is because the intensity values for -140° < 0, <-60 are linear combinations of the body color vector KLand the specular color vector Ks.
The algorithm for separating the two reflection com-ponents described in Subsection 3.B was applied to themeasured data. The red, green, and blue intensitiesare initially stored in the temporal-color matrix I asits columns [Fig. 5 and Eq. (12)]. Then the temporal-color matrix decomposes into the geometry matrix Dand the color matrix C. The columns of the resultinggeometric matrix D are plotted in Fig. 15. Note thatthe body-reflection component and the specular-reflectioncomponent have shapes that correspond to the functionscos(0 - ) and L(0, - 20), respectively, as shown inEq. (9). Figure 16 shows the result of decompositionof the reflection in the temporal-color space. It is ev-ident from this figure that the measured intensity in
The body-reflection plane is shifted toward the green axisbecause the color of the observed object is green in thisexperiment.
The result of the fitting procedure described inSubsection 4.B is shown in Fig. 18. From the result weobtain the direction of the surface normal and the albe-dos as follows: the surface normal (B2/2) - 52.09°, thealbedo of the specular-reflection component (B1 ) 230.37,and the albedo of the body-reflection component (Al)75.00. Notations Al, B1, and B2 follow Eqs. (18) and(19).
D. Matte Dielectric ObjectA green plastic cylinder with a relatively rough surfacewas used in this experiment (Fig. 19). The measured in-tensities are plotted in the temporal-color space (Fig. 20)
30
20
0.
en
10
0.0
0.0 0
0.0
+ +++00O0 0 ~ . .. ? - _
-100.0Theta [deg]
-50.0
Fig. 15. Decomposed two reflection components: 0, surfacereflection; +, body reflection.
or…- , _ _ --
_ I - I
t I ,~~~~~~~~~ I
200t I / specular reflectionGREEZI\ I :i/-I I
body reflectionGREEN lI*/ !
I J II . II^ ." - - - - _ , /
THETA [dog] °
Fig. 16. Loci of two reflection components in the temporal-colorspace.
Y. Sato and K. Ikeuchi
Vol. 11, No. 11/November 1994/J. Opt. Soc. Am. A 2997
150.0
100.0
Ca)
50.01
17. Body-reflection
50.0 100.0 150.0Red
plane (+) and specular-reflection plane
- 74.995979oCos( (x+59.144482)3.±i4±59265I80 .0)+0.30929i- 230.3686070exp(-( (x+104.i8±389) 3.562291)N02)° Laobertian.datO Specular.dat a
body reflection
-100
intensity
colors of the two plastic objects despite their differentsurface roughnesses.
Figure 22 depicts the result of curve fitting to thetwo decomposed reflection components. The surfacenormal and the albedos of the two reflection compo-nents obtained are the surface normal (B2 /2) - 49.61°,the albedo of the specular-reflection component (B1 )219.83, and the albedo of the body-reflection component(A1) 308.1.
Note that the standard deviation of the Gaussian curvethat represents the specular-reflection component [B3 inEq. (19)] is 26.68. This value is greater than that ofthe shiny plastic object (13.56). The difference is consis-tent with the fact that the matte object's surface rough-ness is larger than the shiny object's surface roughness.Further study is necessary to make any quantitativestatement about the relationship between the standarddeviation and the surface roughness.
E. Metal ObjectThe dichromatic-reflection model3 cannot be applied tonondielectric objects such as a metallic specular object.As an example of these objects, an aluminum triangularprism was used in this experiment (Fig. 23). This typeof material does not have the body-reflection componentbut only the specular-reflection component. This resultsin the fact that the matrix I has a rank of 1 when theobject is metallic.
The measured intensities shown in Fig. 24 indicate thatthe reflection from the aluminum triangular prism pos-sesses only the specular-reflection component. This ob-servation is justified by the result of the decomposition
0S
Fig. 18. Result of fitting.
in the same manner as explained in Subsection 3.B.Note that the width of the specular-reflection componentis larger than that in the previous experiment. Thisis attributed mainly to different surface roughnesses oftwo plastic cylinders. It seems that the width can be animportant and revealing indication of surface roughnessfrom observed images. The interpretation of the widthis a subject of further study.
The intensity is decomposed into the two reflec-tion components according to the algorithm shownin Subsection 3.B. The result of the decompositionis shown in Fig. 21. Note that the directions of thespecular-reflection plane and the body-reflection planeare the same as those for the shiny green plastic cylin-der (see Subsection 4.C). The specular-reflection planedoes not change its direction because the color of thespecular-reflection component Ks is that of the lightsource (Fig. 10). In other words, the specular-reflectioncomponent has the same spectrum as the light source.Also, the correspondence of the direction of the body-reflection component is due to the similarity of surface
Fig. 19. Green matte plastic cylinder.
GREEN
,- _ I_
I ,
I * *I
I , . .'
l Rl .I
l 200'
I , " ~~~~~,
THETA deg]
Fig. 20. Measured intensities in the temporal-color space.
+ 0
/
Fig.0.
bns
Y. Sato and K. Ikeuchi
2998 J. Opt. Soc. Am. A/Vol. 11, No. 11/November 1994
I ,1,- I , l
300 I body reflection
i }>/ / specular reflection
200 I L , ., 1 1GREEN -1 1
i~~ : - , I
10 300- -* ----- 1
-15-
-100~~~~~~
TTmsA d e o
Fig. 21. Two decomposed reflection components.
Y. Sato and K. Ikeuchi
The resulting needle map is shown in Fig. 27. We ob-tained the depth map of the purple plastic cylinder by asimple integration method. Figure 28 depicts the result-ing depth map.
G. Generating Body-Reflection Image andSpecular-Reflection ImageBy using the pixel-based separation algorithm, we caneasily generate images of the two reflection compo-nents. The algorithm was applied to all the pixels of theinput images locally, and each separated reflection compo-nent was used to generate the body-reflection image and
Fig. 22. Result of fitting.
of the two reflection components (Fig. 25). The body-reflection component is negligibly small compared withthe specular-reflection component.
F. Shape RecoveryIn the previous subsections the decomposition algorithmwas applied to real color images in order to separate thetwo reflection components using intensity change at asingle pixel. In other words, the reflection componentswere separated locally. After this separation the surfacenormal and the albedo at each pixel were obtained bynonlinear curve fitting of the two reflection componentmodels [Eqs. (18) and (19)] to the decomposed reflectioncomponents. The surface normals of the pixel are B2 /2and A2 , and the albedos are B1 and Al in Eqs. (18) and(19). We repeated the same operation over all pixelsin the image to obtain surface normals over the entireimage. Then the needle map and the depth map of theobject in the image were obtained from these recoveredsurface normals.
We used a purple plastic cylinder as the observed ob-ject in this experiment. The image is shown in Fig. 26.Results of the curve fitting of the body-reflection com-ponent were used to obtain surface normal directions.
Fig. 23. Aluminum triangular prism.
r ------ 7_ -
300
200 , .- , ,
GREEWI * GRSSN~~~~~ I I
100 3,** -----
RED2 0
* * I
laoo * * I
4 -iso *
A..~~~~~~.... ....... l
THETA dgl 0
Fig. 24. Locus of the intensity in the temporal-color space.
,_,_ r - _________I
GREEN
, I
I II
I specular reflectio
I . / I1
I . bodyreflecticI *I*bo
/n I
onI
I
;--- - _ 1
I,I,,I/
I / Ii
-50
2THErA (dog]
Fig. 25. Two decomposed reflection components.
S
I[
I
Vol. 11, No. 11/November 1994/J. Opt. Soc. Am. A 2999
Fig. 26. Purple plastic cylinder.
50.00 100.00 150.00 200.00 250.00 300.00 350.00
Fig. 27. Needle map.
that the input image is successfully decomposed into theimages of the two reflection components, even though theinput image has a complex object with many color regionson the surface. This is because the proposed algorithmis pixel based and does not require global information.In this kind of situation the traditional separation algo-rithm based on the RGB color histogram would easily failbecause clusters in the RGB color space become crowdedand obscure, so that clustering in the RGB space becomesimpossible. On the other hand, since our algorithm ispixel based and applied to each pixel separately, the tworeflection components can be successfully separated evenin the face of inconspicuous specular reflection.
5. CONCLUSIONS
We have proposed temporal-color space analysis asa new concept for color image analysis in which thebody-reflection component and the specular-reflectioncomponent from the dichromatic-reflection model spansubspaces. We have presented an algorithm to separatethe two reflection components at each pixel from a se-quence of color images and to obtain the surface normaland the albedo without prior knowledge of the reflectanceproperties. The significance of our method lies in its use
400.00 450.00 500.00
Fig. 29. Body-reflection image.
30
Fig. 28. Recovered object shape.
the specular-reflection image. Figure 7 shows one framefrom the input image sequence. We decomposed all thepixels in the image into two reflection components byusing the algorithm described in this paper. The resultsof the body-reflection image and the specular-reflectionimage are shown in Figs. 29 and 30, respectively. Note Fig. 30. Specular-reflection image.
400.00 r
360.00-
340.00-
320.00i
30000
2800.0
260.00
240.06-
220.00-
100.00-
160.00-
140.0t1-
120.00i
100.00-
80.00
60.0000
j on nnit IT , |
! I I _ _ _ _ _ .
Y. Sato and K. Ikeuchi
3000 J. Opt. Soc. Am. A/Vol. 11, No. 11/November 1994
of local (i.e., pixel-based) and not global information ofintensity values in the images. This characteristic sepa-rates our algorithm from previously proposed algorithmsfor segmenting the body-reflection component and thespecular-reflection component in the RGB color space.
Our algorithm has been applied to objects of differentmaterials to demonstrate the algorithm's effectiveness.We have successfully separated the two reflection com-ponents in the temporal-color space and have obtainedsurface normals and albedos of the two reflection compo-nents. In addition, we are able to reconstruct the shapesof the objects.
APPENDIX A: HYBRIDREFLECTANCE MODEL
A mechanism of reflection is described in terms ofthree reflection components, namely, the specular spike,the specular lobe, and the diffuse lobe. These reflec-tion components are represented by the Beckmann-Spizzichino model,' 7 the Torrance-Sparrow model 8 (orthe Beckmann-Spizzichino model), and the Lambertianmodel, respectively.' 9 The model of reflection mecha-nism that accounts for all three components is usually toocomplicated to be used for actual applications: it is use-ful to simplify this reflection model into a simpler model.' 3
On a rough surface, distributions of the specular spikeand the specular lobe with respect to a light source direc-tion Qi have a large overlap around a specular angle. Asa result it is not easy to separate these two components.On the other hand, the two distributions converge into anarrow angle around the specular angle when the wave-length is comparable with the surface roughness, i.e.,when the surface is reasonably smooth. Therefore thespecular spike and the specular lobe can be combinedas the specular-reflection component as a reasonableapproximation.' 3 A unit impulse function is used toapproximate the specular component. The Lambertianmodel is also used to represent the diffuser lobe compo-nent, which is also called the body-reflection component.The reflectance model that has the specular- and body-reflection components is called the hybrid reflectancemodel by Nayar et al.13 Nayar et al. used the hybridreflectance model for analyzing reflection, which includesboth the surface- and body-reflection components.' 3 Inthe hybrid reflectance model the intensity of an image ineach pixel is expressed as
I = IL + Is, (Al)
body-reflection component and the specular-reflectioncomponent, respectively. i and 0 r are the incidentangle and the reflecting angle, respectively, as shownin Fig. 31.
In most reflection models it is assumed that the body-reflection component has a spectral distribution that isdifferent from that of incident light, whereas the surface-reflection component has a similar spectral distribution.Lee et al. called this model the neutral-interface-reflectionmodel.2' Considering the neutral-interface-reflectionmodel, Eq. (A2) can be rewritten as
Since we assume that the body-reflection componentis modeled by the Lambertian model and the surface-reflection component is modeled by a unit impulsefunction, geometrical terms gL(i, r) and gs(i, Or) inEq. (A3) become
gL(Ci, Cr) = maX(O, cos 0i),
gs(Ci, Cr) = (Ci - Or). (A4)
Substituting Eq. (A4) into Eq. (A3), we get
fr (Oi, Cr, A) = CL(A)cos i + cs6(Ci - Cr). (A5)
On the other hand, the intensity of incident light onto theobject surface (and not into the camera) is represented as
Li(Ci, A) = c(A)L(Ci), (A6)
where c(A) is the spectral distribution and L(Oi) is ageometrical term of incident light onto the object surface.The intensity of light reflected on the object surface andcoming into the camera can be expressed as the productof Lj(Oj, A) and the bidirectional spectral-reflectance dis-tribution function fr(Ci, Or, A). Finally, the pixel value Iis given by
I(Ci, Cr) = s(A)Li(Ci, A)fr(Ci, Cr, A)dA
= s(A)c(A)L(Oi)[cL cos Oi + csb(i - 0r)]dAA
=L(oi)cos i |A s(A)c(A)CL(A)dA
+ L(Ci)3(i - r)cs f s(A)c(A)dA, (A7)
where IL is the body-reflection component and Is is thespecular-reflection component.
The dichromatic-reflection model in the two-dimen-sional planar case can be represented in terms of thebidirectional spectral-reflectance distribution functionproposed by Nicodemus et al.20 as
fr(Oi, Cr, A) = CL(A)gL(i, r) + cs(A)gs(Oi, Or), (A2)
where fr is the bidirectional spectral-reflectance distribu-tion function, cL(A) and cs(A) are the spectral-reflectancedistributions, and gL(Ci, r) and gS(Oi, r) are the geo-metrical terms. The subscripts L and S refer to the
specular-reflection componentspecular-source
rection
light source
component
reflecting surface
Fig. 31. Hybrid reflectance model.
Y. Sato and K. Ikeuchi
Vol. 11, No. 11/November 1994/J. Opt. Soc. Am. A 3001
where s(A) is the spectral response of a camera.The hybrid reflectance model is expressed by Eq. (A7).
When the coordinate system is changed into the viewer-centered coordinate system shown in Fig. 2, Eq. (A7)becomes
I(Cs) = KLL(C - 0n)cos(Os - Cn)
+ KsL(C8 - Cj8(2C - Cs), (A8)
where
KL = | (A)S(A)C(A)CL(A)dA7
Ks = cs f T(A)s(A)c(A)dA. (B5)
Equation (B4) shows that the intensity curve with re-spect to a direction of the extended light source is alinear combination of a cosine curve that represents thebody-reflection component and the L(Cs - 2Cn) curve thatrepresents the specular-reflection component (Fig. 32).
KL = f s(A)c(A)cL(A)dA,
KS = cs f s(A)c(A)dA. (A9)
APPENDIX B: EXTENDED LIGHT SOURCE
An extended light source instead of a point light sourceis used in our experiments. The extended light source isgenerated by a spherical diffuser that is composed of whitelight-diffusing material. The geometry of the diffuser isshown in Fig. 12. The distribution of the extended lightsource is given by
L(Oi) = L(O - O,)
CJ[(R + H)cos( - s) - R]
{[R + H - R cos( - C3)]2 + [R sin( - s)]2}32
(Bi)
This distribution is limited to the interval C - a < <, + a, where
a = cos (B2)
A derivation of this formula is shown in the appendix ofRef. 13.
The hybrid reflectance model [Eq. (7)] can be rewrittenby using the extended light source as follows:
ACKNOWLEDGMENTS
The authors are thankful to the anonymous reviewers andFredric Solomon for their constructive criticism, whichresulted in a significant improvement in the quality ofthis paper. We also thank Sing Bing Kang, Kevin Lynch,and Kathryn Porsche for their valuable suggestions onthe manuscript.
This research was sponsored in part by the AvionicsLaboratory, Wright Research and Development Center,Aeronautical Systems Division, U.S. Air Force, Wright-Patterson Air Force Base, Ohio 45433-6543, under con-tract F33615-90-C-1465, order 7597.
The views and conclusions contained in this documentare those of the authors and should not be interpretedas representing the official policies, either expressed orimplied, of the U.S. Government.
REFERENCES
1. R. M. Haralick and G. L. Kelly, "Pattern recognition withmeasurement space and spatial clustering for multiple im-ages," Proc. IEEE 57, 654-665 (1969).
2. S. A. Shafer, "Optical phenomena in computer vision," pre-sented at the meeting of the Canadian Society for Computa-tional Studies of Intelligence, Ontario, Canada, May 1984.
3. S. A. Shafer, "Using color to separate reflection components,"Color Res. Appl. 10, 210-218 (1985).
4. G. J. Klinker, S. A. Shafer, and T. Kanade, "The measure-ment of highlight in color images," Int. J. Computer Vision2, 7-32 (1988).
5. G. J. Klinker, S. A. Shafer, and T. Kanade, "A physicalapproach to color image understanding," Int. J. ComputerVision 4, 7-38 (1990).
Fig. 32.source.
Y. Sato and K. Ikeuchi
3002 J. Opt. Soc. Am. A/Vol. 11, No. 11/November 1994
6. C. L. Novak, "Anatomy of a histogram," in Proceedings ofIEEE Conference on Computer Vision and Pattern Recogni-tion (Institute of Electrical and Electronics Engineers, NewYork, 1992), pp. 599-605.
7. L. B. Wolff, "Using polarization to separate reflection com-ponents," in Proceedings of IEEE Conference on ComputerVision and Pattern Recognition (Institute of Electrical andElectronics Engineers, New York, 1989), pp. 363-369.
8. S. N. Nayar, X. Fang, and T. Boult, "Removal of specular-ities using color and polarization," in Proceedings of IEEEConference on Computer Vision and Pattern Recognition (In-stitute of Electrical and Electronics Engineers, New York,1993), pp. 583-589.
9. B. V. Funt and M. S. Drew, "Color space analysis of mutualillumination," IEEE Trans. Pattern Anal. Machine Intell. 15,1319-1326 (1993).
10. B. K. P. Horn, "Obtaining shape from shading information,"in Shape from Shading, B. K. P. Horn and M. J. Brooks, eds.(MIT Press, Cambridge, Mass., 1989).
11. K. Ikeuchi and B. K. P. Horn, "Numerical shape from shad-ing and occluding boundaries," Artif. Intell. 17, 141-184(1981).
12. R. J. Woodham, "Photometric stereo: a reflectance maptechnique for determining surface orientation from imageintensity," in Image Understanding Systems and IndustrialApplications, R. Nevatia, ed., Proc. Soc. Photo-Opt. Instrum.Eng. 155, 136- 143 (1978).
13. S. K. Nayar, K. Ikeuchi, and T. Kanade, "Determining shape
and reflectance of hybrid surfaces by photometric sampling,"IEEE Trans. Robotics Automation 6, 418-431 (1990).
14. H. C. Lee, "Method for computing the scene-illuminant chro-maticity from specular highlights," J. Opt. Soc. Am. A 3,1694-1699 (1986).
15. S. Tominaga and B. A. Wandell, "Standard surface-reflectance model and illuminant estimation," J. Opt. Soc.Am. A 6, 576-584 (1989).
16. C. L. Novak, S. A. Shafer, and R. G. Willson, "Obtainingaccurate color images for machine vision research," in Per-ceiving, Measuring, and Using Color, M. H. Brill, ed., Proc.Soc. Photo-Opt. Instrum. Eng. 1250, 54-68 (1990).
17. P. Beckmann and A. Spizzichino, The Scattering of Electro-magnetic Waves from Rough Surfaces (Pergamon, New York,1963).
18. K. Torrance and E. Sparrow, "Theory for off-specular re-flection from roughened surfaces," J. Opt. Soc. Am. 57,1105-1114 (1967).
19. S. K. Nayar, K. Ikeuchi, and T. Kanade, "Surface reflection:Physical and geometrical perspectives," IEEE Trans. Pat-tern Anal. Machine Intell. 13, 611-634 (1991).
20. F. E. Nicodemus, J. C. Richmond, J. J. Hsia, I. W. Ginsberg,and T. Limperis, "Geometrical considerations and nomencla-ture for reflectance," Natl. Bur. Stand. (U.S.) Monogr. 160(1977).
21. H. C. Lee, E. J. Breneman, and C. P. Schulte, "Modeling lightreflection for computer color vision," IEEE Trans. PatternAnal. Machine Intell. 12,402-409 (1990).