Ten Messages About Youth Employment In South East Europe REGULAR ECONOMIC REPORT NO.9S | 2016 Public Disclosure Authorized Public Disclosure Authorized Public Disclosure Authorized Public Disclosure Authorized
Transcript
Ten Messages About Youth Employment In South East EuropeR E G U L A R E C O N O M I C R E P O R T N O . 9 S | 2 0 1 6
Pub
lic D
iscl
osur
e A
utho
rized
Pub
lic D
iscl
osur
e A
utho
rized
Pub
lic D
iscl
osur
e A
utho
rized
Pub
lic D
iscl
osur
e A
utho
rized
Report No. 110291-ECA
South East Europe Regular Economic Report No.9SSpecial Topic
Ten Messages About Youth Employment in South East Europe
2016
Standard Disclaimer:
This volume was produced by staff of the International Bank for Reconstruction and Development/the World Bank. The findings, interpretations, and conclusions expressed in this paper do not necessarily reflect the views of the Executive Directors of the World Bank or the governments they represent. Nor does the World Bank guarantee the accuracy of the data herein. The boundaries, colors, denominations, and other information shown on any map in this work do not imply any judgment on the part of the World Bank concerning the legal status of any territory or the endorsement or acceptance of such boundaries.
Copyright Statement:
The material in this publication is copyrighted. Copying or transmitting all or any portion of this work without permission may be a violation of law. The International Bank for Reconstruction and Development/ the World Bank encourages dissemination of its work and will normally grant permission promptly to reproduce portions of the work. For permission to copy or reprint any part of this work, please send a request with complete information to the Copyright Clearance Center, Inc., 222 Rosewood Drive, Danvers, MA 01923, USA, telephone 978-750-8400, fax 978-750-4470, http://www.copyright.com/. All other queries on rights and licenses, including subsidiary rights, should be addressed to the Office of the Publisher, The World Bank, 1818 H Street NW, Washington, DC 20433, USA, fax 202-522-2422, e-mail [email protected].
Acknowledgments
The South East Europe Regular Economic Report (RER) covers economic developments, prospects, and policies in six South East European countries (SEE6): Albania, Bosnia and Herzegovina, Kosovo, FYR Macedonia, Montenegro, and Serbia. This Special Topic supplements the RER and discusses policy issues relevant to SEE6 countries. The report is produced twice a year by World Bank staff economists working on SEE6 countries.
This Special Topic is co-authored by: Gallina A. Vincelette, María E. Dávalos, Indhira V. Santos, and Jesus Crespo Cuaresma. Giselle Gavorskis, Kimberly Blair Bolch, Stefan Humer, and Nikola Kojucharov provided research assistance at different stages of the preparation of this study.
The team is grateful to Johannes Koettl, Theo Thomas, Timothy A. Johnston, Lada Strelkova, Sanja Madzarevic-Sujster, Trang Van Nguyen, Tony Verheijen, Barbara Cunha, and Lazar Sestovic for their valuable comments on earlier drafts.
The authors are also grateful to Ellen Goldstein, country director, South Eastern Europe; Ivailo Izvorski, practice manager, Macroeconomics and Fiscal Management Global Practice; Carolina Sanchez-Paramo, practice manager, Poverty Global Practice; and the South East Europe Country Management team for their guidance.
SEE6 Special Topic supplements and RERs may be found at www.worldbank.org/eca/seerer/.
Acknowledgments | iii
TEN MESSAGES ABOUT YOUTH EMPLOYMENT IN SOUTH EAST EUROPE
contents
Acknowledgments iii
Overview vi
Why Focus on Youth Joblessness in SEE6? 1
Poor Labor Market Outcomes for SEE6 Youth 2Message 1: Unemployment is particularly high for youth 2Message 2: Many young people are inactive, “idle”, in the informal sector or
choose to emigrate 4Message 3: Young women, in particular, have a tenuous labor market attachment 7
Drivers of Youth Joblessness in SEE6 9Message 4: Economic growth affects employment opportunities for youth more
than for adults 10Message 5: While youth lose significantly more jobs in economic downturns
than adults do, it takes less economic growth to create jobs for youth than for adults in SEE6 11
Message 6: Labor regulation constrains youth employment 14Message 7: Labor taxation is high for low-wage and part-time workers, groups
where youth is overrepresented 16Message 8: New labor market entrants are not equipped with the skills employers need 17Message 9: Lack of access to productive inputs—finance, land, and personal
and professional connections—worsen the entrepreneurship and employment prospects of young people 21
Message 10: Attitudes, social norms, and lack of access to child care services are serious barriers to youth, particularly women, entering the labor market 24
The SEE6 Policy Agenda for Employment Opportunities for Youth 26Sustained economic growth 26Skills 27Work incentives, labor regulation and flexible work arrangements 29Access to productive inputs and networks 29Attitudes and social norms 30Policy complementarities 30
References 32
SOUTH EAST EUROPE RegUlAR economic RePoRt no.9s SPECIAL TOPIC
iv | contents
list of FiguresFigure 1 Youth and Adult Unemployment in European Economies, 2013 2Figure 2 Unemployed Youth as Percent of Total Unemployed, 2014 2Figure 3 Youth and Adult Unemployment, 2008–14 3Figure 4 Youth-Adult Unemployment Gap and Change in Youth Unemployment,
Mean, 2007–14 3Figure 5 Youth as a Percent of the Total Labor Force, 2014 5Figure 6 15–24-year-olds Not in Employment, Education, or Training, 2014 5Figure 7 Age profile of people in formal and informal employment in SEE6 6Figure 8 Comparison: Secondary or Higher Educational Attainment, Emigrants and
Source Country Population 7Figure 9 Youth Unemployment Rates by Gender in SEE6, 2014 7Figure 10 The Gender Gap in Labor Force Participation by Age Group 8Figure 11 Factors Affecting Youth Unemployment Rates, EU28, 2007–12 10Figure 12 GDP Growth and Change in Youth and Adult Unemployment, 1980–2014 11Figure 13 Change in GDP Growth and Unemployment 12Figure 14 Average Minimum Wages, normalized by GDP per capita, 2013 15Figure 15 Labor Taxes, Levels and Progressivity in SEE6 and Select Countries, 2008 16Figure 16 Evolution of Job Skills Intensity, FYR Macedonia, circa 2000–10 18Figure 17 Firms Reporting Shortages Skills among Young Workers 19Figure 18 Students Scoring Below Level 2 on the PISA Reading Section, 2015 20Figure 19 Average PISA Scores by Sociodemographic Group, Serbia and Montenegro, 2012 20Figure 20 Serbia Entrepreneurship Survey Results, by Age Group 21Figure 21 Shares of men and women aged 18–29 years old who prefer a secure and
average-paying job over a less secure but better paying one 22Figure 22 Individuals with an Account at a Formal Financial Institution, by Age 22Figure 23 Perceptions of Those Aged 18–29 that Connections Matter in Getting a
Job, Private or Public 23
list of BoxesBox 1 Economic Cost of Gender Gaps in SEE6 9
Figure B1.1 Gender Gaps and Estimated Loss in Income per Capita 9Figure B1.2 Gender Gaps and Estimated Income per Capita Loss by Age 9
Box 2 Youth Unemployment and the Crisis in Spain: A Tale of Two Labor Markets 13Box 3 Situations that Reinforce Negative Social Norms for Women 24
list of tablesTable 1 Social Norms Affect Whether Women Work, Kosovo, Percent 25
contents | v
TEN MESSAGES ABOUT YOUTH EMPLOYMENT IN SOUTH EAST EUROPE
overview
Today, nearly half of youth1 in the six South East European countries (SEE6)2 are not in the labor market, and one quarter is inactive—not in employment, education, or training. These poor outcomes partly reflect a difficult recovery in SEE6 from the 2008 global financial crisis, which sent already high youth unemployment soaring to new heights. This paper presents 10 evidence-based messages on the youth employment challenges in SEE6.
Message 1 confronts the stubbornly high youth unemployment. In the SEE6, the average unemployment rate has risen above its pre-crisis level by about 5 percentage points, and at the end of 2013 youth unemployment had hit historic highs of more than 60 percent in Bosnia and Herzegovina, 52 percent in FYR Macedonia, 49 percent in Serbia, and 41 percent in Montenegro. As a result, with the sluggish economic recovery in the SEE6, today youth in the region face unique difficulties in making the school-to-work transition. As a result, many young people are inactive or in the informal sector or choose to emigrate, as pointed out in Message 2.
But these poor labor outcomes also embody deeper structural problems in the SEE6, where not only is unemployment high across the board, but also labor force participation is low, especially for young women and minorities. The essence of Message 3 is that young women
1 Unless otherwise noted, this paper defines “youth” as those aged 15–24 years.
2 The SEE6 countries are Albania, Bosnia and Herzegovina, Kosovo, FYR Macedonia, Montenegro, and Serbia.
in particular have limited attachment to the labor market.
The economic growth rate affects employment opportunities for youth more than for adults, as evidenced in Message 4. For youth seeking employment, the growth rate explains half of the changes in the youth unemployment rate across countries and over time. In SEE6, it takes less economic growth to create jobs for youth than for adults in periods of expansion, and Message 5 explores these dynamics. Because in SEE6 economic upturns tend to be characterized by steeper reductions in both youth and adult unemployment than those in the rest of Europe, SEE6 have to work hard to ensure sustained economic expansions to reduce unemployment.
The other half of changes in the youth unemployment rate is explained by education and labor policy as well as a considerable residual that hints at the need of deeper reform for policies to be effective in addressing structural constraints. Message 6 points out that in the SEE6 rigid labor regulation constrains youth employment, and Message 7 presents evidence that labor taxation is relatively higher for low-wage and part-time workers—groups that are disproportionately young. Moreover, as discussed in Message 8, new SEE6 labor market entrants are not equipped with the skills employers demand. Message 9 makes the additional point that lack of access to productive inputs and professional connections worsens the prospects of young people for entrepreneurship and employment.
Finally, certain cultural norms may narrow employment opportunities for youth, particularly women and members of ethnic minorities; increased access to quality and
SOUTH EAST EUROPE RegUlAR economic RePoRt no.9s SPECIAL TOPIC
vi | oveRview
affordable child care and long-term efforts to shift norms to make opportunities more equal are important countervailing policies. Message 10 discusses these barriers that keep youth from entering the labor market.
The 10 messages demonstrate that many factors disproportionately affect jobless youth. Often young people bear the brunt of the structural and cyclical vulnerabilities that are embedded in the functioning of labor markets in the region. But the challenges faced by cyclically unemployed and structurally jobless young people in SEE6 differ, and so do the policy responses to address them. For the former, it is vital to keep youth engaged in the labor market during recessions and build their human capital while the labor market recovers. For the latter, the policy agenda is deeper; it is necessary to address the disincentives to work and hire youth embedded in exclusionary labor regulations and labor taxation; equip new labor entrants with the skills the market needs; and improve their access to productive inputs, such as land, finance, and professional connections.
Policy measures to combat joblessness could often have much more importance for youth than other age groups. But the SEE6 policy agenda to address youth unemployment and inactivity is not an isolated agenda; it is an agenda for higher overall employment with specific elements for youth. Therefore, measures promoting overall job creation should be complemented, not replaced, by measures focused on youth.
oveRview | vii
TEN MESSAGES ABOUT YOUTH EMPLOYMENT IN SOUTH EAST EUROPE
98
10
Lack of access to productive inputs —finance, land, and personal and professional connections— worsen the entrepreneurship and employment prospects of young people
New labor market entrants are not equipped with the skills employers need
Attitudes, social norms, and lack of access to child care services are serious barriers to youth, particularly women, entering the labor market
Source: World Bank (2016) “South East Europe Regular Economic Report No.9S Special Topic”. Washington, DC.
7Labor taxation is high for low-wage
and part-time workers, groups where youth is overrepresented
1
34
2
6
5
Unemployment is particularly high for youth
Many young people are inactive, “idle”, in the informal sector or
choose to emigrate Young women, in particular, have a
tenuous labor market attachment
Economic growth affects employment opportunities for
youth more than for adults
Labor regulation constrains youth employment
While youth lose significantly more jobs in economic downturns than adults do, it takes
less economic growth to create jobs for youth than for adults in SEE6
98
10
Lack of access to productive inputs —finance, land, and personal and professional connections— worsen the entrepreneurship and employment prospects of young people
New labor market entrants are not equipped with the skills employers need
Attitudes, social norms, and lack of access to child care services are serious barriers to youth, particularly women, entering the labor market
Source: World Bank (2016) “South East Europe Regular Economic Report No.9S Special Topic”. Washington, DC.
7Labor taxation is high for low-wage
and part-time workers, groups where youth is overrepresented
1
34
2
6
5
Unemployment is particularly high for youth
Many young people are inactive, “idle”, in the informal sector or
choose to emigrate Young women, in particular, have a
tenuous labor market attachment
Economic growth affects employment opportunities for
youth more than for adults
Labor regulation constrains youth employment
While youth lose significantly more jobs in While youth lose significantly more jobs in economic downturns than adults do, it takes economic downturns than adults do, it takes
less economic growth to create jobs for less economic growth to create jobs for youth than for adults in SEE6
T E N M E S S A G E S A B O U T Y O U T H E M P L O Y M E N T I N S O U T H E A S T E U R O P E
“It is not easy to be young in the labor market today“ opines the Global Employment Trends for Youth 2013 report.1 It is arguably even more difficult to be young in the SEE6 labor market. Ridden by overall high levels of unemployment and low labor force participation, along with a shrinking and aging work force, the labor market in SEE6 is not creating the job opportunities needed to boost living standards and growth prospects for the region. For youth, their job aspirations as newcomers to the labor market meet the reality of even fewer opportunities available to them to start their productive lives in good standing. Double the average unemployment rate and difficulties to participate in the labor market, particularly among young women, result in a large share of idle youth in SEE6. These disparities in labor market outcomes are closely linked to some of the characteristics of unemployed youth in SEE6 which we explore below.
Understanding and tackling the obstacles to youth access and retention of jobs is critical for reducing poverty, promoting shared prosperity, and accelerating economic growth in SEE6. Because jobs are the main pathway to upward economic mobility,2 ensuring that youth have access to economic opportunities takes center stage in any agenda to raise living standards in the region. Moreover, high and sustained youth inactivity and unemployment imply a reduction in future potential output through human capital depletion and thus have
1 International Labor Organization (2013).2 Cancho et al (2015).
long-run implications for economic growth. In addition, accelerating economic growth in all SEE6 countries will depend on institutions and markets that promote and facilitate formal employment and higher productivity for both youths and adults. Finally, jobs—especially jobs for youth—are important for social cohesion.3
This paper explores the drivers of youth employment in SEE6, organized around 10 evidence-based messages. Its first set of messages describes how the labor market situation in the region after the global financial crisis of 2008 has affected youth outcomes, by presenting the key features of youth employment in SEE6 in Messages 1 through 3. The core of the paper aims to shed light on the factors associated with these outcomes, exploring the roles of economic growth and particularly of the economic downturns of the recent past in Messages 4 through 5, and the barriers and disincentives that youth face to access jobs that are embedded in markets and formal and informal institutions in Messages 6 through 10. While recognizing that they are important, drivers on the demand side for jobs are not dealt with in this paper, such as broader policies that encourage growth and job creation. It concludes with region-specific recommendations for supply-side policies to combat youth unemployment and inactivity in the SEE6 countries, which should be accompanied by efforts to increase overall labor demand.
3 World Bank 2012b.
Why Focus on Youth Joblessness in SEE6?
why FocUs on yoUth JoBlessness in see6? | 1
TEN MESSAGES ABOUT YOUTH EMPLOYMENT IN SOUTH EAST EUROPE
Message 1: Unemployment is particularly high for youth
Unemployment is more than twice as high for youth as for adults. Average unemployment for the adult population in SEE6 is about 21 percent, compared to an average of 9 percent in the European Union (EU). In 2013 the average EU youth unemployment rate was about 26.4 percent, but it was 48 percent in SEE6. Across the continent, rates ranged
from 8 percent in Germany to 60 percent in Bosnia and Herzegovina, with the highest rates concentrated in peripheral Europe, particularly among the SEE6 (Figure 1); in only a quarter of European countries was youth unemployment below 20 percent. This cohort is crucial in shaping the dynamics of general unemployment and the labor market, especially in SEE6 economies where the young constitute a higher share of total unemployment than in the rest of the continent (Figure 2).
Poor Labor Market Outcomes for SEE6 Youth
Figure 1 youth and Adult Unemployment in european economies, 2013Percent
0
60
50
40
30
20
10
DEU CHENOR
AUT
NLDDNK
MLT ES
TLU
XCZE GBR
TUR
LVA
FIN
LTU
SVN
BELSW
EROU
FRA
EU POL
IRL
HUNAL
BBGR
SVK
CYPPR
T ITA
MNE
SEE
SRB
MKD
HRVKO
SES
PGRC
BIH
J Youth unemployment rate (% of total labor force ages 15–24) Q Adult unemployment rate (% of total labor force ages 25 years or over)
Source: Eurostat and International Labour Organization, Key Indicators of the Labor Market database.
Figure 2 Unemployed youth as Percent of total Unemployed, 2014
0
45
40
35
30
25
20
15
10
5
BGRGRC
SVN
ESP
DEU LVA
LTU
EST
CZE SVK
SRB
PRT
MKD IR
LM
NEHUN EU IT
ACYP BEL
FRA
POL
LUX
HRVSE
EBIH
AUT
NLDCHE
ROUDNK
FIN
MLT
NORTU
R ISL
SWE
GBRAL
B
Source: Eurostat and labor force surveys.
SOUTH EAST EUROPE RegUlAR economic RePoRt no.9s SPECIAL TOPIC
2 | PooR lABoR mARket oUtcomes FoR see6 yoUth
In the SEE6 unemployment has risen at a faster pace for youth than for adults since 2008 (Figure 3). Between 2000 and the onset of the global economic and financial crisis in 2008, most countries in Europe saw youth unemployment rate fall as labor markets benefited from buoyant economic growth in the context of income convergence within the EU. However, the growth model in SEE6—which was consumption-driven and supported by capital inflows and remittances—proved unsustainable post-2000s. The crisis reversed the overall trends in economic growth and employment: the region contracted twice between 2008 and 2014 and overall unemployment increased by 5 percentage points on average. Youth unemployment also shot up between 2008 and 2014 to reach staggering levels of over 45 percent on average (Figure 3). While in the SEE6 average youth unemployment increased less than in the EU, its starting levels in 2008 were already almost three times higher.
Figure 3 youth and Adult Unemployment, 2008–14Percent
0 10 20 30 40 50
EU Adult
SEE6 Adult
EU Youth
SEE6 Youth
J 2008 J 2014
Source: Eurostat, national statistics offices.
Youth unemployment on average in SEE6 is still above its pre-crisis levels. However, individual countries have seen different
dynamics in post-crisis youth unemployment. FYR Macedonia and Montenegro have youth unemployment rates slightly below those observed in 2008, while the rest of the region has not yet significantly and sustainably reduced youth unemployment to lower values than those of 2008.4
Figure 4 youth-Adult Unemployment gap and change in youth Unemployment, mean, 2007–14Change in unemployment
FRA
SWEROUBEL
FIN
-15
40
35
30
25
20
15
10
5
0
-5
-10
0 105 2015 3025 35 40
NLDDNK
ISLNOR
AUT
CHE
DEUMLT
TUR
SVN
BIHSRB
MKDMNE
KOS
ESP
GRC
ITAHRV
CYP
PRT
IRLALB
IRLLTUBGR LVA
LUX
POLHUNGBR
CZEEST
Unemployment gap
Source: ILO data.
Not only is the level of youth unemployment high in SEE6, the gap between adult and youth unemployment rates is also very large. Adult-youth unemployment gaps in most SEE6 economies are considerably larger than in most EU countries. For example, in Bosnia and Herzegovina, Montenegro, and Serbia, but also in Croatia, Greece, and Spain in the EU, the gap between the youth and the adult unemployment rates is especially pronounced (Figure 4). Notably, these are exactly the same countries that had the steepest increases in overall unemployment, without signs of recovering labor markets for over five
4 Labor market data for Kosovo is not comparable between 2008 and 2012 onwards.
PooR lABoR mARket oUtcomes FoR see6 yoUth | 3
TEN MESSAGES ABOUT YOUTH EMPLOYMENT IN SOUTH EAST EUROPE
years after the crisis (2008–14).5 While the change in youth unemployment in SEE6 after 2008 was relatively small compared to that of other European economies, the adult-youth unemployment gap has remained large and persistent. It is notable that differences in the dynamics of youth labor market participation between SEE6 and EU economies are not strong enough to explain such a development. This is an indication that the gap, while sensitive to cyclical factors, is also driven by structural forces related to employability and factors affecting job creation, as will be discussed below.
Message 2: Many young people are inactive, “idle”, in the informal sector or choose to emigrate
Many youth in the SEE6 region are not active in the labor market. Labor force participation averages 53 percent for adults, but about 34 percent for youth aged 15–24. In countries with a younger workforce, like Albania and Kosovo, youth account for a significantly higher share of the labor force, therefore affecting the SEE6 average (Figure 5).6 In the rest of the SEE6 countries, youth are in the range of 6 percent of the total labor force in Serbia and 10 percent in Bosnia and Herzegovina. While some youth remain outside the labor force because they face barriers to participating, as explained later, the prospects of long-term unemployment
5 While the positive relationship between youth unemployment changes and the young-adult unemployment rate difference is dominated by the dynamics of the overall unemployment rate, such a positive correlation (albeit a weaker one) also exists if we use the youth-adult unemployment ratio instead of the difference.
6 On average, workers aged 15-24 constitute 11.6 percent of the labor force in the Western Balkan and 9.5 percent in the EU, although within the region are very large differences; for instance, in Albania youth constitute as much as 23 percent of the total labor force.
can also push many discouraged young people to abandon the labor market and education altogether. For youth, it takes around 2 years after finishing their studies to find a first job that is deemed stable or satisfactory.7 Some youth choose to move abroad in search of better opportunities. Besides its more important long-run implications, high inactivity has the immediate effect of reducing labor supply in the short run, thus negatively affecting the output of the economy and prospects for improving individual and household living standards. Put in the context of aging in all SEE6 but Kosovo, overall declining working age population puts more pressure on increasing labor productivity and keeping workers in the labor force for longer periods. Low rates of labor participation and withdrawals from the labor force trigger even sharper declines in the future labor force.
Worryingly, many SEE6 countries have high rates of young people who are not in employment, education, or training (NEET). The number of idle youths signals an underutilization of labor and potential depletion through underinvestment in human capital. NEET rates have been rising rapidly since 2008, climbing to decade-highs by 2014, when they averaged 27 percent in SEE6; a level over twice the one in the EU (Figure 6). Put differently, almost every third young person in SEE6 is idle, compared to every sixth in the EU.
Such high NEET rates erode both the quantity and quality of labor supply both currently and in the future. Youth who are detached from jobs or education for prolonged periods—especially early in their work lives—are likely to face greater difficulties
7 Djuric (2016) and Marjanovic (2016).
SOUTH EAST EUROPE RegUlAR economic RePoRt no.9s SPECIAL TOPIC
4 | PooR lABoR mARket oUtcomes FoR see6 yoUth
in re-integrating into the workforce later and are likely to earn less when they do, due to the depreciation of human capital and job-related skills and the negative signal associated with long periods out of work. The earnings penalty can be as high as 20 percent compared with those who find employment early, and the earnings deficit can persist for as long as 20 years.8 Prolonged unemployment early in one’s career can also delay or prevent the accumulation of valuable on-the-job skills.
8 See, for example, Heisz, Oreopoulus, and von Wachter 2012, Bell and Blanchflower 2011. von Wachter, Song, and Manchester 2009, and Kahn 2010.
In addition, returns from further education are forgone. To the extent that these scarring effects from unemployment and periods of inactivity translate into lower productivity and less accumulation of human capital later in life, they can substantially impair a worker’s prospects of upward economic mobility—and the country’s potential for economic growth.
Moreover, young workers in SEE6 seem to constitute a larger share of informal employment than of formal employment (Figure 7). Since most labor market surveys (e.g. labor force surveys) capture large parts of the informal workforce, high rates of youth
Figure 5 youth as a Percent of the total labor Force, 2014
0
100
90
80
70
60
50
40
30
20
10
0
25
20
15
10
5
BGRLU
X ITA
GRCCZE SV
NES
PSR
BPR
TROU
HUNSV
KBEL PO
LES
TLV
AHRV
LTU IR
LFR
AEU CYP
MNE
MKD TU
RDEU BIH FI
NSE
ESW
EAU
TNOR
CHEGBR
MLT
DNKNLD KO
S ISL
ALB
J Youth labor force share Q Adult labor force share, rhs
Source: Eurostat and labor force surveys.
Figure 6 15–24-year-olds not in employment, education, or training, 2014Percent
NLDNOR
DNKIS
LLU
XDEU SW
ECHE
AUT
CZESV
NLT
U FIN
FRA
MLT ES
TGBR EU PO
LLV
ABEL PR
TSV
KHUN
IRL
MNE
ROUCYP ES
PGRC
HRVSR
BBGR IT
ATU
RM
KD SEE
KOS
BIHAL
B0
35
30
25
20
15
10
5
Source: Eurostat.
PooR lABoR mARket oUtcomes FoR see6 yoUth | 5
TEN MESSAGES ABOUT YOUTH EMPLOYMENT IN SOUTH EAST EUROPE
unemployment may signal the presence of a large informal labor market for youths. Available data from Albania, Kosovo and Serbia suggest that on average, every fifth informal worker is a young worker. Moreover, young workers constitute a small share of the formally employed in SEE6 with an average of less than 5 percent of workers in formal jobs. Informal markets provide less employment security, as well as lower social benefits and opportunities for formal training. Moreover, case studies in the SEE6 and the new EU member states suggest that those working in the informal sector are more likely to remain informally employed for the duration of their careers or to move between inactivity and informality (World Bank, 2013).
Increased unemployment rates and lack of job opportunities push young people to emigrate. Those European countries with the highest rates of youth unemployment since 2008 also saw the fastest growth in youth emigration. The SEE6 region is one of the world regions with the highest emigration rates: From 1990 through 2015, every five years emigration accounted for an average loss of 3.2 percent
of the SEE6 source country population. The global crisis accelerated emigration flow, with cumulative migration accounting for more than 25 percent of source country population in 2013.9 The evidence of “brain drain” among youth in SEE6 is mixed, so that the negative effects of emigration of skilled individuals may be more relevant for some countries than for others. For instance, young Albanians who emigrate are more educated on average than fellow citizens who stay home, but Serbian and FYR Macedonian emigrants are less so (Figure 8). Similarly, Kosovo returnees in 201110 tended to be more educated than the resident population. When it comes to attracting these return migrants, much depends on the absorption capabilities of the domestic labor market, so revival of the labor market in SEE6 should help to encourage skilled emigrants to return home. A 2011 survey of the intentions of emigrant students from Albania, Kosovo, and FYR Macedonia found that a large proportion of them were willing to return (UNDP 2014).
9 United Nations 2015.10 Census data 2011.
Figure 7 Age profile of people in formal and informal employment in SEE6Formal workers, percent Informal workers, percent
0
100
90
80
70
60
50
40
30
20
10
Albania Kosovo Macedonia, FYR Serbia
0
100
90
80
70
60
50
40
30
20
10
Albania Kosovo Macedonia, FYR Serbia
J 15–24 J 25–54 J 55+ J 15–24 J 25–54 J 55+
Source: ESS Data and Serbian LFS. Note: Formal: employee with a contract; informal: employee without a contract.
SOUTH EAST EUROPE RegUlAR economic RePoRt no.9s SPECIAL TOPIC
6 | PooR lABoR mARket oUtcomes FoR see6 yoUth
Figure 8 comparison: secondary or higher educational Attainment, emigrants and source country PopulationShare of population with secondary attainment or higher, percent of total population
-20 -10 0 10 20 30 40 50
POL
SVK
GBR
HRV
BGR
FIN
LVA
CZE
ALB
AUT
GRC
SWE
BEL
DNK
ITA
DEU
ROU
ESP
LTU
EST
FRA
IRL
NLD
SRB
PRT
HUN
SVN
MKD
Difference between emigrant and source country population
Source: Eurostat data.Note: Positive values mean that those who emigrated had higher educational attainment.
Message 3: Young women, in particular, have a tenuous labor market attachment
Gender gaps in employment among youth exist, mostly driven by gaps in participation. While gender gaps in youth unemployment rates are not large in SEE6 (Figure 9), substantial differences remain in the labor market activity rates of young men and young women. On average, a difference of about 20 percentage points separates the activity rates of young men and women, but the difference is as high as 40 percentage points in Kosovo. Differences are even larger when taking into account ethnicity. For example, in Serbia, young Roma women have a 67 percent unemployment
rate, compared to 37 percent for non-Roma women.11
Addressing gender gaps among youth is critical as these gaps persist and widen with age. Gender differences in participation start in adolescence and widen steadily as other barriers, mainly household and family responsibilities, start to affect young women (Figure 10). Since gender gaps start early on, most of these gaps need to be closed early in people’s working lives, during youth. They are also associated with notable economic costs (Box 1).
Figure 9 youth Unemployment Rates by gender in see6, 2014Percent, age 15–24
0
80
70
60
50
40
30
20
10
Albania KosovoMacedonia,
FYR SerbiaBosnia andHerzegovina Montenegro
J Male J Female
Source: Labor force and household surveys’.Note: For Albania, the youth group comprises ages 15–29.
11 UN Development Programme/World Bank/European Commission. 2011 (2011).
PooR lABoR mARket oUtcomes FoR see6 yoUth | 7
TEN MESSAGES ABOUT YOUTH EMPLOYMENT IN SOUTH EAST EUROPE
Figure 10 the gender gap in labor Force Participation by Age group
Albania 2014 Bosnia and Herzegovina 2015
Percent Percent
0
90
80
70
60
50
40
30
20
10
15–29 30–64 65+
0
100
90
80
70
60
50
40
30
20
10
15–24 25–49 50–64
▬ Male ▬ Female ▬ Male ▬ Female
Kosovo 2014 FYR Macedonia 2014
Percent Percent
15–24 25–49 50–64
0
90
80
70
60
50
40
30
20
10
15–24 25–49 50–64
0
100
90
80
70
60
50
40
30
20
10
▬ Male ▬ Female ▬ Male ▬ Female
Montenegro 2015 Serbia 2014
Percent Percent
15–24 25–49 50–64
0
100
90
80
70
60
50
40
30
20
10
15–24 25–49 50–64
0
100
90
80
70
60
50
40
30
20
10
▬ Male ▬ Female ▬ Male ▬ Female
Source: Labor force and households surveys.
SOUTH EAST EUROPE RegUlAR economic RePoRt no.9s SPECIAL TOPIC
8 | PooR lABoR mARket oUtcomes FoR see6 yoUth
Youth face numerous impediments to productive employment, embedded in structural factors and affected by shocks. Disentangling the cyclical from structural factors driving the level and changes in youth unemployment in SEE6 is important in setting the policy agenda for creating job opportunities for youth. Standard decomposition exercises
on unemployment change in a sample of European countries found that half of the variation in the youth unemployment rate observed across countries and over time can be explained by differences in output growth (Figure 11). These cyclical factors are related to the business cycle and employment creation and destruction. The other half of the changes
Box 1 economic cost of gender gaps in see6
Gender gaps in the labor market at any age mean that an important pool of potential workers is underutilized, limiting growth potential. Cuberes and Teignier 2015 estimate that “lost” income per capita due to gender differences in SEE6 averages about 18 percent, with the loss highest in Kosovo at over 28 percent (Figure B1.1). Poor labor market outcomes for groups aged 15–24 account, on average, for 11 percent of the total potential income loss, reaching 33 percent when the next cohort (25–35) is included (Figure B1.2). About a third of the estimated lost income is due to distortions in the occupational choices for women and men, the rest to costs associated with gender inequalities in labor force participation. Put differently, in SEE6 income per capita could rise both from eliminating gender gaps among youth in labor force participation and in entrepreneurship, as well as from more equal participation in traditionally male-dominated occupations, which pay more.
Figure B1.1 gender gaps and estimated loss in income per capita
Figure B1.2 gender gaps and estimated income per capita loss by Age
J Due to labor force participation gap J Due to occupation choice J 15–24 J 25–35 J 36–50 J 51–65
Source: Cuberes and Teignier 2015.Note: A counterfactual set of gender gaps for each age group is calculated. To get the fraction of income loss for each age group, the aggregate gender gap is computed as if all the gender gaps were zero except for that particular age group.
Drivers of Youth Joblessness in SEE6
dRiveRs oF yoUth JoBlessness in see6 | 9
TEN MESSAGES ABOUT YOUTH EMPLOYMENT IN SOUTH EAST EUROPE
in youth unemployment is attributed to structural forces. Among the structural factors, changes in labor and education policies play a role.12 For instance, young workers entering the labor market generally do not have experience, connections, or an understanding of the skills required for job success or entrepreneurship. As a result, they usually find it harder to find jobs than older and more experienced workers, especially when there is little demand for labor and few vacancies, as in SEE6 countries. For changes in youth unemployment, there is also an unexplained large residual associated with
12 The calculations are based on regression analysis using data on youth employment policies in EU countries (European Commission, 2011). In terms of labor market policies, the categories correspond to (a) active labor market programs aimed at the young, (b) conditions on social benefits linked to willingness to participate in the labor market, (c) hiring subsidies, (d) promotion of self-employment, and (e) promotion of mobility among the young. Concerning education policy, the following policies are considered: (a) early school leaving prevention, (b) measures aimed at improving the efficiency of the vocational training system, (c) measures related to acknowledging non-formal learning, (d) special training aimed at the insertion of young workers in the labor market, (e) measures for linking education and experience, (f ) reforms to accommodate labor demand, (g) measures directed to at tertiary education and life-long learning, and (h) youth guarantees. Alternatively, data on real minimum wages were also collected and used as extra regressors, but did not appear to add significant explanatory power to the regression model.
forces beyond cyclical economic growth and labor and education policies. The unexplained residual is arguably related to structural factors, including institutions and norms. Each is discussed in turn.
Message 4: Economic growth affects employment opportunities for youth more than for adults
For both youth and adults, unemployment declines as the economy grows. Solid evidence, as presented in Figure 12, shows that rising youth unemployment is closely associated with economic contractions, and employment with expansions.
Two key statistically significant findings stem from Figure 12 for Europe. First, estimates of the average elasticity of youth and adult unemployment rates to GDP growth suggest that youth unemployment is “super-cyclical” in both the EU and the SEE6 countries (that is, it reacts more strongly than adult unemployment to changes in GDP growth). Second, for both youth and adult unemployment the reaction is particularly large in SEE6 as compared to other European regions. In that region, a 1 percentage point increase in GDP growth is associated on average with a decrease in the youth unemployment rate of 0.85 of a percentage point and in the adult rate by 0.29 of a percentage point. These quantitative relationships are well estimated and significantly different from each other. In contrast, in the EU, an extra percentage point of GDP growth is found to reduce youth unemployment by an average of 0.65 of a percentage point and adult rates by 0.26 of a point.
SOUTH EAST EUROPE RegUlAR economic RePoRt no.9s SPECIAL TOPIC
10 | dRiveRs oF yoUth JoBlessness in see6
Youth are thus disproportionately affected by economic cycles. On average, the change in youth unemployment in response to GDP growth is systematically larger than the change in adult unemployment. This simple negative association between economic growth and youth unemployment reveals the importance of sustained growth to youth unemployment dynamics (Figure 12).13
Message 5: While youth lose significantly more jobs in economic downturns than adults do, it takes less economic growth to create jobs for youth than for adults in SEE6
Ample evidence exists that unemployment reacts more strongly to negative economic shocks than to positive ones. This has been documented in the literature and several
13 Such a difference in correlation does not appear to be related to different lags in the reaction of adult versus youth unemployment, and still exists if changes in unemployment are regressed on GDP growth lagged one year.
theories have been put forward to explain this phenomenon (Ryan 2001). For example, Verick (2009) presented evidence that the young segment of the workforce is disproportionately affected by large recession shocks both immediately and throughout the recovery.
In the EU youth and adult unemployment rates tend to increase more during recessions than they are reduced during expansions. Recovering the jobs that have been lost in a recession therefore requires relatively long and substantial expansionary phases (see for e.g. Crespo Cuaresma, J. 2003). In differentiating unemployment elasticities between periods of positive and negative GDP growth, we find that for the EU, a decrease of 1 percentage point in GDP growth tends to raise the youth unemployment rate by 0.83 of a percentage point, but a positive growth shock of 1 percentage point decreases youth unemployment by only 0.54 of a percentage point; in contrast, adult unemployment goes up in a recession by just 0.34 of a percentage point, and goes down in an expansion by 0.21 of a percentage point.
Figure 12 gdP growth and change in youth and Adult Unemployment, 1980–2014
a. EU b. SEE6
Change in unemployment rate, percent Change in unemployment rate, percent
TEN MESSAGES ABOUT YOUTH EMPLOYMENT IN SOUTH EAST EUROPE
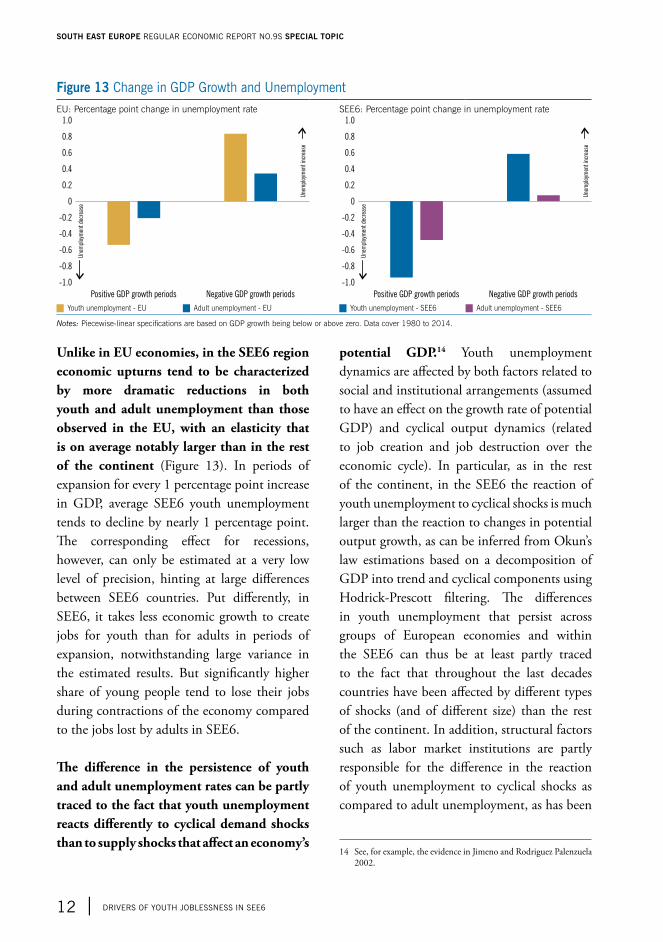
Unlike in EU economies, in the SEE6 region economic upturns tend to be characterized by more dramatic reductions in both youth and adult unemployment than those observed in the EU, with an elasticity that is on average notably larger than in the rest of the continent (Figure 13). In periods of expansion for every 1 percentage point increase in GDP, average SEE6 youth unemployment tends to decline by nearly 1 percentage point. The corresponding effect for recessions, however, can only be estimated at a very low level of precision, hinting at large differences between SEE6 countries. Put differently, in SEE6, it takes less economic growth to create jobs for youth than for adults in periods of expansion, notwithstanding large variance in the estimated results. But significantly higher share of young people tend to lose their jobs during contractions of the economy compared to the jobs lost by adults in SEE6.
The difference in the persistence of youth and adult unemployment rates can be partly traced to the fact that youth unemployment reacts differently to cyclical demand shocks than to supply shocks that affect an economy’s
potential GDP.14 Youth unemployment dynamics are affected by both factors related to social and institutional arrangements (assumed to have an effect on the growth rate of potential GDP) and cyclical output dynamics (related to job creation and job destruction over the economic cycle). In particular, as in the rest of the continent, in the SEE6 the reaction of youth unemployment to cyclical shocks is much larger than the reaction to changes in potential output growth, as can be inferred from Okun’s law estimations based on a decomposition of GDP into trend and cyclical components using Hodrick-Prescott filtering. The differences in youth unemployment that persist across groups of European economies and within the SEE6 can thus be at least partly traced to the fact that throughout the last decades countries have been affected by different types of shocks (and of different size) than the rest of the continent. In addition, structural factors such as labor market institutions are partly responsible for the difference in the reaction of youth unemployment to cyclical shocks as compared to adult unemployment, as has been
14 See, for example, the evidence in Jimeno and Rodriguez Palenzuela 2002.
Figure 13 change in gdP growth and Unemployment EU: Percentage point change in unemployment rate SEE6: Percentage point change in unemployment rate
-1.0
1.0
0.8
0.6
0.4
0.2
0
-0.2
-0.4
-0.6
-0.8
Positive GDP growth periods Negative GDP growth periods
Unem
plo
yment
decr
ease
Unem
plo
yment
incr
ease
-1.0
1.0
0.8
0.6
0.4
0.2
0
-0.2
-0.4
-0.6
-0.8
Unem
plo
yment
decr
ease
Unem
plo
yment
incr
ease
Positive GDP growth periods Negative GDP growth periods
J Youth unemployment - EU J Adult unemployment - EU J Youth unemployment - SEE6 J Adult unemployment - SEE6
Notes: Piecewise-linear specifications are based on GDP growth being below or above zero. Data cover 1980 to 2014.
SOUTH EAST EUROPE RegUlAR economic RePoRt no.9s SPECIAL TOPIC
12 | dRiveRs oF yoUth JoBlessness in see6
Box 2 youth Unemployment and the crisis in spain: A tale of two labor markets
In past decades, reform of employment protection legislation (EPL) in Europe was mostly partial or two-tier. In the mid-1980s, several European countries with considerable EPL, introduced temporary contracts to increase labor market flexibility; many countries deregulated the use of temporary contracts substantially but maintained strict protection for permanent ones. Spain is a good example of this labor market dualism, having the highest incidence of temporary contracts. After 1984, when a two-tier EPL reform liberalized the use of temporary contracts, temporary jobs more than tripled, from 11 percent of total employment in 1983 to about 35 percent in 1995 (Guell and Petrongolo 2007).
The duality of the Spanish labor market has often been held responsible for Spain’s persistently high unemployment. A large share of the workforce had precarious fixed-term labor contracts, unlike workers who had open-ended, usually full-time, contracts. Among those with fixed-term contracts, young workers were exorbitantly overrepresented: In 2010, 56 percent of contracts for workers aged 15–24 were temporary, and it was they who disproportionately suffered job losses when the crisis hit Spain. The differences in employment protection between the two types of workers give rise to insider-outsider dynamics in wage formation mechanisms, with temporary workers as the outsiders (see Bentolila, Dolado, and Jimeno 2011). The minimal moderation of wages in Spain at the outset of the crisis has also been attributed to the asymmetry of employment protection and bargaining power.
Temporary contracts have both good and bad effects. Because they can help firms to evaluate worker suitability for jobs, temporary jobs could act as a stepping-stone to more stable jobs. Temporary contracts might also function as a shock absorber, protecting firms from temporary demand fluctuations by avoiding costly adjustments to their core labor force. Boeri and Garibaldi 2007 and Boeri 2011 show that the “flexibility at the margin” provided by temporary contracts increases both hiring and firing rates for newly created jobs as firms try to restrict firing costs through reduced conversion. Despite helping to create labor market dynamism and employment, however, temporary contracts can also adversely affect investment in skills, and higher turnover and low conversion rates can reduce incentives to invest in firm-specific human capital (Dolado, Garcia-Serrano, and Jimeno 2002; Bentolila et al. 2008). Guell and Petrongolo (2007) argue that the negative impact of temporary work on vocational training depends on whether temporary contracts are used mainly to lower wage costs or to screen for entry-level jobs.
In short, by reducing the commitment employers must make, fixed-term contracts can help low-skilled youth find a first job. However, the long-term impact of such contracts on these workers’ careers may be negative. Spain’s inability to tackle the dual characteristics in past labor market reforms, in fact, partly explains the poor labor market outcomes of young people during the crisis years. Using Spanish social security data, Garcia Perez, Marinescu, and Vall-Castello (2016) have rigorously analyzed the impact of the 1984 liberalization of fixed-term contracts in Spain. They found that the reform raised the likelihood of male high-school dropouts working before age 19 by 9 percent, but in the longer run it reduced the number of days worked by 4.5 percent and earnings by 9 percent. The difficulties Spain has had over the past years in reducing youth unemployment exemplifies the long-lasting effect that incomplete labor market reforms can have in response to large output shocks.
Source: Adapted from Gill and Raiser 2012 and Garcia Perez et al. 2016.
dRiveRs oF yoUth JoBlessness in see6 | 13
TEN MESSAGES ABOUT YOUTH EMPLOYMENT IN SOUTH EAST EUROPE
documented in several European economies (see Box 2 for a brief account of the Spanish case).
The sensitivity of youth unemployment to both cyclical and potential GDP growth throughout the continent has also gone up over the last decade. In Europe, the absolute value of the Okun’s coefficient—which quantifies the effect of GDP growth on the unemployment rate changes—more than doubled (-0.3 to -0.7) in the period corresponding to the global financial crisis compared to the years before. This suggests that the GDP shock caused by the crisis pushed up youth unemployment disproportionately compared to previous recessions. There exists evidence that labor market matching deteriorated significantly during the recent global crisis in Europe (Arpaia, Kiss and Turrini, 2014), a development which can explain such a change in the economic growth elasticity of youth unemployment.
Because youth unemployment reacts to both permanent GDP changes and cyclical ones, reducing youth unemployment in SEE6 by relying solely on economic growth may be a very long process. Assuming constant growth in trend GDP of 2 percent annually (the average for 2007–14) for the full sample of European economies and abstracting from cyclical dynamics, it is estimated that in the SEE6 it would take on average four years to reduce youth unemployment by 2 percentage points—twice as long as it would take in the EU. Under a different set of assumptions, where trend GDP in SEE6 countries grow at their pre-2008 average annual rate of 6 percent and the EU grows at 2 percent annually, the youth unemployment rate between the two regions will converge in 3 decades.
Because achieving systematic decreases in youth unemployment is expected to require more than just sustainable GDP growth in the region, the next messages explore policies that could help tackle structural youth joblessness and as such exert longer-term impact on unemployment.
As labor regulations partly determine how much it costs to hire and fire new workers, they are central to youth employment outcomes. They can also affect the decisions of both workers and firms about the type of employment or contract, informal or formal, full-time or part-time, or the hours worked (see Box 2 for lessons learned from the Spanish labor market). The aggregate effects on employment or unemployment are unlikely to be large within a certain range of rigidity (“plateau” in the language of the World Development Report 2013 on Jobs). However, tight labor regulations on minimum wages and employment protection do have distributional effects, protecting those who have a job to the possible detriment of “outsiders”—who are often new entrants to the labor market and thus disproportionately young.15
The “insider-outsider” phenomenon likely has a bearing on the labor market in SEE6, affecting youth. While empirical evidence is not available to establish this, older (in terms of tenure) workers tend enjoy various employment–preserving benefits due to their seniority in SEE6. Incumbents usually participate in wage negotiations, employment conditions and other. In SEE6, insiders are
15 See Betcherman 2014 for a recent review of this literature.
SOUTH EAST EUROPE RegUlAR economic RePoRt no.9s SPECIAL TOPIC
14 | dRiveRs oF yoUth JoBlessness in see6
often unionized, which gives them further protection compared to outsiders. Outsiders, like youth, face higher unemployment risks. FYR Macedonia and Montenegro have a relatively better performance among SEE6 countries in, for instance, hiring and firing practices (World Economic Forum data 2014–2015).
In addition to the costs of hiring and firing workers, four other areas governed by regulations directly affect youth employment—the areas dealing with flexible work arrangements, apprenticeships, the minimum wage, and family leave provisions. Facilitating flexible work arrangements, including part-time work that allows youths to combine studies with work, can be particularly beneficial while also paying off for employers. In FYR Macedonia, for instance, about 8 percent of workers are employed part-time. In Montenegro, contracts for part-time employment cannot be less than one-fourth (10 hours per week) of the duration of a full-time contract (Kuddo 2014). Tax and benefit systems may also discourage part-time work: In Serbia, the “reference” wage that determines the
minimum social contribution is not adjusted for hours worked, which means that social contributions are disproportionately high for part-time workers (Arias et al. 2014).
Minimum wages, which are relatively high in several SEE6 countries, can also disproportionately affect youth. Countries in SEE6 either set the minimum wage or it is secured in effect through collective bargaining. Minimum wage regulations vary significantly in terms of level, indexation, rules for revision, coverage (national or sectoral), how the level is set, social partners, sanctions, and mechanisms for verifying compliance (Kuddo 2009). Although the effects on total employment are ambiguous and vary by country, minimum wages could particularly affect youth, especially the unskilled, because they are over-represented among low-wage earners for which the minimum wage is more likely to be binding (since their market wage is more likely to be below the established minimum wage).16 Most SEE6 countries have special regimes that authorize apprenticeship, trainee, or intern contracts for young people, but how attractive their labor market regulations are for
16 See Betcherman 2014 for a recent review of the literature.
Figure 14 Average minimum wages, normalized by gdP per capita, 2013
0
20
18
16
14
12
10
8
6
4
2
MEX SR
BES
PSV
KPO
LCZE USA KO
RES
TGBR
LUX
LTU
GRCHUN
SVN
LVA
IRL
BGRHRV
CAN ISR
JPN
FIN
FRA
BELAL
BROU
KOS
MNE
AUT
AUS
NLDM
KD ITA
DEU BIHPR
TNZL
J Typical worker Q 19-year-old or apprentice
Source: World Bank Employing Workers database and World Development Indicators.
dRiveRs oF yoUth JoBlessness in see6 | 15
TEN MESSAGES ABOUT YOUTH EMPLOYMENT IN SOUTH EAST EUROPE
those types of contracts can vary considerably. For example, very few SEE6 countries have differentiated minimum wages for youth or apprentices, and minimum wages are relatively high overall (Figure 14). Only FYR Macedonia has a minimum wage for youth that is markedly below that of an adult worker. Thus, beyond flexible work arrangements, labor legislation influences the costs and benefits of hiring youth, including through apprenticeships and internships, which are critical to building work experience for those entering the labor market.
Finally, the design of family leave provisions, especially maternity leave, could increase the disincentives of hiring young workers, particularly women. Paid maternity leave, the main family leave available in SEE6, is long compared to other countries in the region. This is particularly the case in Albania, Bosnia and Herzegovina, FYR Macedonia and Kosovo, and even when adjusting by the wage replacement rate (or full rate equivalent, FRE).17 Costs for employers can be direct—in cases in which the employer finances leave directly as in Kosovo— or indirect, thus reducing the incentives to hire, especially young women, in the first place.
Message 7: Labor taxation is high for low-wage and part-time workers, groups where youth is overrepresentedLabor taxation is high in SEE6, especially for low-wage and part-time workers—groups where youth are usually overrepresented. On average, in SEE6 countries income taxes and social security contributions constitute 36.5 percent of labor costs, significantly more than in non-European OECD countries, which
17 World Bank (2015).
average 24.1 percent.18 High labor taxation (Figure 15), by increasing costs for firms and reducing net income for individuals, can lead to less hiring, lower labor force participation, and higher informality. Lowering rates of labor taxes will have the strongest effect on employment of worker groups for whom labor demand is most elastic.19 Such groups usually include low-skilled workers, youth, older workers, and women.
Figure 15 labor taxes, levels and Progressivity in see6 and select countries, 2008Progressivity of tax wedge, percentage points
0
25
20
15
10
5
0 5 1510 2520 3530 40 45
IRL
CHE
BEL
FRA
NLDGBR
ITA HUNDEUAUT
SVN
FINCZE
SWE
ESP
PRTNOR
USA SVK GRC LVA
LTUEST
JPN
POL ROUMKD
Bosnia,Rep. Srpska
SRB
Bosnia, Fed.
MNEBGR
Tax wedge for single at 33 percent of average wage
Source: Arias et al. 2014 based on OECD Tax and Benefit Model.Note: The tax wedge measures personal income tax and social security contributions paid by workers and employers as a share of total labor costs. The figure shows the progressivity of labor taxation, as the tax wedge difference between average and low wage earners for a single person with no children at 100 percent or 33 percent of average wage, respectively. Progressivity refers to the increase of the tax wedge in percentage points. More recent data for SEE6 countries is consistent with this graph, but the post 2008 data is not fully comparable to calculate progressivity across a large sample of countries.
Beyond the level of labor taxation, its progressivity also matters because work disincentives are actually different depending on the level of earnings. On average, labor taxation in SEE6 countries is less progressive than in the rest of Europe (Figure 15), which
18 The tax wedge is calculated for a single person, without children, at the average wage. Data for Bosnia and Herzegovina, FYR Macedonia, and Serbia are for 2009; for the rest, data are for 2011.
19 See Rutkowski, J. (2007).
SOUTH EAST EUROPE RegUlAR economic RePoRt no.9s SPECIAL TOPIC
16 | dRiveRs oF yoUth JoBlessness in see6
means that the tax wedge does not increase as sharply in these countries because individuals earn more. Therefore, beyond being a general disincentive to work if labor taxation is high, the structure of taxation can penalize youth in particular. This is the case because youth tend to be overrepresented in low wage jobs given the fact that they are starting their careers and often work fewer hours. Progressivity is particularly low in Bosnia and Herzegovina, Montenegro, and Serbia (Figure 15). Montenegro in particular applies the same tax rate regardless of labor income.20
Higher tax wedge is often associated with lower labor force participation rates and lower employment-to-population ratios. For the Europe and Central Asia region, a 1 percentage point increase in the tax wedge is estimated to result in a 0.3–0.6 percentage point drop in both the labor force participation rate and the employment to-population ratio in ECA. While empirics on the effect of changes in the tax wedge for particular age groups are not available, lowering the tax wedge and improving progressivity would likely mostly affect low wage-earners, where youth are most represented.
Moreover, higher labor taxation—especially among low-wage, low-productivity workers—together with rigid labor regulations, create incentives for informality.21 Therefore, incentives for formal employment in SEE6 can be strengthened,
20 Montenegro currently applies two rates on labor income: a crisis tax of 13 percent and a standard rate of 9 percent.
21 See, for example, Koettl and Weber (2012), who show, using individual data, that controlling for individual and job characteristics, the higher the marginal tax rate and the “formalization tax rate” (including not only labor taxation but also the penalty associated with the withdrawal of social benefits when work is formalized), the more likely individuals are to work informally.
especially for youth. Arguably, disincentives to formalize employment may at least partly explain informality among young workers in SEE6 (see Message 2).
Message 8: New labor market entrants are not equipped with the skills employers need
Despite increases in formal educational attainment, average returns to an additional year of higher education remain high. Enrollment in tertiary education, for the countries where data over time are available, has risen significantly since the 1990s.22 Despite these increases in enrollment, returns to an additional year of higher education remain high, on average, just below 10 percent. This is close to the average for the overall Europe and Central Asia region, although below the average for most other regions.23 Returns are also significantly higher for women than for men.24
The returns to job-relevant education for youth, including in SEE6, are potentially large because labor demand has shifted to more complex, new-economy skills, which tend to command higher wages. The production and occupational structures of most economies are moving significantly to high-value-added and knowledge-intensive activities and services where “new economy” skills are particularly relevant. These skills encompass nonroutine cognitive, socioemotional, and technical skills, that cannot be easily automated
22 World Development Indicators, http://data.worldbank.org/indicator/SE.TER.ENRR.
23 Montenegro and Patrinos 2014.24 Ibid.
dRiveRs oF yoUth JoBlessness in see6 | 17
TEN MESSAGES ABOUT YOUTH EMPLOYMENT IN SOUTH EAST EUROPE
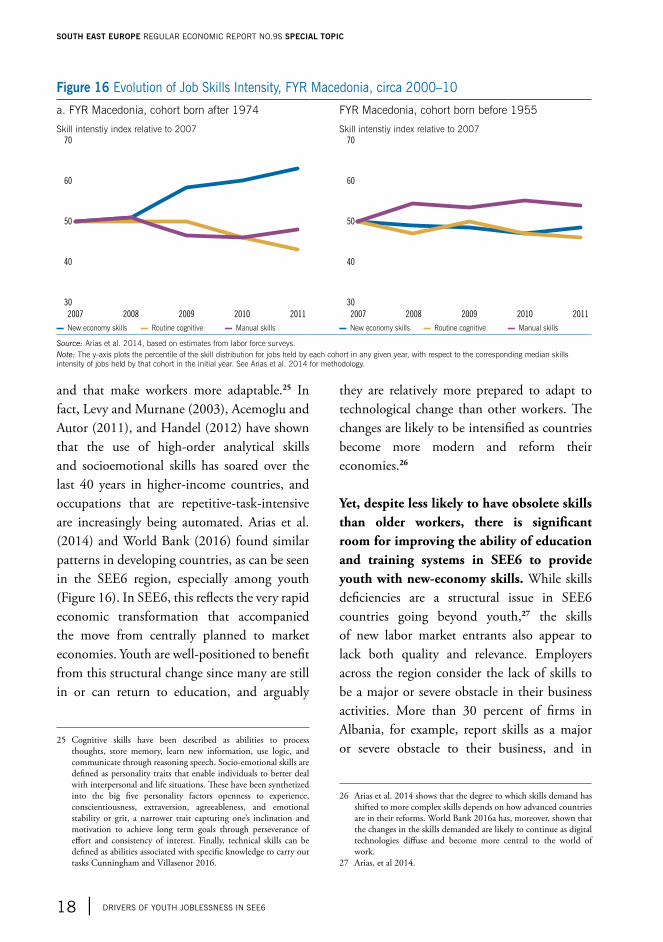
and that make workers more adaptable.25 In fact, Levy and Murnane (2003), Acemoglu and Autor (2011), and Handel (2012) have shown that the use of high-order analytical skills and socioemotional skills has soared over the last 40 years in higher-income countries, and occupations that are repetitive-task-intensive are increasingly being automated. Arias et al. (2014) and World Bank (2016) found similar patterns in developing countries, as can be seen in the SEE6 region, especially among youth (Figure 16). In SEE6, this reflects the very rapid economic transformation that accompanied the move from centrally planned to market economies. Youth are well-positioned to benefit from this structural change since many are still in or can return to education, and arguably
25 Cognitive skills have been described as abilities to process thoughts, store memory, learn new information, use logic, and communicate through reasoning speech. Socio-emotional skills are defined as personality traits that enable individuals to better deal with interpersonal and life situations. These have been synthetized into the big five personality factors openness to experience, conscientiousness, extraversion, agreeableness, and emotional stability or grit, a narrower trait capturing one’s inclination and motivation to achieve long term goals through perseverance of effort and consistency of interest. Finally, technical skills can be defined as abilities associated with specific knowledge to carry out tasks Cunningham and Villasenor 2016.
they are relatively more prepared to adapt to technological change than other workers. The changes are likely to be intensified as countries become more modern and reform their economies.26
Yet, despite less likely to have obsolete skills than older workers, there is significant room for improving the ability of education and training systems in SEE6 to provide youth with new-economy skills. While skills deficiencies are a structural issue in SEE6 countries going beyond youth,27 the skills of new labor market entrants also appear to lack both quality and relevance. Employers across the region consider the lack of skills to be a major or severe obstacle in their business activities. More than 30 percent of firms in Albania, for example, report skills as a major or severe obstacle to their business, and in
26 Arias et al. 2014 shows that the degree to which skills demand has shifted to more complex skills depends on how advanced countries are in their reforms. World Bank 2016a has, moreover, shown that the changes in the skills demanded are likely to continue as digital technologies diffuse and become more central to the world of work.
27 Arias, et al 2014.
Figure 16 evolution of Job skills intensity, FyR macedonia, circa 2000–10
a. FYR Macedonia, cohort born after 1974 FYR Macedonia, cohort born before 1955
Skill intenstiy index relative to 2007 Skill intenstiy index relative to 2007
30
70
60
50
40
2007 20092008 20112010
30
70
60
50
40
2007 20092008 20112010
▬ New economy skills ▬ Routine cognitive ▬ Manual skills ▬ New economy skills ▬ Routine cognitive ▬ Manual skills
Source: Arias et al. 2014, based on estimates from labor force surveys.Note: The y-axis plots the percentile of the skill distribution for jobs held by each cohort in any given year, with respect to the corresponding median skills intensity of jobs held by that cohort in the initial year. See Arias et al. 2014 for methodology.
SOUTH EAST EUROPE RegUlAR economic RePoRt no.9s SPECIAL TOPIC
18 | dRiveRs oF yoUth JoBlessness in see6
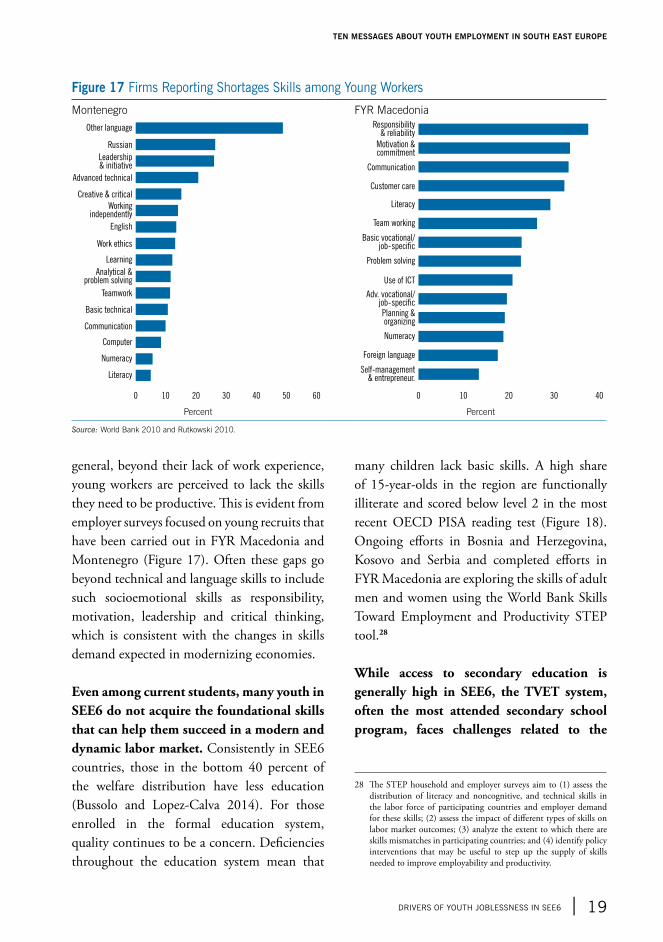
general, beyond their lack of work experience, young workers are perceived to lack the skills they need to be productive. This is evident from employer surveys focused on young recruits that have been carried out in FYR Macedonia and Montenegro (Figure 17). Often these gaps go beyond technical and language skills to include such socioemotional skills as responsibility, motivation, leadership and critical thinking, which is consistent with the changes in skills demand expected in modernizing economies.
Even among current students, many youth in SEE6 do not acquire the foundational skills that can help them succeed in a modern and dynamic labor market. Consistently in SEE6 countries, those in the bottom 40 percent of the welfare distribution have less education (Bussolo and Lopez-Calva 2014). For those enrolled in the formal education system, quality continues to be a concern. Deficiencies throughout the education system mean that
many children lack basic skills. A high share of 15-year-olds in the region are functionally illiterate and scored below level 2 in the most recent OECD PISA reading test (Figure 18). Ongoing efforts in Bosnia and Herzegovina, Kosovo and Serbia and completed efforts in FYR Macedonia are exploring the skills of adult men and women using the World Bank Skills Toward Employment and Productivity STEP tool.28
While access to secondary education is generally high in SEE6, the TVET system, often the most attended secondary school program, faces challenges related to the
28 The STEP household and employer surveys aim to (1) assess the distribution of literacy and noncognitive, and technical skills in the labor force of participating countries and employer demand for these skills; (2) assess the impact of different types of skills on labor market outcomes; (3) analyze the extent to which there are skills mismatches in participating countries; and (4) identify policy interventions that may be useful to step up the supply of skills needed to improve employability and productivity.
Figure 17 Firms Reporting shortages skills among young workers
Montenegro FYR Macedonia
0 10 20 30 40 50 60
Other language
Russian
Leadership& initiative
Advanced technical
Creative & critical
Workingindependently
English
Work ethics
Learning
Analytical &problem solving
Teamwork
Basic technical
Communication
Computer
Numeracy
Literacy
0 10 20 30 40
Responsibility& reliability
Motivation &commitment
Communication
Customer care
Literacy
Team working
Basic vocational/job-speci�c
Problem solving
Use of ICT
Adv. vocational/job-speci�c
Planning &organizing
Numeracy
Foreign language
Self-management& entrepreneur.
Percent Percent
Source: World Bank 2010 and Rutkowski 2010.
dRiveRs oF yoUth JoBlessness in see6 | 19
TEN MESSAGES ABOUT YOUTH EMPLOYMENT IN SOUTH EAST EUROPE
quality and relevance of training provided. For example, in Serbia, 75 percent of secondary enrollment is in three and four-year technical and vocational institutions. Across SEE6, TVET is typically under-funded and its profiles and curricula are obsolete: they do not correspond to skills demanded for modern jobs. In Serbia, TVET students study economy, law, and administration (13.24 percent), followed by mechanical engineering (10.46 percent), electrical engineering (9.88 percent), trade, hospitality and tourism (9.35 percent), and health (8.20 percent; Banović 2013). Students do not have opportunities to practice on the
job. In fact, employers have criticized the type and quality of skills students acquire, since the system tends to emphasize theoretical knowledge over technical and problem-solving skills and business expertise.
The wide variation in education quality within countries further limits opportunities for certain groups. There are, for example, large gaps between sociodemographic groups in performance in international reading and math tests (Figure 19). Similarly, average returns to tertiary education mask significant disparities in payoffs to education between and within
Figure 19 Average PisA scores by sociodemographic group, serbia and montenegro, 2012Points Points
Montenegro Serbia
350 390 430 470
Bottom 20%income
Urban
Females
Females
Top 20%income
Rural
Males
Males
Math
Math
Math
Readin
g
390 430 470 510
Bottom 20%income
Urban
Females
Females
Top 20%income
Rural
Males
Males
Math
Math
Math
Readin
g
Source: OECD PISA database.
Figure 18 students scoring Below level 2 on the PisA Reading section, 2015Percent
0
90
80
70
60
50
40
30
20
10
IRL
EST
FIN
POL
NORDNK
SVN
DEU ESP
RUSPR
TLV
AGBR
NLDSW
EBEL
HRVCHE
OCED
ave. IT
AFR
ACZE IS
LAU
TLU
XGRC
HUNSV
KSR
BROU
TUR
BGRM
NEM
DAAL
BGEO
MKD KO
S
Source: OECD data. Note: Data for Serbia is for 2012.
SOUTH EAST EUROPE RegUlAR economic RePoRt no.9s SPECIAL TOPIC
20 | dRiveRs oF yoUth JoBlessness in see6
fields of study. These disparities are caused by a variety of factors, such as differences in the quality of educational institutions, differentials in parental education, and low coverage of preschool and early child development programs among the ethnic minorities, and in the readiness of individuals to enter into tertiary education. In Serbia, for example, significantly fewer Roma men and women aged 16–29 are enrolled in education than non-Roma youth.29
Message 9: Lack of access to productive inputs—finance, land, and personal and professional connections—worsen the entrepreneurship and employment prospects of young people
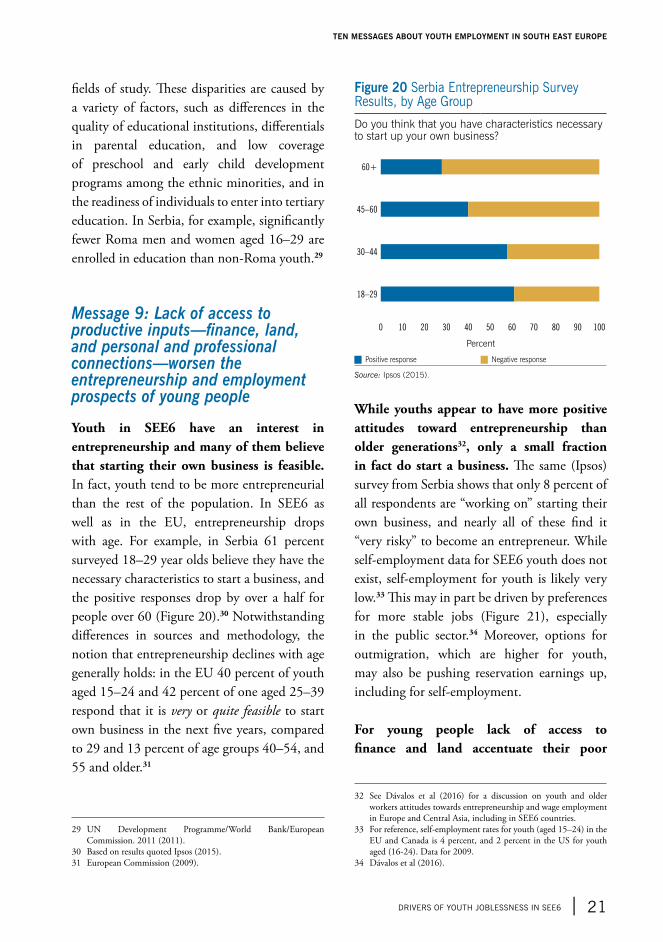
Youth in SEE6 have an interest in entrepreneurship and many of them believe that starting their own business is feasible. In fact, youth tend to be more entrepreneurial than the rest of the population. In SEE6 as well as in the EU, entrepreneurship drops with age. For example, in Serbia 61 percent surveyed 18–29 year olds believe they have the necessary characteristics to start a business, and the positive responses drop by over a half for people over 60 (Figure 20).30 Notwithstanding differences in sources and methodology, the notion that entrepreneurship declines with age generally holds: in the EU 40 percent of youth aged 15–24 and 42 percent of one aged 25–39 respond that it is very or quite feasible to start own business in the next five years, compared to 29 and 13 percent of age groups 40–54, and 55 and older.31
29 UN Development Programme/World Bank/European Commission. 2011 (2011).
30 Based on results quoted Ipsos (2015).31 European Commission (2009).
Figure 20 serbia entrepreneurship survey Results, by Age group
Do you think that you have characteristics necessary to start up your own business?
0 10 3020 5040 7060 80 90 100
60+
30–44
45–60
18–29
Percent
J Positive response J Negative response
Source: Ipsos (2015).
While youths appear to have more positive attitudes toward entrepreneurship than older generations32, only a small fraction in fact do start a business. The same (Ipsos) survey from Serbia shows that only 8 percent of all respondents are “working on” starting their own business, and nearly all of these find it “very risky” to become an entrepreneur. While self-employment data for SEE6 youth does not exist, self-employment for youth is likely very low.33 This may in part be driven by preferences for more stable jobs (Figure 21), especially in the public sector.34 Moreover, options for outmigration, which are higher for youth, may also be pushing reservation earnings up, including for self-employment.
For young people lack of access to finance and land accentuate their poor
32 See Dávalos et al (2016) for a discussion on youth and older workers attitudes towards entrepreneurship and wage employment in Europe and Central Asia, including in SEE6 countries.
33 For reference, self-employment rates for youth (aged 15–24) in the EU and Canada is 4 percent, and 2 percent in the US for youth aged (16-24). Data for 2009.
34 Dávalos et al (2016).
dRiveRs oF yoUth JoBlessness in see6 | 21
TEN MESSAGES ABOUT YOUTH EMPLOYMENT IN SOUTH EAST EUROPE
employment prospects by depressing their entrepreneurship potential. Such barriers, while prevalent for all entrepreneurs, are often particular to youth or more severe for youth than for adults. Youth tend to have lower savings, shorter credit history, and usually lack business performance history and collateral. These factors make it more difficult for youth than adults to obtain financing. For example, in most SEE6 countries, youth have less access to financial services measured by ownership of an account at a formal financial institution (Figure 22). In Serbia, for example, 37 percent
of youth respondents quote the lack of finance as a primary reason for not starting their own business.35 Similarly, around 31 percent of youth in Montenegro and 37 percent in Serbia cite insufficient financial resources as the most significant challenge to doing business.36
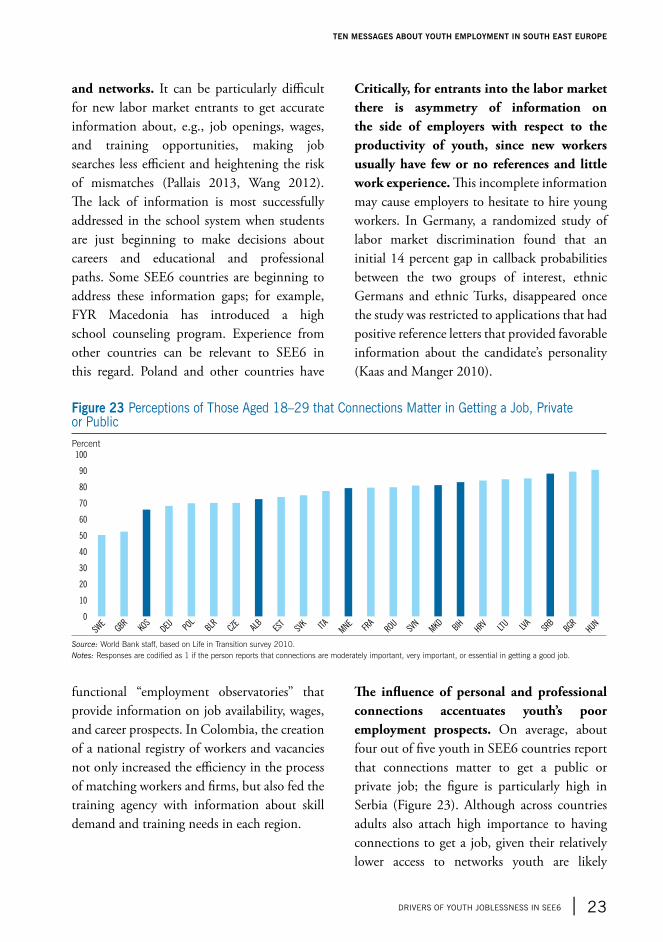
Youth in SEE6 have fewer employment prospects, including as entrepreneurs, if they have limited access to information
35 Based on results quoted Ipsos (2015).36 Djuric (2016) and Marjanovic (2016).
Figure 21 shares of men and women aged 18–29 years old who prefer a secure and average-paying job over a less secure but better paying onePercent
LTU
EST
LVA
SWE
SVK
MNE
BGRHRV
POL
SVN IT
AROU
DEU SRB
GBRBIH FR
AM
KD ALB
HUNKO
S0
90
80
70
60
50
40
30
20
10
J Male Q Female
Source: World Bank staff, based on LiTs (2010).
Figure 22 individuals with an Account at a Formal Financial institution, by AgePercent
TKM TJ
KKG
ZAZ
EGEO
ARM
UZBM
DAAL
BKA
ZSR
BM
NE ITA
RUSKO
SROU
BLR TUR
LTU
UKR BGRBIH
GRCPO
LHUN
CZE SVK
MKD PR
THRV
CYP ESP
LVA
LUX
FRA
IRL
BELES
TGBR
AUT
DEUSW
ESV
NDNK
NLD FIN
0
100
90
80
70
60
50
40
30
20
10
J 15–24 years Q 15+ years
Source: World Bank Findex database.
SOUTH EAST EUROPE RegUlAR economic RePoRt no.9s SPECIAL TOPIC
22 | dRiveRs oF yoUth JoBlessness in see6
and networks. It can be particularly difficult for new labor market entrants to get accurate information about, e.g., job openings, wages, and training opportunities, making job searches less efficient and heightening the risk of mismatches (Pallais 2013, Wang 2012). The lack of information is most successfully addressed in the school system when students are just beginning to make decisions about careers and educational and professional paths. Some SEE6 countries are beginning to address these information gaps; for example, FYR Macedonia has introduced a high school counseling program. Experience from other countries can be relevant to SEE6 in this regard. Poland and other countries have
functional “employment observatories” that provide information on job availability, wages, and career prospects. In Colombia, the creation of a national registry of workers and vacancies not only increased the efficiency in the process of matching workers and firms, but also fed the training agency with information about skill demand and training needs in each region.
Critically, for entrants into the labor market there is asymmetry of information on the side of employers with respect to the productivity of youth, since new workers usually have few or no references and little work experience. This incomplete information may cause employers to hesitate to hire young workers. In Germany, a randomized study of labor market discrimination found that an initial 14 percent gap in callback probabilities between the two groups of interest, ethnic Germans and ethnic Turks, disappeared once the study was restricted to applications that had positive reference letters that provided favorable information about the candidate’s personality (Kaas and Manger 2010).
The influence of personal and professional connections accentuates youth’s poor employment prospects. On average, about four out of five youth in SEE6 countries report that connections matter to get a public or private job; the figure is particularly high in Serbia (Figure 23). Although across countries adults also attach high importance to having connections to get a job, given their relatively lower access to networks youth are likely
Figure 23 Perceptions of those Aged 18–29 that connections matter in getting a Job, Private or PublicPercent
0
100
90
80
70
60
50
40
30
20
10
SWE
GBRKO
SDEU PO
LBLR CZE AL
BES
TSV
K ITA
MNE
FRA
ROUSV
NM
KD BIHHRV
LTU
LVA
SRB
BGRHUN
Source: World Bank staff, based on Life in Transition survey 2010.Notes: Responses are codified as 1 if the person reports that connections are moderately important, very important, or essential in getting a good job.
dRiveRs oF yoUth JoBlessness in see6 | 23
TEN MESSAGES ABOUT YOUTH EMPLOYMENT IN SOUTH EAST EUROPE
at a disadvantage in being able to count on connections for increasing opportunities.37
Message 10: Attitudes, social norms, and lack of access to child care services are serious barriers to youth, particularly women, entering the labor market
Norms and values that are upheld by both employers and potential workers may also be narrowing employment opportunities for youth. Attitudes and social norms have a major impact on markets and institutions: they shape individual and family decisions that directly and indirectly relate to the labor market. A survey of EU countries (European Commission, 2012) found that significant shares of the population—up to 18 percent in Lithuania, for example—considers youth to be at a disadvantage for labor market entrants, even among candidates with the same qualifications. These attitudes and social norms in SEE6 tend to be most detrimental for young
37 See Ioannides and Loury 2004 for a review of this literature.
women, who are often confronted by resistance stemming from social norms about traditional roles (Box 3).38
These attitudes, which in the extreme, result in discrimination, may partly explain the gender wage gaps that remain even after accounting for women’s lower labor force participation and such worker characteristics as age, education, and location. After accounting for differences in the characteristics of male and female workers, labor force survey data for 2008–11 reveal gender wage gaps of 17.9 percent in FYR Macedonia, 16.1 percent in Montenegro, and 11 percent in Serbia (Vladisavljević Avlijaš, and Vujić, 2015). These gaps may make it less attractive for women to join the labor force in the first place. Social attitudes can thus be a deterrent for work through their effect on the expectations of young women. This could be particularly a problem for young women from disadvantaged or conservative backgrounds (Jensen, et al. 2012, Vezza et al. 2013).
38 See Dávalos et al (2016) using qualitative data from Bosnia and Herzegovina, FYR Macedonia, Kosovo and Serbia.
Box 3 situations that Reinforce negative social norms for women
“My latest CV, as recommended by the director, contains the following: ‘I am a single parent with two underage children, I am not planning to get married again, I am not planning to have any more children’– I had to write this in capital letters, underlined. I am in very good health and my children have someone to take care of them when they get sick.”
Unemployed single mother in Serbia
“Women are more active in the labor market, but gender discrimination is the worst for them. When a woman gets pregnant, she is fired. She is laid off! Every private employer does this. We all know it; it is not a secret at all! When she gets fired because of the pregnancy, she registers with the agency and receives about 300 BAM for three months. There is no one to look after the baby and there is no place in day-care centers even for women who still work.”
Employment agency officer in a Bosnia and Herzegovina community
Source: Dávalos et al (2016).
SOUTH EAST EUROPE RegUlAR economic RePoRt no.9s SPECIAL TOPIC
24 | dRiveRs oF yoUth JoBlessness in see6
For women, the lack of affordable quality child care services and the prevailing unsupportive attitudes and social norms function as mutually reinforcing barriers. The lack of affordable child and elder care services can make it difficult for young women to combine work with studies and family responsibilities. In Kosovo, for example, many of the women who are not presently looking for a job cite family responsibilities as the main reason (Table 1). Similarly, in Montenegro and in Serbia, family responsibilities keep many inactive young women from seeking work (23 percent and 18 percent, respectively).39 In Serbia, only 8.6 percent of children aged 26–59 months in the poorest quintile and 6 percent of Roma children participate in early childhood programs, compared to 82 percent in the wealthiest quintile. Expanding good quality and affordable child care can be a ‘triple win’ for youth employment, in that it contributes to core socioemotional skills and facilitates employment of mothers as well as promotes inclusion of marginalized groups into the labor market. A vast literature highlights the global importance of access to child care
39 This compared to 7 percent for men in both countries. Djuric (2016) and Marjanovic (2016).
for women’s increased labor force participation. Del Boca and Locatelli (2006) used data from the European Community Household Panel to show that female labor force participation is affected by the availability, and even more importantly the affordability, of childcare. Similarly, Fong and Lokshin (2000), studying data from Romania for 1989–95, found that both female labor force participation and the decision to use paid childcare were sensitive to the cost of this service.40
40 See also Keck and Saraceno 2013, van der Lippe et al. 2010, Attanasio and Vera-Hernández 2004, Calderon 2012, or Berlinkski and Galiani 2005.
Table 1 social norms Affect whether women work, kosovo, Percent
why are you not looking for a job?
Looking after Children or Incapacitated Adults
Other Personal or Family Responsibilities
Females 7.8 42.0
Males 0.1 5.7
Females
15–24 2.8 12.7
25–39 16.8 46.6
40–54 5.4 61.8
55–65 1.1 55.1
Source: Winkler 2013.
dRiveRs oF yoUth JoBlessness in see6 | 25
TEN MESSAGES ABOUT YOUTH EMPLOYMENT IN SOUTH EAST EUROPE
The policy agenda to address youth unemployment and inactivity is an agenda for higher employment in SEE6 with specific elements for youth. As demonstrated in this study, many factors to lower overall unemployment and to boost participation rates affect disproportionately the jobless youth. Therefore, policy measures to combat joblessness could often have a higher importance for youth than other age groups. Such measures promoting overall job creation should be complemented, and not replaced, by measures focused on youth. It is through this lens the policy discussion for employment opportunities for youth is framed below.
Priority areas for tackling the youth unemployment and inactivity challenge in SEE6 vary by country.41 As this study argues, economic growth is a powerful tool for combatting youth unemployment and explains half of the changes in the youth unemployment rate across countries and over time; the rest is explained by differences in education and labor policies, as well as a large residual. The discussion below highlights and prioritizes by country some of the key policy areas where efforts are required.42
41 The next paragraphs adapt the analysis of Arias et al. 2014.42 The map was created by aggregating available indicators related to
economic growth, skills, work incentives, labor regulations, flexible work arrangements, access to networks and productive inputs, and access to childcare. The Annex describes the indicators.
Sustained economic growth
Economic growth is, without doubt, a requirement for combatting youth joblessness in the SEE6. Given the importance of GDP growth as the means for job creation and as a factor driving youth unemployment, both within and across SEE6 economies (as highlighted in messages 4 and 5), measures to ensure sustained, broad-based GDP growth and promote an enabling environment for firms to thrive are essential to tackle the problem of low engagement of youth in the labor market. Recent economic developments are encouraging: all SEE6 countries have been growing positively since 2015. In addition, SEE6 economies that have pursued structural reforms are seeing early signs of a shift from unsustainable consumption-fueled growth to more sustainable investment and export-led growth. Between 2007 and 2015, the SEE6 share of consumption in growth fell by 6 percentage points and the share of exports rose by 10 percentage points. Investment, especially private investment, is starting to play an important role in economic growth in Serbia, Albania, and Kosovo. Employment has grown throughout SEE6 too, including in the private sector (World Bank 2016b).
The sustained economic growth rates required to close the wide youth unemployment gaps between the SEE6 countries and the EU are large. Bringing youth unemployment rates at least closer to the general unemployment rate will be a positive development with implications for economic growth, individual incomes, poverty reduction, social stability, and macroeconomic
The SEE6 Policy Agenda for Employment Opportunities for Youth
SOUTH EAST EUROPE RegUlAR economic RePoRt no.9s SPECIAL TOPIC
26 | the see6 Policy AgendA FoR emPloyment oPPoRtUnities FoR yoUth
sustainability. As illustrated in messages 4 and 5, as compared to EU economies, in the SEE6 region youth unemployment is more sensitive to GDP growth and it takes relatively less GDP growth to create employment—2.2 percent for youth and 2.7 percent for adults. Nevertheless, narrowing by half the gap between the EU economies, where youth unemployment averages 17.4 percent, and the SEE6, where it averages 52.9 percent, in 15 years would still require SEE6 GDP growth to exceed growth in the EU by about 4.4 percentage points per year. Sustaining these positive trends will require continued commitment to tackle macro-fiscal imbalances and implement structural reforms.
The current study identifies two separate groups of youth in SEE6—one for whom unemployment is a more cyclical phenomenon and one who are structurally disengaged from the labor market. For each, different policies are needed to combat unemployment. The cyclically unemployed can benefit from policies that allow them to stay somewhat engaged with the labor market or in training during downturns; incentives for getting more education and training can make sense for them. Those in the structurally unemployed group are more likely to become long-term unemployed or drop out of the labor force altogether. For them, policies need to both foster the conditions for firm creation and growth and remove institutional disincentives to productive employment. In this sense, improving the regulatory environment for business and reducing institutional barriers are vital for economic growth that will lead to job
creation for the young.43
Beyond policies that foster sustainable growth in SEE6 through which to promote job creation,44 a multipronged agenda is required to open up more and better employment opportunities for youth. As this study illustrates (Messages 6 to 10), youth are confronted with disincentives and barriers to work that can keep them out of productive employment and business activity. Among these disincentives are lack of skills; labor taxation; limited access to productive inputs, information, and networks; exclusionary labor regulations and institutions; and minimal access to affordable child care services. High reservation wages, rooted in large outmigration, preference for stable public employment and informality, also play a role.45
Skills
A key item on the SEE6 agenda is to ensure that youth acquire solid basic skills that can help them succeed in a modern and dynamic labor market. Addressing weaknesses in how well foundational skills are provided requires investments and interventions that start early. Policies need to address two main areas:
(i) Provide adequate services—child care, nutrition, maternal health care—in the
43 Studies of Central and Eastern European economies have found that start-ups and small new firms have been the most important contributors to job creation in the region (see Crespo Cuaresma, Oberhofer, and Vincelette 2014). The most negatively affected by a poor business environment seem to be fast-growing firms—those that disproportionally contribute to employment growth. Improving access to finance and reducing corruption have been found to improve the chances that young entrepreneurs will survive in the market and to increase the rate of overall job creation in periods of economic growth.
44 See World Bank (2016b).45 Dávalos et al (2016) and Arias et al. (2014).
the see6 Policy AgendA FoR emPloyment oPPoRtUnities FoR yoUth | 27
TEN MESSAGES ABOUT YOUTH EMPLOYMENT IN SOUTH EAST EUROPE
critical first three years of life and expand access to quality preschools, especially to low-income families and disadvantaged groups.46 Increased access to preschool can, in addition, remove an important barrier to female employment.
(ii) Offer quality primary and secondary education, focused on foundational skills, for all children and youth. Ensuring that youth are equipped with strong foundational cognitive and socioemotional skills as they enter the labor market47 is especially important in SEE6 countries that are still undergoing a structural transformation and also aging rapidly.
One issue that deserves special attention in the SEE6 is the balance between general and vocational education, and the relevance of vocational education to the labor market. Education systems in many countries track students too early into narrow vocational paths, at the expense of general learning. Vocational education and training (VET) can endow students with technical and occupation-specific skills that can make it easier to find a first job, but it can also make it much more difficult for them to transition to other occupations. In a modern economy, where transformation is fast and there is an increasing premium for transferable skills, flexibility pays off. For most countries, waiting to start tracking until upper
46 Longitudinal research has found that returns to ECD are high: for example, for the Perry Preschool program in the United States, which focused on disadvantaged African-Americans, the social rate of return has been estimated at 7–10 percent, accounting for earnings, employment, and education gains and a reduction in crime (Heckman et al. 2010). In Europe, there is evidence that ECD has long-term benefits for disadvantaged groups: Roma children who attend preschool are more likely to complete secondary education than Roma children from the same neighborhoods who did not go to preschool (World Bank 2012).
47 For a more detailed discussion, see Heckman and Kautz 2014 and Cunningham and Villaseñor 2016.
secondary at the earliest can help ensure that students acquire a solid skills foundation.48
Next on the skills agenda for youth employment should be more effective management of the current expansion of tertiary education. Since many graduates leave the education system with inadequate skills, making it difficult for them to find productive jobs, consolidating regulatory and quality assurance mechanisms, such as accreditation, enhanced performance monitoring, and giving tertiary education institutions more accountability can help raise standards and reduce the wide variation in education quality. Better use of performance contracts and performance-based per capita financing can also improve quality and relevance while expanding access for low-income and vulnerable youth. Moreover, systems that feed educational and labor market data to students and parents can help them make better choices about which institutions to attend and which fields to study.
Furthermore, improving access to and the relevance of practical on-the-job training and making continuous education and training services part of active labor market and second-chance programs is an important aspect of the skills agenda for youth. This entails (1) addressing market failures that prevent more on-the-job training and incentivizing firms to provide it by, for example, rethinking financing mechanisms and apprenticeship programs; (2) targeting
48 It has been found that in education systems where tracking starts very early, the choice tends to depend on factors not related to innate ability. In particular tracking can be affected by the age difference between pupils, especially girls, thus leading to inefficient allocation of students (Schneeweis and Zweimüller 2014). Poland and other countries have moved to delay tracking into VET in order to move their economies up the value chain (Sondergaard and Murthi 2012).
SOUTH EAST EUROPE RegUlAR economic RePoRt no.9s SPECIAL TOPIC
28 | the see6 Policy AgendA FoR emPloyment oPPoRtUnities FoR yoUth
technical or job-specific skills gaps of youth through more effective training as part of active labor market policies and programs targeted to disadvantaged groups; (3) improving second-chance programs for youth that have left the education system or that need retooling.49
Work incentives, labor regulation and flexible work arrangements
Labor regulations could further promote youth employment. Facilitating flexible work arrangements, such as part-time work, that allow youth to combine studies with work, can be highly beneficial not only for young workers but also for employers. Furthermore, in addition to assessing the general design of minimum wage legislation, governments could consider setting a lower minimum wage for younger workers, which could be simply defined by age or by a combination of age and years in the formal labor market. For example, the minimum wage for workers under 30 might be lower than for the rest of the workforce. This would reduce the cost of hiring younger workers, among whom the incidence of unemployment is particularly high and for whom long periods of unemployment could erode human capital and lead to persistently high long-term unemployment. In most EU15 countries, minimum wages are differentiated, and in 40 countries the law sets a youth minimum wage (Kuddo 2014). This is not the case in SEE6. Moreover, reassessing the design of family leave provisions and its impact on incentives to hire or work could be considered;
49 There are few second-chance programs in the region, though some countries in the EU, including Bulgaria, have extended their literacy programs to disadvantaged populations, such as the Roma (Sondergaard and Murthi 2012).
reforms may seek to better balance family leave between mothers and fathers.
The gains to reducing labor taxation for youth, especially young women, can be especially large. Youth are likely to be the most responsive to changes in labor taxation (Arias et al. 2014, Spotlight 4.1). In addition, given the relatively large pool of potential workers in this group, a reduction in labor taxation is likely to encourage youth hiring because it reduces labor costs rather than increasing net wages. Addressing tax disincentives for youth would therefore increase the payoff for employment of labor tax reforms.50 Work incentives for youth can be improved through revenue-neutral targeted reductions in labor taxation. Reducing labor taxation specifically for low wage and part-time earners can increase the payoffs for youth from holding a formal job. This could be done through either social contribution subsidies or in-work benefits, as is done with labor income tax credits in the United States and the United Kingdom.
Access to productive inputs and networks
Policies improving access to productive inputs can have direct positive impact on jobs for youth and entrepreneurship. Reforms in the financial sector that improve access to credit, particularly among usually underserved groups,
50 For most socioeconomic groups, it is usually important to identify work disincentives that may be associated with social transfers, unemployment insurance, and pensions (Arias et al. 2014). However, since youth are not often direct recipients of benefits, indirect effects may be the main concern, particularly the income effects of such programs that act on the whole household, affecting the labor supply decisions of its members. For example, in Albania, Bulgaria, Hungary, Kosovo, and Poland, a larger share of youth is likely to be out of the labor force and out of school in households that receive pensions than in households that do not.
the see6 Policy AgendA FoR emPloyment oPPoRtUnities FoR yoUth | 29
TEN MESSAGES ABOUT YOUTH EMPLOYMENT IN SOUTH EAST EUROPE
are important. Technological innovations that allow for crowdsourcing of financial capital for business ideas, or for credit scoring that goes beyond traditional indicators for credit worthiness may also help. Similarly, in the context of underdeveloped land markets in SEE6 countries and given that at a young age people are less likely to acquire and own land, reforms facilitating the use of movable assets as collateral could enhance access to finance for youth, alongside overall policies to improve the functioning of land markets. Along the same lines, programs to foster entrepreneurship, for example, by alleviating capital constraints or by providing business and “soft skills” training, can help youth improve their job prospects. Given the limited evidence on the impact of these policies in the region, efforts to rigorously evaluate them would be very valuable.
Attitudes and social norms
With a medium and long term perspective, some policies should be directed to improving the attitudes and influencing the social norms that shape agency and employment decisions. The agenda for influencing social norms needs to go beyond establishing and enforcing legal frameworks; it should take a holistic approach that encompasses at minimum the education and legal systems, media outreach, public debate, and political commitment. Interventions that have already been shown to have important effects for changing social norms are role model interventions, job shadowing, and mentoring (see, for example OECD 2011, Eby et al. 2008, and Dávalos et al, 2016). In addition, adaptation of human resources management, particularly in the private sector, has been
identified as a good practice to promote female employment (World Bank 2011).
Policy complementarities
As illustrated in messages 6 to 10, most of the barriers to jobs for youth, although not exclusive to youth, affect them disproportionately. Moreover, these disincentives and barriers reinforce each other, especially among specific youth groups. Young women and youth of both genders from ethnic minorities or with poor skills are likely to face far more severe barriers to productive employment. Removing barriers and disincentives so as to close gender gaps for youth, particularly in labor force participation rates (message 3), will certainly help to close these gaps later in life since there is a lot of inertia in labor market participation.
Therefore, the policy agenda to remove barriers to youth employment, especially among vulnerable groups, would include complementary interventions in different areas. Youth employment programs in many countries try to better match young workers and jobs and improve access to on-the-job training and thus provide not only a first job experience but also critical production inputs necessary to foster youth entrepreneurship. There is evidence that, to be effective, these interventions need to be carefully designed and targeted to the needs and problems of the beneficiaries.51 Moreover, these programs need to be rigorously evaluated because the evidence is often mixed, having drawn upon interventions with very different
51 An example is the Dominican Republic’s “Youth and Employment” labor market insertion program, which has yielded positive results for youth of disadvantaged backgrounds even several years after the program.
SOUTH EAST EUROPE RegUlAR economic RePoRt no.9s SPECIAL TOPIC
30 | the see6 Policy AgendA FoR emPloyment oPPoRtUnities FoR yoUth
designs in different contexts, which makes it difficult to draw generalizable inferences. Lessons drawn from European and OECD countries can help inform the agenda for promoting better employment prospects for youth in SEE6.
the see6 Policy AgendA FoR emPloyment oPPoRtUnities FoR yoUth | 31
TEN MESSAGES ABOUT YOUTH EMPLOYMENT IN SOUTH EAST EUROPE
References
Acemoglu, D., and D. Autor. 2011. “Skills, Tasks and Technologies: Implications for Employment and Earnings. Handbook of Labor Economics, 4, 1043-1171.
Arias, Omar S., Carolina Sánchez-Páramo, María E. Dávalos, Indhira Santos, Erwin R. Tiongson, Carola Grun, Natasha de Andrade Falcão, Gady Saiovici, and Cesar A. Cancho. 2014. Back to Work: Growing with Jobs in Europe and Central Asia. Washington, DC: World Bank.
Arpaia, A., Kiss A. and A. Turrini. 2014. Is unemployment structural or cyclical? Main features of job matching in the EU after the crisis. Economic Papers 527, European Commission. September 2014
Attanasio, O., and M. Vera-Hernandez. 2004. Medium and Long Run Effects of Nutrition and Child Care: Evaluation of a Community Nursery Programme in Rural Colombia. London: Institute for Fiscal Studies.
Banovic, Gojko. 2013. “Current Situation in Secondary Vocational Education in Serbia” A Presentation at a TVET conference, http://www.tvetconference2013.org/eng/presentation/gojko-banovic.pdf
Bell, David, and David Blanchflower. 2011. “Young People and the Great Recession.” Oxford Review of Economic Policy 27 2: 241–267. doi: 10.1093/oxrep/grr011.
Bentolila, S., J. J. Dolado, and J. F. Jimeno. 2011. “Reforming an Insider-Outsider Labor Market: The Spanish Experience.” IZA Discussion Paper 6186. Bonn: Institute for the Study of Labor.
Berlinski, S., and S. Galiani. 2005. “The Effect of a Large Expansion of Pre-Primary School Facilities on Preschool Attendance and Maternal Employment.” London: Institute for Fiscal Studies.
Betcherman, G. 2014. “Labor Market Regulations: What do We Know about their Impacts in Developing Countries?” World Bank Policy Research Working Paper 6819, World Bank, Washington, DC.
Boeri, T. 2011. “Institutional Reforms and Dualism in European Labor Markets.” In Handbook of Labor Economics, Volume 4, Part B, edited by O. Ashenfelter, and D. Card. 1173–1236. Amsterdam: Elsevier.
Boeri, T., and P. Garibaldi. 2007. “Two Tier Reforms of Employment Protection: A Honeymoon Effect?” Economic Journal 117 (521: F357–F385.
Bussolo, M., and L. F. Lopez Calva. 2014, “Shared Prosperity: Paving the Way in Europe and Central Asia.” Europe and Central Asia Studies, World Bank. Washington, DC.
Cancho, César; María E. Dávalos; Giorgia Demarchi; Moritz Meyer and Carolina Sánchez Páramo. 2015. “Economic Mobility in Europe and Central Asia Exploring Patterns and Uncovering Puzzles”. Policy Research Working Paper 7173, World Bank.
Calderon, G. 2012. “The Effects of Child Care Provision in Mexico”. No. 2014-07, Working Papers, Banco de México.
SOUTH EAST EUROPE RegUlAR economic RePoRt no.9s SPECIAL TOPIC
32 | ReFeRences
Crespo Cuaresma, J. 2003. “Okun’s law revisited.” Oxford Bulletin of Economics and Statistics 65: 439-451.
Crespo Cuaresma, J., H. Oberhofer. and G. A. Vincelette. 2014. “Institutional Barriers and Job Creation in Central and Eastern Europe.” IZA Journal of European Labour Studies 3: 3. 1–29
Cho, Yoonyoung, and Maddalena Honorati. 2014. “Entrepreneurship Programs in Developing Countries: A Meta-Regression Analysis.” Labour Economics 28: 110–30.
Cuberes, D., & Teignier, M. (2015). How costly are labor gender gaps? Estimates for the Balkans and Turkey. Estimates for the Balkans and Turkey (June 22, 2015). World Bank Policy Research Working Paper, (7319).
Cunningham, W., M. P. Torrado, and M. Sarzosa. 2016. ”Cognitive and Non-cognitive Skills for the Peruvian Labor Market: Addressing Measurement Error through Latent Skills Estimations.” World Bank Policy Research Working Paper 7550. World Bank. Washington, DC
Cunningham, W. V., & Villaseñor, P. (2016). Employer voices, employer demands, and implications for public skills development policy connecting the labor and education sectors. The World Bank Research Observer, 31(1), 102-134.
Dávalos, M. E., G. Demarchi, I. Santos, B. Kits, I. Oral. 2016. “Voices of Europe and Central Asia: New Insights on Shared Prosperity and Jobs”. World Bank, Washington DC.
Del Boca, D., and M. Locatelli. 2006. The Determinants of Motherhood and Work Status: A Survey. Bonn: Institute for the Study of Labor.
Djuric, Dragan. 2016. “Labour market transitions of young women and men in Montenegro”. Work4Youth Publication Series No.36, International Labor Organization.
Dolado, J., C. Garcia-Serrano, and J. Jimeno.2002. “Drawing Lessons from the Boom of Temporary Jobs in Spain.” Economic Journal 112 480: F270–F295.
Eby, L. T., T. D. Allen, S. C. Evans, T. Ng, and D. L. DuBois. 2008. “Does Mentoring Matter? A Multidisciplinary Meta-analysis Comparing Mentored and Non-mentored Individuals. Journal of Vocational Behavior 722: 254–67.
European Commission. 2011. European Employment Observatory Review: Youth Employment Measures, 2010, Luxembourg: European Union Publications.
European Commission. 2012. “Discrimination in the EU in 2012”. Special Eurobarometer 393, November, Brussels.
European Commission, 2009, ‘Entrepreneurship in the EU and beyond — A survey in the EU, EFTA countries, Croatia, Turkey, the US, Japan, South Korea and China’, Flash Eurobarometer 283. Brussels.
Fong, M., and M. Lokshin. 2000. “Child Care and Women’s Labor Force Participation in Romania.” World Bank, Washington, DC.
Garcia Perez, Ignacio, Ioana Marinescu, and Judit Vall-Castello. 2016. “Can Fixed-Term Contracts Put Low Skilled Youth on a Better Career Path? Evidence from Spain.” NBER Working Paper No. 22048, National Bureau of Economic Research, Cambridge, MA.
Gill, I., and M. Raiser. 2012. Golden Growth: Restoring the Lustre of the European Economic Model. Washington, DC: World Bank.
ReFeRences | 33
TEN MESSAGES ABOUT YOUTH EMPLOYMENT IN SOUTH EAST EUROPE
Guell, M., and B. Petrongolo. 2007. “How Binding Are Legal Limits? Transitions from Temporary to Permanent Work in Spain.” Labour Economics 14 2: 153–83.
Handel, M. J. 2012. Trends in Job Skill Demands in OECD Countries No. 143. Paris: OECD Publishing.
Heckman, James J., and Tim Kautz. 2014. “Fostering and Measuring Skills: Interventions that Improve Character and Cognition,” In The Myth of Achievement Tests: The GED and the Role of Character in American Life, edited by J. J. Heckman, J. E. Humphries, and T. Kautz, 293–317. Chicago, IL: University of Chicago Press.
Heckman, J., S. Hyeok, R. Pinto, P. Savelyev, and A. Yavitz. 2010 “The Rate of Return to the HighScope Perry Preschool Program.” Journal of Public Economics 94 (1-2): 114–28.
Heisz, Andrew, Phil Oreopoulus, and Till von Wachter. 2012. “The Short- and Long-Term Career Effects of Graduating in a Recession: Hysteresis and Heterogeneity in the Market for College Graduates.” American Economic Journal: Applied Economics 4 (1): 1–29.
International Labor Organization. 2013. Enhancing Youth Employability: What? Why? and How? Guide to Core Work Skills. Geneva: ILO.
Ioannides, Y. M., and L. D. Loury. 2004. “Job Information Networks, Neighborhood Effects, and Inequality. Journal of Economic Literature 424: 1056–93.
Ipsos. 2015. “Public opinion of Serbia: Citizens’ attitudes towards entrepreneurship.” Presentation.
Jensen, R. 2012. “Do Labor Market Opportunities Affect Young Women’s Work and Family Decisions? Experimental Evidence from India.” Quarterly Journal of Economics 127 (2): 753–92.
Jimeno, J.F., and D. Rodriguez Palenzuela. 2002. “Youth Unemployment in the OECD: Demographic Shifts, Labour Market Institutions, and Macroeconomic Shocks.” ECB Working Paper 155, European Central Bank, Frankfort.
Kaas, L., and C. Manger. 2012. “Ethnic Discrimination in Germany’s Labour Market: A Field Experiment.” German Economic Review 131: 1–20.
Kahn, Lisa B. 2010 “The Long-Term Labor Market Consequences of Graduating from College in a Bad Economy.” Labour Economics 17 (2): 303–16.
Keck, W., and C. Saraceno. 2013. “The Impact of Different Social-Policy Frameworks on Social Inequalities among Women in the European Union: The Labour-Market Participation of Mothers.” Social Politics 20 (3): 297–328.
Kluve, J., S. Puerto, D. Robalino, F. Rother, F. Weidenkaff, J. Stoeterau, B. Tien, and M. Witte. Forthcoming. “Interventions to Improve the Labor Market Outcomes of Youth: A Systematic Review of Training, Entrepreneurship Promotion, Employment Services, and Subsidized Employment Interventions.”
Kovtun, D., A. M. Cirkel, M.Z. Murgasova, D. Smith, and S. Tambunlertchai. 2014. Boosting Job Growth in the Western Balkans.” IMF Working Paper. No. 14-16. International Monetary Fund, Washington, DC.
Koettl, J. and M. Weber. 2012. “Does Formal Work Pay? The Role of Labor Taxation and Social Benefit Design in the New EU Member States”. IZA Discussion Paper No. 6313. Bonn.
SOUTH EAST EUROPE RegUlAR economic RePoRt no.9s SPECIAL TOPIC
34 | ReFeRences
Kuddo, A. 2014. “South East Europe Six: A Comparative Analysis of Labor Regulations: A Technical Note”, World Bank. Washington, DC.
Kuddo, A. 2009 “Labor Laws in Eastern European and Central Asian Countries: Minimum Norms and Practices.” Social Protection Discussion Paper 0920, World Bank, Washington, DC.
Kupiszewski, M. 2009. “Labour Migration Patterns, Policies and Migration Propensity in the Western Balkans.” Budapest: International Organization for Migration.
Levy, F., and R. J. Murnane. 2003. “The Skill Content of Recent Technological Change: An Empirical Exploration.” Quarterly Journal of Economics 1184: 1279–1333.
Marjanovic, Dragana. 2016. “Labour market transitions of young women and men in the Republic of Serbia”. Work4Youth Publication Series No.36, International Labor Organization.
Montengro, Claudio, and Harry Patrinos. 2014. “Comparable Estimates of Returns to Schooling Around the World.” Policy Research Working Paper 7020, World Bank, Washington, DC.
Mroz, Thomas A., and Timothy H. Savage. 2006. “The Long-term Effects of Youth Unemployment.” Journal of Human Resources 41 (2): 259–93.
OECD. 2011. OECD Reviews of Vocational Education and Training. Paris: OECD.
Pallais, A. 2013. “Inefficient Hiring in Entry-level Labor Markets.” NBER Working Paper. No. w18917, National Bureau of Economic Research, Cambridge, MA.
Rutkowski, J. (2010). “Demand for Skills in FYR Macedonia. Photocopy. Report supported by the Multidonor Trust Fund,“Labor Markets, Job Creation, and Economic Growth,” through funding of the German, Norwegian, Austrian, and Korean governments. World Bank, Washington, DC.
Rutkowski, J. 2010. “Taxation of Labor.” In Fiscal Policy and Economic Growth: Lessons from Eastern Euroope and Central Asia, C. Gray, T. Lane, A. Varoudakis (eds). World Bank. Washington, DC
Ryan, P. 2001. “The School-to-Work Transition: A Cross-National Perspective.” Journal of Economic Literature 39: 34–92.
Schneeweis, N., and M. Zweimüller. 2014. “Early Tracking and the Misfortune of Being Young.” Scandinavian Journal of Economics 1162: 394–428.
Sondergaard, L., and M. Murthi. 2012. “Skills. Not Just Diplomas: Managing Education for Results in Eastern Europe and Central Asia.” World Bank, Washington, DC.
UN. 2015. UN Population Projections: The 2015 Revision. New York, NY: United Nations.
UNDP (UN Development Programme). 2014. Kosovo Human Development Report 2014: Migration as a Force for Development. New York: UNDP.
UN Development Programme/World Bank/European Commision. 2011. Roma survey for Serbia.
Van der Lippe, T., J. de Ruijter, E. de Ruijter, and W. Raub. 2011. “Persistent Inequalities in Time Use Between Men and Women: A Detailed Look at the Influence of Economic Circumstances, Policies and Culture.” European Sociological Review 164–79
ReFeRences | 35
TEN MESSAGES ABOUT YOUTH EMPLOYMENT IN SOUTH EAST EUROPE
Verick, S. 2009. Who Is hit hardest during a Financial Crisis? The Vulnerability of Young Men and Women to Unemployment in an Economic Downturn. IZA Discussion Papers 4359, Institute for the Study of Labor, Bonn.
Vladisavljević, M., S. Avlijaš, and S. Vujić. 2015. “Gender Wage Inequality in the Western Balkans.” In Inequalities During and After Transition in Central and Eastern Europe, edited by Cristiano Perugini and Fabrizio Pompei. Editor Affiliations University of Perugia, 222–43. London: Palgrave Macmillan UK.
Vezza, E., Cruces, G. and Amendolaggine, J. 2013. “Evaluación de Impacto Programa Juventud y Empleo - República Dominicana” Manuscript, August 5, 2013.
von Wachter, Till, Jae Song, and Joyce Manchester. 2013. “The Effect of Job Displacement on Cumulated Years Worked Across Two Decades and More.” In: Life-Cycle Events and their Consequences, edited by A. Couch, Mary C. Daly, and Julie Zissimopoulos. Stanford, CA: Stanford University Press. Wang, Y. 2012. Education in a Changing World: Flexibility, Skills, and Employability. Washington, DC: World Bank.
World Bank, 2010, FYR Macedonia Labor Demand Study. World Bank, Washington, DC.
——. 2011. World Development Report 2012: Gender Equality and Development. Washington, DC: World Bank.
——. 2012a. Closing the Early Learning Gap for Roma Children in Eastern Europe. Washington, DC: World Bank.
——. 2012b. World Development Report 2013: Jobs. Washington, DC: World Bank.
____.2015. “Maternity Leave and Women’s Labor Market Status in Kosovo: Five Key Messages”. Washington, DC: World Bank.
——. 2016a. World Development Report 2016: Digital Dividends. Washington, DC: World Bank.
——. 2016b. South East Europe Regular Economic Report No.9: Rebalancing for Stronger Growth. Washington, DC: World Bank.
SOUTH EAST EUROPE RegUlAR economic RePoRt no.9s SPECIAL TOPIC
36 | ReFeRences
V I E W T H I S R E P O R T O N L I N E :W W W . W O R L D B A N K . O R G / E C A / S E E R E R