35
JEB ©2011 J. E. Boyer Company, Inc. Ten Steps to Superior S&OP John E. Boyer, Jr. J. E. Boyer Company, Inc.

JEB
©2011 J. E. Boyer Company, Inc.
Ten Steps to Superior S&OP
John E. Boyer, Jr. J. E. Boyer Company, Inc.

JEB
©2011 J. E. Boyer Company, Inc.
John E. Boyer, Jr.
John E. Boyer, Jr., PE, CFPIM, is President of J. E. Boyer Company, Inc., a manufacturing education and consulting company. He has 38 years experience including Rockwell International, Emerson Electric, and Weber State University. He has completed 40 S&OP projects in a wide variety of industries including metal fabrication, electronics, automotive, sporting goods, and health care. John has a BS-IE from Lehigh University and an MBA from Utah State University. He is making his 24th APICS International Conference presentation.

JEB
©2011 J. E. Boyer Company, Inc. 3
Objective
Provide at least one idea that will help your S&OP process immediately.
JEB
©2011 J. E. Boyer Company, Inc. 4
Agenda
S&OP Overview – 8 8-Step S&OP Process – 7 10 Steps to Successful S&OP – 45 Calendar example handout Meeting agenda example handout
Typical Timeframe – 10 Questions – 5 35
Slides

JEB
©2011 J. E. Boyer Company, Inc. 5
Sales & Operations Planning
Demand Supply
Orders Forecast
Inventory Capacity
Top Management’s Handle on the Business
It is the activity for effectively balancing demand and supply on a regular and formal basis.
JEB
©2011 J. E. Boyer Company, Inc. 6
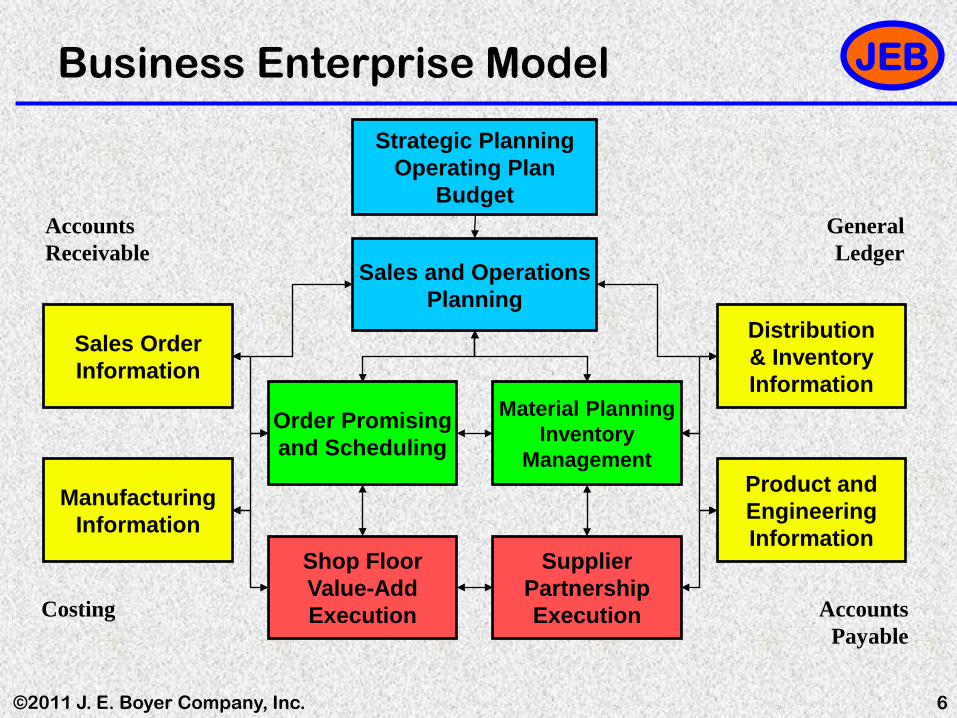
Accounts Receivable
General Ledger
Accounts Payable
Costing
Sales Order Information
Manufacturing Information
Distribution & Inventory Information
Product and Engineering Information
Supplier Partnership Execution
Order Promising and Scheduling
Material Planning Inventory
Management
Strategic Planning Operating Plan
Budget
Sales and Operations
Planning
Shop Floor Value-Add Execution
Business Enterprise Model
JEB
©2011 J. E. Boyer Company, Inc. 7
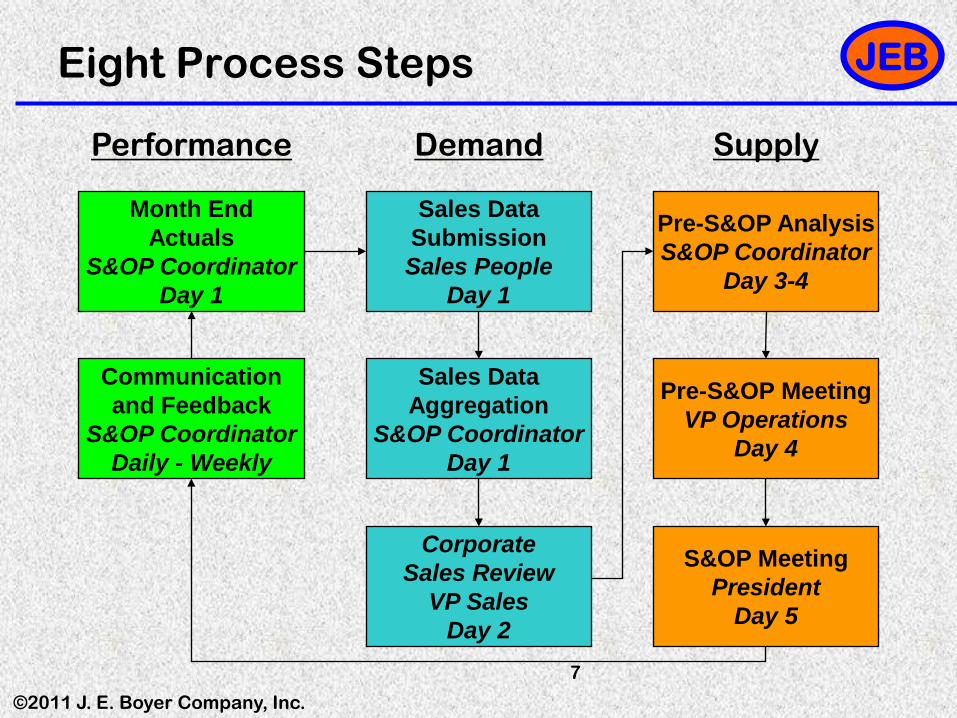
Month End Actuals
S&OP Coordinator Day 1
Demand Supply Performance
Sales Data Submission Sales People
Day 1
Sales Data Aggregation
S&OP Coordinator Day 1
Corporate Sales Review
VP Sales Day 2
Pre-S&OP Analysis S&OP Coordinator
Day 3-4
Pre-S&OP Meeting VP Operations
Day 4
S&OP Meeting President
Day 5
Communication and Feedback
S&OP Coordinator Daily - Weekly
Eight Process Steps

JEB
©2011 J. E. Boyer Company, Inc. 8
SHOW UP!
JEB
©2011 J. E. Boyer Company, Inc. 9
LEARN IT!
JEB
©2011 J. E. Boyer Company, Inc. 10
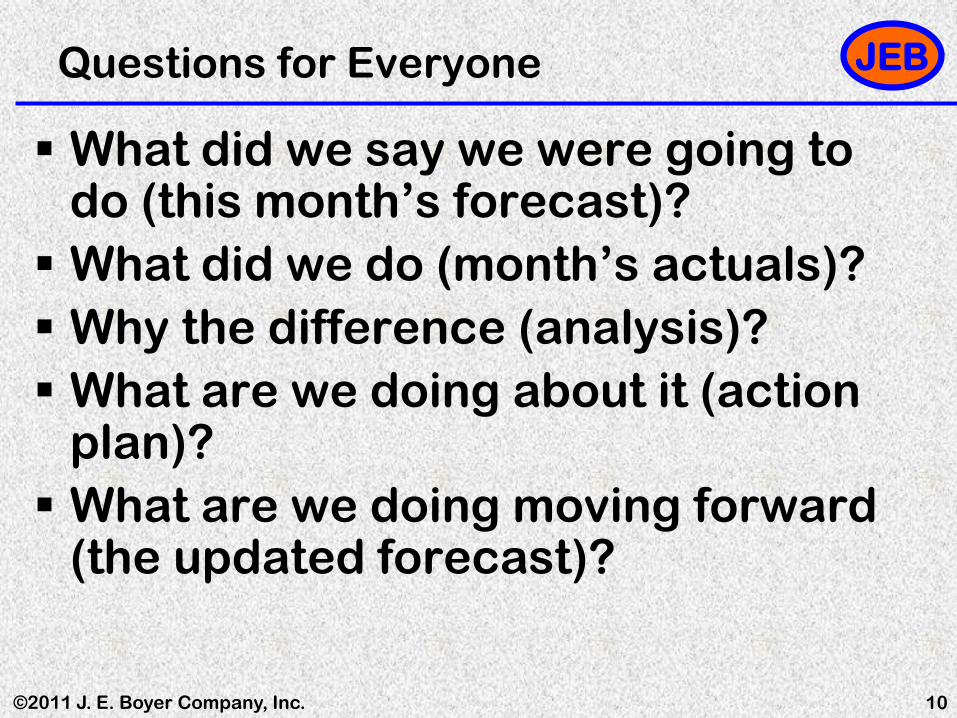
Questions for Everyone
What did we say we were going to do (this month’s forecast)? What did we do (month’s actuals)? Why the difference (analysis)? What are we doing about it (action
plan)? What are we doing moving forward
(the updated forecast)?

JEB
©2011 J. E. Boyer Company, Inc. 11
Who Is Doing the Asking?
and
Who Is Being Asked?

JEB
©2011 J. E. Boyer Company, Inc.
Step 1A – Decide To Investigate It
• Who has decided to investigate S&OP? • Name other key players needed to drive
the investigation? • What is your plan for getting the initial
key people on board and getting the initial budget?
• Do you have a budget for the first three steps?
• The right champion is the single make it or break it key.
12

JEB
©2011 J. E. Boyer Company, Inc.
Step 1B – Educate
• Typically, a two-day S&OP class for the top management team and the key process players is a good start.
• Education puts the team in a knowledgeable position for properly taking the next steps … if a “go” is agreed upon.
13
JEB
©2011 J. E. Boyer Company, Inc.
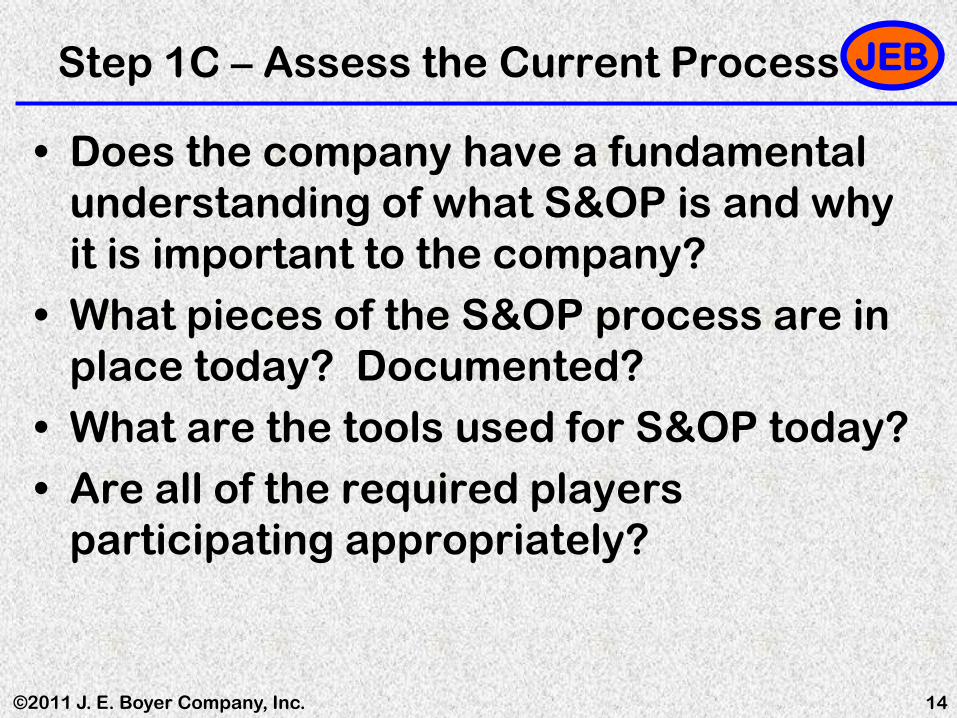
Step 1C – Assess the Current Process
• Does the company have a fundamental understanding of what S&OP is and why it is important to the company?
• What pieces of the S&OP process are in place today? Documented?
• What are the tools used for S&OP today? • Are all of the required players
participating appropriately?
14

JEB
©2011 J. E. Boyer Company, Inc.
Step 1D – Decide To Do It
• Form the design team: – About six people … cross functional. – Design all details of the eight process steps. – Refine the process.
• Form the ongoing process teams: – Sales forecasting and corporate sales review. – Operational analysis and pre-S&OP. – S&OP meeting players.
• Select the “S&OP Coordinator”. • Establish a budget.
15
JEB
©2011 J. E. Boyer Company, Inc. 16
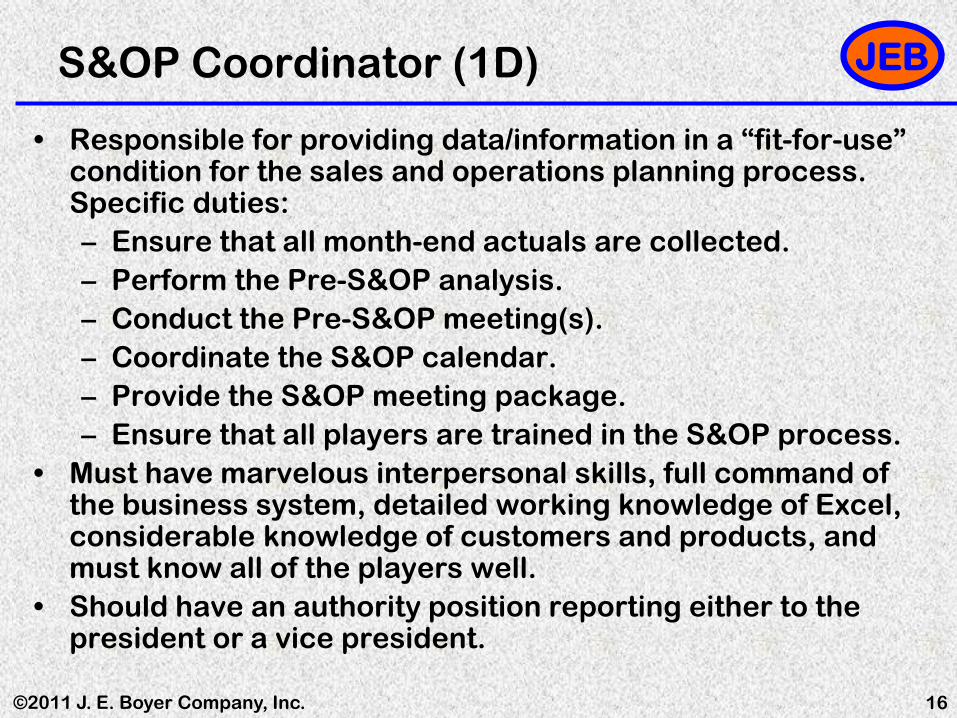
S&OP Coordinator (1D)
• Responsible for providing data/information in a “fit-for-use” condition for the sales and operations planning process. Specific duties: – Ensure that all month-end actuals are collected. – Perform the Pre-S&OP analysis. – Conduct the Pre-S&OP meeting(s). – Coordinate the S&OP calendar. – Provide the S&OP meeting package. – Ensure that all players are trained in the S&OP process.
• Must have marvelous interpersonal skills, full command of the business system, detailed working knowledge of Excel, considerable knowledge of customers and products, and must know all of the players well.
• Should have an authority position reporting either to the president or a vice president.

JEB
©2011 J. E. Boyer Company, Inc.
Establish a Budget (1D)
• What is your budget (time and money)? – Education and training? – Outside help? – Additional software and/or hardware? – IT support? – Visiting other companies that are doing it? – People power for process design and conduct?
• TIME will be more of a test/challenge than money … even though you will think the opposite initially.
17

JEB
©2011 J. E. Boyer Company, Inc.
Period Wks Period Sales Data Sales Review Pre S&OP S&OP MeetingEnd Actuals By Noon 1:00 - 3:00 2:00 - 4:00 1:00 - 3:00
Joe Smith Jim Brown Jim Brown John White Bob Jones31-Jan 5 3-Feb 3-Feb 4-Feb 6-Feb 7-Feb28-Feb 4 3-Mar 3-Mar 4-Mar 6-Mar 7-Mar28-Mar 4 31-Mar 31-Mar 1-Apr 3-Apr 4-Apr2-May 5 5-May 5-May 6-May 8-May 9-May
30-May 4 2-Jun 2-Jun 3-Jun 5-Jun 6-Jun27-Jun 4 30-Jun 30-Jun 1-Jul 3-Jul 7-Jul1-Aug 5 4-Aug 4-Aug 5-Aug 7-Aug 8-Aug
29-Aug 4 2-Sep 2-Sep 3-Sep 4-Sep 5-Sep26-Sep 4 29-Sep 29-Sep 30-Sep 2-Oct 3-Oct31-Oct 5 3-Nov 3-Nov 4-Nov 6-Nov 7-Nov28-Nov 4 1-Dec 1-Dec 2-Dec 4-Dec 5-Dec26-Dec 4 29-Dec 29-Dec 30-Dec 5-Jan 6-Jan
S&OP Coordinator
Sales and Marketing
Sales and Marketing
Production and Materials Top Management
Joe Smith Sue Williams Sue Williams Wendy Ward Bob Jones
Jack Kemp Jack Kemp Joe Vecheck John White
Marvin Alred Marvin Alred John White Jim Brown
Wally Unseld Wally Unseld Randy Urbana Joe Smith
Mary White Mary White Sue Williams Gary PikeJim Brown Joe Smith Joe Smith Vince Winter
Jim Brown
18
Step 2 – Create the S&OP Calendar
It Enables “Show Up”
JEB
©2011 J. E. Boyer Company, Inc.
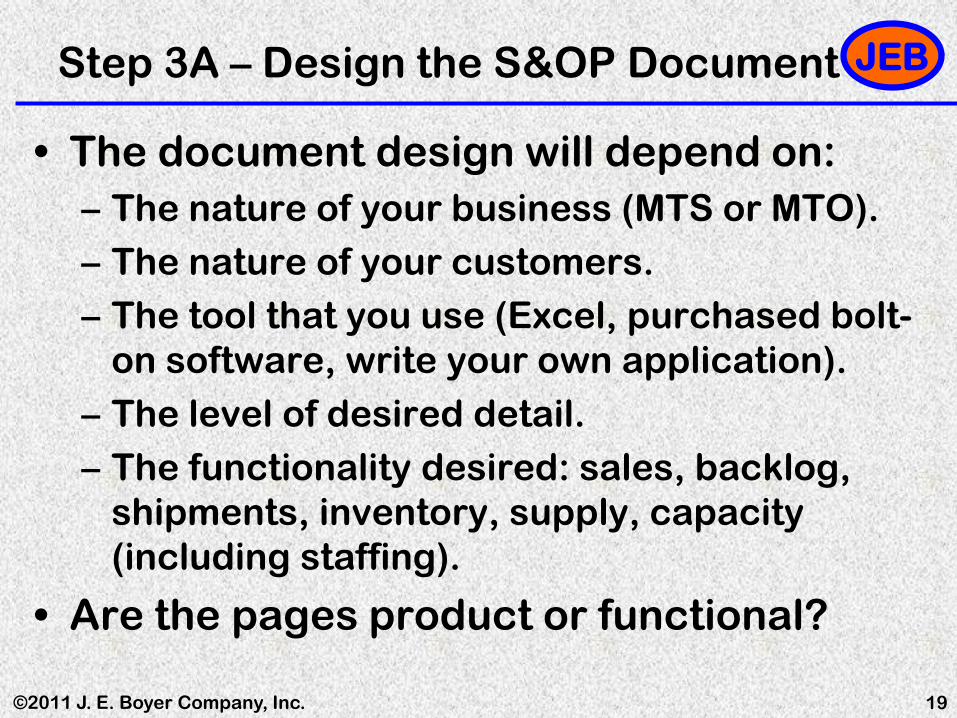
Step 3A – Design the S&OP Document
• The document design will depend on: – The nature of your business (MTS or MTO). – The nature of your customers. – The tool that you use (Excel, purchased bolt-
on software, write your own application). – The level of desired detail. – The functionality desired: sales, backlog,
shipments, inventory, supply, capacity (including staffing).
• Are the pages product or functional?
19

JEB
©2011 J. E. Boyer Company, Inc.
One Page of Many (3A)
20
Product C - S&OP - Any Company, Inc.
Jan Feb Mar Apr May Jun Jul Aug Sep Oct Nov Dec Total
Bookings Units 1050 900 825Dollars $231,000 $198,000 $181,500
Backlog Units 400 246 221 200 21Dollars $88,000 $54,120 $48,620 $44,000 $4,620
Shipments Units 918 1,054 850 1,100 1,000 1,000 900 800 1,200 1,500 1,500 1,200 13,022Dollars $201,960 $231,880 $187,000 $240,000 $220,000 $220,000 $198,000 $176,000 $264,000 $330,000 $330,000 $264,000 $2,862,840Bus Plan $200,000 $200,000 $200,000 $250,000 $250,000 $250,000 $200,000 $200,000 $300,000 $300,000 $300,000 $300,000 $2,950,000
FGI Units 1400 1,426 1,626 1,526 1,526 1,526 1,626 1,826 1,626 1,126 626 426CGS $224,000 $228,160 $260,160 $244,160 $244,160 $244,160 $260,160 $292,160 $260,160 $180,160 $100,160 $68,160
Production Units 1,100 1,080 1,050 1,000 1,000 1,000 1,000 1,000 1,000 1,000 1,000 1,000 12,230
Plant 1 600 580 600 600 600 600 600 600 600 600 600 600Plant 2 400 400 450 400 400 400 400 400 400 400 400 400Plant 3 100 100 0 0 0 0 0 0 0 0 0 0
0200400600800
1,0001,2001,4001,6001,8002,000
Jan Feb Mar Apr May Jun Jul Aug Sep Oct Nov Dec
Units
Shipments FGI Production
JEB
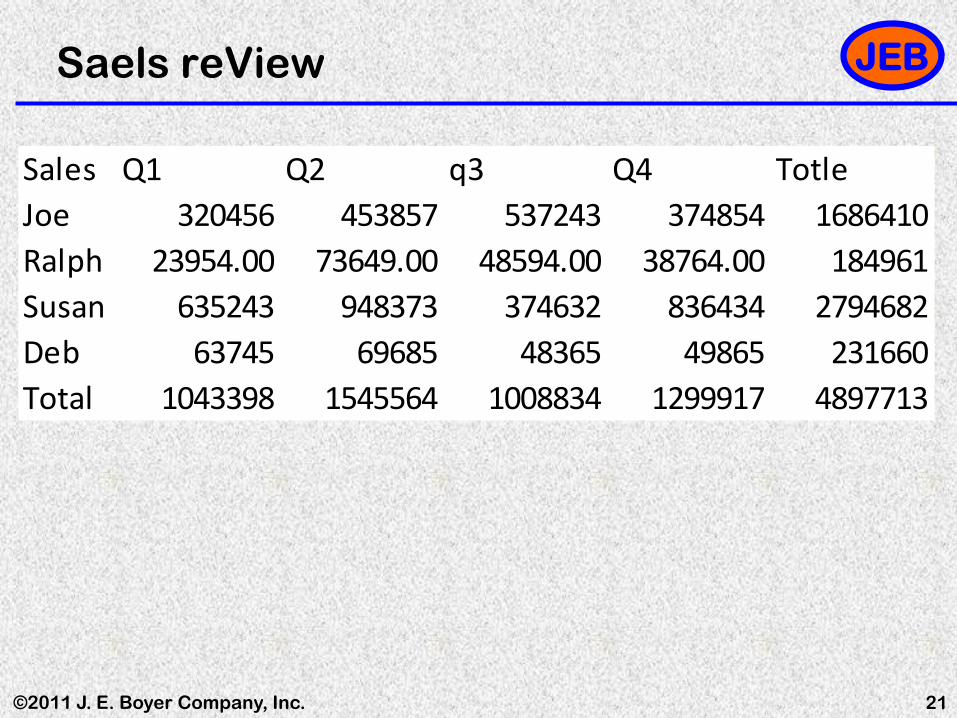
©2011 J. E. Boyer Company, Inc. 21
Saels reView
Sales Q1 Q2 q3 Q4 TotleJoe 320456 453857 537243 374854 1686410Ralph 23954.00 73649.00 48594.00 38764.00 184961Susan 635243 948373 374632 836434 2794682Deb 63745 69685 48365 49865 231660Total 1043398 1545564 1008834 1299917 4897713

JEB
©2011 J. E. Boyer Company, Inc. 22
Sales Review
Sales Q1 Q2 Q3 Q4 TotalJoe $320,456 $453,857 $537,243 $374,854 $1,686,410
Ralph $23,954 $73,649 $48,594 $38,764 $184,961Susan $635,243 $948,373 $374,632 $836,434 $2,794,682
Deb $63,745 $69,685 $48,365 $49,865 $231,660Total $1,043,398 $1,545,564 $1,008,834 $1,299,917 $4,897,713

JEB
©2011 J. E. Boyer Company, Inc.
Step 3B – Agree on Basic Definitions
• When is an order an order? (Bookings) • When is a shipment a shipment?
– Shipment or invoice?
• What comprises backlog? – Can it be aged? – Can the three dates be used?
• When is production production? (Supply)
• When is finished goods finished goods?
23
JEB
©2011 J. E. Boyer Company, Inc.
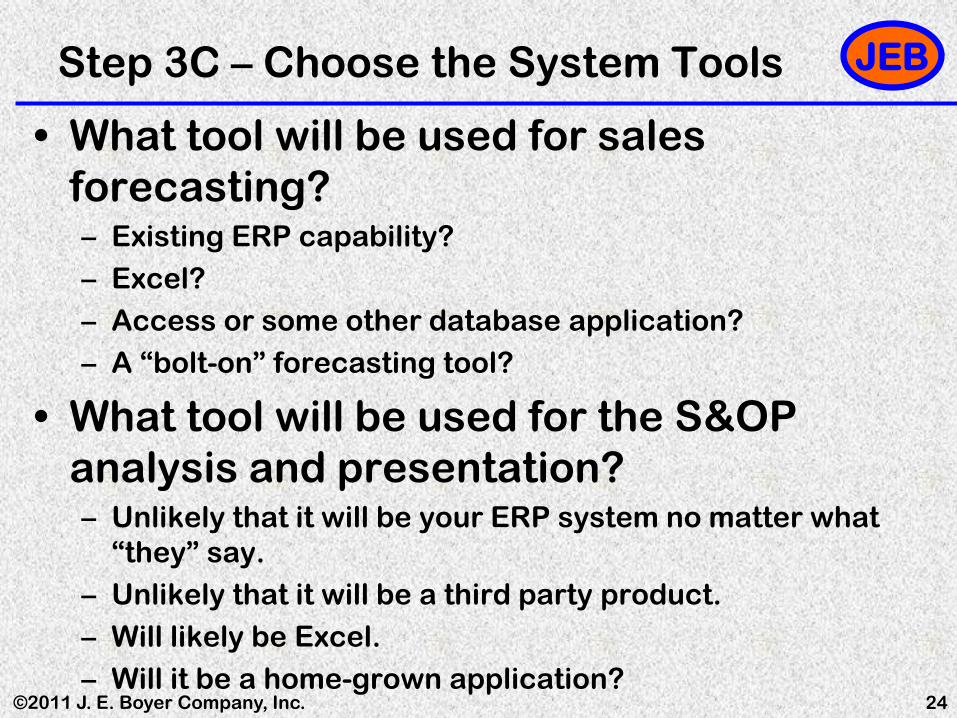
Step 3C – Choose the System Tools
• What tool will be used for sales forecasting? – Existing ERP capability? – Excel? – Access or some other database application? – A “bolt-on” forecasting tool?
• What tool will be used for the S&OP analysis and presentation? – Unlikely that it will be your ERP system no matter what
“they” say. – Unlikely that it will be a third party product. – Will likely be Excel. – Will it be a home-grown application?
24

JEB
©2011 J. E. Boyer Company, Inc.
Data Elements (3C)
• Once the document format is designed and the tools are specified, data element engineering can begin.
• The hierarchy is critical: – Product group -> family -> SKU – Sales person -> key customer -> product group ->
family -> SKU – Don’t forget “other”!
• Each SKU generally has several data elements for grouping (mapping items).
25

JEB
©2011 J. E. Boyer Company, Inc. 26
1245
5432
6632
8874
Family
DD-GGF
Group
345-964
453-985
994-374
743-856
737-009
636-835
997-331
SKU
Line AVB
Line WWR
Line JJH
Line
Mapping Items – (3C)
JEB
©2011 J. E. Boyer Company, Inc.
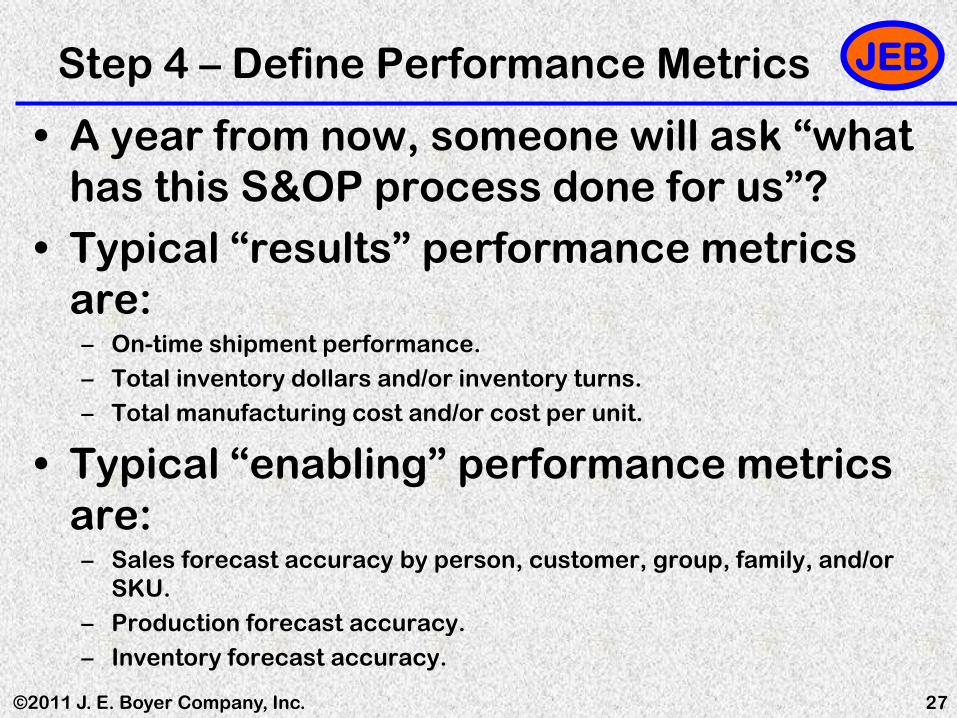
Step 4 – Define Performance Metrics
• A year from now, someone will ask “what has this S&OP process done for us”?
• Typical “results” performance metrics are: – On-time shipment performance. – Total inventory dollars and/or inventory turns. – Total manufacturing cost and/or cost per unit.
• Typical “enabling” performance metrics are: – Sales forecast accuracy by person, customer, group, family, and/or
SKU. – Production forecast accuracy. – Inventory forecast accuracy.
27

JEB
©2011 J. E. Boyer Company, Inc.
Step 5 – Design the Process Steps
• This is the step where all of the eight process steps defined earlier are fully developed.
• Each step includes: – The players and the expected role of each player in the process. – The date, time, and place. – The agenda. – The tools, documents, and formats used.
• For the process to work properly, each process step must be engineered to perfection … leave nothing to interpretation!
28
JEB
©2011 J. E. Boyer Company, Inc.
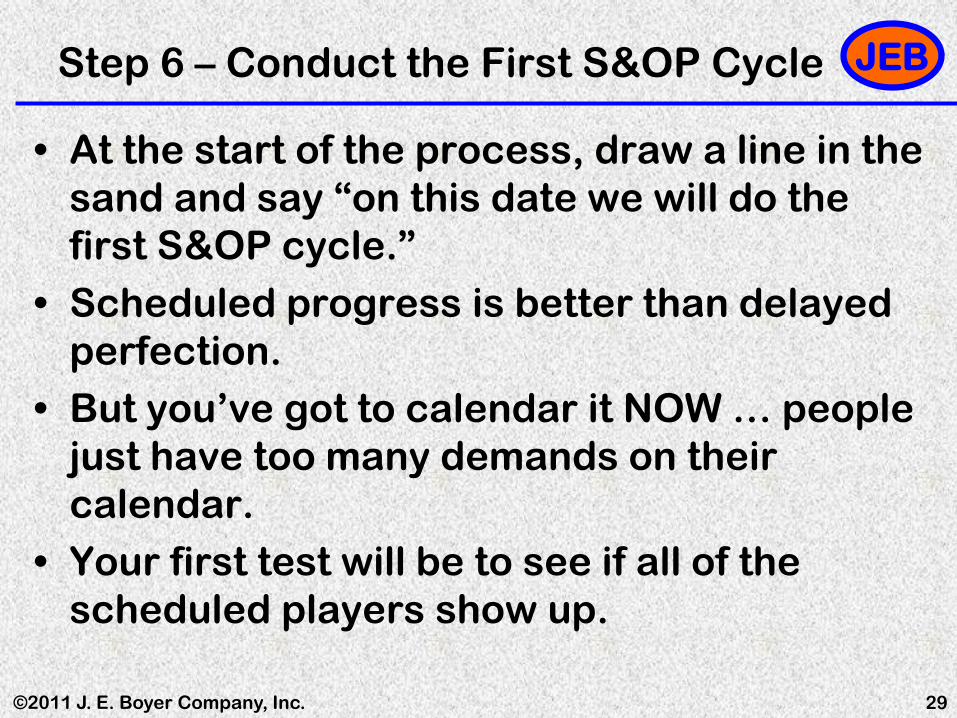
Step 6 – Conduct the First S&OP Cycle
• At the start of the process, draw a line in the sand and say “on this date we will do the first S&OP cycle.”
• Scheduled progress is better than delayed perfection.
• But you’ve got to calendar it NOW … people just have too many demands on their calendar.
• Your first test will be to see if all of the scheduled players show up.
29

JEB
©2011 J. E. Boyer Company, Inc. 30
Step 7 – Refine the Process
• It will take you about 6 complete cycles for all the players to “get it” and for the data to be really workable.
• Watch out for: – Constant sales finger pointing. – Multi-plan processes. – Data trauma. – Lack of preparation. – Attendance problems. – Top management opting out. – A million and 1 reasons why S&OP isn’t a good idea.

JEB
©2011 J. E. Boyer Company, Inc.
Step 8 – Document the Process
• Documentation helps you teach it, repeat it, bring new people into the process, and most importantly … understand it!
• ISO format is a popular option.
31
JEB
©2011 J. E. Boyer Company, Inc.
Step 9 – Train all of the Users
• The first “stupid simple” thing to do is to make sure that all process players and users know how to access the document: – Navigation path (there is a filing technique
for this). – Password.
• Then make sure they understand how S&OP affects their daily business decisions.
32

JEB
©2011 J. E. Boyer Company, Inc. 33
Step 10 – Link S&OP to ERP
• Fundamental questions? – How is demand presented? Orders? Shipments?
Production?
• What time buckets will be used? – S&OP is normally monthly. – The ERP system is normally daily.
• How will shipments, production, and inventory be validated? – In other words, the detail must match the aggregate! – This is done using “roll-ups” for sales, inventory, and
production/supply.

JEB
©2011 J. E. Boyer Company, Inc. 34
Investigate, Educate, Assess, Decide
Calendar
Format, Definitions, Tools, Data
Process Design
First S&OP
Refine
Documentation Train
Link ERP
S&OP 10-Steps Timeframe
Performance Metrics 12 Months

JEB
©2011 J. E. Boyer Company, Inc.
Questions? Comments?
John E. Boyer, Jr. (801) 721-5284 (cell)
J. E. Boyer Company, Inc. www.jeboyer.com


