PUBLIC SERVICE COMMISSION OF MARYLAND TEN-YEAR PLAN (2011 – 2020) OF ELECTRIC COMPANIES IN MARYLAND Prepared for the Maryland Department of Natural Resources In compliance with Section 7-201 of the Maryland Public Utilities Article February 2012
Transcript
PUBLIC SERVICE COMMISSION OF MARYLAND
TEN-YEAR PLAN (2011 – 2020)
OF ELECTRIC COMPANIES
IN MARYLAND
Prepared for the Maryland Department of Natural Resources
In compliance with Section 7-201 of the Maryland Public Utilities Article
February 2012
State of Maryland Public Service Commission
Douglas R. M. Nazarian, Chairman Harold D. Williams, Commissioner Lawrence Brenner, Commissioner
Kelly Speakes-Backman, Commissioner W. Kevin Hughes, Commissioner
David J. Collins Gregory V. Carmean H. Robert Erwin Executive Secretary Executive Director General Counsel
6 St. Paul Street Baltimore, MD 21202 Tel: (410) 767-8000 www.psc.state.md.us
This report was drafted by the Commission’s Energy Analysis and Planning Division (Crissy Godfrey, Director), in cooperation with the Engineering Division (Jerry Hughes, Chief Engineer). Electric companies under the Commission’s jurisdiction provided most of the data in the Appendix.
TABLE OF CONTENTS I. INTRODUCTION ...............................................................................................................................1 II. MARYLAND UTILITY AND PJM ZONAL LOAD FORECASTS...............................................3
A. Introduction...................................................................................................................................... 3 B. PJM Zonal Forecast.......................................................................................................................... 4 C. Maryland Company Forecasts.......................................................................................................... 5
III. REGIONAL GENERATION AND SUPPLY ADEQUACY IN MARYLAND..............................7 A. Introduction...................................................................................................................................... 7 B. Maryland Generation Profile: Age and Fuel Characteristics........................................................... 9 C. Potential Generation Additions in Maryland.................................................................................. 13 D. CPCN Exemptions for Generation ................................................................................................. 15
IV. TRANSMISSION INFRASTRUCTURE: PJM, MARYLAND, AND NATIONAL...................19 A. Introduction.................................................................................................................................... 19 B. Eastern Interconnection Planning Collaborative ............................................................................ 19 C. The Regional Transmission Expansion Planning Protocol ............................................................ 20 D. Transmission Congestion in Maryland........................................................................................... 22 E. High Voltage Transmission Lines in PJM ..................................................................................... 24
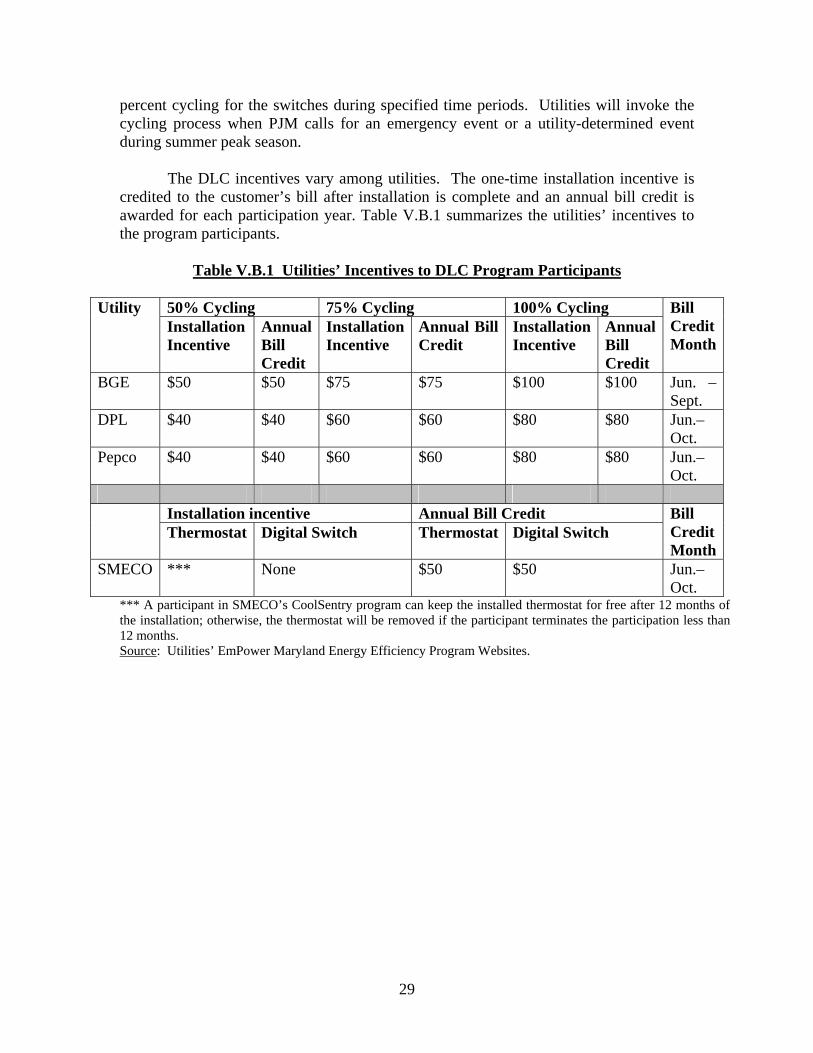
V. DEMAND RESPONSE AND CONSERVATION AND ENERGY EFFICIENCY ....................26 A. Statutory Requirements .................................................................................................................. 26 B. Demand Response Initiatives ......................................................................................................... 28 C. Energy Efficiency and Conservation Programs ............................................................................. 34 D. Advanced Metering Infrastructure / Smart Grid ............................................................................ 37 E. Mid-Atlantic Distributed Resources Initiative ............................................................................... 42
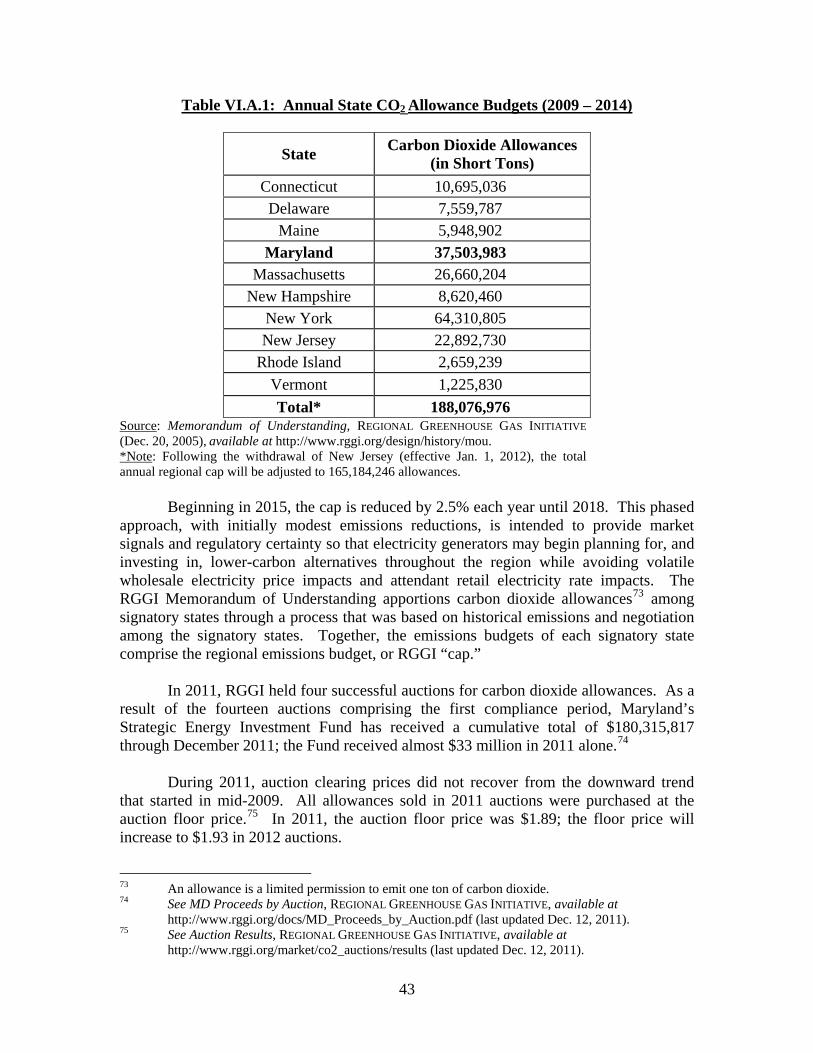
VI. ENERGY, THE ENVIRONMENT, AND RENEWABLES...........................................................42 A. The Regional Greenhouse Gas Initiative........................................................................................ 42 B. The Renewable Energy Portfolio Standard Program ..................................................................... 44 C. Solar Power Requirements in Maryland ........................................................................................ 49
VII. ELECTRIC DISTRIBUTION RELIABILITY IN MARYLAND.................................................51 A. Electric Distribution Reliability Reporting, Operation and Maintenance ...................................... 51 B. Distribution Reliability Issues........................................................................................................ 53 C. Managing Distribution Outages ..................................................................................................... 58 D. Distribution Planning Process ........................................................................................................ 60
VIII. MARYLAND ELECTRICITY MARKETS....................................................................................63 A. Status of Retail Electric Choice in Maryland ................................................................................. 63 B. Standard Offer Service ................................................................................................................... 65
IX. REGIONAL ENERGY ISSUES AND EVENTS ............................................................................66 A. Overview of PJM, OPSI, and Reliability First ............................................................................... 66 B. PJM Summer Peak Events of 2010 and 2011 ................................................................................ 68 C. PJM’s Reliability Pricing Model.................................................................................................... 69 D. Region-Wide Demand Response in PJM Markets ......................................................................... 71
X. PROCEEDINGS BEFORE THE FEDERAL ENERGY REGULATORY COMMISSION .....72
i
APPENDIX
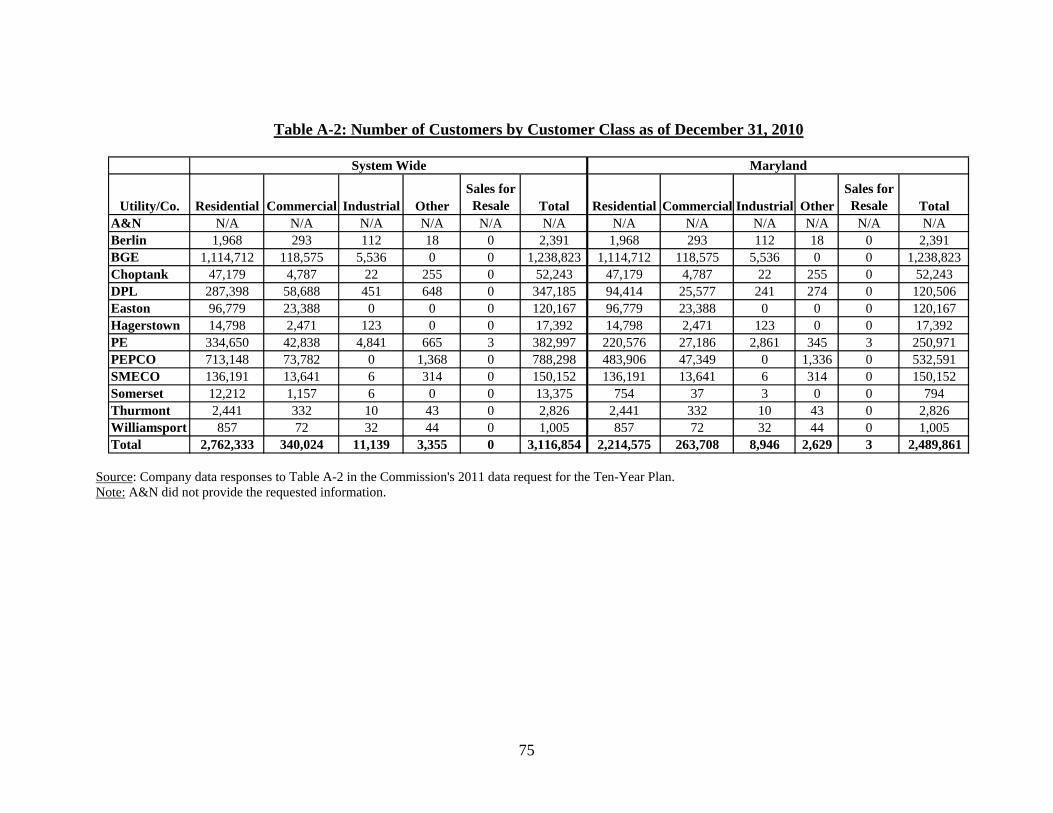
Table A-1: Utilities Providing Retail Electric Service in Maryland................................. 74 Table A-2: Number of Customers by Customer Class as of December 31, 2010 ............ 75 Table A-3: Typical Monthly Electric Bills in Maryland (Winter 2010)........................... 76 Table A-4(a): System Wide Peak Demand Forecast as of December 31, 2010 (MW) (Net
of DSM Programs).................................................................................................... 77 Table A-4(b): Maryland Peak Demand Forecast as of December 31, 2010 (MW) (Net of
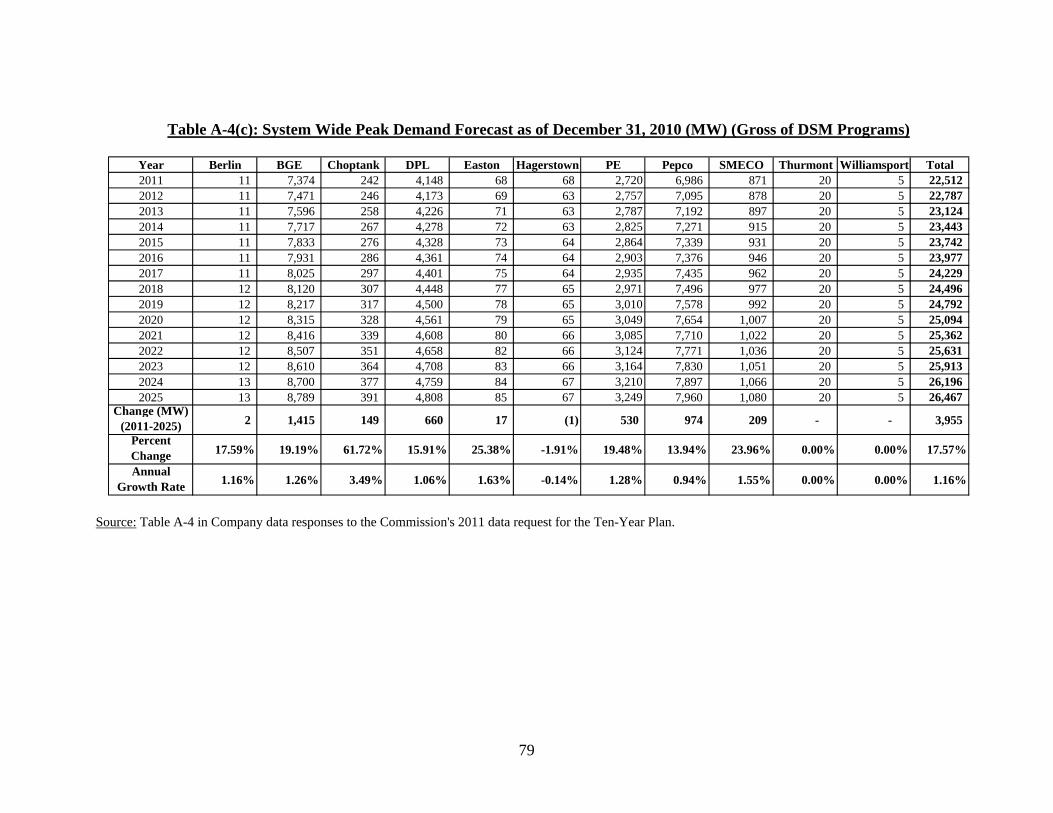
DSM Programs) ........................................................................................................ 78 Table A-4(c): System Wide Peak Demand Forecast as of December 31, 2010 (MW)
(Gross of DSM Programs) ........................................................................................ 79 Table A-4(d): Maryland Peak Demand Forecast as of December 31, 2010 (MW) (Gross
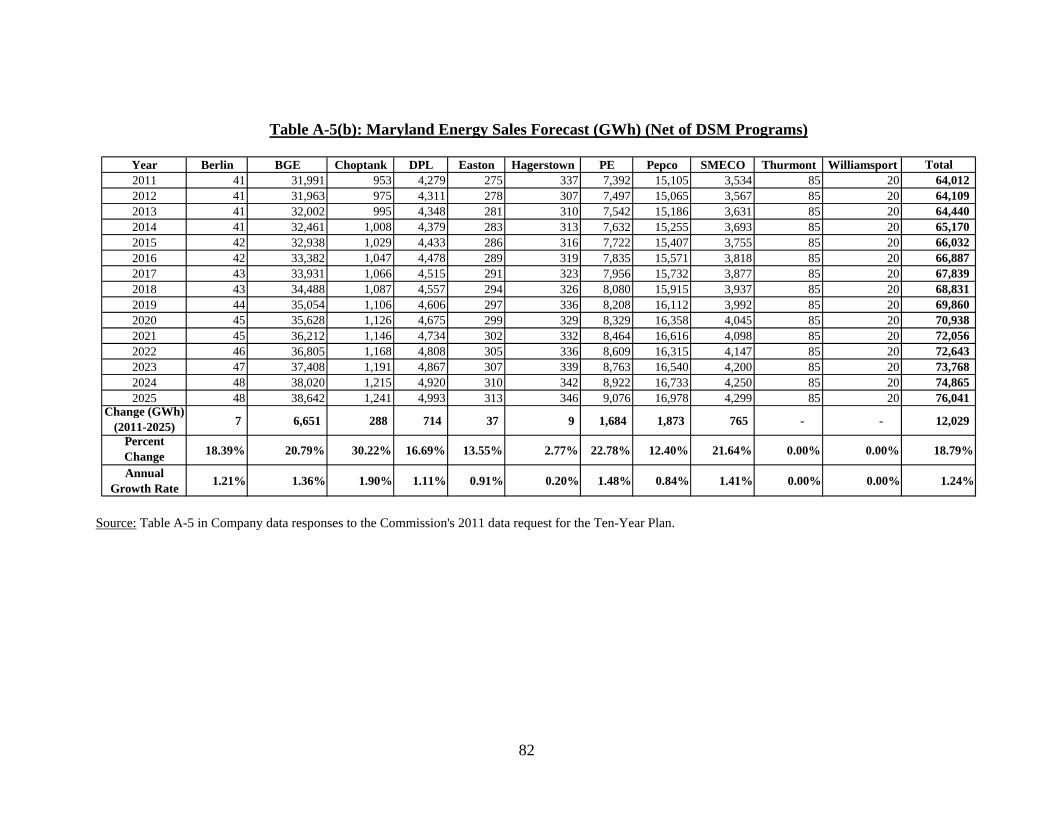
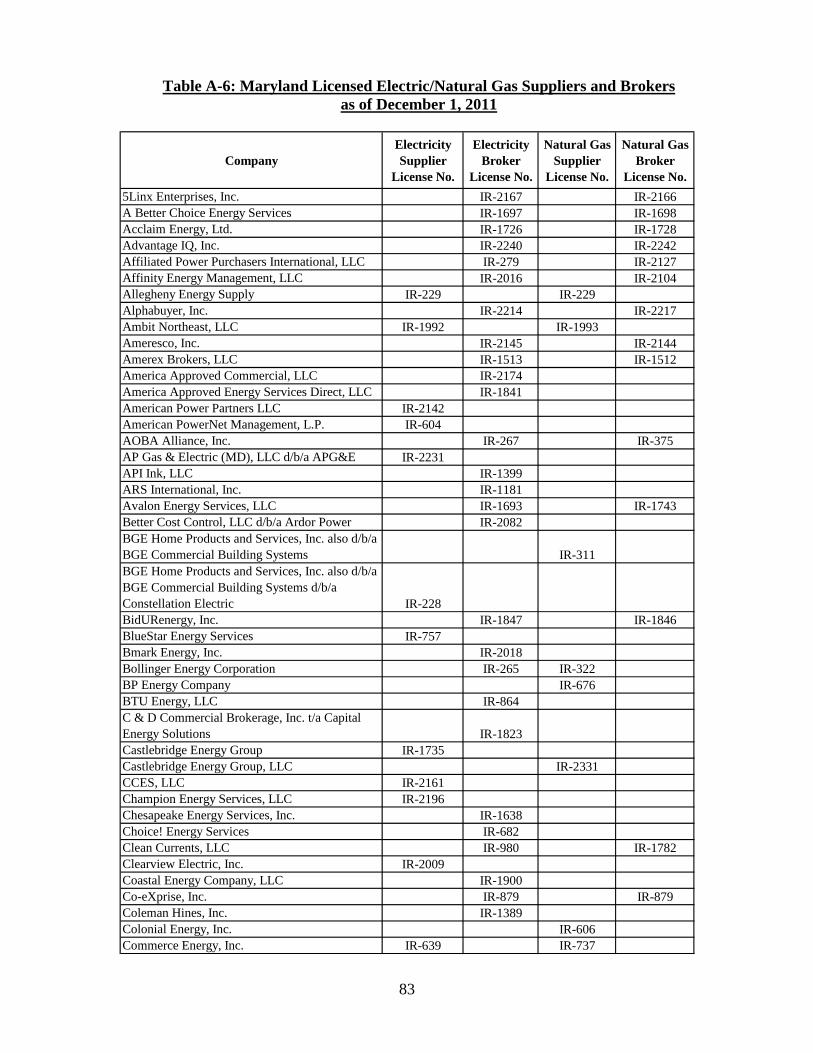
of DSM Programs).................................................................................................... 80 Table A-5(a): System Wide Energy Sales Forecast (GWh) (Net of DSM Programs)...... 81 Table A-5(b): Maryland Energy Sales Forecast (GWh) (Net of DSM Programs) ........... 82 Table A-6: Maryland Licensed Electric/Natural Gas Suppliers and Brokers as of
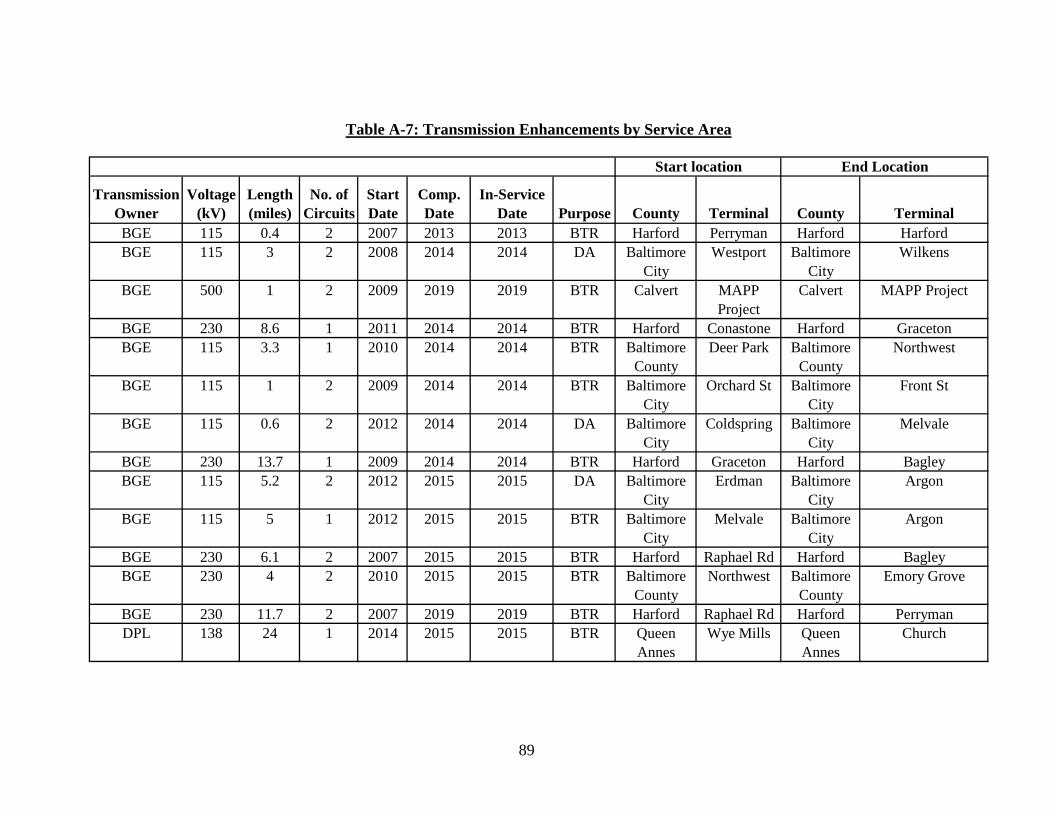
December 1, 2011 ..................................................................................................... 83 Table A-7: Transmission Enhancements by Service Area ............................................... 89 Table A-8: Renewable Projects Providing Capacity and Energy to Maryland Customers
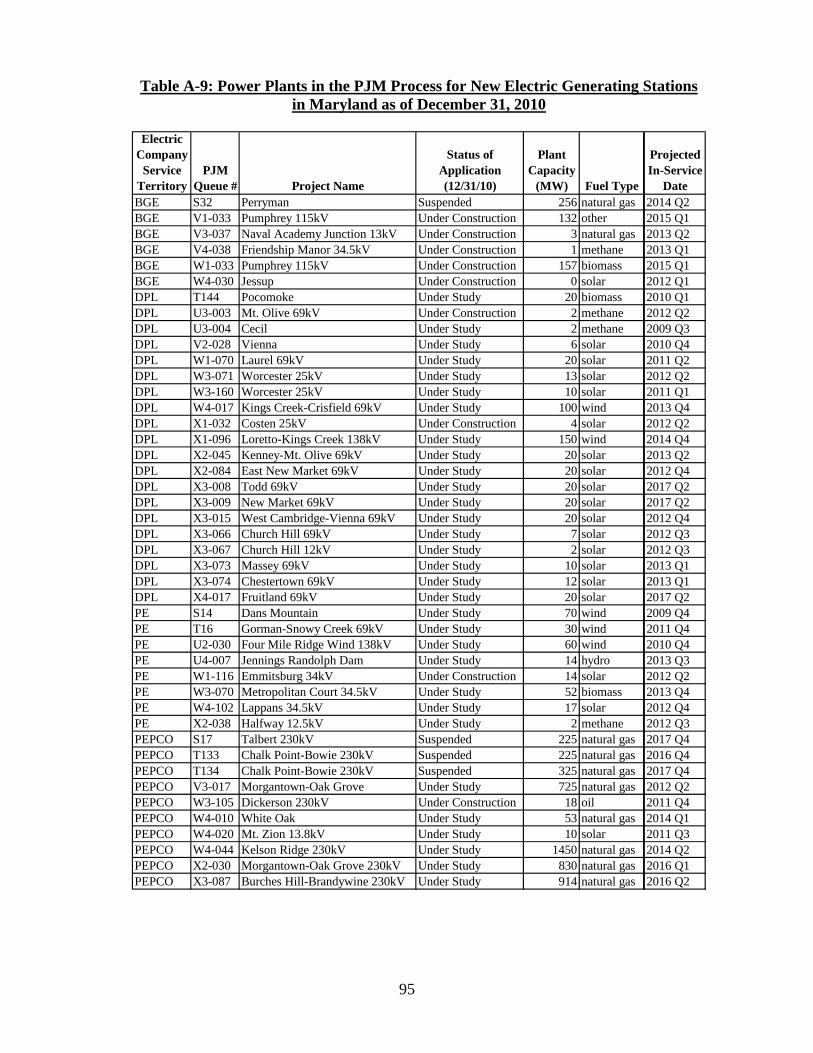
as of December 31, 2010 .......................................................................................... 94 Table A-9: Power Plants in the PJM Process for New Electric Generating Stations in
Maryland as of December 31, 2010.......................................................................... 95
ii
LIST OF MAPS, FIGURES, TABLES, AND CHARTS
Map I.1: Maryland Utilities and their Service Territories in Maryland............................. 2 Figure II.A.1: PJM Maryland Forecast Zones ................................................................... 3 Table II.B.1: Summer Peak Load (MW) Growth Rates .................................................... 4 Table II.B.2: Winter Peak Load (MW) Growth Rates....................................................... 5 Table II.C.1: Comparison of Maryland Peak Demand Forecasts ....................................... 6 Table II.C.2: Comparison of Maryland Energy Sales Forecast .......................................... 6 Table III.A.1: State Electricity Imports (Year 2009) (GWh)............................................. 8 Table III.B.1: Maryland Generating Capacity Profile (Year 2010)................................... 9 Table III.B.2: Maryland Electric Power Generation Profile (Year 2009) ....................... 11 Table III.B.3: Generation by Owner, County, and Capacity (Year 2010)....................... 12 Table III.C.1: PJM Transmission Queue Active New Generating Capacity ................... 15 Table III.D.1: Construction Approvals for CPCN Exempt Generation........................... 17 Table III.D.2: Number and Capacity in MW of CPCN Exempt Generating Units by
Energy Resource ....................................................................................................... 18 Table V.B.1: Utilities’ Incentives to DLC Program Participants .................................... 29 Table V.B.2: Utilities’ Direct Load Program Installations; Program-to-Date as of
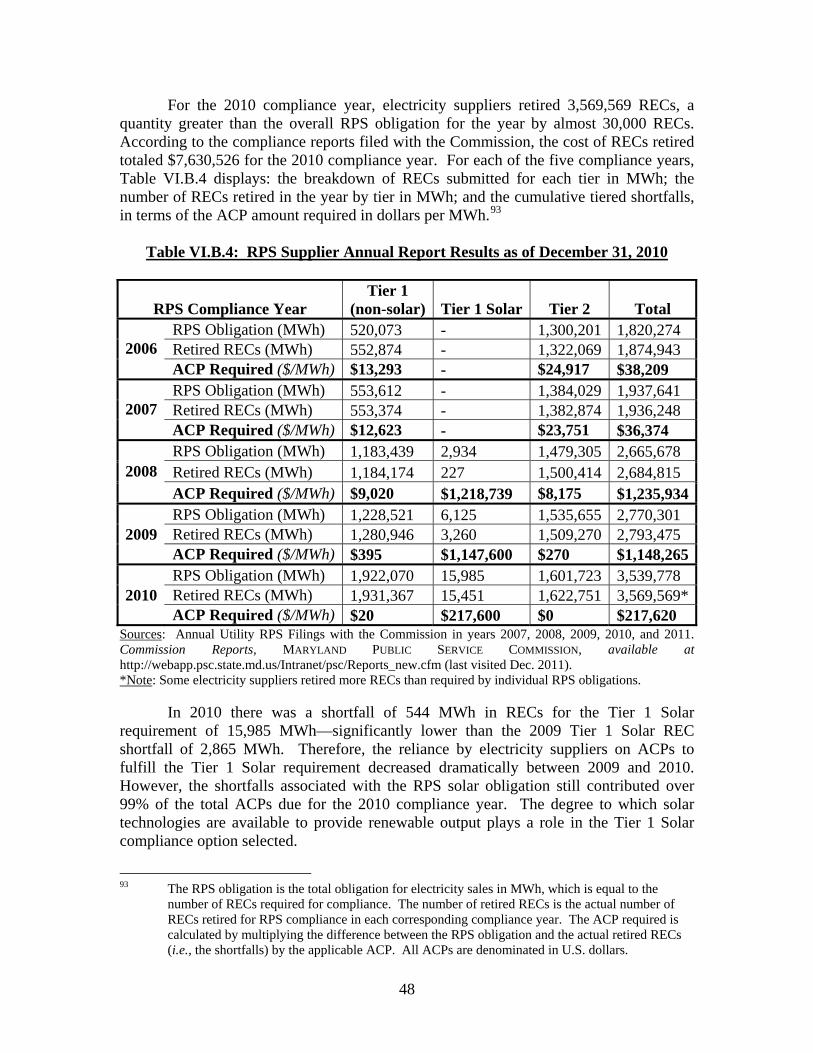
December 31, 2010 ................................................................................................... 30 Table V.B.3: Direct Load Control Program Bids into PJM BRA (MW) ........................ 30 Table V.B.4: Peak Load Reduction Forecast (MW)........................................................ 34 Table VI.A.1: Annual State CO2 Allowance Budgets (2009 – 2014).............................. 43 Table VI.B.1: Eligible Tier 1 and Tier 2 Renewable Resources ..................................... 45 Table VI.B.2: Annual RPS Percentage Requirements by Tier ........................................ 46 Table VI.B.3: RPS Alternative Compliance Fee Schedule ($/MWh) ............................. 47 Table VI.B.4: RPS Supplier Annual Report Results as of December 31, 2010 .............. 48 Chart VI.B.5: Maryland RPS Eligible Capacity by State ................................................ 49 Table VIII.A.1: Residential Customers Enrolled in Retail Supply.................................. 64 Table VIII.A.2: Electric Choice Enrollment in Maryland as of September 30, 2011 ..... 65 Table IX.B.1: Summer 2010 and 2011 Coincident Peaks and Zone LMP...................... 69 Table IX.C.1: RPM “Net Load” Price and Cost .............................................................. 71
iii
LIST OF ACRONYMS AND DEFINITIONS USED ACP Alternative Compliance Penalty AMI Advanced Metering Infrastructure ARR Auction Revenue Right ARRA American Recovery and Reinvestment Act of 2009 BGE Baltimore Gas and Electric Company BRA Base Residual Auction C&I Commercial and Industrial CAIDI Customer Average Interruption Duration Index CETL Capacity Emergency Transfer Limit CETO Capacity Emergency Transfer Objective CIS Customer Information System CO2 Carbon Dioxide CPCN Certificate of Public Convenience and Necessity CSP Curtailment Service Provider DLC Direct Load Control DOE United States Department of Energy DPL Delmarva Power & Light Company DR Demand Response or Demand Resource DSM Demand-Side Management DY Delivery Year EDC Electric Distribution Company EE&C Energy Efficiency and Conservation EFORd Equivalent Demand Forced Outage Rate EIA Energy Information Administration EIPC Eastern Interconnection Planning Collaborative EISA Energy Independence and Security Act of 2007 EISPC Eastern Interconnection State Planning Council ELRP Economic Load Response Program EMAAC Eastern Mid-Atlantic Area Council EMS Energy Management System EM&V Evaluation, Measurement, and Verification EPA United States Environmental Protection Agency ETR Estimated Time of Restoration FERC Federal Energy Regulatory Commission FTR Financial Transmission Right GATS Generation Attributes Tracking System GIS Geographic Information System GW/GWh Gigawatt/Gigawatt-hours HVAC Heating, Ventilation, and Air Conditioning HVCS High Volume Call Service HVDC High Voltage Direct Current IOU Investor-Owned Utility IRM Installed Reserve Margin ISAC Independent State Agency Committee ISO Independent System Operator
iv
IVR Interactive Voice Response kV Kilovolt kW/kWh Kilowatt/Kilowatt-hours LDA Load Deliverability Area LMP Locational Marginal Price LSE Load Serving Entity MAAC Mid-Atlantic Area Council MADRI Mid-Atlantic Distributed Resources Initiative MAPP Mid-Atlantic Power Pathway MDE Maryland Department of the Environment MDS Mobile Dispatch System MEA Maryland Energy Administration MW/MWh Megawatt/Megawatt-hours NERC North American Electric Reliability Council O&M Operation and Maintenance OATT Open Access Transmission Tariff (PJM) OMS Outage Management System OPC Office of People’s Counsel (Maryland) OPSI Organization of PJM States, Inc. PATH Potomac-Appalachian Transmission Highline PE The Potomac Edison Company Pepco Potomac Electric Power Company PJM PJM Interconnection, LLC (Pennsylvania-Jersey-
Maryland) PJM-EIS PJM – Environmental Information Services, Inc PSC/ MD PSC Maryland Public Service Commission PTR Peak-Time Rebate PUA Public Utilities Article, Annotated Code of Maryland REC Renewable Energy Credit RFP Request for Proposal RGGI Regional Greenhouse Gas Initiative RPM Reliability Pricing Model (PJM) RPS Renewable Energy Portfolio Standard RTEP Regional Transmission Expansion Plan RTO Regional Transmission Organization SAIDI System Average Interruption Duration Index SAIFI System Average Interruption Frequency Index SCADA Supervisory Control and Data Acquisition SEIF Maryland Strategic Energy Investment Fund SGIG Smart Grid Investment Grant SMECO Southern Maryland Electric Cooperative, Inc. SOS Standard Offer Service SWMAAC Southwest Mid-Atlantic Area Council TEAC Transmission Expansion Advisory Committee (PJM) TrAIL Trans-Allegheny Interstate Line WMS Work Management System
v
I. INTRODUCTION
Section 7-201 of the Public Utilities Article, Annotated Code of Maryland (“PUA”), requires the Maryland Public Service Commission (“Commission” or “PSC” or “MD PSC”) to forward a Ten-Year Plan of Electric Companies in Maryland (“Ten-Year Plan”) to the Secretary of Natural Resources on an annual basis. This report constitutes that effort for the 2011 – 2020 timeframe and, with exceptions as noted in the text, the referenced data and information is as it existed as of December 31, 2010. It is a compilation of information on long-range plans of Maryland electric utilities. This report also includes summaries of events that have affected or may affect the electric utility industry in Maryland in the near future.
A principal focus of the Commission is the reliability of Maryland’s electricity
supply, delivered at reasonable rates. Achieving reliability is a complex undertaking which requires consideration of factors affecting both supply and demand. To address these elements the Commission is taking action on several fronts: challenging wholesale power policies at the Federal Energy Regulatory Commission (“FERC”); working with the wholesale independent market monitor to effectuate positive market results; evaluating the need for procuring new generation in the State; directing new utility investment in demand response programs to reduce peak electricity demand; evaluating conservation and energy efficiency programs to meet EmPower Maryland peak and overall energy reductions;1 and encouraging better use of emergency generation within the State to promote adequate, economical, and efficient delivery of electricity services.
Section II of this plan addresses the peak demand load forecast for Maryland and
establishes the baseline load requirements for the next ten years. Section III provides information on generation, including certificates of public convenience and necessity (“CPCNs”), and forecasts the availability of generation to meet load requirements. Section IV reviews transmission issues impacting Maryland, including the Department of Energy’s National Interest Electric Transmission Corridors. Section V addresses the options of energy efficiency, conservation, and demand response as part of Maryland’s supply resources, and discusses the effort required to meet EmPower Maryland goals. Proposals to deploy advanced metering infrastructure also are discussed in this section. Because environmental issues continue to play an increasingly important role in energy decisions, Section VI discusses Maryland’s involvement in the Regional Greenhouse Gas Initiative and other issues involving the impact of renewable generation growth. Section VII provides information on distribution reliability, the manner in which utilities have managed outages, and how utilities plan to meet load requirements.
Beginning with Section VIII, we broaden our perspective and review Maryland’s
Electricity Market in general terms and its relation to Commission efforts that are currently underway or anticipated. Section IX discusses PJM Interconnection, LLC
1 See EmPower Maryland Energy Efficiency Act of 2008, codified within MD. CODE ANN., PUB.
UTIL. § 7-211 (2011) (“EmPower Maryland”).
1
(“PJM”)2 and the impact that market rule changes have had both regionally and in Maryland. Section X reviews national issues and the impact generated by FERC rulings and U.S. Department of Energy actions. Also included in the Ten-Year Plan is an Appendix that contains a compilation of data provided by Maryland’s utilities summarizing, among other things, demand and anticipated sales over the next 15 years.
Maryland is geographically divided into thirteen electric utility service territories.
Four of the largest are investor-owned utilities (“IOUs”), four are electric cooperatives (two of which serve only small areas of Maryland), and five are electric municipal operations.3 Table A-1 in the Appendix lists the utilities providing retail electric service in Maryland and Map I.1 below provides a geographic picture of the utilities’ service territories.4
Map I.1: Maryland Utilities and their Service Territories in Maryland
2 PJM is a regional transmission organization that coordinates the movement of wholesale
electricity in all or parts of 13 states and the District of Columbia. 3 The St. Michaels Utilities Commission service territory was transferred to Choptank Electric
Cooperative, Inc. in October 2006. 4 The Potomac Edison Company no longer uses its “doing business name” of “Allegheny Power”
and any references within the Ten-Year Plan to Allegheny Power should be read as referencing Potomac Edison.
2
II. MARYLAND UTILITY AND PJM ZONAL LOAD FORECASTS A. Introduction
The foundation of an analysis for meeting Maryland’s electricity needs starts with a forecast of the anticipated demand over a relevant planning horizon. The Commission routinely evaluates forecasts from individual utilities, as well as the PJM forecast, which provides separate estimates for the transmission zones shown in Figure II.A.1.
Figure II.A.1: PJM Maryland Forecast Zones
Source: PJM Load Forecast Report, PJM PLANNING (Jan. 2011), http://www.pjm.com/planning/resource-adequacy-planning/~/media/documents/reports/2011-pjm-load-report.ashx. PJM sub-regions, known as zones, generally correspond with the IOU service
territories. The PJM zones include adjacent municipal and rural electric cooperatives. The four IOUs operating in Maryland are Baltimore Gas and Electric Company (“BGE”), Potomac Electric Power Company (“Pepco”), Delmarva Power & Light Company (“DPL” or “Delmarva”), and The Potomac Edison Company (“PE”). PJM zones for three of the four IOUs traverse state bounds and extend into other jurisdictions. Pepco, DPL, and PE company data are a subset of the PJM zonal data, since PJM’s zonal forecasts are not limited to Maryland. The BGE zone, alone, resides solely within the State of Maryland.
PJM operates the wholesale power market that includes the entire mid-Atlantic
region and dispatches power plants to serve load on an economic bid basis, subject to transmission capacity availability. PJM’s load forecasts drive the need for generation,
3
which impacts electric consumer prices at the retail level. The Commission closely monitors the development of PJM regional forecasts.
While forecasts can rely on similar economic data, projections of peak demand
and energy usage can vary based upon the underlying assumptions used to generate the forecasts. In general, the expected growth in peak demand and electricity usage is due primarily to expected increases in population and economic activity, which have a direct impact on electricity consumption levels. Key forecast variables include economic and non-economic variables. Economic variables used in forecast models can include gross domestic product, employment, energy prices, and population. Non-economic variables can include weather normalized variables, monthly seasonal variables, ownership of appliances, and building codes.
B. PJM Zonal Forecast PJM’s 2011 Load Forecast Report includes long-term forecasts of peak loads and
net energy for the entire wholesale market region and each PJM sub-region (i.e., zone) – including the four sub-regions in which Maryland resides.5 The 2011 Load Forecast Report concludes that the PJM region will, in aggregate, experience higher peak usage in the summer throughout the forecast period ending 2026.6 Tables II.B.1 and II.B.2 present comparisons in expected growth for the four PJM zones containing Maryland.7 The 2011 Load Forecast is compared to the 2009 and 2010 Load Forecasts on a very broad macro level for the four PJM regions roughly corresponding with the four IOU service territories that serve Maryland. When compared, the 2011 Load Forecast shows significant reductions in both Summer and Winter peak demand growth rates from the previous year’s Load Forecast. The PJM zones containing BGE, DPL, and Pepco experience their peak demands during the summer while the PJM region containing PE experiences peak demands in the winter.8
http://www.pjm.com/committees-and-groups/subcommittees/~/media/documents/reports/2011-pjm-load-report.ashx. The PJM RTO summer peak is forecasted to be 182,904 MW in 2026, a 15-year increase of 28,521 MW. Id.
7 For Maryland, the four PJM regions contain all four of the State’s investor-owned utilities, the five municipal systems, and Maryland’s four rural electric cooperatives. Id.
8 Id.
4
Table II.B.2: Winter Peak Load (MW) Growth Rates
PJM Zone 2009-2019* 2010-2020** 2011-2021*** PE 1.3% 1.3% 1.0%
BGE 1.0% 1.1% 0.8% DPL 1.5% 1.0% 0.8%
Pepco 1.1% 1.2% 1.0% Sources: * PJM Load Forecast Report, January 2009, Tables B-1 and B-2.
** PJM Load Forecast Report, January 2010, Tables B-1 and B-2. ***PJM Load Forecast Report, January 2011, Tablets B-1 and B-2.
C. Maryland Company Forecasts
Maryland’s electric utilities annually submit responses to Commission data requests that include forecasts of peak and annual energy demand. The forecast information provided by each company is summarized in the Appendices as Tables A-4(a) – (d) and Tables A-5(a) – (b). Data requests for the current Ten-Year Plan include responses that expand beyond a ten-year period – from 2011 through 2025. The prior year’s submissions began and terminated one year earlier, that is, from 2010 through 2024. A comparison of the electric utility submissions for the first and last years of the forecast period is provided to indicate, on an aggregate basis, current expectations for peak usage in the State for electricity. The utility forecasts reflect: short-term recessionary impacts, the utilities’ current expectations with regard to nascent demand-side management (“DSM”) and energy efficiency programs, and the expected reductions in energy usage attributable to these programs. Precision and certainty diminish the longer the time period over which a forecast is generated. Comparisons are first presented for the State in aggregate for four common future years: 2011, 2016, 2021, and 2024.9 Additional analysis pertaining to 2011 and the period 2011 through 2021 also are explored.
Table II.C.1 compares Maryland peak demand forecasts on an aggregate basis and includes utility-provided estimates of currently-approved DSM and energy efficiency measures. Actual peak demand in 2011 net of DSM programs compared to the 2010 forecasted peak demand net of DSM programs indicates that peak demand increased by 1.1%. Peak demand forecasts for this Ten-Year Plan period compared to the 2010 – 2019 Ten-Year Plan forecasted peak demand indicate that peak demands are estimated to increase by 0.7% in 2016, 0.7% in 2021, and 0.8% in 2024.10
9 Additional data for the 2011 to 2025 period can be located in Tables A-4 and A-5 of this Ten-Year
Plan Appendix. Corresponding data considering the 2010 to 2024 time period can be located in last year’s Ten-Year Plan Appendix Tables A-5 and A-6.
10 Increases are a comparison strictly to last year’s submissions and not considered on a per capita basis in keeping with the goals of EmPower Maryland.
5
Table II.C.1: Comparison of Maryland Peak Demand Forecasts
(Net of DSM Programs; MW)
2010 - 2019 2011 - 2020 Ten-Year Plan Ten-Year Plan
Sources: Ten-Year Plan (2010-2019) of Electric Companies in Maryland, MD PSC, 6 (Aug. 2011), available at: http://webapp.psc.state.md.us/Intranet/Reports/2010-2019%20Ten%20Year%20Plan.pdf. See Appendix Table A-4(b).
Table II.C.2 compares utility forecasted energy sales within the State of
Maryland. When compared to utility estimates provided last year, the electric utility forecasts, in aggregate, project additional increases in overall annual electricity sales in the State. During the timeframe examined, increases in energy usage trend upward11 between 0.6% and 1.4% when compared to last year’s electric utility submissions.
Table II.C.2: Comparison of Maryland Energy Sales Forecast
Sources: Ten-Year Plan (2010-2019) of Electric Companies in Maryland, MD PSC, 6 (Aug. 2011), available at: http://webapp.psc.state.md.us/Intranet/Reports/2010-2019%20Ten%20Year%20Plan.pdf. See Appendix Table A-5(b).
As reflected in Table II.C.1 and Table II.C.2, utility projections of peak demand
and of annual energy sales are currently moving in similar directions: peak demand is increasing and annual energy sales are increasing when compared to utility estimates provided last year. Historically, peak demand and annual energy sales have moved in tandem.
Numerous changes have occurred or have been proposed to PJM demand
response (“DR”) programs recently. These changes include implementing a more accurate method of measuring and verifying the quantity of demand reductions provided 11 Although the comparison of 2016 forecasted energy sales between the 2010 – 2019 TYP and the
2011 – 2020 TYP indicates a 0.1% reduction, utility data for the 2011 – 2020 TYP reflects an increase in forecasted State energy sales in the aggregate when compared to the 2010 – 2019 TYP forecast. See Appendix Table A-5(b).
6
and proposals to significantly expand both the time period and the seasons during which DR participants must reduce load. The uncertainty associated with such changes leads to less aggressive projections of future DR participation and DSM impacts. III. REGIONAL GENERATION AND SUPPLY ADEQUACY IN MARYLAND A. Introduction
The Commission recognizes that in order to maintain electric system reliability
and an adequate supply of electricity for customers in the future, access to adequate electric capacity must be available to meet customer demand.
A critical requirement for reliable electric service is an appropriate level of
generation and transmission capacity to meet Maryland consumers’ energy needs. While reliability needs may be partially met through local demand side management programs and the import of electricity using high-voltage transmission lines, local generation must be maintained and is essential to keeping the lights on and the power grid operating effectively and economically. All load serving entities in the PJM region are required to ensure they have sufficient capacity contracts to provide reliable electric service during periods of peak demand. As of 2010, Maryland’s net summer generating capacity was approximately 12,516 MW.12 Maryland’s peak demand forecast for 2011 with utility demand-side management and energy conservation measures is approximately 13,786 MW.13 According to PJM’s established margin for necessary reserves, an additional 2,137 MW14 is required and would result in a cumulative estimated reliability requirement of 15,923 MW. Therefore, 3,407 MWs of estimated capacity in the transmission system serves to meet Maryland’s requirements during periods of peak usage in the system.
All major utility systems in the eastern half of the United States and Canada are
interconnected and operate synchronously as part of the Eastern Interconnection. PJM operates, but does not own, the transmission systems in: (1) Maryland; (2) all or part of 12 other states; and (3) the District of Columbia. With FERC approval, PJM undertakes this task in order to coordinate the movement of wholesale electricity and provide access to the transmission grid for utility and non-utility users alike. Within the PJM region, power plants are dispatched to meet load requirements without regard to operating company boundaries. Generally, adjacent utility service territories import or export
12 See Tables III.B.1 and III.B.3. 13 See Appendix Table A-4(b). 14 The example uses an installed reserve margin (“IRM”) of 1.155 for 2010/2011, which is
applicable for planning reserves on a regional basis for the entire pool of PJM resources. IRM establishes a level of installed capacity resources that will provide acceptable reliability levels for the PJM region – and not on an individual state basis – considering demand forecasts, available unforced capacity from existing generation, and the probability that a generating unit will not be available (i.e., Equivalent Demand Forced Outage Rate (“EFORd”)). See PJM, Resource Adequacy Planning, 2009 PJM Reserve Requirements Study, Table I - 1: Historical RRS Parameters, 3, available at: http://www.pjm.com/planning/resource-adequacy-planning/~/media/documents/reports/2009-pjm-reserve-requirement-study.ashx.
wholesale electricity as needed to reduce the total amount of installed capacity required by balancing retail load and generation capacity over a regional, diversified system.
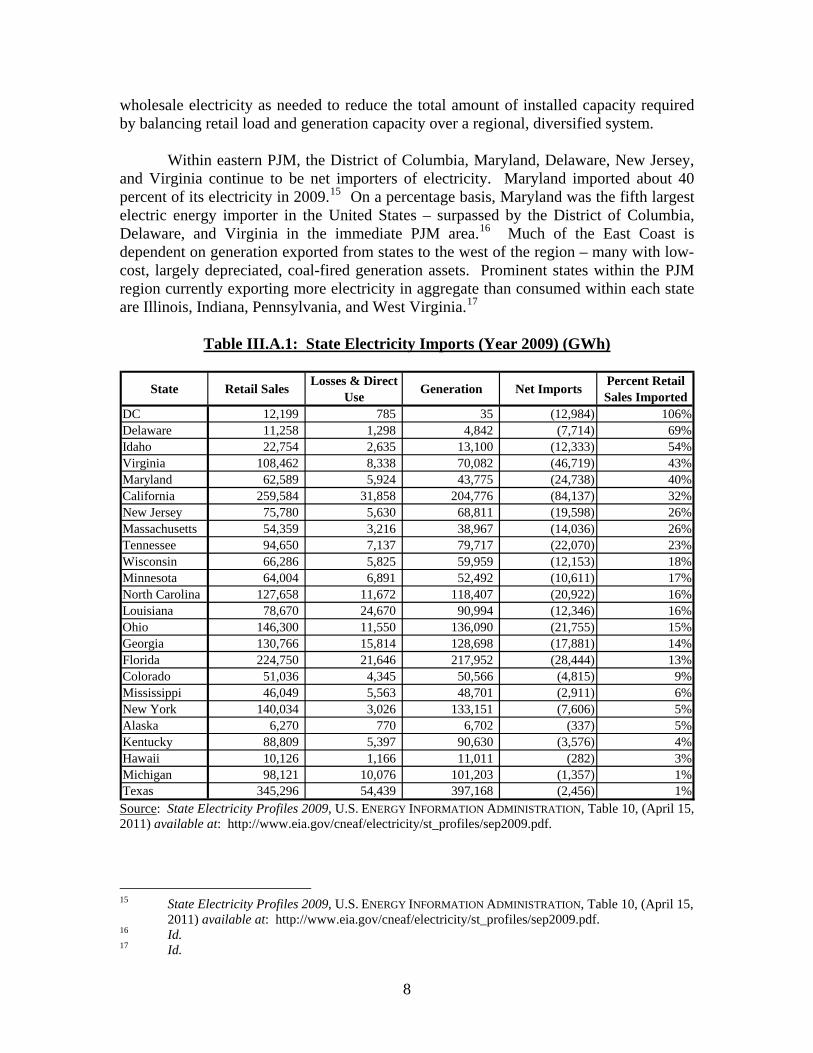
Within eastern PJM, the District of Columbia, Maryland, Delaware, New Jersey,
and Virginia continue to be net importers of electricity. Maryland imported about 40 percent of its electricity in 2009.15 On a percentage basis, Maryland was the fifth largest electric energy importer in the United States – surpassed by the District of Columbia, Delaware, and Virginia in the immediate PJM area.16 Much of the East Coast is dependent on generation exported from states to the west of the region – many with low-cost, largely depreciated, coal-fired generation assets. Prominent states within the PJM region currently exporting more electricity in aggregate than consumed within each state are Illinois, Indiana, Pennsylvania, and West Virginia.17
Table III.A.1: State Electricity Imports (Year 2009) (GWh)
State Retail Sales Losses & Direct
Use Generation Net Imports Percent Retail Sales Imported
15 State Electricity Profiles 2009, U.S. ENERGY INFORMATION ADMINISTRATION, Table 10, (April 15,
2011) available at: http://www.eia.gov/cneaf/electricity/st_profiles/sep2009.pdf. 16 Id. 17 Id.
8
B. Maryland Generation Profile: Age and Fuel Characteristics Most electric generating capacity in Maryland is provided by coal-fired power
plants, which contribute approximately 39 percent of the summer peak capacity available in-State. The vast majority of the State’s coal-fired generation capacity, approximately 70 percent, is provided by power plants thirty-one or more years old. Approximately 41 percent of all capacity in Maryland burns oil or gas as a fuel source, and the majority of these facilities are aging. Overall, approximately 67 percent of Maryland generating capacity has been in operation for over 30 years. As indicated in Table III.B.1, only about 16 percent of the State’s summer generating capacity has been constructed in the past 20 years, and only about 7 percent has been constructed in the last 10 years.
Source: Report EIA-860: “GenY10” Excel, U.S. ENERGY INFORMATION ADMINISTRATION, (Nov. 30, 2011), available at: http://www.eia.gov/cneaf/electricity/page/eia860.html.
In the past few years several older generating units in the eastern PJM region have
requested deactivation. These older generating units are located in Delaware, Pennsylvania, New Jersey, Virginia, and the District of Columbia. These older generation units typically have operated only a limited number of hours each year recently and generate electricity at relatively high marginal costs. However, the units also may be helpful in ensuring reliable electric service in the region. PJM undertakes an analysis to determine the parameters under which units may deactivate or continue to operate.18 The following paragraphs summarize the pending deactivations of generating facilities in the PJM region; several official owner requests for retirement date back to 2007.
In 2007, owners of power plants requested deactivation of units at locations in
D.C.: two Buzzard Point plants with a combined capacity of 240 MW; and two Benning site power plants, 550 MW. The reliability issues have been identified for all units and
2010), available at: http://www.pjm.com/~/media/documents/manuals/m14d.ashx.
9
are expected to be resolved to meet the requested deactivation dates.19 All the units are scheduled for deactivation on May 31, 2012.
In 2009, owners of power plants requested deactivation of units at three locations
in New Jersey and Pennsylvania: two Cromby units (Pennsylvania) with a combined capacity of 345 MW; two Eddystone units (Pennsylvania), 588 MW; and two units at the Kearny (New Jersey) site, 250 MW. On May 31, 2011, one Cromby unit and one Eddystone unit were deactivated20; the remaining four units have requested deactivation dates between May of 2011 and June of 2012. Reliability impacts were identified with the Eddystone unit and with the Cromby unit. The requested deactivation date for the Eddystone unit has been delayed from May 31, 2011 to May 31, 2012, and the requested deactivation date for the Cromby unit has been delayed from May 31, 2011 to December 31, 2011. Additionally, a reliability analysis remains underway for both Kearny units.21
In 2010, owners of power plants requested deactivation of five units that remain
pending: one Kearney unit with a capacity of 21 MW; a Cromby Diesel unit, 2.7 MW; the Ingenco Petersburg plant, 2.9 MW; an Indian River unit, 169.7 MW; and one Sporn unit, 440 MW. The reliability analysis remains underway for the Kearney unit, with a projected deactivation timeline reaching into May of 2015. The reliability analyses were completed for the other four units, and all issues are expected to be resolved to meet the requested deactivation dates.22 Depending on the unit, deactivation is projected between May of 2011 and December of 2013.
In 2011, owners of power plants requested deactivation of nineteen units: two
State Line units with a combined capacity of 515 MW; one Vineland unit, 23 MW; one Viking Energy unit, 16 MW; five Potomac River units, 482 MW; four Chesapeake units, 576 MW; one Yorktown unit, 159 MW; one Bergen unit, 21 MW; one Burlington unit, 21 MW; one National Park unit, 21 MW; one Mercer unit, 115 MW; and one Sewaren unit, 111 MW. The reliability analyses remain underway for the majority of the units, although results are available for both State Line units, the Vineland unit, the Viking Energy unit, and all five Potomac River units. The reliability issues identified in the completed analyses are expected to be resolved to meet the requested deactivation dates.23 Depending on the unit, deactivation is projected between 2012 and 2015.
Several requests for deactivation were filed in the opening months of 2012. One
noteworthy request is an application submitted on January 26, 2012 by FirstEnergy
(formerly Allegheny Power) that references two units located in this State; R. Paul Smith 3 has been in service for 64 years and represents a 28 MW capacity, while R. Paul Smith 4 has been in service for 43 years and represents a capacity of 87 MW. The reliability analysis is underway, and PJM has listed a projected deactivation date of September 1, 2012 for both R. Paul Smith units.24
The Maryland generating profile differs considerably from its capacity profile.
Coal and nuclear facilities generate over 88 percent25 of all electricity produced in Maryland, even though they represent little more than half of in-State capacity.26 In contrast, oil and gas facilities, which tend to operate as mid-merit or peaking units that come on-line only when needed, generate less than 6 percent of the electricity produced by in-State resources, while representing approximately 41 percent of in-State capacity.27 Table III.B.2 summarizes Maryland’s in-State fuel-mix in MWh by generating sources for 2009. In 2009, Maryland plants produced 43,774,832 MWh of electricity.
Table III.B.2: Maryland Electric Power Generation Profile (Year 2009)
Source MWh Share (%)
Coal 24,162,345 55.2 Oil & Gas 2,366,927 5.4 Nuclear 14,550,119 33.2 Hydroelectric 1,888,769 4.3 Other & Renewables 806,671 1.9 Total 43,774,832 100.0 Source: Maryland Electricity Profile, U.S. ENERGY INFORMATION ADMINISTRATION, Table 5, (April 15, 2011), available at: http://www.eia.gov/cneaf/electricity/st_profiles/maryland.html.
The total summer capacity of Maryland generators is approximately 12,516
MW,28 of which approximately 80 percent of the in-State generation capacity is owned by two companies or their subsidiaries: Constellation Energy Group and GenOn Energy, Inc. (“GenOn”). Constellation Energy Group owns about 43 percent of this capacity, and GenOn owns about 37 percent.29 Nearly two-thirds (65 percent) of the State’s power plant capacity resides in one of four counties: Prince George’s, 21 percent; Anne Arundel, 18 percent; Calvert, 14 percent; and Charles, 12 percent. Table III.B.3 lists Maryland generating units by owner, county, and capacity.
24 Id. 25 See Table III.B.2. In 2009 coal facilities generated 55.2% of Maryland’s electricity and nuclear
facilities generated 33.2%, for a total representative of 88.4% of Maryland’s electric power generation profile in 2009. Id.
26 See Table III.B.1. Coal facilities represented 39.04% of the in-State capacity in 2010 while nuclear facilities represented 13.62% of the capacity in 2010. Therefore, coal and nuclear facilities combined for 52.66% of Maryland’s generating capacity profile in 2010. Id.
27 Id. 28 See Table III.B.3. 29 Id.
11
Table III.B.3: Generation by Owner, County, and Capacity (Year 2010)
Operator/Owner Plant Name CountyName Plate Summer Pct. Summer
A & N Electric Smith Island Somerset 1.7 1.6 0.01%AES Warrior Run AES Warrior Run Allegany 229 180 1.44%Allegheny Energy R Paul Smith Washington 109.5 115 0.92%American Sugar Domino Sugar Baltimore City 17.5 17.5 0.14%Town of Berlin Berlin Worcester 9 9 0.07%BP Piney & Deep Creek LLC Deep Creek Garrett 20 18 0.14%Calpine Mid-Atlantic Generation LLC Crisfield Somerset 11.6 10.4 0.08%Constellation Calvert Cliffs Calvert 1828.7 1705Constellation Brandon Shores Anne Arundel 1370 1273Constellation C P Crane Baltimore 415.8 399Constellation Gould Street Baltimore City 103.5 97Constellation Herbert A Wagner Anne Arundel 1058.5 975.9Constellation Notch Cliff Baltimore 144 116.7Constellation Perryman Harford 404.4 353.6Constellation Philadelphia Baltimore City 82.8 60.9Constellation Riverside Baltimore 257.2 228Constellation Westport Baltimore City 121.5 115.8Constellation Solar Maryland, LLC McCormick & Co. Inc. at Belcamp Hartford 1.4 1.4 0.01%Covanta Montgomery, Inc. Montgomery County Resource Recovery Montgomery 67.8 54 0.43%Criterion Power Partners LLC Criterion Wind Project Garrett 70 70 0.56%Eastern Landfill Gas LLC Eastern Landfill Gas LLC Baltimore 3 3 0.02%Easton Utilities Comm Easton Talbot 33.6 31.9Easton Utilities Comm Easton 2 Talbot 38.8 37Energy Recovery Operations, Inc Harford Waste to Energy Facility Harford 1.2 1.1 0.01%Exelon Power Conowingo Harford 506.8 572 4.57%GenOn Chalk Point LLC Chalk Point LLC Prince Georges 2,647 2,347GenOn Mid-Atlantic LLC Morgantown Generating Plant Charles 1,548 1,477GenOn Mid-Atlantic LLC Dickerson Montgomery 930 844Industrial Power Generating Company LLC Wicomico Wicomico 5.4 5.4 0.04%Maryland Environmental Service Eastern Correctional Institute Somerset 5.8 4.6 0.04%NAEA Rock Springs LLC NAEA Rock Springs LLC Cecil 772.6 652 5.21%NewPage Corporation Luke Mill Allegany 65 60 0.48%NRG Vienna Operations Inc Vienna Operations Dorchester 183 170 1.36%Panda-Brandywine LP Panda Brandywine LP Prince Georges 288.8 230 1.84%Power Choice/Pepco Energy Serv NIH Cogeneration Facility Montgomery 22 21.2 0.17%Prince George's County Brown Station Road Plant I Prince Georges 6.7 5.6 0.04%RG Steel LLC RG Steel Sparrows Point, LLC Baltimore 120 152.3 1.22%SCE Engineers Montgomery County Oaks LFGE Plant Montgomery 2.4 2.3 0.02%Solo Cup Co Solo Cup Co Baltimore 11.2 11.2 0.09%Trigen Inner Harbor East, LLC Inner Harbor East Heating Baltimore City 2.1 2.1Trigen-Cinergy Solutions College Park UMCP CHP Plant Prince Georges 27.4 20.8Wheelabrator Environmental Systems Wheelabrator Baltimore Refuse Baltimore City 64.5 61.3 0.49%Worcester County Renewable Energy LLC Worcester County Renewable Energy Worcester 2 2 0.02%
13,611.20 12,515.60 100.00%
0.18%
0.55%
Capacity Statistics (MW)
42.55%
37.30%
Source: Report EIA-860: “GenY10” Excel, U.S. ENERGY INFORMATION ADMINISTRATION, (Nov. 30, 2011), available at: http://38.96.246.204/cneaf/electricity/page/eia860.html.
12
C. Potential Generation Additions in Maryland
Siting for central station generation in Maryland continues to be an important concern. There are reliability, environmental, and competitive issues that must be resolved when finding an appropriate location for a new generator. Generation is largely deregulated and currently the responsibility of independent power producers. Generation companies have proposed various projects, but they are typically either expansions of existing sites or conjoined locations with other industrial or government facilities. Without the financial assurances that were typically available through utility ownership, it has become increasingly difficult for generation companies to secure potential new sites, long-term sales contracts, and the funding necessary to build new generation.
Other sources of generation have benefited from the Commission’s small
generation interconnection rules. Distributed generation from solar facilities and combined heat and power installations are examples of small scale generation. Co-locating smaller generation facilities with other industrial process facilities provides an alternative to increasing central station generation capacity.
However, regardless of the growth in distributed generation, there will still be a
need for central power stations that can be acceptably developed. Areas in or near the State that may be considered for new generation include projects in the Atlantic Ocean, the Nanticoke River area around Vienna on the Lower Eastern Shore, the Calvert Cliffs area in Southern Maryland, various brownfield sites in the Central Maryland area, and wind power sites in the mountains of Western Maryland. Upgrades and additions to existing sites (i.e., brownfield deployment) offer advantages over new, undeveloped greenfield sites with respect to licensing, transmission facilities, and environmental concerns.
Although no significant generation has been constructed in Maryland within the
past few years, the Commission has granted both CPCNs and approvals for construction for those who quality for CPCN exemptions for new generation. Furthermore, no units have been retired recently. The Commission currently has before it several applications for construction of new generation and transmission. When and if constructed, these projects will make available additional electricity for use in Maryland and the PJM region, and should ease congestion substantially.
In 2009, the Commission initiated a new proceeding (Case No. 9214) to consider
proposals for new electric generation facilities in Maryland. On September 29, 2011, the Commission issued a Notice of Approval of Request for Proposals for New Generation to be issued by Maryland Electric Distribution Companies. Attached to that notice was a Request for Proposals inviting interested persons to submit proposals to the Commission to construct new generation facilities that would produce and sell electricity to Maryland’s regulated electric distribution companies. Proposals were due to the Commission January 20, 2012. Additionally, the Commission set for comment whether new generation is needed to meet the long-term anticipated demand in Maryland for
13
standard offer service and other electric supply and if so, the quantity of generation needed. A hearing on the comments was held January 31, 2012.
The status of Commission proceedings covering proposed new electric generator facilities in Maryland (projects ineligible for CPCN exemptions as discussed in Section III.D.) that were active cases in late 2009 through 2011, is as follows :
CN9206: A CPCN application from Constellation Power Source Generation Inc. authorizing the modification of the C.P. Crane generating station for the use of sub-bituminous coal in Baltimore County. Testimony filed January 13, 2010. In-service June 9, 2010.
CN9218: A CPCN application from UniStar, LLC authorizing the modification of the Calvert Cliffs Unit 3 nuclear project for ancillary equipment that will increase air emissions. In-service April 26, 2010.
CN9199: A CPCN Application from Energy Answers International, Inc. to construct a 120 MW Generating Facility in Baltimore using processed waste for fuel. On December 29, 2011, Energy Answers filed a motion to toll its construction deadline contained in the CPCN.
CN9229: A CPCN Application from Mirant for STAR, a processor for flyash at the Morgantown Power Plant in Charles County. In-service November 4, 2010.
In addition to the aforementioned CPCN applications, Maryland is experiencing
an uptick in the amount of solar generation capacity both planned and already available to the State. Section VI.C. details the Commission’s efforts to spur small-scale solar generator interconnection throughout Maryland. On the utility-scale, plans for new solar generation also began taking shape in 2011; Case Number 9272 was opened for the CPCN application of Maryland Solar LLC to construct a 20 MW solar photo-voltaic generating facility in Hagerstown, Maryland. The Commission granted approval on October 8, 2011 for construction of the Hagerstown facility in Order No. 84369. Other notable examples of planned new solar generation include the October 26, 2011 Commission approval for SMECO Solar LLC to construct a Type IV solar generator in Hughesville.30 Additionally, on December 14, 2011, the Commission granted approval to Constellation Solar Holding, LLC to construct a solar photovoltaic generation project located at Mount St. Mary’s University comprising two solar arrays with capacities of 1.25 MW and 250 kW, respectively.31
The number of projects for which a transmission interconnection request (capacity or energy) has been filed with PJM provides an indication of potential generation capacity additions in Maryland. Table III.C.1 lists the new generation projects located in Maryland for which a transmission interconnection request has been made to PJM and that are categorized as under study, under construction, providing partial service, or
30 The Commission granted approval of SMECO Solar LLC’s application for an exemption of the
CPCN requirement. Letter Order, Maillog No. 134380. 31 The Commission granted approval of Constellation Solar Holding, LLC’s application for an
exemption of the CPCN requirement. Letter Order, Maillog No. 135780.
14
currently suspended. The Table demonstrates the diversity of projects being pursued throughout the State. The vast majority (about 89%) of proposed new generation capacity would be located within the Southern Maryland Electric Cooperative, Inc. (“SMECO”) and Pepco service territories, and would use primarily natural gas or nuclear fuel. Additional generation capacity, especially from renewable sources, has been proposed for the DPL and PE service territories.
Table III.C.1: PJM Transmission Queue Active New Generating Capacity
Pursuant to Public Utilities Article § 7-207.1, certain power generating stations
are exempt from the requirement to obtain a CPCN, subject to Commission approval, prior to commencing construction of the generating station. These approvals are available to generating stations that are designed to provide on-site generated electricity and that meet the following qualifications:32
1. The capacity of the generating station does not exceed 70 MW; and 2. The electricity that may be exported for sale from the generating station to
the electric system is sold only on the wholesale market pursuant to an interconnection, operation, and maintenance agreement with the local electric company.33
32 PUA § 1-101(s) defines “On-site generated electricity” as electricity that: (1) is not transmitted or
distributed over an electric company’s transmission or distribution system; or (2) is generated at a facility owned or operated by an electric customer or operated by a designee of the owner who, with the other tenants of the facility, consumes at least 80% of the power generated by the facility each year.
33 The Statute also provides for an exemption from the CPCN process for a generating station that does not exceed 25 MW if electricity that may be exported for sale from the generating station to the electric system is sold only on the wholesale market pursuant to an interconnection, operation, and maintenance agreement with the local electric company, and at least 10% of the electricity generated at the generating station each year must be consumed on-site. MD. CODE ANN., PUB. UTIL. § 7-207.1 (2011).
15
For wind-powered generating stations with a capacity up to 70 MW, there are two additional qualifications that must be met in order to be granted approval without obtaining a CPCN. The first is that the generating station must be land-based; therefore, any off-shore facility within State waters will be required to obtain a CPCN. The second qualification is that the Commission must provide an opportunity for public comment at a public hearing.
The Commission’s PUA § 7-207.1- approved application requires the applicant to
select one of four specific types of generating stations: Type I, Type II, Type III, or Type IV. With the exception of Type I, all generators are required to obtain an Interconnection, Operation, and Maintenance Agreement (“Interconnection Agreement”) with the local Electric Distribution Company (“EDC”). Type I generators must obtain a letter from the local EDC that states an Interconnection Agreement is not necessary.
A Type I generator is not synchronized with the local electric company’s
transmission and distribution system and will not export electricity to the electric system.34 An emergency or back-up generator is the most common Type I generator. A Type II generator is synchronized with the electric system; however, it will not export electricity to the electric system. Generators used for peak-load shaving or generators participating in a demand response program are the most common form of Type II generators. Type III generators are synchronized with the electric system and export electricity for sale on the wholesale market. A Type IV generator is a generator that is synchronized with the electric system, but utilizes the disconnect feature of an inverter to prevent export of power in the event of a power failure on the utility’s grid.
In order to obtain approval to construct a generator under PUA § 7-207.1, an
applicant must submit a completed application. In addition, the generator will need a wholesale sales agreement with PJM if the generator is selling electricity on the wholesale market. It is important to note that the approval does not exempt an applicant from complying with other regulations or from obtaining all other necessary State and local permits, such as those required by the Air and Radiation Management Administration at the Maryland Department of the Environment (“MDE”).
Table III.D.1 provides an overview of the number and capacity of generators that
have applied for PUA § 7-207.1 approvals on an annual basis. The number of applications has generally been increasing over time, and these generators have a cumulative generation capacity of over 1,300 MW.
34 PUA § 1-101(h) defines “Electric company,” with certain exclusions, as a person who physically
transmits or distributes electricity in the State to a retail electric customer.
16
Table III.D.1: Construction Approvals for CPCN Exempt Generation
Period Approved Applications No. of Units Total (MW) Calendar Year 2001 4 7 35.4 Calendar Year 2002 9 26 68.3 Calendar Year 2003 21 29 43.4 Calendar Year 2004 36 58 77.1 Calendar Year 2005 36 70 94.4 Calendar Year 2006 31 55 91.4 Calendar Year 2007 40 62 67.3 Calendar Year 2008 72 130 212.1 Calendar Year 2009 102 153 269.2 Calendar Year 2010 101 152 167.2 Calendar Year 2011 78 138 188.6 Total 530 880 1314.4 Pending 10 16 16.0 Total (Including Pending) 540 896 1330.4
Source: PSC database. Note: 2011 data is current as of October 31, 2011. Each application may contain multiple generation units.
Table III.D.2 reflects that fossil fuel generators were 92.6% of the 896 generator
units reported. These fossil fuel generators provided 1070.0 MW (80.4%) of the total 1330.4 MW of generating capacity reported. Oil remained the dominant fuel source for new generators. Oil-fired generators were 930.1 MW (69.9%) of the total generation reported. Wind-powered units provided 189.6 MW (14.3%) of total CPCN exempt capacity. Solar-powered units provided 44.7 MW (3.4%) of total CPCN exempt capacity.
17
Table III.D.2: Number and Capacity in MW of CPCN Exempt Generating Units by Energy Resource
Energy Resource Total
Approved
Percent of Total
Approved GENERATOR UNITS
Oil 790 88.2% Natural Gas 38 4.2%
Foss
il
Propane 2 0.2% Fossil Total 830 92.6%
Biomass 1 0.1% Digester Gas 3 0.3% Landfill Gas 3 0.3% Solar 56 6.3%
Ren
ewab
le
Wind 3 0.3% Renewable Total 66 7.4% Grand Total 896 100.0%
CAPACITY (MW) Oil 930.1 69.9% Natural Gas 139.8 10.5%
Foss
il
Propane 0.2 0.0% Fossil Total 1070.0 80.4%
Biomass 19.8 1.5% Digester Gas 3.2 0.2% Landfill Gas 3.1 0.2% Solar 44.7 3.4%
Ren
ewab
le
Wind 189.6 14.3% Renewable Total 260.3 19.6% Grand Total 1330.4 100.0%
Source: PSC database. Note: Data is current as of November 1, 2011.
18
IV. TRANSMISSION INFRASTRUCTURE: PJM, MARYLAND, AND NATIONAL
A. Introduction Transmission facilities in PJM and Maryland have continued to play a key role in energy supply. With Maryland’s dependence on energy imports, it is necessary that adequate transmission facilities be available to reliably provide electricity supplies. While all network systems can experience congestion at times, portions of the Mid-Atlantic States -- including central Maryland and the Delmarva Peninsula -- have continued to experience significantly higher levels of congestion than the rest of PJM. This, in turn, has led to higher energy and capacity costs in portions of Maryland and the surrounding states since local, but more expensive, generation resources had to be deployed to meet load. Adequate capacity and reliable supplies of electricity are continually monitored, managed, and, when necessary, supplemented with additional infrastructure. B. Eastern Interconnection Planning Collaborative
During 2011, the Eastern Interconnection Planning Collaborative (“EIPC”) completed the first phase of its work identifying a broad range of alternative futures to be analyzed by a production cost model. Eight futures were modeled under varying assumptions. The futures modeled were:
1. Business as Usual – This Future continues today’s policies.
2. National Carbon Policy/National Implementation – This Future envisions a national Carbon Emission Mitigation policy to be fulfilled by constructing no/low carbon – emitting energy generation facilities in the most productive generation resource areas and building transmission to connect those generation facilities to customers in the Eastern Interconnection.
3. National Carbon Policy/Regional Implementation – This Future concentrates on fulfilling a national Carbon Emission Mitigation Policy by constructing generation and transmission within each region to serve the customers within that region.
4. High Energy Efficiency/Demand Response/Distributed Generation/Smart Grid – This Future focuses on developing local programs to avoid the need for large generation and transmission construction.
5. National RPS/National Implementation – Imposes a 30% Renewable Portfolio Standard which may be fulfilled by importing renewable from the areas of the Eastern Interconnection with the highest renewable energy resource potential.
6. National RPS/Regional Implementation – The RPS is assumed to be fulfilled using renewable energy resource potential within each region of the Eastern Interconnection.
19
7. Nuclear Resurgence – This Future looks at incenting the construction of nuclear technologies as an option on other generation technologies.
8. National Carbon Policy/National Implementation with high Efficiency/Demand Response – This Future combines Future Nos. 2 and 4.
The results from these modeling runs, which include what type of generation is built, where it will be located, how much is needed, and at what cost, can be found at www.eipconline.com. Next, EIPC identified three future scenarios for which a complete transmission build-out will be designed. This exercise will provide an estimate of the transmission costs associated with each scenario. The results of the transmission build-out should be available in early 2012.
C. The Regional Transmission Expansion Planning Protocol Planning the enhancement and expansion of transmission capability on a regional basis is one of the primary functions of the wholesale market operator, PJM. PJM implements this function pursuant to the Regional Transmission Expansion Planning Protocol set forth in Schedule 6 of the PJM Operating Agreement.
PJM annually develops the Regional Transmission Expansion Plan (“RTEP”) to
meet system enhancement requirements for new backbone transmission lines and interconnection requests for new generation. To establish a starting point for development, PJM performs a “baseline” analysis of system adequacy and security. The baseline is used for conducting feasibility studies on behalf of all proposed generation and transmission projects. Subsequent System Impact Studies for those potentially viable projects provide recommendations that become part of the RTEP Report.
PJM’s RTEP looks at a 15-year projection of the grid to predict reliability
problems. The system is planned for the probability of loss of load to be one day in ten years. Single contingency analysis allows for the grid to function with the loss of any one line. In some cases, double contingency analysis is used. PJM’s 15-year planning horizon process has predicted that the congestion on the eastern and western interfaces may cause both load deliverability and generator deliverability issues in central Maryland.35 Deliverability issues can be a result of significant load growth and the retirement of existing generation.36 Ideally, these problems can be solved with a combination of new generation, transmission projects, and demand response.
The RTEP process applies reliability criteria over a 15-year horizon to identify
transmission constraints and reliability concerns. PJM uses CETO/CETL37 analysis to determine the import capabilities of the transmission system to supply the peak load requirements for sub-regions within PJM. There are currently 23 sub-regions or load 35 The central Maryland region of the Mid-Atlantic area generally includes northern Virginia and the
Baltimore/Washington region. 36 Generation slated for retirement includes Benning Road, Buzzard Point, Potomac River, and Gude
Landfill in Washington, DC; and Indian River on the Eastern Shore. 37 Capacity Emergency Transfer Objective/ Capacity Emergency Transfer Limit.
20
deliverability areas (“LDAs”) in PJM. The Transmission Expansion Advisory Committee (“TEAC”) is the primary forum for stakeholders to discuss the RTEP results. The Commission is an active participant in the RTEP and regularly attends the TEAC meetings.
1. Baseline Reliability Assessment
PJM establishes a baseline from which the need and responsibility for
transmission system enhancements can be determined. PJM performs a comprehensive load flow analysis of the ability of the grid to meet reliability standards, taking into account forecasted loads, imports and exports to neighboring systems, existing generation and transmission assets, and anticipated new generation and generation retirements. The baseline reliability assessment identifies areas where the planned system is not in compliance with standards required by the North American Electric Reliability Corporation (“NERC”)38 and the regional reliability councils. The baseline assessment develops and recommends enhancement plans to achieve compliance. 2. Inter-regional Planning
PJM is engaged in planning processes that address issues of mutual concern to
PJM and neighboring transmission grid systems: the Midwest Independent System Operator (“ISO”); ISO New England; the New York ISO; the Tennessee Valley Authority; and the North Carolina Planning Collaborative (added in 2009). The Inter-regional Planning Stakeholder Advisory Committee facilitates stakeholder review and input into the Coordinated System Plan. Coordinated regional transmission expansion planning across seams is expected to reduce congestion on an inter-Regional Transmission Organization (“RTO”) basis, and enhance the physical and economic efficiencies of congestion management. Inter-regional ties are a benefit for reliability, especially when load centers peak at different times (referred to as “load diversity”). This kind of forum has been important for addressing problems such as loop flows around Lake Erie.
3. Obligation to Build RTEP Projects
PJM’s Transmission Owners’ Agreement obligates transmission owners to
proceed with building transmission projects that are needed to maintain reliability
38 Since 1968, NERC has been committed to ensuring the reliability of the bulk power system in
North America. To achieve that goal, NERC develops and enforces reliability standards; assesses adequacy annually via a 10-year forecast and winter and summer forecasts; monitors the bulk power system; audits owners, operators, and users for preparedness; and educates, trains, and certifies industry personnel. NERC is a self-regulatory organization, subject to oversight by FERC. As of June 18, 2007, FERC granted NERC the legal authority to enforce reliability standards with all U.S users, owners, and operators of the bulk power system, and made compliance with those standards mandatory and enforceable. NERC's status as a self-regulatory organization means that it is a non-government organization which has statutory responsibility to regulate bulk power system users, owners, and operators through the adoption and enforcement of standards for fair, ethical, and efficient practices.
21
standards as approved by the PJM Board of Directors. Transmission owners can voluntarily build these projects, or PJM can file with FERC to request FERC to order the project to be built. In Maryland, CPCNs are required for transmission lines above 69,000 volts or modifications to existing facilities.
4. PJM’s Authority
FERC approved PJM as an Independent System Operator in 1997. Since that
time, PJM has administered its RTEP as described in Schedule 6 of the Operating Agreement. PJM has subsequently received authority from FERC for procedures and rules for transmission expansions needed to enable the interconnection of new and expanded generation and merchant transmission facilities. PJM has amended the RTEP to include the development of transmission projects to support competition in wholesale electric markets, allowing it to justify projects for economic reasons as well as reliability.
PJM received final FERC approval as an RTO in 2002. As an RTO, PJM is the
administrator of the Open Access Transmission Tariff (“OATT”) as approved by FERC. The OATT is the basis for PJM to collect charges to recover the costs of projects owned, constructed, or financed by the transmission owners. Transmission owners file rate schedules with FERC to recover transmission investments made pursuant to the RTEPs approved by the PJM Board. The OATT enables generation to be sold anywhere in the system.
D. Transmission Congestion in Maryland 1. PJM’s Definition of Congestion
PJM’s Locational Marginal Pricing (“LMP”) system takes account of congestion
in determining electricity prices. It reflects the value of the energy at the specific location and time it is delivered. Theoretically, if the lowest-priced electricity could simultaneously be distributed across the entire 13 states and the District of Columbia (thereby encompassing the entire PJM wholesale market), prices would be the same across the entire PJM grid. However, the capital investments that would be required for such an expansive transmission system would be cost prohibitive. Therefore, more expensive but advantageously located power plants that generate electricity are required to meet the demand. As a result, LMPs are higher in the congested areas and lower at the source of cheaper power. Congestion costs vary significantly during the course of a day, seasonally, and from year to year. Persistent patterns of high LMPs can indicate future reliability problems and the need for new generation, new transmission, and/or demand response.
2. Location of Congestion
In 2010, the PE South interface continued to be the largest contributor to congestion costs for the third consecutive year. This one constraint’s costs were nearly
22
double the sum of all remaining constraint costs. The PE South interface continues to be the primary west-to-east transfer constraint.39
3. Costs of Congestion
Congestion reflects the underlying characteristics of the power system, including
the nature and capability of transmission facilities and the cost and geographical distribution of generation facilities. Total PJM congestion costs increased by $709.1 million (or 99%) from $719 million in calendar year 2009 to $1,428 billion in calendar year 2010. Maryland utilities shared in these increased congestion costs.
Zone
2010 Total Annual Zonal Congestion Costs ($ million) 40
2009 Total Annual Zonal Congestion Costs ($ million) 41
Allegheny Power (Potomac Edison) 282.7 95.3 Baltimore Gas and Electric 91.6 33.5 Delmarva Power 47.2 31.1 Potomac Electric Power 98 58.4
Wholesale prices for electricity are determined in PJM’s Reliability Pricing
Model (“RPM”) Base Residual Auctions (“BRAs”). Blocks of capacity are sold regionally for future delivery. The data below summarizes the annual capacity price for Maryland in 2014/2015 compared to the 2013/2014 delivery year.42
Zone 2014/2015 $/MW-Day
2013/2014 $/MW-Day
Western Maryland (PE) 125.94 27.73 Central Maryland (BGE) 136.50 226.15 Central Maryland (PEPCO) 136.50 247.14 Delmarva (DPL) 136.50 245.00 Delmarva South 136.50 245.00
Transmission expansion for the bulk electric system can act to reduce the
differences from zone to zone and support reliability requirements and economic concerns. 39 Data for 2010. The zones for Allegheny (Potomac Edison), DPL, and Pepco include territory
outside of Maryland (Delaware, District of Columbia, Pennsylvania, New Jersey, West Virginia, Virginia). Monitoring Analytics, LLC, 2010 State of the Market Report for PJM, Table 7-13 (March 10, 2011), available at: http://www.monitoringanalytics.com/reports/PJM_State_of_the_Market/2010.shtml.
40 Id. at Table 7-19. 41 Data for 2009. The zones for Allegheny (Potomac Edison), DPL, and Pepco include territory
outside of Maryland (Delaware, District of Columbia, Pennsylvania, New Jersey, West Virginia, Virginia). Monitoring Analytics, LLC, 2009 State of the Market Report for PJM, Table 7-17 (March 11, 2010), available at: http://monitoringanalytics.com/reports/PJM _State_of_the_Market/2009.shtml.
Financial Transmission Rights (“FTRs”) and Auction Revenue Rights (“ARRs”) give transmission service customers and PJM members an offset against congestion costs in the Day-Ahead Energy Market. An FTR provides the holder with revenues, or charges, equal to the difference in congestion prices in the Day-Ahead Energy market across the specific FTR transmission path. An ARR provides the holder with revenues, or charges, based on the price differences across the specific ARR transmission path that results from the annual FTR auction. In PJM, FTRs have been available to network service and long-term, firm, point-to-point transmission service customers as a hedge against congestion costs since the inception of locational marginal pricing on April 1, 1998. FTRs became available to all transmission service customers and other PJM members with the introduction of the annual FTR auction effective June 1, 2003.
In the 2009 to 2010 planning period, all ARRs and FTRs hedged more than 96.2%
of the congestion costs within PJM. During the first seven months of the 2010 to 2011 planning period, total ARR and FTR revenues hedged 78.7% of the congestion costs within PJM.43, 44 For the planning period 2009 to 2010, Potomac Edison and BGE were hedged at greater than 100%, DPL at 55.2%, and Pepco at 19.7%.
Congestion of the electricity transmission grid continues to affect the
Baltimore/Washington area and to warrant attention. During the summer of 2010 overall congestion rose by 99%, yet was still lower than congestion costs of 2005. This has resulted primarily from reduced demand and the absence of significant generation or transmission outages. The PJM metered peaks increased for 2010, but 2008 and 2009 were lower than the peaks in 2007 and 2006. This was due to the relatively mild weather, the slowing economy, and increased diversity (non-coincident regional peaks).
For the 2014/2015 capacity auction, PJM announced an increase from the prior 2013/2014 auction in cleared Demand Resources of 4836.5 MW (or 52.1%).
E. High Voltage Transmission Lines in PJM
PJM’s 2010 Regional Transmission Expansion Plan was not published until February 2011. However, the PJM Board approved over 400 individual bulk electric system upgrades in 2010. Determined via PJM’s RTEP process, the upgrades are required to support reliable electricity flows and ensure the power supply system meets national standards through 2024. The PJM Board has approved more then $19.022 billion of bulk electric system upgrades since the inception of the RTEP process in 1997, ensuring that PJM is compliant with NERC reliability criteria.
43 The ARR and FTR revenue adequacy results are aggregate results and all those paying congestion
charges were not necessarily hedged. Aggregate numbers do not reveal the underlying distribution of FTR holders, their revenues, or those paying congestion premiums. The FTR markets can be risky and have resulted in defaults for some participants. Financial entities own about 77% of all Monthly Balance of Planning Period FTRs.
44 PJM Financial Transmission and Revenue Rights: 2010 State of the Market Report for PJM (March 10, 2011), available at: http://www.monitoringanalytics.com/reports/PJM_State_of_the_Market/2009/2009-som-pjm-volume2-sec8.pdf.
24
The deep recession experienced by the country, which began in 2008, continues to
have a substantial impact on PJM’s RTEP. Load growth is a fundamental driver of resource adequacy and transmission expansion plans. The slow economic recovery has caused PJM to dramatically adjust its backbone transmission line project plans. In particular, the 2011 load forecast issued in January 2011 forecasts significantly lower load growth in the near term than in previous forecasts. Projects of interest to Maryland which have been affected include:
• Potomac-Appalachian Transmission Highline (“PATH”) is a 765-kV transmission
line that would extend 300 miles from the Amos Substation (Charleston, WV) to the Kemptown Substation in Frederick County, Maryland. This project was docketed as Case No. 9233. Although included in the 2010 RTEP as a baseline transmission project, in an RTEP update for events since December 2010, PJM stated, “Preliminary 2011 PJM RTEP process analysis suggests that the need for the PATH line has moved several years into the future beyond 2015. This has led the PJM Board to direct owners to suspend efforts on the PATH line pending a more complete analysis in the 2011 RTEP.” PJM 2010 RTEP 2/28/2010, p. 1.
• Mid-Atlantic Power Pathway (“MAPP”) is a 500-kV line that would connect the
Possum Point Substation in Virginia and the generation plants in southern Maryland to Vienna and then to Indian River on the Delmarva Peninsula. The portion under the Chesapeake Bay will be a submarine high-voltage direct current line (“HVDC”). This project is docketed as Case No. 9179 at the MD PSC. On Friday August 19, 2011 PHI announced that the new transmission line will be delayed, suggesting that the new in-service date could be between 2019 and 2021.
• Trans-Allegheny Interstate Line (“TrAIL”), 502 Junction to Loudon. Construction was completed on TrAIL in 2011, and its in-service date was June 2011. This 500 kV transmission line runs from near the border of Pennsylvania and West Virginia to northern Virginia.
• Susquehanna to Roseland is a 500-kV line, approximately 130 miles from
northern Pennsylvania to northern New Jersey. Although its in-service date technically remains 2012, permitting difficulties will delay this project.
The PJM RTEP requires that cost responsibility for transmission enhancements be
established. The cost of transmission facilities in PJM that operate at a voltage of 500 kV and above are currently socialized across all PJM load. The backbone projects listed above have secured incentive rate adders from FERC.45 To make this determination,
45 For the MAPP project, FERC granted Pepco a 12.8% return on equity (including incentives), and
no rehearing was sought; as well, FERC granted BGE a 12.8% return on equity (including incentives), and denied rehearing. The TrAIL project settled for a 12.7% return on equity (including incentives). FERC granted PATH a 14.3% return on equity (including incentives); however, rehearing remains pending.
25
FERC requires the applicant to satisfy its nexus test (non-routine project with advanced technology) and address the rebuttable presumption standard (a project required by PJM).
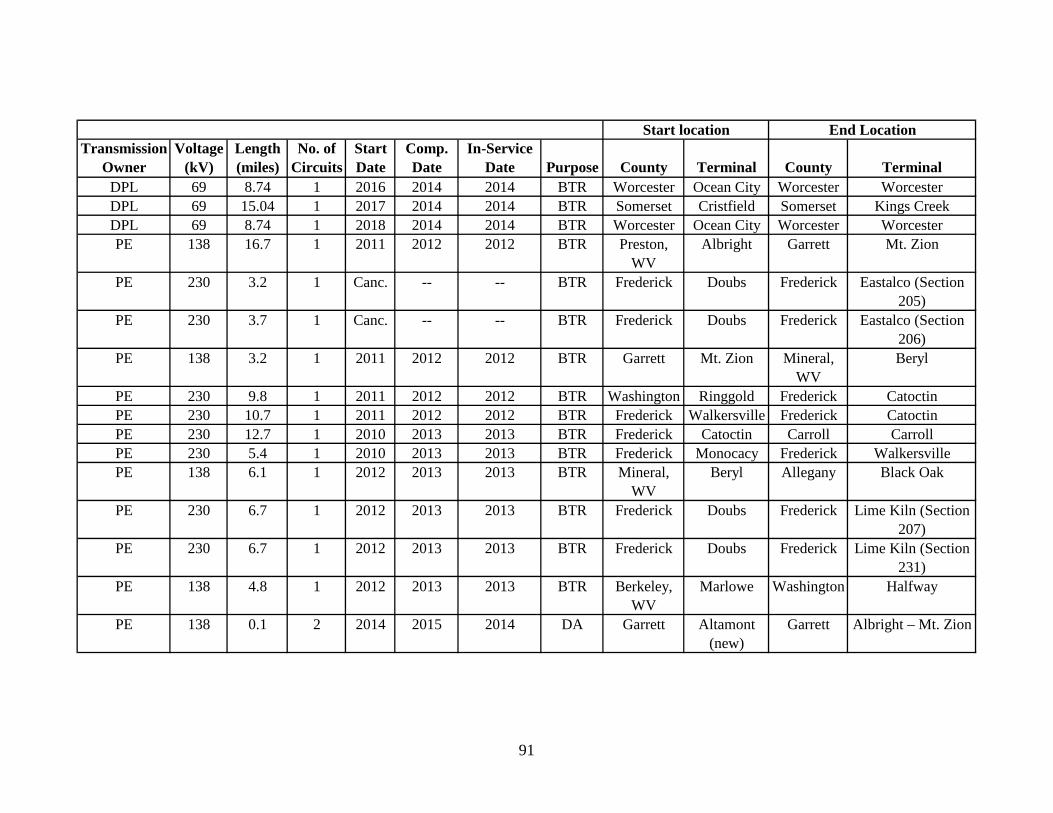
Transmission projects not highlighted above but identified by the transmission
owners are listed in Table A-7 of the Ten-Year Plan for Maryland. For instance, the Southern Maryland Electric Cooperative is continuing with plans for its 230 kV loop in Southern Maryland. V. DEMAND RESPONSE AND CONSERVATION AND ENERGY EFFICIENCY The Commission recognizes the potential of demand-side management ("DSM") as a powerful tool to bolster energy efficiency and conservation efforts in our State. Furthermore, DSM supports system reliability, energy security, energy and capacity price mitigation (i.e., reducing overall energy costs), and enhanced energy market competitiveness, and limits environmental impacts. The Commission encourages energy service providers to offer DSM programs to customers where appropriate. Distribution companies have been tasked with providing cost-effective DSM programs, particularly for mass market residential and small commercial customers. As part of EmPower Maryland,46 the Commission has required the utilities to implement aggressive and cost-effective demand management and energy conservation programs.
A. Statutory Requirements Recognizing energy efficiency as one of the least expensive ways to meet
growing electricity demands in the State, the EmPower Maryland Energy Efficiency Act (“Act”) was enacted on April 24, 2008. By statute, each utility47 is required to develop and implement cost-effective programs and services that encourage and promote the efficient use and conservation of energy by consumers and utilities alike. EmPower Maryland also establishes long-term reduction goals for electric consumption and demand, based on a per capita and 2007 energy consumption baseline. The Act specifically states at § 7-211(g)(1) and (2):
(1) To the extent that the Commission determines that cost-effective energy efficiency and conservation programs and services are available, for each affected class, require each electric company to procure or provide for its electricity customers cost-effective energy efficiency and conservation measures programs and services with projected and verifiable energy electricity savings that are designed to achieve the following a targeted reduction of at least 5% by the end of 2011 and 10% by the end of 2015 of per capita electricity consumed in the electric company’s service territory during 2007; and
46 See MD. CODE ANN., PUB. UTIL. § 7-211 (2011). 47 The term “Utilities” used in this Section refer to: BGE; DPL; Pepco; PE; and SMECO.
26
(2) require each electric company to implement a cost-effective demand response program in the electric company’s service territory that is designed to achieve a targeted reduction of at least 5% by the end of 2011, 10% by the end of 2013, and 15% by the end of 2015, in per capita peak demand of electricity consumed in the electric company’s service territory during 2007.
The Act also states at § 7-211(i)(1):
(1) In determining whether a program or service encourages and promotes the efficient use and conservation of energy, the Commission shall consider the: (i) cost–effectiveness; (ii) impact on rates of each ratepayer class; (iii) impact on jobs; and (iv) impact on the environment.
Prior to July 1 of each program planning phase (2008, 2011, 2014), the Act
requires each utility to consult with the Maryland Energy Administration (“MEA”), Maryland Public Service Commission Staff (“Staff”), and other stakeholders regarding the design and adequacy of the programs proposed by the utility. The 2011 planning phase began in the summer of 2010 with requests for stakeholder input and progressed through various stages of discussion and refinement. All plans were required to be submitted by September 1, 2011 and hearings regarding the EmPower process took place between October 12, 2011 and October 21, 2011. On December 22, 2011 the Commission approved, with some modifications, the utilities' proposed plans in Commission Order No. 84569.
The Commission’s December 22 Order provided increased guidance and
framework for the 2012-2014 program cycle. This included standardization of incentive structures, the transition of Limited Income Energy Efficiency programs to the Maryland Department of Housing and Community Development, the creation of various workgroups to enhance and expand program offerings, and necessary updates to budgets and surcharges associated with the EmPower Maryland program.
Commission Order No. 84569 also changes the reporting process for the 2012-
2014 cycle. Previously, utility reporting was done on a quarterly basis with an annual summary report filed in January of the following year. The new requirements set forth a semi-annual, formal filing process with required metric submissions filed informally with Staff each quarter. The PSC, in consultation with MEA, will continue to provide an annual report to the General Assembly regarding the status of the programs, a recommendation for the appropriate funding level to adequately fund the programs and services, and the per capita electricity consumption and peak demand for the previous year.
27
B. Demand Response Initiatives Demand Response is defined as changes in electric usage by end-use customers
from their normal consumption patterns either in response to changes in the price of electricity over time or to incentive payments designed to induce lower electricity use at times of high wholesale market prices and when system reliability is jeopardized. The increase in electricity prices and changes in technology have spurred interest in finding cost-effective means of reducing electricity consumption. Additionally, the price of electricity in the wholesale markets serving the central and eastern portions of Maryland is determined, in part, by the relative scarcity of generation and transmission capacities serving those areas.
Demand Response initiatives comprise utility-run direct load control programs, inclusive of their legacy demand response programs – the precursor of these Direct Load Control (“DLC”) programs. These programs, although approved separately by the Commission and, in many cases prior to the EmPower Maryland Energy Efficiency and Conservation (“EE&C”) plans, are a critical component in meeting the EmPower Maryland goals and as such are considered part of the EmPower Maryland umbrella package.
1. DLC Programs
In 2008, the Commission approved the DLC programs of BGE, DPL, Pepco, and SMECO.48 These utilities filed revised DLC programs as part of the planning process for the 2012-2014 program cycle. Pepco and DPL proposed to expand their respective DLC programs to include Small Commercial as well as Residential, while BGE and SMECO proposed other enhancements to their programs. However, Potomac Edison did not propose a DLC program due to the non-economical projections associated with their DLC program offerings; this decision was consistent with Potomac Edison's 2009-2011 planning proposals.
Each DLC program includes these common components: (1) all DLC programs are voluntary; (2) upon receiving a customer request, the utility installs either a programmable thermostat or a direct load control switch for a central air conditioning system or an electric heat pump on a customer’s premise; (3) the utilities provide one-time installation incentive and bill credits to the participants in the summer peak months; and (4) with the exception of SMECO, customers can choose one of three cycling choices, 50, 75, or 100 percent.49 SMECO uses an initial 2 degree offset followed by 30 percent cycling for the thermostats, and a 50 percent cycling option followed by 30 48 The Commission approved BGE’s PeakRewards Program on November 30, 2007; Pepco and
DPL’s Energy Wise Programs on April 18, 2008; and SMECO’s CoolSentry Program on April 15, 2008. The utilities’ filings were documented in Case Number 9111. Potomac Edison/Allegheny Power also filed its direct load control program, but it was not found to be cost-effective at the time.
49 The cycling choices of 50%, 75%, and 100% represent the air conditioner compressor working cycle reduced by 50%, 75%, and 100% under PJM- or utility- invoked emergency events during summer peak season.
28
percent cycling for the switches during specified time periods. Utilities will invoke the cycling process when PJM calls for an emergency event or a utility-determined event during summer peak season.
The DLC incentives vary among utilities. The one-time installation incentive is credited to the customer’s bill after installation is complete and an annual bill credit is awarded for each participation year. Table V.B.1 summarizes the utilities’ incentives to the program participants.
Table V.B.1 Utilities’ Incentives to DLC Program Participants
Installation incentive Annual Bill Credit Thermostat Digital Switch Thermostat Digital Switch
Bill Credit Month
SMECO *** None $50 $50 Jun.– Oct.
*** A participant in SMECO’s CoolSentry program can keep the installed thermostat for free after 12 months of the installation; otherwise, the thermostat will be removed if the participant terminates the participation less than 12 months. Source: Utilities’ EmPower Maryland Energy Efficiency Program Websites.
29
Table V.B.2 summarizes the progress in installing these devices for each utility DLC program as of December 31, 2010--since each program’s inception. Installed devices (programmable thermostats and digital switches) number 403,024 units.
Table V.B.2 Utilities’ Direct Load Program Installations; Program-to-Date as of December 31, 2010
Source: For BGE, PE and SMECO, Utilities 2010 Quarter 4 Report of EmPower Maryland Program. For DPL and Pepco, Utilities refiling of 2010 made on August 26, 2011.
The DLC program resulted in 803 MW being bid for Delivery Year (“DY”) 2013-2014 in the May 2010 PJM RPM auction, a 16 percent decrease from the 2009 bid of 952 MW for DY 2012-2013. To date, these programs have accounted for 3,050 MW of the total capacity bid into PJM’s capacity market. Table V.B.3 summarizes the capacity bid into PJM’s capacity market from the DLC program by utility and delivery year.
Table V.B.3: Direct Load Control Program Bids into PJM BRA (MW)
Source: Various data requests in Case Nos. 9111, 9154, 9155, 9156, and 9157. Notes: *BGE’s bid includes both its current DLC and its legacy demand response program. **N/A means data are not available because there was no program launched for these utilities.
a. Update on the DLC four programs
i. BGE
BGE launched its DLC program, PeakRewards, in June 2008. Popular to date, PeakRewards installed a total of 158,838 air conditioning cycling devices from January 1, 2010 through December 2010. Approximately 30,000 more devices have been installed through the third quarter of 2011. As of the end of the third quarter of 2011, a total of
30
356,000 devices (thermostats or switches) have been installed. BGE also has its legacy demand response programs, which include air conditioner and water heater switches installed in the customer premises, and is in the process of transferring these customers to the PeakRewards program, if the customer decides to continue to participate. BGE plans to phase out the legacy programs in 2011. Therefore, BGE’s bid currently includes both the PeakRewards and legacy demand response programs.
Since the inception of PeakRewards, BGE has bid into PJM’s BRA for six consecutive delivery years (see Table V.B.3). The total bid is approximately 2,500 MW, although this total does not reflect the 2014-2015 bid year.50
ii. Pepco
Pepco launched its Energy Wise program (similar in program design to
PeakRewards) in January 2009.51 Pepco had installed 39,987 devices as of December 2010. The program made significant progress in 2010, with 36,057 devices installed in the year 2010 alone. A further 30,790 devices were installed through the third quarter of 2011. The Company has installed 70,777 devices since the program inception.
Pepco has bid into the last four of PJM’s RPM BRAs, with a total bid of 372 MW
for all but the 2014-2015 bid year.52 The Company bid 124 MW for DY 2013/2014 and 149 MW for DY 2012/2013 into PJM’s BRA.
iii. DPL
Concurrently with Pepco, DPL launched its Energy Wise program in January
2009. The Company had installed 13,807 devices by the end of December 2010. Through the third quarter of 2011 the Company had installed an additional 7,115 devices. Since the inception of the program DPL has installed 20,922 devices.
DPL has bid into the last four of PJM’s RPM BRA, with a total bid of 96 MW,
excluding the 2014-2015 bid year.53 The Company bid 32.1 MW for DY 2013/2014, 38.8 MW for DY 2012/2013, and 24.7 MW for DY 2011/2012 into the PJM BRA.
iv. SMECO
SMECO launched its CoolSentry Program in November 2008. A customer may elect to have installed either a thermostat or a digital switch on his/her air conditioner or electric heat pump. SMECO offers a $50 annual bill credit to each participant, but if a participant chooses to install a thermostat, the participant can also keep the thermostat for free after 12 months of participation. No installation incentive is offered to a participant
50 This bid year is not included as bids have not been made public at this time. 51 Pepco and DPL entered into a contract with Comverge on January 20, 2009, and started the testing
phase with their own employee volunteers. 52 This bid year is not included as it has not been made public at this time. 53 This bid year is not included as it has not been made public at this time.
31
to choose a digital switch. SMECO has installed 30,811 devices since program inception, including 11,347 through the third quarter of 2011.
SMECO bid a total of 81.9 MW into PJM’s RPM BRA over the last four years,
31.9 MW for DY 2013/2014, and 25 MW for each DY 2011/2012 and 2012/2013.54
v. Suspension of White Rodgers Programmable Thermostat
Installation
In 2010, the Commission suspended the installation of the thermostats used by Pepco, DPL, and SMECO due to a potential safety hazard with the devices. The Commission issued Order No. 83588 on September 23, 2010 directing Pepco, DPL, and SMECO55 (“the Companies”) to cease the installation of the affected thermostats immediately and appear before the Commission at a hearing on September 24, 2010. On September 24, 2010, the Commission issued Order No. 83592 reinforcing the decision to cease thermostat installation in Order No. 83588 and directed the Companies to notify the Commission when the Consumer Protection Safety Commission (“CPSC”) issued a decision on corrective actions for the safety issue with the thermostats.
On January 14, 2011 the Companies issued a press release providing further detail
about the Canadian CPSC ruling and a subsequent recall by White-Rodgers. On February 1, 2011 the Companies filed a motion to lift the stay, imposed by the Maryland PSC, citing the steps outlined by White-Rodgers to rectify the problem as well as future changes to the program to prevent this type of issue from remaining problematic. On March 7, 2011 the Commission issued Order No. 83899, which lifted the stay on the installation of White-Rodgers thermostats in the manner proposed by the Companies in the February 1 filing.
b. July 22, 2011 DLC Activation Event July 22, 2011 was the first time PJM had declared an emergency event since the
Utilities’ current DLC programs were approved by the Commission in 2008. BGE was the only utility in Maryland to have an emergency event declared by PJM. This was primarily due to the overheating of a transformer at one of BGE’s substations (forcing BGE to take that transformer out of service) and extremely high temperatures. Because of this emergency event, BGE initiated its DLC program at all three cycling levels for the first time (50%, 75%, and 100%), so this was the first time that customers who signed up for the 75% and 100% cycling options had their thermostat or switch cycling at the 75% or 100% level.56 The combination of the extreme high temperatures, cycling participants for the first time at their selected cycling level, and the length of the event (7.75 hours)57 54 The 2014-2015 bid year is not included as it has not been made public at this time. 55 SMECO also was installing the same White Rodgers programmable thermostats in its CoolSentry
program. 56 For non-PJM Emergency events, BGE cycles all participants at a 50 percent level. 57 This total of 7.75 hours was the average time the DLC program was activated, and consisted of
two events. The first event was the PJM-declared emergency which lasted for 6 hours and 34 minutes. For the second event, the Company switched all participants to cycle at the 50 percent
32
led to very high levels of calls to both the BGE call center and the DLC call center, which led to longer than average wait times and customer dissatisfaction.
Pepco, DPL, and SMECO activated their DLC programs for economic reasons
and did not experience any above-average duration times or number of calls at their call centers. Pepco, DPL, and SMECO also reported no problems with overloads on their communication systems.
The major problems of the day were due to shortcomings in participant education
and communication. The following is a list of education and communication problems and the proposed corrections to avoid these issues in future activations events:
1. Participants forgot what level of cycling they were signed up for - BGE
(and all the Utilities) need to remind the participants of their cycling level prior to the summer season, when these devices are most likely to be activated. Additionally, BGE should describe situations when a participant might want to lower their cycling level, such as medical conditions or homes with elderly people and small children.
2. Participants were unaware of the PJM emergency event – BGE should attempt to contact participants the evening prior to an event (PJM Emergency or BGE initiated), similar to the commitment BGE has made for customer contact for Smart Energy Pricing. That way a participant will be aware of the event beyond the message on the thermostat and light on the switch.
3. Participants had never been cycled at more than 50% prior to July 22 – BGE may want to consider cycling participants at their selected cycling level during BGE declared events. Since BGE declared events generally do not last longer than four hours, a 100% participant, for example, may have a better idea of the interior temperature change to expect for a potential PJM declared emergency event.
4. Long time spent on hold while contacting call center – BGE has committed, in its report, to increase call center staff during a PJM declared emergency.
5. Paging signals to DLC devices unable to transmit due to system overloading – BGE has indicated that it is already working with its signal vendor to configure the system to enable the prioritization of system-wide device commands.
BGE has been working on improving the education and communication issues
identified during the July 22 DLC activation event in order to provide more transparency and be more responsive to program participants during future PJM declared emergency events.
level in order to scale down from the emergency event. The second event lasted for 1 hour and 11 minutes.
33
2. Peak Load Reduction Forecast Table V.B.4 demonstrates the impact of demand side management programs on the utilities’ peak load forecast. The table presents the 10-year growth rate for gross of demand side management programs and the impact, or net of, those programs during the period of 2011 through 2020. Overall, the peak load forecast for the utilities listed in Table V.B.4 is estimated to result in an 18 percent increase in demand by 2020 without DSM programs. However, net of DSM programs, the overall forecast is expected to result in a 13 percent increase in demand over the 10-year period. Therefore, holding all other factors constant, it is forecasted that the DSM programs will reduce the peak demand growth rate 5 percent by 2020.
Source: Table A-4(a) Peak Summer Demand Forecast Breakdown 2010 in Company data responses to the Commission's 2011 data request for the Ten-Year Plan.
The major contributors to the peak load reduction are: (1) the current direct load
control program (BGE, DPL, Pepco, and SMECO); (2) legacy load reduction program (BGE and SMECO); (3) BGE’s Smart Grid Initiative,58 and (4) energy efficiency and conservation programs (BGE, DPL, Pepco, and PE).59
C. Energy Efficiency and Conservation Programs On December 31, 2008, the Commission preliminarily approved the utilities’
EmPower Maryland EE&C portfolios, contingent upon varying Commission-prescribed alterations to their programs, budgets, and projected savings. Although BGE’s programs were approved in whole, the Commission directed the other utilities to file their revised portfolios, along with information confirming their final estimated costs and budgets through completed request for proposals or finalized contracts by March 31, 2009. Comments by the interveners, as well as a response by the utility, were filed in each proceeding. As with the original series of proceedings, the Commission conducted 58 Pepco did not include demand reductions from its Commission-approved AMI initiative. 59 The contribution information is obtained through Staff communication with the utilities. SMECO
does not include energy-efficient demand reduction as part of its forecast.
34
hearings for each utility’s proposal. The remaining four utilities’ - PE, DPL, Pepco and SMECO - programs were approved in August 2009.
1. EmPower Maryland Policy
The Commission contracted an Independent Evaluator in April 2010 to conduct quality control and due diligence of the Utilities’ EM&V programs and contracted evaluator.60 In an effort to build a credible and reliable EM&V infrastructure, stakeholders and their various evaluators collectively established the Strategic Evaluation Plan in September 2010 which provided guidance on a variety of issues, but also laid out expectations for the Utilities and their evaluator. A baseline study, conducted by KEMA, was completed in 2010 and released in 2011 for use by the utilities and evaluators. 2011 also saw the release of the first round of cost-effectiveness testing. This was a joint effort by the Utilities, stakeholders, Itron, and Navigant Consulting to gather and analyze savings reported under the EmPower Maryland programs and provide an evaluation of the costs and benefits realized by each Utility. Overall, cost-effectiveness testing returned positive results; however, some programs struggled due to their transformative nature. It was determined that these programs may need additional time and attention in order to achieve minimum cost-effectiveness standards. The five EmPower Maryland Utilities, MEA, the Office of the Peoples Counsel (“OPC”) and Staff (hereafter referred to as the “Planning Group”) began preparations for the 2012-2014 EmPower Plan filings in the summer of 2010. On September 2, 2010 Staff filed the “Invitation to Stakeholders to Propose New or Revised Programs, Measures or Products” on behalf of the Planning Group (“Invitation”). The Invitation clarified that all cost-effective programs would be considered; however the Utilities would determine what they include in these filings and the utilities have the right to modify, adapt, incorporate and/or implement as they deem appropriate any ideas presented on this process and during the stakeholder sessions. The Invitation included a template intended examine all elements for the implementation of a proposed program or product. Proposals were submitted on October 4, 2010 to Staff and MEA.
Over thirty proposals were submitted. The majority came from organizations or firms that had little or no prior association with demand side stakeholder or work group activities in Maryland. The Planning Group scored proposals largely on the completeness of information provided. Eight organizations or firms were rejected prior to the presentation of proposals in most cases because proposals lacked cost or savings estimates.
Four Work Group meetings starting November 1, 2010, open to all stakeholders, were noticed to Staff’s contact list and in a planning framework filed with the Commission. The Planning Group met a number of times during the winter to discuss the merits of the proposals and whether they were likely to be included in some form in the draft Plans. Planning and workgroup meetings continued into 2011 with a culmination in July 2011. As required under the statute each utility and any parties wishing to take part 60 The Utilities also have their own EM&V evaluator, as does the OPC and the MEA.
35
in the hearing process were required to file proposals by September 1, 2011. The subsequent EmPower Maryland hearing process lasted eight days and included presentations from the five Utilities, DHCD, Technical Staff, OPC, and MEA, as well as trade organizations and contractors.
2. EmPower Maryland EE&C Programs
On December 31, 2008, by Order Nos. 82383, 82384, 82385, 82386, and 82387,61 the Commission partially approved the Energy Efficiency, Conservation, and Demand Response Programs pursuant to the EmPower Maryland Energy Efficiency Act of 2008. With the exception of BGE’s portfolio, which was approved as a whole, DPL, Pepco, Potomac Edison and SMECO were all requested to make alterations to some program designs as well as revise the total estimated cost and savings with the finalized RFPs. The Commission approved these revised plans in Order Nos. 82825 on August 6, 2009, and 82835, 82836 and 82837 on August 13, 2009. The approved programs are designed for residential customers,62 as well as small and large commercial businesses.63 Generally, most programs are designed to provide a rebate to consumers to encourage the purchase of energy-efficient products, equipment, or services.64
a. BGE
As of the end of the third quarter of 2011 BGE has spent 89 percent of its
forecasted 2009-2011 EE&C budget ($149,207,339). The Commission approved BGE’s 2011 Residential EE&C EmPower Maryland Surcharge at $0.000730 per kWh effective January, 2011. The Company’s EmPower Maryland EE&C Programs have achieved 26 percent of its 2011 energy savings goal (2,052,948 MWh) and 5 percent of the 2011 peak reduction goal (513 MW) through the third quarter of 2011.65
b. Pepco As of the end of the third quarter of 2011 Pepco has spent 41 percent of the 2009-
2011 EE&C budget ($49.8 million). Pepco continued to use the 2010 combined residential surcharge ($0.00187) as no other surcharge was filed for 2011. The Company has filed a surcharge for 2012 that will encompass the 2010 and 2011 true ups. The Company has achieved 18 percent of its EE&C 2011 energy savings goal (685,378 MWh) and 8 percent of its demand reduction goal (230 MW). 61 The Commission subsequently approved certain program revisions for BGE in Order No. 82674. 62 Residential programs include Lighting and Appliances; Home Performance with Energy Star,
Quick Home Energy Check-up, and Comprehensive Home Audits; Energy Star for New Homes; Limited Income Energy Efficiency Program; Heating, Ventilation, and Air Conditioning (“HVAC”) and Domestic Hot Water Heaters. Program availability varies slightly across service territories.
63 Non-residential programs include the C&I Prescriptive; C&I Custom; Commissioning; C&I HVAC. Program availability varies slightly across service territories.
64 All data in the following sections will be current as of the third quarter of 2011 unless otherwise noted. All data is reported at the Wholesale Level.
65 These percentages do not reflect savings from Demand Response programs as these are not part of the EE&C portfolio but are part of the DLC programs.
36
c. DPL DPL has spent 29 percent of its three-year forecasted budget ($19.6 million).
Pepco continued to use its 2010 combined residential surcharge ($0.001822) during 2011. The Company has filed a surcharge for 2012 that will combined the 2010 and 2011 true ups. Energy savings from EE&C programs through the third quarter will amount to 12 percent of the 2011 goal (205,846 MWh) and will account for 4 percent of the 2011 demand reduction goal (73 MW).
d. SMECO
Program spending for Residential and C&I EE&C programs through the third
quarter accounts for 63 percent of its 2009-2011 forecast ($14.3 million). The Commission approved a residential EE&C surcharge of $0.00145 effective February, 2011. Program-to-date results through the third quarter of 2011 account for 34 percent of the 2011 goal (94,229 MWh) and 40 percent of the 2011 demand reduction goal (29 MW).
e. PE
Program spending, through the third quarter of 2011, for EE&C programs accounts for 9 percent of the 2009-2011 forecasted budget. The Commission approved a residential EE&C surcharge of $0.00010 effective for June, 2011. This was a follow up surcharge in response to the approval of the merger with First Energy. Program-to-date results through the third quarter of 2011 account for 30 percent of the 2011 energy savings goal (122,664 MWh) and 15 percent of the 2011 demand reduction goal (49.4 MW).
D. Advanced Metering Infrastructure / Smart Grid
1. Background
“Smart grid” technology is generally defined as a two-way communication system and associated equipment and software, including equipment installed on an electric customer’s premise that uses the electric company’s distribution network to provide real-time monitoring, diagnostic, and control information and services that can improve the efficiency and reliability of the distribution and use of electricity. Advanced Metering Infrastructure (“AMI”) is a component of smart grid and refers to the installation of meters on a customer’s premises capable of being addressed by the utility. Soon the technology will enable customers to see and respond to market-based pricing as well as be more self-aware of their energy usage, assisting in grid reliability and reducing environmental impacts. Reliability and power quality benefits can also accrue when AMI is employed to reduce blackout probabilities and forced outage rates while restoring power in shorter time periods. On September 28, 2007, the Commission issued Order No. 81637, which established the following minimum technical standards for AMI. BGE,
37
Pepco and DPL subsequently filed, for Commission approval, plans seeking to establish an AMI program.
2. Approved AMI Initiatives
a. BGE
On August 13, 2010, the Commission issued Order No. 83531 in Case No. 9208,66 which authorized BGE to deploy its AMI Initiative. Some highlights of the approved AMI Initiative are:
• Install over 2 million electric meters and gas modules; • Deployment cost of $440 million in capital cost and $57 million in operational
costs; • Total cost over the life of the program of $641 million capital cost and $194
million in operational costs offset by $136 million67 in federal grants from the Department of Energy;
• Total benefits over the life of the project are estimated at $2.7 billion; and • 80 percent of all meters to be installed by 2014.
Order No. 83531 directs BGE to do the following:
1) Establish a regulatory asset for the AMI Initiative. Once the Company has
delivered a cost-effective AMI system, it may seek cost recovery in its base rates, including incremental costs and net depreciation and amortization costs relating to the meters;
2) Allow cost recovery for the replacement of legacy meters by smart meters to be considered in a future depreciation proceeding;
3) Submit for Commission approval, an updated customer education plan; 4) Develop “a comprehensive set of installation, performance, benefits and
budgetary metrics that will allow the Commission to assess the progress and performance of the Initiative;68 and
5) Notify the Commission of whether it will proceed with the initiative. BGE confirmed its intent to proceed with the initiative in a letter sent to the Commission on August 16, 2010.
Since authorization, BGE, in conjunction with PHI, Staff and other stakeholders,
established a Smart Grid Collaborative Work Group per Commission direction. The Work Group offers a venue to discuss issues such as the consumer education plan and the
66 In the Matter of Baltimore Gas and Electric Company for Authorization to Deploy a Smart Grid
Initiative and to Establish a Surcharge Mechanism for the Recovery of Cost. 67 BGE was awarded $200 million in American Recovery and Reinvestment Act funding. Of this,
$136 million funds AMI deployment and $64 million for Peak Rewards and Customer Care & Billing.
68 Order No. 83531at 48.
38
comprehensive set of performance metrics. The Company provided an update on deployment efforts at a status conference on December 15, 2010. The Company proposed that deployment take place from 2011-2014, with installation of smart meters beginning in October 2011.
b. Pepco On September 2, 2010, the Commission issued Order No. 83571 in Case No.
9207,69 authorizing Pepco to deploy its AMI Initiative contingent upon the Company submitting an amended business case and a comprehensive consumer education plan. Some highlights of the approved Smart Grid Initiative are:
• Install 570,000 electric meters; • Deployment cost of $69.4 million in capital cost; • Total cost over the life of the program of $127 million in capital cost and
$1.038 million in annual incremental operational costs; • Total benefits over the life of the project are estimated at $311.6 million; and • Pepco awarded $104.8 million in Smart Grid Investment Grant funds.
Order No. 83571 directs and allows Pepco to do the following:
1) Submit an amended business case and associated benefits-to-costs analysis that demonstrates the cost-effectiveness of the AMI proposal;
2) Submit a plan detailing how it intends to fund its proposed Critical Peak Rebate dynamic pricing structure, including the manner in which it intends to monetize peak demand and energy use reductions attributable to AMI;
3) Develop “a detailed and comprehensive customer education and communications plan,” along with a corresponding customer education and communications budget;70
4) Develop a comprehensive set of metrics of the Company’s AMI proposal, including: (a) installation and performance of the technology; (b) incremental costs incurred; (c) incremental benefits realized; (d) effectiveness of customer education and communications efforts to include customer satisfaction and participation levels; and (e) customer privacy and cyber security;
5) Establish a regulatory asset for the incremental costs associated with the AMI deployment, including start-up costs, which the Company may seek to recover in a base rate proceeding;
6) Seek cost recovery for the replacement of legacy meters by smart meters to be considered in a future depreciation proceeding. The Order also prohibits the Company from implementing a Critical Peak Pricing rate structure. A dynamic rate schedule will go in effect once AMI has been installed. Further, the Commission ordered Commission Staff as well as Pepco to convene an AMI working group, which is to include representatives
69 In the Matter of Potomac Electric Power Company and Delmarva Power and Light Company
Request for the Deployment of Advanced Meter Infrastructure. 70 Id. at 4.
39
from Pepco, BGE, and the Office of People’s Counsel to submit a proposal for “uniformity of critical peak period seasons, times, frequency, and duration, and other aspects of dynamic pricing implementation.”71
Pepco filed with the Commission its Customer Education Plan on October 15, 2010 and an amended business case on December 13, 2010, in accordance with Order No. 83571. Pepco provided cost-benefit analyses under three different post-deployment scenarios, all of which yielded cost-effectiveness scenarios greater than 1.0. The filing also included depreciation timetables for advanced metering infrastructure and estimated costs for regulatory assets. The consumer education plan and amended business case’s final budget—as well as the performance metrics required to be reported— will be subject to the review of the Smart Grid Collaborative Work Group and to the approval of the Commission. In its amended business case filed December 13, 2010, Pepco proposed a time period of 15 months for AMI installation, and the starting month is projected to be June 2011, with completion in August 2012.
c. DPL In Order No. 83571, the Commission deferred the decision on DPL’s request to
proceed with deployment of its AMI Initiative. DPL’s request to establish a regulatory asset for the incremental costs associated with its proposed AMI deployment was deferred as well. Order No. 83571:
1) Deferred DPL’s request to proceed with deployment of its AMI Initiative, and directed the Company to submit an amended business case and associated cost-benefit analysis demonstrating the cost-effectiveness of the proposal;
2) Required the Company to submit a plan detailing how it intends to fund its proposed Critical Peak Rebate dynamic pricing structure, including the manner in which it intends to monetize peak demand and energy use reductions attributable to AMI;
3) Denied DPL’s request to establish a regulatory asset for the incremental costs associated with AMI deployment, pending submission of a revised business case of AMI system deployment that is agreeable to the Commission; and
4) Prohibited the Company from implementing a Critical Peak Pricing rate structure.
DPL filed a revised business case for its AMI Initiative on December 14, 2010, which includes forecast scenarios for all of the adjustments specified by Order No. 83571. The Commission reheard the case on August 17, 2011. At this time no order has been issued by the Commission on this issue but one is expected in 2012. 71 Id. at 51.
40
3. AMI Pilots
a. SMECO
SMECO proposed a two-phase AMI Pilot Program to test the operational benefits of AMI deployment, such as savings from eliminating meter readings and improved outage restoration. Phase I of the pilot, approved by the Commission in December of 2009, includes the installation of 1,000 meters in one section of the service territory and went into effect in 2010. The Cooperative will attempt to quantify the level of operational benefits attainable through deployment of AMI, and the Cooperative will report the results of Phase I to the Commission prior to implementing Phase II, which will be a 10,000 meter deployment across the entire service territory. At the time of this report, SMECO had not yet submitted the report on Phase I of the project. SMECO notified Commission Staff that Phase I will commence in mid-March 2011.
4. AMI Workgroups
a. BGE and Pepco Following the Commission’s direction that workgroups be established to bring stakeholders together with the utilities for the development of metrics, educational programs, and security standards a number of initiatives were undertaken in 2010 and 2011. In a letter dated February 18, 2011 Pepco received approval from the Commission to implement its “Proposed Phase 1” customer education plan. In a letter dated July 18, 2011 BGE received approval from the Commission to implement its “Smart Grid Customer Education and Communication Plan.” In a letter dated August 18, 2011 the Commission granted approval for the Phase 1 Metrics for both BGE and Pepco. The workgroup continues to develop plans for cyber security, Phase II metrics, and Phase II customer education and communication. It is expected that consensus filings and specific plans will be filed for approval on each of these issues in 2012.
41
E. Mid-Atlantic Distributed Resources Initiative
The Mid-Atlantic Distributed Resources Initiative (“MADRI”) was established in 2004, and currently consists of seven PJM State Commissions, DOE and PJM.72 Its goal is “to develop regional policies and market-enabling activities to support distributed generation and demand response in the Mid-Atlantic region.” Facilitation support is provided by the Regulatory Assistance Project funded by DOE. There has been much participation by a large number of stakeholders, including utilities, Commission Staff, FERC, service providers, and consumers. During 2011, MADRI focused on time of use, peak period and related pricing approaches that may be used following the implementation of Smart Grid infrastructure. VI. ENERGY, THE ENVIRONMENT, AND RENEWABLES
A. The Regional Greenhouse Gas Initiative The Regional Greenhouse Gas Initiative (“RGGI”) is the first mandatory cap-and-trade program in the United States for carbon dioxide (“CO2”). Under RGGI, ten Northeastern and Mid-Atlantic states have jointly designed a cap-and-trade program that limits permitted carbon dioxide emissions from fossil fuel power plants, and then incrementally lowers that level or “cap” 10% by 2018. The first compliance period spanned January 1, 2009 – December 31, 2011. Nine member states will continue participation in the RGGI program for the second compliance period of January 1, 2012 – December 31, 2014; New Jersey has formally withdrawn from the RGGI program, effective January 1, 2012. RGGI, Inc. is a nonprofit Delaware corporation formed to provide technical and scientific advisory services to participating states in the development and implementation of the carbon dioxide budget trading programs. The RGGI, Inc. offices are located in New York City in space co-located with the New York Public Service Commission. The RGGI Board of Directors is composed of two representatives from each member state, with equal representation from the states’ environmental and energy regulatory agencies. Agency Heads (two from each state), who also serve as RGGI Board members, constitute a steering committee that provides direction to the Staff Working Group and allows coordination of in-process projects for Board review. Under RGGI, the participating states have agreed to use an auction of allowances as the means to distribute CO2 emissions allowances to electric power plants regulated under coordinated state CO2 cap-and-trade programs. All fossil fuel electric power plants 25 megawatts or greater must obtain allowances and adhere to RGGI guidelines. The effective date for RGGI was January 1, 2009. From 2009 through 2014, the cap stabilizes emissions at 2009 levels of approximately 188 million tons annually. These initial base annual emissions budgets for the 2009-2014 periods are summarized in Table VI.A.1. 72 The Commissions are Delaware, D.C., Illinois, Maryland, New Jersey, Ohio and Pennsylvania.
42
Table VI.A.1: Annual State CO2 Allowance Budgets (2009 – 2014)
State Carbon Dioxide Allowances (in Short Tons)
Connecticut 10,695,036 Delaware 7,559,787
Maine 5,948,902 Maryland 37,503,983
Massachusetts 26,660,204 New Hampshire 8,620,460
New York 64,310,805 New Jersey 22,892,730
Rhode Island 2,659,239 Vermont 1,225,830 Total* 188,076,976
Source: Memorandum of Understanding, REGIONAL GREENHOUSE GAS INITIATIVE (Dec. 20, 2005), available at http://www.rggi.org/design/history/mou. *Note: Following the withdrawal of New Jersey (effective Jan. 1, 2012), the total annual regional cap will be adjusted to 165,184,246 allowances. Beginning in 2015, the cap is reduced by 2.5% each year until 2018. This phased approach, with initially modest emissions reductions, is intended to provide market signals and regulatory certainty so that electricity generators may begin planning for, and investing in, lower-carbon alternatives throughout the region while avoiding volatile wholesale electricity price impacts and attendant retail electricity rate impacts. The RGGI Memorandum of Understanding apportions carbon dioxide allowances73 among signatory states through a process that was based on historical emissions and negotiation among the signatory states. Together, the emissions budgets of each signatory state comprise the regional emissions budget, or RGGI “cap.” In 2011, RGGI held four successful auctions for carbon dioxide allowances. As a result of the fourteen auctions comprising the first compliance period, Maryland’s Strategic Energy Investment Fund has received a cumulative total of $180,315,817 through December 2011; the Fund received almost $33 million in 2011 alone.74
During 2011, auction clearing prices did not recover from the downward trend that started in mid-2009. All allowances sold in 2011 auctions were purchased at the auction floor price.75 In 2011, the auction floor price was $1.89; the floor price will increase to $1.93 in 2012 auctions.
73 An allowance is a limited permission to emit one ton of carbon dioxide. 74 See MD Proceeds by Auction, REGIONAL GREENHOUSE GAS INITIATIVE, available at
http://www.rggi.org/docs/MD_Proceeds_by_Auction.pdf (last updated Dec. 12, 2011). 75 See Auction Results, REGIONAL GREENHOUSE GAS INITIATIVE, available at
B. The Renewable Energy Portfolio Standard Program
The Renewable Energy Portfolio Standard (“RPS”) Program imposes an annual requirement upon Maryland load serving entities (“LSEs”) to derive a percentage of electricity sales from the renewable sources specified in the corresponding RPS Statute.76 LSEs, which include both electricity suppliers and the utilities that provide Standard Offer Service (“SOS”),77 file compliance reports with the Commission verifying that the renewable requirement for each entity is satisfied. The RPS obligation applies to anyone who has completed an electricity sale at retail to customers in the State of Maryland. Additional information regarding the status of the Maryland RPS is available in the annual Renewable Energy Portfolio Standard Report submitted to the General Assembly.78
On an annual basis each supplier must present renewable energy credits (“RECs”) equal to the percentage specified by the RPS Statute,79 or pay the alternative compliance fees equal to any shortfalls.80 A REC is equal to one MWh of electricity generated using specified renewable sources.81 As such, a REC is a tradable commodity equal to one MWh of electricity generated or obtained from a renewable energy generation resource. Generators and suppliers are allowed to trade RECs using a system known as the Generation Attributes Tracking System (“GATS”). GATS is a system designed and operated by PJM Environmental Information Services, Inc. (“PJM-EIS”) that tracks the ownership and trading of the generation attributes.82 A REC has a three-year life during which it may be transferred, sold, or redeemed.83
Suppliers that do not meet the annual RPS requirement are required to pay
Alternative Compliance Payments (“ACPs”) or fees equal to any shortfalls.84 Compliance fees are deposited into the Maryland Strategic Energy Investment Fund (“SEIF” or “Energy Fund”) as dedicated funds to provide for loans and grants that can
76 MD. CODE ANN., PUB. UTIL. § 7-701(j) (2011). 77 Standard Offer Service (“SOS”) is electricity supply purchased from an electric company by the
company’s retail customers that cannot or choose not to transact with a competitive supplier operating in the retail market. See MD. CODE ANN., PUB. UTIL. §§ 7-501(n) and 7-510(c) (2011).
78 See Commission Reports, MARYLAND PUBLIC SERVICE COMMISSION, available at http://webapp.psc.state.md.us/Intranet/psc/Reports_new.cfm (last visited Dec. 2011), for a listing of available RPS Reports submitted in previous years.
79 MD. CODE ANN., PUB. UTIL. § 7-703(b) (2011). 80 Using the Tier 2 RPS requirement as an example, assume a hypothetical LSE operating in the
State had 100,000 MWh in retail electricity sales for 2008. In 2008, the Tier 2 requirement was 2.5%. Thus, the LSE would have to verify the purchase of 2,500 Tier 2 RECs in satisfaction of the Tier 2 RPS obligation, or pay compliance fees for deficits. Similar requirements apply to Tier 1 and Tier 1 solar, the additional RPS tiers provided for in Maryland’s RPS Statute.
81 MD. CODE ANN., PUB. UTIL. § 7-701(i) (2011). 82 An attribute is “a characteristic of a generator, such as location, vintage, emissions output, fuel,
state RPS program eligibility, etc.” PJM Environmental Information Services, Generation Attribute Tracking System Operating Rules, at 3 (September 30, 2010).
indirectly spur the creation of new renewable energy sources in the State.85 The Commission is responsible for creating and administering the RPS Program;86 responsibility for developing renewable energy resources through loans and grants has been vested with the Maryland Energy Administration. Eligible fuel sources for Tier 1 RECs and Tier 2 RECs are listed in Table VI.B.1. In order to verify that each LSE has met its RPS obligation, the Commission requires that all licensed electricity suppliers and electric companies file a Supplier Annual Report no later than April 1st of each year.87 The April 1st deadline provides time for LSEs to calculate electricity sales based on settlement data for the compliance year that ends on December 31st. The April 1st deadline also allows LSEs time to purchase any RECs needed to fulfill their respective RPS obligations.
Table VI.B.1: Eligible Tier 1 and Tier 2 Renewable Sources, for Compliance Year 2010
Tier 1 Renewable Sources Tier 2 Renewable Sources
• Solar (set-aside with separate standard) • Wind • Qualifying Biomass • Methane (landfill or wastewater treatment
plant) • Geothermal • Ocean Energy (waves, tides, currents, and
thermal differences) • Fuel Cells (which produce electricity
from biomass or methane under Tier 1) • Hydroelectric Power Plant (less than 30
MW capacity) • Poultry Litter-to-Energy
• Hydroelectric Power (other than pump storage generation) at or above 30 MW
• Waste-to-Energy88
Source: MD. CODE ANN., PUB. UTIL. § 7-705(b) (2011). Note: Tier 1 RECs may be used to satisfy Tier 2 obligations; Tier 2 RECs, however, may not be used to satisfy Tier 1 obligations.
85 Chapters 127 and 128 of the Laws of 2008 repealed the Maryland Renewable Energy Fund and
redirected compliance fees paid into that fund into the Maryland Strategic Energy Investment Fund. 2008 Md. Laws 846.
86 MD. CODE ANN., PUB. UTIL. § 7-703(a)(1)(i) (2011). 87 These reports have been filed pursuant to MD. CODE ANN., PUB. UTIL. § 7-705(a) (2011). 88 Effective October 1, 2011, new legislation reclassified “waste-to-energy” as a Tier 1 renewable
source. 2011 Md. Laws 3045. However, “waste-to-energy” was classified as a Tier 2 renewable source during the 2010 compliance year as reported in this section.
45
LSEs are required to purchase specified minimum percentages of their electricity resources via RECs from Maryland-certified Tier 1 and Tier 2 renewable resources. As presented in Table VI.B.2, Tier 1 and the Tier 1 solar set-aside89 requirements gradually increase until they peak in 2022 at 18% and 2%, respectively, and are subsequently maintained at those levels. Maryland’s Tier 2 requirement remains constant at 2.5% through 2018, after which it sunsets.
Table VI.B.2: Annual RPS Percentage Requirements by Tier
Source: MD. CODE ANN., PUB. UTIL. § 7-703(b) (2011). Note: Schedule reflects increased percentage requirements effective January 1, 2011 for the Tier 1 Solar category. Electricity suppliers not meeting the RPS requirement for any or all tiers of resources pay an ACP on each MW of shortfall.90 Table VI.B.3 presents the ACP schedule separated by tiers for each year of the RPS from 2010 to 2023 and beyond. Compliance fees, as previously mentioned, are deposited into the SEIF and dedicated to supporting the development of new Tier 1 renewable resources in Maryland.
89 "Tier 1 solar set-aside" refers to the set-aside (or carve-out) of Tier 1 for energy derived from
qualified solar energy facilities. The Tier 1 solar set-aside requirement applies to retail electricity sales in the State by LSEs and is a sub-set of the Tier 1 standard.
90 MD. CODE ANN., PUB. UTIL. § 7-705(b) (2011).
46
Table VI.B.3: RPS Alternative Compliance Fee Schedule ($/MWh)
2023 + $40 $50 $2 Source: MD. CODE ANN., PUB. UTIL. § 7-705(b) (2011). *Note: A supplier sale from Industrial Process Load (“IPL”) is required to meet the entire Tier 1 obligation for electricity sales, including solar. However, the ACP for an IPL Tier 1 non-solar shortfall and a Tier 1 solar shortfall is the same. For IPL, there is no compliance fee for Tier 2 shortfalls. Calendar year 2010 marked the fifth compliance year for the Maryland RPS, and the third year for LSEs to comply with the solar Tier 1 set-aside. GATS and the RPS compliance reports submitted to the Commission by LSEs provide information regarding the RECs retired and the underlying renewable energy facilities (e.g., type and location) utilized by electricity suppliers to comport with Maryland RPS obligations.91 RPS compliance reports were filed by 58 electricity suppliers, including 33 competitive suppliers, 14 brokers or wholesale electricity suppliers with zero retail electricity sales, and 11 electric companies, of which four are investor-owned utilities. In compliance year 2010, there were approximately 65.6 million MWh of total retail electricity sales in Maryland; 64.1 million MWh of electricity sales were subject to RPS compliance, and 1.5 million MWh were exempt.92
91 According to § 7-709, a REC can be diminished or extinguished before the expiration of three
years by: the electricity supplier that received the credit; a nonaffiliated entity of the electricity supplier that purchased or received the transferred credit; or demonstrated noncompliance by the generating facility with the requirements of § 7-704(f). In the PJM region, the regional term of art is “retirement,” and describes the process of removing a REC from circulation by the REC owner, i.e., the owner “diminishes or extinguishes the REC.” PJM Environmental Information Services, Generation Attribute Tracking System (GATS) Operating Rules, at 54 – 56 (September 30, 2010).
92 According to Article § 7-703(a)(2), exceptions for the RPS requirement may include: industrial process load which exceeds 300,000,000 kWh to a single customer in a year; regions where residential customer rates are subject to a freeze or cap (under Article § 7-505); or electric cooperatives under a purchase agreement that existed prior to October 1, 2004, until the expiration of the agreement.
47
For the 2010 compliance year, electricity suppliers retired 3,569,569 RECs, a quantity greater than the overall RPS obligation for the year by almost 30,000 RECs. According to the compliance reports filed with the Commission, the cost of RECs retired totaled $7,630,526 for the 2010 compliance year. For each of the five compliance years, Table VI.B.4 displays: the breakdown of RECs submitted for each tier in MWh; the number of RECs retired in the year by tier in MWh; and the cumulative tiered shortfalls, in terms of the ACP amount required in dollars per MWh.93
Table VI.B.4: RPS Supplier Annual Report Results as of December 31, 2010
Sources: Annual Utility RPS Filings with the Commission in years 2007, 2008, 2009, 2010, and 2011. Commission Reports, MARYLAND PUBLIC SERVICE COMMISSION, available at http://webapp.psc.state.md.us/Intranet/psc/Reports_new.cfm (last visited Dec. 2011). *Note: Some electricity suppliers retired more RECs than required by individual RPS obligations.
In 2010 there was a shortfall of 544 MWh in RECs for the Tier 1 Solar requirement of 15,985 MWh—significantly lower than the 2009 Tier 1 Solar REC shortfall of 2,865 MWh. Therefore, the reliance by electricity suppliers on ACPs to fulfill the Tier 1 Solar requirement decreased dramatically between 2009 and 2010. However, the shortfalls associated with the RPS solar obligation still contributed over 99% of the total ACPs due for the 2010 compliance year. The degree to which solar technologies are available to provide renewable output plays a role in the Tier 1 Solar compliance option selected.
93 The RPS obligation is the total obligation for electricity sales in MWh, which is equal to the
number of RECs required for compliance. The number of retired RECs is the actual number of RECs retired for RPS compliance in each corresponding compliance year. The ACP required is calculated by multiplying the difference between the RPS obligation and the actual retired RECs (i.e., the shortfalls) by the applicable ACP. All ACPs are denominated in U.S. dollars.
48
Chart VI.B.5 presents the geographical location and the total generating capacity (5,615 MW) for all Maryland RPS-certified facilities, regardless of tier.94 RPS requirements also exist in the surrounding states, which generally support out-of-state and regional market participation. Of the renewable facilities that are eligible to participate and potentially provide renewable energy to Maryland, 68 percent are located in the Mid-Atlantic states.95 The locations of the remaining eligible resources span seven states and in total contribute the remaining 32 percent of the State’s eligible capacity.96
Chart VI.B.5: Maryland RPS Eligible Capacity by State
461.7
180.1
44.6 0.6 0.0
122.5300.0
738.6
1,325.7
1,187.0
438.6
109.6
705.9
-
200
400
600
800
1,000
1,200
1,400
PA MD IL DE VA WV IN NY NJ OH WI DC NCState
Cap
acity
(MW
s)
Source: PJM-EIS, Generation Attribute Tracking System, Database query, August 2011.
C. Solar Power Requirements in Maryland In 2008, the Commission laid the foundation for an active solar market in Maryland. Regulations were enacted which established a small generator interconnection standard supported by an expedited process for the interconnection of solar facilities. Additionally, regulations were adopted that established a mechanism for creating solar renewable energy credits (“SRECs”) and a corresponding tracking site. To further streamline the process, an on-line Solar Renewable Energy Facility application form was introduced to the Commission’s website. Also, in 2009 the Commission approved
94 The information in this figure comes from PJM GATS, and does not include Commission
authorized renewable energy facilities that have not established a REC account with PJM GATS. Facilities are classified as “MD Certified” if they have applied to the Commission and received an approval number that is recorded in GATS.
95 For this discussion, the Mid-Atlantic states are classified as Pennsylvania, Maryland, Delaware, Virginia, New Jersey, and the District of Columbia (“D.C”). The combined capacity of these Mid-Atlantic state facilities is 3,803.5 MW, or approximately 68% of the total generating capacity of Maryland RPS-certified facilities.
96 The other six states referenced in the text are: Illinois, West Virginia, Indiana, New York, Ohio, Wisconsin, and North Carolina. The combined capacity of these facilities is 1,811.5 MW, or approximately 32% of the total generating capacity of Maryland RPS-certified facilities.
49
modifications to the solar regulations to reduce the filing requirements for small solar facilities. For compliance year 2010, an LSE subject to Maryland RPS compliance97 was obligated to purchase a minimum of 0.025% of its electricity resources from eligible solar sources.98 The solar RPS obligation increases incrementally each year until reaching the required 2.000% by 2022.99 If an LSE fails to offset the applicable percentage of retail electricity sales with electricity derived from solar resources or from the purchase of SRECs, then the LSE is responsible for making an alternative compliance payment as set forth in the RPS statute.100
An electricity supplier seeking to satisfy its solar RPS obligation may choose to accumulate credits from a renewable on-site generator for purposes of RPS compliance.101 The rated capacity of the renewable on-site generator governs the minimum contract terms by which the LSE and solar electricity generator must generally abide.
The Maryland Solar RPS grants customers the rights to the SRECs each system earns, and requires contract terms to be a minimum of 15 years when the renewable energy credits are purchased by an electricity supplier directly from the solar electricity generator. For facilities that are greater than 10 kW in rated capacity, the stipulation associated with an LSE purchasing SRECs directly from a renewable on-site generator to meet the solar component of the Maryland RPS is that the contract terms for the SRECs must be for no less than 15 years.102
An LSE that purchases SRECs directly from a solar renewable on-site facility that is less than 10 kW in rated capacity must do so through a contract that provides for an up-front lump sum payment for at least 15-years’ worth of SRECs at a price that is determined by the Commission. The up-front purchase of SRECs is intended to aid in financing the construction of this type of solar installation. The current proposed level of payment for the SRECs is the net present value of the 15-years’ worth of RECs using 80% of the compliance fee schedule, with a discount rate that is equal to the Federal Secondary Credit Interest Rate.103
Beginning January 1, 2012, electricity generated from a Tier 1 solar renewable source must be connected with the electric distribution grid serving Maryland in order for the generation to be eligible to create Maryland SRECs after that date. Until January 1, 2012, SRECS from non-Maryland Tier 1 solar renewable energy facilities located in PJM are eligible for the Maryland RPS only to the extent that there is a shortage of SRECs derived from facilities interconnected with the Maryland grid. All Maryland-based Tier 1 97 See supra Section VI.B. (discussing entities subject to the RPS obligation). 98 MD. CODE ANN., PUB. UTIL. § 7-703(b) (2011). 99 See supra Table VI.B.2. 100 MD. CODE ANN., PUB. UTIL. § 7-705(b) (2011). See supra Table VI.B.3. 101 MD. CODE ANN., PUB. UTIL. § 7-709(a) (2011). 102 MD. CODE ANN., PUB. UTIL. § 7-709 (2011). 103 See COMAR 20.61.
50
solar renewable energy facilities must be certified by the Commission as a Maryland renewable energy facility, prior to the facility being eligible to create Maryland-eligible SRECs. As of August 2011, GATS had registrations for 1,585 solar facilities in Maryland with a total capacity of 25.83 MW. The decisions made in surrounding states regarding RPS requirements, ACP levels, and the availability of state grants or subsidized loans may potentially impact the Maryland RPS program. The prices that Maryland LSEs will need to offer to obtain RECs in the spot market and under longer term arrangements may reflect the decisions of surrounding states. VII. ELECTRIC DISTRIBUTION RELIABILITY IN MARYLAND
The Commission supervises and regulates public service companies to promote the economical and efficient delivery of utility services in the State. Economical and efficient delivery of electricity depends on a well-planned, maintained, and operated distribution system.
A. Electric Distribution Reliability Reporting, Operation and
Maintenance Electric utilities serving 40,000 or more Maryland customers are required to file an Annual Reliability Report with the Commission. For each utility, the reports contain measurements of reliability for the preceding calendar year of the System Average Interruption Duration Index (“SAIDI”), the System Average Interruption Frequency Index (“SAIFI”) and the Customer Average Interruption Duration Index (“CAIDI”).104 Each investor-owned utility also reports the reliability measurements for a group of the least reliable electric feeders in its system for the year, together with the remedial actions it has taken to improve the reliability of those feeders. The same feeders are not permitted to appear on a utility's least reliable list in any two successive years under a COMAR provision designed to gradually increase over time the reliability of all feeders in the least performing range. The large electric cooperatives report the operating district with the least reliability for the year, together with the remedial actions taken to improve reliability within those districts.
Routine inspection and maintenance of existing distribution system equipment
must be performed periodically to help maintain a baseline level of reliability. All electric companies serving Maryland have developed written operation and maintenance (“O&M”) procedures pursuant to COMAR 20.50.02.04. The O&M procedures must list the specific inspection and maintenance tasks to be performed and the frequency with which the tasks are to be performed. The six largest electric utilities operating in Maryland are required to maintain their written O&M procedures with the Commission and to file annual updates of any changes that are made to those procedures. While the procedures vary somewhat from utility to utility, there are many common practices, since
104 CAIDI is calculated by dividing SAIDI by SAIFI.
51
the procedures should be based on utility experience and accepted good practice within the industry.
With respect to substations, periodic attention is typically given to power
transformers, various electrical relays and circuit breakers used primarily for equipment protection, and devices used for controlling voltage such as capacitors and voltage regulators.
For distribution feeder lines, inspection and maintenance attention is typically
focused on the electrical conductors in general, capacitors and other voltage regulators, automatic re-closers, electronic monitoring/control devices, vegetation management, and support poles for overhead equipment. Utilities have ongoing, proactive programs for replacement of aged underground electrical conductors, in addition to such activity in reaction to service interruptions. Some utilities inject conditioners into existing underground cable to increase its life expectancy.
The electric distribution system is a large-scale array of electric power circuits
and, increasingly, electronic sensing and control circuits. Excessive heat, whether generated internally or by a hot day, is one of the greatest threats to the proper operation of electric and electronic circuits. Electric utilities use infrared imaging technology in performing periodic inspections to identify substation equipment that is operating at a temperature higher than the normal range for proper operation. Some utilities include distribution feeder equipment in such inspections. The value in this procedure is that abnormally hot spots in electric conductors or equipment can often be detected and corrected long before they fail due to overheating.
Each utility is required by COMAR to keep sufficient records to demonstrate
compliance with its O&M procedures. The Commission’s Engineering Division conducts yearly inspection visits to the electric utilities to examine these records, in a continuing effort to assure basic distribution system reliability.
In recent years, electric distribution utilities have made efforts to raise the
baseline level of service reliability by increasing the automation of distribution feeders, with the potential to reduce both frequency and duration of sustained electric service interruptions. For example, some feeders can be connected with other feeders by switches that are normally off (open), but can be closed so that one of the feeders may temporarily supply part or all of a feeder experiencing an outage. Currently, many of these switches are manually operated, and require a utility crew to operate the switches to restore power. If the operation of such a switch is automated, either with local electronic intelligence or through remote operation from the distribution system control or operations center, service outage time to customers can be reduced.
Although electric service interruptions cannot be totally avoided, new utility
operating methods that could serve to improve reliability include more aggressive attempts to reduce the threat of large privately- and publicly- owned trees or large branches falling on overhead power lines. Utilities work to gain tree owner cooperation
52
to allow the removal of large trees near the lines or large branches overhanging the lines, which would help reduce the frequency of service outages, particularly during storms. Other efforts involve limiting the number of customers exposed to any given outage that does occur.
As members of Mutual Assistance Groups, the utilities share restoration crew manpower and other resources when outages increase beyond levels thought to be manageable using the utility's normal resources. Such assistance serves to reduce outage duration, one common measure of reliability. In addition to crew sharing, the groups hold conference calls for storm preparation for storm damage assessment, and to discuss overall restoration resource availability.
The four large investor-owned electric utilities operating in Maryland are members of the Mid-Atlantic Mutual Assistance group and the Southeastern Electrical Exchange. Another similar group, Maryland Utilities, includes municipal and cooperative electric utilities. These groups and others will continue to be important alliances in the years to come, as effective distribution outage management and storm restoration requires not only a community-wide effort, but sometimes also a regional or national effort.
B. Distribution Reliability Issues 1. Rulemaking No. 43 The Commission instituted Rulemaking No. 43 to adopt service quality and reliability standards. During the pendency of the Rulemaking, the Legislature enacted Chapter 167 of the 2011 Laws of Maryland also requiring the institution of service quality and reliability standards. The Commission convened a working group in this Rulemaking to make recommendation, which recommendations were presented to the Commission on October 27, 2011. The Commission considered the working group’s recommendations and other comments submitted thereon and adopted a set of comprehensive service quality and reliability standards. The standards include several major categories. The Commission adopted, for publication in the Maryland Register for notice and comment,105 system-wide SAIDI and SAIFI reliability metrics for each of the four investor-owned utilities and the two largest electric cooperatives. The SAIDI and SAIFI metrics are for calendar years 2012-2015, after which the Commission will institute company proceedings to determine future SAIDI and SAIFI reliability metrics. To ensure that groups or pockets of customers do not experience poor reliability, the Commission adopted standards to monitor utility feeders and protective devices that activate multiple times. These two reliability standards require the utilities to improve the performance of the poorest three percent of the utility’s feeders and protective devices that operate five or more times.
105 The term “adopted” in this subsection means “adopted for notice and comment.” These standards
have not been finally adopted as of December 31, 2011.
53
Additionally, the Commission adopted standards governing a utility’s effort to restore service interruptions. The service interruption standards call for electric service to be restored within certain time periods during normal conditions and when major outage events occur. Major outage events are weather-related or other events that cause an interruption in electric service to 100,000 or 10 percent of a utility’s customers, whichever is less.106 To ensure adequate utility response to downed electric wires, the Commission also adopted standards to direct utility response to hazardous downed wire events. The reliability and service quality standards also establish customer communication metrics related to how long it takes a utility representative to answer a customer’s calls, how many calls are abandoned and how much telephone line capacity is maintained for customer inquires. These standards establish the minimum level of expected service quality. Finally, the Commission adopted comprehensive vegetation management and periodic equipment maintenance standards. These two categories establish minimum practices for utilities when maintaining and operating their electric facilities.
The electric utilities are required to submit annual performance reports to the Commission summarizing electric service quality and reliability results. By July 1st of each year, the Commission shall determine whether each company met its service quality and reliability standards. The first review will be concluded by July 1, 2013 after considering utility performance during 2012.107 If a utility fails to meet one or more of its standards, the utility must file a corrective action plan if it fails a standard. The Commission will under take appropriate corrective action against a utility that fails to meet a standard, including imposition of appropriate civil penalty. Electric utilities will need to develop implementation plans or supplement existing plans to ensure their level of performance meets or exceeds the new service quality and reliability standards discussed above. 2. In the Matter of an Investigation into the Reliability and Quality of the Electric Distribution Service of Potomac Electric Power Company – Case No. 9240 As reported in the 2010 Annual Report, on August 12, 2010, the Commission initiated the docketed Case No. 9240 for the purpose of investigating the reliability of Pepco’s electric distribution system and the quality of electric distribution service that Pepco is providing to its customers. The initiation of the investigation was based on the unusually large number of complaints from Pepco’s customers and their elected officials alleging frequent and lengthy service outages during and after storm events as well as during “blue sky” conditions. Further, customers expressed frustration with the failure of
106 The interruption must last for 24 or more hours. 107 The standards adopted by the Commission are anticipated to become effective on July 1, 2012.
Thus, the first performance review will cover the portion of 2012 during which the standards are effective.
54
Pepco’s communications system during storm events, which resulted in the customers being unable to obtain estimated times of restoration or report outages. The Commission, in addition to holding a legislative-style hearing in August 2010 for the purpose of questioning the Company’s senior executive responsible for system reliability, storm restoration, and customer communications:
• held two evening hearings for public comment to permit members of the public and elected officials to provide their views on Pepco’s service quality and reliability;
• issued extensive data requests to the Company to produce documents and information;
• required Pepco to hire an independent consultant to evaluate Pepco’s distribution system and communication system (“Consultant”), and directed the Consultant to submit a report of the its findings and recommendations to the Commission; and
• held four days of evidentiary hearings at which the Consultant presented its findings and all parties, as well as the Commission, were able to cross-examine the consultant, the Company’s witnesses and the other parties’ witnesses on their pre-filed testimony.
Prior to the hearings in August 2010, the Company submitted its Reliability Enhancement Plan for Montgomery County, Maryland (“REP”). According to the Company, the REP was designed to significantly increase the reliability of its distribution system in Maryland over a five-year period and included the following six-point reliability programs: enhanced vegetation management; priority feeders; load growth; distribution automation; URD cable replacement; and selective undergrounding. The Company committed to making adjustments to plan as necessary, as the plan was implemented. In May 2010, Montgomery County filed its Pepco Work Group Final Report, which contained a series of findings and recommendations by a 12-member Work Group assembled by Montgomery County tasked with investigating the causes of Pepco’s frequent electricity outages in the County. The filing of this Work Group Report resulted in a contentious discovery dispute between Pepco and the County. After holding a hearing on the discovery dispute, the Commission issued a subpoena compelling Montgomery County to present a witness or panel of witnesses at the evidentiary hearing to sponsor and answer questions related to the Work Group Report. Montgomery County also responded to the discovery requests. In addition to the Company’s witnesses’ pre-filed testimony and the Work Group Report, pre-filed testimony was submitted by Technical Staff of the Commission, Maryland Office of People’s Counsel, Maryland Energy Administration, and the City of Gaithersburg. The City of Gaithersburg did not sponsor a witness and its testimony was
55
not admitted into the administrative record. The Apartment and Office Building Association of Metropolitan Washington intervened in the matter, but did not file testimony. The Office of People’s Counsel of the District of Columbia petitioned to intervene, but was ultimately granted status as an interested person rather than a party. On December 21, 2011, the Commission issued Order No. 84564 in which it concluded that, as alleged by its customers, Pepco had failed to provide an acceptable of reliable service during 2010 as well as several of the preceding few years. Similar to the findings of the Consultant, the Commission found that a direct cause of Pepco’s low level of reliability was its poor and ineffective maintenance of the vegetation surrounding its sub-transmission and distribution system. Specifically, the Commission pointed to the evidence in the record that Pepco failed to adequately fund its vegetation management, failed to meet its own annual tree trimming goals, and failed to adopt a more aggressive tree trimming practice similar to the practices adopted by other Maryland electric companies after 2001. Moreover, the Commission cited the decline of Pepco’s SAIFI figures (adjusted for major outages) during each year from 2004 to 2010 as proof of the steadily deteriorating level of reliability which coincided with Pepco’s poor vegetation management practices. These documented failures and deteriorating level of reliability as measured by SAIDI and SAIFI were evidence of the Company’s neglectful conduct and poor engineering practices sufficient to constitute a violation of its obligations to provide reliable service to its customers. Further, the Commission found that Pepco failed to conduct periodic inspections of its sub-transmission and distribution lines or to direct after-storm inspections or patrols as required by the National Electrical Safety Code (“NESC”) and COMAR 20.50.02.02. Although the Commission held that NESC Rule 214 does not require any precise intervals between inspections, it does require that the Company inspect at intervals experience shows is necessary. The lack of any procedure establishing an interval for periodic inspections reflected that the Company was not complying with the NESC rules or COMAR. Accordingly, based on Pepco’s failure to provide its customers reliable service and its violation of the regulations requiring it to periodically inspection its sub-transmission and distribution line, the Commission assessed Pepco a civil penalty of $1 million. Many of the parties in the matter requested that the Commission, in addition to fining the company, reduce Pepco’s authorized return on equity, restrict its payment of dividends to PHI, direct Pepco to waive its monthly customer charge, or modify or revoke Pepco’s authority to exercise its franchise. The Commission declined to adopt any of these additional penalties, but it agreed with the Maryland Energy Administration, Office of People’s Counsel and Montgomery County that it is
inequitable for Pepco to have caused significant reliability problems and escalating EIVM costs as a result of years of poorly executed and underfunded vegetation management programs and for the Company’s ratepayers to be burdened with full repayment for the EIVM programs that are now required as a direct result of the company’s imprudence.108
108 Order No. 84564 at 59.
56
Specifically, the Commission found that Pepco acted imprudently by: failing to execute adequate vegetation management; by neglecting to conduct periodic inspection or after-storm patrols; by engaging in uncertain and at times contradictory tree trimming practices between 1999 and 2010; and by refusing to transition to a four-year tree trimming cycle, consistent with other Maryland utilities and the recommendations of the tree Trimming Working Group.109 Because the Commission found that it was highly probably this imprudence increased the cost to ratepayers of the Company’s vegetation management programs beyond what they should have been if Pepco had acted prudently, the Commission determined that, in a future rate case, it will disallow recovery of any incremental amounts expended for Pepco’s vegetation management programs that is demonstrated to have been caused by Pepco’s imprudence. Additionally, the Commission designed a series of reporting requirements to ensure that Pepco is implementing its REP in a manner that is significantly increasing reliability. Also, in light of the Commission’s finding that Pepco’s ineffective communications system contributed to significantly to customer dissatisfaction, the Commission directed quarterly reports on Pepco’s effort to reform its communications issues. The Commission did not modify Pepco’s REP, as requested by certain of the parties, but encouraged Pepco to consider that comments or suggestions of these parties as it conducts its annual review of the REP to determine further updates that will improve reliability. Finally, the Commission warned Pepco that, in the event the periodic reports filed by the Company did not reflect improvement of service reliability, the Commission may consider a larger civil penalty or other additional penalties as justified by the circumstances. 3. Electric Service Interruptions Due to Hurricane Irene According to the United States Department of Energy (“DOE”), Hurricane Irene made landfall near Cape Lookout, North Carolina as a Category 1 hurricane at 8:00 a.m. EDT on August 27, 2011. In September 2011, the Commission initiated Case No. 9279 to investigate the electric service interruptions due to Hurricane Irene. Maryland’s four investor-owned utilities,110 along with SMECO and Choptank Electric Cooperative filed major storm reports, pursuant to Commission Order No. 84306 and in compliance with COMAR 20.50.07.07 in an effort to detail the utility’s response and preparation efforts regarding Hurricane Irene. According to data provided by utilities, customers began losing power at 7:50 a.m. EDT on August 27, 2011. Power was not restored to more than 99.9% all affected customers until 11:30 p.m. EDT on September 4, 2011.111 The utilities dispatched approximately 11,882 employees to restore power as a result of Hurricane Irene, with
109 Id. 110 BGE, Pepco, Delmarva, Potomac Edison 111 BGE restored power to 756,016 of the 756,395 affected customers at the declared end of the storm at 11:30 p.m. EDT on Sept. 4. See Baltimore Gas and Electric Company Major Storm Report – Hurricane Irene August 27 through September 4, 2011 p 34 for detailed explanation.
57
nearly half of the employees coming from outside the utility. Out of all of the impacted utilities, BGE experienced the highest peak of customer outages with 476,664; followed by Pepco, 194,516; SMECO, 104,328; Delmarva, 63,597; Choptank, 11,990112; and Potomac Edison, peaking with 8,554 customer outages. On October 31, 2011 the Commission issued Order No. 84445 in the matter of the electric service interruptions due to Hurricane Irene in the State of Maryland beginning August 27, 2011. As a result of this Order, the four IOUs as well as Choptank and SMECO were directed to undertake three specific categories of actions: (1) submit implementation plans in regard to the “lessons learned” issues identified in the respective post-Irene Major Storm Report; (2) participate in a work group tasked with developing standards to provide customers reasonable and reliable estimated time of restoration (“ETR”) information; and (3) file with the Commission the protocols used in determining restoration priority.113
C. Managing Distribution Outages
An important tool developed in recent years for managing electric distribution system outages is the computerized Outage Management System (“OMS”). When an outage occurs, a fully developed OMS accepts information inputs from several sources, including customers and systems internal to the utility, and uses that information to help develop output information as to the location and type of equipment that needs attention in order to end the outage. This output information can then be used to generate work orders for repairs or dispatch repair crews by way of a Mobile Dispatch System (“MDS”) using two-way radio communication. After repairs are made or other actions taken to end the outage, related outage information is entered as additional input into the OMS. The OMS then can identify what customers were affected by the outage, usually what caused the outage, and when it started and ended. 1. Typical Information Inputs to the OMS
• Customer Information System (“CIS”): When a customer calls in an outage, the customer interacts with elements within the utility that have access to the CIS, such as a Customer Service Representative, an automated Interactive Voice Response (“IVR”) unit, or a High Volume Call Service (“HVCS”). The CIS contains the customer's address, can identify the distribution system transformer that serves the customer, and passes this information on to the OMS. The OMS then can be used, with assistance from the next two listed inputs, to identify the location of the customer, both in terms of electrical position in the system diagram and geographic position.
112 See Choptank Electric Cooperative Major Storm Report – Hurricane Irene Sept. 21 at 1. The
utility explains that it believes the maximum number of peak outages is 11,990 members but the utility’s outage management software (OMS), which malfunctioned, reported 8,862 outages. The OMS was used to calculate the Storm Timeline and the data in Figure 1.
113 See Commission Order No. 84445, pg. 1-2.
58
The traditional CIS function will be transformed as some utilities
begin to implement elements of Advanced Metering Infrastructure. Advanced electric service meters and associated two-way communications systems between the customer and utility provide an information channel with the potential for use by both parties to make important decisions related to the efficient supply and use of electricity. AMI also promises faster detection of and more accurate utility response to electric service outages, and may largely replace the role of outage detection provided by customer calls within the traditional CIS.
• Energy Management System (“EMS”): The EMS includes an electronic
diagram of the electric system showing how elements are connected electrically. The EMS also uses remote monitoring devices such as those of the Supervisory Control and Data Acquisition (“SCADA”) system, so that information related to the operational condition of important, major pieces of electric system equipment can be passed on to the OMS.
• Geographic Information System (“GIS”): The GIS includes a map of key
landmarks such as streets, and it shows the location of important elements of the electric system relative to those landmarks. This relationship is clearly important in the effort to get repair crews to the heart of the matter. In addition to providing information to the OMS, both the EMS electric system diagram and the GIS map can be displayed on computer monitors and are used by dispatchers to direct the efforts of repair crews.
• Mobile Dispatch System and Work Management System (“WMS”): After
an outage is cleared, a work order is closed out within the WMS, and in some cases the repair crew can directly close the outage with, and enter related information directly into, the OMS using the MDS. The WMS or MDS information usually includes the time of restoration and the cause of the outage. After this information input is made, the OMS then contains an archive of important information about the entire history of the outage.
2. Typical Information Outputs from the OMS
• Information about the type of equipment involved in the outage and its location is passed to the WMS or MDS so that crews can be effectively dispatched to clear the outage.
• Prior to the clearing of an outage, an Estimated Time of Restoration
(“ETR”) and other information can be fed back to the CIS, so customers calling in who are affected by a particular ongoing outage may be kept informed.
59
• Information concerning outages can be extracted from the OMS in near real-time to feed Internet websites containing outage reports or outage maps.
• The OMS can be queried for outage information to be used to generate
reports concerned with reliability statistics for the entire distribution system or any part thereof.
The four large investor-owned electric utilities operating in Maryland and the
large electric cooperatives, Choptank and SMECO, have implemented OMS, each with functionality developed generally to the extent described above.
Improvements and efforts to increase the functionality of the OMS elements are
ongoing. As with most computer and software-based systems, the OMS evolves with each new software upgrade, and as utilities learn how to best utilize the systems. Furthermore, the OMS is expected to evolve in the next few years as a result of the Commission’s Order No. 84445 in the matter of the electric service interruptions due to Hurricane Irene in the State of Maryland beginning August 27, 2011. The Order directs the four investor-owned electric utilities and SMECO to participate in a work group tasked with developing standards to provide customers reasonable and reliable ETR information; ETR information is a typical information output from an OMS system.114 Additionally, Pepco’s system tasked with providing customers and emergency management personnel timely outage-related information remains under review in Case No. 9240.
D. Distribution Planning Process The role of an electric distribution system planner begins with identification of customer needs, both for the near term and the longer term. Once identified, those needs are translated into a flexible plan involving the engineering and operations functions necessary to meet those needs. Short term planning typically focuses on system expansion to keep pace with electric load growth and maintenance or improvements related to reliability or safety of the system, with a forecast horizon of a few years. Longer term planning, with a forecast horizon of 10 to 20 years, may include expectations of new technologies and altered business climate, in addition to considerations of expanded load growth, reliability, and safety of the system.
A sampling of the largest electric distribution system projects and programs, ongoing, planned, or in development by Maryland's large electric companies, follows.
114 See Commission Order No. 84445, pg. 1-2.
60
1. PE
• In 2012, PE expects to complete construction of two substations, to serve the town of Keedysville and surrounding area, and to serve the area of Lappans Crossroads.
• PE plans to complete a major upgrade of facilities at its Urbana substation in 2012 to provide additional capacity to serve the town of Urbana and the surrounding area.
• PE plans to complete construction in 2013 of a substation to serve the town of Walkersville and the surrounding area.
• In 2014, PE plans to upgrade three substations. The substations supply an area west of Frederick, an area south of Frederick, and the Taneytown area.
• PE plans to complete the construction of a new substation to serve an area around Deep Creek Lake by 2014.
• PE expects to complete a capacity upgrade of a substation serving an area south of Mt. Airy in 2017.
• PE plans to construct a new substation to serve the area southwest of Frederick in 2019.
2. BGE
• BGE plans to construct three additional new substations by the end of 2012. The substations are to serve the Fallston area of Harford County, the Laurel area of Howard County, and the Sykesville area of Carroll County.
• BGE expects to finish the rebuilding of a substation serving northern Baltimore City/Baltimore County in 2012. The utility also expects to complete work to transfer load between feeders and substations to benefit the Westport area of Baltimore City in 2012. The work will retire aging facilities and increase reliability of the network distribution system in the area.
• In 2013, BGE plans to build a new substation to serve load growth in the Konterra Town Center and to relieve other existing substations in the Laurel area. Plans for 2013 also include completing a capacity upgrade in a substation serving Prince George's County.
• BGE plans to complete the construction of two new substations and the rebuilding of two others in 2014. The rebuilding efforts will retire aging facilities and increase electric capacity. These efforts will benefit the Cockeysville and Towson areas of Baltimore County, and the Carroll/Calverton area of Baltimore City.
• Between 2015 and 2016, BGE intends to build five new substations and rebuild two others. The work would provide additional electric capacity to three areas in Harford County, three areas in Baltimore City, and the Hampstead area of Carroll County.
61
3. Choptank
• Choptank expects load growth to occur along the U.S. Route 301 corridor in Kent and Queen Anne Counties, Chestertown, Cambridge, Easton, the west side of Salisbury, and the east side of Berlin.
• Construction of a new substation to serve the Cambridge area is planned for completion by the end of 2012. Currently, most of Choptank's electrical load in Dorchester County is supplied by one substation, which constitutes a single point of connection to the transmission grid. The addition of the new substation would create a backup delivery point in addition to providing increased capacity.
4. DPL
• DPL plans to complete the construction of a substation to serve southern Talbot County in 2012.
• To serve southwestern Kent County, DPL plans to construct a substation and extend two feeders in 2013. The utility also intends to complete construction of a new substation that year to serve growing electrical load in Harford County.
• DPL expects to complete the construction of a substation and the extension of three feeders in 2014 to serve Cecil County.
• During 2017, DPL intends to complete construction of a new substation to serve the Queenstown area of Queen Anne's County, and the rebuilding of a substation to serve the Salisbury area.
5. Pepco
• During 2012, Pepco plans to build two new feeders and to extend two others to serve the Lanham area of Prince George's County. Plans for the year also include extending and increasing the capacity of an existing feeder to serve the Greenbelt Station Project.
• By the close of 2012, Pepco plans to complete construction of a new feeder and the extension of another to meet the electricity needs of the National Harbor Development and the Gaylord National Hotel and Conference Center.
• Pepco’s plans for 2013 include a capacity upgrade of a substation serving the Colesville, Rossmoor, and Fairland areas of Montgomery County.
• Pepco plans to complete the construction of a substation in 2014 to supply the Westphalia Town Center and the Melwood and Forestville areas of Prince George's County.
62
• To accommodate the projected demand for electricity in the Hunting Hill, Shady Grove, and Fernwood Road areas of Montgomery County, Pepco plans to complete the construction of two substations by mid-2015. By the close of that year, the utility intends to extend three feeders to serve the Woodmount area of Montgomery County.
• Pepco plans to complete the construction of a new substation in 2017 to accommodate load growth in the Beltsville area of Prince George's County.
6. SMECO
• During 2013, SMECO plans to purchase an additional mobile substation to be used to provide backup power during outage contingency situations in areas where providing backup power through distribution feeder switching is difficult or impossible.
VIII. MARYLAND ELECTRICITY MARKETS The Electric Customer Choice and Competition Act of 1999 (“Electric Choice Act”) established the legal framework for the restructuring and revised regulation of the electric industry in Maryland. The Electric Choice Act altered the Commission’s role relative to electricity generation and provided that retail electric choice would be available to all customers. Beginning on July 1, 2000, all retail electric customers of IOUs in the State were given the opportunity to choose their electricity supplier. Since July 1, 2003, customers of Maryland’s electric cooperatives have had the right to choose suppliers under a separate schedule adopted by the Commission. Customers of Maryland’s municipal electric utilities will be allowed to choose suppliers on a timetable established in part by the municipal utilities.
A. Status of Retail Electric Choice in Maryland
Customers shopping for electricity in Maryland may choose to buy electricity from a competitive supplier or to take standard offer service from their local electric company. This framework was established by the Electric Choice Act of 1999. This Act deregulated the pricing of electric generation and opened retail markets to competitive suppliers. Opening retail markets for competition has attracted competitive suppliers to Maryland. As of December 1, 2011, Maryland has 65 licensed electricity suppliers and 146 licensed electricity brokers.115 As of December 1, 2011, the following numbers of companies had registered on the Commission’s website as actively soliciting new customers in any Maryland service territory: 32 serving residential load, 65 serving industrial load, 70 serving commercial load, and 18 serving other types of load (such as government).
115 See Table A-6.
63
An examination of the number of customers using a competitive supplier indicates that the transition from utility-supplied generation service to electric competition in Maryland shows that a smaller percentage of residential customers have switched to retail suppliers than non-residential customers. As of September 30, 2011, 19.2% of residential customers, 29.3% of small commercial customers, 56.3% of mid-sized commercial and industrial customers and 91.7% of large commercial and industrial customers were served by retail electricity suppliers. In terms of total electricity supply, almost half of IOU load (47.3%) was served by retail electricity suppliers as of September 30, 2011.
In 2011, residential switching continued to increase as the number of Residential
Choice customers increased by 42% statewide. The increase in switching may be due to the availability of savings over the Standard Offer Service rates. Certain residential electricity offers have been observed to be on the order of 10% below the cost of Standard Offer Service, saving an average customer about $150 per year. The implementation of utility purchase of retail supplier receivables in 2010 for those suppliers that use utility billing probably also played a significant role in the increase in the number of residential customers served by retail electricity suppliers.
The following table illustrates the increase in residential customer switching during 2011:
Table VIII.A.1: Residential Customers Enrolled in Retail Supply
Source: Electric Choice Enrollment Monthly Reports. Note: 2011 data is as of September 30, 2011.
Between December 2005 and September 2011, the total number of customers statewide served by electricity suppliers increased from 39,527 to 553,438 customers. During the same time, the number of customers served by electricity suppliers in BGE’s service territory increased from 3,347 to 339,932.
64
Table VIII.A.2: Electric Choice Enrollment in Maryland as of September 30, 2011
Number of Customers Served by Competitive Electricity Suppliers
Utilities Residential Small C&I Mid C&I Large C&I All C&I Total
BGE 250,856 28,822 15,037 679 44,538 339,932
DPL 17,481 6,828 2,841 70 9,739 36,959
PE 16,101 6,760 3,211 113 10,084 36,269
Pepco 98,310 11,283 9,196 505 20,984 140,278
Total 382,748 53,693 30,285 1,367 85,345 553,438
Percentage of Peak Load Obligation Served by Competitive Electricity Suppliers
Utilities Residential Small C&I Mid C&I Large C&I All C&I Total
BGE 23.9% 34.5% 71.0% 95.5% 78.5% 48.7%
DPL 11.8% 38.2% 69.9% 91.8% 70.2% 37.4%
PE 8.1% 34.2% 64.0% 62.4% 61.1% 34.2%
Pepco 21.9% 42.4% 72.1% 94.5% 80.1% 52.7%
Total 20.9% 36.4% 70.5% 91.1% 76.5% 47.3% Source: Electric Choice Enrollment Monthly Report, Month Ending September 2011. Notes: Small commercial and industrial (“C&I”) customers are commercial or industrial customers with demands less than or equal to 25 kW. These customers are eligible for “Type I” fixed-price utility SOS if they do not switch to a supplier. Mid-sized C&I customers are commercial or industrial customers with demands greater than 25kW, the level for small C&I service (Type I SOS) but less than 600 kW. These customers are eligible for “Type II” fixed price utility SOS if they do not switch to a supplier. See Case Nos. 9037 and 9056 for more information on the Type II customer class. Large C&I customers are commercial or industrial customers with demands equal to or greater than 600 kW. These customers are no longer eligible for “Type III” SOS and receive hourly-priced service (based on PJM hourly LMP) if they do not switch to a supplier.
B. Standard Offer Service Standard Offer Service (“SOS”) is electricity supply service sold by electric utility companies to any customer who does not choose a competitive supplier. The statute requires that SOS should be “designed to obtain the best price for residential and small commercial customers in light of prevailing market conditions at the time of the procurement and the need to protect these customers against excessive price increases.”116
Except for Potomac Edison,117 the investor owned electric companies provide
SOS by purchasing wholesale power contracts with two-year terms twice a year, for 116 MD. CODE ANN., PUB. UTIL. § 7-510(c)(4)(ii) (2011). 117 PE procures its residential and small commercial SOS full service requirement through the sealed
bid process similar to the other IOUs, but they procure a portion of the SOS load four times a year and the length of the contract varies.
65
residential and small commercial service of two-year terms, through sealed bid procurements. These procurements take place in the Spring and Fall for service starting the following Fall and Summer; each procurement covers roughly 25% of the total SOS load. Consequently, the SOS price for residential and small commercial customers at any one time reflects an average of market conditions on those four bid days.
SOS for mid-sized non-residential customers is not intended to stabilize prices
over an extended period of time. Mid-sized non-residential SOS is procured through sealed bids for three-month contracts procured four times a year. The price of the service at any one time reflects market conditions on the most recent bid day.
SOS for SMECO is procured by the cooperative through an actively managed
portfolio approach. Choptank provides SOS through procurement of full-requirements wholesale service through the Old Dominion Electric Cooperative.
IX. REGIONAL ENERGY ISSUES AND EVENTS A. Overview of PJM, OPSI, and Reliability First The flow of electricity and the electricity markets are undeniably regional concepts. Maryland is not an energy island—the transmission lines located within Maryland do not terminate at our borders, but rather are connected to the transmission lines in adjoining states.
The entire State of Maryland resides within PJM, the RTO that coordinates the movement of wholesale electricity in all or parts of Delaware, Illinois, Indiana, Kentucky, Maryland, Michigan, New Jersey, North Carolina, Ohio, Pennsylvania, Tennessee, Virginia, West Virginia, and the District of Columbia. The FERC is responsible for approving tariff changes proposed by PJM, which wholesale market entities operating in Maryland must abide by as a member of PJM.
The Organization of PJM States, Inc. (“OPSI”) is an organization of statutory
regulatory agencies in the 13 states and the District of Columbia that form PJM. The Commission is a member of OPSI.
In addition, Maryland falls within the boundaries of Reliability First, one of eight
regional entities approved by North America Electric Reliability Council (“NERC”) as of January 1, 2006 to develop and enforce regional reliability standards.
66
1. PJM Interconnection, LLC PJM, as an RTO, keeps the electricity supply and demand in balance by providing
power producers price signals to generate sufficient power to match supply with demand and by adjusting import and export transactions. In managing the grid, the company dispatches about 180,400 MW of generating capacity over 61,200 miles of transmission lines.118 PJM exercises a broader reliability role than that of a local electric utility. PJM system operators conduct dispatch operations and monitor the status of the grid over a wide area, using an enormous amount of telemetered data from nearly 74,000 points on the grid.119 This gives PJM a big-picture view of regional conditions and reliability issues, including those in neighboring systems.
PJM also manages a sophisticated regional planning process for generation and
transmission expansion to ensure the continued reliability of the electric system. PJM is responsible for maintaining the integrity of the regional power grid and for managing changes and additions to the grid to accommodate new generating plants, substations and transmission lines.
PJM’s members (totaling more than 750) include: power generators, transmission
owners, electricity distributors (including Maryland utilities), power marketers and large consumers.120 The Commission is not a member of PJM (meaning it is unable to cast a vote); however, it does monitor and actively participates in stakeholder and committee processes at PJM.
2. Organization of PJM States, Inc. OPSI was established in 2005. OPSI, among other things, coordinates activities such as data collection, issue analyses, and policy formulation related to PJM, its operations, its market monitor, and related FERC matters.121 OPSI provides a means for the PJM states to act in concert with one another when it is deemed to be in their common interest. Actions of OPSI, however, do not bind individual commissions or the states they represent.
Each state commission has a member on the OPSI Board of Directors. Chairman Nazarian of the Commission served as OPSI President during 2009. Commissioner Brenner currently serves as the Commission’s member on the OPSI Board of Directors.
During 2011, OPSI was particularly active in facilitating the development of the
Independent State Agency Committee (“ISAC”). The purpose of ISAC is to provide PJM with modeling input for potential transmission planning studies. However, no ISAC 118 PJM’s Role as an RTO, PJM (June 1, 2011), http://www.pjm.com/~/media/about-
pjm/newsroom/fact-sheets/pjms-role-as-an-rto-fact-sheet.ashx. 119 Company Overview, PJM, http://www.pjm.com/about-pjm/who-we-are/company-overview.aspx
(last visited December 1, 2011). 120 Company Overview, PJM, http://www.pjm.com/about-pjm/who-we-are/company-overview.aspx
(last visited December 1, 2011). 121 Organization of PJM States, Inc., available at: http://www.opsi.us.
67
member will be bound by the results of any PJM transmission planning study. Furthermore, the participation of any state in ISAC proceedings will not be considered an assessment of the merits of any particular transmission expansion project. As an OPSI Board member, the Commission will serve as the lead agency on ISAC for the State. The Commission continues to be a very active participant in OPSI. 3. Reliability First Corporation
ReliabilityFirst is a not-for-profit company which began operations on January 1, 2006. ReliabilityFirst's mission is to preserve and enhance electric service reliability and security for the interconnected electric systems within the ReliabilityFirst geographic area. The Boundaries of ReliabilityFirst are defined by the service territories of Load Serving Entities and include all of New Jersey, Delaware, Pennsylvania, Maryland, District of Columbia, West Virginia, Ohio, Indiana, Lower Michigan and portions of Upper Michigan, Wisconsin, Illinois, Kentucky, Tennessee and Virginia. ReliabilityFirst's primary responsibilities include developing reliability standards and monitoring compliance to those reliability standards for all owners, operators and users of the bulk electric system and providing seasonal and long-term assessments of bulk electric system reliability within its Region. The Commission monitors ReliabilityFirst activities and comments if necessary.
B. PJM Summer Peak Events of 2010 and 2011 Peak load is maximum load usage during a specified period of time. Table IX.B.1 provides the coincident peaks as measured by PJM to illustrate the maximum amount of MW usage in PJM at a particular time during a 12-month period. PJM is a summer peaking region, meaning that it has historically experienced its peak loads during hot summer days when air-conditioning usage increases to meet cooling demand. PJM measures energy usage over an hour; accordingly, the data in the table below means the peak occurred sometime in the 59 minutes preceding the hour listed. The table also shows the average LMP for each Maryland utility zone and for all of PJM at the peak hours.
68
Table IX.B.1: Summer 2010 and 2011 Coincident Peaks and Zone LMP
Summer 2010 Coincident Peaks Zone LMP During the Peak Day Date Hour MW PE BGE DPL PEPCO PJM Tuesday 7/6/2010 17:00 136,950 $146.60 $331.01 $332.23 $250.24 $194.70Wednesday 7/7/2010 17:00 137,788 $139.44 $183.75 $196.80 178.59 $135.93Friday 7/23/2010 17:00 134,917 $164.76 $271.36 $213.22 $231.33 $169.13Tuesday 8/10/2010 17:00 132,570 $145.08 $152.42 $137.34 $141.86 $137.93Wednesday 8/11/2010 17:00 131,949 $129.64 $126.25 $122.75 $153.04 $114.67 Summer 2011 Coincident Peaks Zone LMP During the Peak Day Date Hour MW PE BGE DPL PEPCO PJM Wednesday 6/8/2011 17:00 144,394 $267.88 $422.85 $352.54 $417.40 $279.82Tuesday 7/19/2011 17:00 145,253 $96.18 $101.78 $104.43 $99.20 $99.25 Wednesday 7/20/2011 17:00 150,121 $179.70 $195.48 $207.51 $186.14 $187.70Friday 7/21/2011 17:00 158,121 $165.32 $199.17 $196.36 $162.03 $162.36Thursday 7/22/2011 15:00 152,921 $182.94 $361.51 $407.29 $209.20 $229.54
The 2011 summer peak events in PJM were higher than the summer peak events that occurred in 2010. Table IX.B.1 above shows the summer 2011 and 2010 coincident peaks in PJM and the average real-time LMP by zones located in Maryland during that time period. The summer 2011 peak was 158,121 MW and occurred on July 21, 2011 during the hour ending 5:00 PM Eastern Daylight Time.122 The summer 2010 peak was 137,788 MW and occurred on July 7, 2010 during the hour ending 5:00 PM Eastern Daylight Time.123
C. PJM’s Reliability Pricing Model
As a means of ensuring reliability of the electric system in the RTO, PJM annually conducts a long-term planning process that compares the potential available generation located within the RTO and the import capability of the RTO against the estimated demand of customers within the RTO and establishes the amount of generation and transmission required to maintain the reliability of the electric grid within PJM. The amount of capacity procured in PJM’s Reliability Pricing Model (“RPM”) is roughly based upon a forecast of the peak load projected by PJM for a particular year, plus a reserve margin. RPM works in conjunction with PJM’s RTEP to ensure reliability in the PJM region for future years.
Using this information, PJM evaluates offers from generators and other resources three years in advance to be available for a one year delivery period running from June through May (up to three years for new generation) through the Base Residual Auction (“BRA”).124 Once PJM completes its RTEP and conducts the RPM BRA, PJM is in a position to evaluate the reliability of its system. PJM must operate the transmission system to meet reliability criteria established by the FERC and administered by the NERC.
PJM held the BRA for the 2014/2015 delivery period in May 2011. PJM
calculated the RTO reliability requirement to be 148,323.1 MW, which includes a 15.3% reserve margin. However, as a result of the administratively determined downward sloping demand curve - the Variable Resource Requirement - more resources than needed cleared the market. In 2011, 149,974.7 MW cleared the BRA, which essentially increased the reserve margin to 20.6%. This means 1,651.6 MW in excess of the reliability requirement were procured in the BRA. Approximately 10,511.6 MW of excess capacity was offered into the 2014/2015 BRA (i.e., this capacity did not clear); accordingly, for the 2014/2015 delivery year, approximately 12,163.2 MW of capacity in excess of the RTO reliability requirement was offered into the BRA.125
The “Net Load” capacity prices for the IOUs in Maryland for each of the eight completed BRAs are presented in Table IX.C.1. The estimated total capacity cost to Maryland of each BRA is also presented. The Net Load capacity price reflects the BRA clearing price and credits from any transmission capacity transfer rights. Maryland has experienced significant volatility in Net Load prices from the past eight BRAs. The Net Load cost to Maryland from the first BRA for the 2007/2008 delivery year was approximately $693 million. By the 2009/2010 BRA, capacity cost had increased to approximately $1.131 billion before declining to $580 million for 2011/2012 and then again increasing to approximately $1.1 billion for 2013/2014. The 2014/2015 BRA experienced another decline in capacity cost, totaling over $700 million. The observed historical pattern of results suggests that future BRA results could vary significantly from year to year and must be closely monitored.
124 Reliability Pricing Model, PJM MARKETS & OPERATIONS, available at:
http://www.pjm.org/markets-and-operations/rpm.aspx. 125 2014/2015 Base Residual Auction Report, PJM MARKETS & OPERATIONS, available at:
D. Region-Wide Demand Response in PJM Markets Demand Response continues to be actively promoted within the wholesale electricity markets. PJM provides the opportunity for DR to be bid into the Energy, Capacity, Synchronized Reserve, Day-Ahead Scheduling Reserve, and Regulation markets. 15,545 MW of demand resources were offered into the 2014/2015 BRA, which represents an increase of 20% over the amount offered into the 2013/2014 BRA.127 Of that amount, 14,118 MW cleared, which is 4,836.5 MW greater than that which cleared in the 2013/2014 BRA.128
PJM has two basic energy and capacity market demand response programs: the Economic Load Response Program and the Emergency Load Program. The goal of these programs is to provide economic incentives for end-use customers to curtail their electricity usage in the circumstances of either peak periods or unexpected outages.
126 The “Net Load” price for each company is the RPM auction price adjusted for any capacity
transfer credits and load variations from forecast. The total Maryland cost assumes a constant demand for the periods shown based on the summer peak load contribution for each company’s transmission zone. The PE zone includes PE, the municipal electric companies of Hagerstown, Thurmont, Williamsport, and Somerset Rural Electric Cooperative electric loads. The DPL zone includes DPL Maryland, Choptank, the municipal electric companies of Easton, Berlin, and A&N Electric Cooperative loads. The Pepco zone includes Pepco Maryland and SMECO loads.
127 2014/2015 RPM Base Residual Auction Results, PJM MARKETS & OPERATIONS (Nov. 18, 2010), http://pjm.com/markets-and-operations/rpm/~/media/markets-ops/rpm/rpm-auction-info/20110513-2014-15-base-residual-auction-report.ashx. The newly integrated American Transmission Systems, Inc. (“ATSI”) transmission zone accounted for 1,384 MW of the total increase, while the other transmission zones accounted for the remaining 1,720 MW. Id. at 2.
128 Id.
71
1. Economic Load Response Program
The PJM Economic Load Response Program (“ELRP”) is a PJM-managed accounting mechanism that provides for payment of the real savings that result from load reductions to the load reducing customer. This is a voluntary program that allows customers the opportunity to reduce their load and receive payments in either the energy market or the ancillary services market, which includes reserve and regulation. Payments in the energy market generally are based upon the difference between retail rates and day ahead or real-time LMP. Customers who elect to have their load reductions dispatched by PJM are guaranteed to receive a payment equal to their offer into the market. Payments in the ancillary services markets generally are based upon the market clearing price. 2. Emergency Load Program
The PJM Emergency Load Program is designed to provide a method by which end-use customers may be compensated by PJM for reducing load during an emergency event. The Emergency-Capacity Only program provides RPM payments for reducing capacity and reduction is mandatory. The Emergency-Full program provides both RPM payments and energy payments for reducing capacity, and reduction is mandatory. The Emergency-Energy Only program provides energy payments to end-use customers for voluntarily reducing load during an emergency event. The energy payment is the zonal LMP, but customers who elect to have their load reductions dispatched by PJM are guaranteed to receive a payment equal to their offer into the market, including shutdown costs. The 2014/2015 BRA is the first under which two additional demand resource products were offered: Annual DR which is available throughout the year, and Extended Summer DR, which is available for an extended summer period. These new products have fewer limitations than the current DR product.
X. PROCEEDINGS BEFORE THE FEDERAL ENERGY REGULATORY COMMISSION
The Commission is actively engaged in wholesale energy market policy development at PJM. While the Commission is not a formal stakeholder in the stakeholder process, the Commission does actively engage on issues and voice its concerns regularly, both independently and as part of OPSI. The Commission participates in the policy development process because decisions made at PJM directly affect the price of electricity and related services to Maryland customers.
PJM holds more than 300 stakeholder meetings each year for more than two
dozen committees, subcommittees, task forces, and working groups. The Commission assigns one or more Commission Advisors to represent the Commission at the major policy-setting groups. These groups include the Members Committee, the Markets & Reliability Committee, the Markets Implementation Committee, the Planning Committee, and the Regional Planning Process Task Force. Other Commission Staff cover technical and engineering-related meetings, such as the Transmission Expansion Advisory
72
Committee, Resource Adequacy Analysis Subcommittee, Demand Response Subcommittee, and the Load Analysis Subcommittee.
Some of the issues in which the Commission is regularly engaged include load forecasting, demand response, price responsive demand, the capacity market, shortage pricing, governance, transmission planning and reliability planning criteria. While many of these issues are ultimately litigated at FERC, where the Office of General Counsel represents the Commission, being involved in PJM’s stakeholder process gives the Commission early input into the important issues as they emerge. APPENDIX The Appendix contains a compilation of data provided by Maryland’s electric companies, including the number of customers, sales by customer class, and typical utility bills, as well as forecasted peak demand and electricity sales over the next fifteen years, by utility. It also includes a list of licensed electricity and natural gas suppliers and brokers in Maryland, renewable energy projects, planned transmission enhancements, and potential new power plants in Maryland.
73
74
Table A-1: Utilities Providing Retail Electric Service in Maryland
Utility Service Territory A&N Electric Cooperative Smith Island in Somerset County Baltimore Gas & Electric Company Anne Arundel County, Baltimore City, Baltimore
County and portions of the following counties: Calvert, Carroll, Howard, Harford, Montgomery, and Prince George's.
Town of Berlin Town of Berlin. Choptank Electric Cooperative Portions of the Eastern Shore. Delmarva Power & Light Company Major portions of ten counties primarily on the
Eastern Shore. Easton Utilities Commission City of Easton. Hagerstown Municipal Electric Light Plant
City of Hagerstown.
Potomac Edison Company Parts of Western Maryland. Potomac Electric Power Company Major portions of Montgomery and Prince George's
Counties. Somerset Rural Electric Cooperative Northwestern corner of Garrett County. Southern Maryland Electric Cooperative Charles and St. Mary's Counties; portions of Calvert
and Prince George's Counties. Thurmont Municipal Light Company Town of Thurmont Town of Williamsport Town of Williamsport Source: Table 1 in Company data responses to the Commission’s 2011 data request for the Ten-Year Plan.
Table A-2: Number of Customers by Customer Class as of December 31, 2010
Utility/Co. Residential Commercial Industrial OtherSales for Resale Total Residential Commercial Industrial Other
Source: Company data responses to Table A-2 in the Commission's 2011 data request for the Ten-Year Plan. Note: A&N did not provide the requested information.
75
Table A-3: Typical Monthly Electric Bills in Maryland (Winter 2010)
Source: Table A-3 in Company data responses to the Commission's 2011 data request for the Ten-Year Plan. Note: For those utilities that have retail competition available, bills and revenues reflect SOS, distribution service and any non-bypassable charges. Note: Winter is defined as Dec. 1 through Feb. 29--as defined by PJM. Note: A&N did not provide the requested information.
76
Table A-4(a): System Wide Peak Demand Forecast as of December 31, 2010 (MW) (Net of DSM Programs)
Source: Table A-5 in Company data responses to the Commission's 2011 data request for the Ten-Year Plan.
Table A-6: Maryland Licensed Electric/Natural Gas Suppliers and Brokers as of December 1, 2011
CompanyElectricity Supplier
License No.
Electricity Broker
License No.
Natural Gas Supplier
License No.
Natural Gas Broker
License No.5Linx Enterprises, Inc. IR-2167 IR-2166A Better Choice Energy Services IR-1697 IR-1698Acclaim Energy, Ltd. IR-1726 IR-1728Advantage IQ, Inc. IR-2240 IR-2242Affiliated Power Purchasers International, LLC IR-279 IR-2127Affinity Energy Management, LLC IR-2016 IR-2104Allegheny Energy Supply IR-229 IR-229Alphabuyer, Inc. IR-2214 IR-2217Ambit Northeast, LLC IR-1992 IR-1993Ameresco, Inc. IR-2145 IR-2144Amerex Brokers, LLC IR-1513 IR-1512America Approved Commercial, LLC IR-2174America Approved Energy Services Direct, LLC IR-1841American Power Partners LLC IR-2142American PowerNet Management, L.P. IR-604AOBA Alliance, Inc. IR-267 IR-375AP Gas & Electric (MD), LLC d/b/a APG&E IR-2231API Ink, LLC IR-1399ARS International, Inc. IR-1181Avalon Energy Services, LLC IR-1693 IR-1743Better Cost Control, LLC d/b/a Ardor Power IR-2082BGE Home Products and Services, Inc. also d/b/a BGE Commercial Building Systems IR-311BGE Home Products and Services, Inc. also d/b/a BGE Commercial Building Systems d/b/a Constellation Electric IR-228BidURenergy, Inc. IR-1847 IR-1846BlueStar Energy Services IR-757Bmark Energy, Inc. IR-2018Bollinger Energy Corporation IR-265 IR-322BP Energy Company IR-676BTU Energy, LLC IR-864C & D Commercial Brokerage, Inc. t/a Capital Energy Solutions IR-1823Castlebridge Energy Group IR-1735Castlebridge Energy Group, LLC IR-2331CCES, LLC IR-2161Champion Energy Services, LLC IR-2196Chesapeake Energy Services, Inc. IR-1638Choice! Energy Services IR-682Clean Currents, LLC IR-980 IR-1782Clearview Electric, Inc. IR-2009Coastal Energy Company, LLC IR-1900Co-eXprise, Inc. IR-879 IR-879Coleman Hines, Inc. IR-1389Colonial Energy, Inc. IR-606Commerce Energy, Inc. IR-639 IR-737
83
CompanyElectricity Supplier
License No.
Electricity Broker
License No.
Natural Gas Supplier
License No.
Natural Gas Broker
License No.Commercial and Industrial Energy Solutions, LLC IR-2062Commercial Utility Consultants, Inc. IR-2361Compass Energy Services IR-652Competitive Energy Services-Maryland, LLC IR-895 IR-895ConocoPhillips Company IR-1359ConocoPhillips, Inc. IR-378Consolidated Edison Solutions, Inc. IR-603Constellation Energy Projects and Services Group, Inc. IR-239Constellation NewEnergy, Inc. IR-500 IR-522Constellation NewEnergy-Gas Division, LLC IR-655Consumer Energy Solutions, Inc. IR-1210Coral Energy Gas Sales, Inc. IR-360CQI Associates, LLC IR-575 IR-1753Creativ Energy Options IR-1528Current Choice, Inc. IR-2153Cybermark Systems, Inc. d/b/a Proenergy Consultants IR-1785Cypress Natural Gas, L.L.C. IR-674DD&J LLC IR-1560Delta Energy, LLC IR-645Direct Energy Business f/k/a Strategic Energy IR-437Direct Energy Services, LLC IR-719 IR-791Dominion Retail, Inc. t/a Dominion Energy Solutions IR-252 IR-345Downing Place, LLC IR-2011DTE Energy Trading, Inc. IR-686E Source Companies, LLC IR-2017 IR-2021Early Bird Power IR-1798Eastern Shore of Maryland Educational Consortium Energy Trust dba ESMEC Energy Trust IR-342EDF Trading North America, LLC IR-2019EGP Energy Solutions, LLC d/b/a Atlantic Energy Resources IR-1363 IR-1430Eisenbach Consulting, LLC IR-1950 IR-1951Electric Advisors, Inc. IR-1183 IR-1523Ellicott City Investments, LLC d/b/a Allied Power Services IR-1890 IR-1891Emex, LLC IR-2065Eneractive Solutions, LLC IR-1939Energy Acceptance, Corp. IR-2074Energy Advisory Service, LLC IR-1486 IR-1485Energy Edge Consulting, LLC IR-2022Energy Enablement, LLC IR-2385Energy Management Resources of Missouri, Inc. IR-2067 IR-2073Energy Options, LLC IR-568Energy Plus Holdings, LLC IR-1805Energy Plus Natural Gas, LP IR-2216Energy Professionals, LLC IR-1791Energy Services Management, LLC d/b/a Maryland Energy Consortium IR-236 IR-312
84
CompanyElectricity Supplier
License No.
Electricity Broker
License No.
Natural Gas Supplier
License No.
Natural Gas Broker
License No.Energy Services Providers, Inc. d/b/a Maryland Gas and Electric IR-2110Energy Shopper, LLC IR-2048Energy Trust, LLC IR-1682 IR-1681Etheredge Partners, LLC IR-2054Field Personnel Services d/b/a Vanguard Engineering Services IR-1789FirstEnergy Solutions Corp IR-225Gateway Energy Services Corporation IR-340 IR-334GDF Suez Energy Resources IR-605GDF Suez Retail Energy Solutions, LLC IR-2404Genesis Energy International, LLC IR-1986Glacial Energy of Maryland, Inc. IR-888Glacial Natural Gas, Inc. IR-1855Global Energy Market Services, LLC IR-2170Global Montello Group Corp. IR-2225Goldstar Energy Group, Inc. IR-1370 IR-1381Good Energy, LP IR-1592Green Power Management Solutions, LLC IR-1835 IR-1834Hess Corporation IR-219 IR-323Horizon Power & Light, LLC IR-704Houston Energy Services Company, L.L.C IR-403Hudson Energy Services, LLC IR-1114 IR-1120I.C. Thomasson Associates, Inc. IR-1445 IR-1446IDT Energy, Inc. IR-1747 IR-1745Integrity Energy, LTD IR-1985Integrys Energy Services IR-951IntelliGEN Resources LP IR-2113Interstate Gas Supply, Inc. d/b/a IGS Energy IR-2182Interstate Gas Supply, Inc. d/b/a IGS Energy d/b/a Columbia Retail Energy IR-1836Invado International, LLC IR-2026 IR-2025Liberty Power Corp, LLC IR-607Liberty Power Delaware, LLC IR-962Liberty Power Holdings, LLC IR-957Liberty Power, MD, LLC IR-793Linde Energy Services IR-753Long Distance Consultants, L.L.C. IR-1455MABLock Consulting d/b/a The Lock Group IR-1683Maglor Marketing Group IR-2088 IR-2089Major Energy Electric Services, LLC IR-2098Major Energy Services, LLC IR-1749Marathon Oil Company IR-364Market Direct LLC d/b/a mdenergy IR-614Maryland Energy Advisors, LLC IR-1954Maryland Energy Trust, LLC IR-1994MCENERGY, INC. IR-2354Metromedia Energy, Inc. IR-355Metromedia Power, Inc. IR-867Mid Atlantic Renewables, LLC IR-856MidAmerican Energy Company IR-798
85
CompanyElectricity Supplier
License No.
Electricity Broker
License No.
Natural Gas Supplier
License No.
Natural Gas Broker
License No.Mid-Atlantic Aggregation Group Independent Consortium, L.L.C. d/b/a MAAGIC IR-234 IR-234Mid-Atlantic Cooperative Solutions, Inc. d/b/a Aero Energy IR-2030Mitchell Energy Management Services, Inc. IR-1371Mondre Energy, Inc. IR-2334MRDB Holdings, LP d/b/a LPB Energy Consulting IR-930 IR-1000Mxenergy Electric Inc. IR-1853Mxenergy, Inc. IR-327Nania Energy, Inc. IR-1857National Power Source, LLC IR-2084National Utility Service, Inc. IR-1400 IR-1401Natures Current, LLC IR-1352Netpique, LLC IR-2432NextEra Energy Services, LLC IR-966Noble Americas Energy Solutions, LLC IR-464 IR-464North American Power and Gas LLC IR-1983North Shore Energy Consulting, LLC IR-2160Northeast Energy Partners IR-1649NOVEC Energy Solutions, Inc. IR-338NRGing, LLC d/b/a NetGain Energy Advisors IR-2038 IR-2037Oasis Power, LLC d/b/a Oasis Energy IR-1848 IR-1929On-Demand Energy, Inc. IR-1442Open Market Energy, LLC IR-1981 IR-2013Palmco Energy MD, LLC IR-1803Palmco Power MD, LLC IR-1804Patch Energy Services, LLC IR-1943Patriot Energy Group, Inc. IR-2187Peninsula Energy Services Company, Inc. IR-2003Pepco Energy Services, Inc. IR-222Pepco Energy Services, Inc. also d.b.a. Conectiv Energy Services IR-316Planet Energy (Maryland) Corp. IR-2133 IR-2121Platinum Advertising II, LLC IR-1673 IR-1668Positive Energy Electricity Supply, LLC IR-2164Power Brokers, LLC IR-2066Power Brokers, LP IR-1610Power Management IR-1670 IR-1669PPL EnergyPlus, LLC IR-230 IR-335Premier Energy Group IR-942 IR-943Premier Power Solutions, LLC IR-894 IR-894Prospect Resources, Inc. IR-2042 IR-2041Public Power & Utility of Maryland, LLC IR-1781QVINTA Energy Services IR-557 IR-530Reflective Energy Solutions, LLC IR-2352 IR-2253Reliable Power Alternatives Corp. IR-1719Reliant Energy Northeast, LLC d/b/a Reliant Energy IR-2058ResCom Energy, LLC IR-2120Resource Energy Systems, LLC IR-2115
86
CompanyElectricity Supplier
License No.
Electricity Broker
License No.
Natural Gas Supplier
License No.
Natural Gas Broker
License No.Richards Energy Group, Inc. IR-818RMI Consulting, Inc. IR-1685Satori Enterprises, Inc. IR-1499Secure Energy Soltions, LLC IR-2117Select Energy Partners, LLC IR-1864Senergy Corporate Ventures, LLC IR-2325 IR-2326Shell Energy North America IR-1357 IR-1358Silver Star Associates Corporation IR-2194Simply Competitive Energy, LLC IR-2304Smart Choice Energy Services IR-1611 IR-1612Smart One Energy, LLC IR-2355SmartEnergy.com, Inc. IR-270SourceOne, Inc. (DE) IR-2111 IR-2172South Jersey Energy Company IR-740South River Consulting IR-863SouthStar Energy Services, LLC d/b/a Maryland Energy IR-2106Spark Energy Gas, LP IR-613Spark Energy, LP IR-979Sprague Energy Corp. IR-339Stand Energy Corporation IR-632Starion Energy PA, Inc. IR-2094Statoil Natural Gas LLC IR-561Stream Energy Maryland, LLC IR-2072Summit Energy Services IR-1396Suncom Energy Inc. IR-2051Sustainable Star LLC IR-2306Taylor Consulting and Contracting, LLC IR-1790 IR-1960Technology Resource Solutions, Inc. IR-2105Technology Resources Solutions, Inc. IR-1802TES Energy Services, LP IR-2169Texas Energy Options, Inc. IR-1542Texas Retail Energy, LLC IR-2272TFS Energy Solutions, LLC IR-918TFS Energy Solutions, LLC d/b/a Tradition Energy IR-982The Energy Link, LLC IR-2068 IR-2069The Eric Ryan Corporation IR-1438 IR-1437The Legacy Energy Group IR-1692 IR-1691The Loyalton Group, Inc. IR-1766 IR-1765Tiger Natural Gas IR-351Tybec Energy Management Specialist, Inc. IR-2299Tybec Energy Management Specialists, Inc. IR-2163U.S. Gas & Electric d/b/a Maryland Gas & Electric IR-1744U.S. Harvest Postal Protection Services Corp.d/b/a United States Ethane Gas Corp. IR-1824U.S. Harvest Postal Protection Services Corporation d/b/a U.S. Harvest Energy & Technologies Corp. IR-1774U.S. Sun Energy, Inc. IR-1952
87
88
CompanyElectricity Supplier
License No.
Electricity Broker
License No.
Natural Gas Supplier
License No.
Natural Gas Broker
License NoUEC Energy, LLC IR-1972UGI Energy Services, Inc. IR-237 IR-319Unified Energy Services, LLC IR-1751Usource, LLC IR-1160UtiliTech, Inc. IR-915 IR-915Utility Savings Solutions IR-2322Veterans Energy Supply Company, LLP IR-2397Virginia Power Energy Marketing, Inc. d/b/a Dominion Sales and Marketing, Inc. IR-689Viridian Energy PA, LLC IR-1840Volunteer Energy Services, Inc. IR-2012 IR-2004Washington Gas Energy Services, Inc. IR-227 IR-324World Energy Solutions, Inc. IR-619 IR-953
IR-2165Xencom Green Energy, LLC Source: PSC database and Table A-6 in Company data responses to the Commission's 2011 data request for the Ten-Year Plan.
The Table below lists the electricity and natural gas suppliers by license type. The license type indicates what services a supplier may offer in Maryland. The Table below only indicates the license type and does not imply that all suppliers are offering services.
Electric SupplierElectric BrokerGas SupplierGas BrokerTotal Suppliers (Incl. Brokers)** Certain suppliers have both natural gas and electric licenses.
651465762
244
.
Table A-7: Transmission Enhancements by Service Area
Transmission Owner
Voltage (kV)
Length (miles)
No. of Circuits
Start Date
Comp. Date
In-Service Date Purpose County Terminal County Terminal
DPL 69 12 1 2013 2014 2014 DA Kent Lynch Kent McCleansDPL 69 12 1 2013 2014 2014 DA Kent Chestertown Kent McCleansDPL 69 6.52 1 2012 2013 2013 DA Kent Massey Queen
Purpose Codes: BTR ¾ Baseline Transmission Reliability C ¾ Capacity DA ¾ Distribution Adequacy STR ¾ Supplemental Transmission Reliability R ¾ Reliability
Source: Company data responses to Question 7 in the Commission's 2011 data request for the Ten-Year Plan.
93
94
Table A-8: Renewable Projects Providing Capacity and Energy to Maryland Customers as of December 31, 2010
Utility Service Area Operator/Owner Plant Name County Energy Source
Name Plate Summer
PE BP Piney & Deep Creek LLC Deep Creek Garrett 20 18 WaterBGE Constellation Solar Maryland, LLC McCormick & Co. Inc. at Belcamp Hartford 1.4 1.4 SolarPepco Covanta Montgomery, Inc. Montgomery County Resource RecoveryMontgomery 67.8 54 Municipal Solid WastePE Criterion Power Partners LLC Criterion Wind Project Garrett 70 70 WindBGE Eastern Landfill Gas LLC Eastern Landfill Gas LLC Baltimore 3 3 Landfill GasBGE Energy Recovery Operations, Inc Harford Waste to Energy Facility Harford 1.2 1.1 Municipal Solid WasteBGE Exelon Power Conowingo Harford 506.8 572 WaterDPL Industrial Power Generating Company LLWicomico Wicomico 5.4 5.4 Landfill GasDPL Maryland Environmental Service Eastern Correctional Institute Somerset 3.8 2.6 Wood/Wood Waste SolidsPepco Prince George's County Brown Station Road Plant II Prince Georges 6.7 5.6 Landfill GasPepco SCE Engineers Montgomery County Oaks LFGE Plant Montgomery 2.4 2.3 Landfill GasBGE Wheelabrator Environmental Systems Wheelabrator Baltimore Refuse Baltimore City 64.5 61.3 Municipal Solid WasteChoptank Worcester County Renewable Energy LL Worcester County Renewable Energy Worcester 2 2 Landfill Gas
TOTAL 755 798.7
Capacity Statistics (MW)
Source: Report EIA-860: "GenY10" Excel, U.S. ENERGY INFORMATION ADMINISTRATION, (Nov. 30, 2011), available at: http://38.96.246.204/cneaf/electricity/page/eia860.html.
Table A-9: Power Plants in the PJM Process for New Electric Generating Stations in Maryland as of December 31, 2010
Electric
Company Service
TerritoryPJM
Queue # Project Name
Status of Application (12/31/10)
Plant Capacity
(MW) Fuel Type
Projected In-Service
DateBGE S32 Perryman Suspended 256 natural gas 2014 Q2BGE V1-033 Pumphrey 115kV Under Construction 132 other 2015 Q1BGE V3-037 Naval Academy Junction 13kV Under Construction 3 natural gas 2013 Q2BGE V4-038 Friendship Manor 34.5kV Under Construction 1 methane 2013 Q1BGE W1-033 Pumphrey 115kV Under Construction 157 biomass 2015 Q1BGE W4-030 Jessup Under Construction 0 solar 2012 Q1DPL T144 Pocomoke Under Study 20 biomass 2010 Q1DPL U3-003 Mt. Olive 69kV Under Construction 2 methane 2012 Q2DPL U3-004 Cecil Under Study 2 methane 2009 Q3DPL V2-028 Vienna Under Study 6 solar 2010 Q4DPL W1-070 Laurel 69kV Under Study 20 solar 2011 Q2DPL W3-071 Worcester 25kV Under Study 13 solar 2012 Q2DPL W3-160 Worcester 25kV Under Study 10 solar 2011 Q1DPL W4-017 Kings Creek-Crisfield 69kV Under Study 100 wind 2013 Q4DPL X1-032 Costen 25kV Under Construction 4 solar 2012 Q2DPL X1-096 Loretto-Kings Creek 138kV Under Study 150 wind 2014 Q4DPL X2-045 Kenney-Mt. Olive 69kV Under Study 20 solar 2013 Q2DPL X2-084 East New Market 69kV Under Study 20 solar 2012 Q4DPL X3-008 Todd 69kV Under Study 20 solar 2017 Q2DPL X3-009 New Market 69kV Under Study 20 solar 2017 Q2DPL X3-015 West Cambridge-Vienna 69kV Under Study 20 solar 2012 Q4DPL X3-066 Church Hill 69kV Under Study 7 solar 2012 Q3DPL X3-067 Church Hill 12kV Under Study 2 solar 2012 Q3DPL X3-073 Massey 69kV Under Study 10 solar 2013 Q1DPL X3-074 Chestertown 69kV Under Study 12 solar 2013 Q1DPL X4-017 Fruitland 69kV Under Study 20 solar 2017 Q2PE S14 Dans Mountain Under Study 70 wind 2009 Q4PE T16 Gorman-Snowy Creek 69kV Under Study 30 wind 2011 Q4PE U2-030 Four Mile Ridge Wind 138kV Under Study 60 wind 2010 Q4PE U4-007 Jennings Randolph Dam Under Study 14 hydro 2013 Q3PE W1-116 Emmitsburg 34kV Under Construction 14 solar 2012 Q2PE W3-070 Metropolitan Court 34.5kV Under Study 52 biomass 2013 Q4PE W4-102 Lappans 34.5kV Under Study 17 solar 2012 Q4PE X2-038 Halfway 12.5kV Under Study 2 methane 2012 Q3PEPCO S17 Talbert 230kV Suspended 225 natural gas 2017 Q4PEPCO T133 Chalk Point-Bowie 230kV Suspended 225 natural gas 2016 Q4PEPCO T134 Chalk Point-Bowie 230kV Suspended 325 natural gas 2017 Q4PEPCO V3-017 Morgantown-Oak Grove Under Study 725 natural gas 2012 Q2PEPCO W3-105 Dickerson 230kV Under Construction 18 oil 2011 Q4PEPCO W4-010 White Oak Under Study 53 natural gas 2014 Q1PEPCO W4-020 Mt. Zion 13.8kV Under Study 10 solar 2011 Q3PEPCO W4-044 Kelson Ridge 230kV Under Study 1450 natural gas 2014 Q2PEPCO X2-030 Morgantown-Oak Grove 230kV Under Study 830 natural gas 2016 Q1PEPCO X3-087 Burches Hill-Brandywine 230kV Under Study 914 natural gas 2016 Q2
95
Electric Company
Service Territory
PJM Queue # Project Name
Status of Application (12/31/10)
Plant Capacity
(MW) Fuel Type
Projected In-Service
DatePEPCO X3-088 Dickerson 230kV Under Study 440 natural gas 2016 Q4PEPCO X3-102 Burches Hill-Possum Point 500kV Under Study 971 natural gas 2016 Q2PEPCO X4-006 Kelson Ridge 230kV Under Study 785 natural gas 2015 Q2PEPCO X4-007 Kelson Ridge 230kV Under Study 785 natural gas 2015 Q2PEPCO X4-026 Aquasco 230kV Under Study 792 natural gas 2015 Q2SMECO V2-042 Calvert Cliffs 500kV Under Study 1640 nuclear 2017 Q2
Total (MW): 11,474 Source: Generation Queues: Active, PJM, http://www.pjm.com/planning/generation-interconnection/generation-queue-active.aspx (last visited December 18, 2011).