L ETTER TO S HAREHOLDERS C HAIRMAN AND C HIEF E XECUTIVE O FFICER , J EFFREY C. B ARBAKOW TENET HEALTHCARE CORPORATION AND SUBSIDIARIES 1 Tenet gained tremendous momentum during the course of fiscal 2000 as our strategies to mitigate a third straight year of incremental reductions in Medicare payments took hold. As a result, I’m very pleased to report that Tenet’s earnings per share from operations before special charges in fiscal 2000 was $1.81, a 10 percent increase over fiscal 1999, when earnings per share was $1.65. Strong commercial pricing and excellent cost controls spurred the growth in earnings. Fiscal 2000 was our best year for cash flow from operations, which grew to $869 million, up $287 million over fiscal 1999. Free cash flow, plus proceeds from asset sales, allowed us to reduce our debt by $787 million in fiscal 2000. By the close of the year, our strong balance sheet was even stronger and all the key coverage ratios had improved. TENET TODAY Clearly, our strategy of building strong integrated health care delivery systems in the communities we serve is working, and we remain committed to it. During fiscal 2000, we further refined our portfolio of hospitals, divesting 21 nonstrategic facilities and adding one more — Doctors Regional Medical Center in Poplar Bluff, Mo. — which we integrated with our existing hospital there. Today, just under two-thirds of our hospitals are located in markets or counties where Tenet holds either the No.1 or a strong No. 2 market position. Our regional networks are anchored by six major teaching hospitals that serve as the primary teaching hospitals for four prestigious medical schools — the University of Southern California School of Medicine in Los Angeles; Saint Louis University School of Medicine in St. Louis; Creighton University School of Medicine in Omaha, Neb., and MCP Hahnemann University in Philadelphia. More than 30 other Tenet hospitals, including several in New Orleans and Atlanta, also serve as training facilities for new physicians. The strength of our hospital networks gives us greater leverage in contract negotiations with payers, enabling us to gain better prices and terms. In fact, in fiscal 2000 we saw some of the best commercial pricing trends we’ve seen in years. OUR BACK TO BASICS FOCUS Key to the improvement in Tenet’s performance was our intense “Back-to-Basics” operating strategy, which we first introduced early in calendar 1999. During fiscal 2000, we reaped the benefits of the numerous initiatives we put in place as part of this strategy. For example, despite a national nursing shortage and increased pressure on wages, our labor costs actually declined as a percent of revenues. We achieved this reduction through a combination of productivity improvements and outsourcing of some nonpatient care functions like housekeeping and dietary services.
Transcript
L E T T E R T O S H A R E H O L D E R S
C H A I R M A N A N D C H I E F E X E C U T I V E O F F I C E R , J E F F R E Y C . B A R B A K O W
T E N E T H E A L T H C A R E C O R P O R A T I O N A N D S U B S I D I A R I E S 1
Tenet gained tremendous momentum during the course of fiscal 2000 as our strategies tomitigate a third straight year of incremental reductions in Medicare payments took hold.
As a result, I’m very pleased to report that Tenet’s earnings per share from operationsbefore special charges in fiscal 2000 was $1.81, a 10 percent increase over fiscal 1999,when earnings per share was $1.65.
Strong commercial pricing and excellent cost controls spurred the growth in earnings.Fiscal 2000 was our best year for cash flow from operations, which grew to $869 million,up $287 million over fiscal 1999. Free cash flow, plus proceeds from asset sales, allowedus to reduce our debt by $787 million in fiscal 2000. By the close of the year, our strongbalance sheet was even stronger and all the key coverage ratios had improved.
TENET TODAY
Clearly, our strategy of building strong integrated health care delivery systems in thecommunities we serve is working, and we remain committed to it.
During fiscal 2000, we further refined our portfolio of hospitals, divesting 21 nonstrategicfacilities and adding one more — Doctors Regional Medical Center in Poplar Bluff, Mo.— which we integrated with our existing hospital there. Today, just under two-thirds ofour hospitals are located in markets or counties where Tenet holds either the No.1 or a strong No. 2 market position.
Our regional networks are anchored by six major teaching hospitals that serve as the primary teaching hospitals for four prestigious medical schools — the University ofSouthern California School of Medicine in Los Angeles; Saint Louis University School ofMedicine in St. Louis; Creighton University School of Medicine in Omaha, Neb.,and MCP Hahnemann University in Philadelphia. More than 30 other Tenet hospitals,including several in New Orleans and Atlanta, also serve as training facilities for newphysicians.
The strength of our hospital networks gives us greater leverage in contract negotiationswith payers, enabling us to gain better prices and terms. In fact, in fiscal 2000 we sawsome of the best commercial pricing trends we’ve seen in years.
OUR BACK TO BASICS FOCUS
Key to the improvement in Tenet’s performance was our intense “Back-to-Basics”operating strategy, which we first introduced early in calendar 1999. During fiscal 2000,we reaped the benefits of the numerous initiatives we put in place as part of this strategy.
For example, despite a national nursing shortage and increased pressure on wages, ourlabor costs actually declined as a percent of revenues. We achieved this reduction througha combination of productivity improvements and outsourcing of some nonpatient carefunctions like housekeeping and dietary services.
2
Supply expense is another area where we were able tocontrol costs — in spite of upward pressure from newtechnologies and rising pharmaceutical costs. Our success in managing supply costs is a reflection ofsophisticated purchasing and utilization strategies initiated by our BuyPower group-purchasing organization.
We also made progress in our efforts to abate thegrowth in bad debt expense. Rising bad debt expenseis an industrywide phenomenon caused primarily by a shift in business from Medicare to managed care.Although full-year results show an increase in bad debtexpense over the prior year, we are gratified by theimprovement from the first quarter, in which bad debtexpense peaked at 7.8 percent of revenues, to thefourth quarter, in which it dropped to 7.0 percent ofrevenues. This hard-won progress is a result of manyinitiatives implemented under our Back-to-Basics strategy — initiatives that cover virtually all of thecontracting, admitting, billing and collections functionsat our hospitals.
We also made progress on our initiative to unwind ourphysician management and employment relationships,which have not been profitable. During fiscal 2000, weeither took steps to terminate or allowed to expiremanagement and employment agreements withapproximately 50 percent of our contracted physicians.We continue to work toward similar arrangements withthe majority of the remaining contracted physicians.
Finally, our initiatives to improve cash flow bore substantial fruit. We distributed tool kits for our hospitals to use to improve their business officeprocesses, showcased facilities that have developed bestpractices and examined every aspect of our businesspractices that could be improved to enhance collectionsand increase cash flow. As a result, cash flow fromoperations grew nearly 50 percent from fiscal 1999,making fiscal 2000 a record year for operating cash flow.
OUR VIS ION FOR TENET
Looking to the future, we see important changes onthe horizon.
For one, patients are increasingly taking a more activerole in managing their care and are more informedabout their choices. This growing consumerism willtransform how health care is delivered, and organiza-tions that provide quality care and service will gain aclear and sustainable competitive edge. To ensure thatTenet remains at the forefront of health care delivery,we’ve established three key goals for the company:
■ To lead our industry in quality and service,
■ To become the employer of choice, and
■ To be a technology leader in our field.
I’m very excited about the possibilities that new technology presents, not just for improving the quali-ty of patient care at our hospitals, but also for dissem-inating best practices throughout the company,enhancing our ability to provide education and train-ing for our employees and strengthening our relation-ships with our physicians. During fiscal 2000, weunveiled several initiatives and pilot programs to helpus achieve our goals.
A critical initiative in the area of quality and service isa program we call the Partnership for Change. This initiative is designed to improve clinical outcomes,reduce complications and lower the cost of care at ourhospitals. It involves improving hospital processes,identifying best clinical practices and providing clinicians with the support and information they needto make appropriate treatment decisions. To do this,we are using new technology that puts the necessaryinformation, in real time, into the hands of case managers on the patient floors. The Partnership forChange is already in place in 37 of our hospitals,including many of our facilities in New Orleans, SouthFlorida and Southern California. We expect thePartnership for Change to be fully implemented by theend of fiscal 2001.
L E T T E R T O S H A R E H O L D E R S
C H A I R M A N A N D C H I E F E X E C U T I V E O F F I C E R , J E F F R E Y C . B A R B A K O W
T E N E T H E A L T H C A R E C O R P O R A T I O N A N D S U B S I D I A R I E S 3
Our Target 100 program, another key initiative, seeksto achieve 100 percent satisfaction rates among ourmost-important constituents — patients, employeesand physicians. Target 100 engages every employee —from the hospital CEO to the floor nurse to the admissions clerk — in a structured process aimed atimproving customer service, communications, andcoordination and service among hospital departments.It’s in place at about 25 Tenet hospitals and will beexpanded to more than half of our facilities by the endof calendar 2000.
Using TenetMD.com, our proprietary website,physicians who practice at Tenet hospitals will be ableto access patient demographic information, lab resultsand other information about their patients whereverthey have access to the Internet. If we can facilitate theflow of critical information between our hospitals,doctors and patients, we’ll improve the patient careprocess and increase patient and physician satisfaction.
Tenet has been an active investor in companies that aredeveloping promising health care technologies. To date,we’ve invested in 10 ventures and realized proceeds farabove the value of our original investments. Moreimportantly, we’ve gained in-house intellectual capitalby working with companies that are in the forefront ofadapting the Internet and other technologies to healthcare uses.
Our highest profile strategic venture so far has beenthe creation of Broadlane Inc., a joint venture withVentro Corporation, a business-to-business e-commercecompany. Essentially, we are integrating BuyPower’sestablished services and extensive contract base withVentro’s proven e-commerce platform, providing buyersand sellers of health care supplies with an electronicsupply marketplace. Tenet remains the largest share-holder in Broadlane, which is a private company.Broadlane is exceedingly well positioned in the high-volume hospital and medical supply market and we arevery excited about its future prospects.
We made an important addition to Tenet’s executivemanagement team in fiscal 2000. David L. Dennisjoined Tenet in February as vice chairman, chief corporate officer and chief financial officer. A veteraninvestment banker with extensive background inhealth care, David shares the Office of the Presidentwith Thomas B. Mackey, Tenet’s chief operating officer.David is an outstanding strategist with broad experiencein many different aspects of the health care industry.As co-head of Donaldson, Lufkin and Jenrette’s healthcare group, David was closely involved with many of Tenet’s transactions and corporate financings. He’s an invaluable resource as we move forward andposition ourselves to capitalize on the health caretechnology revolution.
We also reluctantly said farewell to a long-servingmember of the Tenet Board of Directors shortly afterthe end of the fiscal year. Richard S. Schweiker, whohas had a long and distinguished career in politics andprivate business, including serving as Secretary ofHealth and Human Services in the ReaganAdministration, retired after nearly 16 years on theTenet board. We have greatly appreciated and benefitedfrom Dick’s rock-solid counsel and advice during allthose years. Joining the board in fiscal 2000 was Van B.Honeycutt, chairman, president and chief executiveofficer of Computer Sciences Corporation. Van’sunderstanding of the health care business coupled withhis extensive knowledge of technology make him aninvaluable addition to our board.
LOOKING AHEAD
I believe the future has never looked more promisingfor Tenet.
We are part of an industry with enormous growthpotential. National expenditures on health care areprojected to nearly double to $2.2 trillion in the nexteight years.
4
Throughout their careers, Phil, Nancy, Judie and Chrishave demonstrated the dedication and compassionthat is at the heart of quality patient care. Their accomplishments are too numerous to list. But there isa particular story about each of them that I think exemplifies why they are special. Last December, as aChristmas present to the children of a terminally illcancer patient under his care, Phil, an avid surfer, tookthem to the beach and gave them a surfing lesson.Nancy helped start a “healthy heart center” atParkway as an outreach to Haitian immigrants. Judiecomforted a pregnant mother dying from pancreaticcancer, who came to the hospital to deliver her baby,by bringing her vegetarian meals that she had cookedat home. Chris brought in a keyboard for a patient dyingof colon cancer who confided to her how much helonged to play the piano one more time before he died.
I want to thank all four of them, as well as the tens ofthousands of other Tenet caregivers in communitiesacross the nation. The success we have experiencedthis year is a direct result of their efforts every day onbehalf of our patients. With their help, we will build onour accomplishments to make fiscal 2001 an even moresuccessful year for Tenet.
Sincerely,
Jeffrey C. BarbakowChairman and Chief Executive Officer
We have a strong portfolio of hospitals, ranging fromtop teaching hospitals to facilities that are strong sole-providers in their communities.
To meet the challenge of operating in one of the mosthighly regulated industries in the nation, we havestrong and effective ethics and compliance programs inplace to guide our employees as they go about thedemanding task of providing quality patient care. Our management team is fully committed to the principles enshrined in these programs.
The political climate in Washington is decidedly better today than it has been in a long time. After threeyears of significant cuts in Medicare reimbursement,we expect government payments to be better in fiscal2001 — and that’s the first time in four years that wecan say that. Additionally, we expect continued commercial pricing improvements to spur strong top-line growth.
And there’s another area in which I believe we have areal advantage over our competitors — the quality andcommitment of our employees.
Health care is a very special business, one that touchespeople’s lives in a very profound way. By their very definition, hospitals deal in life-and-death matters. Formany of the men and women who care for the sick atour hospitals, health care is not just a career — it’s acalling. And supporting them are what I believe to besome of the top hospital managers in the industry andan outstanding corporate team.
To celebrate those who represent the best of who weare and what we do, we created a special recognitionprogram in fiscal 2000 — the Chairman’s Awards for Outstanding Service. There were four honoreesthis year: Phil Arroyo, the evening shift radiologysupervisor at Fountain Valley Regional Hospital andMedical Center in Orange County, Calif.; NancyAncona, a registered nurse at Parkway Regional MedicalCenter in North Miami; Judie Cook, a registered nursein the nursery at Frye Regional Medical Center in Hickory, N.C., and Chris Kennedy, a licensed practical nurse at Medical College of PennsylvaniaHospital in Philadelphia.
S E L E C T E D F I N A N C I A L D A T A
C O N T I N U I N G O P E R A T I O N S
T E N E T H E A L T H C A R E C O R P O R A T I O N A N D S U B S I D I A R I E S 5
M A N A G E M E N T ’ S D I S C U S S I O N & A N A L Y S I S O F
F I N A N C I A L C O N D I T I O N A N D R E S U L T S O F O P E R A T I O N S
RESULTS OF OPERATIONS
Highlights for the year ended May 31, 2000 included the following:
■ strong growth in patient revenues■ continuing effective cost controls■ significant improvements in cash flow■ significant reductions of debt■ progress in Company’s initiatives to reduce losses from its physician practices
On a same-facility basis, patient revenues improved 8.4% over last year, admissions wereup 1.4% and net inpatient revenue per admission improved 6.4%. Total Company operating margins (the ratio of operating income to net operating revenues) increasedfrom 8.6% to 9.2%. Net cash provided by operating activities increased by $287 millionduring the year, to $869 million. The Company reduced its debt by $787 million. Company management authorized the termination or expiration of contractualrelationships with approximately 50% of its contracted physicians.
The Company reported income from continuing operations before income taxes of $647million in 1998, $474 million in 1999 and $618 million in 2000. The most significantunusual items affecting the results of continuing operations in the last three years havebeen: (1) acquisitions and sales of facilities and long-term investments and (2) impairmentand other unusual charges. The pretax impact of these items is shown below:
1998 1999 2000
Gains (losses) on sales of facilities and long-term investments, net $ (17) $ — $ 49
Impairment and other unusual charges (221) (363) (355)
Net pretax impact (after tax, diluted per share: $(0.51) in 1998,$(0.86) in 1999 and $(0.73) in 2000) $ (238) $ (363) $ (306)
Dollars in Millions
PRETAX IMPACT
Excluding the items in the table above, income from continuing operations before incometaxes would have been $885 million in 1998, $837 million in 1999 and $924 million in2000 and diluted earnings per share from continuing operations would have been $1.73in 1998, $1.65 in 1999 and $1.81 in 2000.
T E N E T H E A L T H C A R E C O R P O R A T I O N A N D S U B S I D I A R I E S 7
1998 1999 2000 1998 1999 2000(Dollars in Millions) (% of Net Operating Revenues)
Salaries and benefits 4,052 4,412 4,508 41.0% 40.6% 39.5%
Supplies 1,375 1,525 1,595 13.9% 14.0% 14.0%
Provision for doubtful accounts 588 743 851 5.9% 6.8% 7.5%
Other operating expenses 2,071 2,342 2,525 20.9% 21.5% 22.1%
Depreciation 347 421 411 3.5% 3.9% 3.6%
Amortization 113 135 122 1.2% 1.2% 1.0%
Operating income before impairment and other unusual charges 1,349 1,302 1,402 13.6% 12.0% 12.3%
Impairment and other unusual charges 221 363 355 2.2% 3.4% 3.1%
Operating income $1,128 $ 939 $ 1,047 11.4% 8.6% 9.2%
Results of operations for the year ended May 31, 2000 include the operations of 12 generalhospitals acquired in 1999 and one general hospital acquired in 2000 and exclude, fromthe dates of sale or closure, the operations of 21 general hospitals and certain other facilitiessold or closed since May 31, 1999. Results of operations for the year ended May 31, 1999include the operations of six general hospitals acquired in 1998 and exclude, from thedates of sale or closure, the operations of four general hospitals, 29 home health agenciesand certain other facilities sold or closed since May 31, 1998.
The following is a summary of operating income for the past three fiscal years:
OPERATING INCOME
(1) Net operating revenues of domestic general hospitals include inpatient and outpatient revenues, as well as nonpatient revenues, primarily rental income and services such as cafeteria, gift shops, parking and other miscellaneous revenue.
(2) Net operating revenues of other operations consist primarily of revenues from (i) physician practices; (ii) rehabilitation hospitals, long-term-care facilities, psychiatric and specialty hospitals that are located on or near the same campuses as the Company’s general hospitals; (iii) the Company’s hospital in Barcelona, Spain; (iv) health care joint ventures operated by the Company; (v) subsidiaries of the Company offering managed care and indemnity products; and (vi) equity in earnings of unconsolidated affiliates.
8
Increase (Decrease)
1998 1999 2000 1999 to 2000
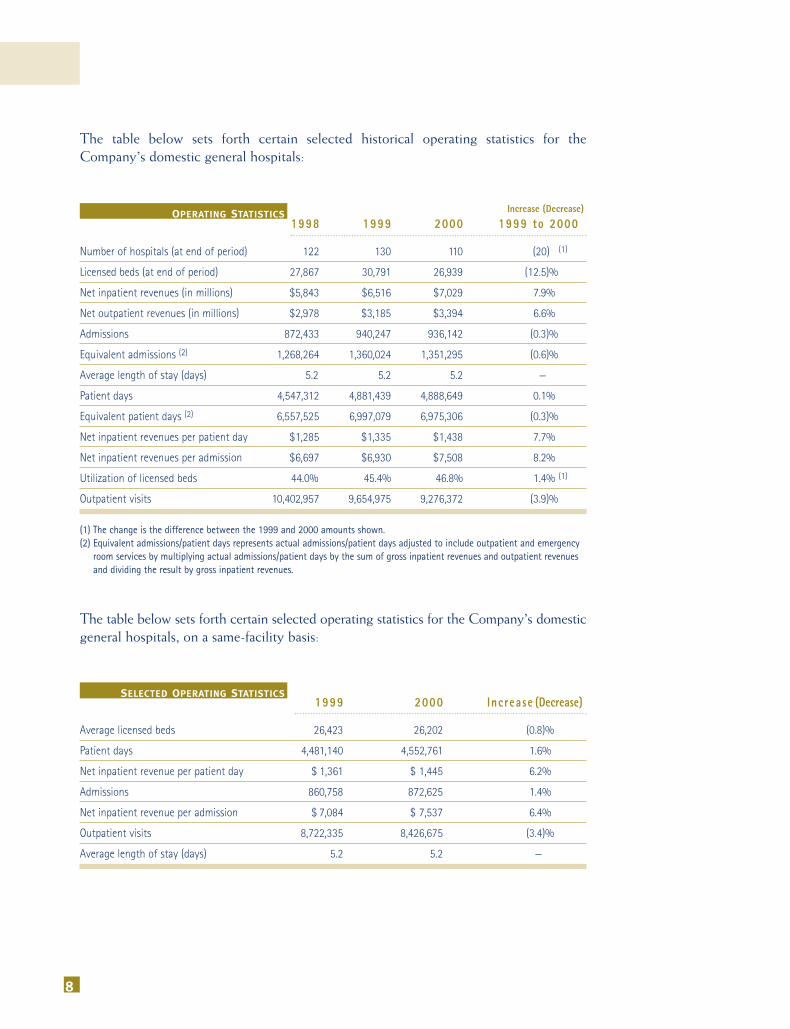
Number of hospitals (at end of period) 122 130 110 (20) (1)
Licensed beds (at end of period) 27,867 30,791 26,939 (12.5)%
Net inpatient revenues (in millions) $5,843 $6,516 $7,029 7.9%
Net outpatient revenues (in millions) $2,978 $3,185 $3,394 6.6%
(1) The change is the difference between the 1999 and 2000 amounts shown.(2) Equivalent admissions/patient days represents actual admissions/patient days adjusted to include outpatient and emergency
room services by multiplying actual admissions/patient days by the sum of gross inpatient revenues and outpatient revenues and dividing the result by gross inpatient revenues.
The table below sets forth certain selected historical operating statistics for theCompany’s domestic general hospitals:
1999 2000 Increase (Decrease)
Average licensed beds 26,423 26,202 (0.8)%
Patient days 4,481,140 4,552,761 1.6%
Net inpatient revenue per patient day $ 1,361 $ 1,445 6.2%
Admissions 860,758 872,625 1.4%
Net inpatient revenue per admission $ 7,084 $ 7,537 6.4%
Outpatient visits 8,722,335 8,426,675 (3.4)%
Average length of stay (days) 5.2 5.2 —
SELECTED OPERATING STATISTICS
The table below sets forth certain selected operating statistics for the Company’s domesticgeneral hospitals, on a same-facility basis:
OPERATING STATISTICS
M A N A G E M E N T ’ S D I S C U S S I O N & A N A L Y S I S O F
F I N A N C I A L C O N D I T I O N A N D R E S U L T S O F O P E R A T I O N S
T E N E T H E A L T H C A R E C O R P O R A T I O N A N D S U B S I D I A R I E S 9
The Company continues to experience increases in inpatient acuity and intensity of servicesas less-intensive services shift from an inpatient to an outpatient basis or to alternativehealth care delivery services because of technological and pharmaceutical improvements,regulatory changes and continued pressures by payers to reduce admissions and lengthsof stay. In spite of the historical shifts from inpatient to outpatient services, the Companyexperienced an 11.9% decline in the number of same-facility outpatient visits during 1999compared to 1998 and a 3.4% decline during 2000 compared to 1999. The primary reasons for the decline in visits on a same-facility basis was the consolidation or closureof the majority of the Company’s home health agencies in response to changes inMedicare payments to home health agencies mandated by the Balanced Budget Act of1997 (BBA).
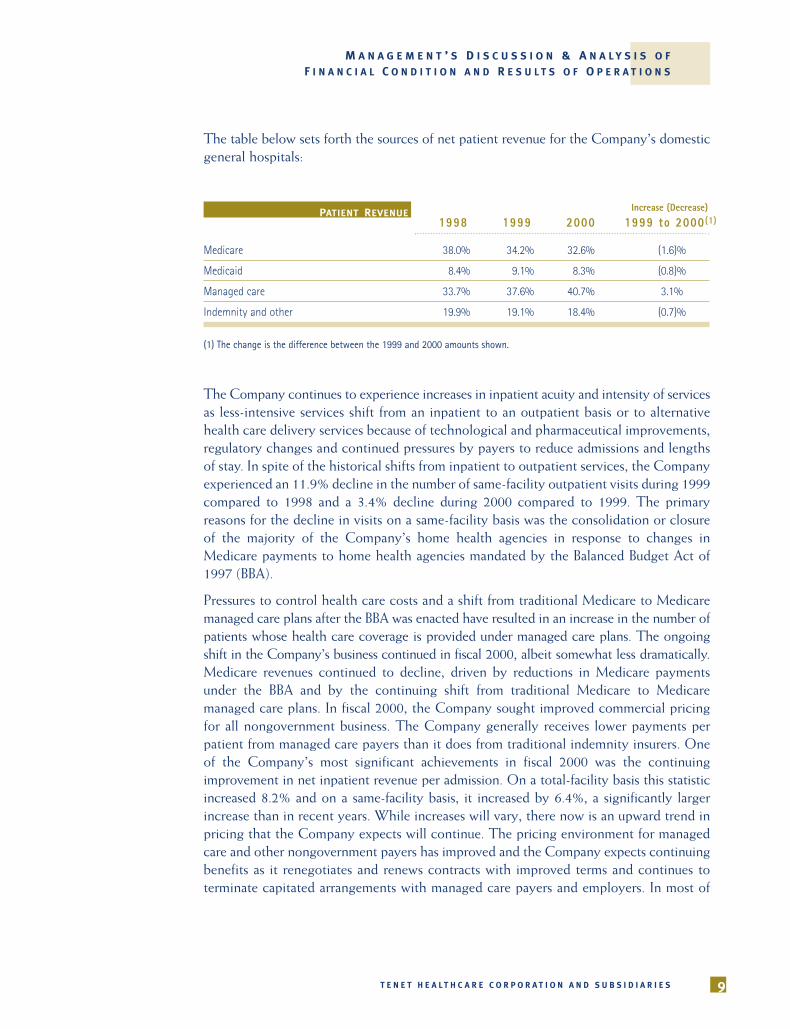
Pressures to control health care costs and a shift from traditional Medicare to Medicaremanaged care plans after the BBA was enacted have resulted in an increase in the number ofpatients whose health care coverage is provided under managed care plans. The ongoingshift in the Company’s business continued in fiscal 2000, albeit somewhat less dramatically.Medicare revenues continued to decline, driven by reductions in Medicare paymentsunder the BBA and by the continuing shift from traditional Medicare to Medicare managed care plans. In fiscal 2000, the Company sought improved commercial pricingfor all nongovernment business. The Company generally receives lower payments perpatient from managed care payers than it does from traditional indemnity insurers. Oneof the Company’s most significant achievements in fiscal 2000 was the continuingimprovement in net inpatient revenue per admission. On a total-facility basis this statisticincreased 8.2% and on a same-facility basis, it increased by 6.4%, a significantly largerincrease than in recent years. While increases will vary, there now is an upward trend inpricing that the Company expects will continue. The pricing environment for managedcare and other nongovernment payers has improved and the Company expects continuingbenefits as it renegotiates and renews contracts with improved terms and continues to terminate capitated arrangements with managed care payers and employers. In most of
The table below sets forth the sources of net patient revenue for the Company’s domesticgeneral hospitals:
(1) The change is the difference between the 1999 and 2000 amounts shown.
Increase (Decrease)
1998 1999 2000 1999 to 2000(1)
Medicare 38.0% 34.2% 32.6% (1.6)%
Medicaid 8.4% 9.1% 8.3% (0.8)%
Managed care 33.7% 37.6% 40.7% 3.1%
Indemnity and other 19.9% 19.1% 18.4% (0.7)%
PATIENT REVENUE
10
the markets served by the Company, profitabilityof capitation arrangements generally has been disappointing to both physicians and hospitals.
To address all the changes impacting the health careindustry, while continuing to provide quality care topatients, the Company has implemented strategies toreduce inefficiencies, create synergies, obtain additionalbusiness and control costs. In the past two years, suchstrategies have included hospital cost-control programsand overhead-reduction plans and the enhancement ofintegrated health care delivery systems. The Companyhas positioned itself for additional cost savings in theyears to come, for example, by outsourcing house-keeping and dietary services in most of its hospitals.Further consolidations and implementation of addi-tional cost-control programs and other operating effi-ciencies may be undertaken in the future.
Salaries and benefits expense as a percentage of netoperating revenues was 41.0% in 1998, 40.6% in 1999and 39.5% in 2000. The decreases have primarilyresulted from continuing cost-control measures,improved labor productivity and the outsourcing ofcertain hospital services described above.
Supplies expense as a percentage of net operating revenues was 13.9% in 1998 and 14.0% in both 1999and 2000. The Company continues to focus on control-ling supplies expense through improved utilization,improving the supply chain process and by developingand expanding programs designed to improve the purchasing of supplies through BuyPower, its group-purchasing organization.
The provision for doubtful accounts as a percentage ofnet operating revenues was 5.9% in 1998, 6.8% in 1999and 7.5% in 2000. Management believes the rise in baddebts is generally attributable to a number of factors,including (a) the continuing shift of business from tra-ditional Medicare to managed care, (b) a rise in thevolume of care provided to uninsured patients in cer-tain of the Company’s hospitals, (c) delays in paymentand denial of claims by managed care payers, and (d)improved pricing. The Company has taken a series ofactions to mitigate the increases in bad debt expense,
including improving the process for collecting receiv-ables, pursuing timely payments from managed carepayers, standardizing and improving billing systemsand developing best practices in the patient admissionsand registration process.
The Company also has addressed the increases in baddebt expense by strengthening its medical eligibilityprograms, as well as its business office and relatedoperations, including admitting, medical records andcoding, and the recruitment, training and compensationof business office staff. In certain markets, theCompany has set up dedicated managed care collectionunits to focus on problem accounts, problem payersand the highly complex reimbursement terms in managed care contracts.
Other operating expenses as a percentage of net operating revenues were 20.9% in 1998, 21.5% in 1999and 22.1% in 2000. The increase in 1999 and 2000 isprimarily due to the outsourcing of certain hospital services mentioned earlier and higher malpractice andother insurance costs in 2000.
Depreciation and amortization expense was $460 million in 1998, $556 million in 1999 and $533 millionin 2000. The increase in 1999 was primarily due to theeffects of facility acquisitions and increased capitalexpenditures partially offset by the effect of disposals,write-downs for impairment of the carrying values oflong-lived assets of certain general hospitals and medical office buildings and the write-off of goodwilland other long-lived assets related to the Company’sphysician practices. The decrease in 2000 was due primarily to the effect of the sales of 17 general hospitals and other health care businesses. Goodwillamortization in 2000 was approximately $94 million or$0.26 per share.
Net operating revenues from the Company’s otheroperations were $898 million in 1998, $922 million in 1999 and $748 million in 2000. The decreases in fiscal 2000 are primarily the result of terminations andcontract expirations of physician practices and disposalsof facilities other than general hospitals.
M A N A G E M E N T ’ S D I S C U S S I O N & A N A L Y S I S O F
F I N A N C I A L C O N D I T I O N A N D R E S U L T S O F O P E R A T I O N S
T E N E T H E A L T H C A R E C O R P O R A T I O N A N D S U B S I D I A R I E S 11
Impairment and other unusual charges of $221 million,$363 million and $355 million were recorded in fiscal1998, 1999 and 2000, respectively.
The Company begins its process of determining if itsfacilities are impaired (other than those related to theelimination of duplicate facilities or excess capacity) byreviewing all of the facilities’ three-year historical andone-year projected cash flows. Facilities whose cashflows are negative and trending significantly down-ward on this basis are selected for further impairmentanalysis. Their future cash flows (undiscounted andwithout interest charges) are estimated over theexpected useful life of the facility taking into accountpatient volumes, changes in payer mix, revenue andexpense growth rates and reductions in Medicare legislation and other payer payment patterns, whichassumptions vary by hospital, home health agency andphysician practice. In 1998, 1999 and 2000, these factorscaused significant declines in cash flows at certainfacilities such that estimated future cash flows wereinadequate to recover the carrying values of the long-lived assets. Continued deterioration of operatingresults relative to past trends for certain of theCompany’s physician practices also led to impairmentand restructuring charges related to these businesses in all three years. Impairment charges have resulted in minor reductions in depreciation and amorti-zation expense.
In addition to striving to continuously improve itsportfolio of general hospitals through acquisitions, theCompany also divests, from time to time, hospitalsthat are not essential to its strategic objectives. For themost part, these facilities are not part of an integrateddelivery system. The size and performance of thesefacilities varies, but on average they are smaller, withlower margins. Such divestitures allow the Companyto streamline its organization by concentrating onmarkets where it already has a strong presence.
The charges recorded in fiscal 2000 include $177 million described below relating to the Company’splans to terminate or allow certain employment and
management contracts with physicians to expire and$178 million relating to the closure or planned sale offive general hospitals and other property and equipment.The total charge for the year consists of $244 millionin noncash write-downs of assets and an accrual of$111 million for obligations requiring future cash disbursements as follows: $19 million in fiscal 2000,$64 million in fiscal 2001 and $28 million thereafter.
Over the past several years, the Company hasemployed or entered into full-risk management agreements with physicians in most of its markets. Alarge percentage of these physician practices wereacquired as part of large hospital acquisitions or throughthe formation of integrated health care deliverysystems. These physician practices, however, have notbeen profitable. Accordingly, beginning in fiscal 1999,the Company undertook the process of evaluating itsphysician strategy in each of its markets and began to develop plans to either terminate or allow a significant number of its existing contracts to expire.During the quarter ended February 29, 2000, Companymanagement authorized the termination or expirationof contractual relationships with approximately 50% ofits contracted physicians.
Accordingly, the Company recorded impairment andother unusual charges of $177 million in that quarterrelating to the Company’s previously announced plansto terminate or allow employment and managementcontracts with approximately 440 physicians to expire.The charge consisted of $102 million in impairmentcharges to value property and equipment and otherassets at the lower of carrying value or estimated fairvalues, $64 million for lease cancellation and other exitcosts, $7 million in severance costs for the terminationof 220 employees at the physician practices and $4million to buy out physician employment contracts.The impairment charges included $19 million for thewrite-down of property and equipment and $83 million for the write-down of goodwill and other assetson all physician practices.
12
The Company expects to incur additional charges inthe future as the balance of its physician contracts areevaluated for possible termination. The most significantbenefits of all these actions will not occur until fiscal2001 and beyond. As of May 31, 2000, future cashexpenditures related to the hospital and physicianpractice charges recorded during the third quarter areexpected to be $70 million.
The charges recorded in fiscal 1999 consisted of (1)$277 million of impairment losses for the Company’splan to sell 20 general hospitals and close one generaland one specialty hospital, (2) $48 million of restruc-turing charges related to the implementation of hospitalcost-control programs and general overhead-reductionplans and (3) $38 million for the impairment of carrying values of property, equipment and goodwill atfacilities and physician practices to be held and used.
The charges recorded in fiscal 1998 consisted of assetimpairment losses related primarily to (1) the plannedclosure or sale of three general hospitals, two specialtyhospitals and 29 home health agencies, (2) the write-down of the carrying values of certain long-lived assetsof one additional general hospital and 16 home healthagencies to be held and used to their fair values and (3) the write-off of goodwill and other assets and additional costs to terminate contracts related tophysician practices and an increase to the chargesincurred in 1997 for the planned closures and sales.
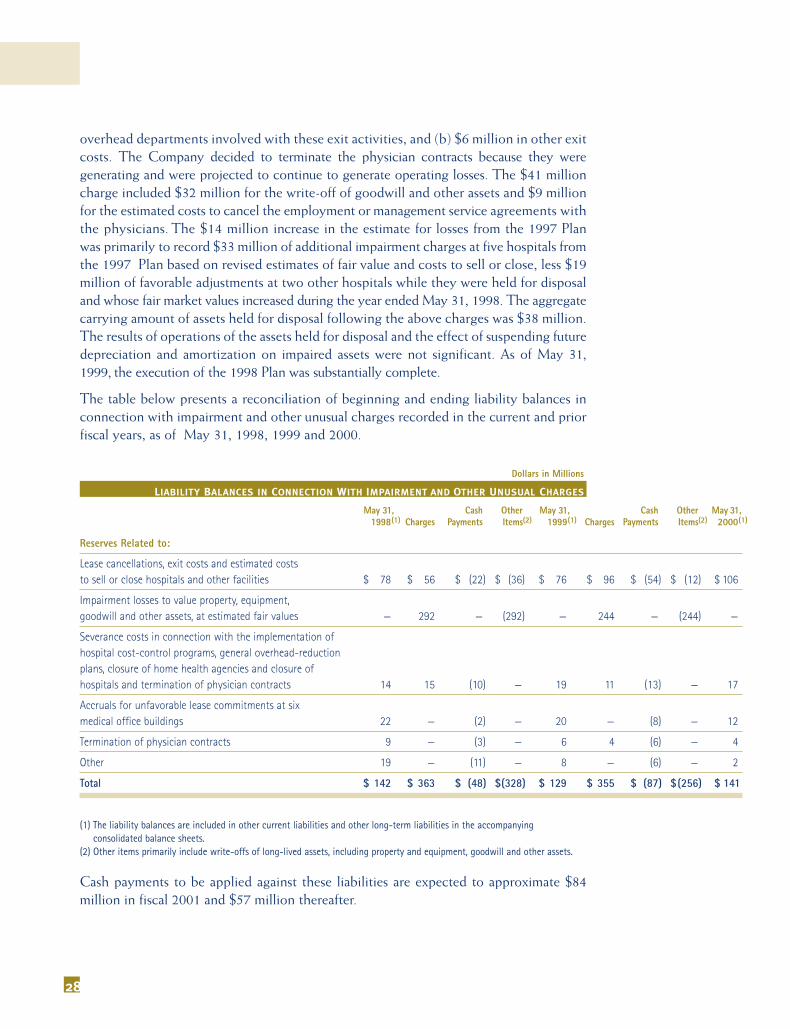
Costs remaining in accrued liabilities at May 31, 2000for impairment and other unusual charges include $106million for the lease cancellations, exit costs andestimated costs to sell or close hospitals, $17 million inseverance costs, $12 million for unfavorable lease com-mitments at six medical office buildings, $4 million inestimated costs to terminate physician contracts and$2 million in other costs, a substantial portion ofwhich are expected to be spent in fiscal 2001.
Interest expense, net of capitalized interest, was $464million in 1998, $485 million in 1999 and $479 million in 2000. The increase between 1998 and 1999is primarily due to increased borrowings for acquisitions and increases in working capital partiallyoffset by the effect of interest rate reductions. Thedecrease between 1999 and 2000 is primarily due to adecrease in borrowings, partially offset by interest rateincreases.
Investment earnings were $22 million in 1998, $27million in 1999 and $22 million in 2000 and werederived primarily from notes receivable and investmentsin debt securities.
Minority interests in income of majority-owned subsidiaries were $22 million in 1998, $7 million in1999 and $21 million in 2000. The decline in 1999 wasprimarily due to the purchase of remaining minorityinterests in two hospitals and one insurance subsidiaryin fiscal 1999. The increase in 2000 was due to theincreased profitability of certain of these subsidiaries.
The $49 million net gains from disposals of facilitiesand other long-term investments in 2000 comprises$50 million in gains on disposals of 17 general hospitals,three long-term-care facilities and various other businesses, $61 million in gains from sales of investmentsin Internet-related health care ventures, offset by $62million in net losses from sales of other investments.
The $17 million of net losses from the disposals offacilities and other long-term investments in 1998 comprised $35 million in losses on the disposals of theCompany’s investments in the common stock ofVencor, Inc. (Vencor) (received as a dividend fromVentas, Inc. (Ventas)) and Total Renal Care Holdings,Inc. (TRC), and an $18 million gain from changes in theindex value of the Company’s 6% SubordinatedExchangeable Notes.
The Company’s tax rate in 2000 before the effect ofimpairment and other unusual charges was 38.4%. TheCompany expects this tax rate to be approximately40% in fiscal 2001.
M A N A G E M E N T ’ S D I S C U S S I O N & A N A L Y S I S O F
F I N A N C I A L C O N D I T I O N A N D R E S U L T S O F O P E R A T I O N S
T E N E T H E A L T H C A R E C O R P O R A T I O N A N D S U B S I D I A R I E S 13
Net cash provided by operating activities $ 869
Proceeds from sales of facilities, long-term investments and other assets 764
Repayments of borrowings, net (787)
Purchases of property and equipment (619)
Purchases of new businesses, net of cash acquired (38)
Other net investing and financing activities (83)
Net increase in cash and cash equivalents $ 106
Dollars in Millions
LIQUIDITY AND CAPITAL RESOURCES
Net cash provided by operating activities for the yearsended May 31, 1998, 1999 and 2000 was $788 million,$657 million and $979 million, respectively, before netexpenditures for discontinued operations, impairmentand other unusual charges of $385 million in 1998,$75 million in 1999 and $110 million in 2000. The expenditures in 1998 include the settlement of significant litigation related to the Company’s discontinued psychiatric business.
Management believes that future cash provided byrecurring operating activities, the availability of creditunder the Company’s unsecured revolving bank creditagreement (credit agreement) and, depending on capi-tal market conditions and to the extent permitted by therestrictive covenants of the credit agreement and theindentures governing the Company’s Senior and SeniorSubordinated notes, other borrowings or the sale ofequity securities should be adequate to meet knowndebt-service requirements and to finance planned capitalexpenditures, acquisitions and other presently knownoperating needs for the next three years. The Companyexpects to refinance the credit agreement on or beforeits January 31, 2002 maturity date.
Proceeds from borrowings under the credit agreementamounted to $2.0 billion in 1998, $5.6 billion in 1999and $1.3 billion in 2000. Loan repayments under thecredit agreement were $1.3 billion in 1998, $5.1 billionin 1999 and $2.0 billion in 2000.
In May 1998, the Company sold $1.355 billion ofSenior and Senior Subordinated Notes due 2008. Thenet proceeds to the Company were $1.32 billion, afterunderwriting discounts and commissions, and were usedto redeem certain of the Company’s Senior and SeniorSubordinated Notes. In June 2000, the Company sold$400 million of 91/4% Senior Notes due 2010. The netproceeds of $396 million were used to repay unsecuredbank loans under the credit agreement.
During fiscal 1998, 1999 and 2000, the Companyreceived net proceeds from the sales of facilities, long-term investments and other assets of $170 million, $72 million and $764 million, respectively.
Cash payments for property and equipment were $534million in fiscal 1998, $592 million in fiscal 1999 and$619 million in fiscal 2000. The Company expects tospend approximately $500 million in fiscal 2001 forcapital expenditures. Such capital expenditures relateprimarily to the development of integrated health caresystems in selected geographic areas, design and construction of new buildings, expansion and renovationof existing facilities, equipment and information systemsadditions and replacements, introduction of new medicaltechnologies and various other capital improvements.
During fiscal 1998, 1999 and 2000, the Companyspent $679 million, $541 million and $38 million,respectively, for purchases of new businesses, net of cashacquired. The 1998 and 1999 acquisitions werefinanced primarily by borrowings.
The Company’s strategy includes the prudentdevelopment of integrated health care systems,including the possible acquisition of general hospitalsand related health care businesses or joining with othersto develop integrated health care delivery networks.
L IQUIDITY AND CAPITAL RESOURCES
The Company’s liquidity for the year ended May 31,2000 was derived principally from net cash providedby operating activities and sales of facilities.
14
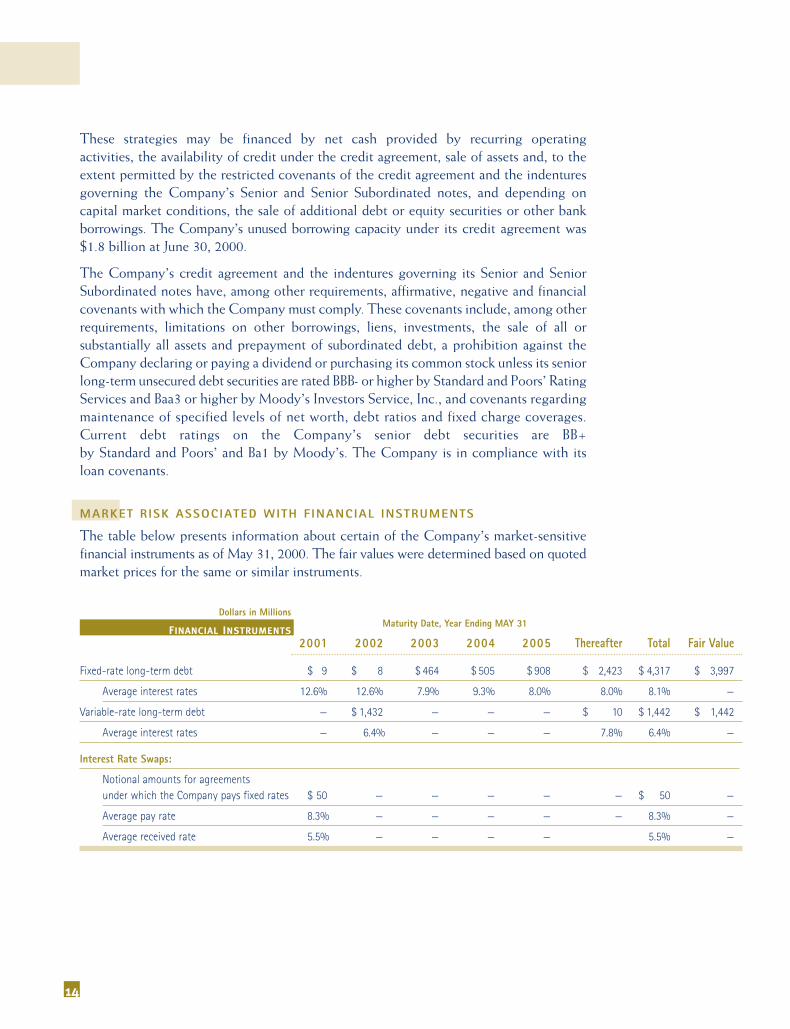
Maturity Date, Year Ending MAY 31
2001 2002 2003 2004 2005 Thereafter Total Fair Value
Notional amounts for agreementsunder which the Company pays fixed rates $ 50 — — — — — $ 50 —
Average pay rate 8.3% — — — — — 8.3% —
Average received rate 5.5% — — — — 5.5% —
Dollars in Millions
FINANCIAL INSTRUMENTS
These strategies may be financed by net cash provided by recurring operating activities, the availability of credit under the credit agreement, sale of assets and, to the extent permitted by the restricted covenants of the credit agreement and the indentures governing the Company’s Senior and Senior Subordinated notes, and depending on capital market conditions, the sale of additional debt or equity securities or other bank borrowings. The Company’s unused borrowing capacity under its credit agreement was$1.8 billion at June 30, 2000.
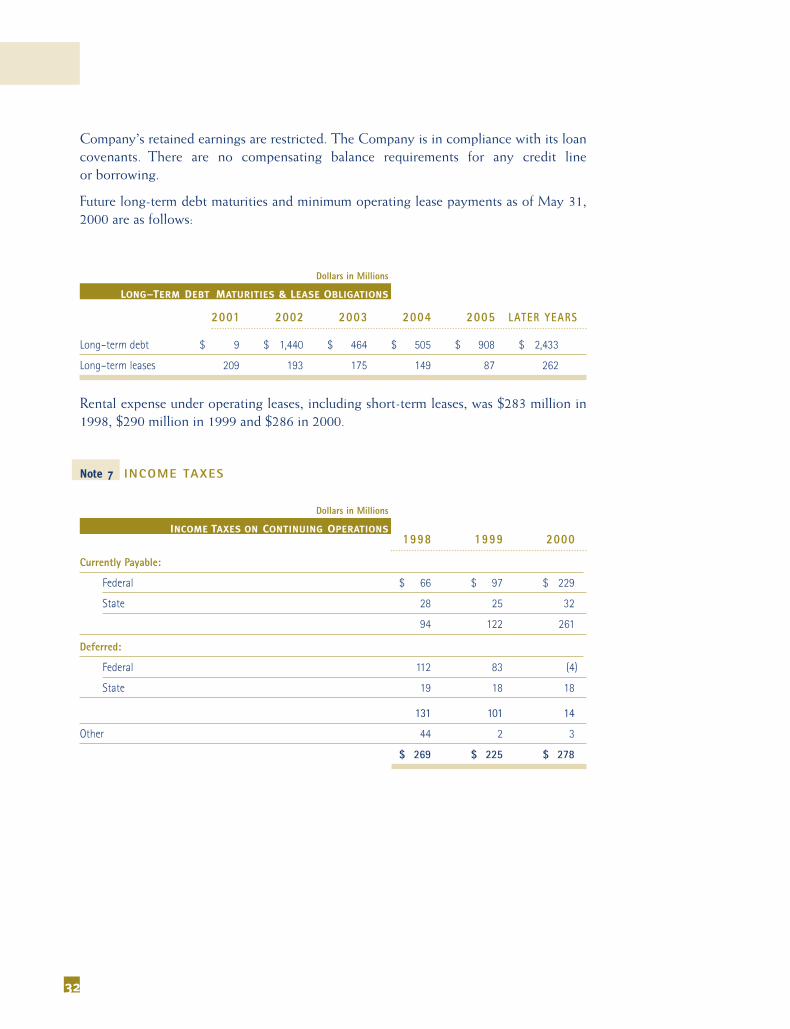
The Company’s credit agreement and the indentures governing its Senior and SeniorSubordinated notes have, among other requirements, affirmative, negative and financialcovenants with which the Company must comply. These covenants include, among otherrequirements, limitations on other borrowings, liens, investments, the sale of all or substantially all assets and prepayment of subordinated debt, a prohibition against theCompany declaring or paying a dividend or purchasing its common stock unless its seniorlong-term unsecured debt securities are rated BBB- or higher by Standard and Poors’ RatingServices and Baa3 or higher by Moody’s Investors Service, Inc., and covenants regardingmaintenance of specified levels of net worth, debt ratios and fixed charge coverages.Current debt ratings on the Company’s senior debt securities are BB+ by Standard and Poors’ and Ba1 by Moody’s. The Company is in compliance with its loan covenants.
MARKET R ISK ASSOCIATED WITH F INANCIAL INSTRUMENTS
The table below presents information about certain of the Company’s market-sensitivefinancial instruments as of May 31, 2000. The fair values were determined based on quotedmarket prices for the same or similar instruments.
Number of Shares Market Value
Ventas, Inc. 8,301,067 $ 32
Total Renal Care Holdings, Inc. 2,865,000 11
Other investments, primarily Internet-related health care ventures — 29
Investment portfolio of debt securities — 77
$ 149
Dollars in Millions
LONG-TERM INVESTMENTS
M A N A G E M E N T ’ S D I S C U S S I O N & A N A L Y S I S O F
F I N A N C I A L C O N D I T I O N A N D R E S U L T S O F O P E R A T I O N S
T E N E T H E A L T H C A R E C O R P O R A T I O N A N D S U B S I D I A R I E S 15
The Company has utilized, to a limited extent, interest rate swaps to manage certain ofits interest rate risk exposures. The interest rate swaps were entered into for periods consistent with related underlying exposures and do not constitute positions independentof those exposures. The Company does not hold or issue derivative instruments for tradingpurposes and is not a party to any instruments with leverage or prepayment features. Inentering into these contracts, the Company has assumed the risk, which it considersslight, that might arise from the possible failure of the counterparties to perform. Becausethe other parties are creditworthy financial institutions, generally commercial banks, theCompany does not expect any losses as a result of counterparty defaults.
At May 31, 2000, the Company’s principal long-term investments sensitive to changes inmarket price are shown in the following table. They are carried at market value on theCompany’s consolidated balance sheets:
At May 31, 2000, the investment portfolio of debt securities consisted of investments inU.S. Treasury Bills and Federal Home Loan Mortgage Corporation and the FederalNational Mortgage Association Notes, with an average maturity of 180 days. TheCompany’s market risk associated with its short-term investments in debt securities is substantially mitigated by the frequent turnover of the portfolio.
Included in the Company’s fixed-rate long-term debt are 6% Exchangeable SubordinatedNotes due 2005 with an aggregate principal balance of $320 million. These notes areexchangeable at the option of the holder for 25.9403 shares of Ventas common stock plus$239.36 in cash per $1,000 principal amount of the notes, subject to the Company’s rightto pay an amount in cash equal to the market price of the Ventas shares in lieu of deliveryof such shares. To the extent that the combined fair market value of the Company’sinvestment in Ventas common stock and the related portfolio of debt securities exceedsthe carrying value of the notes, the Company must adjust the carrying value of thenotes to such fair market value through a charge or credit to earnings. Correspondingadjustments to the carrying values of the investments are credited or charged directlyto other comprehensive income.
16
the Company is unable to predict or control, that maycause the actual results, performance or achievementsof the Company or industry results to be materiallydifferent from any future results, performance orachievements expressed or implied by such forward-looking statements. Such factors include, among others,the following: general economic and business conditions,both nationally and regionally; industry capacity;demographic changes; existing laws and governmentregulations and changes in, or the failure to complywith, laws and governmental regulations; legislativeproposals for health care reform; the ability to enterinto managed care provider arrangements on acceptable terms; a shift from fee-for-service paymentto capitated and other risk-based payment systems; ashift from traditional Medicare and Medicaid reim-bursement to Medicare and Medicaid managed careplans; changes in Medicare and Medicaid payment or reimbursement levels; liability and other claims assertedagainst the Company; competition; the loss of any significant customers; technological and pharmaceuticalimprovements that increase the cost of providing, orreduce the demand for, health care; changes in business strategy or development plans; the ability toattract and retain qualified personnel, including physicians, nurses and other health care professionals;the significant indebtedness of the Company; theavailability of suitable acquisition opportunities andthe length of time it takes to accomplish acquisitions;the Company’s ability to integrate new business withits existing operations; and the availability and terms ofcapital to fund the expansion of the Company’s business,including the acquisition of additional facilities andother factors referenced in this Annual Report. Giventhese uncertainties, prospective investors are cautionednot to place undue reliance on such forward-lookingstatements. The Company disclaims any obligation toupdate any such factors or to publicly announce theresults of any revisions to any of the forward-lookingstatements contained herein to reflect future events or developments.
BUSINESS OUTLOOK
The general hospital industry in the United States andthe Company’s general hospitals continue to have significant unused capacity, and thus there is substantialcompetition for patients. Inpatient utilizationcontinues to be negatively affected by payer-required pre-admission authorization and by payer pressure to maximize outpatient and alternative health caredelivery services for less acutely ill patients. Increasedcompetition, admission constraints and payer pressure,as well as the shift in patient mix to managed care, areexpected to continue.
The ongoing challenge facing the Company and thehealth care industry as a whole is to continue to providequality patient care in an environment of rising costs,strong competition for patients and continued pressureon payment rates by government and other payers.Because of national, state and private industry effortsto reform health care delivery and payment systems,the health care industry as a whole faces increaseduncertainty. The Company is unable to predictwhether any other health care legislation at the federaland/or state level will be passed in the future and whataction it may take in response to such legislation, butit continues to monitor all proposed legislation andanalyze its potential impact in order to formulate theCompany’s future business strategies.
FORWARD-LOOKING STATEMENTS
Certain statements contained in this Annual Report,including, without limitation, statements containingthe words believes, anticipates, expects, will, may,might, should, estimates, intends, appears and wordsof similar import, and statements regarding theCompany’s business strategy and plans, constitute“forward-looking statements” within the meaning of thePrivate Securities Litigation Reform Act of 1995. Suchforward-looking statements are based on management’scurrent expectations and involve known and unknownrisks, uncertainties and other factors, many of which
R E P O R T O F
M A N A G E M E N T
T E N E T H E A L T H C A R E C O R P O R A T I O N A N D S U B S I D I A R I E S 17
To Our Shareholders
The management of Tenet Healthcare Corporation is responsible for the preparation,integrity and objectivity of the consolidated financial statements of the Company and itssubsidiaries and all other information in this Annual Report to Shareholders. The consolidated financial statements have been prepared in conformity with accountingprinciples generally accepted in the United States of America and, accordingly, includecertain amounts that are based on management’s informed judgment and best estimates.
The Company maintains a comprehensive system of internal accounting controls to assistmanagement in fulfilling its responsibility for financial reporting. These controls are supported by the careful selection and training of qualified personnel and an appropriatedivision of responsibilities. Management believes that these controls provide reasonableassurance that assets are safeguarded from loss or unauthorized use and that theCompany’s financial records are a reliable basis for preparing the financial statements.
The Audit Committee of the Board of Directors, comprised solely of directors who areneither current nor former officers or employees of the Company, meets regularly withTenet’s management, internal auditors and independent certified public accountants toreview matters relating to financial reporting (including the quality of accounting principles),internal accounting controls and auditing. The independent accountants and the internalauditors have direct and confidential access to the Audit Committee at all times todiscuss the results of their audits.
The Company’s independent certified public accountants, selected and engaged by theCompany, perform an annual audit of the consolidated financial statements of theCompany in accordance with auditing standards generally accepted in the United Statesof America. These standards require a review of the system of internal controls and testsof transactions to the extent deemed necessary by the independent certified publicaccountants for purposes of supporting their opinion as set forth in their independentauditors’ report. Their report expresses an independent opinion on the fairness of presentation of the consolidated financial statements.
David L. DennisOffice of the President,Chief Corporate Officer and Chief Financial Officer, Vice Chairman
Raymond L. MathiasenExecutive Vice President and Chief Accounting Officer
18
The Board of DirectorsTENET HEALTHCARE CORPORATION:
We have audited the accompanying consolidated balance sheets of Tenet HealthcareCorporation and subsidiaries as of May 31, 1999 and 2000, and the related consolidatedstatements of income, comprehensive income, changes in shareholders’ equity and cashflows for each of the years in the three-year period ended May 31, 2000. These consolidated financial statements are the responsibility of the Company’s management.Our responsibility is to express an opinion on these consolidated financial statementsbased on our audits.
We conducted our audits in accordance with auditing standards generally accepted in theUnited States of America. Those standards require that we plan and perform the audit toobtain reasonable assurance about whether the financial statements are free of materialmisstatement. An audit includes examining, on a test basis, evidence supporting theamounts and disclosures in the financial statements. An audit also includes assessing theaccounting principles used and significant estimates made by management, as well asevaluating the overall financial statement presentation. We believe that our audits providea reasonable basis for our opinion.
In our opinion, the consolidated financial statements referred to above present fairly,in all material respects, the financial position of Tenet Healthcare Corporation and subsidiaries as of May 31, 1999 and 2000, and the results of their operations and theircash flows for each of the years in the three-year period ended May 31, 2000, in conformity with accounting principles generally accepted in the United States of America.
As discussed in Note 15 to the consolidated financial statements, effective June 1, 1999,the Company changed its method of accounting for start-up costs.
Los Angeles, California
July 25, 2000
I N D E P E N D E N T A U D I T O R S ’
R E P O R T
C O N S O L I D A T E D
F I N A N C I A L S T A T E M E N T S
T E N E T H E A L T H C A R E C O R P O R A T I O N A N D S U B S I D I A R I E S 19
May 31
1999 2000
Current Assets:
Cash and cash equivalents $ 29 $ 135
Short-term investments in debt securities 130 110
Accounts receivable, less allowances for doubtful accounts($287 in 1999 and $358 in 2000) 2,318 2,506
Inventories of supplies, at cost 221 223
Deferred income taxes 196 176
Assets held for sale or disposal, at the lower of carrying value or fair value less estimated costs to sell or dispose 655 132
Other current assets 413 312
Total current assets 3,962 3,594
Investments and other assets 569 344
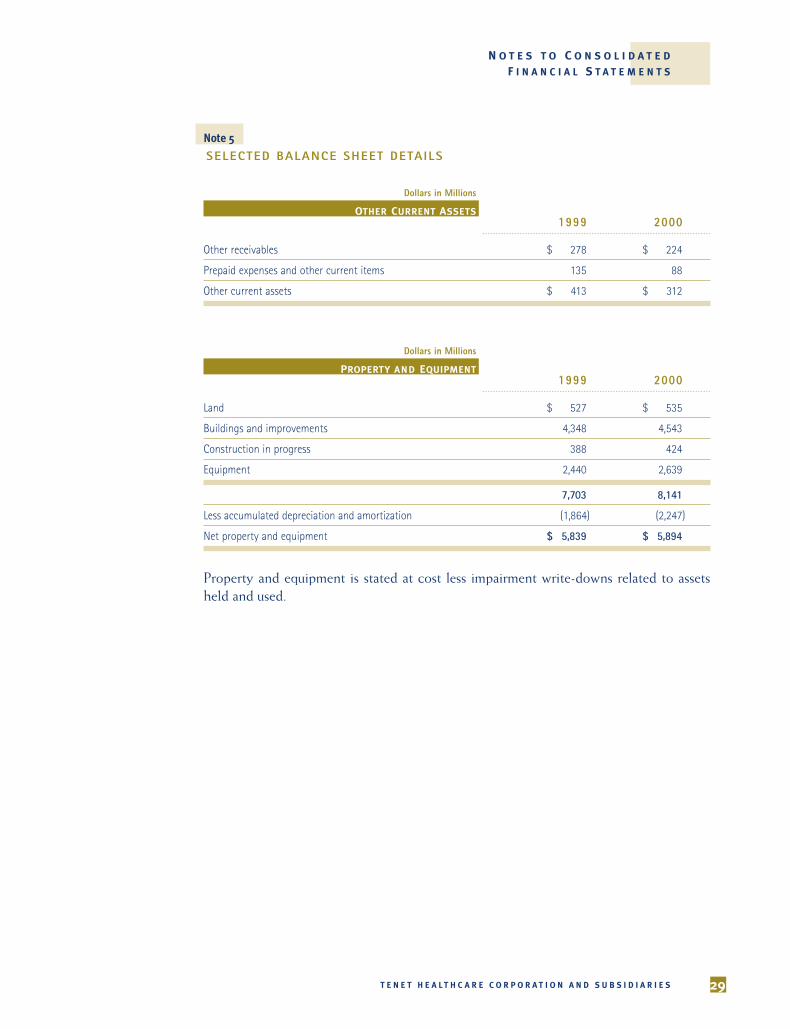
Property and equipment, net 5,839 5,894
Costs in excess of net assets acquired, less accumulated amortization($339 in 1999 and $421 in 2000) 3,283 3,235
Other intangible assets, at cost, less accumulated amortization($70 in 1999 and $80 in 2000) 118 94
$ 13,771 $ 13,161LIABILITIES AND SHAREHOLDERS’ EQUITY
Current Liabilities:
Current portion of long-term debt $ 45 $ 9
Accounts payable 713 671
Employee compensation and benefits 390 383
Accrued interest payable 163 155
Other current liabilities 711 694
Total current liabilities 2,022 1,912
Long-term debt, net of current portion 6,391 5,668
Other long-term liabilities and minority interests 1,048 1,024
Deferred income taxes 440 491
Commitments and contingencies
Shareholders’ Equity:Common stock, $0.075 par value; authorized 700,000,000 shares; 314,778,323 shares issued at May 31, 1999 and 317,214,748 shares issued at May 31, 2000 24 24
Additional paid-in capital 2,510 2,555
Accumulated other comprehensive income (loss) 77 (70)
Retained earnings 1,329 1,627
Less common stock in treasury, at cost, 3,754,708 shares at May 31, 1999 and 2000 (70) (70)
Total shareholders’ equity 3,870 4,066
$ 13,771 $ 13,161
Dollars in Millions
CONSOLIDATED BALANCE SHEETS
ASSETS
See accompanying NOTES TO CONSOLIDATED FINANCIAL STATEMENTS.
20
Years Ended May 31
1998 1999 2000
Net operating revenues $ 9,895 $ 10,880 $ 11,414
Operating Expenses:
Salaries and benefits 4,052 4,412 4,508
Supplies 1,375 1,525 1,595
Provision for doubtful accounts 588 743 851
Other operating expenses 2,071 2,342 2,525
Depreciation 347 421 411
Amortization 113 135 122
Impairment and other unusual charges 221 363 355
Operating income 1,128 939 1,047
Interest expense (464) (485) (479)
Investment earnings 22 27 22
Minority interests in income of consolidated subsidiaries (22) (7) (21)
Net gains (losses) on disposals of facilities and long-term investments (17) — 49
Income from continuing operations before income taxes 647 474 618
Income taxes (269) (225) (278)
Income from continuing operations, before discontinued operations,extraordinary charge and cumulative effect of accounting change 378 249 340
Discontinued operations, net of taxes — — (19)
Extraordinary charge from early extinguishment of debt, net of taxes (117) — —
Cumulative effect of accounting change, net of taxes — — (19)
Net income $ 261 $ 249 $ 302
EARNINGS (LOSS) PER COMMON AND COMMON EQUIVALENT SHARE:
Basic:
Continuing operations $ 1.23 $ 0.80 $ 1.09
Discontinued operations — — (0.06)
Extraordinary charges (0.38) — —
Cumulative effect of accounting change — — (0.06)
$ 0.85 $ 0.80 $ 0.97
Diluted:
Continuing operations $ 1.22 $ 0.79 $ 1.08
Discontinued operations — — (0.06)
Extraordinary charges (0.38) — —
Cumulative effect of accounting change — — (0.06)
$ 0.84 $ 0.79 $ 0.96
WEIGHTED SHARES AND DILUTIVE SECURITIES OUTSTANDING (IN THOUSANDS):
Basic 306,255 310,050 311,980
Diluted 312,113 313,386 314,918
Dollars in Millions, Except Per Share Amounts
CONSOLIDATED STATEMENTS OF INCOME
See accompanying NOTES TO CONSOLIDATED FINANCIAL STATEMENTS.
T E N E T H E A L T H C A R E C O R P O R A T I O N A N D S U B S I D I A R I E S 21T E N E T H E A L T H C A R E C O R P O R A T I O N A N D S U B S I D I A R I E S
C O N S O L I D A T E D
F I N A N C I A L S T A T E M E N T S
Years Ended May 31
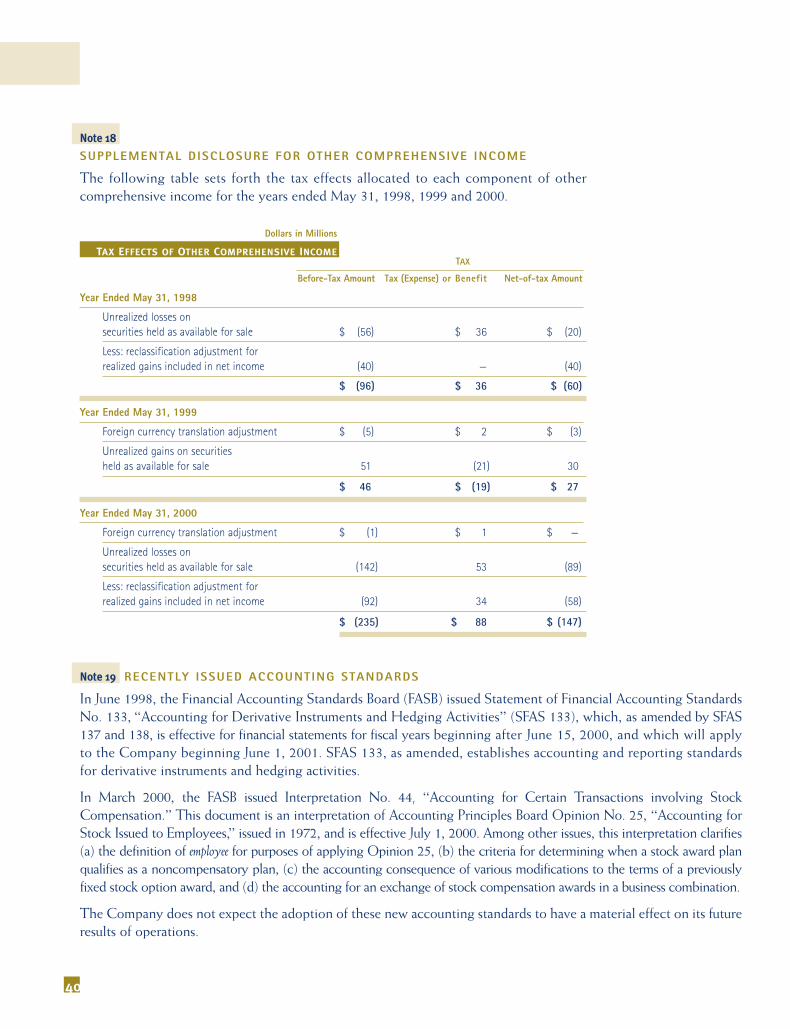
1998 1999 2000
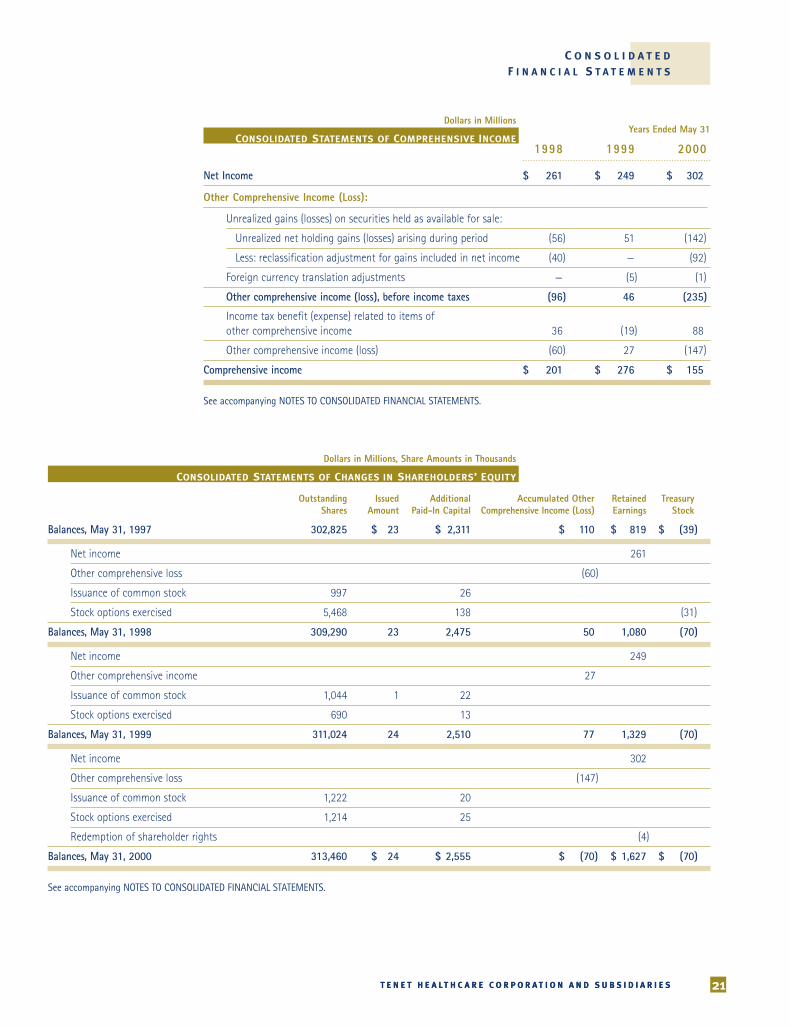
Net Income $ 261 $ 249 $ 302
Other Comprehensive Income (Loss):
Unrealized gains (losses) on securities held as available for sale:
Unrealized net holding gains (losses) arising during period (56) 51 (142)
Less: reclassification adjustment for gains included in net income (40) — (92)
CONSOLIDATED STATEMENTS OF CHANGES IN SHAREHOLDERS’ EQUITY
See accompanying NOTES TO CONSOLIDATED FINANCIAL STATEMENTS.
22
Years Ended May 31
1998 1999 2000
CASH FLOWS FROM OPERATING ACTIVITIES:
Net income $ 261 $ 249 $ 302
Adjustments to Reconcile Net Income to Net Cash Provided by Operating Activities:
Depreciation and amortization 460 556 533
Provision for doubtful accounts 588 743 851
Additions to reserves for impairment and other unusual charges 221 363 355
Deferred income taxes 131 101 2
Gain on sales of facilities and long-term investments — — (49)
Discontinued operations — — 19
Extraordinary charges from early extinguishment of debt 117 — —
Cumulative effect of accounting change — — 19
Other items 38 17 33
Increases (Decreases) in Cash from Changes in Operating Assets and Liabilities, Net of Effects from Purchases of New Businesses and Sales of Facilities:
Accounts receivable (988) (1,347) (1,139)
Inventories and other current assets (100) (114) 51
Accounts payable, accrued expenses and other current liabilities 143 197 (15)
Other long-term liabilities and minority interests (83) (108) 17
Net expenditures for discontinued operations, impairment and other unusual charges (385) (75) (110)
Net cash provided by operating activities 403 582 869
CASH FLOWS FROM INVESTING ACTIVITIES:
Purchases of property and equipment (534) (592) (619)
Purchases of new businesses, net of cash acquired (679) (541) (38)
Proceeds from sales of facilities, long-term investments and other assets 170 72 764
Other items, including expenditures related to prior-year purchases of new businesses (40) (86) (143)
Net cash used in investing activities (1,083) (1,147) (36)
CASH FLOWS FROM FINANCING ACTIVITIES:
Proceeds from borrowings 3,349 5,634 1,298
Repayments of borrowings (2,762) (5,085) (2,085)
Proceeds from exercises of stock options 80 13 25
Proceeds from sales of common stock 17 23 20
Other items (16) (14) 15
Net cash provided by (used in) financing activities 668 571 (727)
Net increase (decrease) in cash and cash equivalents (12) 6 106
Cash and cash equivalents at beginning of year 35 23 29
Cash and cash equivalents at end of year $ 23 $ 29 $ 135
Dollars in Millions
CONSOLIDATED STATEMENTS OF CASH FLOWS
See accompanying NOTES TO CONSOLIDATED FINANCIAL STATEMENTS.
N O T E S T O C O N S O L I D A T E D
F I N A N C I A L S T A T E M E N T S
T E N E T H E A L T H C A R E C O R P O R A T I O N A N D S U B S I D I A R I E S 23
Note 1 BASIS OF PRESENTATION
The accounting and reporting policies of Tenet Healthcare Corporation (together withits subsidiaries, “Tenet” or the “Company”) conform to accounting principles generallyaccepted in the United States of America and prevailing practices for investor-ownedentities within the health care industry. The preparation of financial statements in conformity with generally accepted accounting principles requires management of theCompany to make estimates and assumptions that affect the amounts reported in the consolidated financial statements and accompanying notes. Actual results could differfrom those estimates.
Note 2 SIGNIF ICANT ACCOUNTING POLIC IES
A. The Company Tenet is an investor-owned health care services company that owns or operates, throughits subsidiaries and affiliates (collectively, “subsidiaries”), general hospitals and relatedhealth care facilities and holds investments in other companies, including health carecompanies. The Company’s provision of health care through its domestic general hospitalsand related health care facilities comprises a single reportable operating segment underStatement of Financial Accounting Standards No. 131, “Disclosures About Segmentsof an Enterprise and Related Information.” At May 31, 2000, the Company’s sub-sidiaries operated 110 domestic general hospitals serving urban and rural communities in17 states, with a total of 26,939 licensed beds. The Company’s subsidiaries also owned oroperated physician practices, a small number of rehabilitation hospitals, specialty hospitals, long-term-care facilities and a psychiatric facility and many medicaloffice buildings located on the same campus as, or nearby, the Company’s general hospitals and various other ancillary health care businesses.
At May 31, 2000, the Company’s largest concentrations of hospital beds were inCalifornia with 29.6%, Florida with 14.0% and Texas with 13.3%. The concentration ofhospital beds in these three states increases the risk that any adverse economic, regulatoryor other developments that may occur in such states may adversely affect the Company’sresults of operations or financial condition.
The Company is subject to changes in government legislation that could impact Medicareand Medicaid payment levels and to increased levels of managed care penetration and changes in payer patterns that may impact the level and timing of payments for services rendered.
B. Principles of Consolidation The consolidated financial statements include the accounts of Tenet and its wholly ownedand majority-owned subsidiaries. Significant investments in other affiliated companiesgenerally are accounted for using the equity method. Intercompany accounts and transactions are eliminated in consolidation. The results of operations of acquired businesses in purchase transactions are included from their respective acquisition dates.
PERCENTAGES OF CONSOLIDATED NET OPERATING REVENUES
24
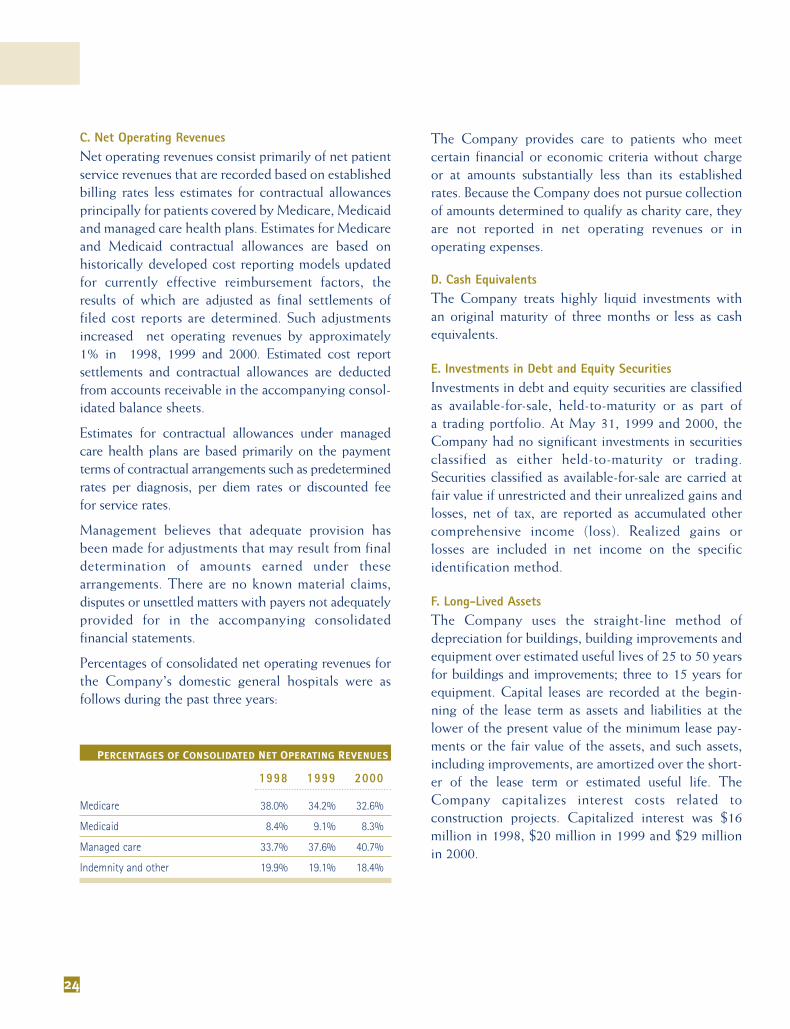
C. Net Operating Revenues Net operating revenues consist primarily of net patientservice revenues that are recorded based on establishedbilling rates less estimates for contractual allowancesprincipally for patients covered by Medicare, Medicaidand managed care health plans. Estimates for Medicareand Medicaid contractual allowances are based on historically developed cost reporting models updatedfor currently effective reimbursement factors, theresults of which are adjusted as final settlements offiled cost reports are determined. Such adjustmentsincreased net operating revenues by approximately1% in 1998, 1999 and 2000. Estimated cost reportsettlements and contractual allowances are deductedfrom accounts receivable in the accompanying consol-idated balance sheets.
Estimates for contractual allowances under managedcare health plans are based primarily on the paymentterms of contractual arrangements such as predeterminedrates per diagnosis, per diem rates or discounted fee for service rates.
Management believes that adequate provision hasbeen made for adjustments that may result from finaldetermination of amounts earned under thesearrangements. There are no known material claims,disputes or unsettled matters with payers not adequatelyprovided for in the accompanying consolidated financial statements.
Percentages of consolidated net operating revenues forthe Company’s domestic general hospitals were asfollows during the past three years:
1998 1999 2000
Medicare 38.0% 34.2% 32.6%
Medicaid 8.4% 9.1% 8.3%
Managed care 33.7% 37.6% 40.7%
Indemnity and other 19.9% 19.1% 18.4%
The Company provides care to patients who meet certain financial or economic criteria without chargeor at amounts substantially less than its establishedrates. Because the Company does not pursue collectionof amounts determined to qualify as charity care, theyare not reported in net operating revenues or in operating expenses.
D. Cash Equivalents The Company treats highly liquid investments with an original maturity of three months or less as cashequivalents.
E. Investments in Debt and Equity SecuritiesInvestments in debt and equity securities are classifiedas available-for-sale, held-to-maturity or as part of a trading portfolio. At May 31, 1999 and 2000, theCompany had no significant investments in securitiesclassified as either held-to-maturity or trading.Securities classified as available-for-sale are carried atfair value if unrestricted and their unrealized gains andlosses, net of tax, are reported as accumulated othercomprehensive income (loss). Realized gains or losses are included in net income on the specific identification method.
F. Long-Lived Assets The Company uses the straight-line method of depreciation for buildings, building improvements andequipment over estimated useful lives of 25 to 50 yearsfor buildings and improvements; three to 15 years forequipment. Capital leases are recorded at the begin-ning of the lease term as assets and liabilities at thelower of the present value of the minimum lease pay-ments or the fair value of the assets, and such assets,including improvements, are amortized over the short-er of the lease term or estimated useful life. TheCompany capitalizes interest costs related to construction projects. Capitalized interest was $16million in 1998, $20 million in 1999 and $29 millionin 2000.
N O T E S T O C O N S O L I D A T E D
F I N A N C I A L S T A T E M E N T S
T E N E T H E A L T H C A R E C O R P O R A T I O N A N D S U B S I D I A R I E S 25
Costs in excess of the fair value of the net assets of purchased businesses (goodwill) generally are amortizedon the straight-line method primarily over 40 years.Deferred financing costs are amortized over the livesof the related loans using the interest method.
Impairment of long-lived assets, including goodwillrelated to such assets, is recognized whenever eventsor changes in circumstances indicate that the carryingamount of the asset, or related groups of assets, maynot be fully recoverable from estimated future cashflows. The Company also assesses the recoverability ofgoodwill at the enterprise level in a similar manner.Measurement of the amount of impairment may bebased on appraisal, market values of similar assets orestimates of future discounted cash flows resultingfrom use and ultimate disposition of the asset.
The Company begins its process of determining if its facilities are impaired at each fiscal year-end byreviewing the three-year historical and one-year projected cash flows of each facility. Facilities whosecash flows are negative and trending significantly down-ward on this basis are selected for further impairmentanalysis. Future cash flows (undiscounted and withoutinterest charges) are estimated over the expected usefullife of the facility taking into account patient volumes,changes in payer mix, revenue and expense growthrates and changes in Medicare legislation and otherpayer payment patterns, which assumptions vary byhospital, home health agency and physician practice.The sum of those expected future cash flows are com-pared to the carrying value of the assets. If the sum ofthe expected future cash flows is less than the carryingamount of the assets, the Company recognizes animpairment charge.
G. Indexed Debt Instruments Changes in the Company’s liability resulting fromincreases or decreases in the index value of theCompany’s 6% Exchangeable Subordinated Notes areaccounted for as adjustments of the carrying amount of the Notes with corresponding charges (or credits) to earnings.
H. Income Taxes The Company accounts for income taxes under theasset and liability method. This approach requires therecognition of deferred tax assets and liabilities for the expected future tax consequences of temporary differences between the carrying amounts and the taxbases of assets and liabilities.
I. Segment ReportingThe Company’s business of providing health carethrough its domestic general hospitals (which gener-ated 90.9%, 90.5% and 93.4% of the Company’s netoperating revenues in the fiscal years 1998, 1999 and2000, respectively) and related health care facilities isa single reportable operating segment. TheCompany’s chief operating decision maker, as thatterm is defined in generally accepted accountingstandards, regularly reviews financial informationabout each of the Company’s facilities and sub-sidiaries for assessing performance and allocatingresources.
Note 3
ACQUIS IT IONS AND DISPOSALS OF FACIL IT IES
Tenet’s subsidiaries acquired six general hospitals infiscal 1998, 12 general hospitals in fiscal 1999 and onegeneral hospital in fiscal 2000. All of these transactionshave been accounted for as purchases. The results ofoperations of the acquired businesses have beenincluded in the Company’s consolidated financialstatements from the dates of acquisition.
In addition to striving to continuously improve itsportfolio of general hospitals through acquisitions, theCompany also divests, from time to time, hospitalsthat are not essential to its strategic objectives. For themost part, these facilities are not part of an integrateddelivery system. The size and performance of thesefacilities varies, but on average they are smaller, withlower margins. Such divestitures allow the Company tostreamline its organization by concentrating on, orstrengthening, the markets where it already has astrong presence.
The charges consist of $244 million in impairmentwrite-downs of property, equipment and other assetsto the lower of carrying values or estimated fair valuesand $111 million for expected cash disbursements forlease cancellation and other exit costs, the estimated and actual costs to close or sell the five general hospitals,severance costs and costs to terminate the physiciancontracts. The impairment charge includes $116 million for the write-down of property and equipment,$69 million for the write-down of goodwill and $59million for the write-down of other assets. The principalelements of the other charges are $38 million in leasecancellation costs, $12 million in severance costsrelated to the termination of 713 employees and $61million in other exit costs.
The Company decided to terminate the physicianpractices because they have not been profitable.During the latter part of fiscal 1999, the Companybegan the process of evaluating its physician strategyin each of its markets and began to develop plans toeither terminate or allow a significant number of itsexisting contracts with physicians to expire. Duringfiscal 2000, the Company’s management authorizedthe termination or expiration of the contractual relationships with approximately 50% of its contractedphysicians. The physicians, employees and propertyowners/lessors affected by this decision were dulynotified. The Company expects to incur additionalcharges in the future as the balance of its physiciancontracts are evaluated for possible termination.
The Company decided to sell or close the five generalhospitals because three represented excess capacity inthe markets where it had other hospitals and two werein markets that were not essential to the Company’sstrategic objectives.
The aggregate carrying amount of assets held for saleor disposal following the above charges was $104 million and is included in assets held for sale or disposalin the accompanying consolidated balance sheet atMay 31, 2000. The results of operations of the assetsheld for sale or disposal and the effect of suspendingfuture depreciation and amortization on impairedassets are not significant.
26
The Company’s current plan for termination or expirationof certain employment and management contracts withapproximately 440 physicians over the next 15 months $ 177
The closure or sale of five general hospitals and otherproperty and equipment 178
$ 355
Dollars in Millions
IMPAIRMENT AND OTHER UNUSUAL CHARGES
During the year ended May 31, 1998, the Companysold or closed 10 general hospitals, exchanged its ownership interest in one hospital for a minority interestin a joint venture, combined the operations of twoother general hospitals and sold certain ancillary healthcare operations. During the year ended May 31, 1999,the Company sold two general hospitals, closed onegeneral hospital, combined the operations of two general hospitals and closed 29 home health agencies.During the year ended May 31, 2000, the Companysold 17 general hospitals, closed three general hospitalsand terminated the lease on one general hospital. TheCompany also sold three long-term-care facilities. Thenet gain on the sales of these facilities in 2000 was $50million. In addition, the Company recorded $61 millionin gains from sales of investments in Internet-relatedhealth care ventures, offset by $62 million in net lossesfrom sales of other investments. The results of opera-tions of the sold or closed businesses were not significant.
Note 4
IMPAIRMENT AND OTHER UNUSUAL CHARGES
2000In the third and fourth quarters of the year ended May 31, 2000, the Company recorded impairment andother unusual charges of $355 million relating to:
N O T E S T O C O N S O L I D A T E D
F I N A N C I A L S T A T E M E N T S
T E N E T H E A L T H C A R E C O R P O R A T I O N A N D S U B S I D I A R I E S 27
The Company’s 1998 Plan to Close or Sell:
Three general hospitals by May 31, 1999 $ 77
Two specialty hospitals by May 31, 1999 24
Twenty-nine home health agencies by August 31, 1998 38
Write-off of goodwill and other assets and additional costs to terminate contracts related to 33 of the Company’s physician practices by May 31, 1999 41
Impairment of the carrying value of goodwill at an additional general hospital 20
Impairment of the carrying values of property, equipment, goodwill and other assets at 16 home health agencies to be held and used 7
A net increase in the estimate for losses from a 1997 plan to close or sell hospitals 14
$ 221
Dollars in Millions
IMPAIRMENT AND OTHER UNUSUAL CHARGES
The Company’s 1999 Plan to sell 20 general hospitals and close one general and one specialty hospital by February 29, 2000 $ 277
Impairment of the carrying values of property, equipment and goodwill at 20 physician practices and other ancillary health care businesses to be held and used 38
Implementation of hospital cost control programs and general overhead reduction plans 48
$ 363
Dollars in Millions
IMPAIRMENT AND OTHER UNUSUAL CHARGES
1999In the fourth quarter of the year ended May 31, 1999,the Company recorded impairment and other unusualcharges of $363 million relating to:
The charges in the 1999 Plan above primarily consistedof $264 million in impairment charges to value property and equipment and other assets at the lower ofcarrying value or estimated fair values for those facilitiesincluded in the Company’s plan that were to be closedor were expected to be sold at losses, and $13 millionin other costs of closure, primarily lease cancellations.The $38 million impairment charge included $19 million for the write-off of goodwill, $10 million forthe write-down of property and equipment to estimatedfair values and $9 million for the write-down of otherassets. The principal elements of the $48 millioncharge for the implementation of hospital cost-controlprograms and general overhead-reduction plans were$18 million in lease cancellation costs, $15 million inseverance costs related to the termination of 233employees in facilities and 120 employees in corporate overhead departments and $15 million inother exit costs.
The Company decided to sell or close the above facilities because, for the most part, they were in markets that were not essential to the Company’sstrategic objectives.
The aggregate carrying amount of assets held for disposal following the above charges was $631 million.The results of operations of the assets held for sale and the effect of suspending future depreciation andamortization on impaired assets were not significant.As of May 31, 2000, the execution of the 1999 Planwas substantially complete.
1998In the fourth quarter of the year ended May 31, 1998,the Company recorded impairment and other unusualcharges of $221 million relating to:
The charges in the 1998 Plan above primarily consistedof $42 million in impairment charges to value propertyand equipment and other assets and $40 million tovalue goodwill at estimated fair values. For the hospitalsthat were to be closed, the charges also included $36million of lease commitments, demolition and othercosts of closure. For the home health agencies that wereto be closed, the charges above also included (a) $14million in severance costs related to the termination of489 employees at the agencies and in the corporate
28
(1) The liability balances are included in other current liabilities and other long-term liabilities in the accompanying consolidated balance sheets.
(2) Other items primarily include write-offs of long-lived assets, including property and equipment, goodwill and other assets.
Cash payments to be applied against these liabilities are expected to approximate $84 million in fiscal 2001 and $57 million thereafter.
May 31, Cash Other May 31, Cash Other May 31,1998(1) Charges Payments Items(2) 1999(1) Charges Payments Items(2) 2000(1)
Reserves Related to:
Lease cancellations, exit costs and estimated costs to sell or close hospitals and other facilities $ 78 $ 56 $ (22) $ (36) $ 76 $ 96 $ (54) $ (12) $ 106
Impairment losses to value property, equipment, goodwill and other assets, at estimated fair values — 292 — (292) — 244 — (244) —
Severance costs in connection with the implementation of hospital cost-control programs, general overhead-reduction plans, closure of home health agencies and closure of hospitals and termination of physician contracts 14 15 (10) — 19 11 (13) — 17
Accruals for unfavorable lease commitments at six medical office buildings 22 — (2) — 20 — (8) — 12
LIABILITY BALANCES IN CONNECTION WITH IMPAIRMENT AND OTHER UNUSUAL CHARGES
overhead departments involved with these exit activities, and (b) $6 million in other exitcosts. The Company decided to terminate the physician contracts because they were generating and were projected to continue to generate operating losses. The $41 millioncharge included $32 million for the write-off of goodwill and other assets and $9 millionfor the estimated costs to cancel the employment or management service agreements withthe physicians. The $14 million increase in the estimate for losses from the 1997 Planwas primarily to record $33 million of additional impairment charges at five hospitals fromthe 1997 Plan based on revised estimates of fair value and costs to sell or close, less $19million of favorable adjustments at two other hospitals while they were held for disposaland whose fair market values increased during the year ended May 31, 1998. The aggregatecarrying amount of assets held for disposal following the above charges was $38 million.The results of operations of the assets held for disposal and the effect of suspending futuredepreciation and amortization on impaired assets were not significant. As of May 31,1999, the execution of the 1998 Plan was substantially complete.
The table below presents a reconciliation of beginning and ending liability balances inconnection with impairment and other unusual charges recorded in the current and priorfiscal years, as of May 31, 1998, 1999 and 2000.
Note 5
SELECTED BALANCE SHEET DETAILS
1999 2000
Other receivables $ 278 $ 224
Prepaid expenses and other current items 135 88
Other current assets $ 413 $ 312
Dollars in Millions
OTHER CURRENT ASSETS
N O T E S T O C O N S O L I D A T E D
F I N A N C I A L S T A T E M E N T S
T E N E T H E A L T H C A R E C O R P O R A T I O N A N D S U B S I D I A R I E S 29
1999 2000
Land $ 527 $ 535
Buildings and improvements 4,348 4,543
Construction in progress 388 424
Equipment 2,440 2,639
7,703 8,141
Less accumulated depreciation and amortization (1,864) (2,247)
Net property and equipment $ 5,839 $ 5,894
Dollars in Millions
PROPERTY AND EQUIPMENT
Property and equipment is stated at cost less impairment write-downs related to assetsheld and used.
30
Loans Payable to Banks — Loans under the Company’s credit agreement are unsecured andgenerally bear interest at a base rate equal to the prime rate or, if higher, the federal fundsrate plus 0.50%, or, at the option of the Company, an adjusted London interbank offeredrate (LIBOR) for one-, two-, three-, or six-month periods plus an interest margin of 68.75basis points. The Company has agreed to pay the lenders an annual facility fee of 31.25 basis points on the total loan commitment. During the year ended May 31, 2000,the weighted average interest rate on loans payable to banks under the credit agreement was 6.4%. The Company expects to refinance the credit agreement on orbefore its January 31, 2002 maturity date.
Senior Notes and Senior Subordinated Notes — In June 2000, the Company issued, in a private placement, $400 million of 91/4% Senior Notes due 2010. The proceeds were usedto retire existing bank debt under the credit agreement.
1999 2000
Loans payable to banks — unsecured $ 2,168 $ 1,442
85/8% Senior Notes due 2003, $500 million face value, net of $7 million unamortized discount 492 493
77/8% Senior Notes due 2003, $400 million face value, net of $4 million unamortized discount 395 396
8% Senior Notes due 2005, $900 million face value, net of $15 million unamortized discount 882 885
75/8% Senior Notes due 2008, $350 million face value, net of $6 million unamortized discount 344 344
85/8% Senior Subordinated Notes due 2007, $700 million face value, net of $12 million unamortized discount 686 688
81/8% Senior Subordinated Notes due 2008, $1,005 million face value, net of $23 million unamortized discount 980 982
6% Exchangeable Subordinated Notes due 2005, $320 million face value, net of $6 million unamortized discount 313 314
Zero–coupon guaranteed bonds due 2002 33 37
Notes payable and capital lease obligations, secured by property and equipment payable in installments to 2016 125 80
Other notes, primarily unsecured 18 16
6,436 5,677
Less current portion (45) (9)
$ 6,391 $ 5,668
Dollars in Millions
LONG–TERM DEBT
Note 6 LONG-TERM DEBT AND LEASE OBLIGATIONS
The Company’s 77/8% Senior Notes due 2003, 85/8%Senior Notes due 2003 and 8% Senior Notes due 2005are not redeemable prior to their maturity. The 75/8%Senior Notes due 2008 and the new 91/4% SeniorNotes due 2010 are redeemable at any time at theoption of the Company. The 8 5/8% SeniorSubordinated Notes due 2007 are redeemable at theoption of the Company, in whole or from time to timein part, at any time on or after January 15, 2002. TheSenior Subordinated Notes due 2008 are notredeemable by the Company prior to June 1, 2003.
The senior notes are unsecured obligations of theCompany ranking senior to all subordinated indebted-ness of the Company, including the senior subordinatednotes, and equally in right of payment with all otherindebtedness of the Company, including borrowingsunder the credit agreement described above. The seniorsubordinated notes also are unsecured obligations of theCompany and are subordinated in right of payment toall existing and future senior debt, including the seniornotes and borrowings under the credit agreement.
In connection with the redemption of certain of theCompany’s indebtedness in 1998, the Companyrecorded an extraordinary charge from early extinguishment of debt in the amount of $117 million,net of tax benefits of $72 million.
6% Exchangeable Subordinated Notes — The 6%Exchangeable Subordinated Notes due 2005 areexchangeable at the option of the holder for shares ofcommon stock of Ventas, Inc., formerly known asVencor, Inc. (Ventas), at an exchange rate of 25.9403shares and $239.36 in cash (see Note 12) per $1,000principal amount of the notes, subject to theCompany’s right to pay an amount in cash equal to themarket price of the shares of Ventas common stock in lieu of delivery of such shares. Subject to certain limitations in the credit agreement, the notes are nowredeemable at the option of the Company at any time.The notes also are unsecured obligations of theCompany subordinated in right of payment to all existing and future senior and senior subordinated debtand borrowings under the credit agreement.
N O T E S T O C O N S O L I D A T E D
F I N A N C I A L S T A T E M E N T S
T E N E T H E A L T H C A R E C O R P O R A T I O N A N D S U B S I D I A R I E S 31
In May 1998, Ventas, in connection with a plan ofreorganization, split into two public companies: a self-administered, self-managed realty company (Ventas),and an operating company now known as Vencor, Inc.(Vencor), which leases hospitals and nursing facilitiesfrom Ventas. In May 1998, the Company sold itsVencor common stock and invested the proceeds in a portfolio of investments in U.S. government andU.S. government-sponsored agency securities. Theseinvestments, which are held in escrow for the benefitof the holders of the 6% Exchangeable SubordinatedNotes, are treated as available for sale.
To the extent that the combined fair market value of the Company’s investment in the common stock ofVentas and, from May 1998, the related investmentportfolio, exceeds the carrying value of the notes at theend of any accounting period, the Company adjuststhe carrying value of the notes to the fair market valueof the investments through a charge or credit to earnings. Corresponding adjustments to the carryingvalue of the investments are credited or charged directlyto other comprehensive income as unrealized gains orlosses. The combined value of the Ventas commonstock and the investment portfolio has remained belowthe exchange price since the end of the Company’ssecond quarter in fiscal 1998.
Loan Covenants — The credit agreement and the indentures governing the Company’s outstanding publicdebt have, among other requirements, limitations on borrowings by, and liens on the assets of, theCompany or its subsidiaries, investments, the sale of all or substantially all assets and prepayment of subordinated debt, a prohibition against the Companydeclaring or paying dividends on or purchasing itsstock unless its senior long-term unsecured debt securities are rated BBB- or higher by Standard and Poors’ Rating Services and Baa3 or higher byMoody’s Investors Service, Inc., and covenantsregarding maintenance of specified levels of networth, debt ratios and fixed-charge coverage ratios.Because of the dividend restrictions, all of the
32
1998 1999 2000
Currently Payable:
Federal $ 66 $ 97 $ 229
State 28 25 32
94 122 261
Deferred:
Federal 112 83 (4)
State 19 18 18
131 101 14
Other 44 2 3
$ 269 $ 225 $ 278
Dollars in Millions
INCOME TAXES ON CONTINUING OPERATIONS
Company’s retained earnings are restricted. The Company is in compliance with its loancovenants. There are no compensating balance requirements for any credit line or borrowing.
Future long-term debt maturities and minimum operating lease payments as of May 31,2000 are as follows:
Rental expense under operating leases, including short-term leases, was $283 million in1998, $290 million in 1999 and $286 in 2000.
Note 7 INCOME TAXES
A reconciliation between the amount of reported income tax expense and the amountcomputed by multiplying income before tax by the statutory Federal income tax rate isshown below:
1998 1999 2000
Tax provision at statutory federal rate of 35% $ 227 $ 166 $ 216
State income taxes, net of federal income tax benefit 27 28 32
Goodwill amortization 26 25 23
Nondeductible goodwill included in asset sales — — 32
Donation of TRC common stock (25) — —
Nondeductible asset impairment charges 12 38 1
Change in valuation allowance and tax contingency reserves 10 (35) (32)
Reserves related to discontinued operations, impairment and other unusual charges 152 — 140 —
Receivables — doubtful accounts and adjustments 44 — — 15
Accruals for insurance risks 101 — 120 —
Intangible assets — 8 — 50
Other long-term liabilities 64 — 149 —
Benefit plans 98 — 69 —
Other accrued liabilities 92 — 124 —
Investments and other assets — 75 16 —
Net operating loss carryforwards 41 — 17 —
Other items 1 — 7 —
$ 593 $ 837 $ 642 $ 957
Dollars in Millions
DEFERRED TAX ASSETS AND LIABILITIES
Deferred tax assets and liabilities as of May 31, 1999 and 2000 relate to the following:
N O T E S T O C O N S O L I D A T E D
F I N A N C I A L S T A T E M E N T S
T E N E T H E A L T H C A R E C O R P O R A T I O N A N D S U B S I D I A R I E S 33
34
currently are $1 million per occurrence and in prioryears varied by hospital and by policy period from$500,000 to $3 million per occurrence. A significantportion of these risks is, in turn, reinsured with majorindependent insurance companies. In addition to the reserves recorded by the above insurance subsidiary, the Company maintains an unfundedreserve based on actuarial estimates for the self-insuredportion of its professional liability risks. Reserves forlosses and related expenses are estimated using expectedloss-reporting patterns and have been discounted totheir present value using a discount rate of 8%.Adjustments to the reserves are included in results of operations.
B. Significant Legal ProceedingsThe Company has been involved in significant civil litigation of an unusual nature related principally to its subsidiaries’ discontinued psychiatric business. TheCompany recently entered into an agreement in principle to settle substantially all of such civil litigation.
Note 9 STOCK BENEFIT PLANS
The Company has stock-based compensation plans,which are described below. The Company has electedto continue to apply Accounting Principles BoardOpinion No. 25 and related interpretations inaccounting for its plans. Accordingly, no compensationcost has been recognized for stock options under theplans because the exercise prices for options grantedwere equal to the quoted market prices on the optiongrant dates and all option grants were to employees or directors.
At May 31, 2000, there were 17,583,014 shares of common stock available for future grants of stockoptions and performance-based incentive awards to theCompany’s key employees, advisors and consultants.Options are normally exercisable at the rate of one-third per year beginning one year from the date ofgrant. Stock options generally expire 10 years from thedate of grant. No performance-based incentive stockawards have been made since fiscal 1994.
Management believes that realization of the deferredtax assets is more likely than not to occur as temporarydifferences reverse against future taxable income.
At May 31, 2000, the Company’s carryforwards fromprior tax returns available to offset future federal nettaxable income consisted of (1) net operating loss carryforwards of approximately $49 million, expiringin 2002 through 2007, and (2) approximately $6 millionin alternative minimum taxes with no expiration.
Allowable federal deductions relating to net operatinglosses are subject to annual limitations. These limita-tions are not expected to significantly affect the abilityof the Company to ultimately recognize the benefit ofthese net operating loss deductions in future years.
Note 8 CLAIMS AND LAWSUITS
In its normal course of business, the Company is subject to claims and lawsuits. The Company believesthat its liability for damages resulting from such claimsand lawsuits is adequately covered by insurance or is adequately provided for in its consolidated financial statements.
The Company has recorded provisions to estimate thecost of the ultimate disposition of all of its significantlegal proceedings and to estimate the legal fees that itexpects to incur. There can be no assurance that theultimate liability will not exceed such estimates. Whilethe amounts claimed may be substantial, the ultimateliability cannot now be reasonably determined becauseof the considerable uncertainties that exist. Therefore,it is possible that results of operations or liquidity in aparticular period could be materially affected by certain of these contingencies. Based on facts currentlyavailable, however, management believes that the disposition of known matters that are pending orasserted will not have a materially adverse effect on thefinancial position of the Company.
A. Professional and General Liability InsuranceThe Company insures substantially all of itsprofessional and comprehensive general liability risks inexcess of self-insured retentions through a majority-ownedinsurance subsidiary. These self-insured retentions
OUTSTANDING STOCK OPTIONS
N O T E S T O C O N S O L I D A T E D
F I N A N C I A L S T A T E M E N T S
T E N E T H E A L T H C A R E C O R P O R A T I O N A N D S U B S I D I A R I E S 35
OPTIONS OUTSTANDING OPTIONS EXERCISABLE
Range of Number of Weighted-Average Weighted Average Number of Weighted AverageExercise Prices Options Remaining Contractual Life Exercise Price Options Exercise Price
$ 4.69 to $9.88 2,463,164 3.3 years $ 9.40 2,463,164 $ 9.40
$ 11.11 to $17.50 11,141,815 7.4 years 15.53 3,994,118 13.45
$ 17.63 to $23.63 6,381,705 6.3 years 20.86 4,901,602 21.08
$ 24.75 to $31.00 10,487,495 7.7 years 28.17 5,510,686 26.44
$ 33.06 to $35.13 4,835,105 7.4 years 33.09 3,250,102 33.10
35,309,284 7.0 years $ 22.22 20,119,672 $ 21.55
1998 1999 2000Weighted Average Weighted Average Weighted Average
Outstanding at end of year 23,284,572 21.58 31,387,519 23.76 35,309,284 22.22
Options exercisable at year end 12,169,407 $ 15.63 16,833,561 $ 19.02 20,119,672 $ 21.55
STOCK OPTIONS PLANS
A summary of the status of the Company’s stock option plans as of May 31, 1998, 1999and 2000, and changes during the years ending on those dates is presented below:
The Company has a Directors Stock Option Plan pursuant to which nonemployee directorsreceive annual grants of options to purchase shares of common stock. At May 31, 2000,there were 57,704 shares available for future grant. Awards have an exercise price equal tothe fair market value of the Company’s shares on the date of grant, typically vest on thedate of grant and expire 10 years after the date of grant. In July 2000, the Board ofDirectors approved an amendment to the plan that will increase the number of sharesavailable for future grants by 700,000, subject to shareholder approval.
All awards granted under the foregoing plans will vest under circumstances defined in theplans or under certain employment arrangements, including a change in control of theCompany without the approval of the Board of Directors.
The following table summarizes certain information about the Company’s stock optionsoutstanding at May 31, 2000:
36
1998 1999 2000
Expected volatility 33% 35% 36%
Risk-free interest rates 5.9% 4.9% 5.9%
Expected lives, in years 6.1 7.2 6.6
Expected dividend yield 0% 0% 0%
VALUATION ASSUMPTIONS
Net Income:
As reported $ 261 $ 249 $ 302
Pro forma $ 231 $ 199 $ 249
Basic Earnings Per Share:
As reported $ 0.85 $ 0.80 $ 0.97
Pro forma $ 0.76 $ 0.65 $ 0.81
Diluted Earnings Per Share:
As reported $ 0.84 $ 0.79 $ 0.96
Pro forma $ 0.75 $ 0.64 $ 0.80
Dollars in Millions
PRO FORMA DISCLOSURES
The weighted average fair value of options granted in 1998, 1999, and 2000 was $14.66,$13.48 and $8.21, respectively. The fair values of the option grants in the table above,and for purposes of the pro forma disclosures below, have been estimated as of the dateof each grant using a Black-Scholes option-pricing model with the following weighted-average assumptions:
Had compensation cost for the Company’s stock options been determined based onthese fair values for awards granted during the past four years, the Company’s net incomeand earnings per share would have been the pro forma amounts indicated below:
1998 1999 2000
Note 10
EMPLOYEE STOCK PURCHASE PLAN
The Company has an Employee Stock Purchase Plan under which it is authorized to issueup to 9,500,000 shares of common stock to eligible employees of the Company or its designated subsidiaries. Under the terms of the plan, eligible employees may elect to havebetween 1% and 10% of their base earnings withheld each calendar quarter to purchase,on the last day of the quarter, shares of the Company’s common stock at a purchase priceequal to 85% of the lower of the closing price on the first day of the quarter or its closingprice on the last day of the quarter. Under the plan, the Company sold 703,832 shares inthe year ended May 31, 1998 at a weighted average price of $24.87 per share, 1,043,804shares in the year ended May 31, 1999 at a weighted average price of $21.58 per shareand 1,098,554 shares in the year ended May 31, 2000 at a weighted average price of$15.92 per share.
Note 11
EMPLOYEE RETIREMENT PLANS
Substantially all domestic employees who are employed by the Company or its subsidiaries, upon qualification, are eligible to participate in a defined contribution 401(k)plan. Employees who elect to participate generally make mandatory contributions from 1%to 20% of their eligible compensation, and the Company matches such contributions up toa maximum percentage. Company contributions to the plans were approximately $39 million for fiscal 1998, $49 million for fiscal 1999 and $52 million for fiscal 2000.
Note 12
INVESTMENTS
The Company’s principal long-term investments in unconsolidated affiliates at May 31,2000, included 8,301,067 shares of Ventas, 2,865,000 shares of Total Renal Care Holdings,Inc. (TRC) and shares of various other investments, primarily in Internet-related healthcare ventures. Also included in the Company’s long-term investments at May 31, 2000 isan investment portfolio of U.S. government securities aggregating $77 million, whichresulted from the investment of the proceeds from the Company’s sale of 8,301,067shares of Vencor common stock that it received as a dividend from Ventas in May 1998.This sale resulted in a pretax loss to the Company of $30 million in 1998. The portfoliois being held in an escrow account for the benefit of the holders of the Company’s 6% Exchangeable Notes (see Note 6). The Company classifies all these investments as“available for sale” whereby the carrying values of the shares and debt instruments areadjusted to market value at the end of each accounting period through a credit or charge,net of income taxes, to other comprehensive income. At May 31, 1999 and 2000, theaggregate market value of these investments was approximately $378 million and $149million, respectively.
N O T E S T O C O N S O L I D A T E D
F I N A N C I A L S T A T E M E N T S
T E N E T H E A L T H C A R E C O R P O R A T I O N A N D S U B S I D I A R I E S 37
38
Effect of DilutiveBasic Earnings Stock Options Diluted Earnings
Per Share and Warrants Per Share
1998 Income (Numerator) $ 378 — $ 378
Weighted average shares (Denominator) 306,255 5,858 312,113
Per share amount $ 1.23 $ 1.22
1999 Income (Numerator) $ 249 — $ 249
Weighted average shares (Denominator) 310,050 3,336. 313,386
Per share amount $ 0.80 $ 0.79
2000 Income (Numerator) $ 340 — $ 340
Weighted average shares (Denominator) 311,980 2,938 314,918
Per share amount $ 1.09 $ 1.08
EARNINGS PER SHARE RECONCILIATION
Outstanding options to purchase 15,321,000 shares of common stock were not includedin the computation of earnings per share for fiscal 2000 because the options’ exerciseprices were greater than the average market price of the common stock.
In March 1998, the Company contributed 2,135,000 shares of its TRC common stock,with a fair market value of $75 million and an original cost basis of $4 million, to TenetHealthcare Foundation, a charitable foundation through which Tenet conducts substantially all of the Company’s philanthropic grant making. The effect of the contribution to the foundation, less the gain on the disposition of the TRC shares, hasbeen reflected in net losses on disposals of facilities and long-term investments in the1998 consolidated statement of income.
Note 13
EARNINGS PER SHARE
The table below is a reconciliation of the numerators and the denominators of theCompany’s basic and diluted earnings per share computations for income from continu-ing operations for each of the three years ended May 31, 1998 through 2000. Income isexpressed in millions and weighted average shares are expressed in thousands:
Dollars in Millions
SUPPLEMENTAL DISCLOSURES TO CONSOLIDATED STATEMENTS OF CASH FLOWS
N O T E S T O C O N S O L I D A T E D
F I N A N C I A L S T A T E M E N T S
T E N E T H E A L T H C A R E C O R P O R A T I O N A N D S U B S I D I A R I E S 39
Note 14
DISCONTINUED OPERATIONS—PSYCHIATRIC HOSPITAL BUSINESS
In the fourth quarter of the year ended May 31, 2000, the Company recorded an additional$30 million charge to discontinued operations ($19 million after taxes or $0.06 per share)to reflect a July 19, 2000 agreement in principle to settle substantially all of the remainingcivil litigation related to certain of the Company’s former psychiatric hospitals.
Note 15
CUMULATIVE EFFECT OF ACCOUNTING CHANGE
On June 1, 1999, the Company changed its method of accounting for start-up costs toexpense such costs as incurred in accordance with Statement of Position 98-5. The adoption of the Statement resulted in the write-off of previously capitalized start-up costsas of May 31, 1999 in the amount of $19 million, net of tax benefit, which amount isshown in the accompanying consolidated statement of income for the year ended May31, 2000 as a cumulative effect of accounting change.
Note 16
DISCLOSURES ABOUT FAIR VALUE OF F INANCIAL INSTRUMENTS
The carrying amounts of cash and cash equivalents, accounts receivable, current portionof long-term debt, accounts payable and accrued interest payable approximate fair valuebecause of the short maturity of these instruments. The carrying values of investments,both short-term and long-term (excluding investments accounted for by the equitymethod), are reported at fair value. Long-term receivables are carried at cost and are notmaterially different from their estimated fair values. The fair value of long-term debt isbased on quoted market prices and approximates its carrying value.
Note 17
SUPPLEMENTAL DISCLOSURES TO CONSOLIDATED STATEMENTS OF CASH FLOWS
Income taxes paid (net of refunds received) 11 (7) 226
Fair value of common stock issued for acquisitions of hospitals and other assets — 9 —
Fair value of 1,078,800 shares of common stock received as payments for note and the exercise of stock options 31 — —
40
Note 18
SUPPLEMENTAL DISCLOSURE FOR OTHER COMPREHENSIVE INCOME
The following table sets forth the tax effects allocated to each component of othercomprehensive income for the years ended May 31, 1998, 1999 and 2000.
Note 19 RECENTLY ISSUED ACCOUNTING STANDARDS
In June 1998, the Financial Accounting Standards Board (FASB) issued Statement of Financial Accounting StandardsNo. 133, “Accounting for Derivative Instruments and Hedging Activities” (SFAS 133), which, as amended by SFAS137 and 138, is effective for financial statements for fiscal years beginning after June 15, 2000, and which will applyto the Company beginning June 1, 2001. SFAS 133, as amended, establishes accounting and reporting standardsfor derivative instruments and hedging activities.
In March 2000, the FASB issued Interpretation No. 44, “Accounting for Certain Transactions involving StockCompensation.” This document is an interpretation of Accounting Principles Board Opinion No. 25, “Accounting forStock Issued to Employees,” issued in 1972, and is effective July 1, 2000. Among other issues, this interpretation clarifies(a) the definition of employee for purposes of applying Opinion 25, (b) the criteria for determining when a stock award planqualifies as a noncompensatory plan, (c) the accounting consequence of various modifications to the terms of a previouslyfixed stock option award, and (d) the accounting for an exchange of stock compensation awards in a business combination.
The Company does not expect the adoption of these new accounting standards to have a material effect on its futureresults of operations.
TAX
Before-Tax Amount Tax (Expense) or Benefit Net-of-tax Amount
Year Ended May 31, 1998
Unrealized losses on securities held as available for sale $ (56) $ 36 $ (20)
Less: reclassification adjustment for realized gains included in net income (40) — (40)
Unrealized losses onsecurities held as available for sale (142) 53 (89)
Less: reclassification adjustment for realized gains included in net income (92) 34 (58)
$ (235) $ 88 $ (147)
Dollars in Millions
TAX EFFECTS OF OTHER COMPREHENSIVE INCOME
S U P P L E M E N T A R Y
F I N A N C I A L I N F O R M A T I O N
T E N E T H E A L T H C A R E C O R P O R A T I O N A N D S U B S I D I A R I E S 41
Quarterly operating results are not necessarily representative of operations for a full yearfor various reasons, including levels of occupancy, interest rates, acquisitions, disposals,revenue allowance and discount fluctuations, the timing of price changes, gains and losseson sales of assets, impairment and other unusual charges and fluctuations in quarterly taxrates. For example, fiscal 1998 includes an $18 million gain recorded in the second quar-ter related to a change in the index value of the Company’s 6% ExchangeableSubordinated Notes, and a $35 million loss from disposal of long-term investments,impairment and other unusual charges of $221 million, as well as a $117 million extraor-dinary charge from early extinguishment of debt in the fourth quarter. Fiscal 1999includes impairment and other unusual charges of $363 million recorded in the fourthquarter. Fiscal 2000 includes a $19 million charge for the cumulative effect of accountingchange recorded in the first quarter and net gains (losses) on disposals of facilities andlong-term investments of $10 million, $58 million, $51 million and $(70) million record-ed in the first, second, third and fourth quarters, respectively. The third and fourth quar-ters also include impairment and other unusual charges of $232 million and $123 million,respectively. The fourth quarter also includes a $19 million charge to discontinued oper-ations.
At July 31, 2000, there were approximately 11,700 holders of record of the Company’scommon stock. The Company’s common stock is listed and traded on the New York andPacific stock exchanges. The stock prices above are the high and low sales prices asreported in the NYSE Composite Tape for the last two fiscal years. The Company’s creditfacility prohibits the declaration or payment of dividends unless its senior long-term unsecured debt securities are rated BBB- or higher by Standard and Poors’ Rating Servicesand Baa3 or higher by Moody’s Investors Services, Inc.
F ISCAL 1999 QUARTERS FISCAL 2000 QUARTERSFirst Second Third Fourth First Second Third Fourth
Holders of National Medical Enterprises,Inc. (NME) stock certificates who wouldlike to exchange them for Tenet certificates may do so by contacting thetransfer agent. Former shareholders ofAmerican Medical Holdings, Inc. (AMI)and OrNda HealthCorp who have notyet redeemed their AMI or OrNda stockfor cash and Tenet stock also should contact the transfer agent.
Please send certificates for transfer and address changes to:
Receive and DeliverDepartment - 11WP.O. Box 11002Church Street StationNew York, NY 10286
Please address other inquiries for the transfer agent to:
Shareholder RelationsDepartment - 11EP.O. Box 11258Church Street StationNew York, NY 10286
COMPANY INFORMATION
The company reports annuallyto the Securities and ExchangeCommission on Form 10-K.The Company also publishes an annual report to shareholdersand reports quarterly earnings.You may obtain a copy of these and other documents aslisted below.
Please note that the Companyno longer mails quarterly lettersto shareholders. Instead, it hasmade available the followingmeans for shareholders toobtain information on a moretimely basis:
Via the World Wide WebThe Company’s web site,www.tenethealth.com,offers extensive informationabout the Company’s operationsand financial performance,including a comprehensiveseries of investor pages. Currentand archived quarterly earningsreports, annual reports andother documents may beaccessed and/or downloaded.
Via FacsimileTo request that the Company’scurrent quarterly earnings reportbe delivered via facsimile, pleasecall (888) 896-9016.
Via MailTo request any financial literature be mailed to you,please call the Company’s literature request hotline at (805) 563-6969 or write toTenet Investor Relations.
INVESTOR RELATIONSFor all other shareholder inquiries, please contact:
Paul J. RussellSenior Vice President, Investor RelationsP.O. Box 31907Santa Barbara, CA 93130Phone: (805) 563-7188Fax: (805) 563-6877E-mail: [email protected]
Diana L. TakvamVice President, Investor RelationsP.O. Box 31907Santa Barbara, CA 93130Phone: (805) 563-6883Fax: (805) 563-6877E-mail: [email protected]
CORPORATE HEADQUARTERS
Tenet Healthcare Corporation3820 State StreetSanta Barbara, CA 93105(805) 563-7000www.tenethealth.com
ANNUAL MEETING
The annual meeting of shareholders of Tenet HealthcareCorporation will be held at 9:30 a.m. on Wednesday,October 11, 2000, at the Regent Beverly Wilshire Hotel,9500 Wilshire Boulevard,Beverly Hills, California.