UNITED STATES SECURITIES AND EXCHANGE COMMISSION Washington, D.C. 20549 FORM 10-K (Mark One) [ ü ] ANNUAL REPORT PURSUANT TO SECTION 13 OR 15(d) OF THE SECURITIES EXCHANGE ACT OF 1934 For the fiscal year ended December 31, 2018 OR [ ] TRANSITION REPORT PURSUANT TO SECTION 13 OR 15(d) OF THE SECURITIES EXCHANGE ACT OF 1934 For the transition period from __________ to __________. Commission File Number 001-16191 TENNANT COMPANY (Exact name of registrant as specified in its charter) Minnesota 41-0572550 State or other jurisdiction of (I.R.S. Employer incorporation or organization Identification No.) 701 North Lilac Drive, P.O. Box 1452 Minneapolis, Minnesota 55440 (Address of principal executive offices) (Zip Code) Registrant’s telephone number, including area code 763-540-1200 Securities registered pursuant to Section 12(b) of the Act: Title of each class Name of exchange on which registered Common Stock, par value $0.375 per share New York Stock Exchange Securities registered pursuant to Section 12(g) of the Act: None Indicate by check mark if the registrant is a well-known seasoned issuer, as defined by Rule 405 of the Securities Act. ü Yes No Indicate by check mark if the registrant is not required to file reports pursuant to Section 13 or Section 15(d) of the Act. Yes ü No Indicate by check mark whether the registrant (1) has filed all reports required to be filed by Section 13 or 15(d) of the Securities Exchange Act of 1934 during the preceding 12 months (or for such shorter period that the registrant was required to file such reports), and (2) has been subject to such filing requirements for the past 90 days. ü Yes No Indicate by check mark whether the registrant has submitted electronically every Interactive Data File required to be submitted pursuant to Rule 405 of Regulation S-T (§232.405 of this chapter) during the preceding 12 months (or for such shorter period that the registrant was required to submit such files). ü Yes No Indicate by check mark if disclosure of delinquent filers pursuant to Item 405 of Regulation S-K (§229.405 of this chapter) is not contained herein, and will not be contained, to the best of registrant’s knowledge, in definitive proxy or information statements incorporated by reference in Part III of this Form 10-K or any amendment to this Form 10-K. [ ] 1
Transcript
UNITED STATESSECURITIES AND EXCHANGE COMMISSION
Washington, D.C. 20549
FORM 10-K(Mark One)
[ üü]ANNUAL REPORT PURSUANT TO SECTION 13 OR 15(d) OF THE SECURITIES EXCHANGE ACT OF 1934For the fiscal year ended December 31, 2018
OR [ ] TRANSITION REPORT PURSUANT TO SECTION 13 OR 15(d) OF THE SECURITIES EXCHANGE ACT OF 1934
For the transition period from __________ to __________.
Commission File Number 001-16191
TENNANT COMPANY(Exact name of registrant as specified in its charter)
Minnesota 41-0572550State or other jurisdiction of (I.R.S. Employerincorporation or organization Identification No.)
701 North Lilac Drive, P.O. Box 1452Minneapolis, Minnesota 55440
(Address of principal executive offices) (Zip Code)
Registrant’s telephone number, including area code 763-540-1200
Securities registered pursuant to Section 12(b) of the Act:
Title of each class Name of exchange on which registered
Common Stock, par value $0.375 per share New York Stock Exchange
Securities registered pursuant to Section 12(g) of the Act: None
Indicate by check mark if the registrant is a well-known seasoned issuer, as defined by Rule 405 of the Securities Act. üü Yes No
Indicate by check mark if the registrant is not required to file reports pursuant to Section 13 or Section 15(d) of the Act. Yes üü NoIndicate by check mark whether the registrant (1) has filed all reports required to be filed by Section 13 or 15(d) of the Securities Exchange Actof 1934 during the preceding 12 months (or for such shorter period that the registrant was required to file such reports), and (2) has beensubject to such filing requirements for the past 90 days. üü Yes NoIndicate by check mark whether the registrant has submitted electronically every Interactive Data File required to be submitted pursuant toRule 405 of Regulation S-T (§232.405 of this chapter) during the preceding 12 months (or for such shorter period that the registrant wasrequired to submit such files). üü Yes NoIndicate by check mark if disclosure of delinquent filers pursuant to Item 405 of Regulation S-K (§229.405 of this chapter) is not containedherein, and will not be contained, to the best of registrant’s knowledge, in definitive proxy or information statements incorporated by referencein Part III of this Form 10-K or any amendment to this Form 10-K. [ ]
1
Indicate by check mark whether the registrant is a large accelerated filer, an accelerated filer, a non-accelerated filer, a smaller reporting company, or emerging growthcompany. See definitions of “large accelerated filer,” "accelerated filer," "smaller reporting company," and "emerging growth company" in Rule 12b-2 of the Exchange Act.
Large accelerated filer üü Accelerated filer Non-accelerated filer Smaller reporting company
Emerging growth company
If an emerging growth company, indicate by check mark if the registrant has elected not to use the extended transition period forcomplying with any new or revised financial accounting standards provided pursuant to Section 13(a) of the Exchange Act. [ ] Indicate by check mark whether the registrant is a shell company (as defined in Rule 12b-2 of the Act). Yes üü NoThe aggregate market value of the voting and non-voting common equity held by non-affiliates as of June 29, 2018, was $1,404,892,960.As of January 31, 2019, there were 18,119,093 shares of Common Stock outstanding.
DOCUMENTS INCORPORATED BY REFERENCE
Portions of the registrant’s Proxy Statement for its 2019 annual meeting of shareholders (the “2019 Proxy Statement”) are incorporated by reference in Part III.
2
Tennant CompanyForm 10–K
Table of Contents
PART I Page Item 1 Business 4 Item 1A Risk Factors 5
Item 1B Unresolved Staff Comments 8
Item 2 Properties 8
Item 3 Legal Proceedings 9
Item 4 Mine Safety Disclosures 9PART II Item 5 Market for Registrant's Common Equity, Related Shareholder Matters and Issuer Purchases of Equity Securities 10 Item 6 Selected Financial Data 12
Item 7 Management's Discussion and Analysis of Financial Condition and Results of Operations 14
Item 7A Quantitative and Qualitative Disclosures About Market Risk 21
Item 8 Financial Statements and Supplementary Data 22
Report of Independent Registered Public Accounting Firm 22
Consolidated Financial Statements 23
Consolidated Statements of Operations 23
Consolidated Statements of Comprehensive Income 24
Consolidated Balance Sheets 25
Consolidated Statements of Cash Flows 26
Consolidated Statements of Equity 28
Notes to the Consolidated Financial Statements 29
1 Summary of Significant Accounting Policies 29
2 Newly Adopted Accounting Pronouncements 32
3 Revision of Prior Period Financial Statements 33
4 Revenue from Contracts with Customers 33
5 Investment in Joint Venture 35
6 Management Actions 35
7 Acquisitions and Divestitures 36
8 Inventories 38
9 Property, Plant and Equipment 38
10 Goodwill and Intangible Assets 39
11 Debt 40
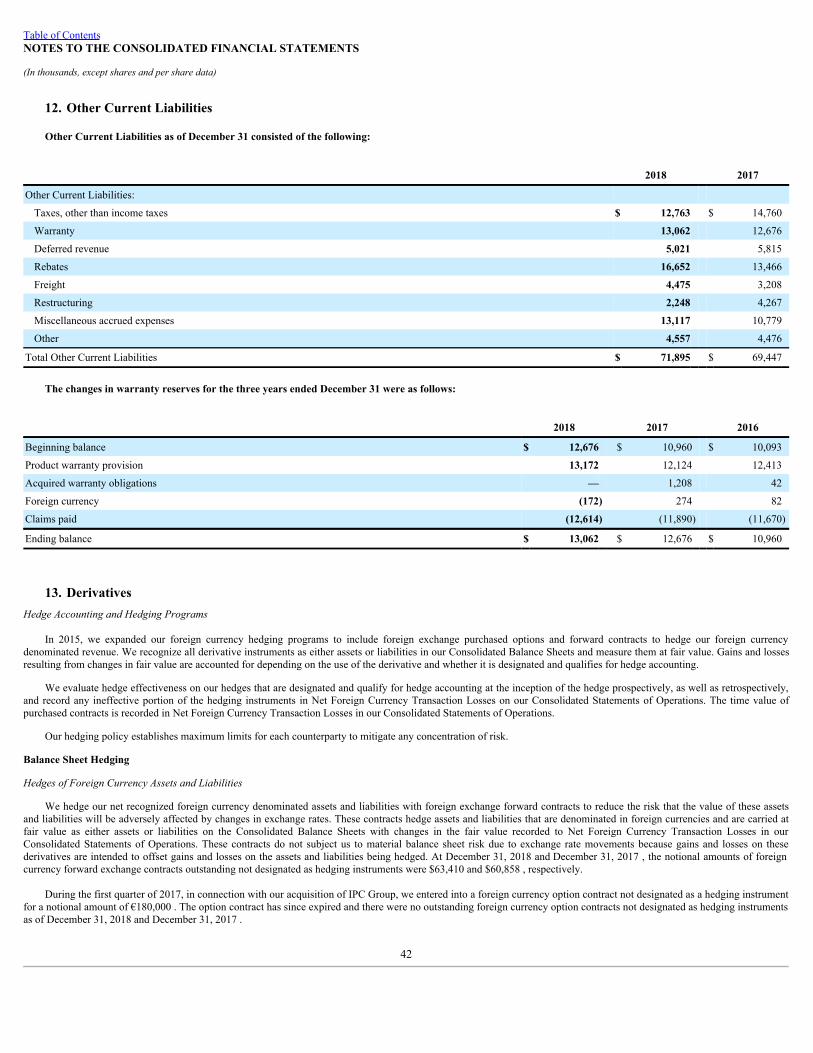
12 Other Current Liabilities 42
13 Derivatives 42
14 Fair Value Measurements 44
15 Retirement Benefit Plans 45
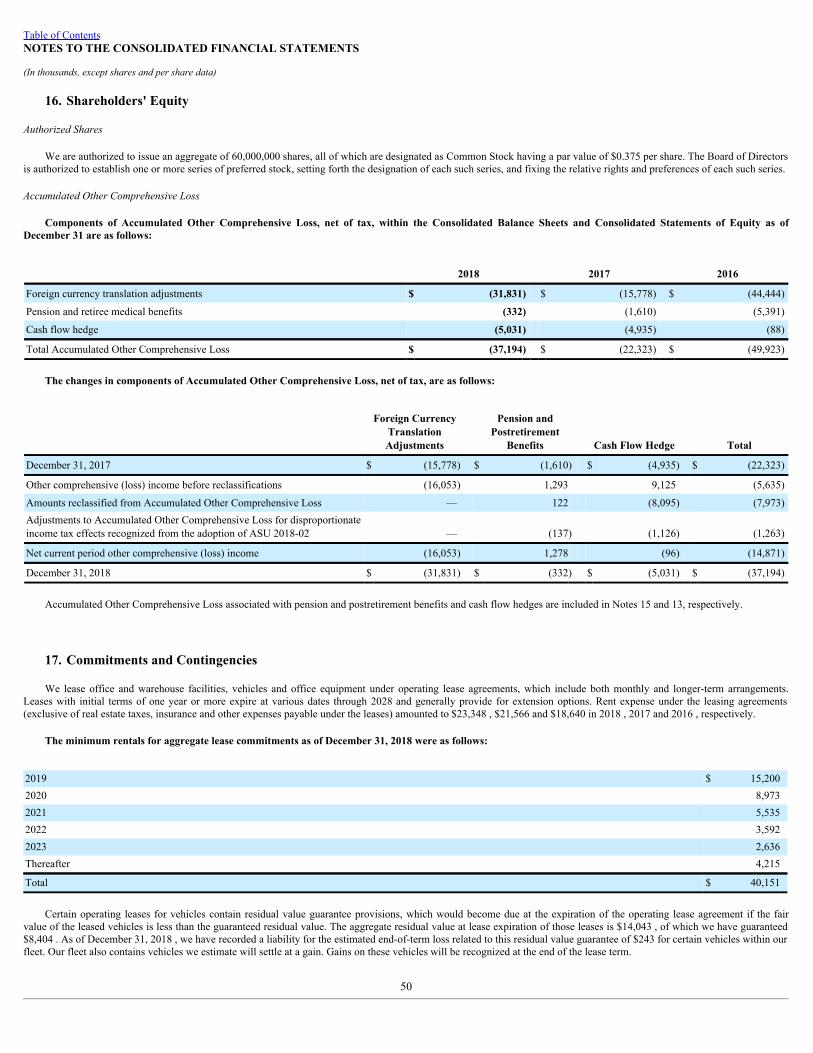
16 Shareholders' Equity 50
17 Commitments and Contingencies 50
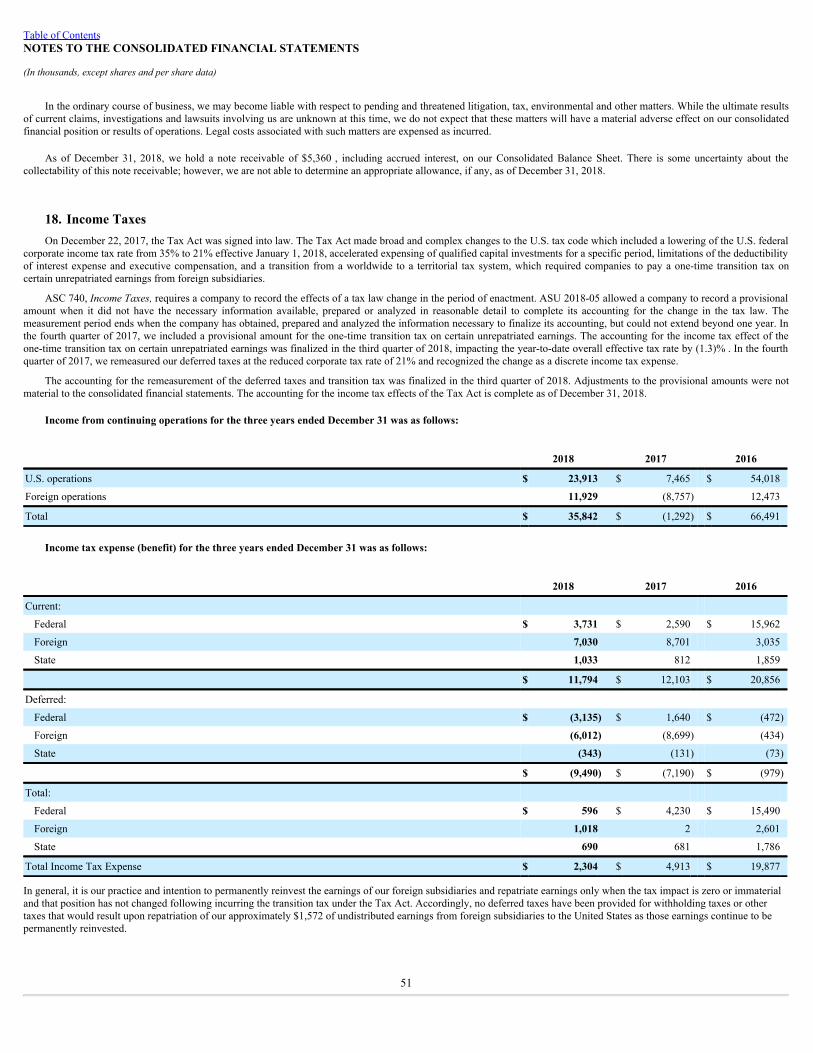
18 Income Taxes 51
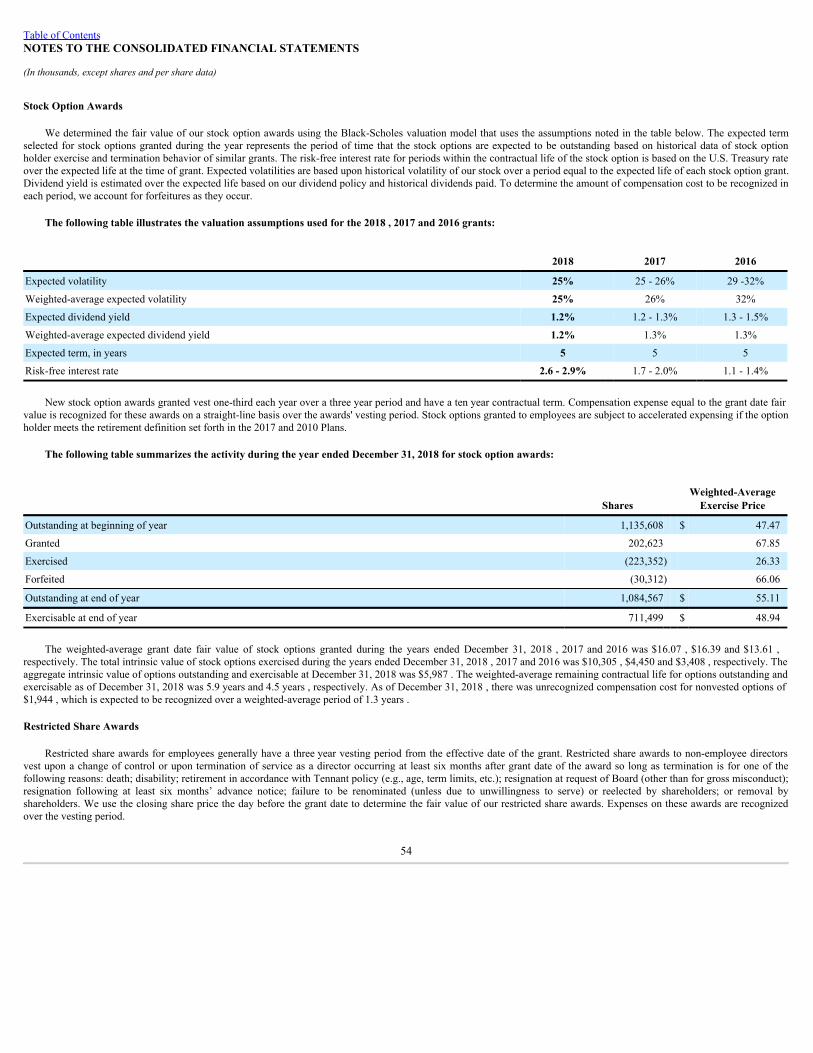
19 Share-Based Compensation 53
20 Earnings (Loss) Attributable to Tennant Company Per Share 56
21 Segment Reporting 56
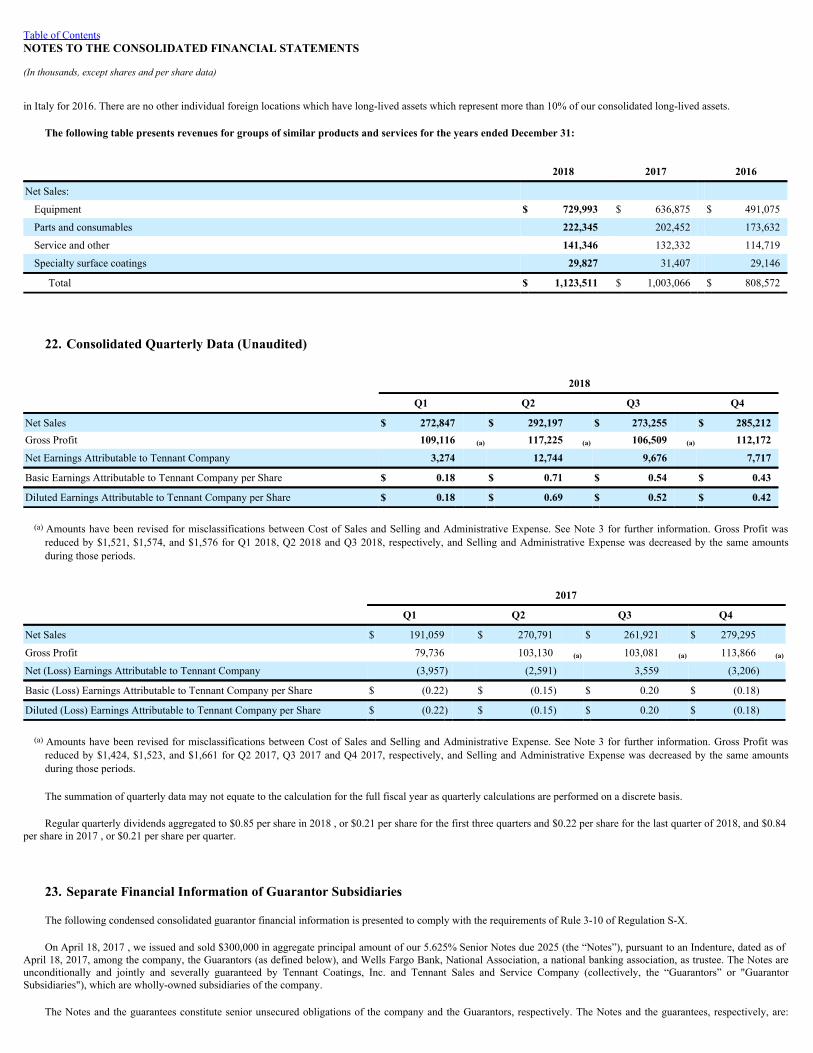
22 Consolidated Quarterly Data (Unaudited) 57
23 Separate Financial Information of Guarantor Subsidiaries 57
24 Subsequent Event 66 Item 9 Changes in and Disagreements with Accountants on Accounting and Financial Disclosure 66 Item 9A Controls and Procedures 66
Item 12 Security Ownership of Certain Beneficial Owners and Management and Related Shareholder Matters 67
Item 13 Certain Relationships and Related Transactions, and Director Independence 67
Item 14 Principal Accountant Fees and Services 67PART IV Item 15 Exhibits and Financial Statement Schedules 68 Item 16 Form 10-K Summary 71
Signatures 72
3
Table of Contents
TENNANT COMPANY2018
ANNUAL REPORTForm 10–K
(Pursuant to Securities Exchange Act of 1934)PART I
ITEM 1 – BusinessGeneral Development of Business
Founded in 1870 by George H. Tennant, Tennant Company, a Minnesotacorporation incorporated in 1909, began as a one-man woodworking business, evolvedinto a successful wood flooring and wood products company, and eventually into amanufacturer of floor cleaning equipment. Throughout its history, Tennant hasremained focused on advancing our industry by aggressively pursuing newtechnologies and creating a culture that celebrates innovation.
Today, Tennant Company is a recognized leader of the cleaning industry. We arepassionate about developing innovative and sustainable solutions that help ourcustomers clean spaces more effectively, addressing indoor and outdoor cleaningchallenges. Tennant Company operates in three geographic business units includingthe Americas, Europe, Middle East and Africa (EMEA) and Asia Pacific (APAC).
Tennant Company is committed to empowering our customers to create acleaner, safer and healthier world with high-performance solutions that minimizewaste, reduce costs, improve safety and further sustainability goals.
Principal Products, Markets and Distribution
The Company offers products and solutions consisting of mechanized cleaningequipment, detergent-free and other sustainable cleaning technologies, aftermarketparts and consumables, equipment maintenance and repair service, specialty surfacecoatings, and business solutions such as financing, rental and leasing programs, andmachine-to-machine asset management solutions.
The Company's products are used in many types of environments including:Retail establishments, distribution centers, factories and warehouses, public venuessuch as arenas and stadiums, office buildings, schools and universities, hospitals andclinics, parking lots and streets, and more. The Company markets its offerings underthe following brands: Tennant ® , Nobles ® , Alfa Uma Empresa Tennant ™ , IRIS ® ,VLX ™ , Superior Anodes, Orbio ®, , IPC brands and private-label brands. Orbio-branded products and solutions are part of the emerging category of On-SiteGeneration (OSG). OSG technologies create and dispense effective cleaning andantimicrobial solutions on site within a facility. The Company's customers includecontract cleaners to whom organizations outsource facilities maintenance, as well asbusinesses that perform facilities maintenance themselves. The Company reachesthese customers through the industry's largest direct sales and service organization andthrough a strong and well-supported network of authorized distributors worldwide.
Raw Materials
The Company has not experienced any significant or unusual problems in theavailability of raw materials or other product components. The Company has sole-source vendors for certain components. A disruption in supply from such vendors maydisrupt the Company’s operations. However, the Company believes that it can findalternate sources in the event there is a disruption in supply from such vendors.
Intellectual Property
Although the Company considers that its patents, proprietary technologies andtrade secrets, customer relationships, licenses, trademarks, trade names and brandnames in the aggregate constitute a valuable asset, it does not regard its business asbeing materially dependent upon any single item or category of intellectual property.We take appropriate measures to protect our intellectual property to the extent suchintellectual property can be protected.
SeasonalityAlthough the Company’s business is not seasonal in the traditional sense, the
percentage of revenues in each quarter typically ranges from 22% to 28% of the totalyear. The first quarter tends to be at the low end of the range reflecting customers’initial slow ramp up of capital purchases and the Company’s efforts to close out ordersat the end of each year. The second and fourth quarters tend to be toward the high endof the range and the third quarter is typically in the middle of the range.
Working CapitalThe Company funds operations through a combination of cash and cash
equivalents and cash flows from operations. Wherever possible, cash management iscentralized and intercompany financing is used to provide working capital tosubsidiaries as needed. In addition, credit facilities are available for additionalworking capital needs or investment opportunities.
Major Customers
The Company sells its products to a wide variety of customers, none of which areof material importance in relation to the business as a whole. The customer baseincludes several governmental entities which generally have terms similar to othercustomers.
Backlog
The Company processes orders within two weeks, on average. Therefore, nosignificant backlogs existed at December 31, 2018 and 2017 .
Competition
Public industry data concerning global market share is limited; however, throughan assessment of validated third-party sources and sponsored third-party marketstudies, the Company is confident in its position as a world-leading manufacturer offloor maintenance and cleaning equipment. Several global competitors compete withTennant in virtually every geography of the world. However, small regionalcompetitors are also significant competitors who vary by country, vertical market,product category or channel. The Company competes primarily on the basis ofoffering a broad line of high-quality, innovative products supported by an extensivesales and service network in major markets.
Research and Development
Tennant Company has a history of developing innovative technologies to create acleaner, safer, healthier world. The Company is committed to its innovation leadershipposition through fulfilling its goal to annually invest 3% of annual sales to researchand development. The Company’s innovation efforts are focused on solving ourcustomers’ needs holistically addressing a
4
broad array of issues, such as managing labor costs, enhancing productivity, andmaking cleaning processes more efficient and sustainable. Through core productdevelopment, partnerships and technology enablement we are creating new growthavenues for Tennant. These new avenues for growth go beyond cleaning equipmentinto business insights and service solutions.
Environmental Compliance
Compliance with Federal, State and local provisions which have been enacted oradopted regulating the discharge of materials into the environment, or otherwiserelating to the protection of the environment, has not had, and the Company does notexpect it to have, a material effect upon the Company’s capital expenditures, earningsor competitive position.
Employees
The Company employed approximately 4,300 people in worldwide operations asof December 31, 2018 .
Available Information
The Company's internet address is www.tennantco.com. The Company makesavailable free of charge, through the Investor Relations website atinvestors.tennantco.com, its annual report on Form 10-K, quarterly reports on Form10-Q, current reports on Form 8-K and amendments to those reports filed or furnishedpursuant to Section 13(a) or 15(d) of the Exchange Act as soon as reasonablypracticable when such material is filed electronically with, or furnished to, theSecurities and Exchange Commission (“SEC”).
Executive Officers of the Registrant
The list below identifies those persons designated as executive officers of theCompany, including their age, positions held with the Company and their businessexperience during the past five or more years.
David W. Huml, Senior Vice President, EMEA, APAC, Global Marketing andOperations
David W. Huml (50) joined the Company in November 2014 as Senior VicePresident, Global Marketing. In January 2016, he also assumed oversight for theCompany's APAC business unit. In January 2017, he assumed oversight for theCompany's EMEA business and in June 2018 he assumed responsibility for GlobalOperations. From 2006 to October 2014, he held various positions with Pentair plc, aglobal manufacturer of water and fluid solutions, valves and controls, equipmentprotection and thermal management products, most recently as Vice President,Applied Water Platform. From 1992 to 2006, he held various positions with GracoInc., a designer, manufacturer and marketer of systems and equipment to move,measure, control, dispense and spray fluid and coating materials, including WorldwideDirector of Marketing, Contractor Equipment Division.
H. Chris Killingstad, President and Chief Executive Officer
H. Chris Killingstad (63) joined the Company in April 2002 as Vice President,North America and was named President and CEO in 2005. From 1990 to 2002, hewas employed by The Pillsbury Company, a consumer foods manufacturer. From1999 to 2002 he served as Senior Vice President and General Manager of FrozenProducts for Pillsbury North America; from 1996 to 1999 he served as Regional VicePresident and Managing Director of Pillsbury Europe, and from 1990 to 1996 wasRegional Vice President of Häagen-Dazs Asia Pacific. He held the position ofInternational Business Development Manager at PepsiCo Inc., from 1982-1990 andFinancial Manager for General Electric, from 1978-1980.
Carol E. McKnight, Senior Vice President, Chief Administrative Officer
Carol E. McKnight (51) joined the Company in June 2014 as Senior VicePresident of Global Human Resources. In 2017, Carol was named SVP and ChiefAdministrative Officer. Prior to joining Tennant, she was Vice President of HumanResources at ATK (Alliant Techsystems) where she held divisional
and corporate leadership positions in the areas of compensation, talent management,talent acquisition and general human resource management from 2002 to 2014. Priorto ATK, she was with New Jersey-based NRG Energy, Inc.
Mary E. Talbott, Senior Vice President, General Counsel and Corporate Secretary
Mary E. Talbott (50) joined the Company in January 2019 as Senior VicePresident, General Counsel and Corporate Secretary. Prior to joining Tennant, from2017 to 2018, she was Vice President, Assistant General Counsel and AssistantCorporate Secretary for General Cable Corporation, a global manufacturer in thedevelopment, design, manufacture, marketing and distribution of copper, aluminumand fiber optic wire and cable products for use in the energy, industrial, construction,automotive, specialty and communications markets. From 2016 to 2017, she was VicePresident of Law at Macy’s, Inc., and from 2006 to 2015, she held corporateleadership positions with Scripps Networks Interactive, Inc. (which was spun off fromThe E.W. Scripps Company in 2008), a developer of lifestyle-oriented content forlinear and interactive video platforms including television and the internet, mostrecently as Senior Vice President, Deputy General Counsel and Corporate Secretary.
Keith A. Woodward, Senior Vice President and Chief Financial Officer
Keith A. Woodward (54) joined the Company in December 2018 as Senior VicePresident and Chief Financial Officer. Prior to joining Tennant, he was at GeneralMills, Inc, a global manufacturer and marketer of branded consumer foods, for over26 years holding various finance and corporate leadership roles, most recently asSenior Vice President, Global Treasurer. Prior to General Mills, Inc., he was withPriceWaterhouseCoopers.
Richard H. Zay, Senior Vice President, The Americas and R&D
Richard H. Zay (48) joined the Company in June 2010 as Vice President, GlobalMarketing and was named Senior Vice President, Global Marketing in October 2013.In 2014, he was named Senior Vice President of the Americas business unit forTennant and in 2018 he assumed responsibility for Tennant Research andDevelopment as well. From 2006 to 2010, he held various positions with WhirlpoolCorporation, a manufacturer of major home appliances, most recently as GeneralManager, KitchenAid Brand. From 1993 to 2006, he held various positions withMaytag Corporation, including Vice President, Jenn-Air Brand, Director ofMarketing, Maytag Brand, and Director of Cooking Category Management.
5
Table of Contents
ITEM 1A – Risk Factors
The following are significant factors known to us that could materially adverselyaffect our business, financial condition or operating results.
We may not be able to develop or manage strategic planning and growthprocesses or the related operational plans to deliver on our strategies and establish abroad organization alignment, thereby impairing our ability to achieve futureperformance expectations.
We are continuing to refine our global company strategy to guide our next phaseof performance as our structure has become more complex due to recent acquisitions.We continue to consolidate and reallocate resources as part of our ongoing efforts tooptimize our cost structure and to drive synergies and growth. Our operating resultsmay be negatively impacted if we are unable to implement new processes and manageorganizational changes, which includes changes to our go-to-market strategy, systemsand processes; simultaneous focus on expense control and growth; and introduction ofalternative cleaning methods. In addition, if we do not effectively realize and sustainthe benefits that these transformations are designed to produce, we may not fullyrealize the anticipated savings of these actions or they may negatively impact ourability to serve our customers or meet our strategic objectives.
We may not be able to upgrade and evolve our information technology systemsas quickly as we wish and we may encounter difficulties as we upgrade and evolvethese systems to support our growth strategy and business operations, which couldadversely impact our abilities to accomplish anticipated future cost savings andbetter serve our customers.
We have many information technology systems that are important to theoperation of our business and are in need of upgrading in order to effectivelyimplement our growth strategy. Given our greater emphasis on customer-facingtechnologies, we may not have adequate resources to upgrade our systems at the pacewhich the current business environment demands. Additionally, significantlyupgrading and evolving the capabilities of our existing systems could lead toinefficient or ineffective use of our technology due to lack of training or expertise inthese evolving technology systems. These factors could lead to significant expenses,adversely impacting our results of operations and hindering our ability to offer bettertechnology solutions to our customers.
Increases in the cost of, quality, or disruption in the availability of, rawmaterials and components that we purchase or labor required to manufacture ourproducts could negatively impact our operating results or financial condition.
Our sales growth, expanding geographical footprint and continued use of sole-source vendors, coupled with suppliers’ potential credit issues, could lead to anincreased risk of a breakdown in our supply chain. Our use of sole-source vendorscreates a concentration risk. There is an increased risk of defects due to the highlyconfigured nature of our purchased component parts that could result in quality issues,returns or production slow downs. In addition, modularization may lead to more sole-sourced products and as we seek to outsource the design of certain key components,we risk loss of proprietary control and becoming more reliant on a sole source. Thereis also a risk that the vendors we choose to supply our parts and equipment fail tocomply with our quality expectations, thus damaging our reputation for quality andnegatively impacting sales.
We have and may continue to experience higher than normal wage inflation dueto skilled labor shortages. In addition, we have incurred costs associated with tariffson certain raw materials used on our manufacturing processes. The labor shortagesand tariff costs have unfavorably impacted our gross profit margins and couldcontinue to do so if actions we are taking are not effective at offsetting these risingcosts. Changes and uncertainties related to government fiscal and tax policies,including increased duties, tariffs,
or other restrictions, could adversely affect demand for our products, the cost of theproducts we manufacture or our ability to cost-effectively source raw materials, all ofwhich could have a negative impact on our financial results.
We may encounter financial difficulties if the United States or other globaleconomies experience an additional or continued long-term economic downturn,decreasing the demand for our products and negatively affecting our sales growth.
Our product sales are sensitive to declines in capital spending by ourcustomers. Decreased demand for our products could result in decreased revenues,profitability and cash flows and may impair our ability to maintain our operations andfund our obligations to others. In the event of a continued long-term economicdownturn in the U.S. or other global economies, our revenues could decline to thepoint that we may have to take cost-saving measures, such as restructuring actions. Inaddition, other fixed costs would have to be reduced to a level that is in line with alower level of sales. A long-term economic downturn that puts downward pressure onsales could also negatively affect investor perception relative to our publicly statedgrowth targets.
Our ability to effectively operate our Company could be adversely affected if weare unable to attract and retain key personnel and other highly skilled employees,provide employee development opportunities and create effective successionplanning strategies.
Our growth strategy, expanding global footprint, changing workforcedemographics and increased improvements in technology and business processesdesigned to enhance the customer experience are putting increased pressure on humancapital strategies designed to recruit, retain and develop top talent.
Our continued success will depend on, among other things, the skills and servicesof our executive officers and other key personnel. Our ability to attract and retainhighly qualified managerial, technical, manufacturing, research, sales and marketingpersonnel also impacts our ability to effectively operate our business. As companiesgrow and increase their hiring activities, there is an inherent risk of increasedemployee turnover and the loss of valuable employees in key positions, especially inemerging markets. We believe the increased loss of key personnel within aconcentrated region could adversely affect our sales growth.
In addition, there is a risk that we may not have adequate talent acquisitionresources and employee development resources to support our future hiring needs andprovide training and development opportunities to all employees. This, in turn, couldimpede our workforce from embracing change and leveraging the improvements wehave made in technology and other business process enhancements.
Inadequate funding or insufficient innovation of new technologies may resultin an inability to develop and commercialize new innovative products and services.
We strive to develop new and innovative products and services to differentiateourselves in the marketplace. New product development relies heavily on our financialand resource investments in both the short term and long term. If we fail to adequatelyfund product development projects or fund a project which ultimately does not gainthe market acceptance we anticipated, we risk not meeting our customers'expectations, which could result in decreased revenues, declines in margin and loss ofmarket share.
We may consider acquisition of suitable candidates to accomplish our growthobjectives. We may not be able to successfully integrate the businesses we acquire toachieve operational efficiencies, including synergistic and other benefits ofacquisition.
We may consider, as part of our growth strategy, supplementing our organicgrowth through acquisitions of complementary businesses or products. We haveengaged in acquisitions in the past, such as the acquisition
6
Table of Contents
of the IPC Group, and we believe future acquisitions may provide meaningfulopportunities to grow our business and improve profitability. Acquisitions allow us toenhance the breadth of our product offerings and expand the market and geographicparticipation of our products and services.
However, our success in growing by acquisition is dependent upon identifyingbusinesses to acquire, integrating the newly acquired businesses with our existingbusinesses and complying with the terms of our credit facilities. We may incurdifficulties in the realignment and integration of business activities when assimilatingthe operations and products of an acquired business or in realizing projectedefficiencies, cost savings, revenue synergies and profit margins. Acquired businessesmay not achieve the levels of revenue, profit, productivity or otherwise perform asexpected. We are also subject to incurring unanticipated liabilities and contingenciesassociated with an acquired entity that are not identified or fully understood in the duediligence process. Current or future acquisitions may not be successful or accretive toearnings if the acquired businesses do not achieve expected financial results.
In addition, we may record significant goodwill or other intangible assets inconnection with an acquisition. We are required to perform impairment tests at leastannually and whenever events indicate that the carrying value may not be recoverablefrom future cash flows. If we determine that any intangible asset values need to bewritten down to their fair values, this could result in a charge that may be material toour operating results and financial condition.
We are subject to competitive risks associated with developing innovativeproducts and technologies, including but not limited to, not expanding as rapidly oraggressively in the global market as our competitors, our customers not continuingto pay for innovation and competitive challenges to our products, technology andthe underlying intellectual property.
Our products are sold in competitive markets throughout the world. Competitionis based on product features and design, brand recognition, reliability, durability,technology, breadth of product offerings, price, customer relationships and after-saleservice. Although we believe that the performance and price characteristics of ourproducts will produce competitive solutions for our customers’ needs, our products aregenerally priced higher than our competitors’ products. This is due to our dedicationto innovation and continued investments in research and development. We believe thatcustomers will pay for the innovations and quality in our products. However, it maybe difficult for us to compete with lower priced products offered by our competitorsand there can be no assurance that our customers will continue to choose our productsover products offered by our competitors. If our products, markets and services are notcompetitive, we may experience a decline in sales volume, an increase in pricediscounting and a loss of market share, which adversely impacts revenues, margin andthe success of our operations.
Competitors may also initiate litigation to challenge the validity of our patents orclaims, allege that we infringe upon their patents, violate our patents or they may usetheir resources to design comparable products that avoid infringing our patents.Regardless of whether such litigation is successful, such litigation could significantlyincrease our costs and divert management’s attention from the operation of ourbusiness, which could adversely affect our results of operations and financialcondition.
We may encounter risks to our IT infrastructure, such as access and security,that may not be adequately designed to protect critical data and systems from theft,corruption, unauthorized usage, viruses, sabotage or unintentional misuse.
Global cybersecurity threats and incidents can range from uncoordinatedindividual attempts to gain unauthorized access to IT systems to sophisticated andtargeted measures known as advanced persistent threats, directed at the Company, itsproducts and its customers. We seek to deploy comprehensive measures to deter,prevent, detect, react to and mitigate these threats, including identity and accesscontrols, data protection,
vulnerability assessments, continuous monitoring of our IT networks and systems andmaintenance of backup and protective systems.
Despite these efforts, cybersecurity incidents, depending on their nature andscope, could potentially result in the misappropriation, destruction, corruption orunavailability of critical data and confidential or proprietary information (our own orthat of third parties) and the disruption of business operations. The potentialconsequences of a material cybersecurity incident include financial loss, reputationaldamage, litigation with third parties, theft of intellectual property, diminution in thevalue of our investment in research, development and engineering, and increasedcybersecurity protection and remediation costs due to the increasing sophistication andproliferation of threats, which in turn could adversely affect our competitiveness andresults of operations.
Actions of activist investors or others could disrupt our business.
Public companies have been the target of activist investors. One investor whichowns approximately 5% of our outstanding common stock filed a Schedule 13D withthe Securities and Exchange Commission in December 2017 which stated its beliefthat we should undertake a strategic review process regarding a consolidationtransaction with a third party. In the event such investor or another third party, such asan activist investor, continues to pursue such belief or proposes to change ourgovernance policies, board of directors, or other aspects of our operations, our reviewand consideration of such proposals may create a significant distraction for ourmanagement and employees. This could negatively impact our ability to execute ourbusiness plans and may require our management to expend significant time andresources. Such proposals may also create uncertainties with respect to our financialposition and operations and may adversely affect our ability to attract and retain keyemployees.
We may be unable to conduct business if we experience a significant businessinterruption in our computer systems, manufacturing plants or distribution facilitiesfor a significant period of time.
We rely on our computer systems, manufacturing plants and distribution facilitiesto efficiently operate our business. If we experience an interruption in the functionalityin any of these items for a significant period of time for any reason, we may not haveadequate business continuity planning contingencies in place to allow us to continueour normal business operations on a long-term basis. In addition, the increase incustomer-facing technology raises the risk of a lapse in business operations.Therefore, significant long-term interruption in our business could cause a decline insales, an increase in expenses and could adversely impact our financial results.
Our global operations are subject to laws and regulations that imposesignificant compliance costs and create reputational and legal risk.
Due to the international scope of our operations, we are subject to a complexsystem of commercial, tax and trade regulations around the world. Recent years haveseen an increase in the development and enforcement of laws regarding trade, taxcompliance, labor and safety and anti-corruption, such as the U.S. Foreign CorruptPractices Act, and similar laws from other countries. Our numerous foreignsubsidiaries and affiliates are governed by laws, rules and business practices that differfrom those of the U.S., but because we are a U.S.-based company, oftentimes they arealso subject to U.S. laws which can create a conflict. Despite our due diligence, thereis a risk that we do not have adequate resources or comprehensive processes to staycurrent on changes in laws or regulations applicable to us worldwide and maintaincompliance with those changes. Increased compliance requirements may lead toincreased costs and erosion of desired profit margin. As a result, it is possible that theactivities of these entities may not comply with U.S. laws or business practices or ourBusiness Ethics Guide. Violations of the U.S. or local laws may result in severecriminal or civil sanctions, could disrupt our business, and result in an adverse effecton our reputation, business and
7
Table of Contents
results of operations or financial condition. We cannot predict the nature, scope oreffect of future regulatory requirements to which our operations might be subject orthe manner in which existing laws might be administered or interpreted.
In addition to the foregoing, the European Union adopted a comprehensiveGeneral Data Privacy Regulation (the "GDPR") in May 2016 that has replaced the EUData Protection Directive and related country-specific legislation. The GDPR becameeffective in May 2018. GDPR requires companies to satisfy new requirementsregarding the handling of personal and sensitive data, including its use, protection andthe ability of persons whose data is stored to correct or delete such data aboutthemselves. Failure to comply with GDPR requirements could result in penalties of upto 4% of worldwide revenue.
The SEC has adopted rules regarding disclosure of the use of “conflict minerals”(commonly referred to as tin, tantalum, tungsten and gold) which are mined from theDemocratic Republic of the Congo in products we manufacture or contract tomanufacture. These rules have required and will continue to require due diligence anddisclosure efforts.
We are subject to product liability claims and product quality issues that couldadversely affect our operating results or financial condition.
Our business exposes us to potential product liability risks that are inherent in thedesign, manufacturing and distribution of our products. If products are usedincorrectly by our customers, injury may result leading to product liability claimsagainst us. Some of our products or product improvements may have defects or risksthat we have not yet identified that may give rise to product quality issues, liabilityand warranty claims. Quality issues may also arise due to changes in parts orspecifications with suppliers and/or changes in suppliers. If product liability claims arebrought against us for damages that are in excess of our insurance coverage or foruninsured liabilities and it is determined we are liable, our business could be adverselyimpacted. Any losses we suffer from any liability claims, and the effect that anyproduct liability litigation may have upon the reputation and marketability of ourproducts, may have a negative impact on our business and operating results. We couldexperience a material design or manufacturing failure in our products, a quality systemfailure, other safety issues, or heightened regulatory scrutiny that could warrant arecall of some of our products. Any unforeseen product quality problems could resultin loss of market share, reduced sales and higher warranty expense.
We may not be able to generate sufficient cash to service all of ourindebtedness, and may be forced to take other actions to satisfy our obligationsunder our indebtedness, which may not be successful.
In April 2017, in connection with the acquisition of IPC Cleaning S.p.A., weentered into a new senior credit facility and indenture, and issued debt totalingapproximately $400,000,000 consisting of a $100,000,000 term loan and$300,000,000 of senior notes, which funded the acquisition and replaced our currentdebt facility. The new senior credit facility also includes a revolving facility in anamount up to $200,000,000. We cannot provide assurance that our business willgenerate sufficient cash flow from operations to meet all our debt servicerequirements, to pay dividends, to repurchase shares of our common stock, and tofund our general corporate and capital requirements.
Our ability to satisfy our debt obligations will depend upon our future operatingperformance. We do not have complete control over our future operating performancebecause it is subject to prevailing economic conditions, and financial, business andother factors.
Our current and future debt service obligations and covenants could haveimportant consequences. These consequences include, or may include, the following:
• our ability to obtain financing for future working capital needs or acquisitionsor other purposes may be limited;
• our funds available for operations, expansions, dividends or otherdistributions, or stock repurchases may be reduced because we dedicate asignificant portion of our cash flow from operations to the payment ofprincipal and interest on our indebtedness;
• our ability to conduct our business could be limited by restrictive covenants;and
• our vulnerability to adverse economic conditions may be greater than lessleveraged competitors and, thus, our ability to withstand competitive pressuresmay be limited.
Restrictive covenants in our senior credit facility and in our indenture place limitson our ability to conduct our business. Covenants in our senior credit facility andindenture include those that restrict our ability to make acquisitions, incur debt,encumber or sell assets, pay dividends, engage in mergers and consolidations, enterinto transactions with affiliates, make investments and permit our subsidiaries to enterinto certain restrictive agreements. The senior credit facility additionally containscertain financial covenants. We cannot provide assurance that we will be able tocomply with these covenants in the future.
Foreign currency exchange rate fluctuations, particularly the strengthening ofthe U.S. dollar against other major currencies, could result in declines in ourreported net sales and net earnings.
We earn revenues, pay expenses, own assets and incur liabilities in countriesusing functional currencies other than the U.S. dollar. Because our consolidatedfinancial statements are presented in U.S. dollars, we translate revenues and expensesinto U.S. dollars at the average exchange rate during each reporting period, as well asassets and liabilities into US. dollars at exchange rates in effect at the end of eachreporting period. Therefore, increases or decreases in the value of the U.S. dollaragainst other major currencies will affect our net revenues, net earnings, earnings pershare and the value of balance sheet items denominated in foreign currencies as wetranslate them into the U.S. dollar reporting currency. We use derivative financialinstruments to hedge our estimated transactional or translational exposure to certainforeign currency-denominated assets and liabilities as well as our foreign currencydenominated revenue. While we actively manage the exposure of our foreign currencymarket risk in the normal course of business by utilizing various foreign exchangefinancial instruments, these instruments involve risk and may not effectively limit ourunderlying exposure from foreign currency exchange rate fluctuations or minimize theeffects on our net earnings and the cash volatility associated with foreign currencyexchange rate changes. Fluctuations in foreign currency exchange rates, particularlythe strengthening of the U.S. dollar against major currencies, could materially affectour financial results.
ITEM 1B – Unresolved Staff Comments
None.
ITEM 2 – Properties
The Company’s corporate offices are owned by the Company and are located inthe Minneapolis, Minnesota, metropolitan area. Manufacturing facilities located inMinneapolis, Minnesota; Holland, Michigan; Chicago, Illinois; Uden, the Netherlandsand the Italian cities of Venice, Cremona and Reggio Emilia and in the Province ofPadua are owned by the Company. Manufacturing facilities located in Louisville,Kentucky; São Paulo, Brazil; Shanghai, China, and another facility in the Province ofPadua are leased to the Company. In addition, IPC uses a dedicated, third-party plantin Germany that specially manufactures heavy–duty stainless steel scrubbers andsweepers to IPC designs. IPC also owns a minor tools and supplies assemblyoperation in China to service local customers. The facilities are in good operatingcondition, suitable for their respective uses and adequate for current needs.
8
Sales offices, warehouse and storage facilities are leased in various locations inthe United States, Canada, Mexico, Portugal, Spain, Italy, Germany, France, theNetherlands, Belgium, Norway, the United Kingdom, Japan, China, India, Australia,New Zealand and Brazil. The Company’s facilities are in good operating condition,suitable for their respective uses and adequate for current needs.
Further information regarding the Company’s property and lease commitments isincluded in the Contractual Obligations section of Item 7 and in Note 17 to theConsolidated Financial Statements.
ITEM 3 – Legal Proceedings
There are no material pending legal proceedings other than ordinary routinelitigation incidental to the Company’s business.
ITEM 4 – Mine Safety Disclosures
Not applicable.
9
Table of Contents
PART IIITEM 5 – Market for Registrant’s Common Equity, Related Shareholder Matters and Issuer Purchases of Equity Securities
MARKET INFORMATION – Tennant's common stock is traded on the New York Stock Exchange, under the ticker symbol TNC. As of February 14, 2019, there were 312shareholders of record.
DIVIDEND INFORMATION – Cash dividends on Tennant’s common stock have been paid for 74 consecutive years. Tennant’s annual cash dividend payout increased forthe 47 th consecutive year to $0.85 per share in 2018, an increase of $0.01 per share over 2017. Dividends are generally declared each quarter. On February 14, 2019, theCompany announced a quarterly cash dividend of $0.22 per share payable March 15, 2019, to shareholders of record on February 28, 2019.
DIVIDEND REINVESTMENT OR DIRECT DEPOSIT OPTIONS – Shareholders have the option of reinvesting quarterly dividends in additional shares of Companystock or having dividends deposited directly to a bank account. The Transfer Agent should be contacted for additional information.
TRANSFER AGENT AND REGISTRAR – Shareholders with a change of address or questions about their account may contact:
EQUITY COMPENSATION PLAN INFORMATION – The following table provides information about shares of the Company's Common Stock that may be issued underthe Company's equity compensation plans, as of December 31, 2018.
Plan Category
(a) Number of securities to be issuedupon exercise of outstanding options,
warrants and rights (1)
(b) Weighted-average exerciseprice of outstanding options,
warrants and rights (2)
(c) Number of securities remainingavailable for future issuance under
equity compensation plans (excludingsecurities reflected in column (a))
Equity compensation plans not approvedby security holders — — —
Total 1,313,569 $47.47 761,382
(1) Amount includes outstanding awards under the 1997 Non-Employee Director Stock Option Plan, the 2007 Stock Incentive Plan, the Amended and Restated 2010Stock Incentive Plan, each as amended, and the 2017 Stock Incentive Plan (the "Plans"). Amount includes shares of Common Stock that may be issued upon exerciseof outstanding stock options under the Plans. Amount also includes shares of Common Stock that may be paid in cash upon exercise of outstanding stock appreciationrights under the Plans. Amount also includes shares of Common Stock that may be issued upon settlement of restricted stock units and deferred stock units (phantomstock) under the Plans. Stock appreciation rights, restricted stock units and deferred stock units may be settled in cash, stock or a combination of both. Column (a)includes the number of shares that could be issued upon a complete distribution of all outstanding stock options and stock appreciation rights (1,084,567) and restrictedstock units and deferred stock units (230,554).
(2) Column (b) includes the weighted-average exercise price for outstanding stock options and stock appreciation rights.
10
Table of Contents
SHARE REPURCHASES – On October 31, 2016, the Board of Directors authorized the repurchase of an additional 1,000,000 shares of our common stock. This is inaddition to the 392,892 shares remaining under our prior repurchase program. Share repurchases are made from time to time in the open market or through privately negotiatedtransactions, primarily to offset the dilutive effect of shares issued through our share-based compensation programs. As of December 31, 2018, our 2017 Credit Agreementrestricts the payment of dividends or repurchasing of stock if, after giving effect to such payments and assuming no default exists or would result from such payment, ourleverage ratio is greater than 2.50 to 1, in such case limiting such payments to an amount ranging from $50.0 million to $75.0 million during any fiscal year based on ourleverage ratio after giving effect to such payment. Our Senior Notes due 2025 also contain certain restrictions, which are generally less restrictive than those contained in the2017 Credit Agreement.
For the Quarter EndedDecember 31, 2018
Total Number of SharesPurchased (1) Average Price Paid Per Share
Total Number of SharesPurchased as Part of Publicly
Announced Plans or Programs
Maximum Number of Sharesthat May Yet Be Purchased
Under the Plans or Programs
October 1–31, 2018 86 $75.95 — 1,392,892
November 1–30, 2018 267 63.89 — 1,392,892
December 1–31, 2018 407 78.09 — 1,392,892
Total 760 $72.86 — 1,392,892
(1) Includes 760 shares delivered or attested to in satisfaction of the exercise price and/or tax withholding obligations by employees who exercised stock options orrestricted stock under employee share-based compensation plans.
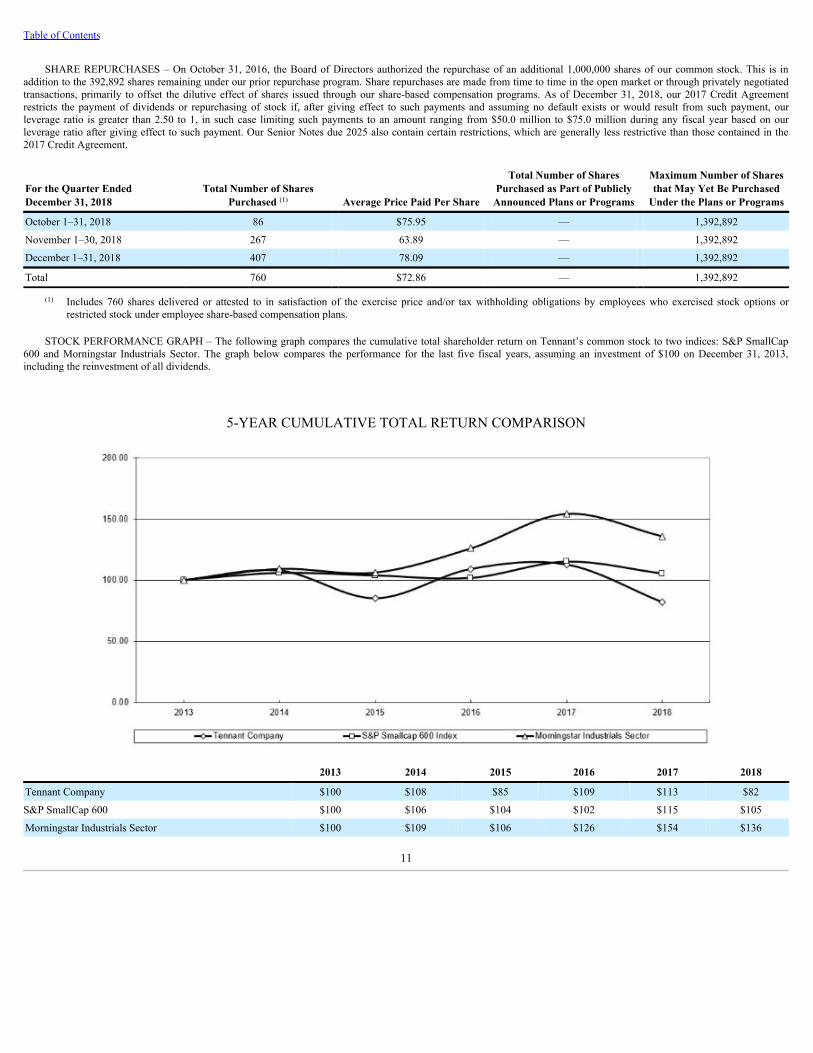
STOCK PERFORMANCE GRAPH – The following graph compares the cumulative total shareholder return on Tennant’s common stock to two indices: S&P SmallCap600 and Morningstar Industrials Sector. The graph below compares the performance for the last five fiscal years, assuming an investment of $100 on December 31, 2013,including the reinvestment of all dividends.
Years Ended December 31 2018 2017 2016 2015 2014 Financial Results:
Net Sales $ 1,123,511 $ 1,003,066 $ 808,572 $ 811,799 $ 821,983 Cost of Sales 678,478 603,253 (2), (5) 456,977 462,739 469,556 Gross Margin - % 39.6 39.9 43.5 43.0 42.9 Research and Development Expense 30,739 32,013 34,738 32,415 29,432
% of Net Sales 2.7 3.2 4.3 4.0 3.6 Selling and Administrative Expense 356,316 (1), (4) 334,782 (2), (4), (5) 248,592 (4) 251,670 (3), (4) 250,695 (4)
% of Net Sales 31.7 33.4 30.7 31.0 30.5 Profit from Operations 57,978 (1), (4) 33,018 (2), (4), (5) 68,265 (4) 52,576 (3), (4) 71,894 (4)
% of Net Sales 5.2 3.3 8.4 6.6 8.8 Income Tax Expense 2,304 (1) 4,913 (2) 19,877 18,336 (3) 18,887
Effective Tax Rate - % 6.4 (380.2) 29.9 36.4 27.2 Net Earnings (Loss) Attributable toTennant Company 33,412
(1)
(6,195)(2)
46,614 32,088 50,651 % of Net Sales 3.0 (0.6) 5.8 4.0 6.2
Per Share Data: Basic Net Earnings (Loss)Attributable to Tennant Company $ 1.86 (1) $ (0.35) (2) $ 2.66 $ 1.78 (3) $ 2.78 Diluted Net Earnings (Loss)Attributable to Tennant Company $ 1.82 (1) $ (0.35) (2) $ 2.59 $ 1.74 (3) $ 2.70 Diluted Weighted Average Shares 18,338,569 17,695,390 17,976,183 18,493,447 18,740,858 Cash Dividends $ 0.85 $ 0.84 $ 0.81 $ 0.80 $ 0.78 Financial Position:
Total Assets $ 992,544 $ 993,977 $ 470,037 $ 432,295 $ 486,932 Total Debt 355,065 376,839 36,194 24,653 28,137 Total Tennant CompanyShareholders’ Equity 314,422 296,503 278,543 252,207 280,651 Current Ratio 1.9 1.8 2.2 2.2 2.4 Debt-to-Capital Ratio 53.0% 56.0% 11.5% 8.9% 9.1% Cash Flows:
Net Cash Provided by Operations $ 79,970 $ 54,174 $ 57,878 $ 45,232 $ 59,362 Capital Expenditures, Net ofDisposals (18,668) (17,926) (25,911) (24,444) (19,292) Free Cash Flow 61,302 36,248 31,967 20,788 40,070 Other Data:
Depreciation and Amortization $ 54,420 $ 43,253 $ 18,300 $ 18,031 $ 20,063 Number of employees at year-end 4,341 4,297 3,236 3,164 3,164
The results of operations from our 2017 acquisition of the IPC Group have been included in the Selected Financial Data presented above since its acquisition date on April6, 2017.
(1) 2018 includes pre-tax acquisition and integration costs, restructuring charges, professional services, building design costs, and a gain on a sale of business in sellingand administrative expense of $6,869, $1,032, $1,914, $1,556, and $(955), respectively ($ 5,363, $874 , $1,445, $1,175, and $(721) after-tax, respectively, or $0.29,$0.05, $0.08, $0.06, $(0.04) per diluted share, respectively). Additionally, 2018 included a pre-tax pension curtailment gain in other expense of $(165) ($(134) after-taxor $(0.01) per diluted share). In addition, 2018 net earnings attributable to Tennant Company includes an acquisition-related tax adjustment of $883 and a mandatoryrepatriation tax expense of $362 ($0.05 and $0.02 per diluted share, respectively).
(2) 2017 includes a fair value step-up adjustment to acquired inventory in cost of sales of $7,245 pre-tax ($5,237 after-tax, or $0.30 per diluted share), pre-tax acquisitioncosts, restructuring charges and a pension settlement charge in selling and administrative expense of $10,560, $10,519 and $6,373, respectively ($9,748, $7,559 and$4,020 after-tax, or $0.55, $0.43 and $0.23 per diluted share, respectively). 2017 also includes pre-tax acquisition-related financing costs and acquisition costs in totalother expense, net of $7,378 and $814, respectively ($4,619 and $660 after-tax, or
12
Table of Contents
$0.26 and $0.04 per diluted share, respectively). In addition, 2017 net loss attributable to Tennant Company includes a $2,388 net income tax expense ($0.14 perdiluted share) as a result of the impacts of the 2017 tax reform legislation.
(3) 2015 includes restructuring charges of $3,744 pre-tax ($3,095 after-tax or $0.17 per diluted share) and a non-cash impairment of long-lived assets of $11,199 pre-tax($10,822 after-tax or $0.58 per diluted share).
(4) On January 1, 2018, we adopted ASU No. 2017-07, Compensation—RetirementBenefits(Topic715):ImprovingthePresentationofNetPeriodicPensionCostandNetPeriodicPostretirementBenefitCost.The components of net pension and postretirement benefit costs, except for service costs, are required to be presented in theCondensed Consolidated Statements of Operations separately from the service cost component in nonoperating expenses. See Note 2.
(5) 2017 was revised for misclassifications as discussed in Note 3.
13
Table of Contents
ITEM 7 – Management’s Discussion and Analysis of FinancialCondition and Results of Operations
OverviewTennant Company is a world leader in designing, manufacturing and marketingsolutions that empower customers to achieve quality cleaning performance, reduceenvironmental impact and help create a cleaner, safer, healthier world. Tennant iscommitted to creating and commercializing breakthrough, sustainable cleaninginnovations to enhance its broad suite of products, including floor maintenance andoutdoor cleaning equipment, detergent-free and other sustainable cleaningtechnologies, aftermarket parts and consumables, equipment maintenance and repairservice, specialty surface coatings and asset management solutions. Tennant productsare used in many types of environments, including retail establishments, distributioncenters, factories and warehouses, public venues such as arenas and stadiums, officebuildings, schools and universities, hospitals and clinics, parking lots and streets, andmore. Customers include contract cleaners to whom organizations outsource facilitiesmaintenance, as well as businesses that perform facilities maintenance themselves.The company reaches these customers through the industry's largest direct sales andservice organization and through a strong and well-supported network of authorizeddistributors worldwide.
Historical Results
The following table compares the historical results of operations for the yearsended December 31, 2018 , 2017 and 2016 in dollars and as a percentage of Net Sales(in thousands, except per share amounts and percentages):
Net Earnings (Loss)Attributable toTennant Company $ 33,412 3.0 $ (6,195) (0.6) $ 46,614 5.8
Net Earnings (Loss)Attributable toTennant Company perShare - Diluted $ 1.82 $ (0.35) $ 2.59
14
Table of Contents
Net Sales
Net Sales in 2018 totaled $1,123.5 million , a 12.0% increase as compared to NetSales of $1,003.1 million in 2017 .
The components of the consolidated Net Sales change for 2018 as compared to2017 , and 2017 as compared to 2016 , were as follows:
Growth Elements 2018 v. 2017 2017 v. 2016
Organic Growth: Volume 3.9% (0.1%)
Price 1.6% 1.5%
Organic Growth 5.5% 1.4%
Foreign Currency 0.3% 0.5%
Acquisitions 6.2% 22.2%
Total 12.0% 24.1%
The 12.0% increase in consolidated Net Sales for 2018 as compared to 2017 wasdriven by:
• Organic sales increased approximately 5.5% which excludes the effects offoreign currency translation exchange and acquisitions, due to an approximate3.9% volume increase and a 1.6% price increase . T he volume increase wasdriven by growth in all geographic regions, with particular strength in theAmericas from higher sales of commercial equipment in the strategic accountchannel. Strong organic sales in Germany and France and strength in Chinaand Australia also contributed to the strong organic sales growth. The priceincrease was the result of selling price increases in most geographies, with aneffective date of February 1, 2018. The impact to gross margin is estimated tobe minimal as these selling price increases were taken to offset inflation.
• 6.2% from the full year impact of the April 2017 acquisition of the IPC Group.
• A favorable impact from foreign currency exchange of approximately 0.3% .
The 24.1% increase in consolidated Net Sales for 2017 as compared to 2016 wasprimarily due to the following:
• 22.2% from the April 2017 acquisition of the IPC Group and the expansion ofour commercial floor coatings business through the August 2016 acquisition ofthe Florock ® brand.
• An organic sales increase of approximately 1.4% which excludes the effects offoreign currency exchange and acquisitions, due to an approximate 1.5% priceincrease, partially offset by a volume decrease of 0.1% . The price increasewas the result of selling price increases, typically in the range of 2% to 4% inmost geographies, with an effective date of February 1, 2017. The impact togross margin was minimal as these selling price increases were taken to offsetinflation. The slight volume decrease was primarily due to increased sales inLatin America and EMEA being more than offset by volume decreases inNorth America. Sales of new products introduced from 2015 to 2017 totaled48% of equipment revenue in 2017. This compares to 37% of equipmentrevenue in 2016 from sales of new products introduced from 2014 to 2016.
• A favorable impact from foreign currency exchange of approximately 0.5%.
The following table sets forth annual Net Sales by geographic area and therelated percentage change from the prior year (in thousands, except percentages):
Americas – In 2018 , Americas Net Sales increased 7.9% to $691.0 million ascompared with $640.3 million in 2017 . The direct impact of the second quarter 2017acquisition of the IPC Group favorably impacted Net Sales by approximately 1.1%. Inaddition, an unfavorable impact of foreign currency translation exchange effectswithin the Americas impacted Net Sales by approximately 0.7% in 2018. As a result,organic sales growth in the Americas favorably impacted Net Sales by approximately7.5% due to strong equipment sales in North America resulting from increases in allchannels, particularly strategic accounts and the distribution channel. The Americasalso experienced increased parts and service sales in 2018 as well as strong sales inLatin America, particularly Brazil.
In 2017 , Americas Net Sales increased 5.5% to $640.3 million as compared with$607.0 million in 2016 . The direct impact of the IPC Group and Florock acquisitionsfavorably impacted Net Sales by approximately 4.4%. In addition, a favorable directimpact of foreign currency translation exchange effects within the Americas impactedNet Sales by approximately 0.4% in 2017. As a result, organic sales growth in theAmericas favorably impacted Net Sales by approximately 0.7% due to strong salesperformance in Latin America, particularly Brazil and Mexico, from focused go-to-market strategies in our direct channel. This was partially offset by lower sales inNorth America, where sales growth through the distribution channel were more thanoffset by service sales.
Europe, Middle East and Africa – EMEA Net Sales in 2018 increased 22.6% to$335.6 million as compared to 2017 Net Sales of $273.7 million . In 2018 , the directimpact of the second quarter 2017 acquisition of the IPC Group favorably impactedNet Sales by approximately 18.2%. In addition, a favorable impact of foreign currencytranslation exchange effects within EMEA impacted Net Sales by approximately 3.0%in 2018. As a result, organic sales growth in EMEA favorably impacted Net Sales byapproximately 1.3% due to strong growth in Germany and France, partially offset bychallenging comparable sales performance in Italy.
EMEA Net Sales in 2017 increased 112.1% to $273.7 million as compared to2016 Net Sales of $129.0 million . In 2017, the direct impact of the IPC Groupacquisition favorably impacted Net Sales by approximately 105.3%. In addition, afavorable direct impact of foreign currency translation exchange effects within EMEAimpacted Net Sales by approximately 1.3% in 2017. As a result, organic sales growthin EMEA favorably impacted Net Sales in 2017 by approximately 5.5% due to s trongsales growth in most European countries from strong demand in both the direct anddistributor channels being partially offset by lower sales in the UK.
Asia Pacific – APAC Net Sales in 2018 increased 8.8% to $96.9 million ascompared to 2017 Net Sales of $89.1 million . In 2018 , t he direct impact of thesecond quarter 2017 acquisition of the IPC Group favorably impacted Net Sales byapproximately 6.3%. In addition, an unfavorable direct impact of foreign currencytranslation exchange effects within APAC impacted Net Sales by approximately 0.6%in 2018. As a result, organic sales growth in APAC favorably impacted Net Sales byapproximately 3.2% primarily due to sales growth in China, India and Australia fromstrong commercial and industrial product sales through the direct and strategic accountchannels slightly offset by sales declines in Japan and Korea.
15
Table of Contents
APAC Net Sales in 2017 increased 22.8% to $89.1 million as compared to 2016Net Sales of $72.5 million . In 2017, the direct impact of the IPC Group acquisitionfavorably impacted Net Sales by approximately 22.7%. In addition, a favorable directimpact of foreign currency translation exchange effects within APAC impacted NetSales by approximately 0.1% in 2017. As a result, organic sales growth in APAC wasessentially flat due to sales growth in China from strong sales through the direct anddistributor channels being offset by sales declines primarily in Korea and Singaporeresulting from a challenging economic environment.
Gross Profit
Gross Profit margin was 39.6% , or 25 basis points lower in 2018 compared to2017 . Gross Profit margin was unfavorably impacted by manufacturing productivityissues associated with raw material and labor shortages, robust strategic account saleswhich negatively impacted our mix, higher freight costs and negative impacts fromtariffs. The unfavorable Gross Profit margin impacts were partially offset by improvedoperational performance in both manufacturing and service as well as favorablepricing in North America and EMEA. In addition, Gross Profit margin was favorablyimpacted by a $7.2 million, or approximately 70 basis points, fair value inventorystep-up flow through related to our acquisition of the IPC Group in 2017 that did notrepeat in 2018.
Gross Profit margin was 390 basis points lower in 2017 compared to 2016 dueprimarily to the $7.2 million, or approximately 70 basis points, fair value inventorystep-up flow through related to our acquisition of the IPC Group and field serviceproductivity challenges related to a high number of open service trucks of $5.1million, or approximately 50 basis points. In addition, Gross Profit margin wasunfavorably impacted by mix of sales by channel and region, primarily resulting fromhigher sales through the distribution in North America and lower gross margins fromthe IPC Group. The near-term unfavorable impacts from investments in manufacturingautomation initiatives and high levels of raw material cost inflation also contributed tolower Gross Profit margin in 2017.
Operating Expenses
Research and Development Expense – Tennant continues to invest ininnovative product development with 2.7% of 2018 Net Sales spent on Research andDevelopment ("R&D"). We continue to invest in developing innovative new productsand technologies and the advancement of detergent-free products, fleet managementand other sustainable technologies. New products and product variants launched in2018 included the T600 series of scrubbers and our first autonomous floor caremachine.
R&D Expense decreased $1.3 million , or 4.0% , in 2018 as compared to 2017 .As a percentage of Net Sales, 2018 R&D Expense decreased 46 basis points comparedto the prior year. The decrease in R&D as a percentage of sales reflects the impact ofhigher revenue in 2018 and the timing of anticipated project spend in 2018, includinginvestment in our strategic relationship with Brain Corp., to accelerate development ofour autonomous floor cleaning technology. We continue to invest in R&D at levelsnecessary to propel our clear technology leadership position.
R&D Expense decreased $2.7 million, or 7.8%, in 2017 as compared to 2016. Asa percentage of Net Sales, 2017 R&D Expense decreased 110 basis points comparedto the prior year. The decrease in R&D spending was primarily due to headcountreduction related to the first quarter 2017 restructuring action.
Selling and Administrative Expense – Selling and Administrative Expense("S&A Expense") increased by $21.5 million , or 6.4% , in 2018 compared to 2017 .As a percentage of Net Sales, 2018 S&A Expense decreased 170 basis points to 31.7%from 33.4% in 2017 . The primary drivers of the increase were approximately $18.3million of IPC-related S&A expense due to an additional quarter in 2018 and $12.6million in compensation-related expenses. These increases were offset by a decreaseof $9.5 million in restructuring costs from 2017 to 2018.
Selling and Administrative Expense ("S&A Expense") increased by $86.2million, or 34.7%, in 2017 compared to 2016 . As a percentage of Net Sales, 2017S&A Expense increased 270 basis points to 33.4% from 30.7% in 2016 . S&AExpense was unfavorably impacted by $15.7 million and $10.6 million ofamortization expense and acquisition costs, respectively, related to our acquisition ofthe IPC Group. In addition, S&A Expense was unfavorably impacted by $10.5 millionof restructuring charges taken in the 2017 first and fourth quarters.
Total Other Expense, Net
Interest Income – Interest Income was $3.0 million in 2018 , an increase of $0.6million from 2017 . The increase between 2018 and 2017 was primarily due to anextra quarter of interest income related to foreign currency swap activities.
Interest Income was $2.4 million in 2017 , an increase of $2.1 million from 2016.The increase between 2017 and 2016 was primarily due to interest income related toforeign currency swap activities.
Interest Expense – Interest Expense was $23.3 million in 2018 , as compared to$25.4 million in 2017 . The lower Interest Expense in 2018 was primarily due tocarrying a lower level of debt on our Consolidated Balance Sheets due to debtpaydowns, as further described in the Liquidity and Capital Resources section thatfollows.
Interest Expense was $25.4 million in 2017 , as compared to $1.3 million in 2016. The higher Interest Expense in 2017 was primarily due to carrying a higher level ofdebt on our Consolidated Balance Sheets related to our acquisition activities, as wellas a $6.2 million charge to expense the debt issuance costs for loans which wererefinanced or repaid, as further described in the Liquidity and Capital Resourcessection that follows.
Net Foreign Currency Transaction Losses – Net Foreign Currency TransactionLosses were $1.1 million in 2018 as compared to $3.4 million in 2017 . The favorablechange in the impact from foreign currency transactions in 2018 was primarily due tofluctuations in foreign currency rates, specifically between the Euro, Brazilian real andthe U.S. dollar, and settlements of transactional hedging activity in the normal courseof business. Additionally an unfavorable $1.1 million mark-to-market adjustment of aforeign exchange call option was recorded in 2017 that did not recur in 2018. Thisinstrument was held in connection with our acquisition of the IPC Group in April2017.
Net Foreign Currency Transaction Losses were $3.4 million in 2017 as comparedto $0.4 million in 2016 . The unfavorable change in the impact from foreign currencytransactions in 2017 was primarily due to fluctuations in foreign currency rates,specifically between the Euro and U.S. dollar, settlements of transactional hedgingactivity in the normal course of business and a $1.1 million mark-to-marketadjustment of a foreign exchange call option, an instrument held in connection withour acquisition of the IPC Group in April 2017.
Other Expense, Net – Other Expense, Net was $0.7 million in 2018 as comparedto $7.9 million in 2017 . The favorable change in Other Expense, Net was dueprimarily to a pension settlement loss of $6.4 million in 2017 that did not recur in2018.
16
Table of Contents
Other Expense, Net was $7.9 million in 2017 as compared to $0.4 million in2016 . The unfavorable change in Other Expense, Net was due primarily to a pensionsettlement loss of $6.4 million and additional expense recorded as a result of theacquisition of the IPC Group.
Income Taxes
The overall effective income tax rate was 6.4% , (380.2)% and 29.9% in 2018 ,2017 and 2016 , respectively.
The expense for 2018 included a $1.5 million tax benefit associated with $6.9million of acquisition and integration-related costs associated with our integration ofthe IPC Group and pending acquisition of Gaomei Cleaning Equipment Company, a$0.2 million tax benefit associated with $1.0 million of restructuring charge, a $0.4million tax benefit associated with $1.6 million of building design costs, a $0.5million tax benefit associated with $1.9 million of costs related to non-operationalprofessional service fees, a $0.2 million tax expense associated with a $1.0 milliongain on the sale of assets of our Waterstar business, a $0.9 million benefit associatedwith an acquisition tax adjustment, and a $0.4 million benefit related to finalizing theincome tax effect of the one-time transition tax on certain unrepatriated earnings.These special items impacted the 2018 effective tax rate by (6.2%).
Our effective tax rate fluctuates from year to year due to the global nature of ouroperations. The effective tax rate change from 2017 was primarily due to the lowercorporate tax rate provided by the Tax Act beginning in the first quarter of 2018, themix in full year taxable earnings by country, the tax expense benefit related to theexercise of soon-to-expire stock options and a favorable tax ruling from the Italian taxauthorities related to the deductibility of interest expense in Italy.
On December 22, 2017, legislation popularly referred to as the Tax Act wasenacted, resulting in significant changes from previous tax law, including, but notlimited to, requiring a one-time transition tax on certain unrepatriated earnings offoreign subsidiaries and a reduction in the U.S. federal corporate income tax rate from35% to 21% and established new laws that impacted 2018.
ASC 740 requires a company to record the effects of a tax law change in theperiod of enactment. ASU 2018-05 allowed a company to record a provisional amountwhen it did not have the necessary information available, prepared or analyzed inreasonable detail to complete its accounting for the change in the law. Themeasurement period ends when the company has obtained, prepared and analyzed theinformation necessary to finalize its accounting, but cannot extend beyond one year.
During the third quarter of 2018, the accounting for the remeasurement of thedeferred taxes and transition tax was finalized. Adjustments to the provisionalamounts were not material to the consolidated financial statements. The accountingfor the income tax effects of the Tax Act is complete as of December 31, 2018.
The tax expense for 2017 included a $3.7 million tax benefit associated with$18.8 million of acquisition and financing costs related to the IPC Group acquisition, a$3.0 million tax benefit associated with a $10.5 million restructuring charge, a $2.4million tax benefit associated with a $6.2 million pension settlement, a $2.0 milliontax benefit associated with $7.2 million of expense related to inventory step-upamortization, a $2.0 million tax expense related to the write-down of net U.S. deferredtax assets at the lower enacted tax rates and $0.4 million tax expense related to thetransition tax on cash and cash equivalent balances related to accumulated earningsassociated with our international operations as a result of Tax Legislation. Thesespecial items impacted the 2017 year-to-date overall effective tax rate by 412.9%.
Excluding the 2017 special items and the effect of the Tax Act, the tax rateincreased from 29.9% in 2016 due primarily to the mix in full year taxable earnings bycountry.
There were no special items that affected the tax rate in 2016.
Other Comprehensive Income (Loss)
Foreign Currency Translation Adjustments – For the years endedDecember 31, 2018 and 2017 , we recorded a pre-tax foreign currency translation lossof $16.2 million and a gain of $28.4 million , respectively. For the year endedDecember 31, 2016 , we recorded pre-tax foreign currency translation gains of $0.1million in Other Comprehensive Income (Loss). These adjustments resulted fromtranslating the financial statements of our non-U.S. dollar functional currencysubsidiaries into our reporting currency, which is the U.S. dollar, as well as otheradjustments permitted by ASC 830 – ForeignCurrencyMatters.
Durin g 2018 , we recorded a pre-tax currency translation loss of $16.2 million .These adjustments were caused primarily by the strengthening of the U.S. dollar tomost currencies. In 2018, the U.S. dollar strengthened by approximately 5% to theEuro and approximately 15% to the Brazilian Real.
During 2017 , we recorded pre-tax currency translation gains of $28.4 million.These adjustments were caused primarily by the appreciation of the Euro against theU.S. dollar. In 2017, the Euro appreciated against the U.S. dollar by approximately14%.
During 2016 , we recorded translation gains of $3.4 million relating to theBrazilian real, and translation losses of $1.3 million for the Euro, $1.0 million for theChinese renminbi, $0.9 million for the British pound and $0.1 million for variousother currencies. These adjustments were caused by the appreciation of the U.S. dollaragainst these currencies of between 3% and 17%, and the strengthening of theBrazilian real of 22% in 2016.
Pension and Retiree Medical Benefits – The summarized changes inAccumulated Other Comprehensive Loss for the three years ended December 31 wereas follows:
Pension and Postretirement Medical
Benefits
2018 2017 2016
Prior Service Costs $ 109 $ — $ —Net actuarial (gain) loss (1,699) 622 2,357Amortization of prior service cost (19) — (41)Amortization of net actuarial loss (87) (117) (68)Settlement Charge (49) (6,373) —
Total recognized in othercomprehensive (income) loss $ (1,745) $ (5,868) $ 2,248
The $1.7 million gain in 2018 was primarily due to a $1.7 million actuarial gainrelating to an annual actuarial analysis resulting from a 67 basis point increase in theU.S. pension discount rate, a 27 basis point increase in the non-U.S. discount rate anda 69 basis point increase in the postretirement discount rate.
The $5.9 million gain in 2017 was primarily due to a $6.4 million settlementcharge related to the termination of the U.S. Pension Plan and a $0.1 million creditrelated to amortization of accumulated actuarial losses. These gains were partiallyoffset by $0.6 million of net actuarial losses relating to an increase of $1.2 million inthe pension benefit obligation in 2017 due to changes in demographic experience andother changes, a $0.6 million increase in the pension benefit obligation resulting froma 64 basis point decrease in the U.S. pension discount rate, a 19 basis point decrease inthe non-U.S. discount rate and a 32 basis point decrease in the postretirement discountrates and a $1.0 million decrease in the pension benefit obligation due to a higher thanexpected actual return on assets.
The $2.2 million loss i n 2016 was primarily due to a $2.4 net actuarial lossrelating to an increase of $3.2 million in the projected benefit obligation resultingfrom a 16 basis point decrease in the U.S. pension discount rate, a 95 basis pointdecrease in the non-U.S. discount rate and a 12 basis point
17
Table of Contents
decrease in the postretirement discount rate. There was an approximate $0.6 milliondecrease in the pension benefit obligation in 2016 relating to demographic experienceand other changes, as well as a $0.2 million decrease due to a higher than expectedactual return on assets. The net actuarial loss was partially offset by a $0.1 millioncredit relating to amortization of accumulated actuarial losses and prior service costs.
Cash Flow Hedging – For the years ended December 31, 2018 and 2017 , werecorded pre-tax adjustments on cash flow hedge financial instruments of a gain of$1.3 million and a loss of $7.7 million , respectively, in Other Comprehensive Income(Loss) as further disclosed i n Note 13 to the Company's Consolidated FinancialStatements. For the year ended December 31, 2016 , we recorded a pre-tax loss of$0.3 million in Other Comprehensive Income (Loss) for these items.
The $1.3 million gain in 2018 was primarily due to the strengthening of the U.S.dollar relative to the Canadian dollar and Euro. During 2018, the U.S. dollarstrengthened approximately 8% to the Canadian dollar and approximately 5% to theEuro.
The $7.7 million loss in 2017 was primarily due to $26.2 million of lossesrecognized primarily as a result of our Euro to U.S. dollar foreign exchange crosscurrency swaps to mitigate our Euro exposure on our cash flows associated with anintercompany loan from a wholly-owned European subsidiary. The loss was partiallyoffset by $18.5 of losses reclassified from Accumulated Other Comprehensive Loss tothe Consolidated Statements of Earnings.
The $0.3 million pre-tax loss in 2016 was driven by our cash flow exposure to theCanadian dollar resulting from changes in this currency relative to the U.S. dollar.
Liquidity and Capital Resources
Liquidity – Cash and Cash Equivalents totaled $85.6 million at December 31,2018 , as compared to $58.4 million as of December 31, 2017 . Cash and CashEquivalents held by our foreign subsidiaries totaled $59.2 million as of December 31,2018 , as compared to $39.1 million as of December 31, 2017 . Wherever possible,cash management is centralized and intercompany financing is used to provideworking capital to subsidiaries as needed. Our current ratio was 1.9 as ofDecember 31, 2018 , and 1.8 as of December 31, 2017 , and our working capital was$219.8 million and $186.6 million , respectively.
Our Debt-to-Capital ratio was 53.0% as of December 31, 2018 , compared with56.0% as of December 31, 2017 . Our capital structure was comprised of $355.1million of Debt and $314.4 million of Tennant Company Shareholders’ Equity as ofDecember 31, 2018 .
Operating Activities – Cash provided by operating activities was $80.0 millionin 2018 , $54.2 million in 2017 and $57.9 million in 2016 . In 2018 , cash provided byoperating activities was driven primarily by net earnings, after adding back non-cashitems, a $12.6 million increase in Employee Compensation and Benefits liabilities andan increase in Accounts Payable of $4.6 million due to timing of payments. Thesecash inflows were partially offset by cash outflows resulting from an increase inAccounts Receivable of $7.6 million resulting from higher sales levels, the variety ofpayment terms offered and mix of business as well as a $16.6 million increase inInventories to support future sales growth.
In 2017, cash provided by operating activities was driven primarily by netearnings, after adding back non-cash items, an increase in Other Current Liabilities of$14.6 million due to additional accruals recorded as a result of the IPC Groupconsolidation and the fourth quarter 2017 restructuring action and an increase inAccounts Payable of $10.8 million due to timing of payments. These cash inflowswere partially offset by cash outflows resulting from an increase in AccountsReceivable of $14.4 million resulting from higher sales levels, the variety of paymentterms offered and mix of business.
In 2016, cash provided by operating activities was driven primarily by netearnings, after adding back non-cash items, partially offset by an increase in AccountsReceivable of $9.3 million resulting from higher sales levels, particularly in December2016, the variety of payment terms offered and mix of business.
Investing Activities – Net cash used in investing activities was $16.0 million in2018 , $375.3 million in 2017 and $40.6 million in 2016 . In 2018 , we used $18.7million for net capital expenditures. Net capital expenditures included investments ininformation technology process improvement projects, tooling related to new productdevelopment and manufacturing equipment. We also used $2.8 million for thepurchase of a technology license and other intangibles. In addition, we received $4.0million in proceeds from the sale of assets of our Waterstar business.
In 2017 , we used $354.1 million, net of cash acquired, in relation to ouracquisition of the IPC Group and the final installment payment for the acquisition ofthe Florock brand and $17.9 million for net capital expenditures. Net capitalexpenditures included investments in information technology process improvementprojects, tooling related to new product development and manufacturing equipment.We also used $2.5 million for the purchase of the distribution rights to sell the i-mopand $1.5 million as a result of a loan to i-team North America B.V., a joint venturethat operates as a distributor of the i-mop in North America. The details regarding thejoint venture and our distribution of the i-mop are described further in Note 5 to theConsolidated Financial Statements.
In 2016 , we used $25.9 million for net capital expenditures. Net capitalexpenditures included investments in information technology process improvementprojects, tooling related to new product development and manufacturing equipment. Inaddition, our acquisition of the Florock brand and the assets of Dofesa BarrdioMecanizado, a long-time distributor based in Central Mexico, used $12.9 million, netof cash acquired. We also used $2.0 million as a result of a non-interest bearing cashadvance to TCS EMEA GmbH, the master distributor of our products in CentralEastern Europe, Middle East and Africa.
Financing Activities – Net cash used in financing activities was $32.8 million in2018 . Net cash provided by financing activities was $319.5 million in 2017 . Net cashused in financing activities was $9.6 million in 2016 . In 2018 , proceeds from theincurrence of Long-Term Debt associated with the pending Gaomei acquisition andthe issuance of Common Stock provided $11.0 million and $5.9 million , respectively.These cash inflows were partially offset by cash outflows resulting from $38.3 millionof Long-Term Debt payments and dividend payments of $15.3 million . Our annualcash dividend payout increased for the 47 th consecutive year to $0.85 per share in2018 , an increase of $0.01 per share over 2017 .
In 2017 , proceeds from the incurrence of Long-Term Debt associated with theIPC acquisition and the issuance of Common Stock provided $440.0 million and $6.9million, respectively. These cash inflows were partially offset by cash outflowsresulting from $96.2 million of Long-Term Debt payments, $16.5 million related topayments of debt issuance costs and dividend payments of $15.0 million.
In 2016 , dividend payments used $14.3 million, the purchases of our commonstock per our authorized repurchase program used $12.8 million and the payment ofLong-Term Debt used $3.5 million. These cash ouflows were partially offset byproceeds resulting from the incurrence of Long-Term Debt of $15.0 million, theissuance of Common Stock of $5.3 million and the excess tax benefit on stock plansof $0.7 million.
On October 31, 2016, the Board of Directors authorized the repurchase of anadditional 1,000,000 shares of our common stock. At December 31, 2018 , there were1,392,892 remaining shares authorized for repurchase.
There were no shares repurchased in 2018 in the open market, no sharesrepurchased in 2017 and 246,474 shares repurchased during 2016 , at averagerepurchase prices of $51.78 during 2016 . Our 2017 Credit Agreement restricts
18
Table of Contents
the payment of dividends or repurchasing of stock if, after giving effect to suchpayments and assuming no default exists or would result from such payment, ourleverage ratio is greater than 2.50 to 1, in such case limiting such payments to anamount ranging from $50.0 million to $75.0 million during any fiscal year based onour leverage ratio after giving effect to such payment. Our Senior Notes due 2025 alsocontain certain restrictions, which are generally less restrictive than those contained inthe 2017 Credit Agreement.
Indebtedness – In order to finance the acquisition of the IPC Group, on April 4,2017, the Company and certain of our foreign subsidiaries entered into a CreditAgreement (the “2017 Credit Agreement”) with JPMorgan, as administrative agent,Goldman Sachs Bank USA, as syndication agent, Wells Fargo, National Association,U.S. Bank National Association, and HSBC Bank USA, National Association, as co-documentation agents, and the lenders (including JPMorgan) from time to time partythereto.
On April 18, 2017, we issued and sold $300,000,000 in aggregate principalamount of our 5.625% Senior Notes due 2025 (the “Notes”), pursuant to an Indenture,dated as of April 18, 2017, among the company, the Guarantors (as defined therein),and Wells Fargo Bank, National Association, a national banking association, astrustee. The Notes are guaranteed by Tennant Coatings, Inc., and Tennant Sales andService Company (collectively, the “Guarantors”), which are wholly-ownedsubsidiaries of the company.
For further details regarding our indebtedness, see Note 11 to the ConsolidatedFinancial Statements.
Contractual Obligations – Our contractual obligations as of December 31, 2018, are summarized by period due in the following table (in thousands):
(1) Long-term debt represents borrowings through our Notes and the 2017Credit Agreement with JPMorgan. Interest on the Notes accrues at the rate of 5.625%per annum and is payable semiannually in cash on each May 1 and November 1,commencing on November 1, 2017. Repayment of the principal amount of the SeniorNotes is due upon expiration of the agreement in 2025. Interest payments on our 2017Credit Agreement with JPMorgan were calculated using the December 31, 2017 30-day LIBOR rate plus a spread.
(2) Our retirement benefit plans, as described in Note 15 to the ConsolidatedFinancial Statements, require us to make contributions to the plans from time to time.Contributions to the various plans are dependent upon a number of factors includingthe market performance of plan assets, if any, and future changes in interest rates,which impact the actuarial measurement of plan obligations. As a result, we have onlyincluded our 2019 expected contribution in the contractual obligations table.
(3) The unfunded deferred compensation arrangements covering certaincurrent and retired management employees totaled $ 5.1 million as of December 31,2018 . Our estimated distributions in the contractual obligations table are based upon anumber of assumptions including termination dates and participant distributionelections.
(4) Operating lease commitments consist primarily of office and warehousefacilities, vehicles and office equipment as discussed in Note 17 to the ConsolidatedFinancial Statements.
(5) Purchase obligations include all known open purchase orders,contractual purchase commitments and contractual obligations as of December 31,2018 .
(6) Other obligations include residual value guarantees as discussed in Note17 to the Consolidated Financial Statements.
Total contractual obligations exclude our gross unrecognized tax benefits of $5.7million and accrued interest and penalties of $0.4 million as of December 31, 2018 .We expect to make cash outlays in the future related to uncertain tax positions.However, due to the uncertainty of the timing of future cash flows, we are unable tomake reasonably reliable estimates of the period of cash settlement, if any, with therespective taxing authorities. For further information related to unrecognized taxbenefits, see Note 18 to the Consolidated Financial Statements.
Newly Issued Accounting Guidance
Leases
In February 2016, the Financial Accounting Standards Board ("FASB") issuedAccounting Standards Update ("ASU") No. 2016-02, Leases(Topic842). This ASUchanges current U.S. GAAP for lessees to recognize lease assets and lease liabilitieson the balance sheet for those leases classified as operating leases under previous U.S.GAAP. Under the new guidance, lessor accounting is largely unchanged. Theamendments in this ASU are effective for annual periods beginning after December15, 2018, including interim periods within that reporting period, which is our fiscal2019. We expect the adoption of this standard will have a material impact on theconsolidated balance sheets for recognition of operating lease related assets andliabilities. We do not expect a material impact to the consolidated statements ofoperations. See FN 1 for further discussion.
DerivativesandHedging
In August 2017, the FASB issued ASU No. 2017-12, DerivativesandHedging(Topic 815): Targeted Improvements to Accounting for Hedging Activities , whichbetter aligns accounting rules with a company's risk management activities, betterreflects the economic results of hedging in financial statements and simplifies hedgeaccounting treatment. This ASU is effective for fiscal years beginning after December15, 2018, including interim periods within those fiscal years, which is our fiscal 2019.We have determined that the adoption of this standard will not have a material impacton our consolidated financial statements and related disclosures.
No other new accounting pronouncements issued but not yet effective have had,or are expected to have, a material impact on our results of operations or financialposition.
Critical Accounting Policies and Estimates
Our Consolidated Financial Statements are based on the selection and applicationof accounting principles generally accepted in the United States
19
Table of Contents
of America, which require us to make estimates and assumptions about future eventsthat affect the amounts reported in our Consolidated Financial Statements and theaccompanying notes. Our significant accounting policies are described in Note 1 to theConsolidated Financial Statements. Future events and their effects cannot bedetermined with absolute certainty. Therefore, the determination of estimates requiresthe exercise of judgment. Actual results could differ from those estimates, and anysuch differences may be material to the Consolidated Financial Statements. Webelieve that the following policies may involve a higher degree of judgment andcomplexity in their application and represent the critical accounting policies used inthe preparation of our Consolidated Financial Statements. If different assumptions orconditions were to prevail, the results could be materially different from our reportedresults.
Goodwill – Goodwill represents the excess of cost over the fair value of netassets of businesses acquired and is allocated to our reporting units at the time of theacquisition. We analyze Goodwill on an annual basis and when an event occurs orcircumstances change that may reduce the fair value of a reporting unit below itscarrying amount. An entity should recognize an impairment charge for the amount bywhich the carrying amount exceeds the reporting unit's fair value.
We performed an analysis of qualitative factors to determine whether it is morelikely than not that the fair value of a reporting unit is less than its carrying amount asa basis for determining whether it is necessary to perform the quantitative goodwillimpairment test. The qualitative test is used as an indicator to identify if there ispotential goodwill impairment. If the qualitative test indicates there may be animpairment, we perform the quantitative test, which measures the amount of thegoodwill impairment, if any. We perform our goodwill impairment analysis as ofyear-end or when an event occurs or circumstances change that may reduce the fairvalue of a reporting unit below its carrying amount, and use our judgment to developassumptions for the discounted cash flow model that we use, if necessary.Management assumptions include forecasting revenues and margins, estimatingcapital expenditures, depreciation, amortization and discount rates.
If our goodwill impairment testing resulted in one or more of our reporting units’carrying amount exceeding its fair value, we would write down our reporting units’carrying amount to its fair value and would record an impairment charge in our resultsof operations in the period such determination is made. Subsequent reversal ofgoodwill impairment charges is not permitted. Based on our analysis of qualitativefactors, we determined that it was not more likely than not that the fair value of theNorth America, Latin America, EMEA and APAC reporting units was less than itsrespective carrying amount. We elected to perform a quantitative analysis of theCoatings reporting unit. Based on the quantitative analysis of that reporting unit, itwas determined there was no goodwill impairment at December 31, 2018. We hadGoodwill of $182.7 million as of December 31, 2018 .
Income Taxes – We are required to estimate our income taxes in each of thejurisdictions in which we operate. This process involves estimating our actual currenttax obligations based on expected income, statutory tax rates and tax planningopportunities in the various jurisdictions. We also establish reserves for uncertain taxmatters that are complex in nature and uncertain as to the ultimate outcome. Althoughwe believe that our tax return positions are fully supportable, we consider our abilityto ultimately prevail in defending these matters when establishing these reserves. Weadjust our reserves in light of changing facts and circumstances, such as the closing ofa tax audit. We believe that our current reserves are adequate. However, the ultimateoutcome may differ from our estimates and assumptions and could impact the incometax expense reflected in our Consolidated Statements of Operations.
Tax law requires certain items to be included in our tax return at different timesthan the items are reflected in our results of operations. Some of these differences arepermanent, such as expenses that are not deductible in our tax returns, and somedifferences will reverse over time, such as depreciation
expense on property, plant and equipment. These temporary differences result indeferred tax assets and liabilities, which are included within our Consolidated BalanceSheets. Deferred tax assets generally represent items that can be used as a taxdeduction or credit in our tax returns in future years but have already been recorded asan expense in our Consolidated Statements of Operations. We assess the likelihoodthat our deferred tax assets will be recovered from future taxable income, and, basedon management’s judgment, to the extent we believe that recovery is not more likelythan not, we establish a valuation reserve against those deferred tax assets. Thedeferred tax asset valuation allowance could be materially different from actual resultsbecause of changes in the mix of future taxable income, the relationship between bookand taxable income and our tax planning strategies. As of December 31, 2018 , avaluation allowance of $11.5 million was recorded against foreign tax losscarryforwards, foreign tax credit carryforwards and state credit carryforwards.
Cautionary Factors Relevant to Forward-Looking Information
This annual report on Form 10-K, including “Management’s Discussion andAnalysis of Financial Condition and Results of Operations” in Item 7, contains certainstatements that are considered “forward-looking statements” within the meaning of thePrivate Securities Litigation Reform Act of 1995. Forward-looking statementsgenerally can be identified by the use of forward-looking terminology such as “may,”“will,” “expect,” “intend,” “estimate,” “anticipate,” “believe,” “project,” or “continue”or similar words or the negative thereof. These statements do not relate to strictlyhistorical or current facts and provide current expectations of forecasts of futureevents. Any such expectations or forecasts of future events are subject to a variety offactors. Particular risks and uncertainties presently facing us include:
• Ability to effectively manage strategic plans or growth processes.
• Ability to successfully upgrade and evolve our information technologysystems.
• Fluctuations in the cost, quality or availability of raw materials and purchasedcomponents.
• Geopolitical and economic uncertainty throughout the world.
• Ability to attract, retain and develop key personnel and create effectivesuccession planning strategies.
• Ability to develop and commercialize new innovative products and services.
• Ability to integrate acquisitions, including IPC.
• Competition in our business.
• Ability to successfully protect our information technology systems from cybersecurity risks.
• Potential disruption of our business from actions of activist investors or others.
• Occurrence of a significant business interruption.
• Ability to comply with global laws and regulations.
• Unforeseen product liability claims or product quality issues.
• Ability to generate sufficient cash to satisfy our debt obligations.
• Internal control over financial reporting risks resulting from our acquisition ofIPC.
We caution that forward-looking statements must be considered carefully andthat actual results may differ in material ways due to risks and uncertainties bothknown and unknown. Information about factors that could materially affect our resultscan be found in Part I, Item 1A - Risk Factors. Shareholders, potential investors andother readers are urged to consider
20
Table of Contents
these factors in evaluating forward-looking statements and are cautioned not to placeundue reliance on such forward-looking statements.
We undertake no obligation to update or revise any forward-looking statement,whether as a result of new information, future events or otherwise, except as requiredby law. Investors are advised to consult any further disclosures by us in our filingswith the Securities and Exchange Commission and in other written statements onrelated subjects. It is not possible to anticipate or foresee all risk factors, and investorsshould not consider any list of such factors to be an exhaustive or complete list of allrisks or uncertainties.
ITEM 7A – Quantitative and Qualitative Disclosures AboutMarket Risk
Commodity Risk – We are subject to exposures resulting from potential costincreases related to our purchase of raw materials or other product components. We donot use derivative commodity instruments to manage our exposures to changes incommodity prices such as steel, oil, gas, lead and other commodities.
Various factors beyond our control affect the price of oil and gas, including, butnot limited to, worldwide and domestic supplies of oil and gas, political instability orarmed conflict in oil-producing regions, the price and level of foreign imports, thelevel of consumer demand, the price and availability of alternative fuels, domestic andforeign governmental regulation, weather-related factors and the overall economicenvironment. We purchase petroleum-related component parts for use in ourmanufacturing operations. In addition, our freight costs associated with shipping andreceiving product and sales and service vehicle fuel costs are impacted by fluctuationsin the cost of oil and gas.
Fluctuations in worldwide demand and other factors affect the price for lead,steel and related products. We do not maintain an inventory of raw or fabricated steelor batteries in excess of near-term production requirements. As a result, increases inthe price of lead or steel can significantly increase the cost of our lead- and steel-basedraw materials and component parts.
During 2018, we experienced inflation on our raw materials and other purchasedcomponent costs. We continue to focus on mitigating the risk of future raw material orother product component cost increases through supplier negotiations, ongoingoptimization of our supply chain, the continuation of cost reduction actions andproduct pricing. The success of these efforts will depend upon our ability to leverageour commodity spend in the current global economic environment. If the commodityprices increase significantly and we are not able to offset the increases with higherselling prices, our results may continue to be unfavorably impacted in 2019.
Foreign Currency Exchange Rate Risk – Due to the global nature of ouroperations, we are subject to exposures resulting from foreign currency exchangefluctuations in the normal course of business. Our primary exchange rate exposuresare with the Euro, Australian and Canadian dollars, British pound, Japanese yen,Chinese renminbi, Brazilian real and Mexican peso against the U.S. dollar. The directfinancial impact of foreign currency exchange includes the effect of translating profitsfrom local currencies to U.S. dollars, the impact of currency fluctuations on thetransfer of goods between our operations in the United States and our internationaloperations and transaction gains and losses. In addition to the direct financial impact,foreign currency exchange has an indirect financial impact on our results, includingthe effect on sales volume within local economies and the impact of pricing actionstaken as a result of foreign exchange rate fluctuations.
In the normal course of business, we actively manage the exposure of our foreigncurrency exchange rate market risk by entering into various hedging instruments withcounterparties that are highly rated financial institutions. We may use foreignexchange purchased options or forward contracts to hedge our foreign currencydenominated forecasted revenues or forecasted sales to wholly-owned foreignsubsidiaries. Additionally, we hedge
our net recognized foreign currency assets and liabilities with foreign exchangeforward contracts. We hedge these exposures to reduce the risk that our net earningsand cash flows will be adversely affected by changes in foreign exchange rates. We donot enter into any of these instruments for speculative or trading purposes to generaterevenue.
These contracts are carried at fair value and have maturities between one and 12months. The gains and losses on these contracts generally approximate changes in thevalue of the related assets, liabilities or forecasted transactions. Some of the derivativeinstruments we enter into do not meet the criteria for cash flow hedge accountingtreatment; therefore, changes in fair value are recorded in Foreign CurrencyTransaction Losses on our Consolidated Statements of Operations.
We use foreign currency exchange rate derivatives to hedge our exposure tofluctuations in exchange rates for anticipated intercompany cash transactions betweenTennant Company and its subsidiaries. During 2017, we entered into Euro to U.S.dollar foreign exchange cross currency swaps for all of the anticipated cash flowsassociated with an intercompany loan from a wholly-owned European subsidiary. Weentered into these foreign exchange cross currency swaps to hedge the foreigncurrency denominated cash flows associated with this intercompany loan, andaccordingly, they are not speculative in nature. We designated these cross currencyswaps as cash flow hedges. The hedged cash flows as of December 31, 2018 included€174,000 of total notional value. As of December 31, 2018 , the aggregate scheduledinterest payments over the course of the loan and related swaps amounted to €24,000 .The scheduled maturity and principal payment of the loan and related swaps of€150,000 are due in April 2022 . There were no new cross currency swaps designatedas cash flow hedges as of December 31, 2018 .
For further information regarding our foreign currency derivatives and hedgingprograms, see Note 13 to the Consolidated Financial Statements.
For details of the estimated effects of currency translation on the operations ofour operating segments, see Item 7 – Management's Discussion and Analysis ofFinancial Condition and Results of Operations.
Other Matters – Management regularly reviews our business operations withthe objective of improving financial performance and maximizing our return oninvestment. As a result of this ongoing process to improve financial performance, wemay incur additional restructuring charges in the future which, if taken, could bematerial to our financial results.
21
Table of Contents
ITEM 8 – Financial Statements and Supplementary Data
REPORT OF INDEPENDENT REGISTERED PUBLIC ACCOUNTING FIRM
To the shareholders and board of directorsTennant Company:
We have audited the accompanying consolidated balance sheets of Tennant Company, and subsidiaries (the Company) as of December 31, 2018 and 2017, the relatedconsolidated statements of operations, comprehensive income, equity, and cash flows for each of the years in the three-year period ended December 31, 2018, and the relatednotes and financial statement schedules included in Item 15.A.2 (collectively, the consolidated financial statements). We also have audited the Company’s internal control overfinancial reporting as of December 31, 2018, based on criteria established in InternalControl-IntegratedFramework(2013)issued by the Committee of SponsoringOrganizations of the Treadway Commission.
In our opinion, the consolidated financial statements referred to above present fairly, in all material respects, the financial position of the Company as of December 31, 2018 and2017, and the results of its operations and its cash flows for each of the years in the three-year period ended December 31, 2018, in conformity with U.S. generally acceptedaccounting principles. Also in our opinion, the Company maintained, in all material respects, effective internal control over financial reporting as of December 31, 2018 based oncriteria established in InternalControl-IntegratedFramework(2013)issued by the Committee of Sponsoring Organizations of the Treadway Commission.
ChangeinAccountingPrinciple
As discussed in Note 2 to the consolidated financial statements, the Company has changed its method of accounting for revenue in 2018 due to the adoption of FASBAccounting Standards Codification (Topic 606), RevenuefromContractswithCustomers.
BasisforOpinion
The Company’s management is responsible for these consolidated financial statements, for maintaining effective internal control over financial reporting, and for its assessmentof the effectiveness of internal control over financial reporting, included in the accompanying Management’s Report on Internal Control over Financial Reporting. Ourresponsibility is to express an opinion on the Company’s consolidated financial statements and an opinion on the Company’s internal control over financial reporting based onour audits. We are a public accounting firm registered with the Public Company Accounting Oversight Board (United States) (PCAOB) and are required to be independent withrespect to the Company in accordance with the U.S. federal securities laws and the applicable rules and regulations of the Securities and Exchange Commission and the PCAOB.
We conducted our audits in accordance with the standards of the PCAOB. Those standards require that we plan and perform the audits to obtain reasonable assurance aboutwhether the consolidated financial statements are free of material misstatement, whether due to error or fraud, and whether effective internal control over financial reporting wasmaintained in all material respects.
Our audits of the consolidated financial statements included performing procedures to assess the risks of material misstatement of the consolidated financial statements, whetherdue to error or fraud, and performing procedures that respond to those risks. Such procedures included examining, on a test basis, evidence regarding the amounts anddisclosures in the consolidated financial statements. Our audits also included evaluating the accounting principles used and significant estimates made by management, as well asevaluating the overall presentation of the consolidated financial statements. Our audit of internal control over financial reporting included obtaining an understanding of internalcontrol over financial reporting, assessing the risk that a material weakness exists, and testing and evaluating the design and operating effectiveness of internal control based onthe assessed risk. Our audits also included performing such other procedures as we considered necessary in the circumstances. We believe that our audits provide a reasonablebasis for our opinions.
A company’s internal control over financial reporting is a process designed to provide reasonable assurance regarding the reliability of financial reporting and the preparation offinancial statements for external purposes in accordance with generally accepted accounting principles. A company’s internal control over financial reporting includes thosepolicies and procedures that (1) pertain to the maintenance of records that, in reasonable detail, accurately and fairly reflect the transactions and dispositions of the assets of thecompany; (2) provide reasonable assurance that transactions are recorded as necessary to permit preparation of financial statements in accordance with generally acceptedaccounting principles, and that receipts and expenditures of the company are being made only in accordance with authorizations of management and directors of the company;and (3) provide reasonable assurance regarding prevention or timely detection of unauthorized acquisition, use, or disposition of the company’s assets that could have a materialeffect on the financial statements.
Because of its inherent limitations, internal control over financial reporting may not prevent or detect misstatements. Also, projections of any evaluation of effectiveness tofuture periods are subject to the risk that controls may become inadequate because of changes in conditions, or that the degree of compliance with the policies or procedures maydeteriorate.
/s/ KPMG LLP
We have served as the Company's auditor since 1954.
Minneapolis, MinnesotaFebruary 28, 2019
22
Table of Contents
Consolidated Statements of OperationsTENNANTCOMPANYANDSUBSIDIARIES
(Inthousands,exceptsharesandpersharedata)
Years ended December 31 2018 2017 2016
Net Sales $ 1,123,511 $ 1,003,066 $ 808,572
Cost of Sales 678,478 603,253 456,977
Gross Profit 445,033 399,813 351,595
Operating Expense:
Research and Development Expense 30,739 32,013 34,738
Selling and Administrative Expense 356,316 334,782 248,592
Total Operating Expense 387,055 366,795 283,330
Profit from Operations 57,978 33,018 68,265
Other Income (Expense):
Interest Income 3,035 2,405 330
Interest Expense (23,342) (25,394) (1,279)
Net Foreign Currency Transaction Losses (1,100) (3,387) (392)
Other Expense, Net (729) (7,934) (433)
Total Other Expense, Net (22,136) (34,310) (1,774)
Profit (Loss) Before Income Taxes 35,842 (1,292) 66,491
Income Tax Expense 2,304 4,913 19,877
Net Earnings (Loss) Including Noncontrolling Interest 33,538 (6,205) 46,614
Net Earnings (Loss) Attributable to Noncontrolling Interest 126 (10) —
Net Earnings (Loss) Attributable to Tennant Company $ 33,412 $ (6,195) $ 46,614
Net Earnings (Loss) Attributable to Tennant Company per Share:
Basic $ 1.86 $ (0.35) $ 2.66
Diluted $ 1.82 $ (0.35) $ 2.59
Weighted Average Shares Outstanding:
Basic 17,940,438 17,695,390 17,523,267
Diluted 18,338,569 17,695,390 17,976,183
Cash Dividends Declared per Common Share $ 0.85 $ 0.84 $ 0.81
See accompanying Notes to Consolidated Financial Statements.
23
Table of Contents
Consolidated Statements of Comprehensive IncomeTENNANTCOMPANYANDSUBSIDIARIES
(Inthousands)
Years ended December 31 2018 2017 2016
Net Earnings (Loss) Including Noncontrolling Interest $ 33,538 $ (6,205) $ 46,614
See accompanying Notes to Consolidated Financial Statements.
28
Table of ContentsNOTES TO THE CONSOLIDATED FINANCIAL STATEMENTS
(Inthousands,exceptsharesandpersharedata)
1. Summary of Significant Accounting Policies
Nature of Operations – Tennant Company is a world leader in designing, manufacturing and marketing solutions that empower customers to achieve quality cleaningperformance, significantly reduce environmental impact and help create a cleaner, safer, healthier world. Tennant offers products and solutions consisting of mechanizedcleaning equipment, detergent-free and other sustainable cleaning technologies, aftermarket parts and consumables, equipment maintenance and repair service, specialty surfacecoatings, and business solutions such as financing, rental and leasing programs, and machine-to-machine asset management solutions. Tennant products are used in many typesof environments including: Retail establishments, distribution centers, factories and warehouses, public venues such as arenas and stadiums, office buildings, schools anduniversities, hospitals and clinics, parking lots and streets, and more. Customers include contract cleaners to whom organizations outsource facilities maintenance, as well asbusinesses that perform facilities maintenance themselves. The Company reaches these customers through the industry's largest direct sales and service organization and througha strong and well-supported network of authorized distributors worldwide.
Consolidation – The Consolidated Financial Statements include the accounts of Tennant Company and its subsidiaries. All intercompany transactions and balances havebeen eliminated. In these Notes to the Consolidated Financial Statements, Tennant Company is referred to as “Tennant,” “we,” “us,” or “our.”
Translation of Non-U.S. Currency – Foreign currency-denominated assets and liabilities have been translated to U.S. dollars at year-end exchange rates, while incomeand expense items are translated at average exchange rates prevailing during the year. Gains or losses resulting from translation are included as a separate component ofAccumulated Other Comprehensive Loss. The balance of cumulative foreign currency translation adjustments recorded within Accumulated Other Comprehensive Loss as ofDecember 31, 2018 , 2017 and 2016 was a net loss of $31,831 , $15,778 and $44,444 , respectively. The majority of translation adjustments are not adjusted for income taxes assubstantially all translation adjustments relate to permanent investments in non-U.S. subsidiaries. Net Foreign Currency Transaction Losses are included in Other Income(Expense).
Use of Estimates – In preparing the consolidated financial statements in conformity with U.S. generally accepted accounting principles ("U.S. GAAP"), management mustmake decisions that impact the reported amounts of assets, liabilities, revenues, expenses and the related disclosures, including disclosures of contingent assets and liabilities.Such decisions include the selection of the appropriate accounting principles to be applied and the assumptions on which to base accounting estimates. Estimates are used indetermining, among other items, sales promotions and incentives accruals, inventory valuation, warranty reserves, allowance for doubtful accounts, pension and postretirementaccruals, useful lives for intangible assets, and future cash flows associated with impairment testing for Goodwill and other long-lived assets. These estimates and assumptionsare based on management’s best estimates and judgments. Management evaluates its estimates and assumptions on an ongoing basis using historical experience and other factorsthat management believes to be reasonable under the circumstances. We adjust such estimates and assumptions when facts and circumstances dictate. A number of these factorsinclude, among others, economic conditions, credit markets, foreign currency, commodity cost volatility and consumer spending and confidence, all of which have combined toincrease the uncertainty inherent in such estimates and assumptions. As future events and their effects cannot be determined with precision, actual amounts could differsignificantly from those estimated at the time the consolidated financial statements are prepared. Changes in those estimates resulting from continuing changes in the economicenvironment will be reflected in the financial statements in future periods.
Cash and Cash Equivalents – We consider all highly liquid investments with maturities of three months or less from the date of purchase to be cash equivalents.
Restricted Cash – We have a total of $525 as of December 31, 2018 that serves as collateral backing certain bank guarantees and is therefore restricted. This money isinvested in time deposits.
Receivables – Credit is granted to our customers in the normal course of business. Receivables are recorded at original carrying value less reserves for estimateduncollectible accounts and sales returns. To assess the collectability of these receivables, we perform ongoing credit evaluations of our customers’ financial condition. Throughthese evaluations, we may become aware of a situation where a customer may not be able to meet its financial obligations due to deterioration of its financial viability, creditratings or bankruptcy. The reserve requirements are based on the best facts available to us and are reevaluated and adjusted as additional information becomes available. Ourreserves are also based on amounts determined by using percentages applied to trade receivables. These percentages are determined by a variety of factors including, but notlimited to, current economic trends, historical payment and bad debt write-off experience. An account is considered past-due or delinquent when it has not been paid within thecontractual terms. Uncollectible accounts are written off against the reserves when it is deemed that a customer account is uncollectible.
Inventories – Inventories are valued at the lower of cost or net realizable value. Cost is determined on a first-in, first-out (“FIFO”) basis except for Inventories in NorthAmerica, which are determined on a last-in, first-out (“LIFO”) basis.
Property, Plant and Equipment – Property, plant and equipment is carried at cost. Additions and improvements that extend the lives of the assets are capitalized whileexpenditures for repairs and maintenance are expensed as incurred. We generally depreciate buildings and improvements by the straight-line method over a life of 30 years .Other property, plant and equipment are generally depreciated using the straight-line method based on lives of 3 years to 15 years .
29
Table of ContentsNOTES TO THE CONSOLIDATED FINANCIAL STATEMENTS
(Inthousands,exceptsharesandpersharedata)
Equity Method Investment – Investments in which we have the ability to exercise significant influence, but do not control, are accounted for under the equity method ofaccounting and are included in Other Assets on the Consolidated Balance Sheets. Under this method of accounting, our share of the net earnings or losses of the investee arepresented as a component of Other Expense, Net on the Consolidated Statements of Operations. The detail regarding our equity method investment in i-team North AmericaB.V., a joint venture that operates as the distributor of the i-mop in North America, is further described in Note 5.
Goodwill – Goodwill represents the excess of cost over the fair value of net assets of businesses acquired. We analyze Goodwill on an annual basis as of year-end and whenan event occurs or circumstances change that may reduce the fair value of one of our reporting units below its carrying amount. A goodwill impairment occurs if the carryingamount of a reporting unit exceeds its fair value. In assessing the recoverability of Goodwill, we use an analysis of qualitative factors to determine whether it is more likely thannot that the fair value of a reporting unit is less than its carrying amount as a basis for determining whether it is necessary to perform the quantitative impairment test.
Intangible Assets – Intangible Assets consist of definite lived customer lists, trade names and technology. Generally, intangible assets classified as trade names areamortized on a straight-line basis and intangible assets classified as customer lists or technology are amortized using an accelerated method of amortization.
Impairment of Long-lived Assets and Assets Held for Sale – We periodically review our intangible and long-lived assets for impairment and assess whether events orcircumstances indicate that the carrying amount of the assets may not be recoverable. We generally deem an asset group to be impaired if an estimate of undiscounted futureoperating cash flows is less than its carrying amount. If impaired, an impairment loss is recognized based on the excess of the carrying amount of the individual asset group overits fair value.
Assets held for sale are measured at the lower of their carrying value or fair value less costs to sell. Upon retirement or disposition, the asset cost and related accumulateddepreciation or amortization are removed from the accounts and a gain or loss is recognized based on the difference between the fair value of proceeds received and carryingvalue of the assets held for sale.
Purchase of Common Stock – We repurchase our Common Stock under 2016 and 2015 repurchase programs authorized by our Board of Directors. These programs allowus to repurchase up to an aggregate of 1,392,892 shares of our Common Stock. Upon repurchase, the par value is charged to Common Stock and the remaining purchase price ischarged to Additional Paid-in Capital. If the amount of the remaining purchase price causes the Additional Paid-in Capital account to be in a debit position, this amount is thenreclassified to Retained Earnings. Common Stock repurchased is included in shares authorized but is not included in shares outstanding.
Warranty – We record a liability for estimated warranty claims at the time of sale. The amount of the liability is based on the trend in the historical ratio of claims to sales,the historical length of time between the sale and resulting warranty claim, new product introductions and other factors. In the event we determine that our current or futureproduct repair and replacement costs exceed our estimates, an adjustment to these reserves would be charged to earnings in the period such determination is made. Warrantyterms on machines range from one to four years. However, the majority of our claims are paid out within the first six to nine months following a sale. The majority of theliability for estimated warranty claims represents amounts to be paid out in the near term for qualified warranty issues, with immaterial amounts reserved to be paid out for olderequipment warranty issues. Warranty costs are recorded as a component of Selling and Administrative Expense in the Consolidated Statements of Operations.
Debt Issuance Costs – We record all applicable debt issuance costs related to a recognized debt liability in the Consolidated Balance Sheets as a direct deduction from thecarrying amount of the debt liability, if not a line-of-credit arrangement. All debt issuance costs related to line-of-credit arrangements are recorded as part of Other Assets in theConsolidated Balance Sheets and subsequently amortized over the term of the line-of-credit arrangement. We amortize our debt issuance costs using the effective interest methodover the term of the debt instrument or line-of-credit arrangement. Amortization of these costs is included as part of Interest Expense in the Consolidated Statements ofOperations.
Environmental – We record a liability for environmental clean-up on an undiscounted basis when a loss is probable and can be reasonably estimated.
Pension and Profit Sharing Plans – Substantially all U.S. employees are covered by various retirement benefit plans, including postretirement medical plans and definedcontribution savings plans. Pension plan costs are accrued based on actuarial estimates with the required pension cost funded annually, as needed. No new participants haveentered the defined benefit pension plan since 2000 and no new participants have entered the postretirement medical plan since 1998. For further details regarding our pensionand profit sharing plans, see Note 15.
Postretirement Benefits – We accrue and recognize the cost of retiree health benefits over the employees’ period of service based on actuarial estimates. Benefits are onlyavailable for U.S. employees hired before January 1, 1999.
Derivative Financial Instruments – In countries outside the U.S., we transact business in U.S. dollars and in various other currencies. We hedge our net recognizedforeign currency denominated assets and liabilities with foreign exchange forward contracts to reduce the risk that the value of these assets and liabilities will be adverselyaffected by changes in exchange rates. We may also use foreign exchange option contracts or forward contracts to hedge certain cash flow exposures resulting from changes inforeign currency exchange rates. We enter into these foreign exchange contracts to hedge a portion of our forecasted currency denominated revenue in the normal course ofbusiness, and accordingly, they are not speculative in nature.
30
Table of ContentsNOTES TO THE CONSOLIDATED FINANCIAL STATEMENTS
(Inthousands,exceptsharesandpersharedata)
We account for our foreign currency hedging instruments as either assets or liabilities on the balance sheet and measure them at fair value. Gains and losses resulting fromchanges in fair value are accounted for depending on the use of the derivative and whether it is designated and qualifies for hedge accounting. Gains and losses from foreignexchange forward contracts that hedge certain balance sheet positions are recorded each period to Net Foreign Currency Transaction Losses in our Consolidated Statements ofOperations. Foreign exchange option contracts or forward contracts hedging forecasted foreign currency revenue are designated as cash flow hedges under accounting forderivative instruments and hedging activities, with gains and losses recorded each period to Accumulated Other Comprehensive Loss in our Consolidated Balance Sheets, untilthe forecasted transaction occurs. When the forecasted transaction occurs, we reclassify the related gain or loss on the cash flow hedge to Net Sales. In the event the underlyingforecasted transaction does not occur, or it becomes probable that it will not occur, we reclassify the gain or loss on the related cash flow hedge from Accumulated OtherComprehensive Loss to Net Foreign Currency Transaction Losses in our Consolidated Statements of Operations at that time. If we do not elect hedge accounting, or the contractdoes not qualify for hedge accounting treatment, the changes in fair value from period to period are recorded in Net Foreign Currency Transaction Losses in our ConsolidatedStatements of Operations. See Note 13 for additional information regarding our hedging activities.
Revenue Recognition – Revenue is recognized upon transfer of control of promised products or services to customers in an amount that reflects the consideration weexpect to receive in exchange for those products and services. Generally, these criteria are met at the time the product is shipped.
We also enter into contracts that can include combinations of products and services, which are generally capable of being distinct and are accounted for as separate performanceobligations. Revenue is recognized net of allowances for returns and any taxes collected from customers, which are subsequently remitted to governmental authorities.
Further details regarding revenue recognition are discussed in Notes 2 and 4.
Share-based Compensation – We account for employee share-based compensation using the fair value based method. Our share-based compensation plans are more fullydescribed in Note 19.
Research and Development – Research and development costs are expensed as incurred.
Advertising Costs – We advertise products, technologies and solutions to customers and prospective customers through a variety of marketing campaign and promotionalefforts. These efforts include tradeshows, online advertising, e-mail marketing, mailings, sponsorships and telemarketing. Advertising costs are expensed as incurred. In 2018 ,2017 and 2016 , such activities amounted to $8,767 , $8,228 and $7,269 , respectively.
Income Taxes – Deferred tax assets and liabilities are recognized for the expected future tax consequences of temporary differences between the book and tax bases ofexisting assets and liabilities. A valuation allowance is provided when, in management’s judgment, it is more likely than not that some portion or all of the deferred tax asset willnot be realized. We have established contingent tax liabilities using management’s best judgment. We follow guidance provided by Accounting Standards Codification ("ASC")740, IncomeTaxes, regarding uncertainty in income taxes, to record these contingent tax liabilities (refer to Note 18 for additional information). We adjust these liabilities asfacts and circumstances change. Interest Expense is recognized in the first period the interest would begin accruing. Penalties are recognized in the period we claim or expect toclaim the position in our tax return. Interest and penalty expenses are classified as an income tax expense.
Sales Tax – Sales taxes collected from customers and remitted to governmental authorities are presented on a net basis.
Earnings per Share – Basic earnings (loss) per share is computed by dividing Net Earnings (Loss) Attributable to Tennant Company by the Weighted Average SharesOutstanding during the period. Diluted earnings per share assumes conversion of potentially dilutive stock options, performance shares, restricted shares and restricted stockunits. These conversions are not included in our computation of diluted earnings per share if we have a net loss attributable to Tennant Company in a reporting period, as theeffects are anti-dilutive.
New Accounting Pronouncements - In February 2016, the FASB issued ASU No. 2016-02, Leases(Topic842). This ASU changes current U.S. GAAP for lessees torecognize lease assets and lease liabilities on the balance sheet for those leases classified as operating leases under previous U.S. GAAP. Under the new guidance, lessoraccounting is largely unchanged. The amendments in this ASU are effective for annual periods beginning after December 15, 2018, including interim periods within thatreporting period, which is our fiscal 2019.
We have elected to apply the standard on a prospective basis with an adjustment to retained earnings in the first period of adoption. We have also elected the package ofpractical expedients, which permits us not to reassess our prior conclusions about lease identification, lease classification and initial direct costs. In addition, we have elected theshort-term lease recognition whereby we will not recognize operating lease related assets or liabilities for leases with a lease term less than one year. We have also elected to notseparate lease and non-lease components for all of our leases. We will not be electing the hindsight practical expedient to determine the reasonably certain term of existingleases.
We are continuing to evaluate the impact of this amended guidance on our consolidated financial statements and related disclosures. We expect the adoption of this standardwill have a material impact on the consolidated balance sheets for recognition of operating lease related assets and liabilities. We do not expect a material impact to theconsolidated statements of operations. We are unable to quantify the impact at this time as the lease software required to calculate the impact due to the volume of our lease datahas not yet been implemented. We are also in the process of implementing controls to ensure compliance with the new lease accounting standard. We expect to be complete withimplementation activities by the end of the first quarter of 2019 and will provide appropriate disclosures at that time.
31
Table of ContentsNOTES TO THE CONSOLIDATED FINANCIAL STATEMENTS
On January 1, 2018, we adopted Accounting Standards Update ("ASU") No. 2014-09, RevenuefromContractswithCustomers(Topic606)and all the related amendments("new revenue standard") to all contracts not completed at the date of initial application using the modified retrospective method. The cumulative effect of initially applying thenew revenue standard as an adjustment to the opening balance of retained earnings was not material to the company. The comparative information has not been restated andcontinues to be reported under the accounting standards in effect for those periods, and there are no material differences between the reported results under the new revenuestandard and those that would have been reported under legacy U.S. GAAP.
The new revenue standard also required us to record a refund liability and a corresponding asset for our right to recover products from customers upon settling the refundliability to account for the transfer of products with a right of return. The impact of this provision of the new revenue standard is immaterial to our financial statements. The newrevenue standard also provided additional clarity that resulted in a reclassification from the Accounts Receivable to Other Current Liabilities to reflect a change in thepresentation of our sales return reserves on the balance sheet, which were previously recorded net of Accounts Receivable. Provisions for estimated sales returns will continue tobe recorded at the time the related revenue is recognized.
The reclassification from Accounts Receivable to Other Current Liabilities in accordance with the detail described above impacted the Condensed Consolidated BalanceSheet as of December 31, 2018, as follows (in thousands):
As Reported Balance Without
Adoption of ASC 606 Effect of ChangeHigher/(Lower)
LIABILITIES Other Current Liabilities $ 71,895 $ 70,583 $ 1,312
Total Current Liabilities 248,874 247,562 $ 1,312
Total Liabilities $ 676,192 $ 674,880 $ 1,312
Intra-EntityTransfersofAssetsOtherthanInventory
On January 1, 2018, we adopted ASU No. 2016-16, IncomeTaxes(Topic740):Intra-EntityTransfersofAssetsOtherthanInventory.The ASU requires the tax effects ofall intra-entity sales of assets other than inventory to be recognized in the period in which the transaction occurs. The adoption of this ASU resulted in a $94 cumulative effectadjustment recorded in Retained Earnings as of the beginning of 2018 that reflects a $1,281 reduction in a long-term deferred charge, mostly offset by the establishment ofdeferred tax assets of $1,187 . The reduction in the long-term asset and establishment of the deferred tax asset impacted Other Assets and Deferred Income Taxes, respectively,on our Condensed Consolidated Balance Sheets.
StatementofCashFlows–RestrictedCash
On January 1, 2018, we adopted ASU No. 2016-18, StatementofCashFlows(Topic230):RestrictedCash.The ASU requires companies to explain the changes in thecombined total of restricted and unrestricted balances in the Condensed Consolidated Statements of Cash Flows. Therefore, amounts generally described as restricted cash orrestricted cash equivalents should be combined with unrestricted cash and cash equivalents when reconciling the beginning and end of period balances on the CondensedConsolidated Statement of Cash Flows. In accordance with the ASU, we adopted the standard on a retrospective basis to all periods presented.
Compensation–RetirementBenefits
On January 1, 2018, we adopted ASU No. 2017-07, Compensation—RetirementBenefits(Topic715):ImprovingthePresentationofNetPeriodicPensionCostandNetPeriodicPostretirementBenefitCost. The ASU requires employers to report the service cost component of net pension and postretirement benefit costs in the same line item oritems as other compensation costs arising from services rendered by the pertinent employees during the period. The other components of net pension and postretirement benefitcosts are required to be presented in the Condensed Consolidated Statements of Operations separately from the service cost component in nonoperating expenses. In accordancewith the ASU, we adopted the standard on a retrospective basis to all periods presented. As a result, we reclassified $5,974 of net benefit costs and $233 of net benefit creditsfrom Selling and Administrative Expense to Other Expense, Net on the Condensed Consolidated Statements of Operations for the twelve months ended December 31, 2017 andDecember 31, 2016, respectively. The reclassification represents the other components of net pension and postretirement benefit costs that are now presented in the CondensedConsolidated Statements of Operations separately from the service cost in Total Other Expense, Net. As a basis for the retrospective application of the ASU, we used thepractical expedient that permits us to use the amounts disclosed for the various components of net benefit cost in Note 15.
IncomeStatement–ReportingComprehensiveIncome
On January 1, 2018, we elected to adopt early ASU No. 2018-02, IncomeStatement—ReportingComprehensiveIncome(Topic220). The ASU gives companies the optionto reclassify stranded tax effects caused by the newly enacted legislation referred to as the Tax Cuts and Jobs Act (the "Tax Act") from Accumulated Other Comprehensive Lossto Retained Earnings. The adoption resulted in a $1,262 cumulative effect adjustment which increased Retained
32
Table of ContentsNOTES TO THE CONSOLIDATED FINANCIAL STATEMENTS
(Inthousands,exceptsharesandpersharedata)
Earnings as of the beginning of 2018 and reduced the deferred income tax benefits in Accumulated Other Comprehensive Loss relating to cash flow hedges and pension andretiree medical benefits.
IncomeTaxes
In March 2018, we adopted ASU No. 2018-05, IncomeTaxes(Topic740):AmendmentstoSECparagraphsPursuanttoSECStaffAccountingBulletinNo.118.The ASUupdates the income tax accounting in U.S. GAAP to reflect the SEC interpretive guidance released on December 22, 2017, when the Tax Act was signed into law. Additionalinformation regarding the adoption of this standard is contained in Note 18.
3. Revision of Prior Period Financial StatementsSubsequent to the issuance of our consolidated financial statements for the quarter and year-to-date periods ended September 30, 2018, management identified
misclassifications between Cost of Sales and Selling and Administrative Expense in our Consolidated Statements of Operations. As a result of revising prior period financialstatement amounts for these misclassifications, Cost of Sales increased $4,608 and Selling and Administrative Expense decreased $4,608 for the year ended December 31, 2017.There were no misclassifications identified for the year ended December 31, 2016. These revisions had no impact on Profit (Loss) Before Income Taxes. The revisions also hadno impact on our Consolidated Statements of Comprehensive Income, Consolidated Statements of Equity, Consolidated Balance Sheets, or Consolidated Statements of CashFlow. Management evaluated the materiality of the revisions from a quantitative and qualitative perspective and concluded that the revisions are immaterial to our consolidatedfinancial statements.
Revisions to amounts in previously filed quarterly financial statements from 2018 and 2017 are reflected in Note 22.
4. Revenue from Contracts with CustomersUnder the new revenue standard, revenue is recognized when control transfers under the terms of the contract with our customers. Revenue is measured as the amount of
consideration we expect to receive in exchange for transferring goods or providing services. Sales and other taxes we collect concurrent with revenue-producing activities areexcluded from revenue. We do not account for shipping and handling as a distinct performance obligation as we generally perform shipping and handling activities after wetransfer control of goods to the customer. We have elected to account for shipping and handling costs associated with outbound freight after control of goods has transferred to acustomer as a fulfillment cost. Incidental items that are immaterial in the context of the contract are not recognized as a separate performance obligation. We do not have anysignificantly extended payment terms as payment is generally received within one year of the point of sale.
In general, we transfer control and recognize a sale at the point in time when products are shipped from our manufacturing facilities both direct to consumers and todistributors. Service revenue is recognized in the period the service is performed or ratably over the period of the related service contract. Consideration related to servicecontracts is deferred if the proceeds are received in advance of the satisfaction of the performance obligations and recognized over the contract period as the performanceobligation is met. We use an output method to measure progress toward completion for certain prepaid service contracts, as this method appropriately depicts performancetowards satisfaction of the performance obligations.
For contracts with multiple performance obligations (i.e., a product and service component), we allocate the transaction price to the performance obligations in proportionto their stand-alone selling prices. We use an observable price to determine the stand-alone selling price for separate performance obligations. When allocating on a relativestand-alone selling price basis, any discounts contained within the contract are allocated proportionately to all of the performance obligations in the contract.
Disaggregation of Revenue
The following tables illustrate the disaggregation of revenue by geographic area, groups of similar products and services and sales channels for the twelve months endedDecember 31, 2018 , 2017 and 2016 (in thousands):
NetSalesbygeographicarea
Twelve Months Ended
December 31
2018 2017 2016
Americas $ 690,996 $ 640,274 $ 607,026
Europe, Middle East and Africa 335,603 273,738 129,046
Asia Pacific 96,912 89,054 72,500
Total $ 1,123,511 $ 1,003,066 $ 808,572
Net Sales are attributed to each geographic area based on the end user country and are net of intercompany sales.
33
Table of ContentsNOTES TO THE CONSOLIDATED FINANCIAL STATEMENTS
(Inthousands,exceptsharesandpersharedata)
NetSalesbygroupsofsimilarproductsandservices
Twelve Months Ended
December 31
2018 2017 2016
Equipment $ 729,993 $ 636,875 $ 491,075
Parts and Consumables 222,345 202,452 173,632
Specialty Surface Coatings 29,827 31,407 29,146
Service and Other 141,346 132,332 114,719
Total $ 1,123,511 $ 1,003,066 $ 808,572
NetSalesbysaleschannel
Twelve Months Ended
December 31
2018 2017 2016
Sales Direct to Consumer $ 735,244 $ 674,495 $ 609,538
Sales to Distributors 388,267 328,571 199,034
Total $ 1,123,511 $ 1,003,066 $ 808,572
Contract LiabilitiesSalesReturns
The right of return may exist explicitly or implicitly with our customers. When the right of return exists, we adjust the transaction price for the estimated effect of returns.We estimate the expected returns using the expected value method by assessing historical sales levels and the timing and magnitude of historical sales return levels as a percentof sales and projecting this experience into the future.
SalesIncentives
Our sales contracts may contain various customer incentives, such as volume-based rebates or other promotions. We reduce the transaction price for certain customerprograms and incentive offerings that represent variable consideration. Sales incentives given to our customers are recorded using the most likely amount approach forestimating the amount of consideration to which the company will be entitled. We forecast the most likely amount of the incentive to be paid at the time of sale, update thisforecast quarterly, and adjust the transaction price accordingly to reflect the new amount of incentives expected to be earned by the customer. A majority of our customerincentives are settled within one year. We record our accruals for volume-based rebates and other promotions in Other Current Liabilities on our Condensed ConsolidatedBalance Sheets.
The change in our sales incentive accrual balance for the twelve months ended December 31, 2018 was as follows:
We sell separately priced prepaid contracts to our customers where we receive payment at the inception of the contract and defer recognition of the consideration receivedbecause we have to satisfy future performance obligations. Our deferred revenue balance is primarily attributed to prepaid maintenance contracts on our machines ranging from12 months to 60 months . In circumstances where prepaid contracts are sold simultaneously with machines, we use an observable price to determine stand-alone selling price forseparate performance obligations.
34
Table of ContentsNOTES TO THE CONSOLIDATED FINANCIAL STATEMENTS
(Inthousands,exceptsharesandpersharedata)
The change in the deferred revenue balance for the twelve months ended December 31, 2018 was as follows:
Twelve Months Ended
December 31
2018
Beginning balance $ 7,787 Increase in deferred revenue representing our obligation to satisfy future performance obligations 14,650 Decrease in deferred revenue for amounts recognized in Net Sales for satisfied performance obligations (13,755)Foreign currency fluctuations (157)
Ending balance $ 8,525
At December 31, 2018 , $5,021 and $3,504 of deferred revenue was reported in Other Current Liabilities and Other Liabilities, respectively, on our Condensed ConsolidatedBalance Sheets. Of this, we expect to recognize the following approximate amounts in Net Sales in the following periods:
2019 $ 5,0212020 1,8652021 1,0442022 4422023 153
Thereafter —
Total $ 8,525
At December 31, 2017, $5,815 and $2,483 of deferred revenue was reported in Other Current Liabilities and Other Liabilities, respectively, on our Condensed ConsolidatedBalance Sheets.
Practical Expedients and Exemptions
We generally expense the incremental costs of obtaining a contract when incurred because the amortization period would be less than one year. These costs relate primarilyto sales commissions and are recorded in Selling and Administrative Expense in the Condensed Consolidated Statements of Operations.
We do not disclose the value of unsatisfied performance obligations for contracts with an original expected length of one year or less. In addition, we do not adjust thepromised amount of consideration for the effects of a significant financing component if we expect, at contract inception, that the period between when we transfer a promisedgood or service to a customer and when the customer pays for that good or service will be one year or less.
5. Investment in Joint VentureOn February 13, 2017, the Company, through a Dutch subsidiary, together with Future Cleaning Technologies, B.V., a company headquartered in the Netherlands,
announced the January 1, 2017 formation of i-team North America B.V., a joint venture that operates as the distributor of the i-mop in North America. We began selling andservicing the i-mop in the second quarter of 2017. We own a 50% ownership interest in the joint venture, which is accounted for under the equity method of accounting, with ourproportionate share of income or loss presented as a component of Other Expense, Net on the Consolidated Statements of Operations. In 2018 , this amount was immaterial.
As of December 31, 2018 , the carrying value of the company's investment in the joint venture was $32 . In March 2017, we issued a $1,500 loan to the joint venture and, asa result, recorded a long-term note receivable in Other Assets on the Consolidated Balance Sheets.
6. Management Actions
During the first quarter of 2017 , we implemented a restructuring action to better align our global resources and expense structure with a lower growth global economicenvironment. The pre-tax charge of $8,018 , including other associated costs of $961 , consisted primarily of severance and was included within Selling and AdministrativeExpense in the Consolidated Statements of Operations. The charge impacted our Americas, Europe, Middle East and Africa ("EMEA") and Asia Pacific ("APAC") operatingsegments. We estimated the savings would offset the pre-tax charge approximately one year from the date of the action. No additional costs will be incurred related to thisrestructuring action.
During the fourth quarter of 2017 , we implemented a restructuring action primarily driven by integration actions related to our acquisition of IP Cleaning S.p.A and itssubsidiaries ("IPC Group"). See Note 7 for further details regarding our acquisition of the IPC Group. The restructuring action consisted primarily of severance and includesreductions in overall staffing to streamline and right-size the organization to support anticipated business requirements. The pre-tax charge of $2,501 was included within Sellingand Administrative Expense in the Consolidated Statements of Operations. The charge impacted our Americas, EMEA and APAC operating segments. We estimated the savingswould offset the pre-tax charge approximately one year from the date of the action.
35
Table of ContentsNOTES TO THE CONSOLIDATED FINANCIAL STATEMENTS
(Inthousands,exceptsharesandpersharedata)
During the fourth quarter of 2018 , we implemented a restructuring action consisting of severance to further our integration efforts related to the IPC Group. The pre-taxcharge of $1,032 was included within Selling and Administrative Expense in the Consolidated Statements of Operations. The charge impacted our EMEA and APAC operatingsegments. We estimate the savings will offset the pre-tax charge approximately one year from the date of the action.
A reconciliation to the ending liability balance of severance and related costs as of December 31, 2018 is as follows:
2018 charges and utilization: New charges 1,032Cash payments (2,123)Foreign currency adjustments (97)
December 31, 2018 Balance $ 2,248
7. Acquisitions and Divestitures
Waterstar
During the third quarter of 2018, we sold substantially all of the assets of our Waterstar business for $4,000 in cash. The resulting gain was approximately $1,000 and isreflected within Selling and Administrative Expense in operating profit in our Consolidated Statements of Operations.
IPCleaningS.p.A.
On April 6, 2017, we acquired nearly 100 percent of the outstanding capital stock of IPC Group for a purchase price of $353,769 , net of cash acquired of $8,804 . Theprimary seller was Ambienta SGR S.p.A., a European private equity fund. IPC Group, based in Italy, is a designer and manufacturer of innovative professional cleaningequipment, cleaning tools and supplies. The acquisition strengthens our presence and market share in Europe and will allow us to better leverage our EMEA cost structure. Wefunded the acquisition of IPC Group, along with related fees, including refinancing of existing debt, with funds raised through borrowings under a senior secured credit facilityin an aggregate principal amount of $420,000 . Further details regarding our acquisition financing arrangements are discussed in Note 11.
The following table summarizes the final fair value measurement of the assets acquired and liabilities assumed as of the date of acquisition:
36
Table of ContentsNOTES TO THE CONSOLIDATED FINANCIAL STATEMENTS
(Inthousands,exceptsharesandpersharedata)
ASSETS Receivables $ 39,984Inventories 46,442Other Current Assets 7,456Assets Held for Sale 2,247Property, Plant and Equipment 63,890
Intangible Assets Subject to Amortization: Trade Name 26,753Customer Lists 123,061Technology 9,631
Total Estimated Purchase Price, net of Cash Acquired $ 353,769
Based on the final fair value measurement of the assets acquired and liabilities assumed, we allocated $152,472 to goodwill for the expected synergies from combiningIPC Group with our existing business. None of the goodwill is expected to be deductible for income tax purposes. In connection with the finalization of the fair valuemeasurements in the first quarter of 2018, we recorded a measurement period adjustment, which increased goodwill by $4,627 with offsetting adjustments to various income taxassets and liabilities.
The final fair value of the acquired intangible assets is $159,445 . The expected lives of the acquired amortizable intangible assets are approximately 15 years forcustomer lists, 10 years for trade names and 10 years for technology. Trade names are being amortized on a straight-line basis while the customer lists and technology arebeing amortized on an accelerated basis. We recorded amortization expense of $20,794 in Selling and Administrative Expense on our Consolidated Statements of Operations forthese acquired intangible assets for the twelve months ended December 31, 2018 .
The following unaudited pro forma financial information presents the combined results of operations of Tennant Company as if the acquisition of IPC Group hadoccurred as of January 1, 2016:
Years ended December 31 2017 2016
Net Sales
Pro forma $ 1,057,127 $ 1,013,710
As reported 1,003,066 808,572
Net Earnings (Loss) Attributable to Tennant Company
Pro forma $ 12,288 $ 30,412
As reported (6,195) 46,614
Net Earnings (Loss) Attributable to Tennant Company per Diluted Share
Pro forma $ 0.68 $ 1.69
As reported (0.35) 2.59
37
Table of ContentsNOTES TO THE CONSOLIDATED FINANCIAL STATEMENTS
(Inthousands,exceptsharesandpersharedata)
The unaudited pro forma financial information is presented for informational purposes only. It is not necessarily indicative of what our consolidated results of operationsactually would have been had the acquisition occurred at the beginning of each year, nor does it attempt to project the future results of operations of the combined company.
The unaudited pro forma financial information above gives effect to the following:
• Incremental depreciation and amortization expense related to the fair value of the property, plant and equipment and identified intangible assets;
• Exclusion of the purchase accounting impact of the inventory step-up related to the sale of acquired inventory;
• Incremental interest expense related to additional debt used to finance the acquisition;
• Exclusion of non-recurring acquisition-related transaction and financing costs; and
• Pro forma adjustments tax affected based on the jurisdiction where the costs were incurred.
8. Inventories
Inventories as of December 31 consisted of the following:
2018 2017
Inventories carried at LIFO: Finished goods $ 48,607 $ 43,439
Raw materials, production parts and work-in-process 28,581 23,694
Excess of FIFO over LIFO cost (a) (31,199) (28,429)
Total LIFO inventories $ 45,989 $ 38,704
Inventories carried at FIFO: Finished goods $ 53,520 $ 54,161
Raw materials, production parts and work-in-process 35,624 34,829
Total FIFO inventories $ 89,144 $ 88,990
Total inventories $ 135,133 $ 127,694
(a) Inventories of $45,989 as of December 31, 2018, and $38,704 as of December 31, 2017, were valued at LIFO. The difference between replacement cost and the statedLIFO inventory value is not materially different from the reserve for the LIFO valuation method.
9. Property, Plant and Equipment
Property, Plant and Equipment and related Accumulated Depreciation, including equipment under capital leases, as of December 31, consisted of the following:
2018 2017
Property, Plant and Equipment: Land $ 17,857 $ 18,152
Buildings and improvements 93,729 96,230
Machinery and manufacturing equipment 154,118 151,645
Office equipment 111,219 107,312
Work in progress 9,718 9,429
Total Property, Plant and Equipment 386,641 382,768
Property, Plant and Equipment, Net $ 163,447 $ 180,018
Depreciation expense was $32,291 in 2018 , $26,199 in 2017 and $17,891 in 2016 .
38
Table of ContentsNOTES TO THE CONSOLIDATED FINANCIAL STATEMENTS
(Inthousands,exceptsharesandpersharedata)
10. Goodwill and Intangible Assets
For purposes of performing our goodwill impairment analysis, we have identified our reporting units as North America, Latin America, Coatings, EMEA and APAC. As ofDecember 31, 2018 , 2017 and 2016 , we performed an analysis of qualitative factors to determine whether it is more likely than not that the fair value of a reporting unit is lessthan its carrying amount as a basis for determining whether it is necessary to perform the quantitative goodwill impairment test. Based on our analysis of qualitative factors, wedetermined that it was not more likely than not that the fair value of the North America, Latin America, EMEA and APAC reporting units was less than its respective carryingamount. We elected to perform a quantitative analysis of the Coatings reporting unit. Based on the quantitative analysis of that reporting unit, it was determined there was nogoodwill impairment at December 31, 2018.
The changes in the carrying amount of Goodwill are as follows:
Goodwill
AccumulatedImpairment
Losses Total
Balance as of December 31, 2016 $ 58,397 $ (37,332) $ 21,065
Weighted-average original life (in years) 15 10 11
The purchase accounting adjustments recorded during the first quarter of 2018 were based on the fair value adjustments related to our acquisition of the IPC Group, asdescribed further in Note 7.
In 2018 , our purchased intangible assets were $2,775 , which was primarily due to a technology license. The license was recorded in Intangible Assets, Net as technologyon the Condensed Consolidated Balance Sheets as of December 31, 2018 .
Amortization expense on Intangible Assets was $22,129 , $17,054 and $409 for the years ended December 31, 2018 , 2017 and 2016 , respectively.
39
Table of ContentsNOTES TO THE CONSOLIDATED FINANCIAL STATEMENTS
(Inthousands,exceptsharesandpersharedata)
Estimated aggregate amortization expense based on the current carrying amount of amortizable Intangible Assets for each of the five succeeding years is asfollows:
In 2017, the Company and certain of our foreign subsidiaries entered into a Credit Agreement (the "2017 Credit Agreement") with JPMorgan, as administrative agent,Goldman Sachs Bank USA, as syndication agent, Wells Fargo, National Association, U.S. Bank National Association, and HSBC Bank USA, National Association, as co-documentation agents, and the lenders (including JPMorgan) from time to time party thereto.
The 2017 Credit Agreement contains customary representations, warranties and covenants, including, but not limited to, covenants restricting the company’s ability to incurindebtedness and liens and merge or consolidate with another entity. The 2017 Credit Agreement also contains financial covenants, requiring us to maintain a ratio ofconsolidated total indebtedness to consolidated earnings before income, taxes, depreciation and amortization, subject to certain adjustments ("Adjusted EBITDA") of not greaterthan 4.00 to 1, as well as requiring us to maintain a ratio of consolidated Adjusted EBITDA to consolidated interest expense of no less than 3.50 to 1 for the year endedDecember 31, 2018 . The 2017 Credit Agreement also contains a financial covenant requiring us to maintain a senior secured net indebtedness to Adjusted EBITDA ratio of notgreater than 3.50 to 1. These financial covenants may restrict our ability to pay dividends and purchase outstanding shares of our common stock. We were in compliance withour financial covenants at December 31, 2018 .
In October 2018, the Company signed Amendment No. 1 to the 2017 Credit Agreement, which clarified that the adoption of the new lease accounting standard in 2019would have no effect on any financial covenant calculations.
Effective with our fiscal year ended December 31, 2018, we are required to repay the senior credit agreement with 25% to 50% of our excess cash flow from the precedingfiscal year, as defined in the agreement, unless our net leverage ratio for such preceding fiscal year is less than or equal to 3.00 to 1.
Our Senior Notes also contain certain restrictions, which are generally less restrictive than those contained in the 2017 Credit Agreement.
SeniorUnsecuredNotes
On April 18, 2017, we issued and sold $300,000 in aggregate principal amount of our 5.625% Senior Notes due 2025 (the “Notes”), pursuant to an Indenture, dated as ofApril 18, 2017, among the company, the Guarantors (as defined therein), and Wells Fargo Bank, National Association, a national banking association, as trustee. The Notes areguaranteed by Tennant Coatings, Inc., and Tennant Sales and Service Company (collectively, the “Guarantors”), which are wholly-owned subsidiaries of the company. Separatefinancial information of the Guarantors is presented in Note 23.
The Notes will mature on May 1, 2025. Interest on the Notes accrues at the rate of 5.625% per annum and is payable semiannually in cash on each May 1 andNovember 1, commencing on November 1, 2017.
The Notes and the guarantees constitute senior unsecured obligations of the company and the Guarantors, respectively. The Notes and the guarantees, respectively, are:(a) equal in right of payment with all of the company’s and the Guarantors’ senior debt, without giving effect to collateral arrangements; (b) senior in right of payment to all ofthe company’s and the Guarantors’ future subordinated debt, if any; (c) effectively subordinated in right of payment to all of the company’s and the Guarantors’ debt andobligations that are secured, including borrowings under the company’s senior secured credit facilities for so long as the senior secured credit facilities are secured, to the extentof the value of the assets securing such liens; and (d) structurally subordinated in right of payment to all liabilities (including trade payables) of the company’s and theGuarantors’ subsidiaries that do not guarantee the Notes. The Notes also contain customary representations, warranties and covenants, and are less restrictive than thosecontained in the 2017 Credit Agreement.
We used the net proceeds from this offering to refinance a $300,000 term loan under our 2017 Credit Agreement that we borrowed as part of the financing for theacquisition of the IPC Group and to pay related fees and expenses.
The Indenture governing the Notes contains covenants that limit, among other things, our ability and the ability of our restricted subsidiary to incur additional indebtedness(including guarantees thereof); incur or create liens on assets securing indebtedness; make certain restricted payments; make certain investments; dispose of certain assets; allowto exist certain restrictions on the ability of our restricted subsidiaries to pay dividends or make other payments to us; engage in certain transactions with affiliates; andconsolidate or merge with or into other companies. If we experience certain kinds of changes of control, we may be required to repurchase the Notes at a price equal to 101% ofthe principal amount of the Notes, plus accrued and unpaid interest, if any, to, but excluding, the date of repurchase. If we make certain asset sales and do not use the netproceeds for specified purposes, we may be required to offer to repurchase the Notes at a price equal to 100% of the principal amount, plus accrued and unpaid interest, if any,to, but excluding, the date of repurchase.
40
Table of ContentsNOTES TO THE CONSOLIDATED FINANCIAL STATEMENTS
(Inthousands,exceptsharesandpersharedata)
RegistrationRightsAgreement
In connection with the issuance and sale of the Notes, the company entered into a Registration Rights Agreement, dated April 18, 2017, among the company, the Guarantorsand Goldman, Sachs & Co. and J.P. Morgan Securities LLC (the “Registration Rights Agreement”). Pursuant to the Registration Rights Agreement, the company agreed (1) touse its commercially reasonable efforts to consummate an exchange offer to exchange the original Senior Notes for new registered notes (the "Exchange Notes"), with termssubstantially identical in all material respects with the Original Notes (except that the Exchange Notes will not contain terms with respect to additional interest, registration rightsor transfer restrictions) and (2) if required, to have a shelf registration statement declared effective with respect to resales of the Senior Notes.
On January 22, 2018, we commenced the exchange offer required by the Registration Rights Agreement. The exchange offer closed on February 23, 2018. We did not incurany additional indebtedness as a result of the exchange offer. As a result, we were not required to pay additional interest on the Senior Notes.
CapitalLeaseObligations
Capital lease obligations outstanding are primarily related to sale-leaseback transactions with third-party leasing companies whereby we sell our manufactured equipment tothe leasing company and lease it back. The equipment covered by these leases is rented to our customers over the lease term.
Debt outstanding at December 31, consisted of the following:
2018 2017
Bank Borrowings $ 3,926 $ —
Senior Unsecured Notes 300,000 300,000
Credit Facility Borrowings 53,000 80,000
Capital Lease Obligations 2,863 3,279
Unamortized Debt Issuance Costs (4,724) (6,440)
Total Debt 355,065 376,839
Less: Current Maturities of Credit Facility Borrowings, Net of Debt Issuance Costs (1) (27,005) (30,883)
Long-term portion $ 328,060 $ 345,956
(1) Current maturities of debt include $25,927 of current maturities, less $184 of unamortized debt issuance costs, under our 2017 Credit Agreement and $1,262 of currentmaturities of capital lease obligations.
As of December 31, 2018 , we had outstanding borrowings under our Senior Unsecured Notes of $300,000 . We had outstanding borrowings under our 2017 CreditAgreement, totaling $22,000 under our term loan facility and $31,000 under our revolving facility. In addition, we had letters of credit and bank guarantees outstanding in theamount of $3,279 , leaving approximately $165,721 of unused borrowing capacity on our revolving facility. Although we are only required to make a minimum principalpayment of $6,875 during 2019, we have both the intent and the ability to pay an additional $15,125 during 2019. As such, we have classified $22,000 as current maturities oflong-term debt. Commitment fees on unused lines of credit for the year ended December 31, 2018 were $595 . The overall weighted average cost of debt is approximately 5.4%and, net of a related cross-currency swap instrument, is approximately 4.5% . Further details regarding the cross-currency swap instrument are discussed in Note 13.
The aggregate maturities of our outstanding debt, excluding unamortized debt issuance costs, as of December 31, 2018 , are as follows:
Table of ContentsNOTES TO THE CONSOLIDATED FINANCIAL STATEMENTS
(Inthousands,exceptsharesandpersharedata)
12. Other Current Liabilities
Other Current Liabilities as of December 31 consisted of the following:
2018 2017
Other Current Liabilities: Taxes, other than income taxes $ 12,763 $ 14,760
Warranty 13,062 12,676
Deferred revenue 5,021 5,815
Rebates 16,652 13,466
Freight 4,475 3,208
Restructuring 2,248 4,267
Miscellaneous accrued expenses 13,117 10,779
Other 4,557 4,476
Total Other Current Liabilities $ 71,895 $ 69,447
The changes in warranty reserves for the three years ended December 31 were as follows:
2018 2017 2016
Beginning balance $ 12,676 $ 10,960 $ 10,093
Product warranty provision 13,172 12,124 12,413
Acquired warranty obligations — 1,208 42
Foreign currency (172) 274 82
Claims paid (12,614) (11,890) (11,670)
Ending balance $ 13,062 $ 12,676 $ 10,960
13. DerivativesHedgeAccountingandHedgingPrograms
In 2015, we expanded our foreign currency hedging programs to include foreign exchange purchased options and forward contracts to hedge our foreign currencydenominated revenue. We recognize all derivative instruments as either assets or liabilities in our Consolidated Balance Sheets and measure them at fair value. Gains and lossesresulting from changes in fair value are accounted for depending on the use of the derivative and whether it is designated and qualifies for hedge accounting.
We evaluate hedge effectiveness on our hedges that are designated and qualify for hedge accounting at the inception of the hedge prospectively, as well as retrospectively,and record any ineffective portion of the hedging instruments in Net Foreign Currency Transaction Losses on our Consolidated Statements of Operations. The time value ofpurchased contracts is recorded in Net Foreign Currency Transaction Losses in our Consolidated Statements of Operations.
Our hedging policy establishes maximum limits for each counterparty to mitigate any concentration of risk.
Balance Sheet Hedging
HedgesofForeignCurrencyAssetsandLiabilities
We hedge our net recognized foreign currency denominated assets and liabilities with foreign exchange forward contracts to reduce the risk that the value of these assetsand liabilities will be adversely affected by changes in exchange rates. These contracts hedge assets and liabilities that are denominated in foreign currencies and are carried atfair value as either assets or liabilities on the Consolidated Balance Sheets with changes in the fair value recorded to Net Foreign Currency Transaction Losses in ourConsolidated Statements of Operations. These contracts do not subject us to material balance sheet risk due to exchange rate movements because gains and losses on thesederivatives are intended to offset gains and losses on the assets and liabilities being hedged. At December 31, 2018 and December 31, 2017 , the notional amounts of foreigncurrency forward exchange contracts outstanding not designated as hedging instruments were $63,410 and $60,858 , respectively.
During the first quarter of 2017, in connection with our acquisition of IPC Group, we entered into a foreign currency option contract not designated as a hedging instrumentfor a notional amount of €180,000 . The option contract has since expired and there were no outstanding foreign currency option contracts not designated as hedging instrumentsas of December 31, 2018 and December 31, 2017 .
42
Table of ContentsNOTES TO THE CONSOLIDATED FINANCIAL STATEMENTS
(Inthousands,exceptsharesandpersharedata)
Cash Flow Hedging
HedgesofForecastedForeignCurrencyTransactions
In countries outside the U.S., we transact business in U.S. dollars and in various other currencies. We may use foreign exchange option contracts or forward contracts tohedge certain cash flow exposures resulting from changes in these foreign currency exchange rates. These foreign exchange contracts, carried at fair value, have maturities of upto one year . We enter into these foreign exchange contracts to hedge a portion of our forecasted foreign currency denominated revenue in the normal course of business, andaccordingly, they are not speculative in nature. The notional amount of outstanding foreign currency forward contracts designated as cash flow hedges were $0 and $2,928 as ofDecember 31, 2018 and December 31, 2017 , respectively. The notional amount of outstanding foreign currency option contracts designated as cash flow hedges was $8,436 and$8,619 as of December 31, 2018 and December 31, 2017 , respectively.
ForeignCurrencyDerivatives
We use foreign currency exchange rate derivatives to hedge our exposure to fluctuations in exchange rates for anticipated intercompany cash transactions between TennantCompany and its subsidiaries. During 2017, we entered into Euro to U.S. dollar foreign exchange cross currency swaps for all of the anticipated cash flows associated with anintercompany loan from a wholly-owned European subsidiary. We entered into these foreign exchange cross currency swaps to hedge the foreign currency denominated cashflows associated with this intercompany loan, and accordingly, they are not speculative in nature. We designated these cross currency swaps as cash flow hedges. The hedgedcash flows as of December 31, 2018 included €174,000 of total notional value. As of December 31, 2018 , the aggregate scheduled interest payments over the course of the loanand related swaps amounted to €24,000 . The scheduled maturity and principal payment of the loan and related swaps of €150,000 are due in April 2022 . There were no newcross currency swaps designated as cash flow hedges as of December 31, 2018 .
To receive hedge accounting treatment, all hedging relationships are formally documented at the inception of the hedge, and the hedges must be highly effective inoffsetting changes to future cash flows on hedged transactions. We record changes in the fair value of these cash flow hedges in Accumulated Other Comprehensive Loss in ourConsolidated Balance Sheets, until the forecasted transaction occurs. When the forecasted transaction occurs, we reclassify the related gain or loss on the cash flow hedge to NetSales. In the event the underlying forecasted transaction does not occur, or it becomes probable that it will not occur, we reclassify the gain or loss on the related cash flow hedgefrom Accumulated Other Comprehensive Loss to Net Foreign Currency Transaction Losses in our Consolidated Statements of Operations at that time. If we do not elect hedgeaccounting, or the contract does not qualify for hedge accounting treatment, the changes in fair value from period to period are recorded in Net Foreign Currency TransactionLosses in our Consolidated Statements of Operations.
The fair value of derivative instruments on our Consolidated Balance Sheets as of December 31 consisted of the following:
Derivatives not designated as hedging instruments: Foreign currency forward contracts (1) $ 223 $ — $ 442 $ 425
(1) Contracts that mature within the next 12 months are included in Other Current Assets and Other Current Liabilities for asset derivatives and liabilities derivatives,respectively, on our Consolidated Balance Sheets. Contracts with maturities greater than 12 months are included in Other Assets and Other Liabilities for assetderivatives and liability derivatives, respectively, in our Consolidated Balance Sheets. Amounts included in our Consolidated Balance Sheets are recorded net where aright of offset exists with the same derivative counterparty.
As of December 31, 2018 , we anticipate reclassifying approximately $2,367 of gains from Accumulated Other Comprehensive Loss to n et earnings during the next 12months.
43
Table of ContentsNOTES TO THE CONSOLIDATED FINANCIAL STATEMENTS
(Inthousands,exceptsharesandpersharedata)
The effect of foreign currency derivative instruments designated as cash flow hedges and foreign currency derivative instruments not designated as hedges in ourConsolidated Statements of Earnings for the three years ended December 31 were as follows:
2018 2017 2016
ForeignCurrency
OptionContracts
ForeignCurrencyForwardContracts
ForeignCurrency
OptionContracts
ForeignCurrencyForwardContracts
ForeignCurrency
OptionContracts
ForeignCurrencyForwardContracts
Derivatives in cash flow hedging relationships: Net gain (loss) recognized in Other Comprehensive Income (Loss), net oftax (1) $ 100 $ 9,025 $ (193) $ (16,226) $ (259) $ (73)Net (loss) gain reclassified from Accumulated Other Comprehensive Lossinto earnings, net of tax, effective portion to Net Sales (110) (18) (178) (37) (148) 7Net gain reclassified from Accumulated Other Comprehensive Loss inearnings, net of tax, effective portion to Interest Income — 1,870 — 1,198 — —Net gain (loss) reclassified from Accumulated Other Comprehensive Lossinto earnings, net of tax, effective portion to Net Foreign CurrencyTransaction Losses — 6,353 — (12,555) — —
Net gain (loss) recognized in earnings (2) 8 12 (13) 10 (11) 2
Derivatives not designated as hedging instruments: Net loss recognized in earnings (3) $ — $ (2,518) $ — $ (6,161) $ — $ (890)
(1) Net change in the fair value of the effective portion classified in Other Comprehensive Income (Loss).
(2) Ineffective portion and amount excluded from effectiveness testing classified in Net Foreign Currency Transaction Losses.
(3) Classified in Net Foreign Currency Transaction Losses.
14. Fair Value Measurements
Estimates of fair value for financial assets and financial liabilities are based on the framework established in the accounting guidance for fair value measurements. Theframework defines fair value, provides guidance for measuring fair value and requires certain disclosures. The framework discusses valuation techniques, such as the marketapproach (comparable market prices), the income approach (present value of future income or cash flow) and the cost approach (cost to replace the service capacity of an asset orreplacement cost). The framework utilizes a fair value hierarchy that prioritizes the inputs to valuation techniques used to measure fair value into three broad levels. Thefollowing is a brief description of those three levels:
• Level 1: Observable inputs such as quoted prices (unadjusted) in active markets for identical assets or liabilities.
• Level 2: Inputs other than quoted prices that are observable for the asset or liability, either directly or indirectly. These include quoted prices for similar assets orliabilities in active markets and quoted prices for identical or similar assets or liabilities in markets that are not active.
• Level 3: Unobservable inputs that reflect the reporting entity’s own assumptions.
Our population of assets and liabilities subject to fair value measurements at December 31, 2018 is as follows:
Our foreign currency forward exchange and option contracts are valued using observable Level 2 market expectations at the measurement date and standard valuationtechniques to convert future amounts to a single present value amount. Further details regarding our foreign currency forward exchange and option contracts are discussed inNote 13.
The carrying amounts reported in the Consolidated Balance Sheets for Cash and Cash Equivalents, Restricted Cash, Receivables, Other Current Assets, Accounts Payableand Other Current Liabilities approximate fair value due to their short-term nature.
The fair market value of our Long-Term Debt approximates cost based on the borrowing rates currently available to us for bank loans with similar terms and remainingmaturities.
From time to time, we measure certain assets at fair value on a non-recurring basis, including evaluation of long-lived assets, goodwill and other intangible assets, as part ofa business acquisition. These assets are measured and recognized at amounts equal to the fair value determined as of the date of acquisition. Fair value valuations are based onthe information available as of the acquisition date and the expectations and assumptions that have been deemed reasonable by us. There are inherent uncertainties andmanagement judgment required in these determinations. The fair value measurements of assets acquired and liabilities assumed as part of a business acquisition are based onvaluations involving significant unobservable inputs, or Level 3, in the fair value hierarchy.
These assets are also subject to periodic impairment testing by comparing the respective carrying value of each asset to the estimated fair value of the reporting unit or assetgroup in which they reside. In the event we determine these assets to be impaired, we would recognize an impairment loss equal to the amount by which the carrying value of thereporting unit, impaired asset or asset group exceeds its estimated fair value. These periodic impairment tests utilize company-specific assumptions involving significantunobservable inputs, or Level 3, in the fair value hierarchy.
15. Retirement Benefit Plans
Substantially all U.S. employees are covered by various retirement benefit plans, including postretirement medical plans and defined contribution savings plans. Retirementbenefits for eligible employees in foreign locations are funded principally through defined benefit plans, annuity or government programs. The total cost of benefits for our planswas $11,926 , $13,253 and $12,108 in 2018 , 2017 and 2016 , respectively.
We had a qualified, funded defined benefit retirement plan (the “U.S. Pension Plan”) covering certain current and retired employees in the U.S. During 2015, the plan wasamended to freeze benefits for all participants effective January 31, 2017 . On February 15, 2017 , the Board of Directors approved the termination of the U.S. Pension Plan,effective May 15, 2017 . Participants who elected an immediate lump sum distribution were paid out in December 2017. Assets for participants who elected or are currentlyreceiving annuity payments and those who have elected to defer their benefits were transferred to the annuity company, Pacific Life, in December 2017. Excess assets weretransferred from the Tennant Company Pension Trust to the Tennant Company Retirement Savings Plan to deliver future discretionary benefits to plan participants. As ofDecember 31, 2018 , we held excess assets of $6,408 for future discretionary benefit payments.
We have a U.S. postretirement medical benefit plan (the “U.S. Retiree Plan”) to provide certain healthcare benefits for U.S. employees hired before January 1, 1999.Eligibility for those benefits is based upon a combination of years of service with us and age upon retirement.
Our defined contribution savings plan (“401(k)”) covers substantially all U.S. employees. Under this plan, we match up to 3% of the employee’s annual compensation incash to be invested per their election. We also make a profit sharing contribution to the 401(k) plan for employees with more than one year of service in accordance with ourProfit Sharing Plan. This contribution is based upon our financial performance and can be funded in the form of Tennant stock, cash or a combination of both. Expenses for the401(k) plan were $8,073 , $4,404 and $8,359 during 2018 , 2017 and 2016 , respectively.
We have a U.S. nonqualified supplemental benefit plan (the “U.S. Nonqualified Plan”) to provide additional retirement benefits for certain employees whose benefits underour 401(k) plan or U.S. Pension Plan are limited by either the Employee Retirement Income Security Act or the Internal Revenue Code.
We also have defined benefit pension plans in the United Kingdom and Germany (the “U.K. Pension Plan” and the “German Pension Plan”). The U.K. Pension Plan andGerman Pension Plan cover certain current and retired employees and both plans are closed to new participants. In December 2018, the U.K. Pension Plan was amended to closeall future accrual of benefits to existing active members, resulting in a curtailment gain of $165 relating to past service benefits.
We expect to contribute approximately $146 to our U.S. Nonqualified Plan, $779 to our U.S. Retiree Plan, $360 to our U.K. Pension Plan and $34 to our German PensionPlan in 2019 .
45
Table of ContentsNOTES TO THE CONSOLIDATED FINANCIAL STATEMENTS
(Inthousands,exceptsharesandpersharedata)
Weighted-average asset allocations by asset category of the U.K. Pension Plan and the Tennant Company Retirement Savings Plan as of December 31, 2018 are asfollows:
Asset Category Fair Value
Quoted Prices in ActiveMarkets for Identical
Assets(Level 1)
Significant ObservableInputs
(Level 2)
SignificantUnobservable Inputs
(Level 3)
Cash and Cash Equivalents $ 6,408 $ 6,408 $ — $ —
Investment Account held by Pension Plan (1) 10,842 — — 10,842
Total $ 17,250 $ 6,408 $ — $ 10,842
(1) This category is comprised of investments in insurance contracts.
Weighted-average asset allocations by asset category of the U.K. Pension Plan and the Tennant Company Retirement Savings Plan as of December 31, 2017 are asfollows:
Asset Category Fair Value
Quoted Prices in ActiveMarkets for Identical
Assets(Level 1)
Significant ObservableInputs
(Level 2)
SignificantUnobservable Inputs
(Level 3)
Cash and Cash Equivalents $ 6,305 $ 6,305 $ — $ —
Investment Account held by Pension Plan (1) 11,163 — — 11,163
Total $ 17,468 $ 6,305 $ — $ 11,163
(1) This category is comprised of investments in insurance contracts.
Estimates of the fair value of the U.K Pension Plan and the Tennant Company Retirement Savings Plan assets are based on the framework established in the accountingguidance for fair value measurements. A brief description of the three levels can be found in Note 14. The Investment Account held by the U.K. Pension Plan invests ininsurance contracts for purposes of funding the U.K. Pension Plan and is classified as Level 3. The fair value of the Investment Account is the cash surrender values asdetermined by the provider which are the amounts the plan would receive if the contracts were cashed out at year end. The underlying assets held by these contracts areprimarily invested in assets traded in active markets.
A reconciliation of the beginning and ending balances of the Level 3 investments of our U.K. Pension Plan during the years ended December 31 are as follows:
2018 2017
Fair value at beginning of year $ 11,163 $ 9,562
Purchases, sales, issuances and settlements, net (856) (535)
Net gain 1,138 1,190
Foreign currency (603) 946
Fair value at end of year $ 10,842 $ 11,163
The primary objective of our U.K. Pension Plan is to meet retirement income commitments to plan participants at a reasonable cost to us and to maintain a sound actuariallyfunded status. This objective is accomplished through growth of capital and safety of funds invested. Assets are invested in securities to achieve growth of capital over inflationthrough appreciation and accumulation and reinvestment of dividend and interest income. Investments are diversified to control risk. The U.K. Pension Plan is invested ininsurance contracts with underlying investments primarily in equity and fixed income securities. Our German Pension Plan is unfunded, which is customary in that country.
Weighted-average assumptions used to determine benefit obligations as of December 31 are as follows:
U.S. Pension Benefits Non-U.S.
Pension Benefits Postretirement
Medical Benefits
2018 2017 2018 2017 2018 2017
Discount rate 3.95% 3.28% 2.72% 2.45% 3.95% 3.26%
Rate of compensation increase —% —% 3.50% 3.50% — —
46
Table of ContentsNOTES TO THE CONSOLIDATED FINANCIAL STATEMENTS
(Inthousands,exceptsharesandpersharedata)
Weighted-average assumptions used to determine net periodic benefit costs as of December 31 are as follows:
The discount rate is used to discount future benefit obligations back to today’s dollars. Our discount rates were determined based on high-quality fixed income investments.The resulting discount rates are consistent with the duration of plan liabilities. The FTSE (formerly known as Citigroup) Above Median Spot Rates for high-quality corporatebonds are used in determining the discount rate for the U.S. Plans. The expected return on assets assumption on the investment portfolios for the pension plans is based on thelong-term expected returns for the investment mix of assets currently in the portfolio. Management uses historic return trends of the asset portfolio combined with recent marketconditions to estimate the future rate of return.
The accumulated benefit obligations as of December 31 for all defined benefit plans are as follows:
2018 2017
U.S. Pension Plans $ 1,267 $ 1,414
U.K. Pension Plan 9,264 11,131
German Pension Plan 950 1,013
Information for our plans with an accumulated benefit obligation in excess of plan assets as of December 31 is as follows:
2018 2017
Accumulated benefit obligation $ 2,217 $ 2,427
Fair value of plan assets — —
As of December 31, 2018 and 2017 , the U.S. Nonqualified and the German Pension Plans had an accumulated benefit obligation in excess of plan assets.
Information for our plans with a projected benefit obligation in excess of plan assets as of December 31 is as follows:
2018 2017
Projected benefit obligation $ 2,217 $ 2,427
Fair value of plan assets — —
As of December 31, 2018 and 2017 , the U.S. Nonqualified and the German Pension Plans had a projected benefit obligation in excess of plan assets.
Assumed healthcare cost trend rates as of December 31 are as follows:
2018 2017
Healthcare cost trend rate assumption for the next year 6.38% 6.56%
Rate to which the cost trend rate is assumed to decline (the ultimate trend rate) 5.00% 5.00%
Year that the rate reaches the ultimate trend rate 2032 2032
Assumed healthcare cost trend rates have a significant effect on the amounts reported for healthcare plans. To illustrate, a one-percentage-point change in assumedhealthcare cost trends would have the following effects:
1-Percentage-Point
Decrease
1-Percentage-Point
Increase
Effect on total of service and interest cost components $ (26) $ 29
Effect on postretirement benefit obligation $ (599) $ 672
47
Table of ContentsNOTES TO THE CONSOLIDATED FINANCIAL STATEMENTS
(Inthousands,exceptsharesandpersharedata)
Summaries related to changes in benefit obligations and plan assets and to the funded status of our defined benefit and postretirement medical benefit plans areas follows:
U.S. Pension Benefits Non-U.S.
Pension Benefits Postretirement
Medical Benefits
2018 2017 2018 2017 2018 2017
Change in benefit obligation:
Benefit obligation at beginning of year $ 1,414 $ 40,961 $ 12,144 $ 11,136 $ 9,604 $ 10,540
Service cost — — 126 132 45 60
Interest cost 43 1,538 280 298 293 363
Plan participants' contributions — — 13 14 — —
Plan amendments — — 109 — — —
Actuarial loss (gain) 35 1,811 (514) 327 (485) (524)
Net actuarial loss (gain) 35 1,611 633 (1,249) (465) 1,718 (485) (524) 6
Amortization of prior service cost — — (41) (19) — — — — —
Amortization of net actuarial loss (49) (43) (41) (38) (74) (27) — — —
Settlement (49) (6,373) — — — — — — —
Total recognized in other comprehensive (income)loss $ (63) $ (4,805) $ 551 $ (1,197) $ (539) $ 1,691 $ (485) $ (524) $ 6
Total recognized in net benefit cost (credit) andother comprehensive (income) loss $ 78 $ 813 $ 246 $ (1,286) $ (415) $ 1,824 $ (147) $ (101) $ 478
The following benefit payments, which reflect expected future service, are expected to be paid for our U.S. and Non-U.S. plans:
U.S. Pension Benefits Non-U.S.
Pension Benefits Postretirement
Medical Benefits
2019 $ 146 $ 243 $ 779
2020 138 249 830
2021 129 257 752
2022 121 265 755
2023 112 275 715
2024 to 2028 468 1,511 3,424
Total $ 1,114 $ 2,800 $ 7,255
The following amounts are included in Accumulated Other Comprehensive Loss as of December 31, 2018 and are expected to be recognized as components of netperiodic benefit cost during 2019 :
PensionBenefits
PostretirementMedicalBenefits
Net actuarial loss $ 104 $ —
Transition obligation 4 —
49
Table of ContentsNOTES TO THE CONSOLIDATED FINANCIAL STATEMENTS
(Inthousands,exceptsharesandpersharedata)
16. Shareholders' Equity
AuthorizedShares
We are authorized to issue an aggregate of 60,000,000 shares, all of which are designated as Common Stock having a par value of $0.375 per share. The Board of Directorsis authorized to establish one or more series of preferred stock, setting forth the designation of each such series, and fixing the relative rights and preferences of each such series.
AccumulatedOtherComprehensiveLoss
Components of Accumulated Other Comprehensive Loss, net of tax, within the Consolidated Balance Sheets and Consolidated Statements of Equity as ofDecember 31 are as follows:
Other comprehensive (loss) income before reclassifications (16,053) 1,293 9,125 (5,635)
Amounts reclassified from Accumulated Other Comprehensive Loss — 122 (8,095) (7,973)Adjustments to Accumulated Other Comprehensive Loss for disproportionateincome tax effects recognized from the adoption of ASU 2018-02 — (137) (1,126) (1,263)
Net current period other comprehensive (loss) income (16,053) 1,278 (96) (14,871)
Accumulated Other Comprehensive Loss associated with pension and postretirement benefits and cash flow hedges are included in Notes 15 and 13, respectively.
17. Commitments and Contingencies
We lease office and warehouse facilities, vehicles and office equipment under operating lease agreements, which include both monthly and longer-term arrangements.Leases with initial terms of one year or more expire at various dates through 2028 and generally provide for extension options. Rent expense under the leasing agreements(exclusive of real estate taxes, insurance and other expenses payable under the leases) amounted to $23,348 , $21,566 and $18,640 in 2018 , 2017 and 2016 , respectively.
The minimum rentals for aggregate lease commitments as of December 31, 2018 were as follows:
Certain operating leases for vehicles contain residual value guarantee provisions, which would become due at the expiration of the operating lease agreement if the fairvalue of the leased vehicles is less than the guaranteed residual value. The aggregate residual value at lease expiration of those leases is $14,043 , of which we have guaranteed$8,404 . As of December 31, 2018 , we have recorded a liability for the estimated end-of-term loss related to this residual value guarantee of $243 for certain vehicles within ourfleet. Our fleet also contains vehicles we estimate will settle at a gain. Gains on these vehicles will be recognized at the end of the lease term.
50
Table of ContentsNOTES TO THE CONSOLIDATED FINANCIAL STATEMENTS
(Inthousands,exceptsharesandpersharedata)
In the ordinary course of business, we may become liable with respect to pending and threatened litigation, tax, environmental and other matters. While the ultimate resultsof current claims, investigations and lawsuits involving us are unknown at this time, we do not expect that these matters will have a material adverse effect on our consolidatedfinancial position or results of operations. Legal costs associated with such matters are expensed as incurred.
As of December 31, 2018, we hold a note receivable of $5,360 , including accrued interest, on our Consolidated Balance Sheet. There is some uncertainty about thecollectability of this note receivable; however, we are not able to determine an appropriate allowance, if any, as of December 31, 2018.
18. Income TaxesOn December 22, 2017, the Tax Act was signed into law. The Tax Act made broad and complex changes to the U.S. tax code which included a lowering of the U.S. federal
corporate income tax rate from 35% to 21% effective January 1, 2018, accelerated expensing of qualified capital investments for a specific period, limitations of the deductibilityof interest expense and executive compensation, and a transition from a worldwide to a territorial tax system, which required companies to pay a one-time transition tax oncertain unrepatriated earnings from foreign subsidiaries.
ASC 740, IncomeTaxes,requires a company to record the effects of a tax law change in the period of enactment. ASU 2018-05 allowed a company to record a provisionalamount when it did not have the necessary information available, prepared or analyzed in reasonable detail to complete its accounting for the change in the tax law. Themeasurement period ends when the company has obtained, prepared and analyzed the information necessary to finalize its accounting, but could not extend beyond one year. Inthe fourth quarter of 2017, we included a provisional amount for the one-time transition tax on certain unrepatriated earnings. The accounting for the income tax effect of theone-time transition tax on certain unrepatriated earnings was finalized in the third quarter of 2018, impacting the year-to-date overall effective tax rate by (1.3)% . In the fourthquarter of 2017, we remeasured our deferred taxes at the reduced corporate tax rate of 21% and recognized the change as a discrete income tax expense.
The accounting for the remeasurement of the deferred taxes and transition tax was finalized in the third quarter of 2018. Adjustments to the provisional amounts were notmaterial to the consolidated financial statements. The accounting for the income tax effects of the Tax Act is complete as of December 31, 2018.
Income from continuing operations for the three years ended December 31 was as follows:
2018 2017 2016
U.S. operations $ 23,913 $ 7,465 $ 54,018
Foreign operations 11,929 (8,757) 12,473
Total $ 35,842 $ (1,292) $ 66,491
Income tax expense (benefit) for the three years ended December 31 was as follows:
2018 2017 2016
Current:
Federal $ 3,731 $ 2,590 $ 15,962
Foreign 7,030 8,701 3,035
State 1,033 812 1,859
$ 11,794 $ 12,103 $ 20,856
Deferred:
Federal $ (3,135) $ 1,640 $ (472)
Foreign (6,012) (8,699) (434)
State (343) (131) (73)
$ (9,490) $ (7,190) $ (979)
Total:
Federal $ 596 $ 4,230 $ 15,490
Foreign 1,018 2 2,601
State 690 681 1,786
Total Income Tax Expense $ 2,304 $ 4,913 $ 19,877
In general, it is our practice and intention to permanently reinvest the earnings of our foreign subsidiaries and repatriate earnings only when the tax impact is zero or immaterialand that position has not changed following incurring the transition tax under the Tax Act. Accordingly, no deferred taxes have been provided for withholding taxes or othertaxes that would result upon repatriation of our approximately $1,572 of undistributed earnings from foreign subsidiaries to the United States as those earnings continue to bepermanently reinvested.
51
Table of ContentsNOTES TO THE CONSOLIDATED FINANCIAL STATEMENTS
(Inthousands,exceptsharesandpersharedata)
Our effective income tax rate varied from the U.S. federal statutory tax rate for the three years ended December 31 as follows:
2018 2017 2016
Tax at statutory rate 21.0 % 35.0 % 35.0 %
(Decreases) increases in the tax rate from:
State and local taxes, net of federal benefit 1.4 (21.1) 1.7
Effect of foreign operations (4.3) (70.8) (5.5)
Transaction costs (4.2) (226.3) —
Effect of 2017 deferred rate change (1.0) (154.3) —
Transition Tax (1.0) (28.0) —
Effect of changes in valuation allowances 6.6 (126.5) 1.9
Domestic production activities deduction 0.4 28.3 (2.2)
Share-based payments (5.7) 90.4 —
Research & Development credit (3.6) 82.9 (1.3)
Other, net (3.2) 10.2 0.3
Effective income tax rate 6.4 % (380.2)% 29.9 %
Deferred tax assets and liabilities were comprised of the following as of December 31:
2018 2017
Deferred Tax Assets:
Inventories, principally due to changes in inventory reserves $ 3,335 $ 4,757
Employee wages and benefits, principally due to accruals for financial reporting purposes 11,642 11,031
Warranty reserves accrued for financial reporting purposes 2,610 2,578
Receivables, principally due to allowance for doubtful accounts and tax accounting method for equipment rentals 1,728 2,138
Tax loss carryforwards 7,765 11,383
Tax credit carryforwards 4,708 1,575
Other 4,712 3,630
Gross Deferred Tax Assets $ 36,500 $ 37,092
Less: valuation allowance (11,519) (9,691)
Total Net Deferred Tax Assets $ 24,981 $ 27,401
Deferred Tax Liabilities:
Property, Plant and Equipment, principally due to differences in depreciation and related gains 9,882 9,042
Goodwill and Intangible Assets 45,628 60,450
Total Deferred Tax Liabilities $ 55,510 $ 69,492
Net Deferred Tax Liabilities $ (30,529) $ (42,091)
Tax credit carryforwards consist of $1,812 foreign tax credits, $1,268 state tax credits, and $1,628 of Netherlands tax credits. We have non-U.S. cumulative tax losses of$35,593 in various countries. Cumulative losses can be used to offset the income tax liabilities on future income in these countries. $18,649 of these losses have unlimitedcarryforward periods. $16,944 of these losses have a limited carryforward period which must be utilized during 2019 to 2026.
The valuation allowance at December 31, 2018 principally applies to the Netherlands tax loss and tax credit carryforwards, a Sweden tax loss carryforward, and state taxcredit carryforwards that, in the opinion of management, are more likely than not to expire unutilized. However, to the extent that tax benefits related to these carryforwards arerealized in the future, the reduction in the valuation allowance will reduce income tax expense. A valuation allowance for the remaining tax loss carryforwards is not requiredsince it is more likely than not that they will be realized through carryback to taxable income in prior years, future reversals of existing taxable temporary differences and futuretaxable income.
52
Table of ContentsNOTES TO THE CONSOLIDATED FINANCIAL STATEMENTS
(Inthousands,exceptsharesandpersharedata)
A reconciliation of the beginning and ending amount of unrecognized tax benefits is as follows:
2018 2017
Balance at January 1 $ 2,232 $ 2,477
Increases as a result of tax positions taken during a prior period 74 —
Increases as a result of tax positions taken during the current year 370 329
Increase related to prior period tax positions of acquired entities 3,833 236
Decreases relating to settlement with tax authorities — (68)
Reductions as a result of a lapse of the applicable statute of limitations (1,274) (770)
Increases as a result of foreign currency fluctuations 418 28
Balance at December 31 $ 5,653 $ 2,232
Included in the balance of unrecognized tax benefits at December 31, 2018 and 2017 are potential benefits of $5,473 and $1,992 , respectively, that if recognized, wouldaffect the effective tax rate from continuing operations.
We recognize potential accrued interest and penalties related to unrecognized tax benefits as a component of income tax expense. In addition to the liability of $5,653 and$2,232 for unrecognized tax benefits as of December 31, 2018 and 2017 , there was approximately $416 and $482 , respectively, for accrued interest and penalties. To the extentinterest and penalties are not assessed with respect to uncertain tax positions, the amounts accrued will be revised and reflected as an adjustment to income tax expense.
We and our subsidiaries are subject to U.S. federal income tax as well as income tax of numerous state and foreign jurisdictions. We are generally no longer subject to U.S.federal tax examinations for taxable years before 2015 and, with limited exceptions, state and foreign income tax examinations for taxable years before 2014.
The Internal Revenue Service completed its examination of the U.S. income tax return for the 2015 tax year during the third quarter of 2018. The IRS's adjustments tocertain tax positions were not material. We are currently undergoing income tax examinations in various state and foreign jurisdictions covering 2014 to 2016 . Although thefinal outcome of these examinations cannot be currently determined, we believe that we have adequate reserves with respect to these examinations.
We do not anticipate that total unrecognized tax benefits will change significantly within the next 12 months.
19. Share-Based Compensation
We have four plans under which we have awarded share-based compensation grants: The 1997 Non-Employee Directors Option Plan ("1997 Plan"), which provided forstock option grants to our non-employee Directors, the 2007 Stock Incentive Plan (“2007 Plan”), the Amended and Restated 2010 Stock Incentive Plan, as Amended (“2010Plan”) and the 2017 Stock Incentive Plan ("2017 Plan"), which were adopted as a continuing step toward aggregating our equity compensation programs to reduce thecomplexity of our equity compensation programs.
The 2010 Plan, originally approved by our shareholders on April 28, 2010 and amended and restated by our shareholders on April 25, 2012, terminated our rights to grantawards under the 2007 Plan; however, any awards granted under the 2007 or 2010 Plans that do not result in the issuance of shares of Common Stock may again be used for anaward under the 2010 Plan. The 2010 Plan was amended and restated by our shareholders on April 24, 2013, increasing the number of shares available under the amended 2010Plan from 1,500,000 shares to 2,600,000 shares.
The 2017 Plan approved by our shareholders on April 26, 2017 terminated our rights to grant awards under previous plans; however, any awards granted under previousplans that do not result in the issuance of shares of Common Stock may again be used for an award under the 2017 Plan. There were 1,200,000 shares made available under theapproved 2017 Plan.
As of December 31, 2018 , there were 897,315 shares reserved for issuance under the 2007 Plan and the 2010 Plan for outstanding compensation awards. There were761,382 shares available for issuance under the 2017 Plan for current and future equity awards as of December 31, 2018. The Compensation Committee of the Board ofDirectors determines the number of shares awarded and the grant date, subject to the terms of our equity award policy.
We recognized total Share-Based Compensation Expense of $8,314 , $5,891 and $3,875 , respectively, during the years ended 2018 , 2017 and 2016 . The total excess taxbenefit recognized for share-based compensation arrangements during the years ended 2018 , 2017 and 2016 was $2,060 , $1,168 and $686 , respectively.
53
Table of ContentsNOTES TO THE CONSOLIDATED FINANCIAL STATEMENTS
(Inthousands,exceptsharesandpersharedata)
Stock Option Awards
We determined the fair value of our stock option awards using the Black-Scholes valuation model that uses the assumptions noted in the table below. The expected termselected for stock options granted during the year represents the period of time that the stock options are expected to be outstanding based on historical data of stock optionholder exercise and termination behavior of similar grants. The risk-free interest rate for periods within the contractual life of the stock option is based on the U.S. Treasury rateover the expected life at the time of grant. Expected volatilities are based upon historical volatility of our stock over a period equal to the expected life of each stock option grant.Dividend yield is estimated over the expected life based on our dividend policy and historical dividends paid. To determine the amount of compensation cost to be recognized ineach period, we account for forfeitures as they occur.
The following table illustrates the valuation assumptions used for the 2018 , 2017 and 2016 grants:
New stock option awards granted vest one-third each year over a three year period and have a ten year contractual term. Compensation expense equal to the grant date fairvalue is recognized for these awards on a straight-line basis over the awards' vesting period. Stock options granted to employees are subject to accelerated expensing if the optionholder meets the retirement definition set forth in the 2017 and 2010 Plans.
The following table summarizes the activity during the year ended December 31, 2018 for stock option awards:
Shares Weighted-Average
Exercise Price
Outstanding at beginning of year 1,135,608 $ 47.47
Granted 202,623 67.85
Exercised (223,352) 26.33
Forfeited (30,312) 66.06
Outstanding at end of year 1,084,567 $ 55.11
Exercisable at end of year 711,499 $ 48.94
The weighted-average grant date fair value of stock options granted during the years ended December 31, 2018 , 2017 and 2016 was $16.07 , $16.39 and $13.61 ,respectively. The total intrinsic value of stock options exercised during the years ended December 31, 2018 , 2017 and 2016 was $10,305 , $4,450 and $3,408 , respectively. Theaggregate intrinsic value of options outstanding and exercisable at December 31, 2018 was $5,987 . The weighted-average remaining contractual life for options outstanding andexercisable as of December 31, 2018 was 5.9 years and 4.5 years , respectively. As of December 31, 2018 , there was unrecognized compensation cost for nonvested options of$1,944 , which is expected to be recognized over a weighted-average period of 1.3 years .
Restricted Share Awards
Restricted share awards for employees generally have a three year vesting period from the effective date of the grant. Restricted share awards to non-employee directorsvest upon a change of control or upon termination of service as a director occurring at least six months after grant date of the award so long as termination is for one of thefollowing reasons: death; disability; retirement in accordance with Tennant policy (e.g., age, term limits, etc.); resignation at request of Board (other than for gross misconduct);resignation following at least six months’ advance notice; failure to be renominated (unless due to unwillingness to serve) or reelected by shareholders; or removal byshareholders. We use the closing share price the day before the grant date to determine the fair value of our restricted share awards. Expenses on these awards are recognizedover the vesting period.
54
Table of ContentsNOTES TO THE CONSOLIDATED FINANCIAL STATEMENTS
(Inthousands,exceptsharesandpersharedata)
The following table summarizes the activity during the year ended December 31, 2018 for nonvested restricted share awards:
Shares Weighted-Average
Grant Date Fair Value
Nonvested at beginning of year 99,789 $ 53.11
Granted 16,377 67.70
Vested (14,384) 68.00
Forfeited (1,561) 67.39
Nonvested at end of year 100,221 $ 53.52
The total fair value of restricted stock units vested during the years ended December 31, 2018 , 2017 and 2016 was $978 , $1,463 and $1,970 , respectively. As ofDecember 31, 2018 , there was $1,196 of total unrecognized compensation cost related to nonvested restricted stock units which is expected to be recognized over a weighted-average period of 1.6 years .
Performance Share Awards
We grant performance share awards to key employees as a part of our long-term management compensation program. These awards are earned based upon achievement ofcertain financial performance targets over a three year period. The number of shares of common stock a participant receives will be increased (up to 200 percent of target levels)or reduced (down to zero ) based on the level of achievement of the financial performance targets. We use the closing share price the day before the grant date to determine thefair value of our performance share awards. Expenses on these awards are recognized over a three year performance period. Performance shares are granted in restricted stockunits. They are payable in stock and vest solely upon achievement of certain financial performance targets during this three year period.
The following table summarizes the activity during the year ended December 31, 2018 for nonvested performance share awards:
Shares Weighted-Average
Grant Date Fair Value
Nonvested at beginning of year 123,024 $ 63.09
Granted 47,997 67.84
Forfeited (43,974) 66.23
Nonvested at end of year 127,047 $ 63.80
The total fair value of performance shares vested during the years ended December 31, 2017 and 2016 was $1,240 and $1,703 , respectively. No performance shares vestedduring the year ended December 31, 2018 . As of December 31, 2018 , we expect to recognize $3,287 of total compensation costs over a weighted-average period of 1.8 years .
Restricted Stock Units
We grant restricted stock units to employees and non-employee directors, which generally vest within three years from the date of the grant. Vested restricted stock units arepaid out in stock. We use the closing share price the day before the grant date to determine the fair value of our restricted stock units. Expenses on these awards are recognizedon a straight-line basis over the vesting period of the award.
The following table summarizes the activity during the year ended December 31, 2018 for nonvested restricted stock units:
Shares Weighted-Average
Grant Date Fair Value
Nonvested at beginning of year 43,125 $ 64.67
Granted 83,380 66.83
Vested (15,427) 58.27
Forfeited (9,123) 66.60
Nonvested at end of year 101,955 $ 67.23
The total fair value of shares vested during the years ended December 31, 2018 and 2017 was $899 and $962 , respectively. As of December 31, 2018 , there was $4,473 oftotal unrecognized compensation cost related to nonvested shares which is expected to be recognized over a weighted-average period of 2.0 years .
55
Table of ContentsNOTES TO THE CONSOLIDATED FINANCIAL STATEMENTS
(Inthousands,exceptsharesandpersharedata)
Share-Based Liabilities
As of December 31, 2018 and 2017 , we had $213 and $175 in total share-based liabilities recorded on our Consolidated Balance Sheets, respectively. During the yearsended December 31, 2018 , 2017 and 2016 , we paid out $32 , $45 and $62 related to share-based liability awards, respectively.
20. Earnings (Loss) Attributable to Tennant Company Per Share
The computations of Basic and Diluted Earnings (Loss) Attributable to Tennant Company per Share for the years ended December 31 were as follows:
2018 2017 2016
Numerator:
Net Earnings (Loss) Attributable to Tennant Company $ 33,412 $ (6,195) $ 46,614
Denominator:
Basic - Weighted Average Shares Outstanding 17,940,438 17,695,390 17,523,267
Effect of dilutive securities 398,131 — 452,916
Diluted - Weighted Average Shares Outstanding 18,338,569 17,695,390 17,976,183
Excluded from the dilutive securities shown above were options to purchase and shares to be paid out under share-based compensation plans of 293,356 , 711,212 and356,598 shares of common stock during 2018 , 2017 and 2016 , respectively. These exclusions were made if the exercise prices of these options are greater than the averagemarket price of our common stock for the period, if the number of shares we can repurchase under the treasury stock method exceeds the weighted shares outstanding in theoptions or if we have a net loss, as the effects are anti-dilutive.
21. Segment Reporting
We are organized into four operating segments: North America; Latin America; Europe, Middle East, Africa; and Asia Pacific. We combine our North America and LatinAmerica operating segments into the "Americas" for reporting net sales by geographic area. In accordance with the objective and basic principles of the applicable accountingguidance, we aggregate our operating segments into one reportable segment that consists of the design, manufacture and sale of products used primarily in the maintenance ofnonresidential surfaces.
The following table presents Net Sales by geographic area for the years ended December 31:
2018 2017 2016
Net Sales:
Americas $ 690,996 $ 640,274 $ 607,026
Europe, Middle East, Africa 335,603 273,738 129,046
Asia Pacific 96,912 89,054 72,500
Total $ 1,123,511 $ 1,003,066 $ 808,572
The following table presents long-lived assets by geographic area as of December 31:
2018 2017 2016
Long-lived assets:
Americas $ 118,609 $ 132,659 $ 134,737
Europe, Middle East, Africa 385,659 422,338 19,606
Asia Pacific 4,145 4,731 4,334
Total $ 508,413 $ 559,728 $ 158,677
Accounting policies of the operations in the various operating segments are the same as those described in Note 1. Net Sales are attributed to each operating segment basedon the end user country and are net of intercompany sales. No single customer represents more than 10% of our consolidated Net Sales.
Long-lived assets consist of Property, Plant and Equipment, Goodwill, Intangible Assets and certain other assets. Long-lived assets located in Italy totaled $355,460 and$393,917 , respectively, at December 31, 2018 and 2017, as a result of our acquisition of IPC Group. We did not have long-lived assets located
56
Table of ContentsNOTES TO THE CONSOLIDATED FINANCIAL STATEMENTS
(Inthousands,exceptsharesandpersharedata)
in Italy for 2016. There are no other individual foreign locations which have long-lived assets which represent more than 10% of our consolidated long-lived assets.
The following table presents revenues for groups of similar products and services for the years ended December 31:
Net Earnings Attributable to Tennant Company 3,274 12,744 9,676 7,717
Basic Earnings Attributable to Tennant Company per Share $ 0.18 $ 0.71 $ 0.54 $ 0.43
Diluted Earnings Attributable to Tennant Company per Share $ 0.18 $ 0.69 $ 0.52 $ 0.42
(a) Amounts have been revised for misclassifications between Cost of Sales and Selling and Administrative Expense. See Note 3 for further information. Gross Profit wasreduced by $1,521, $1,574, and $1,576 for Q1 2018, Q2 2018 and Q3 2018, respectively, and Selling and Administrative Expense was decreased by the same amountsduring those periods.
Net (Loss) Earnings Attributable to Tennant Company (3,957) (2,591) 3,559 (3,206)
Basic (Loss) Earnings Attributable to Tennant Company per Share $ (0.22) $ (0.15) $ 0.20 $ (0.18)
Diluted (Loss) Earnings Attributable to Tennant Company per Share $ (0.22) $ (0.15) $ 0.20 $ (0.18)
(a) Amounts have been revised for misclassifications between Cost of Sales and Selling and Administrative Expense. See Note 3 for further information. Gross Profit wasreduced by $1,424, $1,523, and $1,661 for Q2 2017, Q3 2017 and Q4 2017, respectively, and Selling and Administrative Expense was decreased by the same amountsduring those periods.
The summation of quarterly data may not equate to the calculation for the full fiscal year as quarterly calculations are performed on a discrete basis.
Regular quarterly dividends aggregated to $0.85 per share in 2018 , or $0.21 per share for the first three quarters and $0.22 per share for the last quarter of 2018, and $0.84per share in 2017 , or $0.21 per share per quarter.
23. Separate Financial Information of Guarantor Subsidiaries
The following condensed consolidated guarantor financial information is presented to comply with the requirements of Rule 3-10 of Regulation S-X.
On April 18, 2017 , we issued and sold $300,000 in aggregate principal amount of our 5.625% Senior Notes due 2025 (the “Notes”), pursuant to an Indenture, dated as ofApril 18, 2017, among the company, the Guarantors (as defined below), and Wells Fargo Bank, National Association, a national banking association, as trustee. The Notes areunconditionally and jointly and severally guaranteed by Tennant Coatings, Inc. and Tennant Sales and Service Company (collectively, the “Guarantors” or "GuarantorSubsidiaries"), which are wholly-owned subsidiaries of the company.
The Notes and the guarantees constitute senior unsecured obligations of the company and the Guarantors, respectively. The Notes and the guarantees, respectively, are:
(a) equal in right of payment with all of the company’s and the Guarantors’ senior debt, without giving effect to collateral arrangements; (b) senior in right of payment to all ofthe company’s and the Guarantors’ future subordinated debt, if any; (c) effectively subordinated in right of payment to all of the
57
Table of ContentsNOTES TO THE CONSOLIDATED FINANCIAL STATEMENTS
(Inthousands,exceptsharesandpersharedata)
company’s and the Guarantors’ debt and obligations that are secured, including borrowings under the company’s senior secured credit facilities for so long as the senior securedcredit facilities are secured, to the extent of the value of the assets securing such liens; and (d) structurally subordinated in right of payment to all liabilities (including tradepayables) of the company’s and the Guarantors’ subsidiaries that do not guarantee the Notes.
The following condensed consolidated financial information presents the Condensed Consolidated Statements of Earnings, Comprehensive Income and Cash Flows for eachof the years in the three year period ended December 31, 2018 , and the related Condensed Consolidated Balance Sheets as of December 31, 2018 and 2017 , of TennantCompany ("Parent"), the Guarantor Subsidiaries on a combined basis, the Non-Guarantor Subsidiaries on a combined basis and elimination entries necessary to consolidate theParent with the Guarantor and Non-Guarantor Subsidiaries. The following condensed consolidated financial statements should be read in conjunction with the consolidatedfinancial statements of the company and notes thereto of which this note is an integral part.
Condensed Consolidated Statement of EarningsFor the year ended December 31, 2018
Total Equity 298,474 95,611 337,952 (433,563) 298,474
Total Liabilities and Total Equity $ 917,547 $ 261,182 $ 745,838 $ (930,590) $ 993,977
63
Table of ContentsNOTES TO THE CONSOLIDATED FINANCIAL STATEMENTS
(Inthousands,exceptsharesandpersharedata)
Condensed Consolidated Statement of Cash FlowsFor the year ended December 31, 2018
(in thousands) Parent Guarantor
Subsidiaries Non-Guarantor
Subsidiaries Eliminations Total Tennant
Company
OPERATING ACTIVITIES Net Cash Provided by Operating Activities $ 68,082 $ 1,202 $ 10,888 $ (202) $ 79,970
INVESTING ACTIVITIES Purchases of Property, Plant and Equipment (6,832) (99) (11,849) — (18,780)
Proceeds from Disposals of Property, Plant and Equipment 21 — 91 — 112Proceeds from Principal Payments Received on Long-Term NoteReceivable — — 1,416 — 1,416
Proceeds from Sale of Business — — 4,000 — 4,000
Purchases of Intangible Asset (2,500) — (275) — (2,775)
Change in Investments in Subsidiaries (15,622) — — 15,622 —
Loan Payments Received by Parent from Subsidiary 1,218 — — (1,218) —
Loan Payments Received by Subsidiary from Parent — — 1,778 (1,778) —
Net Cash Used in Investing Activities (23,715) (99) (4,839) 12,626 (16,027)
Loan Repayments made to Parent from Subsidiary — — (1,218) 1,218 —
Loan Repayments made to Subsidiary from Parent (1,778) — — 1,778 —
Change in Subsidiary Equity — — 15,622 (15,622) —
Proceeds from Issuance of Long-Term Debt 11,000 — — — 11,000
Payments of Long-Term Debt (38,000) — (255) — (38,255)
Change in Capital Lease Obligations — — 14 — 14
Proceeds from Issuances of Common Stock 5,880 — — — 5,880
Dividends Paid (15,343) — (202) 202 (15,343)
Net Cash (Used in) Provided by Financing Activities (38,241) — 17,887 (12,424) (32,778)Effect of Exchange Rate Changes on Cash, Cash Equivalents andRestricted Cash 184 — (4,266) — (4,082)
NET INCREASE IN CASH, CASH EQUIVALENTS ANDRESTRICTED CASH 6,310 1,103 19,670 — 27,083
Cash, Cash Equivalents and Restricted Cash at Beginning of Year 18,469 507 40,075 — 59,051
CASH, CASH EQUIVALENTS AND RESTRICTED CASH ATEND OF YEAR $ 24,779 $ 1,610 $ 59,745 $ — $ 86,134
64
Table of ContentsNOTES TO THE CONSOLIDATED FINANCIAL STATEMENTS
(Inthousands,exceptsharesandpersharedata)
Condensed Consolidated Statement of Cash FlowsFor the year ended December 31, 2017
(in thousands) Parent Guarantor
Subsidiaries Non-Guarantor
Subsidiaries Eliminations Total Tennant
Company
OPERATING ACTIVITIES Net Cash Provided by Operating Activities $ 26,992 $ 280 $ 27,711 $ (809) $ 54,174
INVESTING ACTIVITIES Purchases of Property, Plant and Equipment (9,558) — (10,879) — (20,437)
Proceeds from Disposals of Property, Plant and Equipment 23 1 2,487 — 2,511Proceeds from Principal Payments received on Long-Term NoteReceivable — — 667 — 667
Acquisition of Businesses, Net of Cash Acquired (304) — (353,769) — (354,073)
Issuance of Long-Term Note Receivable — — (1,500) — (1,500)
Purchase of Intangible Asset (2,500) — — — (2,500)
Change in Investments in Subsidiaries (199,028) — — 199,028 —
Loan Borrowings (Payments) from Subsidiaries (159,780) — (4,983) 164,763 —
Net Cash (Used in) Provided by Investing Activities (371,147) 1 (367,977) 363,791 (375,332)
Change in Subsidiary Entity — 3,570 16,024 (19,594) —
Payments of Long-Term Debt (3,429) — (31) — (3,460)
Proceeds from Issuance of Long-Term Debt 15,000 — — — 15,000
Purchases of Common Stock (12,762) — — — (12,762)
Proceeds from Issuances of Common Stock 5,271 — — — 5,271
Excess Tax Benefit on Stock Plans 686 — — — 686
Dividends Paid (14,293) — (598) 598 (14,293)
Net Cash (Used in) Provided by Financing Activities (9,527) 11,539 (1,264) (10,306) (9,558)
Effect of Exchange Rate Changes on Cash and Cash Equivalents 63 — (1,213) — (1,150)
NET INCREASE IN CASH, CASH EQUIVALENTS ANDRESTRICTED CASH 2,649 226 3,736 — 6,611
Cash, Cash Equivalents and Restricted Cash at Beginning of Year 35,835 — 16,104 — 51,939
CASH, CASH EQUIVALENTS AND RESTRICTED CASH ATEND OF YEAR $ 38,484 $ 226 $ 19,840 $ — $ 58,550
24. Subsequent Event
On September 4, 2018, we signed a definitive agreement to acquire 100% of the outstanding capital stock of Hefei Gaomei Cleaning Machines Co., Ltd. and 99% of theoutstanding capital stock of Anhui Rongen Environmental Protection Technology Co., Ltd. (collectively "Gaomei"), privately held designers and manufacturers of commercialcleaning solutions based in China. The acquisition closed on January 4, 2019. The purchase price includes cash and contingent consideration which will be paid out over the nextfew years. The purchase price and net assets acquired are not significant to our consolidated financial statements.
ITEM 9 – Changes in and Disagreements with Accountants onAccounting and Financial Disclosure
None.
ITEM 9A – Controls and Procedures
Disclosure Controls and Procedures
Our management, including our Chief Executive Officer and Principal Financialand Accounting Officer, have conducted an evaluation of the effectiveness of thedesign and operation of our disclosure controls and procedures (as defined in Rule13a-15(e) under the Securities Exchange Act of 1934, as amended (the ExchangeAct)) as of December 31, 2018. Based on that evaluation, our Chief Executive Officerand Principal Financial and Accounting Officer concluded that, as of December 31,2018, our disclosure controls and procedures were effective.
For purposes of Rule 13a-15(e), the term disclosure controls and proceduresmeans controls and other procedures of an issuer that are designed to ensure thatinformation required to be disclosed by the issuer in the reports that it files or submitsunder the Exchange Act (15 U.S.C. 78a et seq.) is recorded, processed, summarizedand reported within the time periods specified in the SEC’s rules and forms.Disclosure controls and procedures include, without limitation, controls andprocedures designed to ensure that information required to be disclosed by an issuer inthe reports that it files or submits under the Exchange Act is accumulated andcommunicated to the issuer’s management, including its Chief Executive Officer andPrincipal Financial and Accounting Officer, or persons performing similar functions,as appropriate to allow timely decisions regarding required disclosure.
Management’s Report on Internal Control over Financial Reporting
66
Table of Contents
Our management is responsible for establishing and maintaining adequateinternal control over financial reporting, as such term is defined in Rule 13a-15(f)under the Exchange Act.
The Company’s internal control over financial reporting is a process designed toprovide reasonable assurance regarding the reliability of financial reporting and thepreparation of financial statements for external purposes in accordance with generallyaccepted accounting principles. A company’s internal control over financial reportingincludes those policies and procedures that:
(i) Pertain to the maintenance of records that, in reasonable detail, accurately andfairly reflect the transactions and dispositions of the assets of the company;
(ii) Provide reasonable assurance that transactions are recorded as necessary topermit preparation of financial statements in accordance with generallyaccepted accounting principles, and that receipts and expenditures of thecompany are being made only in accordance with authorizations ofmanagement and directors of the company; and
(iii) Provide reasonable assurance regarding prevention or timely detection ofunauthorized acquisition, use or disposition of the company’s assets that couldhave a material effect on the financial statements.
Because of its inherent limitations, internal control over financial reporting maynot prevent or detect misstatements. Also, projections of any evaluation ofeffectiveness to future periods are subject to the risk that controls may becomeinadequate because of changes in conditions, or that the degree of compliance with thepolicies or procedures may deteriorate.
A material weakness is a deficiency, or combination of deficiencies, in internalcontrol over financial reporting such that there is a reasonable possibility that amaterial misstatement of the Company’s annual or interim financial statements willnot be prevented or detected on a timely basis.
Under the supervision of the Audit Committee of the Board of Directors and withthe participation of our management, including our Chief Executive Officer andPrincipal Financial and Accounting Officer, we conducted an evaluation of theeffectiveness of our internal control over financial reporting using the criteriaestablished in Internal Control - Integrated Framework (2013) issued by theCommittee of Sponsoring Organizations of the Treadway Commission (COSO).Based on our assessment and those criteria, our Chief Executive Officer and PrincipalFinancial and Accounting Officer concluded that our internal control over financialreporting was effective as of December 31, 2018.
KPMG, LLP, an independent registered public accounting firm, has audited theeffectiveness of the Company's internal control over financial reporting as ofDecember 31, 2018 and has issued a report which is included in Item 8 of this AnnualReport on Form 10-K.
Changes in Internal Control Over Financial Reporting
We have completed our testing of the operating effectiveness of internal controlover financial reporting of our acquired entity, IPC Group. There were no significantchanges in the Company's internal control over financial reporting during the quarterended December 31, 2018 that have materially affected, or are reasonably likely tomaterially affect, the Company's internal control over financial reporting.
ITEM 9B – Other Information
None.
PART IIIITEM 10 – Directors, Executive Officers and CorporateGovernance
Information required under this item with respect to directors is contained in thesections entitled “Board of Directors” and “Section 16(a) Beneficial OwnershipReporting Compliance” as part of our 2019 Proxy Statement and is incorporatedherein by reference. See also Item 1, Executive Officers of the Registrant in Part Ihereof.
Business Ethics Guide
We have adopted the Tennant Company Business Ethics Guide, which applies toall of our employees, directors, consultants, agents and anyone else acting on ourbehalf. The Business Ethics Guide includes particular provisions applicable to oursenior financial management, which includes our Chief Executive Officer, ChiefFinancial Officer, Controller and other employees performing similar functions. Acopy of our Business Ethics Guide is available on the Investor Relations website atinvestors.tennantco.com. We intend to post on our website any amendment to, orwaiver from, a provision of our Business Ethics Guide that applies to our PrincipalExecutive Officer, Principal Financial Officer, Principal Accounting Officer,Controller and other persons performing similar functions promptly following the dateof such amendment or waiver. In addition, we have also posted copies of ourCorporate Governance Principles and the Charters for our Audit, Compensation,Governance and Executive Committees on our website.
ITEM 11 – Executive Compensation
Information required under this item is contained in the sections entitled“Director Compensation," “Executive Compensation Information,” and "Pay Ratio" aspart of our 2019 Proxy Statement and is incorporated herein by reference.
ITEM 12 – Security Ownership of Certain Beneficial Ownersand Management and Related Shareholder Matters
Information required under this item is contained in the section entitled “SecurityOwnership of Certain Beneficial Owners and Management” as part of our 2019 ProxyStatement and is incorporated herein by reference. The section entitled "EquityCompensation Plan Information" can be found within Item 5, MarketforRegistrant'sCommon Equity, Related Shareholder Matters and Issuer Purchases of EquitySecuritiesin Part II hereof.
ITEM 13 – Certain Relationships and Related Transactions, andDirector Independence
Information required under this item is contained in the sections entitled“Director Independence” and “Related-Person Transaction Approval Policy” as part ofour 2019 Proxy Statement and is incorporated herein by reference.
ITEM 14 – Principal Accountant Fees and Services
Information required under this item is contained in the section entitled “FeesPaid to Independent Registered Public Accounting Firm” as part of our 2019 ProxyStatement and is incorporated herein by reference.
67
Table of Contents
PART IVITEM 15 – Exhibits and Financial Statement Schedules
A. The following documents are filed as a part of this report:
1. Financial Statements
Consolidated Financial Statements filed as part of this report are contained in Item 8 of this annual report on Form 10-K.
2. Financial Statement Schedule
Schedule II - Valuation and Qualifying Accounts
(In thousands) 2018 2017 2016
Allowance for Doubtful Accounts: Balance at beginning of year $ 2,428 $ 2,570 $ 2,929 Charged to costs and expenses 375 1,183 649 Reclassification (1) 772 (526) — Charged to other accounts (2) (222) 80 (4) Deductions (3) (837) (879) (1,004)
Balance at end of year $ 2,516 $ 2,428 $ 2,570
Sales Returns Reserve: Balance at beginning of year $ 813 $ 538 (5) $ 686 (5)
Charged to costs and expenses 688 419 (5) (88) (5)
Charged to other accounts (2) 10 31 (5) (15) (5)
Deductions (3) (198) (175) (5) (45) (5)
Balance at end of year $ 1,313 $ 813 (5) $ 538 (5)
Inventory Reserves: Balance at beginning of year $ 4,107 $ 3,644 $ 3,540 Charged to costs and expenses 1,916 1,698 1,455 Charged to other accounts (2) (139) 183 (50) Deductions (4) (246) (1,418) (1,301)
Balance at end of year $ 5,638 $ 4,107 $ 3,644
Valuation Allowance for Deferred Tax Assets: Balance at beginning of year $ 9,691 $ 6,865 $ 5,884 Charged to costs and expenses 2,373 1,634 1,295 Charged to other accounts (2) (545) 1,192 (314)
Balance at end of year $ 11,519 $ 9,691 $ 6,865
(1) Includes amount reclassified between Allowance for Doubtful Accounts and Other Receivables related to a customer's open receivables balance which was resolved in2018, as well as acquisition-related adjustments.
(2) Primarily includes impact from foreign currency fluctuations.
(3) Includes accounts determined to be uncollectible and charged against reserves, net of collections on accounts previously charged against reserves.
(4) Includes inventory identified as excess, slow moving or obsolete and charged against reserves.
(5) These balances were included in the Allowance for Doubtful Accounts in 2017 and 2016. Due to the adoption of ASC 606, the Sales Returns Reserve is now includedin Other Current Liabilities. Please see Note 2 for further discussion.
All other schedules are omitted because they are not applicable or the required information is shown in the Consolidated Financial Statements or notes thereto.
68
Table of Contents
3. Exhibits
Item # Description Method of Filing
2.1
Share Purchase Agreement dated as of February 22, 2017, among TennantCompany, Ambienta SGR S.p.A., Federico De Angelis, Pietro CorsanoAnnibaldi, Antonio Perosa and Giulio Vernazza
Incorporated by reference to Exhibit 2.1 to the Company's Current Reporton Form 8-K filed February 28, 2017.
3.1 Restated Articles of Incorporation Incorporated by reference to Exhibit 3i to the Company’s Form 10-Q forthe quarter ended June 30, 2006.
3.2 Amended and Restated By-Laws Incorporated by reference to Exhibit 3iii to the Company’s Current Reporton Form 8-K dated December 14, 2010.
3.3
Articles of Amendment of Restated Articles of Incorporation of TennantCompany
Incorporated by reference to Exhibit 3iii to the Company's Form 10-Q forthe quarter ended March 31, 2018.
4.1
Indenture dated as of April 18, 2017
Incorporated by reference to Exhibit 4.1 to the Company's Current Reporton Form 8-K filed April 24, 2017.
4.2
Registration Rights Agreement dated April 18, 2017
Incorporated by reference to Exhibit 4.2 to the Company's Current Reporton Form 8-K filed April 24, 2017.
4.3
Form 5.625% Senior Note due 2025
Incorporated by reference to Exhibit 4(b)(1) to the Company's RegistrationStatement on Form S-4 filed January 8, 2018.
10.1 Tennant Company Executive Nonqualified Deferred Compensation Plan,as restated effective January 1, 2009, as amended*
Incorporated by reference to Exhibit 10.1 to the Company’s Form 10-Q forthe quarter ended September 30, 2012.
10.2 Form of Amended and Restated Management Agreement and ExecutiveEmployment Agreement*
Incorporated by reference to Exhibit 10.3 to the Company's Form 10-K forthe year ended December 31, 2011.
10.3 Schedule of parties to Management and Executive Employment Agreement
Filed herewith electronically.
10.4 Tennant Company Non-Employee Director Stock Option Plan (as amendedand restated effective May 6, 2004)*
Incorporated by reference to Exhibit 10.6 to the Company’s Form 10-Q forthe quarter ended June 30, 2004.
10.5 Tennant Company Amended and Restated 1999 Stock Incentive Plan*
Incorporated by reference to Appendix A to the Company’s ProxyStatement for the 2006 Annual Meeting of Shareholders filed on March 15,2006.
10.6 Tennant Company 2007 Stock Incentive Plan* Incorporated by reference to Appendix A to the Company’s ProxyStatement for the 2007 Annual Meeting of Shareholders filed on March 15,2007.
10.7
Deferred Stock Unit Agreement (awards in and after 2008)*
Incorporated by reference to Exhibit 10.17 to the Company's Form 10-Kfor the year ended December 31, 2007.
10.8 Tennant Company 2014 Short-Term Incentive Plan*
Incorporated by reference to Appendix B to the Company's ProxyStatement for the 2013 Annual Meeting of Shareholders filed on March 11,2013.
10.9 Amended and Restated 2010 Stock Incentive Plan, as Amended* Incorporated by reference to Appendix A to the Company's ProxyStatement for the 2013 Annual Meeting of Shareholders filed on March 11,2013.
10.10
Credit Agreement dated as of April 4, 2017
Incorporated by reference to Exhibit 10.1 to the Company's Current Reporton Form 8-K filed April 5, 2017.
10.11
2017 Stock Incentive Plan
Incorporated by reference to Appendix A on the Company's ProxyStatement for the 2017 Annual Meeting of Shareholders filed March 15,2017.
10.12
Form of Tennant Company 2017 Stock Incentive Plan Non-Statutory StockOption Agreement
Incorporated by reference to Exhibit 10.3 to the Company's Form 10-Q forthe quarter ended June 30, 2017.
10.13
Form of Tennant Company 2017 Stock Incentive Plan Restricted StockAgreement
Incorporated by reference to Exhibit 10.4 to the Company's Form 10-Q forthe quarter ended June 30, 2017.
10.14
Form of Tennant Company 2017 Stock Incentive Plan Non-EmployeeDirector Restricted Stock Agreement
Incorporated by reference to Exhibit 10.5 to the Company's Form 10-Q forthe quarter ended June 30, 2017.
10.15
Form of Tennant Company 2017 Stock Incentive Plan Restricted StockUnit Agreement
Incorporated by reference to Exhibit 10.6 to the Company's Form 10-Q forthe quarter ended June 30, 2017.
10.16
Form of Tennant Company 2017 Stock Incentive Plan Non-EmployeeDirector Restricted Stock Unit Agreement*
Incorporated by reference to Exhibit 10.1 to the Company's Form 10-Q forthe quarter ended June 30, 2018.
Tennant Company Executive Officer Cash Incentive Plan*
Incorporated by reference to Exhibit 10.1 to the Company's Current Reporton Form 8-K filed August 20, 2018.
10.18
Tennant Company Executive Officer Severance Plan and Summary PlanDescription*
Incorporated by reference to Exhibit 10.1 to the Company's Current Reporton Form 8-K filed October 10, 2018.
21 Subsidiaries of the Registrant Filed herewith electronically.23.1 Consent of KPMG, LLP Independent Registered Public Accounting Firm Filed herewith electronically.
24.1 Powers of Attorney Included on signature page.
31.2 Rule 13a-14(a)/15d-14(a) Certification of Chief Financial Officer Filed herewith electronically.32.1 Section 1350 Certification of Chief Executive Officer Filed herewith electronically.32.2 Section 1350 Certification of Chief Financial Officer Filed herewith electronically.101 The following financial information from Tennant Company’s annual
report on Form 10-K for the period ended December 31, 2018, filed withthe SEC on February 28, 2019, formatted in Extensible Business ReportingLanguage (XBRL): (i) the Consolidated Statements of Operations for theyears ended December 31, 2018, 2017 and 2016, (ii) the ConsolidatedStatements of Comprehensive Income for the years ended December 31,2018, 2017 and 2016, (iii) the Consolidated Balance Sheets as ofDecember 31, 2018 and 2017, (iv) the Consolidated Statements of CashFlows for the years ended December 31, 2018, 2017 and 2016, (v) theConsolidated Statements of Equity for the years ended December 31, 2018,2017 and 2016, and (vi) Notes to the Consolidated Financial Statements.
Filed herewith electronically.
* Management contract or compensatory plan or arrangement required to be filed as an exhibit to this annual report on Form 10-K.
Pursuant to the requirements of Section 13 or 15(d) of the Securities Exchange Act of 1934, the Registrant has duly caused this report to be signed on its behalf by theundersigned, thereunto duly authorized.
TENNANT COMPANY By /s/ H. Chris Killingstad
H. Chris Killingstad
President, CEO and
Board of Directors Date February 28, 2019
Each of the undersigned hereby appoints H. Chris Killingstad and Mary E. Talbott, and each of them (with full power to act alone), as attorneys and agents for theundersigned, with full power of substitution, for and in the name, place and stead of the undersigned, to sign and file with the Securities and Exchange Commission under theSecurities Exchange Act of 1934, any and all amendments and exhibits to this annual report on Form 10-K and any and all applications, instruments, and other documents to befiled with the Securities and Exchange Commission pertaining to this annual report on Form 10-K or any amendments thereto, with full power and authority to do and performany and all acts and things whatsoever requisite and necessary or desirable.
Pursuant to the requirements of Section 13 or 15(d) of the Securities Exchange Act of 1934, this report has been signed by the following persons on behalf of the Registrantand in the capacities and on the dates indicated.
By /s/ H. Chris Killingstad By /s/ Donal L. Mulligan
H. Chris Killingstad Donal L. Mulligan
President, CEO and Board of Directors
Board of Directors Date February 28, 2019Date February 28, 2019
By /s/ Keith A. Woodward By /s/ Steven A. Sonnenberg
Keith A. Woodward Steven A. Sonnenberg
Senior Vice President and Chief Financial Officer Board of Directors
Date February 28, 2019 Date February 28, 2019
By /s/ Azita Arvani Azita Arvani By /s/ David S. Wichmann
Board of Directors David S. Wichmann
Date February 28, 2019 Board of Directors Date February 28, 2019
By /s/ William F. Austen William F. Austen By /s/ David Windley
Board of Directors David Windley
Date February 28, 2019 Board of Directors
Date February 28, 2019
By /s/ Carol S. Eicher Carol S. Eicher Board of Directors Date February 28, 2019
72
Exhibit 10.3
SCHEDULE OF PARTIES TOMANAGEMENT AND EXECUTIVE EMPLOYMENT AGREEMENT
Parties to current form of amended and restated management agreement:
Name TitleH. Chris Killingstad President and Chief Executive OfficerDavid W. Huml Senior Vice President, EMEA, APAC, Global Marketing and OperationsCarol E. McKnight Senior Vice President, Chief Administrative OfficerRichard H. Zay Senior Vice President, The Americas, and Research & Development
Exhibit 21
Subsidiaries of the Registrant
Listed below are subsidiaries of Tennant Company as of December 31, 2018 .
Subsidiary Jurisdiction of OrganizationApplied Kehrmaschinen GmbH Federal Republic of GermanyApplied Sweepers Group Leasing Limited United KingdomApplied Sweepers Holdings. Limited United KingdomApplied Sweepers International Limited United KingdomCT Corporation Ltd. People’s Republic of ChinaEagle International LLC DelawareFloorep Limited United KingdomFoma Norge AS Kingdom of NorwayHofmans Machinefabriek en Constructiebedrijf B.V. NetherlandsInterclean Assistance ICA S.A. French RepublicIP Cleaning Espana S.L. Kingdom of SpainIP Gansow GmbH Federal Republic of GermanyIP Cleaning India Pvt. Ltd. Republic of IndiaIP Cleaning S.r.l. Italian RepublicIP Cleaning Sverige AB Kingdom of SwedenIPC Eagle Corporation MinnesotaIPC Euromop Iberica S.L. Kingdom of SpainIPC Industria e Commercio Ltda. Federative Republic of BrazilIPC Tools S.p.A. Italian RepublicNobles Floor Machines Limited United KingdomServicios Integrados Tennant United Mexican StatesSociedade Alfa Ltda. Federative Republic of BrazilSoteco Benelux B.V.B.A. BelgiumTCO C.V. NetherlandsTennant Asia Pacific Holdings Pte Ltd. Republic of SingaporeTennant Australia Pty Limited AustraliaTennant CAD Holdings LLC MinnesotaTennant Cleaning Solutions Ireland Limited IrelandTennant Cleaning Systems and Equipment (Shanghai) Co., Ltd. People’s Republic of ChinaTennant Cleaning Systems India Private Limited Republic of IndiaTennant Coatings, Inc. MinnesotaTennant Company Far East Headquarters Pte Ltd. Republic of SingaporeTennant Company Japan, Ltd. JapanTennant Company (Thailand) Ltd. ThailandTennant Europe B.V. NetherlandsTennant Europe N.V. BelgiumTennant GmbH & Co. KG Federal Republic of GermanyTennant Holding B.V. NetherlandsTennant Holding A (Italy) B.V. NetherlandsTennant Holding B (Italy) B.V. NetherlandsTennant Holding C (Italy) B.V. NetherlandsTennant Holding (US), Inc. MinnesotaTennant Holdings LLC MinnesotaTennant Hong Kong Limited Hong KongTennant International Holding B.V. Netherlands
Tennant International Holding LLC MinnesotaTennant NL B.V. NetherlandsTennant N.V. NetherlandsTennant Netherland Holding B.V. NetherlandsTennant New Zealand Ltd. New ZealandTennant Portugal E. de L., S.U., L. da Portuguese RepublicTennant S.A. French RepublicTennant SA Holdings LLC MinnesotaTennant Sales & Service Canada ULC British Columbia, CanadaTennant Sales and Service Company MinnesotaTennant Sales and Service Spain, S.A. Kingdom of SpainTennant Scotland Limited United KingdomTennant Sverige AB Kingdom of SwedenTennant UK Cleaning Solutions Ltd. United KingdomTennant UK Limited United KingdomTennant Ventas & Servicios de Mexico United Mexican StatesTennant Verwaltungs-gesellschaft GmbH Federal Republic of GermanyTNC C.V. NetherlandsVaclensa Ltd. United KingdomWalter-Broadley Limited United KingdomWalter-Broadley Machines Limited United KingdomWater Star, Inc. Ohio
Joint Ventures
I-Team North America B.V. Netherlands
Exhibit 23.1
Consent of Independent Registered Public Accounting Firm
The Board of DirectorsTennant Company:
We consent to the incorporation by reference in the registration statements (Nos. 333‑219833, 333-84374, 333-142581, 333-166342, 333-181203, and 333-188151) on Form S-8 of Tennant Company of our report dated February 28, 2019, with respect to the consolidated balance sheets of Tennant Company andsubsidiaries as of December 31, 2018 and 2017, the related consolidated statements of operations, comprehensive income, equity, and cash flows for each of theyears in the three-year period ended December 31, 2018, and the related notes and financial statement schedule as included in Item 15.A.2 (collectively, the“consolidated financial statements”), and the effectiveness of internal control over financial reporting as of December 31, 2018, which report appears in theDecember 31, 2018 annual report on Form 10‑K of Tennant Company.
Our report refers to a change in the method of accounting for revenue.
/s/ KPMG LLP
Minneapolis, MinnesotaFebruary 28, 2019
Exhibit 31.1CERTIFICATIONS
I, H. Chris Killingstad, certify that:
1. I have reviewed this annual report on Form 10-K of Tennant Company;
2. Based on my knowledge, this report does not contain any untrue statement of a material fact or omit to state a material fact necessary to make thestatements made, in light of the circumstances under which such statements were made, not misleading with respect to the period covered by this report;
3. Based on my knowledge, the financial statements, and other financial information included in this report, fairly present in all material respects thefinancial condition, results of operations and cash flows of the registrant as of, and for, the periods presented in this report;
4. The registrant’s other certifying officers and I are responsible for establishing and maintaining disclosure controls and procedures (as defined in ExchangeAct Rules 13a-15(e) and 15d-15(e)) and internal control over financial reporting (as defined in Exchange Act Rules 13a-15(f) and 15d-15(f)) for theregistrant and have:
a) Designed such disclosure controls and procedures, or caused such disclosure controls and procedures to be designed under our supervision, toensure that material information relating to the registrant, including its consolidated subsidiaries, is made known to us by others within thoseentities, particularly during the period in which this report is being prepared;
b) Designed such internal control over financial reporting, or caused such internal control over financial reporting to be designed under oursupervision, to provide reasonable assurance regarding the reliability of financial reporting and the preparation of financial statements forexternal purposes in accordance with generally accepted accounting principles;
c) Evaluated the effectiveness of the registrant’s disclosure controls and procedures and presented in this report our conclusions about theeffectiveness of the disclosure controls and procedures, as of the end of the period covered by this report based on such evaluation; and
d) Disclosed in this report any change in the registrant’s internal control over financial reporting that occurred during the registrant’s most recentfiscal quarter (the registrant’s fourth fiscal quarter in the case of an annual report) that has materially affected, or is reasonably likely tomaterially affect, the registrant’s internal control over financial reporting; and
5. The registrant’s other certifying officers and I have disclosed, based on our most recent evaluation of internal control over financial reporting, to theregistrant’s auditors and the audit committee of the registrant’s board of directors (or persons performing the equivalent functions):
a) All significant deficiencies and material weaknesses in the design or operation of internal control over financial reporting which are reasonablylikely to adversely affect the registrant’s ability to record, process, summarize and report financial information; and
b) Any fraud, whether or not material, that involves management or other employees who have a significant role in the registrant’s internal controlover financial reporting.
Date: February 28, 2019 /s/ H. Chris Killingstad
H. Chris Killingstad
President and Chief Executive Officer
Exhibit 31.2CERTIFICATIONS
I, Keith A. Woodward, certify that:
1. I have reviewed this annual report on Form 10-K of Tennant Company;
2. Based on my knowledge, this report does not contain any untrue statement of a material fact or omit to state a material fact necessary to make thestatements made, in light of the circumstances under which such statements were made, not misleading with respect to the period covered by this report;
3. Based on my knowledge, the financial statements, and other financial information included in this report, fairly present in all material respects thefinancial condition, results of operations and cash flows of the registrant as of, and for, the periods presented in this report;
4. The registrant’s other certifying officers and I are responsible for establishing and maintaining disclosure controls and procedures (as defined in ExchangeAct Rules 13a-15(e) and 15d-15(e)) and internal control over financial reporting (as defined in Exchange Act Rules 13a-15(f) and 15d-15(f)) for theregistrant and have:
a) Designed such disclosure controls and procedures, or caused such disclosure controls and procedures to be designed under our supervision, toensure that material information relating to the registrant, including its consolidated subsidiaries, is made known to us by others within thoseentities, particularly during the period in which this report is being prepared;
b) Designed such internal control over financial reporting, or caused such internal control over financial reporting to be designed under oursupervision, to provide reasonable assurance regarding the reliability of financial reporting and the preparation of financial statements forexternal purposes in accordance with generally accepted accounting principles;
c) Evaluated the effectiveness of the registrant’s disclosure controls and procedures and presented in this report our conclusions about theeffectiveness of the disclosure controls and procedures, as of the end of the period covered by this report based on such evaluation; and
d) Disclosed in this report any change in the registrant’s internal control over financial reporting that occurred during the registrant’s most recentfiscal quarter (the registrant’s fourth fiscal quarter in the case of an annual report) that has materially affected, or is reasonably likely tomaterially affect, the registrant’s internal control over financial reporting; and
5. The registrant’s other certifying officers and I have disclosed, based on our most recent evaluation of internal control over financial reporting, to theregistrant’s auditors and the audit committee of the registrant’s board of directors (or persons performing the equivalent functions):
a) All significant deficiencies and material weaknesses in the design or operation of internal control over financial reporting which are reasonablylikely to adversely affect the registrant’s ability to record, process, summarize and report financial information; and
b) Any fraud, whether or not material, that involves management or other employees who have a significant role in the registrant’s internal controlover financial reporting.
Date: February 28, 2019 /s/ Keith A. Woodward
Keith A. WoodwardSenior Vice President and Chief Financial Officer(Principal Financial and Accounting Officer)
Exhibit 32.1
CERTIFICATION OF CHIEF EXECUTIVE OFFICER
PURSUANT TO SECTION 906 OF THE SARBANES-OXLEY ACT OF 2002 In connection with the annual report of Tennant Company (the “Company”) on Form 10-K for the period ended December 31, 2018 as filed with the Securitiesand Exchange Commission on the date hereof (the “Report”), I, H. Chris Killingstad, President and Chief Executive Officer, certify, pursuant to 18 U.S.C. Section1350, as adopted pursuant to section 906 of the Sarbanes-Oxley Act of 2002, that:
(1) The Report fully complies with the requirements of Section 13(a) or 15(d) of the Securities Exchange Act of 1934; and(2) The information contained in this periodic report fairly presents, in all material respects, the financial condition and results of operations of the
Company.
Date: February 28, 2019 /s/ H. Chris Killingstad H. Chris Killingstad President and Chief Executive Officer
Exhibit 32.2
CERTIFICATION OF CHIEF FINANCIAL OFFICER
PURSUANT TO SECTION 906 OF THE SARBANES-OXLEY ACT OF 2002 In connection with the annual report of Tennant Company (the “Company”) on Form 10-K for the period ended December 31, 2018 as filed with the Securitiesand Exchange Commission on the date hereof (the “Report”), I, Keith A. Woodward, Senior Vice President and Chief Financial Officer, certify, pursuant to 18U.S.C. Section 1350, as adopted pursuant to section 906 of the Sarbanes-Oxley Act of 2002, that:
(1) The Report fully complies with the requirements of Section 13(a) or 15(d) of the Securities Exchange Act of 1934; and(2) The information contained in this periodic report fairly presents, in all material respects, the financial condition and results of operations of the
Company.
Date: February 28, 2019 /s/ Keith A. Woodward Keith A. Woodward Senior Vice President and Chief Financial Officer