December 8, 2017 Tennessee Market Highlights Number: 49 FED CATTLE: Fed cale traded $3 to $4 lower compared to last week on a live ba- sis. Prices on a live basis were mainly $117 while dressed prices were mainly $186 to $187. The 5-area weighted average prices thru Thursday were $117.47 live, down $3.21 from last week and $187.03 dressed, down $3.02 from a week ago. A year ago prices were $108.89 live and $169.96 dressed. The December live cale futures price has plummeted since early November losing nearly $12 per hundredweight. Fortunately, the cash price for finished cale has not fallen as dramacally. Live cale futures have certainly put a damper on cash prices the past couple of weeks but cash and fu- tures have not been in full parity during the decline as cash prices have only declined $6 per hundredweight over the same me period. Cale feeders do not have to be happy about declining prices, but they can take some comfort in prices not completely following technical trade in the futures market which means cash trade is sll tak- ing into account the fundamentals of the market. BEEF CUTOUT: At midday Friday, the Choice cutout was $205.55 up $0.47 from Thursday and down $0.60 from last Friday. The Select cutout was $185.75 up $1.92 from Thursday and up $2.17 from last Fri- day. The Choice Select spread was $19.80 compared to $22.57 a week ago. Choice beef buyers did lile to change the market from one week ago, but Select beef buyers appeared to be on the move this week. There is very lile me leſt for Choice prices to find addional support before the Christmas and New Year holi- days as many retailers, restaurants and food service providers have likely made most of their purchases for holiday dining. This does not mean all buyers have com- pleted their purchasing, but it is unlikely there are so many short bought in the mar- ket place that Choice beef will surge in the next two weeks. Alternavely, it appears some beef buyers are beginning to secure inventory for Select beef needs for the win- ter months. The Choice Select spread will begin narrowing and may do so at a rapid pace immediately following Christmas. The beef market connues to experience strong carcass grades, but much of the premium in the Choice cutout will be bid away as con- sumers begin focusing on end meats. This situaon will likely lead to Choice Select spread under $1 in February. OUTLOOK: The cash calf and feeder cale market took a tumble this week as feeder cale futures followed live cale futures during their price decline. The January feeder cale futures contract price declined a lile more than $8 since the end of No- vember. The futures price decline led calf and feeder steer prices to decline $3 to $9 compared to one week ago based on Ten- nessee weekly aucon market averages while feeder heifer prices declined $3 to $8. The sudden drop in prices may have caught a few producers off guard that have been holding on to calves due to abundant grass and hay resources. However, now is not the me to panic and go in a selling frenzy. Pro- ducers who weaned calves for the purpose of adding weight should connue to do so while keeping an eye on the market. The sudden price downturn is likely to reverse and move back to the trading range that has been consistent since the middle of September. Addionally, prices for light- weight calves tend to strengthen aſter the first of the year. Similarly, feeder cale prices generally find support in January though they have been supported most of the fourth quarter of 2017. It may also be important for producers to realize that it may be difficult for calf and feeder cale prices to outpace the prices realized the last few months of 2017. Fall calf and feed- er cale prices were supported throughout (Connued on page 2) Livestock Comments by Dr. Andrew P. Griffith Trends for the Week Compared to a Week Ago Slaughter Cows $2 to $5 lower Slaughter Bulls Steady Feeder Steers $3 to $9 lower Feeder Heifers $3 to $8 lower Feeder Cale Index Wednesday’s index: 155.01 Fed Cale The 5-area live price of $117.47 is down $3.21. The dressed price is down $3.02 at $187.03. Corn March closed at $3.52 a bushel, down 6 cents since last Friday. Soybeans January closed at $9.89 a bushel, down 5 cents since last Friday. Wheat March closed at $4.19 a bushel, down 19 cents since last Friday. Coon March closed at 73.72 cents per lb, up 0.44 cents since last Friday.
Transcript
December 8, 2017 Tennessee Market Highlights Number: 49
FED CATTLE: Fed cattle traded $3 to $4 lower compared to last week on a live ba-sis. Prices on a live basis were mainly $117 while dressed prices were mainly $186 to $187.
The 5-area weighted average prices thru Thursday were $117.47 live, down $3.21 from last week and $187.03 dressed, down $3.02 from a week ago. A year ago prices were $108.89 live and $169.96 dressed.
The December live cattle futures price has plummeted since early November losing nearly $12 per hundredweight. Fortunately, the cash price for finished cattle has not fallen as dramatically. Live cattle futures have certainly put a damper on cash prices the past couple of weeks but cash and fu-tures have not been in full parity during the decline as cash prices have only declined $6 per hundredweight over the same time period. Cattle feeders do not have to be happy about declining prices, but they can take some comfort in prices not completely following technical trade in the futures market which means cash trade is still tak-ing into account the fundamentals of the market.
BEEF CUTOUT: At midday Friday, the Choice cutout was $205.55 up $0.47 from Thursday and down $0.60 from last Friday. The Select cutout was $185.75 up $1.92 from Thursday and up $2.17 from last Fri-day. The Choice Select spread was $19.80 compared to $22.57 a week ago.
Choice beef buyers did little to change the market from one week ago, but Select beef buyers appeared to be on the move this week. There is very little time left for Choice prices to find additional support before the Christmas and New Year holi-days as many retailers, restaurants and food service providers have likely made most of their purchases for holiday dining. This does not mean all buyers have com-pleted their purchasing, but it is unlikely there are so many short bought in the mar-
ket place that Choice beef will surge in the next two weeks. Alternatively, it appears some beef buyers are beginning to secure inventory for Select beef needs for the win-ter months. The Choice Select spread will begin narrowing and may do so at a rapid pace immediately following Christmas. The beef market continues to experience strong carcass grades, but much of the premium in the Choice cutout will be bid away as con-sumers begin focusing on end meats. This situation will likely lead to Choice Select spread under $1 in February.
OUTLOOK: The cash calf and feeder cattle market took a tumble this week as feeder cattle futures followed live cattle futures during their price decline. The January feeder cattle futures contract price declined a little more than $8 since the end of No-vember. The futures price decline led calf and feeder steer prices to decline $3 to $9 compared to one week ago based on Ten-nessee weekly auction market averages while feeder heifer prices declined $3 to $8. The sudden drop in prices may have caught a few producers off guard that have been holding on to calves due to abundant grass and hay resources. However, now is not the time to panic and go in a selling frenzy. Pro-ducers who weaned calves for the purpose of adding weight should continue to do so while keeping an eye on the market. The sudden price downturn is likely to reverse and move back to the trading range that has been consistent since the middle of September. Additionally, prices for light-weight calves tend to strengthen after the first of the year. Similarly, feeder cattle prices generally find support in January though they have been supported most of the fourth quarter of 2017. It may also be important for producers to realize that it may be difficult for calf and feeder cattle prices to outpace the prices realized the last few months of 2017. Fall calf and feed-er cattle prices were supported throughout
(Continued on page 2)
Livestock Comments by Dr. Andrew P. Griffith Trends for the Week Compared to a Week Ago
Slaughter Cows
$2 to $5 lower
Slaughter Bulls
Steady
Feeder Steers
$3 to $9 lower
Feeder Heifers
$3 to $8 lower
Feeder Cattle Index
Wednesday’s index: 155.01
Fed Cattle
The 5-area live price of $117.47 is down $3.21. The dressed price is down $3.02 at $187.03.
Corn
March closed at $3.52 a bushel, down 6 cents since last Friday.
Soybeans
January closed at $9.89 a bushel, down 5 cents since last Friday.
Wheat
March closed at $4.19 a bushel, down 19 cents since last Friday.
Cotton
March closed at 73.72 cents per lb, up 0.44 cents since last Friday.
2
the fall marketing time period which is rare. However, the mar-ket simply followed the live cattle market which it is expected to do in the coming months. Thus, as live cattle prices begin to escalate late in the first quarter of 2018 so will feeder cattle prices. Calf prices toward the end of the first quarter will be supported by the feeder cattle market and abundant spring forage. On another note, slaughter cow prices took a hit this week as prices were $2 to $5 lower based on Tennessee weekly auction averages. The decline eliminated last week’s gains plus some. Slaughter cow prices should begin to slowly gain some footing from January through May.
ASK ANDREW, TN THINK TANK: This week a producer who regularly preconditions home raised cattle asked a question concerning how hard to push cattle with commercial or com-modity feeds. Some producers would encourage pushing them fairly hard while others may encourage a slower growth rate. However, the recommendation from a profitability standpoint is to compare cost of gain and value of gain. If the value of gain is higher than the cost of gain from commodity feeds then it is more profitable to push cattle to gain more weight in a shorter period of time. Alternatively, if the cost of gain exceeds value of gain then additional feed may not be the answer to increasing returns. The price slide and feed costs are major determinants in this evaluation. However, it is also important to consider the flesh score of feeder cattle as they are growing. Fleshy cattle will be discounted because the feedlot would prefer to put on the fat toward the end of feeding.
Please send questions and comments to [email protected] or send a letter to Andrew P. Griffith, University of Tennessee, 314B Morgan Hall, 2621 Morgan Circle, Knoxville, TN 37996.
FRIDAY’S FUTURES MARKET CLOSING PRICES: Friday’s closing prices were as follows: Live/fed cattle –December $115.58 -0.05; February $118.30 -0.38; April $120.20 +0.10; Feeder cattle –January $145.23 -1.10; March $143.33 -1.18; April $143.65 -0.98; May $143.73 -0.73; December corn closed at $3.40 up $0.01 from Thursday.
(Continued from page 1)
Livestock Comments by Dr. Andrew Griffith
Thursday December 7, 2017
Month Class III Close Class IV Close
Dec 15.51 13.59
Jan 14.39 13.41
Feb 14.36 13.63
Mar 14.55 13.76
Apr 14.81 14.03
Milk Futures
Cattle Hogs
———— Number of head ————
This week (4 days) 119,250 463,500
Last week (4 days) 119,250 456,250
Year ago (4 days) 117,750 437,500
This week as percentage of
Week ago (%) 100% 102%
Year ago (%) 101% 106%
Average Daily Slaughter USDA Box Beef Cutout Value
Overview Corn, soybeans, and wheat were down; and cotton was up for the week. March corn futures continue to struggle to gain positive traction. The con-tract low, $3.48 ¾, occurred on November 16, since then the contract has not traded above $3.60 ½, an 11 ¾ cent trading range. January soybean futures set 4-month highs earlier this week before retreating below $10 on Friday.
Next week’s USDA WASDE report will determine if prices breakout to the upside or establish a new contract lows for corn. U.S. exports and adjustments to the South American crop will be closely watched for soybeans. Major revisions to the domestic crop on the WASDE report are not expected. Average Tennessee corn basis is 15 cents weaker than last year. This is in addition to nearby futures trading 6 ½ cents lower. A net reduction in cash prices to producers of 21 ½ cents. Average soybean basis across Tennessee is 16 cents weaker than last year at this time. This is in addition to January soybean futures being 57 cents lower ($9.92 compared to $10.49) than 2016. A total reduc-tion in cash price to the producer of 73 cents compared to 2016. Higher yields will help offset the reduced prices. March cotton futures continued its 7 week rally (starting at 66.77 cents on October 20) closing at 73.72. The contract high of 75.57 (March 20, 2017) could be challenged next week. Decembers WASDE report is likely to reflect increased export sales. Currently, cotton export commitments are 35% higher than last year and are at 73% of the total export commitments projected by USDA. Maintaining futures prices above 75 cents could be challenging, so additional sales above 73 cents may be warranted. Corn In Tennessee, January 2018 cash forward contracts averaged $3.54 with a range of $3.28 to $3.63. March 2018 corn futures closed at $3.52 down 6 cents since last Friday. For the week, March 2018 corn futures traded between $3.50 and $3.60. Across Tennes-see, average basis (cash price-nearby futures price) strengthened at Memphis, Northwest Barge Points, Northwest, and Lower-middle Tennessee and weakened at Upper-middle Tennessee. Overall, basis for the week ranged from 35 under to 5 over the March futures contract with an average of 9 under at the end of the week. Mar/May and Mar/Dec future spreads were 9 and 33 cents, respectively.
May 2018 corn futures closed at $3.61 down 5 cents since last Friday. Corn net sales reported by exporters from November 24-30 were within expectations with net sales of 34.5 million bushels for the 2017/18 marketing year. Exports for the same time period were down from last week at 23.3 million bushels. Corn export sales and commitments were 47% of the USDA estimated total an-nual exports for the 2017/18 marketing year (September 1 to August 31) compared to a 5-year average of 52%. Ethanol production for the week ending December 1 was 1.108 million barrels per day up 42,000 from the previous week. Ethanol stocks were 22.544 million barrels, up 500,000 barrels. December 2018 corn futures closed at $3.85 down 4 cents since last Friday. Downside price protection could be obtained by purchasing a $3.90 December 2018 Put Option costing 28 cents establishing a $3.62 futures floor. Soybeans In Tennessee, January 2018 soybean cash contracts average $9.94 with a range of $9.65 to $10.17. January 2018 soybean futures closed at $9.89 down 5 cents since last Friday. For the week, January 2018 soybean futures traded between $9.86 and $10.15. Av-erage soybean basis strengthened at Lower-middle and Northwest Tennessee and weakened at Memphis, Northwest Barge Points, and Upper-middle Tennessee. Basis ranged from 40 under to even the January futures contract at elevators and barge points. Aver-age basis at the end of the week was 22 under the January futures contract. January/March soybean-to-corn price ratio was 2.81 at the end of the week.
(Continued on page 4)
4
Crop Comments by Dr. Aaron Smith
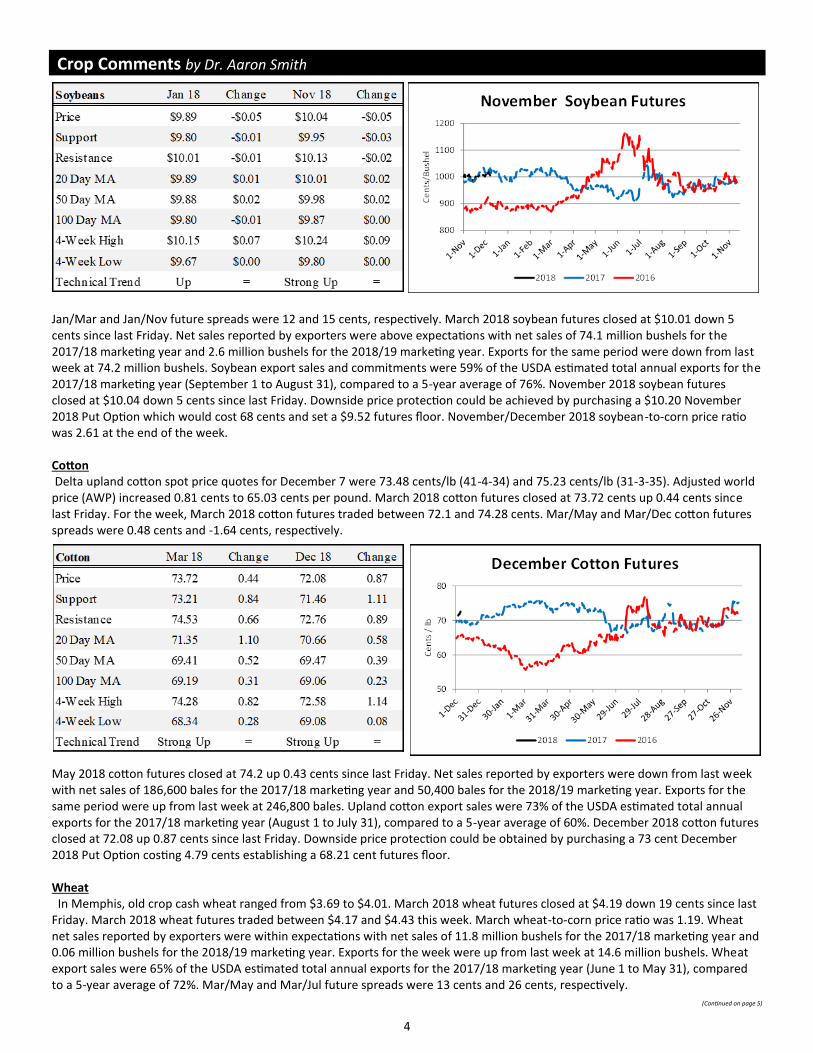
Jan/Mar and Jan/Nov future spreads were 12 and 15 cents, respectively. March 2018 soybean futures closed at $10.01 down 5 cents since last Friday. Net sales reported by exporters were above expectations with net sales of 74.1 million bushels for the 2017/18 marketing year and 2.6 million bushels for the 2018/19 marketing year. Exports for the same period were down from last week at 74.2 million bushels. Soybean export sales and commitments were 59% of the USDA estimated total annual exports for the 2017/18 marketing year (September 1 to August 31), compared to a 5-year average of 76%. November 2018 soybean futures closed at $10.04 down 5 cents since last Friday. Downside price protection could be achieved by purchasing a $10.20 November 2018 Put Option which would cost 68 cents and set a $9.52 futures floor. November/December 2018 soybean-to-corn price ratio was 2.61 at the end of the week. Cotton Delta upland cotton spot price quotes for December 7 were 73.48 cents/lb (41-4-34) and 75.23 cents/lb (31-3-35). Adjusted world price (AWP) increased 0.81 cents to 65.03 cents per pound. March 2018 cotton futures closed at 73.72 cents up 0.44 cents since last Friday. For the week, March 2018 cotton futures traded between 72.1 and 74.28 cents. Mar/May and Mar/Dec cotton futures spreads were 0.48 cents and -1.64 cents, respectively.
May 2018 cotton futures closed at 74.2 up 0.43 cents since last Friday. Net sales reported by exporters were down from last week with net sales of 186,600 bales for the 2017/18 marketing year and 50,400 bales for the 2018/19 marketing year. Exports for the same period were up from last week at 246,800 bales. Upland cotton export sales were 73% of the USDA estimated total annual exports for the 2017/18 marketing year (August 1 to July 31), compared to a 5-year average of 60%. December 2018 cotton futures closed at 72.08 up 0.87 cents since last Friday. Downside price protection could be obtained by purchasing a 73 cent December 2018 Put Option costing 4.79 cents establishing a 68.21 cent futures floor. Wheat In Memphis, old crop cash wheat ranged from $3.69 to $4.01. March 2018 wheat futures closed at $4.19 down 19 cents since last Friday. March 2018 wheat futures traded between $4.17 and $4.43 this week. March wheat-to-corn price ratio was 1.19. Wheat net sales reported by exporters were within expectations with net sales of 11.8 million bushels for the 2017/18 marketing year and 0.06 million bushels for the 2018/19 marketing year. Exports for the week were up from last week at 14.6 million bushels. Wheat export sales were 65% of the USDA estimated total annual exports for the 2017/18 marketing year (June 1 to May 31), compared to a 5-year average of 72%. Mar/May and Mar/Jul future spreads were 13 cents and 26 cents, respectively.
(Continued on page 5)
5
Crop Comments by Dr. Aaron Smith
May 2018 wheat futures closed at $4.32 down 19 cents from last Friday. In Tennessee, June/July 2018 cash forward contracts ranged from $4.29 to $4.78 for the week. July 2018 wheat futures closed at $4.45 down 19 cents since last Friday. Downside price protection could be obtained by purchasing a $4.50 July 2018 Put Option costing 26 cents establishing a $4.24 futures floor. Additional Information: Links for data presented:
U.S. Export Sales - https://apps.fas.usda.gov/export-sales/esrd1.html
If you would like further information or clarification on topics discussed in the crop comments section or would like to be added to our free email list please contact me at [email protected].
Tennessee 500-600 lbs. M-1 Steer Prices2016, 2017 and 5-year average
2011/2015 Avg 2016 2017
85
105
125
145
165
185
Tennessee 700-800 lbs. M-1 Steer Prices2016, 2017 and 5-year average
2011/2015 Avg 2016 2017
8595
105115125135145155
5-Area Finished Cattle Prices2015, 2016 and 5-year average
2011/2015 Avg 2016 2017
35455565758595
105
Tennessee Slaughter Cow PricesBreakers 75-80%
2015, 2016 and 5-year average
2011/2015 2016 2017
9
Athens Stockyard - December 6, 2017 1 load of Holstein steers; avg. wt. 925 lbs.; $95.00 1 load of Holstein steers; avg. wt. 970 lbs.; $94.00 1 load of heifers; mixed; avg. wt. 615 lbs.; $142.00 1 load of steers; mixed; avg. wt. 835 lbs.; $144.00 Browning Livestock - December 6, 2017 1 load of 66 heifers; avg. wt. 745 lbs.; $140.00
East Tennessee Livestock Center Holstein Sale, Sweetwater, TN Weighted Average Report for Friday Dec 1, 2017 Cattle Receipts: 994 For complete report: https://www.ams.usda.gov/mnreports/nv_ls182.txt Lower Middle Tennessee Cattlemens Video Board Sale Feeder Cattle Weighted Average Report for 12/01/2017 Receipts: 1186 For complete report: https://www.ams.usda.gov/mnreports/nv_ls184.txt
Senators Support Delay in ELD Mandate for Livestock Haulers Wyatt Bechtel December 7, 2017
Senators Jerry Moran (R-KS) and Heidi Heitkamp (D-ND) are leading a bipartisan attempt to delay electronic logging device (ELD) implementation for livestock haulers.
On Dec. 5, 20 senators sent a letter to Senate Majority Leader (R-KY) Mitch McConnell and Senate Minority Leader (D-NY) Chuck Schumer, supporting a provision in the House-passed Transportation, Housing and Urban Development (THUD) Ap-propriations. Language in THUD delays enactment of ELD rules for commercial motor vehicles transporting livestock or insects.
The letter says a delay will allow the Federal Motor Carrier Safety Administration (FMCSA) additional time so adjustments can be made in hours of service rules that will help address animal welfare concerns.
“Livestock haulers are charged with the challenging task of en-suring motorist safety while protecting the welfare of animals being transported,” the senators write.
A number of agriculture groups including the United States Cattlemen's Association (USCA) have been asking for a delay in implementation to adjust the hours of service.
“We applaud each and every Senator who signed-onto this letter for showing their support of small business owners in rural and agricultural America. A vast majority of livestock haul-ers are both the owner and operator of their business and this upcoming regulation will disproportionately affect our ability to do business efficiently and affordably,” says Steve Hilker, USCA transportation committee chairman and owner of Steve Hilker Trucking Inc. in Cimarron, Kan.
ELDs are a record keeping device synchronized to a truck en-gine that logs information digitally. In real-time an ELD records data such as time spent on the road, miles driven, location and engine hours.
“Given that we are hauling a living, breathing commodity, the comfort and welfare of our cargo is of the utmost concern to livestock haulers. Once loaded onto the truck, these animals must get to their destination as quickly and safely as possible.
Beef Industry News Featured Article from DROVERS CattleNetwork
An ELD would only serve to increase the number of stops in-cluded on a trip, extending the overall time that the cattle are on the trailer and adding additional stress during an already difficult experience in that animal's life,” Hilker says.
FMCSA has put a 90-day delay on the implementation ELDs for agriculture commodities. A 90-day waiver for agriculture com-modities will begin on Dec. 18 in an effort for FMCSA to evalu-ate issues revolving around the hours of service requirements.
The full letter can be read here.
Along with Moran and Heitkamp, 18 other senators signed the letter. The other senators included:
Sen. James Lankford (R-OK)
Sen. Dean Heller (R-NV)
Sen. John Hoeven (R-ND)
Sen. Cory Gardner (R-CO)
Sen. Joe Manchin (D-WV)
Sen. Mike Enzi (R-WY)
Sen. Chuck Grassley (R-IA)
Sen. Thom Tillis (R-NC)
Sen. John Barrasso (R-WY)
Sen. Bill Cassidy (R-LA)
Sen. Mike Crapo (R-ID)
Sen. James Inhofe (R-OK)
Sen. Jon Tester (D-MT)
Sen. Marco Rubio (R-FL)
Sen. Joni Ernst (R-IA)
Sen. Mike Lee ( R-UT)
Sen. James Risch (R-ID) Sen. Pat Roberts (R-KS)
Department of Agricultural and Resource Economics 314 Morgan Hall • 2621 Morgan Circle
arec.tennessee.edu USDA / Tennessee Department of Agriculture Market News Service http://www.tennessee.gov/agriculture/article/ag-farms-market-news 1-800-342-8206