NIST Technical Note 1879 Tensile Properties of Commercially Pure, High-Purity and Ultra-High-Purity Iron: Results of an International Round-Robin Enrico Lucon Kenji Abiko Marlies Lambrecht Birgit Rehmer This publication is available free of charge from: http://dx.doi.org/10.6028/NIST.TN.1879
Transcript
NIST Technical Note 1879
Tensile Properties of Commercially
Pure, High-Purity and
Ultra-High-Purity Iron: Results of an
International Round-Robin
Enrico Lucon
Kenji Abiko
Marlies Lambrecht
Birgit Rehmer
This publication is available free of charge from:
http://dx.doi.org/10.6028/NIST.TN.1879
NIST Technical Note 1879
Tensile Properties of Commercially
Pure, High-Purity and
Ultra-High-Purity Iron: Results of an
International Round-Robin
Enrico Lucon Applied Chemicals and Materials Division
Material Measurement Laboratory
Kenji Abiko Institute for Material Research, Tohoku University
Sendai, Japan
Marlies Lambrecht Structural Materials Tests, Belgian Nuclear Research Center, SCK•CEN
Mol, Belgium
Birgit Rehmer BAM 5.2, Experimental and Model Based Mechanical Behaviour of Materials
Berlin, Germany
This publication is available free of charge from:
http://dx.doi.org/10.6028/NIST.TN.1879
April 2015
U.S. Department of Commerce Penny Pritzker, Secretary
National Institute of Standards and Technology
Willie May, Acting Under Secretary of Commerce for Standards and Technology and Acting Director
Certain commercial entities, equipment, or materials may be identified in this
document in order to describe an experimental procedure or concept adequately.
Such identification is not intended to imply recommendation or endorsement by the
National Institute of Standards and Technology, nor is it intended to imply that the
entities, materials, or equipment are necessarily the best available for the purpose.
National Institute of Standards and Technology Technical Note 1879
Abstract ........................................................................................................................................................................ iii
Keywords ...................................................................................................................................................................... iii
2. Results of the individual participants .................................................................................................................... 4
3. Comparison of participants’ data ........................................................................................................................ 21
3.3. Elongation at fracture ................................................................................................................................ 24
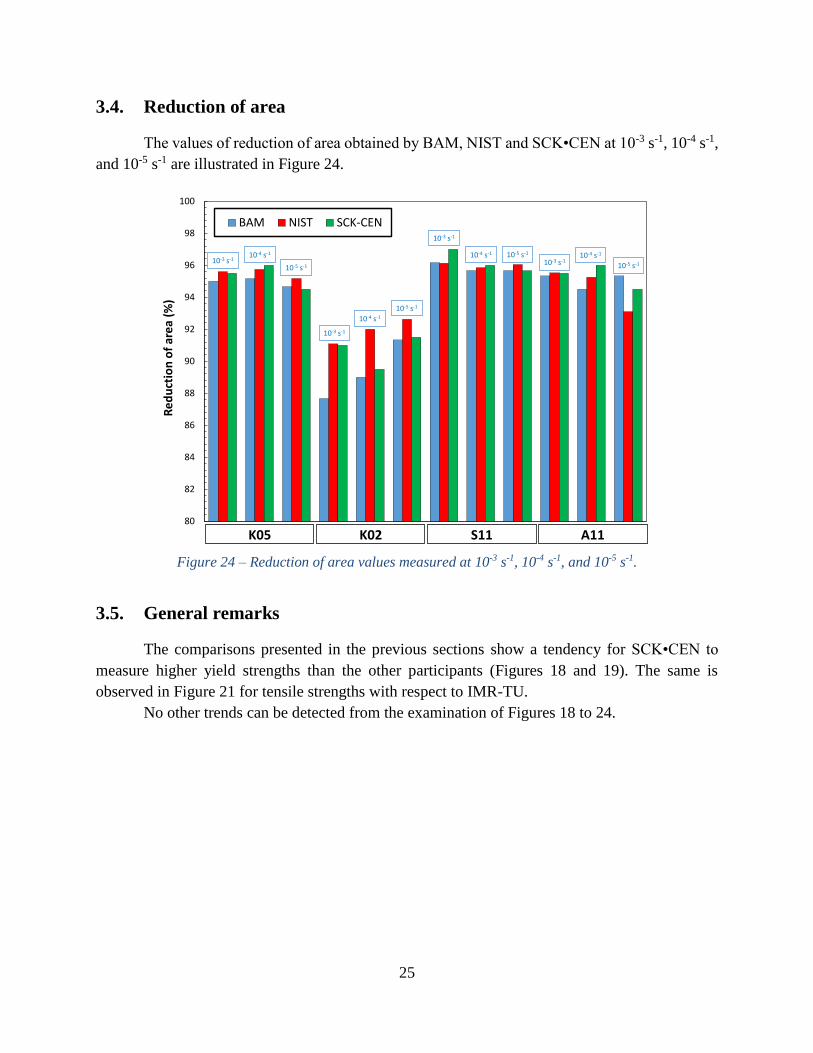
3.4. Reduction of area ....................................................................................................................................... 25
3.5. General remarks ......................................................................................................................................... 25
An interlaboratory comparison (aka Round-Robin) was conducted among four
international laboratories for the characterization of the room temperature tensile properties of Fe
with different degrees of purity, ranging from commercial purity (CP) to ultra-high purity (UHP).
The purpose of this Round-Robin was to investigate the influence of purity level and strain rate on
the tensile properties of iron.
The laboratories that participated in the Round-Robin are listed in Table 1, along with the
names of the scientists who were responsible for testing and reporting results. The participants’
data were collected and compared by NIST, Boulder CO (USA) in consultation with the
participating institutes.
Table 1 - Round-Robin participants.
Institute Location Responsible
BAM Berlin
(Germany) B. Rehmer
IMR-TU Sendai
(Japan) K. Abiko
NIST Boulder, CO
(USA) E. Lucon
SCK•CEN Mol
(Belgium) M. Lambrecht
Four types of iron were tensile tested: commercially pure (CP) Fe, two types of high purity
(HP) Fe, and ultra-high purity (UHP) Fe. The designations of the four types of pure Fe were K05
(CP), K02 (HP), S11 (HP), and A11 (UHP). Their impurity content, measured by the Institute of
Material Research at Tohoku University (IMR-TU), is provided in Table 2.
Table 2 – Impurity content (weight ppm) of the investigated materials. (nm = not measured.)
Element CP Fe HP Fe UHP Fe
K05 K02 S11 A11
Fe bal bal bal bal
C 14.0 1.6 0.3 0.5
N 1.8 4 1.5 <0.1
O 8.6 60 72.1 8.3
S 1.1 0.9 12.2 1.2
H nm <0.1 <0.1
Al 75.0 3.0 nm nm B 10.9 2.6 nm nm
Cr nm 2.3 nm nm Mn nm 1.3 nm nm Ni nm 6.3 nm <1
P 49 1 nm nm Si nm 1 2 <1
2
Adding up the impurity contents in Table 2, the following purity levels are obtained:
K05 (CP): 99.98396 %;
K02 (HP): 99.9916 %;
S11 (HP): 99.99118 %;
A11 (UHP): 99.9999878 %.
The materials K05 and K02 were melted in argon atmosphere at 200 Torr (26.7 MPa)
pressure, in a ceramics crucible (URC). S11 and A11 were melted in ultra-high vacuum (UHV,
10-7 Pa), by use of a water-cooled copper crucible.
From the scientific point of view, the most interesting material is A11 (electrolytic UHP
iron). It was obtained by use of an induction melting furnace, located at IMR-TU in Sendai (Japan).
The furnace is capable of melting iron ingots up to 10 kg, and its main chamber can be evacuated
to a base pressure of 6.7 × 10⁻⁸ Pa. UHP Fe is used for the fundamental research on the intrinsic
properties of iron and to determine the inherent effects of each impurity [1-3].
For each material, participants received tensile specimens of the geometry shown in Figure
1, which corresponds to the ASTM E8/E8M-13a Small-Size Round Specimen (Type 4). The
specimens were manufactured and distributed by IMR-TU (Prof. Abiko).
Figure 1 - Geometry of the tensile specimens tested for the Round-Robin (dimensions in mm).
For every material, each laboratory was required to test three specimens at three different
strain rates, i.e., 9 specimens per material, for a total of 36 specimens. Tests were to be conducted
at room temperature (21 °C ± 3 °C) in accordance with ASTM E8/E8M-13a. As much as possible,
an extensometer was required to be used to monitor specimen elongation. Due to
miscommunication among participants, participating labs didn’t all test at the same nominal strain
rates. A summary of the tests performed is provided in the test matrix shown in Table 3.
The following parameters were reported by participants1:
Yield strength2, σYS (MPa);
Tensile strength, σTS (MPa);
Elongation at fracture, t (%);
Reduction of area, RA (%).
1 Participants also reported uniform elongation u (%). However, three of the four labs estimated u from actuator
displacement rather than specimen elongation. This parameter was therefore not included in the analyses. 2 In case of discontinuous yielding, the minimum between the strength at an offset of 0.2 % plastic deformation (σp0.2)
and the lower yield strength (σLYS) was reported as the yield strength for the test.
3
Table 3 - Test matrix for the Round-Robin.
Participant Material No. of tests Strain rate (s-1) Remarks
BAM
K05
3
3
3
10-3
10-4
10-5
Tests were conducted with an
extensometer which was removed at
approximately 1 mm elongation.
K02
3
3
3
10-3
10-4
10-5
S11
3
3
3
10-3
10-4
10-5
A11
3
3
3
10-3
10-4
10-5
IMR-TU
K05
3
3
3
5 × 10⁻³
5 × 10⁻⁴
5 × 10⁻⁵
K02
3
3
3
5 × 10⁻³
5 × 10⁻⁴
5 × 10⁻⁵
S11
3
3
3
5 × 10⁻³
5 × 10⁻⁴
5 × 10⁻⁵
A11
3
3
3
5 × 10⁻³
5 × 10⁻⁴
10-5
NIST
K05
3
3
3
10-3
10-4
10-5
Tests were conducted with an
extensometer which was removed at
approximately 0.7 mm elongation.
K02
3
3
4
10-3
10-4
10-5
S11
3
3
3
10-3
10-4
10-5
A11
3
3
3
10-3
10-4
10-5
SCK•CEN
K05
2
1
2
1
2
1
10-3
5 × 10⁻³
10-4
5 × 10⁻⁴
5 × 10⁻⁴
10-5
Tests at 5 × 10⁻³ s-1, 5 × 10⁻⁴ s-1, and
5 × 10⁻⁵ s-1 were conducted without extensometer.
The remaining tests were conducted with an
extensometer which was removed at
approximately 5-6 mm elongation.
K02
2
1
2
1
2
1
10-3
5 × 10⁻³
10-4
5 × 10⁻⁴
5 × 10⁻⁴
10-5
S11
2
1
2
1
2
1
10-3
5 × 10⁻³
10-4
5 × 10⁻⁴
5 × 10⁻⁴
10-5
A11
2
1
2
1
2
1
10-3
5 × 10⁻³
10-4
5 × 10⁻⁴
5 × 10⁻⁴
10-5
4
2. Results of the individual participants
2.1. BAM results
The test results reported by BAM [4] are presented in Table 4.
Table 4 - Test results reported by BAM [4].
Average values of all tensile parameters are presented as a function of tested material in
Table 5 and as a function of strain rate in Table 6. Average values are also illustrated in Figures 2
to 6.
Specimen Strain sYS sTS t RA
ID rate (s-1) (MPa) (MPa) (%) (%)
K05-1_19 1E-03 228 288 45 95
K05-1_20 1E-03 233 281 48 95
K05-1_21 1E-03 232 280 47 95
K05-2_21 1E-04 211 264 49 95
K05-2_22 1E-04 200 260 51 96
K05-2_23 1E-04 202 262 53 96
K05-3_19 1E-05 48 95
K05-3_20 1E-05 178 250 50 95
K05-3_21 1E-05 174 250 52 95
K02-1_21 1E-03 198 252 44 86
K02-1_22 1E-03 192 242 45 86
K02-1_23 1E-03 194 241 48 91
K02-2_19 1E-04 189 250 40 88
K02-2_20 1E-04 159 232 49 91
K02-2_21 1E-04 158 229 54 89
K02-3_21 1E-05 184 237 39 91
K02-3_22 1E-05 163 230 44 92
K02-3_23 1E-05 163 230 46 91
S11-1_9 1E-03 111 208 73 97
S11-1_10 1E-03 99 205 73 96
S11-1_11 1E-03 106 205 72 96
S11-2_28 1E-04 89 200 72 94
S11-2_29 1E-04 87 201 74 96
S11-2_30 1E-04 91 203 74 97
S11-1_28 1E-05 66 190 64 95
S11-1_29 1E-05 64 189 65 96
S11-1_30 1E-05 63 188 68 96
A11-1_17 1E-03 68 200 67 95
A11-1_18 1E-03 68 201 74 95
A11-1_19 1E-03 69 201 73 96
A11-2_17 1E-04 43 189 65 95
A11-2_18 1E-04 44 186 65 94
A11-2_19 1E-04 44 188 71 96
A11-3_23 1E-05 27 179 71 95
A11-3_24 1E-05 28 178 66 96
A11-3_25 1E-05 29 177 37 95
Material
CP Fe
HP Fe
UHP Fe
DATA ACQUISITION FAILED
5
Table 5 – Average BAM test results as a function of tested material.
Table 6 – Average BAM test results as a function of strain rate.
Figure 2 - Average values of yield strength measured by BAM. Error bars indicate standard deviations.
Strain sYS sTS t RA
rate (s-1) (MPa) (MPa) (%) (%)
1E-03 231 283 47 95
1E-04 204 262 51 95
1E-05 176 250 50 95
1E-03 195 245 46 88
1E-04 169 237 47 89
1E-05 163 232 43 91
1E-03 105 206 73 96
1E-04 88 201 73 96
1E-05 66 189 66 96
1E-03 68 201 71 95
1E-04 44 188 67 95
1E-05 28 178 58 95
Material
K05
K02
S11
A11
Strain sYS sTS t RA
rate (s-1) (MPa) (MPa) (%) (%)
K05 231 283 47 95
K02 195 245 46 88
S11 105 206 73 96
A11 68 201 71 95
K05 204 262 51 95
K02 169 237 47 89
S11 88 201 73 96
A11 44 188 67 95
K05 176 250 50 95
K02 163 232 43 91
S11 66 189 66 96
A11 28 178 58 95
Material
1E-03
1E-04
1E-05
0
50
100
150
200
250
Yie
ld s
tre
ngt
h (
MP
a)
1E-3 1/s
1E-4 1/s
1E-5 1/s
K05(pure Fe)
K02(high-purity Fe)
S11(high-purity Fe)
A11(UHP Fe)
6
Figure 3 - Average values of tensile strength measured by BAM. Error bars indicate standard deviations.
Figure 4 - Average values of elongation at fracture measured by BAM. Error bars indicate standard
deviations.
0
50
100
150
200
250
300
Ten
sile
str
en
gth
(M
Pa)
1E-3 1/s
1E-4 1/s
1E-5 1/s
K05(pure Fe)
K02(high-purity Fe)
S11(high-purity Fe)
A11(UHP Fe)
0
10
20
30
40
50
60
70
80
Elo
nga
tio
n a
t fr
actu
re (
%)
1E-3 1/s
1E-4 1/s
1E-5 1/s
K05(pure Fe)
K02(high-purity Fe)
S11(high-purity Fe)
A11(UHP Fe)
7
Figure 5 - Average values of reduction of area measured by BAM.
Very clear and consistent trends for yield and tensile strengths can be observed in Figures
2 and 3. Both parameters decrease as material purity increases and strain rate decreases. Specific
trends are not detected in Figures 4 and 5 for ductility parameters (t and RA).
75
80
85
90
95
100
Re
du
ctio
n o
f ar
ea
(%)
1E-3 1/s 1E-4 1/s 1E-5 1/s
K05(pure Fe)
K02(high-purity Fe)
S11(high-purity Fe)
A11(UHP Fe)
8
2.2. IMR-TU results
The test results obtained by IMR-TU3 are presented in Table 7. Note that reduction of area
was not measured.
Table 7 - Test results obtained by IMR-TU.
Average values of all tensile parameters are presented as a function of tested material in
Table 8 and as a function of strain rate in Table 9. Average values are also illustrated in Figures 6
to 8.
3 IMR-TU provided raw test data to NIST, who analyzed the tests and calculated the results.
Specimen Strain sYS sTS t
ID rate (s-1) (MPa) (MPa) (%)
K05-1_29 5E-03 245 282 49
K05-1_30 5E-03 243 280 48
K05-1_31 5E-03 243 279 48
K05-2_31 5E-04 199 257 54
K05-2_32 5E-04 215 259 55
K05-2_33 5E-04 210 259 52
K05-3_29 5E-05 200 248 52
K05-3_30 5E-05 201 248 52
K05-3_31 5E-05 201 255 50
K02-1_31 5E-03 211 247 47
K02-1_32 5E-03 204 243 57
K02-1_33 5E-03 200 239 55
K02-2_29 5E-04 189 241 45
K02-2_30 5E-04 187 240 44
K02-2_31 5E-04 183 237 51
K02-3_31 5E-05 171 235 45
K02-3_32 5E-05 175 235 41
K02-3_33 5E-05 176 239 41
S11-1_12 5E-03 126 211 77
S11-1_13 5E-03 123 210 70
S11-1_14 5E-03 124 212 71
S11-2_25 5E-04 106 207 73
S11-2_26 5E-04 98 205 72
S11-2_27 5E-04 99 206 69
S11-1_25 5E-05 71
S11-1_26 5E-05 67 188 66
S11-1_27 5E-05 70 187 62
A11-1_27 5E-03 92 199 68
A11-1_29 5E-03 91 198 70
A11-1_30 5E-03 94 201 68
A11-2_27 5E-03 56 184 68
A11-2_28 5E-03 59 189 70
A11-2_29 5E-03 59 187 68
A11-3_29 5E-03 41 175 67
A11-3_30 5E-03 44 178 67
A11-3_31 5E-03 42 177 62
HP Fe
FILE INCOMPLETE
CP Fe
UHP Fe
Material
9
Table 8 – Average IMR-TU test results as a function of tested material.
Table 9 – Average IMR-TU test results as a function of strain rate.
Figure 6 - Average values of yield strength measured by IMR-TU. Error bars indicate standard deviations.
Strain sYS sTS t
rate (s-1) (MPa) (MPa) (%)
5E-03 244 280 48
5E-04 208 258 53
5E-05 201 251 51
5E-03 205 243 53
5E-04 187 239 47
5E-05 174 236 42
5E-03 124 211 73
5E-04 101 206 71
5E-05 70 188 64
5E-03 92 199 69
5E-04 58 187 68
5E-05 42 177 65
K05
K02
S11
A11
Material
Strain sYS sTS t
rate (s-1) (MPa) (MPa) (%)
K05 244 280 48
K02 205 243 53
S11 124 211 73
A11 92 199 69
K05 208 258 53
K02 187 239 47
S11 101 206 71
A11 58 187 68
K05 201 251 51
K02 174 236 42
S11 70 188 64
A11 42 177 65
5E-04
5E-05
Material
5E-03
0
50
100
150
200
250
Yie
ld s
tre
ngt
h (
MP
a)
1E-3 1/s
1E-4 1/s
1E-5 1/s
K05(pure Fe)
K02(high-purity Fe)
S11(high-purity Fe)
A11(UHP Fe)
10
Figure 7 - Average values of tensile strength measured by IMR-TU. Error bars indicate standard
deviations.
Figure 8 - Average values of elongation at fracture measured by IMR-TU. Error bars indicate standard
deviations.
0
50
100
150
200
250
300
Ten
sile
str
en
gth
(M
Pa)
1E-3 1/s
1E-4 1/s
1E-5 1/s
K05(pure Fe)
K02(high-purity Fe)
S11(high-purity Fe)
A11(UHP Fe)
0
10
20
30
40
50
60
70
80
90
Elo
nga
tio
n a
t fr
actu
re (
%)
1E-3 1/s
1E-4 1/s
1E-5 1/s
K05(pure Fe)
K02(high-purity Fe)
S11(high-purity Fe)
A11(UHP Fe)
11
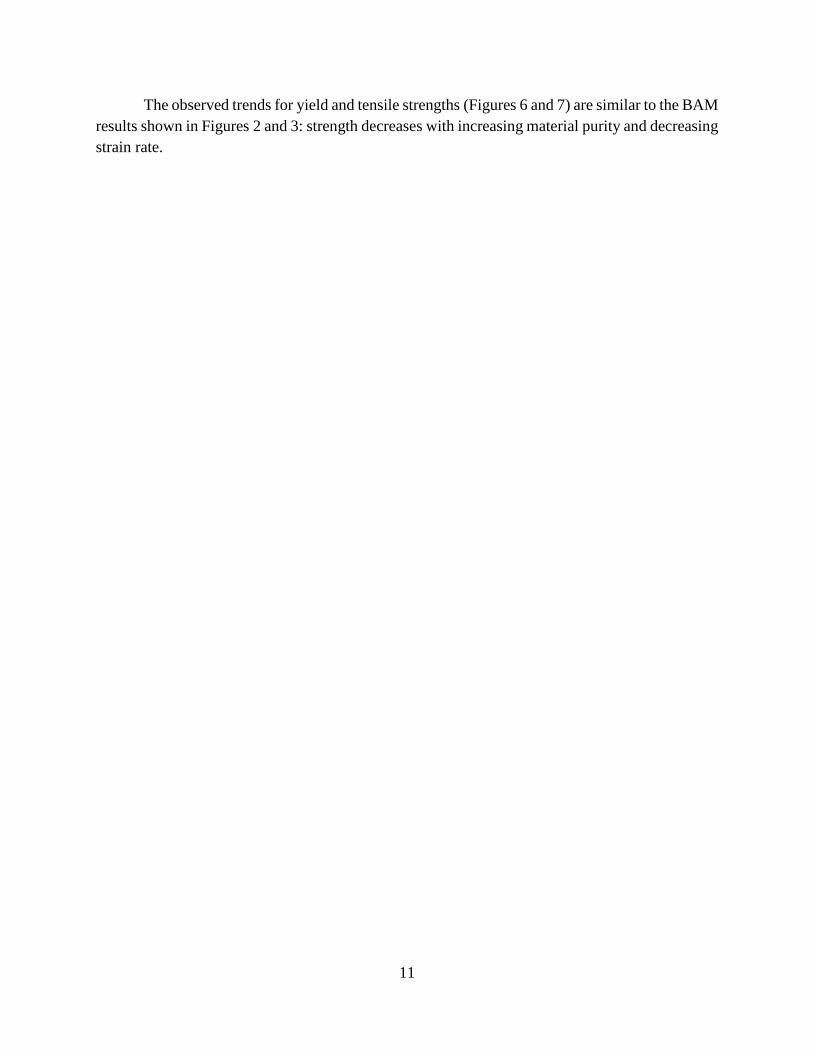
The observed trends for yield and tensile strengths (Figures 6 and 7) are similar to the BAM
results shown in Figures 2 and 3: strength decreases with increasing material purity and decreasing
strain rate.
12
2.3. NIST results
The test results obtained by NIST are presented in Table 10. Note that a fourth K02
specimen was tested at 10-5 s-1 because of the anomalous results yielded by specimen K02-3_30.
Table 10 - Test results reported by NIST.
Figure 9 compares force/actuator displacement curves for the K02 (HP iron) specimens
tested at the lowest strain rate (10-5 s-1). The outlier behavior of specimen K02-3_30 is evident,
with higher strength and lower ductility than the other three specimens. No apparent reason for
this anomaly could be identified. However, we should also note that similar situations were also
observed at 10-3 s-1 and 10-4 s-1, in reference to specimens K02-1_30 and K02-2_28 respectively.
Specimen Strain sYS sTS t RA
ID rate (s-1) (MPa) (MPa) (%) (%)
K05-1_26 1E-03 219 277 58 96
K05-1_27 1E-03 229 282 62 96
K05-1_28 1E-03 243 294 51 96
K05-2_16 1E-04 197 264 53 96
K05-2_28 1E-04 220 271 62 96
K05-2_30 1E-04 213 271 55 96
K05-3_15 1E-05 172 253 50 95
K05-3_27 1E-05 179 259 52 95
K05-3_28 1E-05 205 267 51 95
K02-1_28 1E-03 183 243 61 92
K02-1_29 1E-03 185 246 54 90
K02-1_30 1E-03 202 256 48 91
K02-2_26 1E-04 150 233 59 91
K02-2_27 1E-04 148 231 57 93
K02-2_28 1E-04 186 253 51 91
K02-2_14 1E-05 131 218 42 92
K02-3_28 1E-05 139 224 52 94
K02-3_29 1E-05 137 223 51 93
K02-3_30 1E-05 177 244 42 92
S11-1_15 1E-03 103 219 71 97
S11-1_17 1E-03 109 219 67 96
S11-1_22 1E-03 109 220 67 96
S11-2_22 1E-04 92 212 67 95
S11-2_23 1E-04 94 214 76 96
S11-2_24 1E-04 94 216 63 97
S11-1_16 1E-05 64 194 61 96
S11-1_23 1E-05 71 196 64 95
S11-1_24 1E-05 76 197 61 97
A11-1_24 1E-03 78 214 70 97
A11-1_25 1E-03 74 208 73 96
A11-1_26 1E-03 76 211 65 94
A11-2_24 1E-04 53 197 67 96
A11-2_25 1E-04 52 197 70 96
A11-2_26 1E-04 48 194 65 93
A11-3_20 1E-05 39 183 80 93
A11-3_21 1E-05 37 184 68 93
A11-3_22 1E-05 38 187 59 93
Material
UHP Fe
HP Fe
P Fe
13
Figure 9 - Comparison between K02 specimens tested by NIST at 10-5 s-1.
Average values for all tensile parameters are presented as a function of tested material in
Table 11 and as a function of strain rate in Table 12. Average values and standard deviations
(indicated by error bars) are also illustrated in Figures 10 to 13.
Table 11 – Average NIST test results as a function of tested material.
0
0.5
1
1.5
2
2.5
3
3.5
0 2 4 6 8 10
Forc
e (
kN)
Actuator displacement (mm)
K02-3_30
Strain sYS sTS t RA
rate (s-1) (MPa) (MPa) (%) (%)
1E-03 231 284 57 96
1E-04 210 269 57 96
1E-05 185 260 51 95
1E-03 190 248 54 91
1E-04 161 239 56 92
1E-05 132 228 47 93
1E-03 107 219 68 96
1E-04 93 214 69 96
1E-05 71 196 62 96
1E-03 76 211 69 96
1E-04 51 196 67 95
1E-05 38 185 69 93
Material
K05
K02
S11
A11
14
Table 12 – Average NIST test results as a function of strain rate.
Figure 10 - Average values of yield strength measured by NIST. Error bars indicate standard deviations.
Strain sYS sTS t RA
rate (s-1) (MPa) (MPa) (%) (%)
K05 231 284 57 96
K02 190 248 54 91
S11 107 219 68 96
A11 76 211 69 96
K05 210 269 57 96
K02 161 239 56 92
S11 93 214 69 96
A11 51 196 67 95
K05 185 260 51 95
K02 132 228 47 93
S11 71 196 62 96
A11 38 185 69 93
Material
1E-03
1E-04
1E-05
0
50
100
150
200
250
Yie
ld s
tre
ngt
h (
MP
a)
1E-3 1/s
1E-4 1/s
1E-5 1/s
K05(pure Fe)
K02(high-purity Fe)
S11(high-purity Fe)
A11(UHP Fe)
15
Figure 11 - Average values of tensile strength measured by NIST. Error bars indicate standard deviations.
Figure 12 - Average values of elongation at fracture measured by NIST. Error bars indicate standard
deviations.
0
50
100
150
200
250
300
Ten
sile
str
en
gth
(M
Pa)
1E-3 1/s
1E-4 1/s
1E-5 1/s
K05(pure Fe)
K02(high-purity Fe)
S11(high-purity Fe)
A11(UHP Fe)
0
10
20
30
40
50
60
70
80
Elo
nga
tio
n a
t fr
actu
re (
%)
1E-3 1/s1E-4 1/s1E-5 1/s
K05(pure Fe)
K02(high-purity Fe)
S11(high-purity Fe)
A11(UHP Fe)
16
Figure 13 - Average values of reduction of area measured by NIST. Error bars indicate standard deviations.
As already observed for BAM and IMR-TU results, yield and tensile strength
systematically decrease as the material purity increases and strain rate increases (Figures 10 and
11). Ductility parameters do not exhibit equally clear patterns.
50
55
60
65
70
75
80
85
90
95
100
Re
du
ctio
n o
f ar
ea
(%)
1E-3 1/s
1E-4 1/s
1E-5 1/s
K05(pure Fe)
K02(high-purity Fe)
S11(high-purity Fe)
A11(UHP Fe)
17
2.4. SCK•CEN results
The test results obtained by SCK•CEN are presented in Table 13. For every test condition,
specimens were tested at two strain rates (e.g., 10-3 s-1 and 5 × 10⁻³ s-1). The tests performed at 5 ×
10-3 s-1, 5 × 10⁻⁴ s-1, and 5 × 10⁻⁵ s-1 were conducted without extensometer. For these tests, the
parameter sp02 was estimated from force and actuator displacement data, after linearization of the
initial portion of the test record. For 9 of these 12 tests, sYS corresponds to sLYS, which is not
affected by the use of actuator displacement or specimen elongation.
Table 13 - Test results obtained by SCK•CEN.
Specimen Strain sYS sTS t RA
ID rate (s-1) (MPa) (MPa) (%) (%)
K05-1_16 5E-03 250 292 51 94
K05-1_17 1E-03 246 284 50 95
K05-1_18 1E-03 244 293 47 96
K05-2_18 5E-04 228 275 57 96
K05-2_19 1E-04 215 265 53 96
K05-2_20 1E-04 227 271 49 96
K05-3_16 5E-05 195 257 57 94
K05-3_17 1E-05 189 254 50 95
K05-3_18 1E-05 193 256 50 94
K02-1_18 5E-03 224 262 50 91
K02-1_19 1E-03 194 246 50 92
K02-1_20 1E-03 208 257 46 90
K02-2_16 5E-04 201 253 49 88
K02-2_17 1E-04 185 244 47 91
K02-2_18 1E-04 202 261 38 88
K02-3_18 5E-05 177 242 52 92
K02-3_19 1E-05 167 234 48 91
K02-3_20 1E-05 187 250 40 92
S11-1_6 5E-03 145 229 71 97
S11-1_7 1E-03 111 218 68 97
S11-1_8 1E-03 111 218 71 97
S11-2_31 5E-04 117 221 76 96
S11-2_32 1E-04 93 208 70 97
S11-2_33 1E-04 96 209 70 95
S11-1_31 5E-05 75 203 68 96
S11-1_32 1E-05 67 195 62 97
S11-1_33 1E-05 71 197 65 97
S11-3_23 1E-05 114 210 61 93
A11-1_14 5E-03 107 215 80 96
A11-1_15 1E-03 72 204 72 97
A11-1_16 1E-03 72 204 71 94
A11-2_14 5E-04 71 206 75 97
A11-2_15 1E-04 52 195 68 96
A11-2_16 1E-04 49 194 68 96
A11-3_26 5E-05 44 188 68 94
A11-3_27 1E-05 38 180 65 94
A11-3_28 1E-05 39 181 65 95
Material
CP Fe
HP Fe
UHP Fe
18
Average values of all tensile parameters (considering only tests conducted at 10-3 s-1,
10-4 s-1, and 10-5 s-1) are presented as a function of tested material in Table 14 and as a function of
strain rate in Table 15. Average values are also illustrated in Figures 14 to 17.
Table 14 – Average SCK•CEN test results as a function of tested material.
Table 15 – Average SCK•CEN test results as a function of strain rate.
Strain sYS sTS t RA
rate (s-1) (MPa) (MPa) (%) (%)
1E-03 245 289 49 96
1E-04 221 268 51 96
1E-05 191 255 50 95
1E-03 201 252 48 91
1E-04 194 253 43 90
1E-05 177 242 44 92
1E-03 111 218 70 97
1E-04 95 209 70 96
1E-05 84 201 63 96
1E-03 72 204 72 96
1E-04 51 195 68 96
1E-05 39 181 65 95
Material
K05
K02
S11
A11
Strain sYS sTS t RA
rate (s-1) (MPa) (MPa) (%) (%)
K05 245 289 49 96
K02 201 252 48 91
S11 111 218 70 97
A11 72 204 72 96
K05 221 268 51 96
K02 194 253 43 90
S11 95 209 70 96
A11 51 195 68 96
K05 191 255 50 95
K02 177 242 44 92
S11 84 201 63 96
A11 39 181 65 95
Material
1E-03
1E-04
1E-05
19
Figure 14 - Average values of yield strength measured by SCK•CEN.
Figure 15 - Average values of tensile strength measured by SCK•CEN.
0
50
100
150
200
250
Yie
ld s
tre
ngt
h (
MP
a)
1E-3 1/s
1E-4 1/s
1E-5 1/s
K05(pure Fe)
K02(high-purity Fe)
S11(high-purity Fe)
A11(UHP Fe)
0
50
100
150
200
250
300
Ten
sile
str
en
gth
(M
Pa)
1E-3 1/s
1E-4 1/s
1E-5 1/s
K05(pure Fe)
K02(high-purity Fe)
S11(high-purity Fe)
A11(UHP Fe)
20
Figure 16 - Average values of elongation at fracture measured by SCK•CEN.
Figure 17 - Average values of reduction of area measured by SCK•CEN.
Similar to the other participants, the results obtained by SCK•CEN confirm that yield and
tensile strengths decrease with increasing material purity and decreasing strain rate, whereas
ductility parameters do not exhibit specific trends.
0
10
20
30
40
50
60
70
80
Elo
nga
tio
n a
t fr
actu
re (
%)
1E-3 1/s1E-4 1/s1E-5 1/s
K05(pure Fe)
K02(high-purity Fe)
S11(high-purity Fe)
A11(UHP Fe)
50
55
60
65
70
75
80
85
90
95
100
Re
du
ctio
n o
f ar
ea
(%)
1E-3 1/s
1E-4 1/s
1E-5 1/s
K05(pure Fe)
K02(high-purity Fe)
S11(high-purity Fe)
A11(UHP Fe)
21
3. Comparison of participants’ data
Table 16 is the master table which presents all the test results provided by the Round-Robin
participants. When multiple tests on the same material and at the same strain rate are available for
a single participant, the corresponding average values are given in Table 16.
Table 16 – Master table of the tensile Round-Robin results.
Strain sYS sTS t RA
rate (s-1) (MPa) (MPa) (%) (%)
BAM 1E-03 231 283 47 95
NIST 1E-03 231 284 57 96
SCK-CEN 1E-03 245 289 49 96
IMR-TU 5E-03 244 280 48
SCK-CEN 5E-03 250 292 51 94
BAM 1E-04 204 262 51 95
NIST 1E-04 210 269 57 96
SCK-CEN 1E-04 221 268 51 96
IMR-TU 5E-04 208 258 53
SCK-CEN 5E-04 228 275 57 96
BAM 1E-05 176 250 50 95
NIST 1E-05 185 260 51 95
SCK-CEN 1E-05 191 255 50 95
IMR-TU 5E-05 201 251 51
SCK-CEN 5E-05 195 257 57 94
BAM 1E-03 195 245 46 88
NIST 1E-03 190 248 54 91
SCK-CEN 1E-03 201 252 48 91
IMR-TU 5E-03 205 243 53
SCK-CEN 5E-03 224 262 50 91
BAM 1E-04 169 237 47 89
NIST 1E-04 161 239 56 92
SCK-CEN 1E-04 194 253 43 90
IMR-TU 5E-04 187 239 47
SCK-CEN 5E-04 201 253 49 88
BAM 1E-05 163 232 43 91
NIST 1E-05 132 228 47 93
SCK-CEN 1E-05 177 242 44 92
IMR-TU 5E-05 174 236 42
SCK-CEN 5E-05 177 242 52 92
BAM 1E-03 105 206 73 96
NIST 1E-03 107 219 68 96
SCK-CEN 1E-03 111 218 70 97
IMR-TU 5E-03 124 211 73
SCK-CEN 5E-03 145 229 71 97
BAM 1E-04 88 201 73 96
NIST 1E-04 93 214 69 96
SCK-CEN 1E-04 95 209 70 96
IMR-TU 5E-04 101 206 71
SCK-CEN 5E-04 117 221 76 96
BAM 1E-05 66 189 66 96
NIST 1E-05 71 196 62 96
SCK-CEN 1E-05 84 201 63 96
IMR-TU 5E-05 70 188 64
SCK-CEN 5E-05 75 203 68 96
BAM 1E-03 68 201 71 95
NIST 1E-03 76 211 69 96
SCK-CEN 1E-03 72 204 72 96
IMR-TU 5E-03 92 199 69
SCK-CEN 5E-03 107 215 80 96
BAM 1E-04 44 188 67 95
NIST 1E-04 51 196 67 95
SCK-CEN 1E-04 51 195 68 96
IMR-TU 5E-04 58 187 68
SCK-CEN 5E-04 71 206 75 97
BAM 1E-05 28 178 58 95
NIST 1E-05 38 185 69 93
SCK-CEN 1E-05 39 181 65 95
IMR-TU 5E-05 42 177 65
SCK-CEN 5E-05 44 188 68 94
A11
Material Institute
K05
K02
S11
22
3.1. Yield strength
The values of yield strength obtained by BAM, NIST and SCK•CEN at 10-3 s-1, 10-4 s-1,
and 10-5 s-1 are illustrated in Figure 18. Yield strengths measured by IMR-TU and SCK•CEN at 5
× 10-3 s-1, 5 × 10⁻⁴ s-1, and 5 × 10⁻⁵ s-1 are shown in Figure 19.
Figure 18 – Yield strength values measured at 10-3 s-1, 10-4 s-1, and 10-5 s-1.