30
Forest Carbon Projects Katie Goslee Program Associate Winrock International [email protected] Integrated Energy Policy Report Workshop May 26, 2009 Terrestrial Carbon Sequestration
Forest Carbon Projects
Katie GosleeProgram AssociateWinrock [email protected]
Integrated Energy Policy Report WorkshopMay 26, 2009
Terrestrial Carbon Sequestration
2
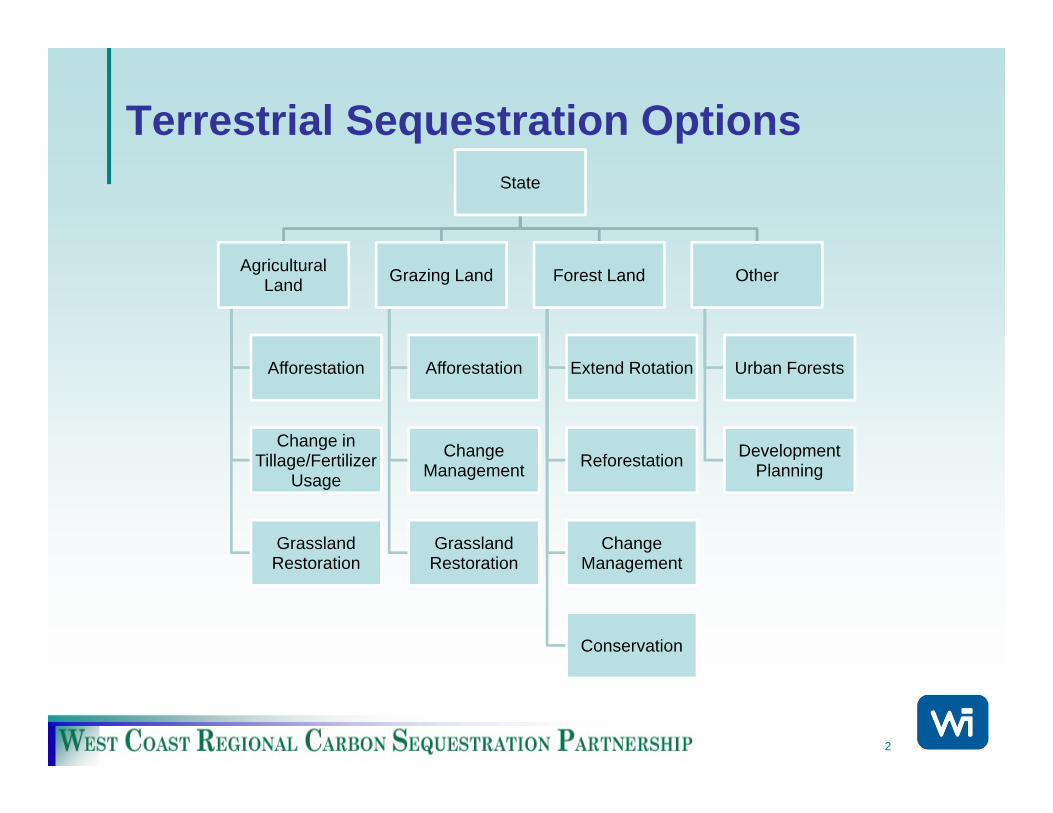
Terrestrial Sequestration OptionsState
Agricultural Land
Afforestation
Change in Tillage/Fertilizer
Usage
Grassland Restoration
Grazing Land
Afforestation
Change Management
Grassland Restoration
Forest Land
Extend Rotation
Reforestation
Change Management
Conservation
Other
Urban Forests
Development Planning
3
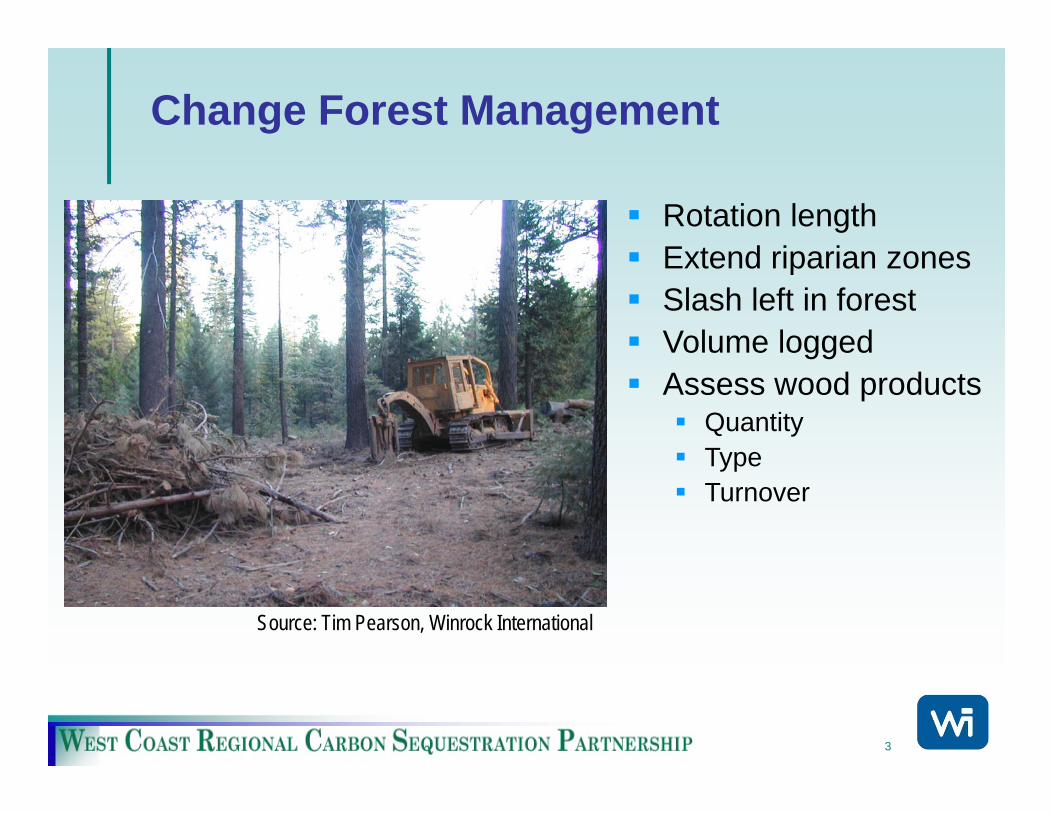
Change Forest Management
Source: Tim Pearson, Winrock International
Rotation lengthExtend riparian zonesSlash left in forestVolume loggedAssess wood products
QuantityTypeTurnover
4
5
6
7
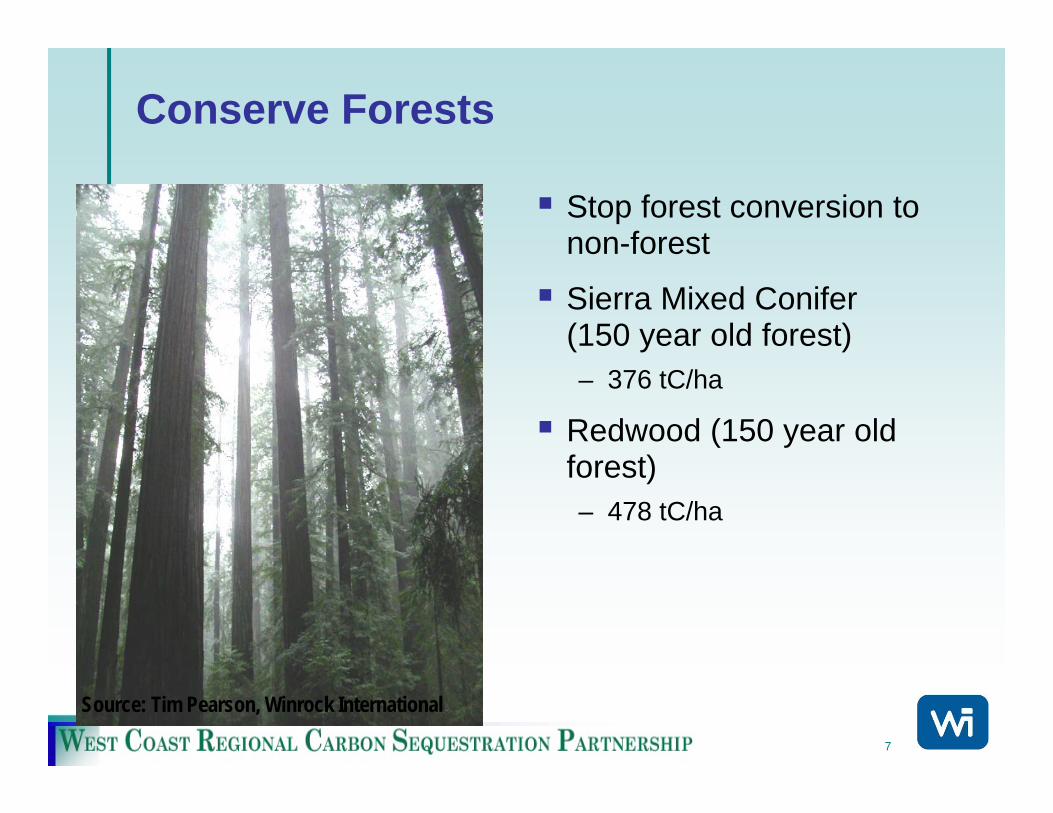
Conserve Forests
Stop forest conversion to non-forest
Sierra Mixed Conifer (150 year old forest)– 376 tC/ha
Redwood (150 year old forest)– 478 tC/ha
Source: Tim Pearson, Winrock International
8
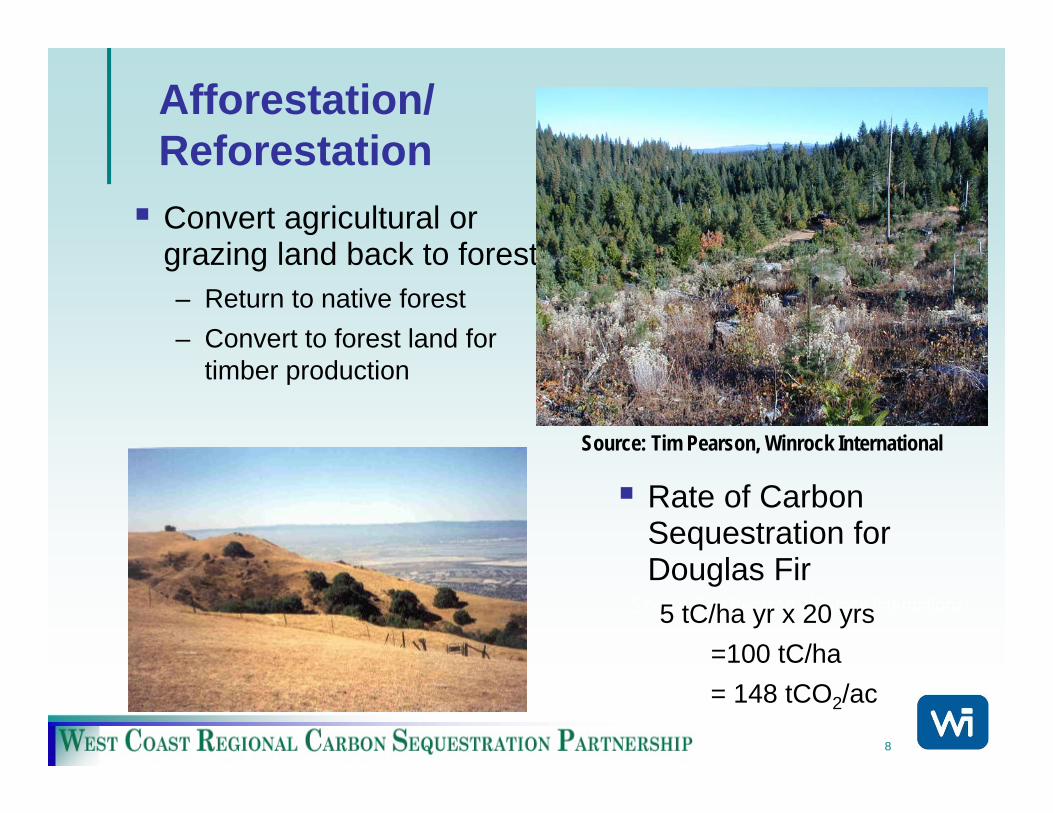
Afforestation/ ReforestationConvert agricultural or grazing land back to forest– Return to native forest– Convert to forest land for
timber production
Source: Tim Pearson, Winrock International
Rate of Carbon Sequestration for Douglas Fir5 tC/ha yr x 20 yrs
=100 tC/ha= 148 tCO2/ac
Source: Tim Pearson, Winrock International
9
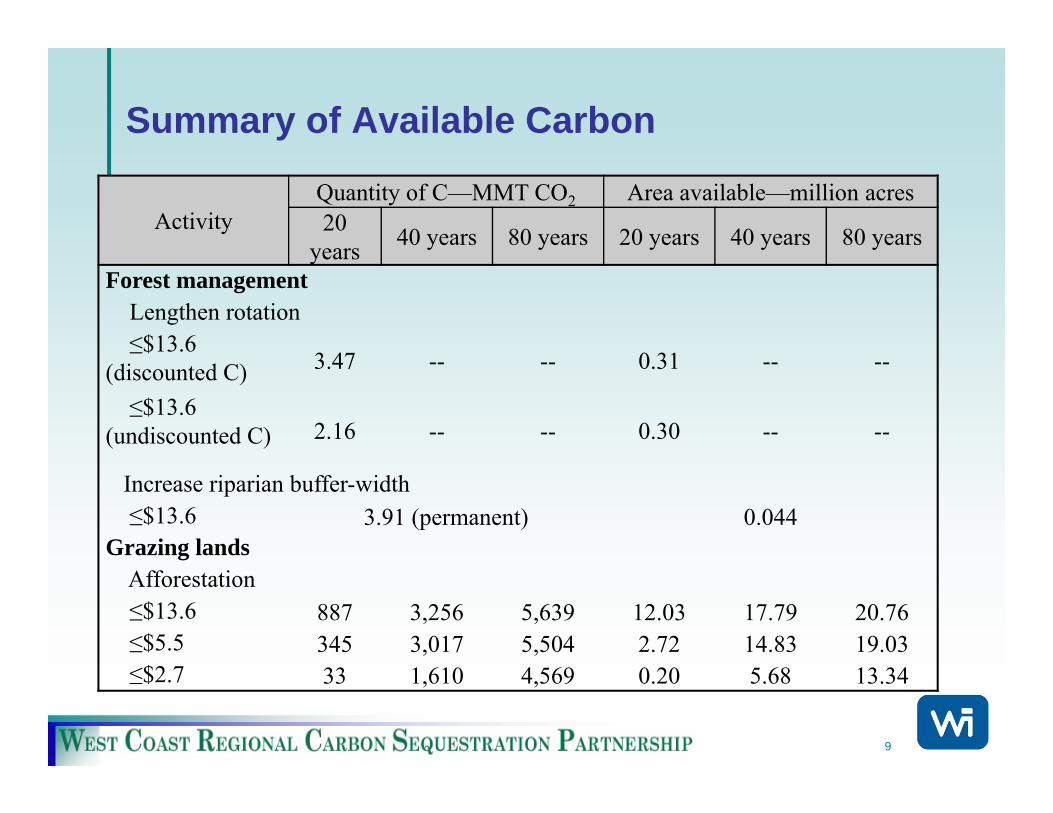
Summary of Available Carbon
ActivityQuantity of C—MMT CO2 Area available—million acres20
years 40 years 80 years 20 years 40 years 80 years
Forest managementLengthen rotation≤$13.6
(discounted C) 3.47 -- -- 0.31 -- --
≤$13.6 (undiscounted C) 2.16 -- -- 0.30 -- --
Increase riparian buffer-width≤$13.6 3.91 (permanent) 0.044
Grazing landsAfforestation≤$13.6 887 3,256 5,639 12.03 17.79 20.76≤$5.5 345 3,017 5,504 2.72 14.83 19.03≤$2.7 33 1,610 4,569 0.20 5.68 13.34
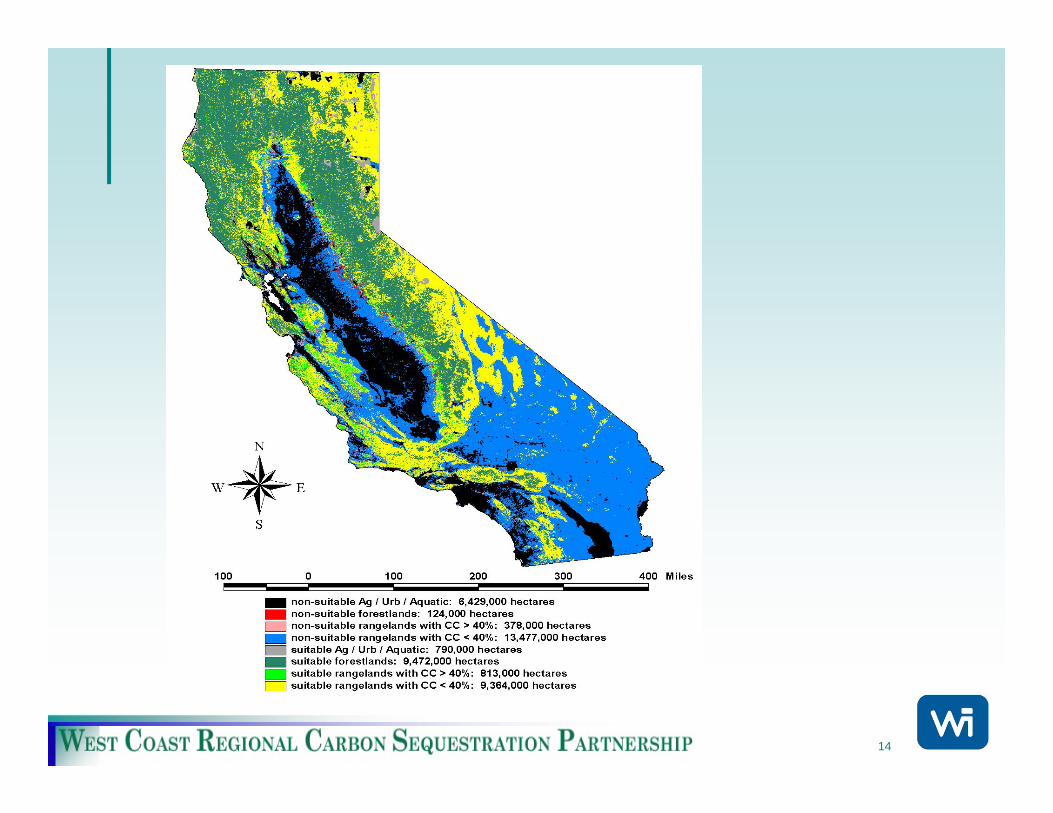
10
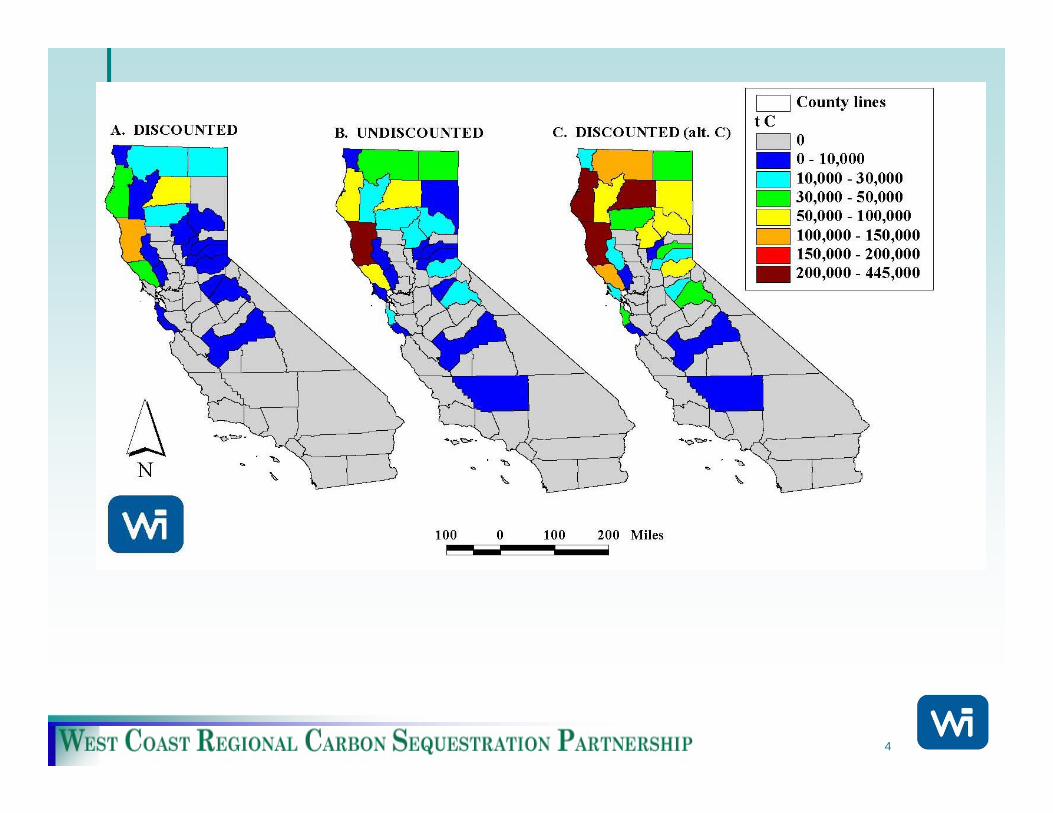
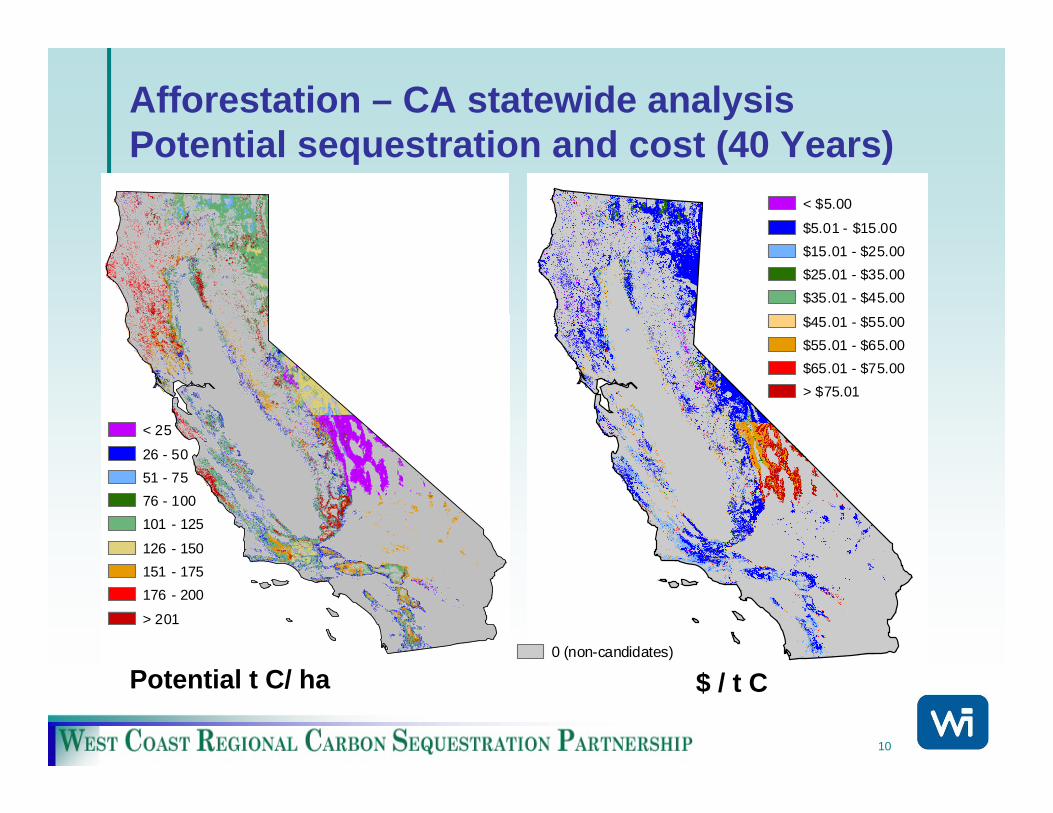
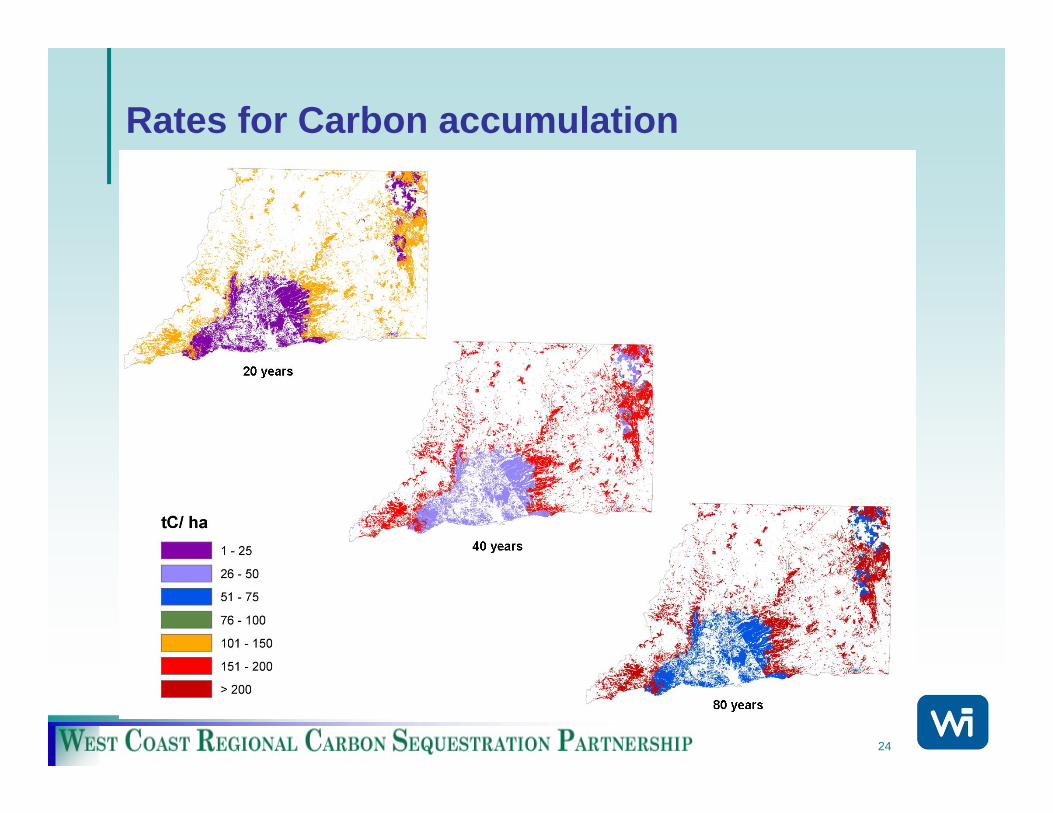
< 25
26 - 5051 - 7576 - 100101 - 125
126 - 150151 - 175176 - 200
> 201
Potential t C/ ha
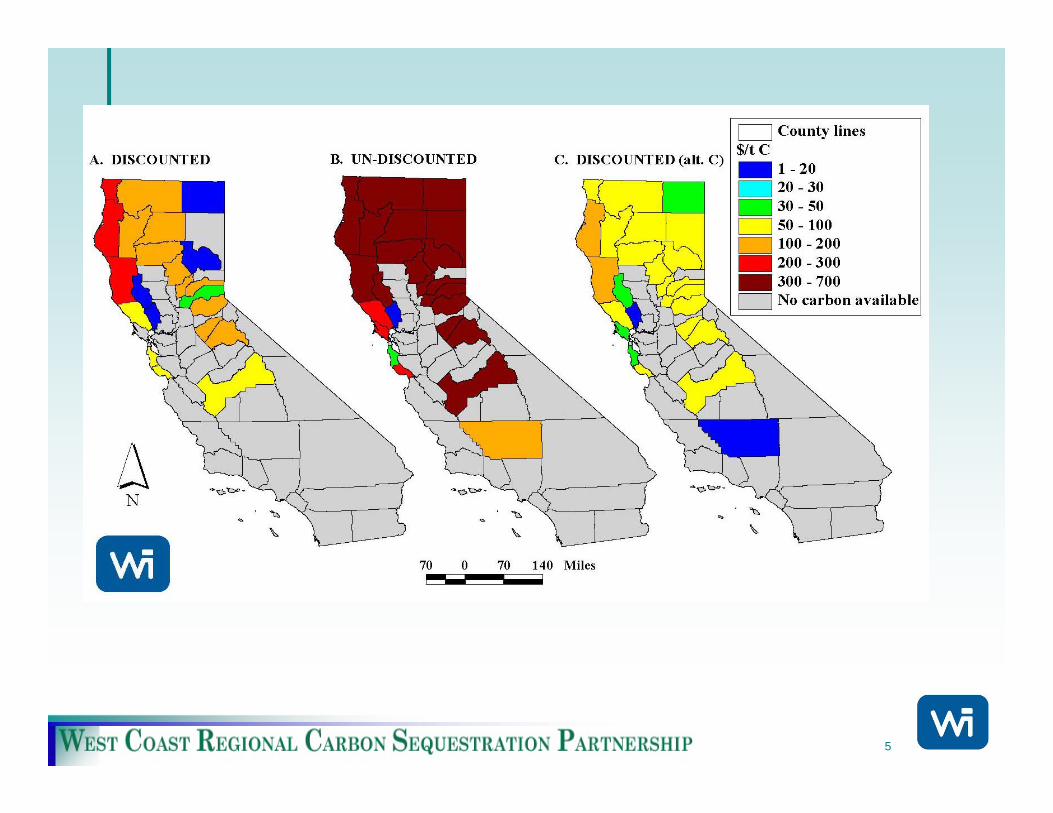
Afforestation – CA statewide analysisPotential sequestration and cost (40 Years)
< $5.00
$5.01 - $15.00$15.01 - $25.00$25.01 - $35.00$35.01 - $45.00
$45.01 - $55.00$55.01 - $65.00$65.01 - $75.00> $75.01
$ / t C0 (non-candidates)
11
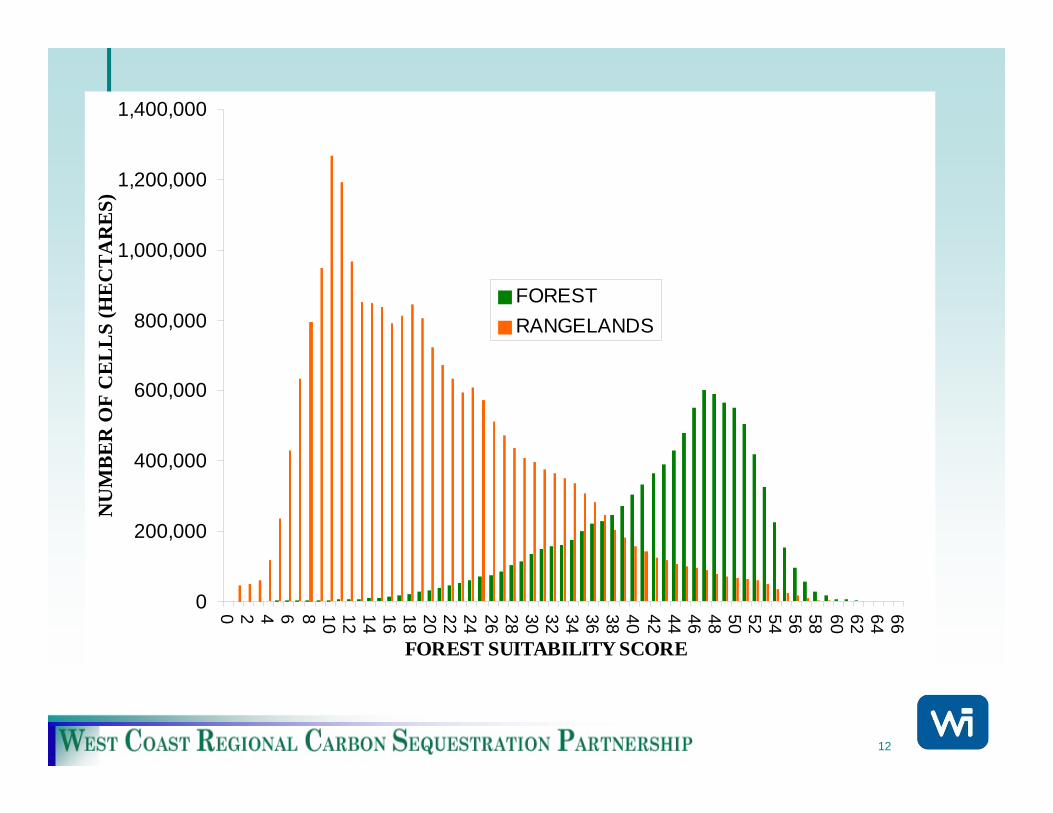
12
0
200,000
400,000
600,000
800,000
1,000,000
1,200,000
1,400,000
0 2 4 6 8 10 12 14 16 18 20 22 24 26 28 30 32 34 36 38 40 42 44 46 48 50 52 54 56 58 60 62 64 66
FOREST SUITABILITY SCORE
NU
MB
ER
OF
CE
LL
S (H
EC
TA
RE
S)
FORESTRANGELANDS
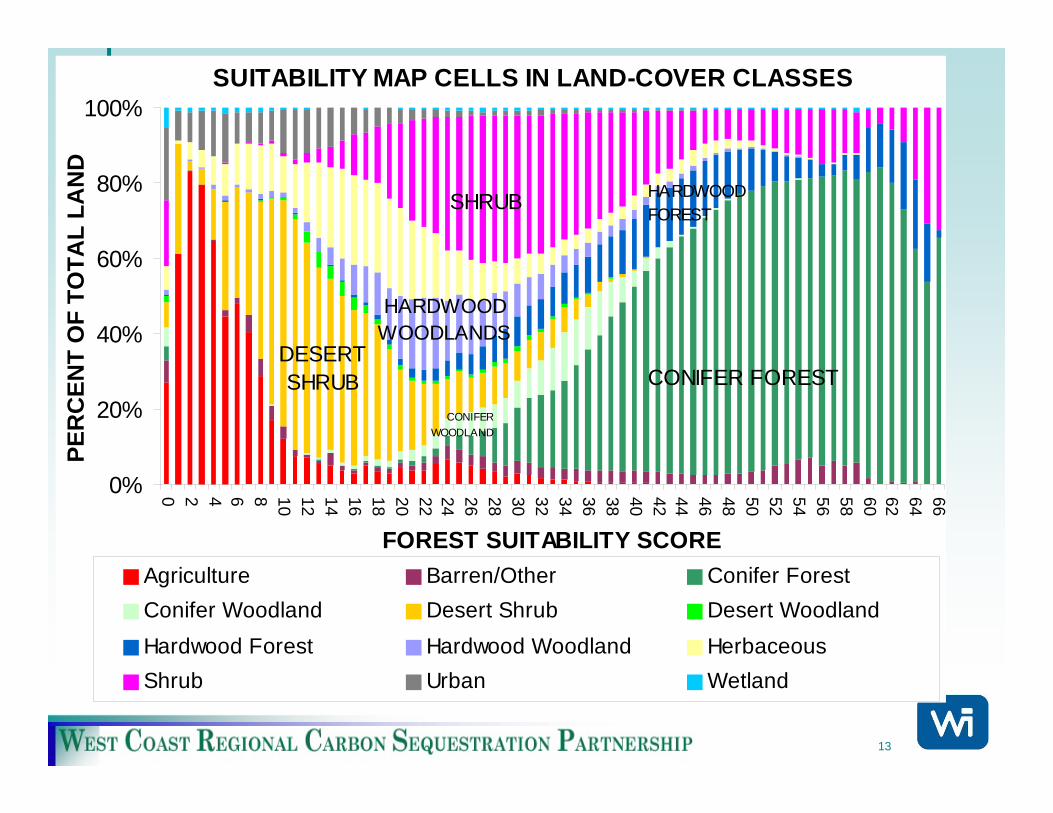
13
SUITABILITY MAP CELLS IN LAND-COVER CLASSES
0%
20%
40%
60%
80%
100%
0 2 4 6 8 10 12 14 16 18 20 22 24 26 28 30 32 34 36 38 40 42 44 46 48 50 52 54 56 58 60 62 64 66
FOREST SUITABILITY SCORE
PER
CEN
T O
F TO
TAL
LAN
D
Agriculture Barren/Other Conifer ForestConifer Woodland Desert Shrub Desert WoodlandHardwood Forest Hardwood Woodland HerbaceousShrub Urban Wetland
CONIFER FOREST
SHRUB
CONIFERWOODLAND
DESERTSHRUB
HARDWOODWOODLANDS
HARDWOODFOREST
14
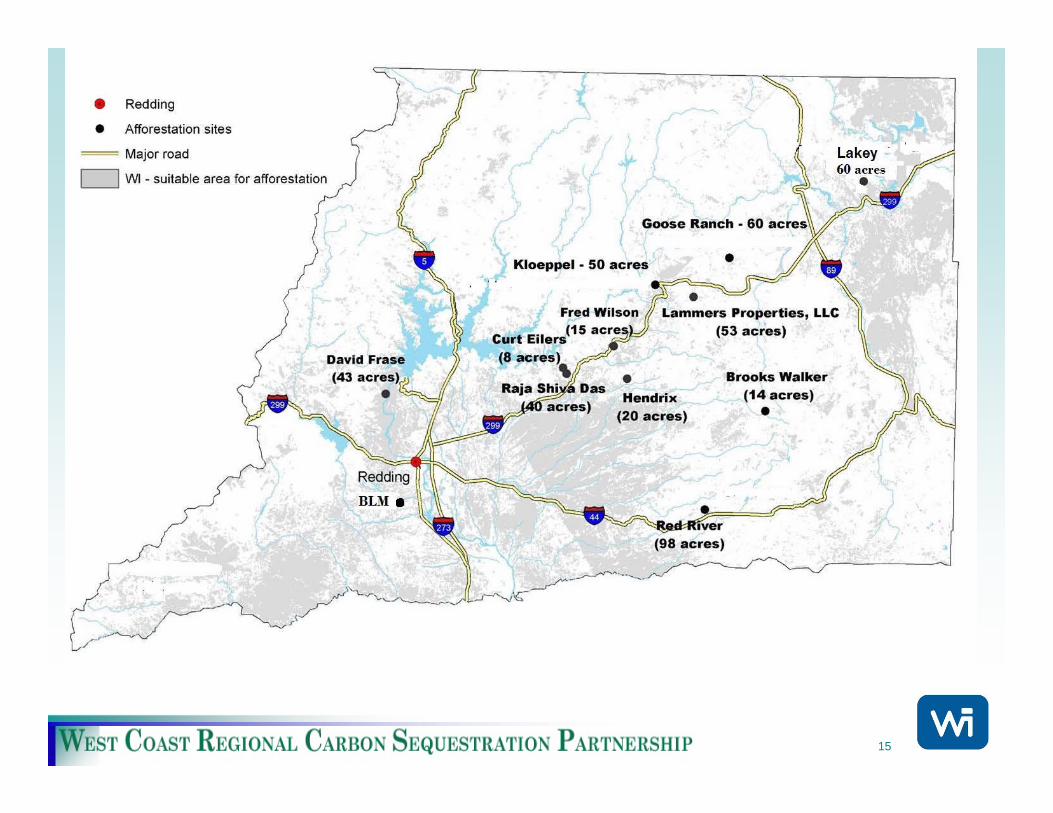
15
Shasta Afforestation Projects - map
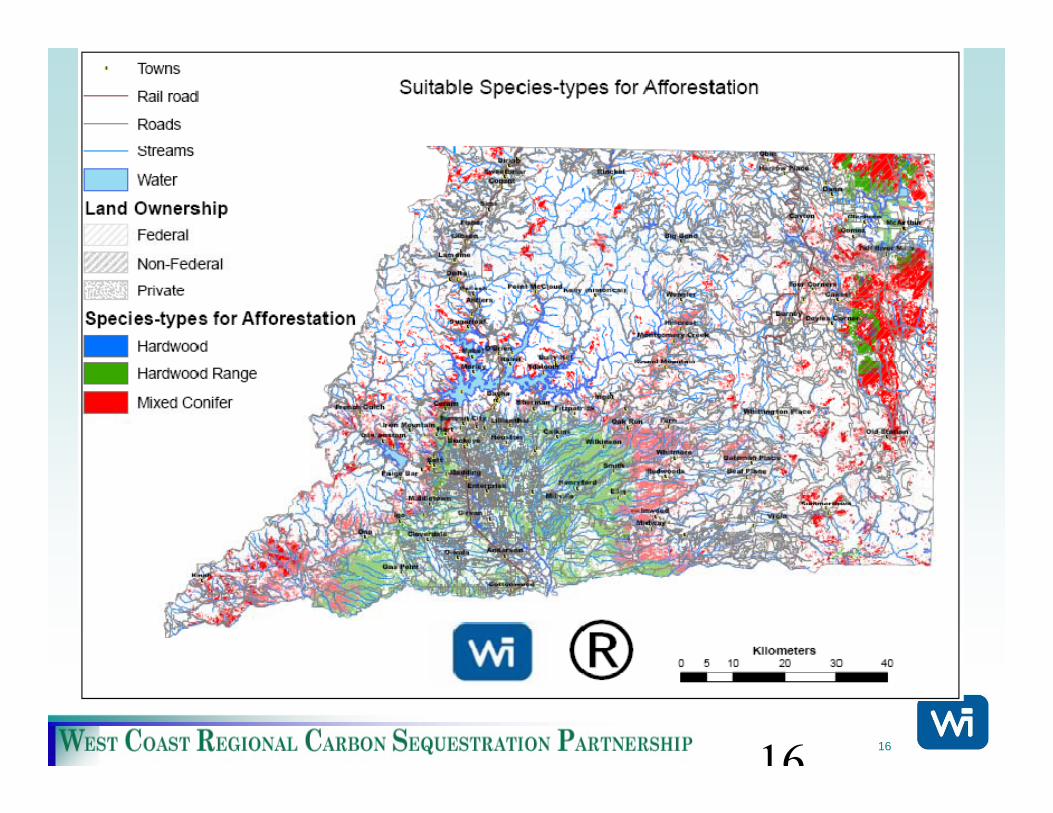
1616
1717
18
19
20
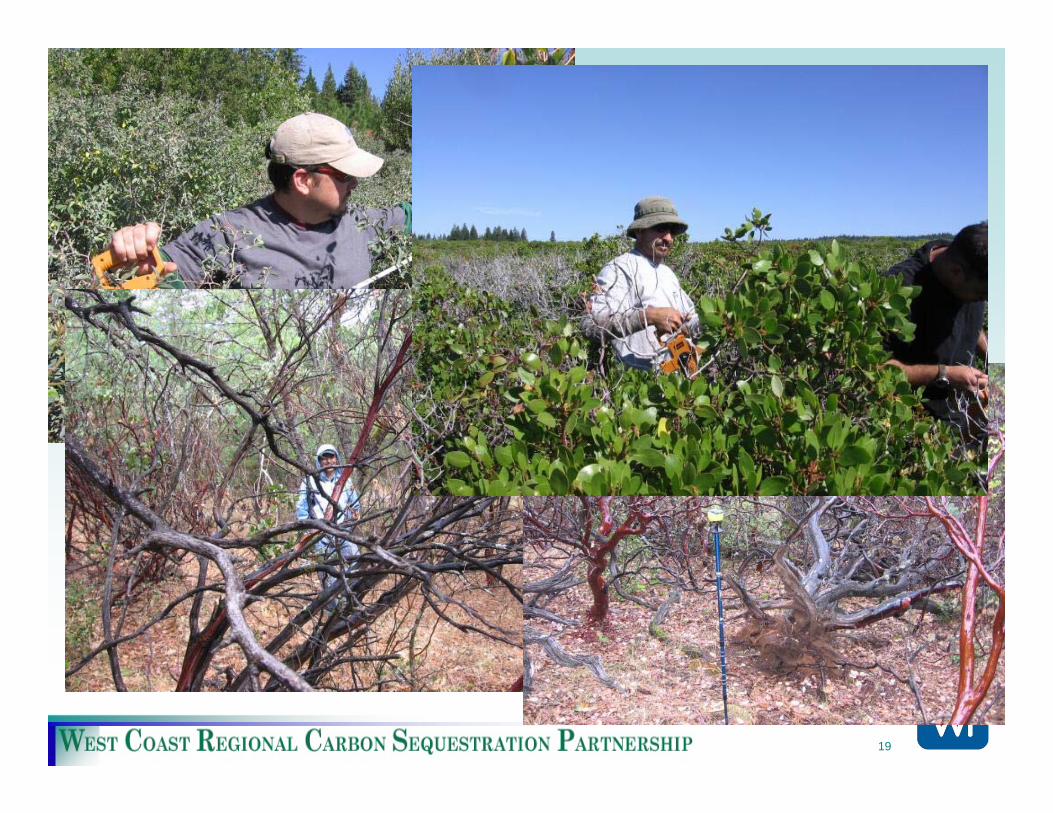
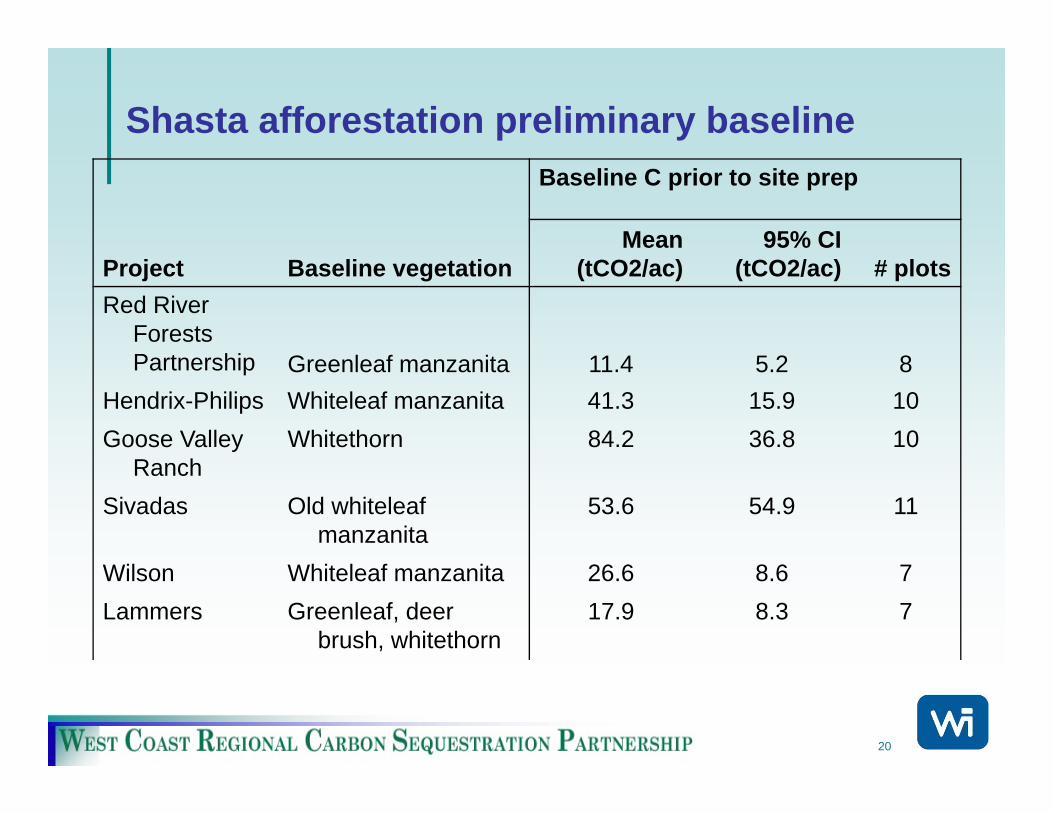
Shasta afforestation preliminary baselineBaseline C prior to site prep
Project Baseline vegetationMean
(tCO2/ac)95% CI
(tCO2/ac) # plotsRed River
Forests Partnership Greenleaf manzanita 11.4 5.2 8
Hendrix-Philips Whiteleaf manzanita 41.3 15.9 10Goose Valley
RanchWhitethorn 84.2 36.8 10
Sivadas Old whiteleaf manzanita
53.6 54.9 11
Wilson Whiteleaf manzanita 26.6 8.6 7Lammers Greenleaf, deer
brush, whitethorn17.9 8.3 7
21
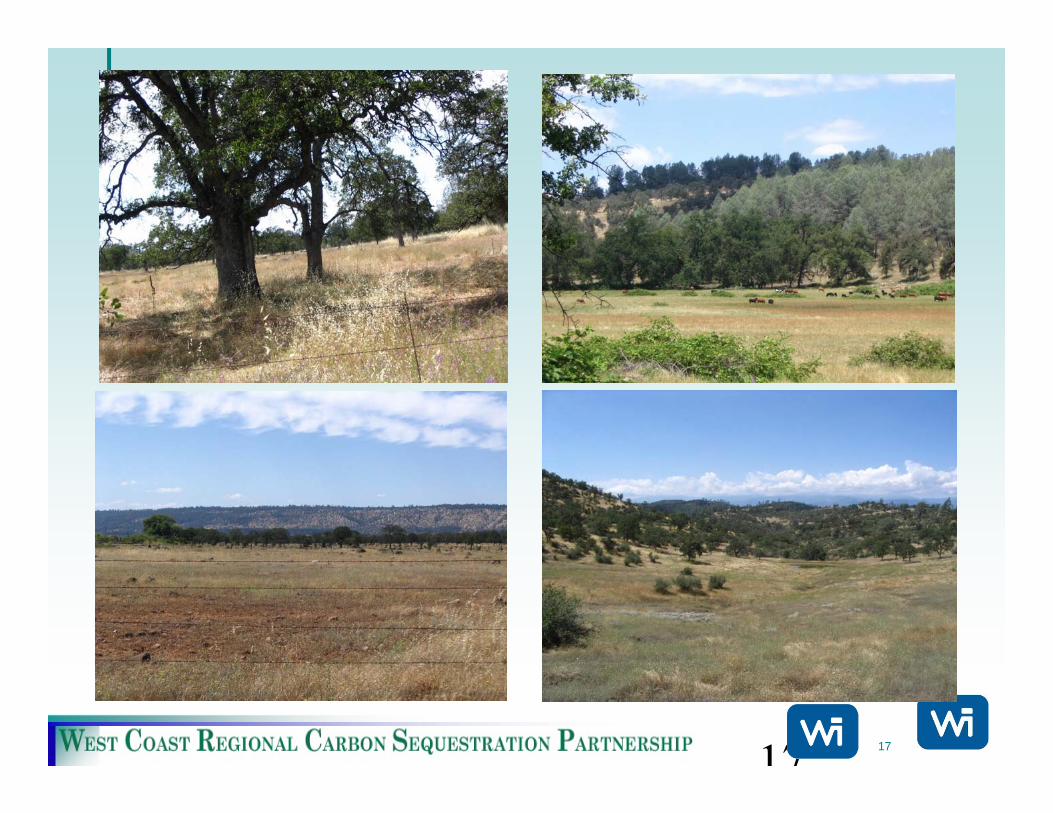
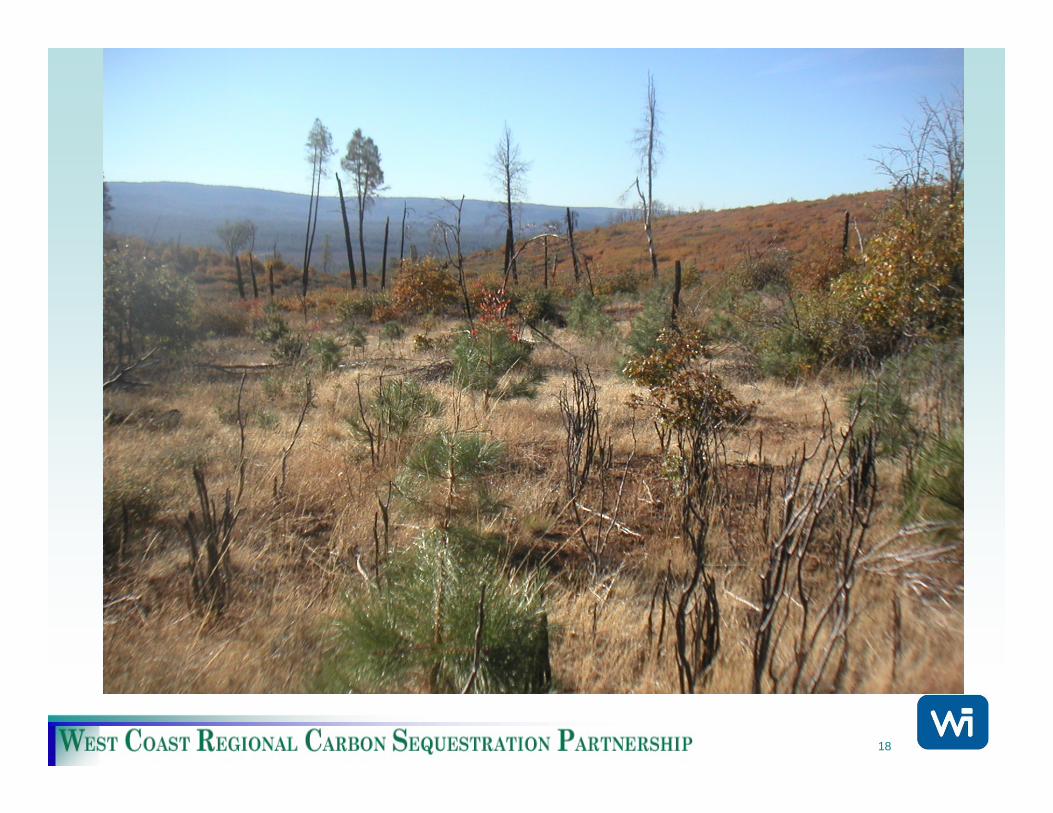
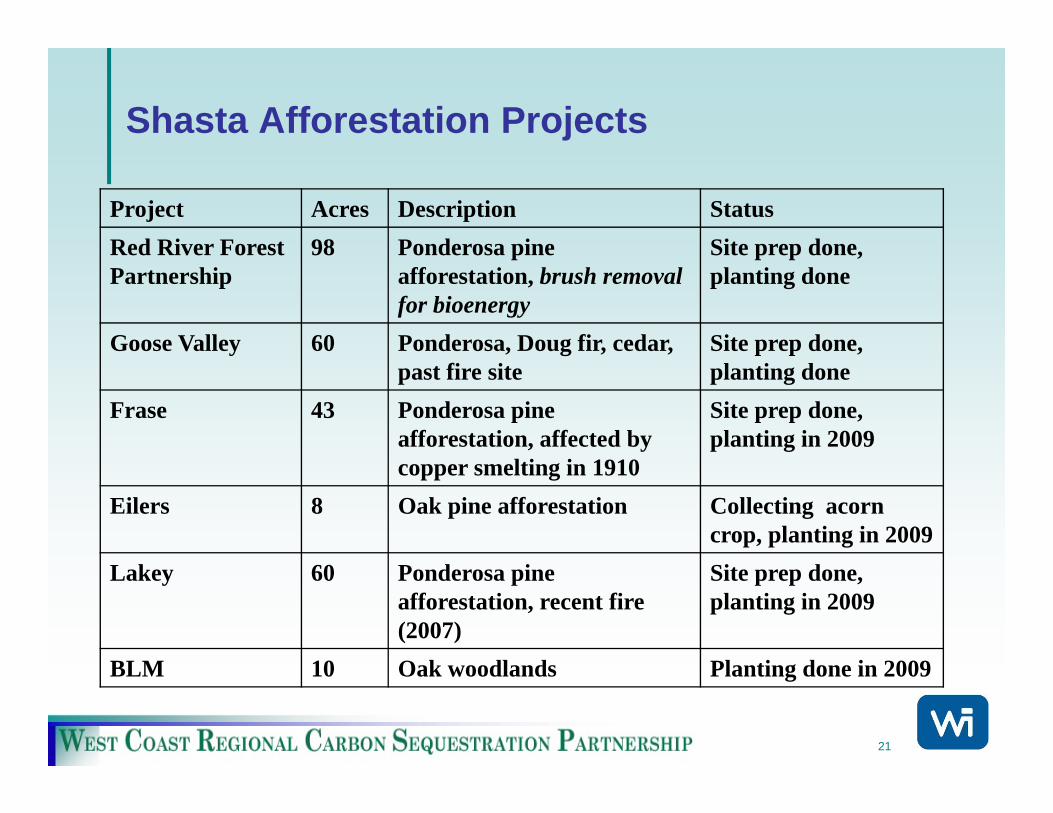
Shasta Afforestation Projects
Project Acres Description StatusRed River Forest Partnership
98 Ponderosa pine afforestation, brush removal for bioenergy
Site prep done, planting done
Goose Valley 60 Ponderosa, Doug fir, cedar, past fire site
Site prep done, planting done
Frase 43 Ponderosa pine afforestation, affected by copper smelting in 1910
Site prep done,planting in 2009
Eilers 8 Oak pine afforestation Collecting acorn crop, planting in 2009
Lakey 60 Ponderosa pine afforestation, recent fire (2007)
Site prep done, planting in 2009
BLM 10 Oak woodlands Planting done in 2009
22
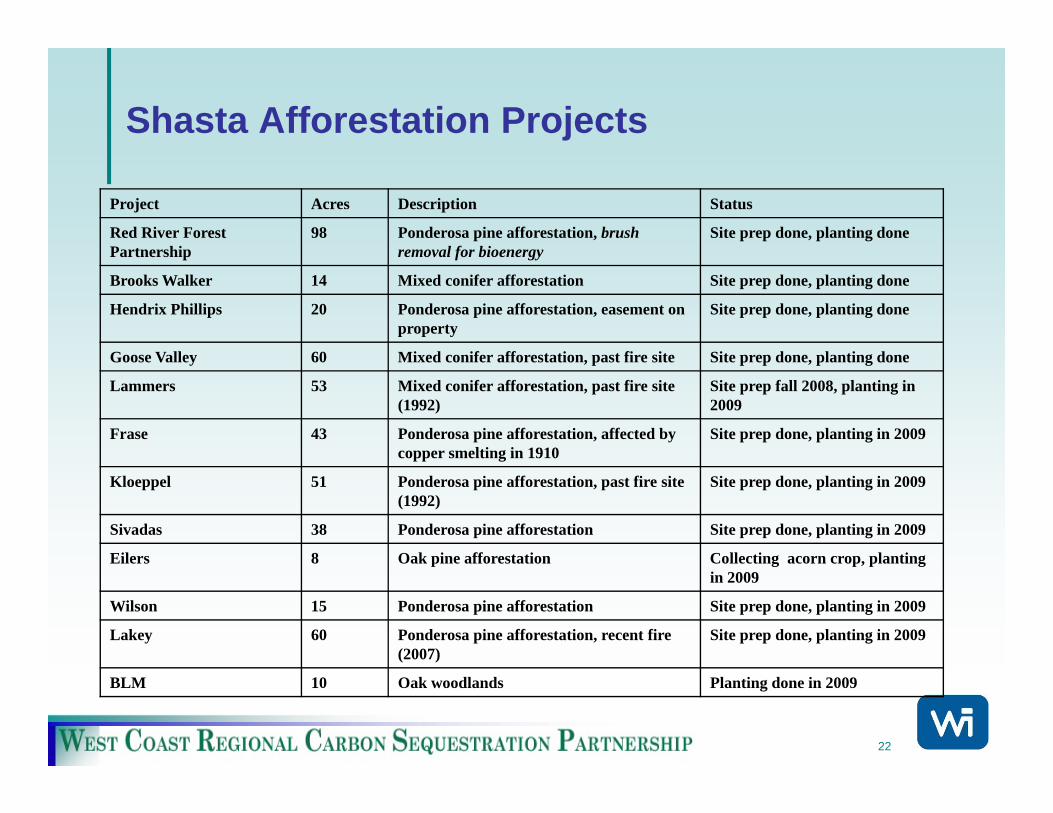
Shasta Afforestation Projects
Project Acres Description Status
Red River Forest Partnership
98 Ponderosa pine afforestation, brush removal for bioenergy
Site prep done, planting done
Brooks Walker 14 Mixed conifer afforestation Site prep done, planting done
Hendrix Phillips 20 Ponderosa pine afforestation, easement on property
Site prep done, planting done
Goose Valley 60 Mixed conifer afforestation, past fire site Site prep done, planting done
Lammers 53 Mixed conifer afforestation, past fire site (1992)
Site prep fall 2008, planting in 2009
Frase 43 Ponderosa pine afforestation, affected by copper smelting in 1910
Site prep done, planting in 2009
Kloeppel 51 Ponderosa pine afforestation, past fire site (1992)
Site prep done, planting in 2009
Sivadas 38 Ponderosa pine afforestation Site prep done, planting in 2009
Eilers 8 Oak pine afforestation Collecting acorn crop, planting in 2009
Wilson 15 Ponderosa pine afforestation Site prep done, planting in 2009
Lakey 60 Ponderosa pine afforestation, recent fire (2007)
Site prep done, planting in 2009
BLM 10 Oak woodlands Planting done in 2009
23
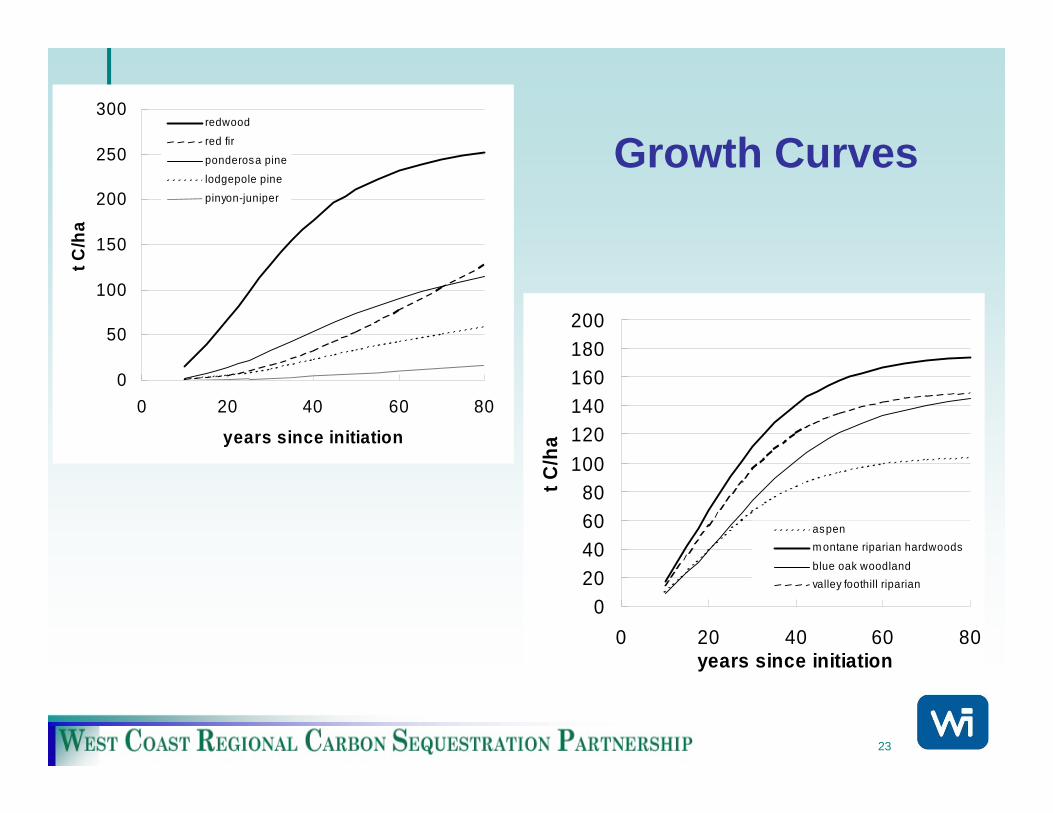
Growth Curves
0
50
100
150
200
250
300
0 20 40 60 80
years since initiation
t C/h
a
redwood
red firponderosa pine
lodgepole pinepinyon-juniper
020406080
100120140160180200
0 20 40 60 80years since initiation
t C/h
aaspenm ontane riparian hardwoods
blue oak woodlandvalley foothill riparian
24
Rates for Carbon accumulation
25
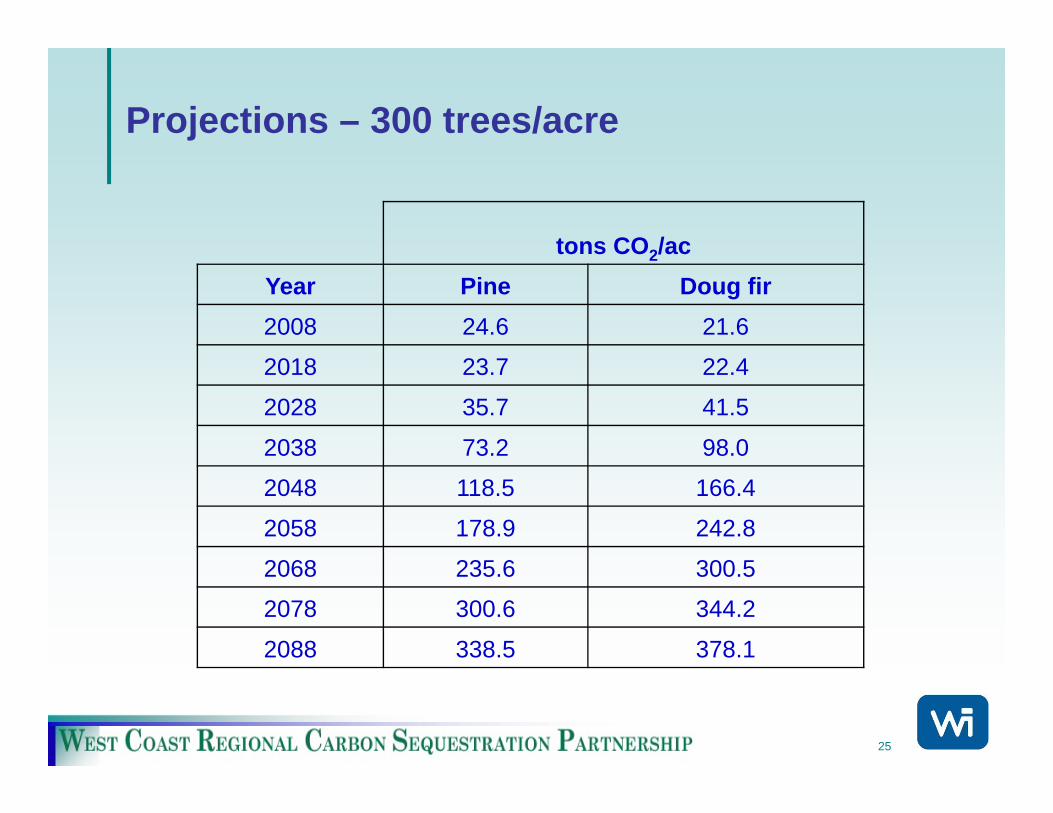
Projections – 300 trees/acre
tons CO2/acYear Pine Doug fir2008 24.6 21.6
2018 23.7 22.4
2028 35.7 41.5
2038 73.2 98.0
2048 118.5 166.4
2058 178.9 242.8
2068 235.6 300.5
2078 300.6 344.2
2088 338.5 378.1
26
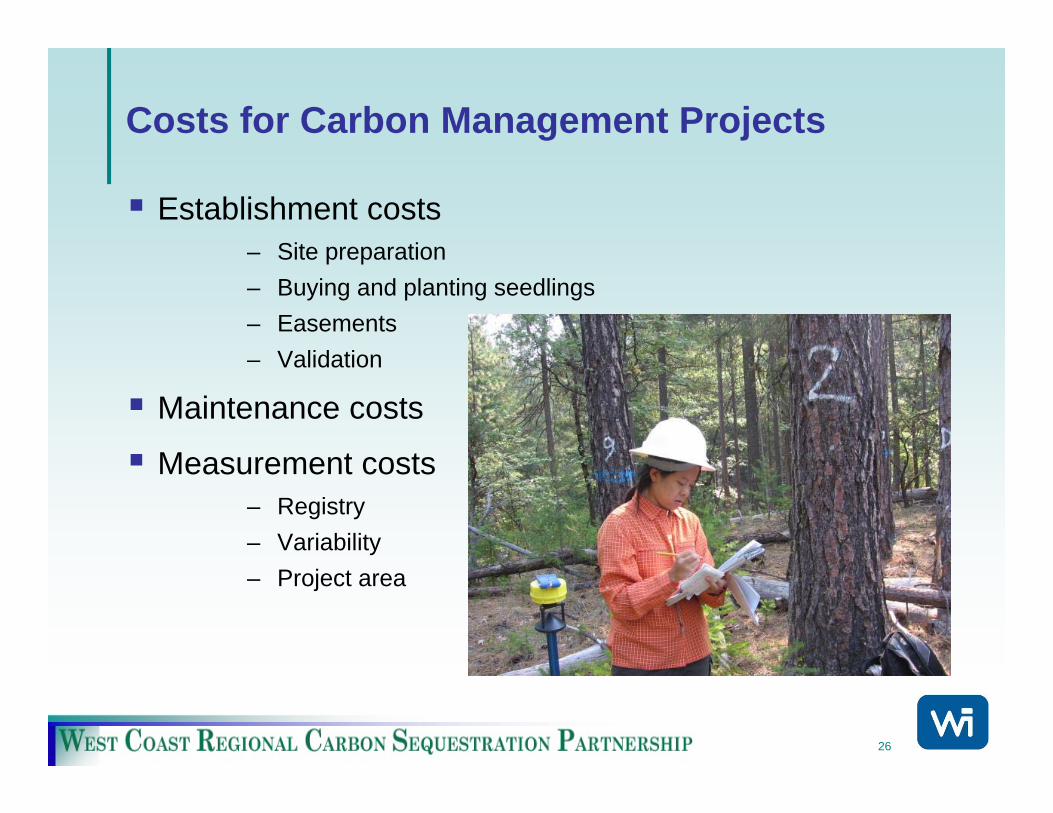
Costs for Carbon Management Projects
Establishment costs– Site preparation– Buying and planting seedlings– Easements– Validation
Maintenance costs
Measurement costs– Registry– Variability– Project area
27
Costs for Carbon Management Projects
Opportunity costs• Existing income from:
• Farming• Grazing• Wood products
Carbon alone rarely covers all costs
28
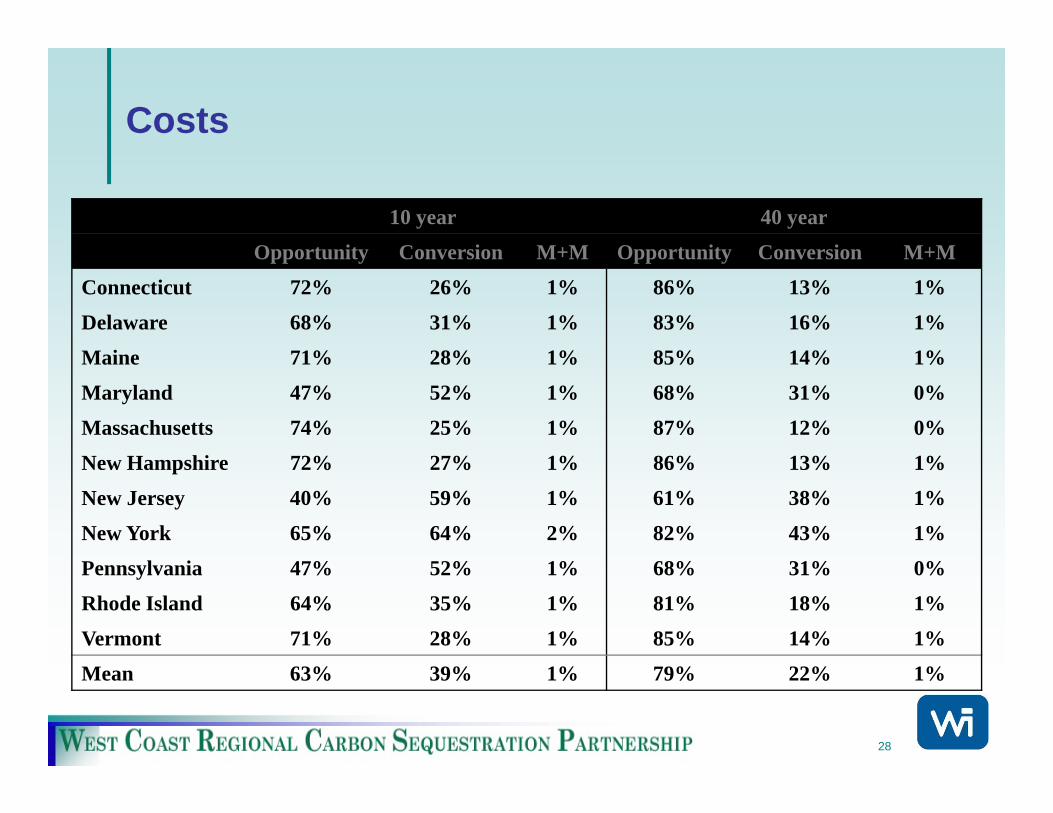
Costs
10 year 40 year
Opportunity Conversion M+M Opportunity Conversion M+M
Connecticut 72% 26% 1% 86% 13% 1%
Delaware 68% 31% 1% 83% 16% 1%
Maine 71% 28% 1% 85% 14% 1%
Maryland 47% 52% 1% 68% 31% 0%
Massachusetts 74% 25% 1% 87% 12% 0%
New Hampshire 72% 27% 1% 86% 13% 1%
New Jersey 40% 59% 1% 61% 38% 1%
New York 65% 64% 2% 82% 43% 1%
Pennsylvania 47% 52% 1% 68% 31% 0%
Rhode Island 64% 35% 1% 81% 18% 1%
Vermont 71% 28% 1% 85% 14% 1%
Mean 63% 39% 1% 79% 22% 1%
29
Policy issues
Regulation of offsets, rather than of forest sector
Ensuring additionality is critical
Regulatory identification of forestry practices is inappropriate
Co-benefits are high in forest projects