Terrestrial Magma Ocean Solidification and Formation of a Candidate D 00 Layer by Alessondra Springmann B.A., Wellesley College (2007) Submitted to the Department of Earth, Atmospheric, and Planetary Sciences in partial fulfillment of the requirements for the degree of Master of Science in Earth and Planetary Sciences at the MASSACHUSETTS INSTITUTE OF TECHNOLOGY June 2011 c Alessondra Springmann, MMXI. All rights reserved. The author hereby grants to MIT permission to reproduce and distribute publicly paper and electronic copies of this thesis document in whole or in part. Author .............................................................. Department of Earth, Atmospheric, and Planetary Sciences May 18, 2011 Certified by .......................................................... Linda T. Elkins-Tanton Assistant Professor Thesis Supervisor Accepted by ......................................................... Maria T. Zuber E. A. Griswold Professor of Geophysics Head of the Department
Transcript
Terrestrial Magma Ocean Solidification
and Formation of a Candidate D′′ Layer
by
Alessondra Springmann
B.A., Wellesley College (2007)
Submitted to theDepartment of Earth, Atmospheric, and Planetary Sciencesin partial fulfillment of the requirements for the degree of
E. A. Griswold Professor of GeophysicsHead of the Department
2
Terrestrial Magma Ocean Solidification
and Formation of a Candidate D′′ Layer
by
Alessondra Springmann
Submitted to theDepartment of Earth, Atmospheric, and Planetary Sciences
on May 18, 2011, in partial fulfillment of therequirements for the degree of
Master of Science in Earth and Planetary Sciences
Abstract
In this thesis we investigate the solidification of early magma oceans on the Earthand the formation of a deep dense layer at the core-mantle boundary. We also studythe concentrations and densities of the last layers of the solidified magma ocean andhow they create a deep dense layer after solid-state overturn. The deep dense layerthat forms in our model matches the bulk physical properties of the D′′ layer observedby other workers. This layer is also sufficiently dense that the bulk of its materialis not reentrained by the mantle after the onset of convection, and that this layeris enriched in incompatible elements such as samarium and neodymium regardlessof distribution coefficients used for incompatible elements in mantle minerals suchas perovskite. However, we found that this probable D′′ layer is more enriched insamarium than is to be expected for a planet’s mantle which evolves from an initiallychondritic composition.
Thesis Supervisor: Linda T. Elkins-TantonTitle: Assistant Professor
3
4
Acknowledgments
Foremost, I am grateful for my research and academic advisors, Linda T. Elkins-Tanton and Richard Binzel. Their patience and willingness to explain concepts to mehas been invaluable. Richard W. Carlson’s guidance and time regarding incompatibleelement behaviors were incredibly helpful and generous. James L. Elliot, Miri E. Skol-nik, Richard G. French, Paul R. Weissman, Blanche E. Staton, Jane A. Connor, andJudith Tripp deserve acknowledgment for their support as well.
Regarding content and structure, Susan D. Benecchi’s detailed comments wentabove and beyond the call of duty; I am grateful for her continued guidance and men-toring. Andrew D. Wickert, Mariela C. Perignon, and Francesca E. DeMeo providededits and useful conversations. Matthew F. Lockhart has been the best officemateI could ask for; this paper owes a good deal to his presence. Emily C. Davidsonprovided insight into mass balance, isotopes of rare-Earth elements, and the motiva-tion necessary to continue working on this project. Zachary J. Bailey has listenedconsistently and compassionately when he was not providing more Wagner and punsthan should be allowed by law—thank you for the gneiss hikes.
On the technical side, Karl C. Ramm introduced me to Ubuntu; David S. Glasserprovided useful conversations about git and version control; and Kevin A. Riggle en-abled more consistent server uptime. Tim D. Smith and Benjamin J. Kaduk providedconversations about isotopes and moles.
While I learned about the differences between barium sulfate and barite, JanHanson, Uma Mahadevan, Douglas A. Corley, and William Prange helped me tobetter appreciate Group II minerals. Robin Winn also deserves thanks for teachingrelaxation techniques.
The Inverness Yacht Club remains a second home, and I am especially gratefulfor the generosity and care of the Darley and Biller families. The support of myparents, Toni Littlejohn and Christopher Springmann, has been unwavering. EricB. Holmes brought three important things to this thesis: trips to the UC Davis geologylibrary, a relentlessly positive big-picture outlook, and focused encouragement. Hewas instrumental in providing specific feedback, clarifying my thought and writingprocesses, and ultimately seeing this project worked on and completed.
This research was partially supported by an NSF Astronomy grant to L. T. Elkins-Tanton.
With apologies to Hunter S. Thompson:
“We can’t stop here. This is adiabat country!”
5
6
In Memory of James Elliot
1943–2011
Teacher, mentor, and friend
7
8
1 Introduction
Terrestrial planets likely formed by accretion of differentiated planetary embryos and
by sweeping up planetesimals that remain after planetary embryo formation (Cham-
bers, 2004; Canup, 2008; Raymond et al., 2009, and references therein). The heat of
accretion caused material in the upper portions of early terrestrial planets’ mantles
to melt (Safronov, 1978; Weidenschilling et al., 1997). With each planetary embryo
collision, the proto-Earth’s mantle likely melted and differentiated, resulting in the
mantle having gone through the differentiation and melting process numerous times.
Little evidence remains from Earth’s early history, as it has been erased by billions
of years of mantle convection and plate tectonics. Among many others, there are two
specific measurements made on the modern Earth that may be explained by magma
ocean processes: the existence of a dense layer at Earth’s core-mantle boundary, as
well as the concentrations of rare-Earth elements in rocks extracted from the mantle.
At present, Earth has a structure characterized by layers: crust, mantle, and a
dense region at the core-mantle boundary (CMB), and likely “acquired its primary
layered structure. . . very early in its history,” (Lay et al., 1998) including the strat-
ification present at the CMB. The lowermost layer in the mantle above the core is
known as the D′′ layer (Figure 1), and has a host of physical characteristics (density,
thickness) that distinguish it from the surrounding layers inside the Earth, detectable
through seismic studies (Garnero, 2000).
There is evidence that a mineralogical phase change occurs in the D′′ layer, making
it physically distinct from the mantle above it (Oganov and Ono, 2004). It has been
suggested that the D′′ layer could be a graveyard for slab “dregs” (Garnero, 2000).
Regardless of what explains the seismic discontinuities in this region of the Earth, it
is likely this layer has a very high density, in contrast with the mantle (Lay et al.,
1998). Various models predict the D′′ layer to be from 150 km to 300 km in thickness
(Kendall and Shearer, 1994; Garnero, 2000; Oganov and Ono, 2004; Wentzcovitch
et al., 2006), while tomographic inversion studies show the heterogeneity of this layer
(Garnero, 2000).
9
6,378 km
3,488 km
0 km
radi
us
D” Layer
crust and lithospherelower mantle
outer core (molten)
innercore(solid)
Figure 1: A cartoon of the interior of the Earth, showing the core, mantle, and crust,with the D′′ layer at the core-mantle boundary. Adapted from Beatty et al. (1999).
The decay of 146-samarium to 142-neodymium can provide insights into early
events in Earth’s history. This decay chain is used because 146-samarium was pro-
duced in significant amounts during the supernova event that created our solar system
(Maji et al., 2006), and has a half-life of 1.03× 10⁸ years (Lugmair et al., 1983). Due
to the length of its half-life, all 146-samarium present at the beginning of the solar
system decayed to 142-neodymium during the first 400-500 Ma of Earth’s history and
thus these isotopes are useful for investigating early mantle events (Rollinson, 2007).
The relative abundances of samarium and neodymium in Earth’s mantle should
not be affected by the formation of Earth’s core or volatile loss during terrestrial
accretion (Boyet and Carlson, 2005). Not only extremely similar in terms of compat-
ibility because of their similar radius and valence states, samarium and neodymium
are both lithophile elements (Amelin and Rotenberg, 2004)–that is, they are elements
concentrated in Earths crust and mantle (as opposed to the terrestrial core). Sm
and Nd are also refractory, having high condensation temperatures of approximately
1400◦C (Carlson and Boyet, 2008). As both are lithophile and refractory elements,
10
their relative abundances in terrestrial rocks should remain unchanged despite events
such as core formation or weathering; thus we assume that their abundance ratios
are similar to both solar system and bulk planetary values (Amelin and Rotenberg,
2004).
DePaolo and Wasserburg (1976) measured the neodymium isotope abundances in
terrestrial rocks and found that they followed the average abundances of neodymium
isotopes in chondrite meteorites, which are believed to be the building blocks of Earth
(Ringwood, 1966). As terrestrial neodymium departures from chondritic values are
small, DePaolo and Wasserburg (1976) use epsilon notation (Equation 1) to measure
neodymium concentration deviations in samples from terrestrial standards (Boyet and
Carlson, 2005). Crustal rocks, which have been extracted from the mantle, have a
ε142Nd value of 0 compared to the terrestrial La Jolla standard, while chondrites have
a negative ε142Nd value (DePaolo and Wasserburg, 1976; Boyet and Carlson, 2005;
Carlson and Boyet, 2008). Figure 2 shows deviations in 142Nd/144Nd for a variety
of meteorites, compared to a terrestrial standard for neodymium in units of µ142Nd
(Equation 2), which has a multiplier of 1,000,000 instead of 10,000 as for ε142Nd.
ε142Nd =
(
142Nd144Nd
)sample(
142Nd144Nd
)standard
− 1
× 10, 000 (1)
µ142Nd =
(
142Nd144Nd
)sample(
142Nd144Nd
)standard
− 1
× 1, 000, 000 (2)
If the Earth formed primarily from chondrite meteorites, and the relative abun-
dances of the lithophiles samarium and neodymium were not affected by core forma-
tion, then there should be no appreciable difference between ε142Nd values of terres-
trial samples and chondrites.
However, there is a difference between the ε142Nd values of terrestrial rocks and
chondrite meteorites that cannot be resolved. There are two possible explanations:
one, that Earth formed out of a different class of meteorites with an ε142Nd value
11
Figure 2: Deviations in 142Nd/144Nd for a variety of meteorites expressed in µ142Nd ,or parts per million difference relative to the average value of the terrestrial La Jollaneodymium standard. The dark yellow bar shows the average and 2σ µ142Nd valuesfor standards and all terrestrial rocks younger than 3.6 Ga. The light yellow barshows the range observed for Archaean samples (Boyet et al., 2003; Caro et al., 2003,2006; Boyet and Carlson, 2006; Bennett et al., 2007). Meteorite data are from Boyetand Carlson (2005) and Carlson et al. (2007) (filled symbols) and Nyquist et al.(1995); Andreasen and Sharma (2006); Rankenburg et al. (2006) (open symbols).After Carlson and Boyet (2008), used with permission.
12
closer to that of what is seen in terrestrial rocks today. Second, and alternatively,
there could exist an unsampled reservoir deep within in the Earth that contains
material with an even more negative (“subchondritic”) ε142Nd value that offsets the
superchondritic ε142Nd value of the mantle and crust, such that the bulk silicate Earth
composition would have a chondritic ε142Nd value. If the latter assumption is correct,
how would this unsampled, ε142Nd enriched reservoir have formed during the Earth’s
formation and solidification?
Carlson and Boyet (2008) propose that a hidden mantle reservoir, which does
not participate in mantle convection and is enriched in neodymium and samarium,
could resolve the terrestrial excess of neodymium isotopes compared to chondrite
meteorites, assuming that the Earth formed with chondritic abundances for these
refractory lithophile elements.
The D′′ is a candidate for this proposed enriched mantle reservoir due to its high
density contrast with the material above it in the mantle. Because of its high den-
sity and likely negative melt buoyancy (Knittle, 1998) this layer is predicted to not
participate in mantle convection and thus would retain its initial concentrations of
rare-Earth elements (REEs), specifically those of samarium and neodymium, over the
age of the Earth without mixing with the rest of the mantle.
Elkins-Tanton (2008) explored the solidification of magma oceans on Earth and
Mars, as well as the creation of and timescales for atmosphere generation. This model
uses known mineral stabilities as a function of pressure to determine at what depth
assemblages will solidify in the mantle, and while tracking both evolving liquid com-
positions of and trace element concentrations in the whole-mantle magma ocean. Here
we extend the model from Elkins-Tanton (2008) to investigate the formation and com-
position of a deep, dense layer in the terrestrial mantle formed during magma ocean
solidification, and whether the present concentrations of rare-Earth elements such as
neodymium and samarium are consistent with the bulk silicate Earth composition
originating from chondritic meteorites.
Also discussed is whether the properties of the deep dense layer produced in
this model are consistent with enriched reservoir predictions, as well as the current
13
D′′ layer. In Section 2, the model used by Elkins-Tanton (2008) and in this work
is described. In Section 3 the formation of a deep dense layer by this model is dis-
cussed, especially regarding stability of this layer and its concentrations of rare-earth
elements. In Section 4 we comment on the significance of the REE concentrations in
this deep dense layer, and in Section 5 we discuss the implications of our results.
14
2 Methods
In this section we present a brief description of the methods used by Elkins-Tanton
(2008) (hereafter the E-T2008 model) to model terrestrial magma ocean solidification,
the assumptions used in this paper, as well as an overview of how the model treats the
solidification and eventual overturn of the terrestrial magma ocean and fractionation
of minerals therein.
We assume in this work that the entire mantle has been in a fully-molten, magma
ocean stage. Several workers (including Smith et al., 1970; Wood et al., 1970; Warren,
1985; Tonks and Melosh, 1993) suggest that an impactor-created full-mantle magma
ocean is not likely, and recent work by Canup (2008) predicts that impactors would
melt up to 2000 km of the Earth’s mantle, thus creating a deep, but not full-mantle,
magma ocean. Although a single impactor would not have provided sufficient energy
to melt the entire mantle at its present depth, it is assumed that the entirety of
the mantle experienced a magma ocean state during Earth’s accretion, and thus a
whole-mantle terrestrial magma ocean assumption is made for this work.
Regarding composition of the magma ocean, the oxide species used in the E-
T2008 model are silicon dioxide, aluminum oxide, iron oxide, magnesium oxide, and
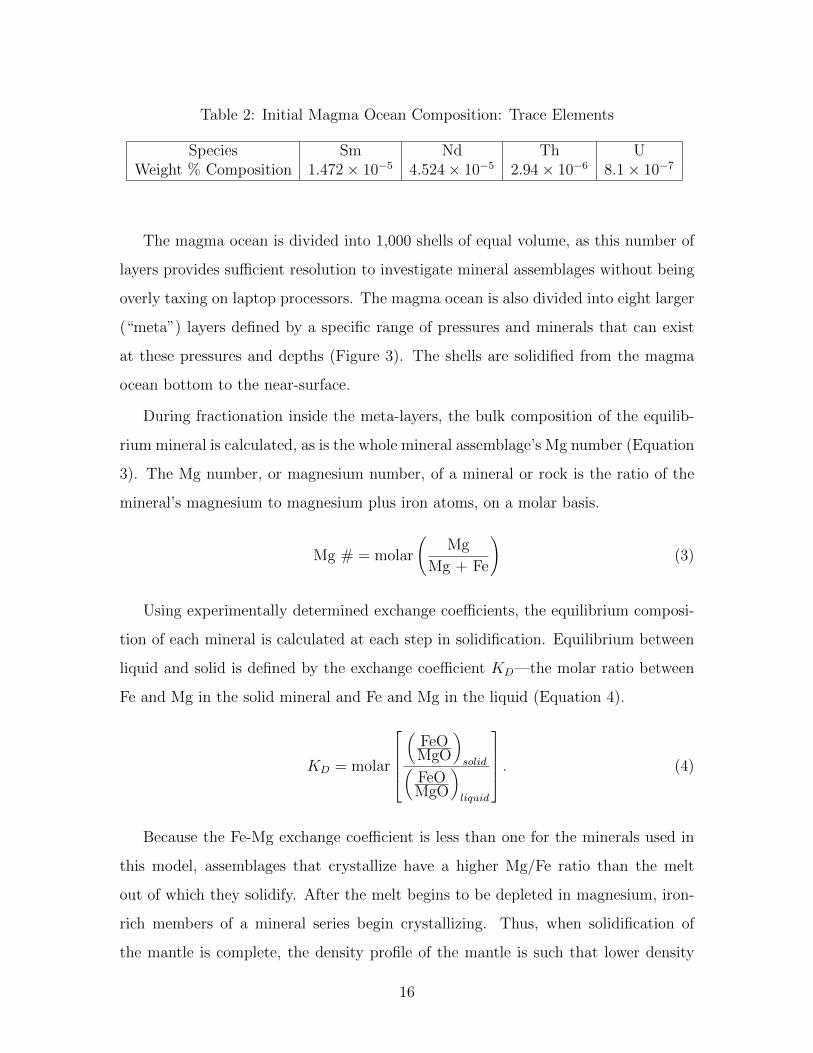
calcium oxide (Table 1); and the trace elements used in this thesis, which vary from
those used in the E-T2008 model, are samarium, neodymium, thorium, and uranium
(Table 2). Samarium and neodymium are used in this work, as opposed to lutetium
and hafnium, as we can compare the concentrations of the former two elements to
results from Boyet and Carlson (2005) and Carlson and Boyet (2008). The initial mass
percents for the oxides are from Hart and Zindler (1986), reflecting the composition
of the bulk silicate Earth (bulk silicate Earth), and the initial mass percents for the
trace elements are from Anders and Grevesse (1989).
Table 1: Initial Magma Ocean Composition: Major Element Oxides
Figure 3: Mineral assemblages by depth which solidify from a full-Earth magma oceanin this model. The percentage of each pressure/depth range occupied by a particularassemblage is given on the right side of the figure. After Elkins-Tanton (2008).
17
cumulates are near the bottom of the solidified ocean, and higher density cumulates
are clustered at the near-surface of the ocean.
As cumulates fractionate out of the melt, it is assumed that the bulk composition
of these minerals is isolated from the melt, and that the composition of these solids
remains constant and does not change as the solidification process proceeds.
The composition of the solidified layer is subtracted from the remaining magma
ocean liquids at each step, resulting in an evolving magma ocean composition. As
the solidification process occurs on a short timescale (as short as 10,000 years, Elkins-
Tanton, 2008), it is thus assumed that there is no mixing between solidified layers.
Any mixing among layers would be caused by density differences of assemblages due
to differences in compositions at different depths.
As solidification progresses, incompatible elements become concentrated in the
remaining liquids of the magma ocean. In this work, emphasis is placed on incompat-
ible elements, defined as having a distribution coefficient, D, less than 1 (Albarede,
2003). Incompatible elements are species that occasionally fit into the cation sites
of minerals, such as olivine, replacing iron or magnesium. Due to either a difference
in charge or ionic radii, some incompatible elements do not enter the cation sites of
minerals and thus become relatively enriched in the magma melt.
For this analysis, the incompatible elements used are rare earth elements, which
are characterized by having charges higher than the ions they replace in the mineral
lattice (Albarede, 2003). Thus, at the near surface of the magma ocean, the residual
liquids become enriched in these incompatible rare Earth elements.
Due to convection, the temperature in the melted mantle varies adiabatically with
depth. It is assumed that the entire mantle is molten from the core to the surface; in
other words, the entire mantle is initially above the liquidus.
The melting temperature of the bulk silicate mantle depends on the pressure of
material in the magma ocean, as well as the solidus temperature of melting initiation.
This solidus used in this work is based on one calculated by Abe (1997) and the model
used by Elkins-Tanton (2008), and hybridizes these two solidi to create a new model
which is believed to be physically reasonable at both high and low temperatures and
18
pressures.
An adiabatic temperature profile is the curve that describes how temperature
varies with pressure under adiabatic expansion conditions. Adiabatic processes are
characterized by not giving or receiving heat, or by constant entropy; most mantle
processes occur at approximately constant entropy (Asimow, 1999).
The adiabat is steeper than the solidus and the two curves intersect at the bottom
of the mantle. At their intersection point, solidification begins, and therefore in the
model used, solidification proceeds from the base of the magma ocean toward the
surface. If the adiabat were more shallow, it would not intersect the solidus until
closer to the surface of the planet.
Solidification begins at the bottom of the magma ocean with magnesium-bearing
minerals crystallizing preferentially over iron-bearing minerals during magma ocean
solidification. Mantle solidification proceeds up through the mantle, with the den-
sity of minerals calculated as a function of temperature and composition at specific
pressures (Figure 3). These densities are calculated at a reference pressure of 1 at-
mosphere, and in the mantle at depth these pressures would be far greater. The
reference pressure used in calculations is useful for comparing material at different
pressures from across the mantle and for ordering material by density. As crystal-
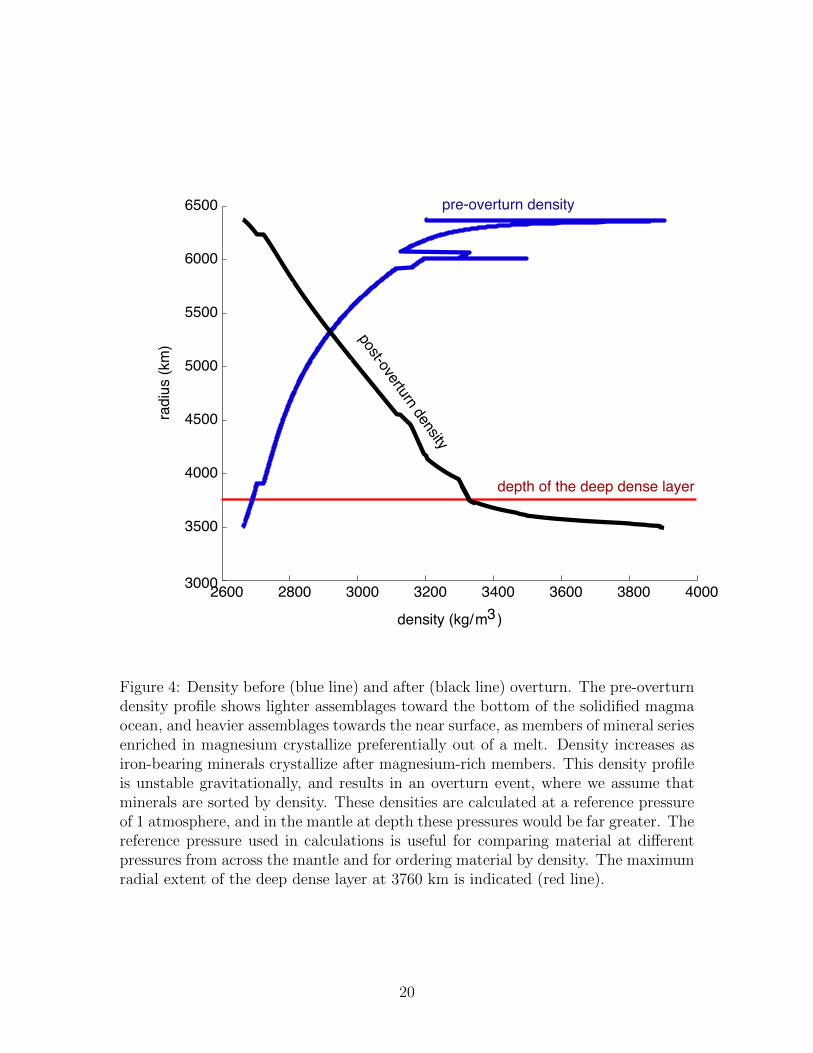
lization progresses from the bottom of the mantle to the surface, the density profile
of the mantle reflects assemblages with lighter densities at the bottom of the mantle
and denser assemblages closer to the surface (Figure 4). While the model does not
solidify the last 0.3% by volume of the solidified mantle, it is assumed that at the end
of solidification these remaining liquids solidify along with the rest of the mantle.
The density of each mineral is calculated by passing the Mg number, pressure,
and temperature of the relevant mineral to an equation of state used for calculating
the volume of solids. The widely-adopted equation of state used in the model is the
Birch-Murnaghan equation (Equation 5). Its long use in geophysics has given it a
“certain authority in the literature” (Anderson, 1995). In this equation, P is pressure,
T is temperature, K0T is the bulk modulus material at a pressure of P = 0 and a
constant temperature, K ′0 is the bulk modulus pressure derivative at P = 0, and
19
2600 2800 3000 3200 3400 3600 3800 40003000
3500
4000
4500
5000
5500
6000
6500
density (kg/m3)
radi
us (k
m)
pre-overturn density
post-overturn density
depth of the deep dense layer
Figure 4: Density before (blue line) and after (black line) overturn. The pre-overturndensity profile shows lighter assemblages toward the bottom of the solidified magmaocean, and heavier assemblages towards the near surface, as members of mineral seriesenriched in magnesium crystallize preferentially out of a melt. Density increases asiron-bearing minerals crystallize after magnesium-rich members. This density profileis unstable gravitationally, and results in an overturn event, where we assume thatminerals are sorted by density. These densities are calculated at a reference pressureof 1 atmosphere, and in the mantle at depth these pressures would be far greater. Thereference pressure used in calculations is useful for comparing material at differentpressures from across the mantle and for ordering material by density. The maximumradial extent of the deep dense layer at 3760 km is indicated (red line).
20
V/V0 is the ratio of the volume of a solid at a specific temperature to its equilibrium
volume.
The bulk modulus is defined asK = −V(∂P∂V
)T
and is thus proportional to changes
in pressure with respect to volume at constant temperature; it is the amount of
pressure increase required to cause a parcel of matter to decrease in relative volume.
P =3K0T
2
[(V
V0
)7/3
−(V
V0
)5/3]{
1 +3
4(K ′0 − 4)
[(V
V0
)2/3
− 1
]}(5)
The Birch-Murnaghan equation is arranged such that when the correct volume
ratio is provided for a mineral (given the mineral’s specific pressure, temperature, bulk
modulus, and bulk modulus pressure derivative), the equation returns the relevant
volume ratio for the specified pressure and temperature. The mass of each mineral is
then divided by the volume it occupies, yielding a density for each mineral.
Including these residual layers of unsolidified material, the resulting density profile
of the solidified magma ocean is gravitationally unstable, which leads to the cumulates
undergoing an overturn event to a more gravitationally stable configuration. Overturn
is assumed to occur rapidly (Elkins-Tanton, 2008) via Rayleigh-Taylor instabilities
(Elkins-Tanton et al., 2011), and that, after overturn, cumulates are sorted by density,
with the higher density cumulates sinking toward the bottom of the magma ocean and
the lighter cumulates rising toward the near surface of the solidified magma ocean.
21
3 Results
Stability of the Deep Dense Layer As a result of sorting by density during over-
turn, a dense layer of material sinks to the bottom of the solidified magma ocean. In
the model used, the densest materials that sink to the bottom of the solidified magma
ocean during overturn form a layer approximately 250 km thick. This thickness of
this deep dense layer is determined by inspecting the density profile of the magma
ocean after overturn. A discontinuity in the density profile slope leads us to define
material denser than 3,320 kg/m3 to be part of the deep dense layer (Figure 4). The
mass of this layer, calculated by integrating the densities of assemblages in this layer
over the range of radii the layer occupies, is 1.9 × 10²³ kg, which is 3.24% of the
mantle by mass.
In order for the deep dense layer material to participate in mantle convection and
thus be reentrained by the mantle, the material would have to undergo a negative
change in density. In order to have a lower density, the material would have to expand.
We consider a solid material that expands linearly (Equation 3) where the change in
density for a material with thermal expansion coefficient of α = 10−5 K−1, change in
temperature ∆T , and initial density ρi.
∆ρ = ∆Tαρi (6)
The deep dense layer’s density is between 3,300 and 3,900 kg/m3, as calculated
at a reference pressure of 1 atmosphere (at pressure the densities of assemblages in
this layer are higher). For the material at a density of 3,300 kg/m3 a temperature
change of upwards of 5,000 K would be require to expand this material to a density
of 3,100 kg/m3 (Figure 5). Williams and Jeanloz (1990); Lay et al. (1998) predict a
temperature change on the order of 1,000 K across the D′′ layer, so this figure is not
unreasonable. A larger temperature change would be required to expand material at
greater densities such that it would be able to mix with the mantle.
Assuming that material with a density lower than 3,330 kg/m3 is reentrained by
the mantle, this would change the mass of the deep dense layer to be 1.7 × 10²³ kg,
Figure 5: Temperature-based stability of material in the deep dense layer. In orderto achieve a change of 200 kg/m3 in density of the deep dense layer such that thematerial would participate in mantle convection, a change in temperature of upwardsof 5,000 K is required. The dotted lines represent constant density.
23
which is 2.8% of the mantle by mass. As a change in temperature on the order of
1000 K is required for the expansion that would yield this sort of density change, it is
not likely that heating of the lighter material in this region would cause appreciable
changes in the bulk physical properties of the deep dense layer that forms.
Even if material in this layer were to melt, for example from radiogenic heating,
it would very likely be negatively buoyant in comparison to the cumulates residing
above it (Knittle, 1998), and it is thus unlikely that this melt would participate in
mantle convection. As a result, this deep dense layer is stable against participation
in mantle convection, and could remain at the base of the solidified magma ocean for
the age of the Earth.
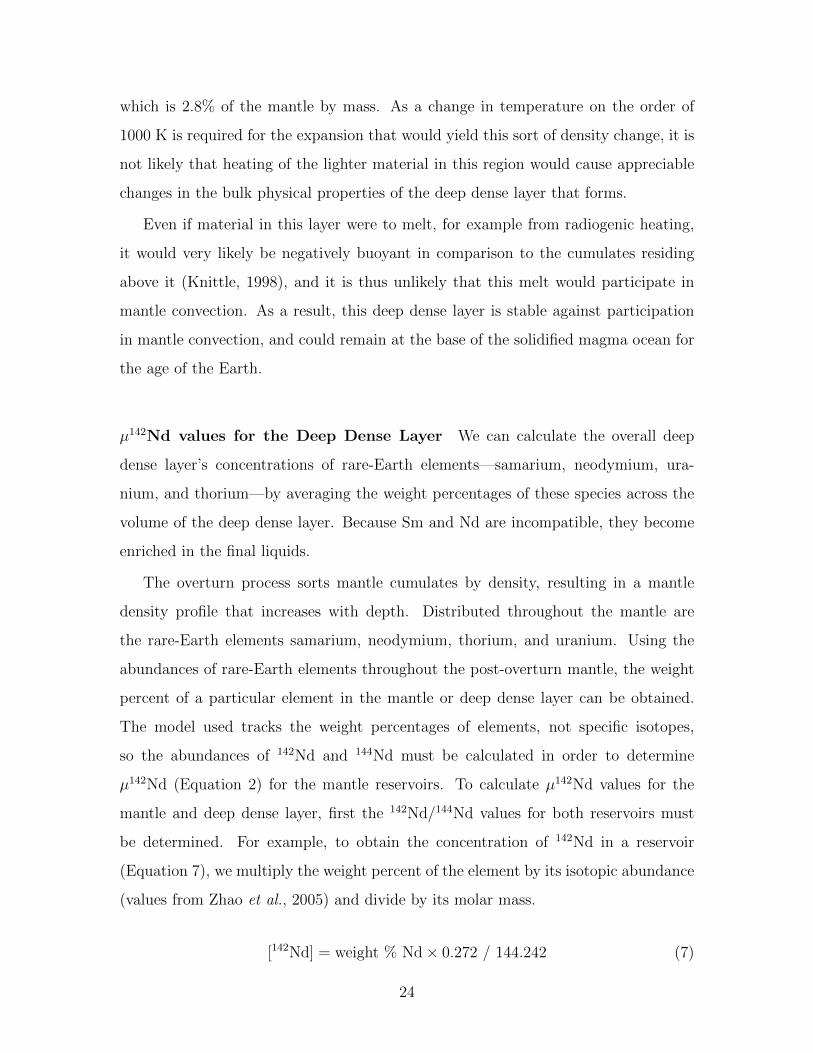
µ142Nd values for the Deep Dense Layer We can calculate the overall deep
dense layer’s concentrations of rare-Earth elements—samarium, neodymium, ura-
nium, and thorium—by averaging the weight percentages of these species across the
volume of the deep dense layer. Because Sm and Nd are incompatible, they become
enriched in the final liquids.
The overturn process sorts mantle cumulates by density, resulting in a mantle
density profile that increases with depth. Distributed throughout the mantle are
the rare-Earth elements samarium, neodymium, thorium, and uranium. Using the
abundances of rare-Earth elements throughout the post-overturn mantle, the weight
percent of a particular element in the mantle or deep dense layer can be obtained.
The model used tracks the weight percentages of elements, not specific isotopes,
so the abundances of 142Nd and 144Nd must be calculated in order to determine
µ142Nd (Equation 2) for the mantle reservoirs. To calculate µ142Nd values for the
mantle and deep dense layer, first the 142Nd/144Nd values for both reservoirs must
be determined. For example, to obtain the concentration of 142Nd in a reservoir
(Equation 7), we multiply the weight percent of the element by its isotopic abundance
(values from Zhao et al., 2005) and divide by its molar mass.
[142Nd] = weight % Nd× 0.272 / 144.242 (7)
24
The 142Nd/144Nd values for chondritic and terrestrial standards are well known,
and so these are evolved from their initial concentrations at 4.567 Ga (the formation
time of the soldest solar system solids (Connelly et al., 2008)) to present day values.
In this model the neodymium and samarium isotope concentrations are evolved as
in one reservoir until 4.5 Ga when the Moon-forming giant impact (Hartmann and
Davis, 1975) is posited to have occurred (Lee et al., 1997). At this point, the mantle
is split into the deep dense layer and the present-day mantle and the concentrations
of neodymium and samarium in these reservoirs evolve independently.
The evolving 142Nd/144Nd values for the mantle and deep dense layer are calculated
by adding the amount of 146Sm that decays to 142Nd over the age of the Earth to the
initial amount of 142Nd in the reservoir, then dividing the amount of 142Nd by 144Nd
to obtain the 142Nd/144Nd ratio.
Once the 142Nd/144Nd ratio of the reservoir in question is calculated, it is then
compared to the terrestrial La Jolla standard, with an 142Nd/144Nd ratio of 1.141840
(Boyet and Carlson, 2005). Subtracting 1 and multiplying by 1,000,000 yields the
µ142Nd value for the reservoir, which can be compared to the predicted µ142Nd values
from Carlson and Boyet (2008).
The resulting µ142Nd values for both the deep dense layer (to be compared to the
early enriched reservoir predicted by Carlson and Boyet (2008)) and the mantle (to be
compared to the early depleted reservoir from Carlson and Boyet (2008)) returned by
our model depend heavily on the concentrations of Nd and Sm in both the deep dense
layer and the mantle, and thus, on the distribution coefficients of these rare-Earth
elements for mantle minerals. Much of the mantle post-solidification is occupied by
mantle perovskite, for which the distribution coefficients of Sm, Nd, Th, and U are not
well constrained (Elkins-Tanton, 2008, and supplemental material referenced therein).
To explore the effects of small changes in the distribution coefficients for rare-Earth
elements, a Monte Carlo simulation was run, varying the distribution coefficients
for both Ca- and MgFe-perovskite from their minimum to maximum values in the
literature (Tables 3 and 4; assuming that Al-perovskite has the same distribution
coefficients as MgFe-perovskite). One thousand different combinations of distribution
25
coefficients for Ca- and MgFe-perovskite were passed to the model in order to return
a range of possible µ142Nd values. Distribution coefficients used in these simulations
for samarium in MgFe-perovskite are represented on the color scale: dark brown
represents a D of close to 0.01, while light brown represents a D near 0.5.
Table 3: REE Partition Coefficients for Calcium Perovskite
Species Minimum Maximum ReferenceSm 1.0 5 Kato et al. (1988); Corgne and Wood (2005);
Corgne et al. (2005)Nd 1 10 Kato et al. (1988); Corgne et al. (2005)U 0.01 1 Kato et al. (1988); Corgne and Wood (2005);
Corgne et al. (2005)Th 1.0 10 Corgne and Wood (2005); Corgne et al. (2005)
Table 4: REE Partition Coefficients for MgFe Perovskite
Species Minimum Maximum ReferenceSm 0.01 0.5 Corgne et al. (2005); Liebske et al. (2005)Nd 0.01 0.02 Corgne et al. (2005)U 0.01 1.0 Corgne et al. (2005); Liebske et al. (2005)Th 0.01 0.2 Corgne et al. (2005); Liebske et al. (2005)
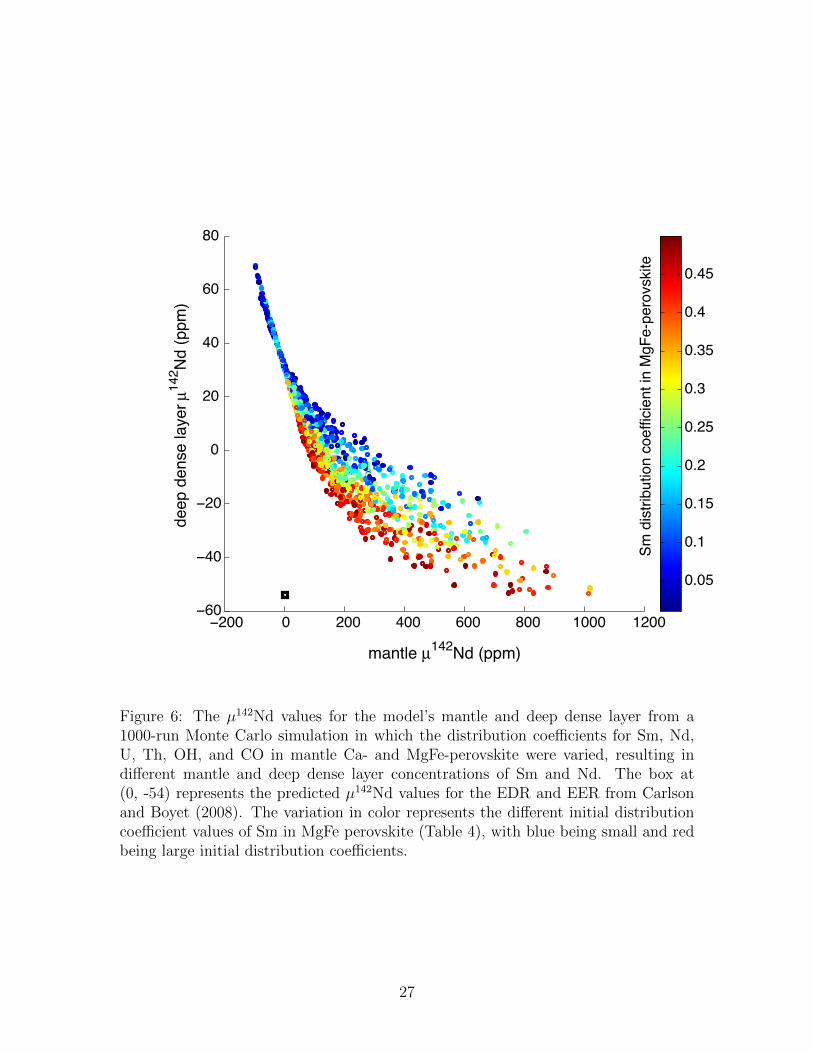
Carlson and Boyet (2008) predicts that for an early enriched reservoir occupying
4% of the mantle mass, the resulting µ142Nd value should be -54, with that of the
early depleted reservoir (mantle minus early enriched reservoir composition) being
0. The results of this Monte Carlo simulation (Figure 6) show that this predicted
combination of µ142Nd values is not possible. These results are inconsistent with a
chondritic initial bulk silicate Earth composition, the implications of which will be
discussed further in Section 4.
26
−200 0 200 400 600 800 1000 1200−60
−40
−20
0
20
40
60
80
mantle µ142Nd (ppm)
deep
den
se la
yer µ
142 N
d (p
pm)
0.05
0.1
0.15
0.2
0.25
0.3
0.35
0.4
0.45
Sm d
istri
butio
n co
effic
ient
in M
gFe-
pero
vski
te
Figure 6: The µ142Nd values for the model’s mantle and deep dense layer from a1000-run Monte Carlo simulation in which the distribution coefficients for Sm, Nd,U, Th, OH, and CO in mantle Ca- and MgFe-perovskite were varied, resulting indifferent mantle and deep dense layer concentrations of Sm and Nd. The box at(0, -54) represents the predicted µ142Nd values for the EDR and EER from Carlsonand Boyet (2008). The variation in color represents the different initial distributioncoefficient values of Sm in MgFe perovskite (Table 4), with blue being small and redbeing large initial distribution coefficients.
27
4 Discussion
Carlson and Boyet (2008) predicts that the µ142Nd value for the early enriched reser-
voir that is 4% by mass of the mantle is -54, indicating a layer highly enriched in
142Nd compared to terrestrial rocks. If our model agrees with that of Carlson and
Boyet (2008), we would expect our deep dense layer layer to have a similar µ142Nd ra-
tio. However, the model used in this work produces µ142Nd values for the deep dense
layer that show over enrichment in 146Sm and thus excessively large µ142Nd values for
the deep dense layer when µ142Nd of the mantle is 0 (Figure 6). If the early depleted
reservoir and the mantle are the same reservoir, and thus the source region for the
terrestrial 142Nd/144Nd standard, by definition they should have a µ142Nd value of 0.
Assuming both formed from the same chondritic source, it is also not possible to
have an early enriched reservoir with a positive µ142Nd value and an early depleted
reservoir with 0. This would be only possible if the early enriched reservoir is negligible
in mass compared to the early depleted reservoir (which it is not in the model used,
at 4% of the mantle mass), and also does not contain enough REEs to change the
Sm/Nd ratio of the early depleted reservoir by enough to create an appreciable change
in 142Nd for the early depleted reservoir.
Inspecting Figure 6 further, some of the solutions have positive µ142Nd values
in both the deep dense layer and mantle. Mass balance dictates that splitting a
source with an initial chondritic samarium to neodymium ratio into two reservoirs
with higher than chondritic (and therefore positive) samarium to neodymium ratios
is not physically possible.
Even though the Sm and Nd concentrations and µ142Nd values for the deep dense
layer produced by our model are not consistent with those predicted by Carlson and
Boyet (2008), the physical properties of this layer match those from other workers.
Specifically, the height of this layer (250 km) matches literature thickness predictions
(Kendall and Shearer, 1994; Garnero, 2000; Oganov and Ono, 2004; Wentzcovitch
et al., 2006; Youngs and Houseman, 2007), and the high density contrast of this layer
with the material above it is consistent with predictions from Knittle (1998).
28
The density of this layer also means that it is stable against expansion due to
increases in temperature. As a temperature change of 5,000 K would be required to
expand this deep dense layer, the assumption that the majority of this layer does not
participate in mantle convection and therefore that its budget of Nd and Sm would
be preserved over the age of the Earth is plausible.
29
5 Conclusions
We showed that a crystallizing magma ocean can produce a deep mantle reservoir
that is stable against being mixed with the mantle over timescales similar to the age
of the Earth. Even if this layer were to increase in temperature, it is likely that the
change in volume and thus density would be insufficiently large for the material in
this reservoir to mix with the overlying mantle.
While we can explain the formation of a stable dense basal layer with the model
used in this work, we cannot produce isotope concentrations in this lower-mantle
reservoir that match predictions consistent with the Earth’s mantle having formed
with a chondritic composition. The concentrations of Sm and Nd in this deep dense
layer suggest that an overabundance of samarium produced during solidification by
the model could be responsible for increasing the µ142Nd of the deep dense layer to
the point where it is super-chondritic and inconsistent with having evolved from a
chondritic source. Thus, we are not able to verify via the 146Sm /142Nd system whether
the BSE composition is consistent with a chondritic terrestrial mantle origin.
Part of the discrepancy between the results of this study and the prediction of
Carlson and Boyet (2008) regarding the µ142Nd values of the mantle and deep dense
layer is that the latter workers use a slightly different set of abundances for their BSE
composition (McDonough and s. Sun (1995) versus Anders and Grevesse (1989) and
Hart and Zindler (1986) in this work). While the deviations between the chondritic
BSE values used are small, they could have a small effect on the final µ142Nd values
calculated by this work.
30
References
Abe, Y. 1997. Thermal and chemical evolution of the terrestrial magma ocean. Physicsof the Earth and Planetary Interiors 100 (1-4), 27–39.
Albarede, F. 2003. Geochemistry: an introduction. Cambridge University Press.
Amelin, Y., and E. Rotenberg 2004. Sm-Nd systematics of chondrites. Earth andPlanetary Science Letters 223 (3-4), 267–282.
Anders, E., and N. Grevesse 1989. Abundances of the elements - Meteoritic and solar.Geochimica et Cosmochimica Acta 53 (1), 197–214.
Anderson, O. 1995. Equations of state of solids for geophysics and ceramic science.Oxford Monographs on Geology and Geophysics. Oxford University Press.
Andreasen, R., and M. Sharma 2006. Solar nebula heterogeneity in p-process samar-ium and neodymium isotopes. Science 314 (5800), 806–809.
Asimow, P. D. 1999. Melting the mantle. In H. Sigurdsson (Ed.), Encyclopedia ofVolcanoes, pp. 55–68. Academic Press.
Beatty, J., C. Petersen, and A. Chaikin 1999. The New Solar System. CambridgeUniversity Press.
Bennett, V. C., A. D. Brandon, and A. P. Nutman 2007. Coupled 142Nd-143Nd isotopicevidence for hadean mantle dynamics. Science 318 (5858), 1907–1910.
Boyet, M., J. Blichert-Toft, M. Rosing, M. Storey, P. Telouk, and F. Albarede 2003.142Nd evidence for early Earth differentiation. Earth and Planetary Science Let-ters 214 (3-4), 427–442.
Boyet, M., and R. W. Carlson 2005. 142Nd Evidence for Early (>4.53 Ga) GlobalDifferentiation of the Silicate Earth. Science 309 (5734), 576–581.
Boyet, M., and R. W. Carlson 2006. A new geochemical model for the Earth’s mantleinferred from 146Sm-142Nd systematics. Earth and Planetary Science Letters 250 (1-2), 254–268.
Canup, R. M. 2008. Accretion of the Earth. Philosophical Transactions of the RoyalSociety A: Mathematical, Physical and Engineering Sciences 366 (1883), 4061–4075.
Carlson, R. W., and M. Boyet 2008. Composition of the Earth’s interior: the impor-tance of early events. Philosophical Transactions of the Royal Society A: Mathe-matical, Physical and Engineering Sciences 366 (1883), 4077–4103.
Carlson, R. W., M. Boyet, and M. Horan 2007. Chondrite barium, neodymium,and samarium isotopic heterogeneity and early Earth differentiation. Sci-ence 316 (5828), 1175–1178.
31
Caro, G., B. Bourdon, J.-L. Birck, and S. Moorbath 2003. 146Sm-142Nd evidencefrom Isua metamorphosed sediments for early differentiation of the Earth’s mantle.Nature 423 (6938), 428–432.
Caro, G., B. Bourdon, J.-L. Birck, and S. Moorbath 2006. High-precision142nd/144nd measurements in terrestrial rocks: Constraints on the early differen-tiation of the Earth’s mantle. Geochimica et Cosmochimica Acta 70 (1), 164–191.
Chambers, J. E. 2004. Planetary accretion in the inner solar system. Earth andPlanetary Science Letters 223 (3-4), 241–252.
Connelly, J. N., Y. Amelin, A. N. Krot, and M. Bizzarro 2008. Chronology of theSolar System’s Oldest Solids. Astrophysical Journal, Letters 675 (2), L121–L124.
Corgne, A., C. Liebske, B. J. Wood, D. C. Rubie, and D. J. Frost 2005. Silicateperovskite-melt partitioning of trace elements and geochemical signature of a deepperovskitic reservoir. Geochimica et Cosmochimica Acta 69 (2), 485–496.
Corgne, A., and B. Wood 2005. Trace element partitioning and substitution mecha-nisms in calcium perovskites. Contributions to Mineralogy and Petrology 149 (1),85–97.
DePaolo, D. J., and G. J. Wasserburg 1976. Nd isotopic variations and petrogeneticmodels. Geophysical Research Letters 3 (5), 249–252.
Elkins-Tanton, L. T. 2008. Linked magma ocean solidification and atmosphericgrowth for Earth and Mars. Earth and Planetary Science Letters 271 (1-4), 181–191.
Elkins-Tanton, L. T., S. Burgess, and Q.-Z. Yin 2011. The lunar magma ocean: rec-onciling the solidification process with lunar petrology and geochronology (abstract#1505). In Proc. 42nd Lunar and Planetary Science Conf., Volume XLII. Lunarand Planetary Institute, Houston.
Garnero, E. 2000. Heterogeneity of the lowermost mantle. Annual Review of Earthand Planetary Sciences 28 (1), 509–537.
Hart, S. R., and A. Zindler 1986. In search of a bulk-Earth composition. ChemicalGeology 57 (3-4), 247–267.
Hartmann, W. K., and D. R. Davis 1975. Satellite-sized planetesimals and lunarorigin. Icarus 24 (4), 504–514.
Kato, T., A. Ringwood, and T. Irifune 1988. Experimental determination of elementpartitioning between silicate perovskites, garnets and liquids: constraints on earlydifferentiation of the mantle. Earth and Planetary Science Letters 89 (1), 123–145.
Kendall, J.-M., and P. M. Shearer 1994. Lateral variations in D double prime thicknessfrom long period shear wave data. Journal of Geophysical Research 99 (B6), 11,575–11,590.
32
Knittle, E. 1998. The solid/liquid partitioning of major and radiogenic elementsat lower mantle pressures: implications for the core-mantle boundary region. InM. Gurnis, M. E. Wysession, E. Knittle, and B. A. Buffett (Eds.), The Core-Mantle Boundary Region, Geodynamics Series 28, pp. 119–130. American Geo-physical Union Press.
Lay, T., Q. Williams, and E. Garnero 1998. The core-mantle boundary layer anddeep Earth dynamics. Nature 392 (6675), 461–468.
Lee, D.-C., A. N. Halliday, G. A. Snyder, and L. A. Taylor 1997. Age and origin ofthe moon. Science 278 (5340), 1098–1103.
Liebske, C., B. Schmickler, H. Terasaki, B. T. Poe, A. Suzuki, K. Funakoshi, R. Ando,and D. C. Rubie 2005. Viscosity of peridotite liquid up to 13 GPa: Implicationsfor magma ocean viscosities [rapid communication]. Earth and Planetary ScienceLetters 240 (3-4), 589–604.
Lugmair, G. W., T. Shimamura, R. S. Lewis, and E. Anders 1983. Samarium-146in the Early Solar System: Evidence from Neodymium in the Allende Meteorite.Science 222 (4627), 1015–1018.
Maji, S., S. Lahiri, B. Wierczinski, and G. Korschinek 2006. Separation of samariumand neodymium: a prerequisite for getting signals from nuclear synthesis. Ana-lyst 131, 1332–1334.
McDonough, W. F., and S. s. Sun 1995. The composition of the Earth. ChemicalGeology 120 (3-4), 223–253. Chemical Evolution of the Mantle.
Nyquist, L. E., H. Wiesmann, B. Bansal, C. Y. Shih, J. E. Keith, and C. L. Harper1995. 146Sm-142Nd formation interval for the lunar mantle. Geochimica et Cos-mochimica Acta 59 (13), 2817–2837.
Oganov, A. R., and S. Ono 2004. Theoretical and experimental evidence for a post-perovskite phase of MgSiO3 in Earth’s D′′ layer. Nature 430 (6998), 445–448.
Rankenburg, K., A. D. Brandon, and C. R. Neal 2006. Neodymium isotope evidencefor a chondritic composition of the moon. Science 312 (5778), 1369–1372.
Raymond, S. N., D. P. O’Brien, A. Morbidelli, and N. A. Kaib 2009. Building theterrestrial planets: Constrained accretion in the inner solar system. Icarus 203 (2),644 – 662.
Ringwood, A. E. 1966. Chemical evolution of the terrestrial planets. Geochimica etCosmochimica Acta 30 (1), 41–104.
Rollinson, H. R. 2007. Early Earth Systems: A Geochemical Approach. Wiley-Blackwell.
33
Safronov, V. S. 1978. The heating of the Earth during its formation. Icarus 33 (1),3–12.
Smith, J. V., A. T. Anderson, R. Newton, E. Olsen, P. Wyllie, A. Crewe, M. Isaacson,and D. Johnson 1970. Petrologic history of the Moon inferred from petrography,mineralogy, and petrogenesis of Apollo 11 rocks. In Proceedings of the Apollo 11Lunar Science Confrence, pp. 897–925.
Tonks, W. B., and H. J. Melosh 1993. Magma ocean formation due to giant impacts.Journal of Geophysical Research 98 (E3), 5319–5333.
Warren, P. 1985. The magma ocean concept and lunar evolution. Annual Review ofEarth and Planetary Sciences 13 (1), 201–240.
Weidenschilling, S. J., D. Spaute, D. R. Davis, F. Marzari, and K. Ohtsuki 1997.Accretional Evolution of a Planetesimal Swarm. Icarus 128 (2), 429–455.
Wentzcovitch, R., T. Tsuchiya, and J. Tsuchiya 2006. MgSiO3 post-perovskite atD′′ conditions. Proceedings of the National Academy of Sciences 103 (3), 543–546.
Williams, Q., and R. Jeanloz 1990. Melting Relations in the Iron-Sulfur System atUltra-High Pressures: Implications for the Thermal State of the Earth. J. Geophys.Res. 95 (B12), 19299–19310.
Wood, J., J. Dickey Jr, U. Marvin, and B. Powell 1970. Lunar anorthosites and ageophysical model of the Moon. In Proceedings of the Apollo 11 Lunar ScienceConfrence, pp. 965–988.
Youngs, B. A., and G. A. Houseman 2007. Topography on the D′′ region from analysisof a thin dense layer beneath a convecting cell. Physics of The Earth and PlanetaryInteriors 160 (1), 60–74.
Zhao, M., T. Zhou, J. Wang, H. Lu, and F. Xiang 2005. Absolute measurements ofneodymium isotopic abundances and atomic weight by MC-ICPMS. InternationalJournal of Mass Spectrometry 245 (1-3), 36–40.