~,111,,, JC ..... -= M- ,- f Fields of Opportunities STATE OF 10\NA TERRY BRANSTAD, GOVERNOR DEPARTMENT OF EDUCATION KIM REYNOLDS, LT. GOVERNOR JASON E. GLASS, DIRECTOR March 28, 2013 John Sauer, Superintendent Bennett Community School District 300 Cedar Street Bennett, IA 52721-0343 Dear Superintendent: Attached is the report of findings for the Comprehensive School Improvement Site Visit conducted at Bennett Community School District (CSD) on January 15, 2013. The report is based upon a variety of interviews conducted with district staff and stakeholder groups during the indicated dates, and review of documents submitted to the Department and on-site. The site visit was designed to assess the district’s progress with its Comprehensive School Improvement Plan (CSIP) section of C-Plan, provide a general assessment of educational practices within the district, make recommendations for improvement, and determine compliance with state accreditation standards and applicable federal program requirements. Based on the findings from a comprehensive site visit, including a desk audit, on-site document review, and interviews, Bennett CSD maintains State of Iowa accreditation upon resolution of non-compliance issues described in the Chapter 12 Non-compliance Matrix and the Outside of Chapter 12 Non-compliance Matrix included in the comprehensive site visit report. The non- compliances revealed as a result of the visit are shared with the superintendent prior to leaving the district at the end of the site visit. The Bennett CSD must complete corrective actions according to the timeline noted on the non-compliance web site at the DE secure log in page. Documentation of corrections must be made available to the Site Visit Team Leader. Department follow-up will be conducted to verify resolution of all noted non-compliance issues The report reflects consensus of the following team members: Department of Education Representatives: Shelley Ackermann, Part B Monitoring Consultant Holly Barnes, School Improvement Consultant Kimberly Johnson, QPPS Consultant Kate Small, Part C Consultant Dale Simonson, Special Education Cadre Member Mississippi Bend Area Education Agency Representatives: Terri Hansen-Blair, Quality Learning Consultant JoAnne Dixson, Sector Coordinator Local Education Agency Representatives: Kim Huckstadt, Superintendent, Maquoketa CSD Other Representatives: Angie Squires, Early Childhood Consultant, Keystone AEA Grimes State Office Building - 400 E 14th St - Des Moines IA 50319-0146 PHONE (515) 281-5294 FAX (515) 242-5988 www.educateiowa.gov Championing Excellence for all Iowa Students through Leadership and Service
Transcript
~,111,,, JC ..... -= M-
,- f ~ Fields of Opportunities STATE OF 10\NA
TERRY BRANSTAD, GOVERNOR DEPARTMENT OF EDUCATION KIM REYNOLDS, LT. GOVERNOR JASON E. GLASS, DIRECTOR
March 28, 2013
John Sauer, Superintendent Bennett Community School District 300 Cedar Street Bennett, IA 52721-0343
Dear Superintendent:
Attached is the report of findings for the Comprehensive School Improvement Site Visit conducted at Bennett Community School District (CSD) on January 15, 2013. The report is based upon a variety of interviews conducted with district staff and stakeholder groups during the indicated dates, and review of documents submitted to the Department and on-site.
The site visit was designed to assess the district’s progress with its Comprehensive School Improvement Plan (CSIP) section of C-Plan, provide a general assessment of educational practices within the district, make recommendations for improvement, and determine compliance with state accreditation standards and applicable federal program requirements.
Based on the findings from a comprehensive site visit, including a desk audit, on-site document review, and interviews, Bennett CSD maintains State of Iowa accreditation upon resolution of non-compliance issues described in the Chapter 12 Non-compliance Matrix and the Outside of Chapter 12 Non-compliance Matrix included in the comprehensive site visit report. The non-compliances revealed as a result of the visit are shared with the superintendent prior to leaving the district at the end of the site visit. The Bennett CSD must complete corrective actions according to the timeline noted on the non-compliance web site at the DE secure log in page. Documentation of corrections must be made available to the Site Visit Team Leader. Department follow-up will be conducted to verify resolution of all noted non-compliance issues
The report reflects consensus of the following team members:
Department of Education Representatives: Shelley Ackermann, Part B Monitoring Consultant Holly Barnes, School Improvement Consultant Kimberly Johnson, QPPS Consultant Kate Small, Part C Consultant Dale Simonson, Special Education Cadre Member
Mississippi Bend Area Education Agency Representatives: Terri Hansen-Blair, Quality Learning Consultant JoAnne Dixson, Sector Coordinator
Local Education Agency Representatives: Kim Huckstadt, Superintendent, Maquoketa CSD
Other Representatives: Angie Squires, Early Childhood Consultant, Keystone AEA
Grimes State Office Building - 400 E 14th St - Des Moines IA 50319-0146
It is our hope this report will provide guidance to enhance student achievement in the district and support continuing conversations among staff and community members about the local education system, how and what students are learning, and how more students can learn at higher levels.
As part of Bennett CSD’s continuous improvement process, the district must review its current CSIP section of C-Plan and provide revisions as needed. Revisions should be based on the district’s needs assessments (including the attached report), student achievement data, stakeholder input, and established priorities. Recertification of the CSIP section of C-Plan must be completed by September 15, 2013. Directions for revision and submission of the CSIP section of C-Plan can be found at: https://www.edinfo.state.ia.us/securelogin.asp.
The Department would appreciate the district’s feedback regarding its site visit experience. This feedback will inform the Department’s efforts to continuously improve the comprehensive site visit process. A short online survey has been developed and is available at the following site: https://www.surveymonkey.com/s/School_Improvement_2012-2013DistrictSurvey. The survey will take approximately ten minutes to complete. Responses are confidential and shared in aggregate form with members of the Department’s School Improvement Team.
The visiting team again extends its gratitude to you and the XXX CSD staff and patrons in preparing for and showing courtesy during the visit. Thank you for your time and cooperation.
Sincerely,
Holly Barnes School Improvement Consultant Bureau of School Improvement Iowa Department of Education I
Amy Williamson, Chief Bureau of School Improvement Iowa Department of Education
cc: Site Visit Team Members School Board President Iowa Department of Education Official File AEA Office
Comprehensive Site Visit Iowa Department of Education
Bennett CSD
Team Findings January 25-16, 2013
Iowa Department of Education Grimes State Office Building
400 E. 14th Street Des Moines, Iowa 50319-0146
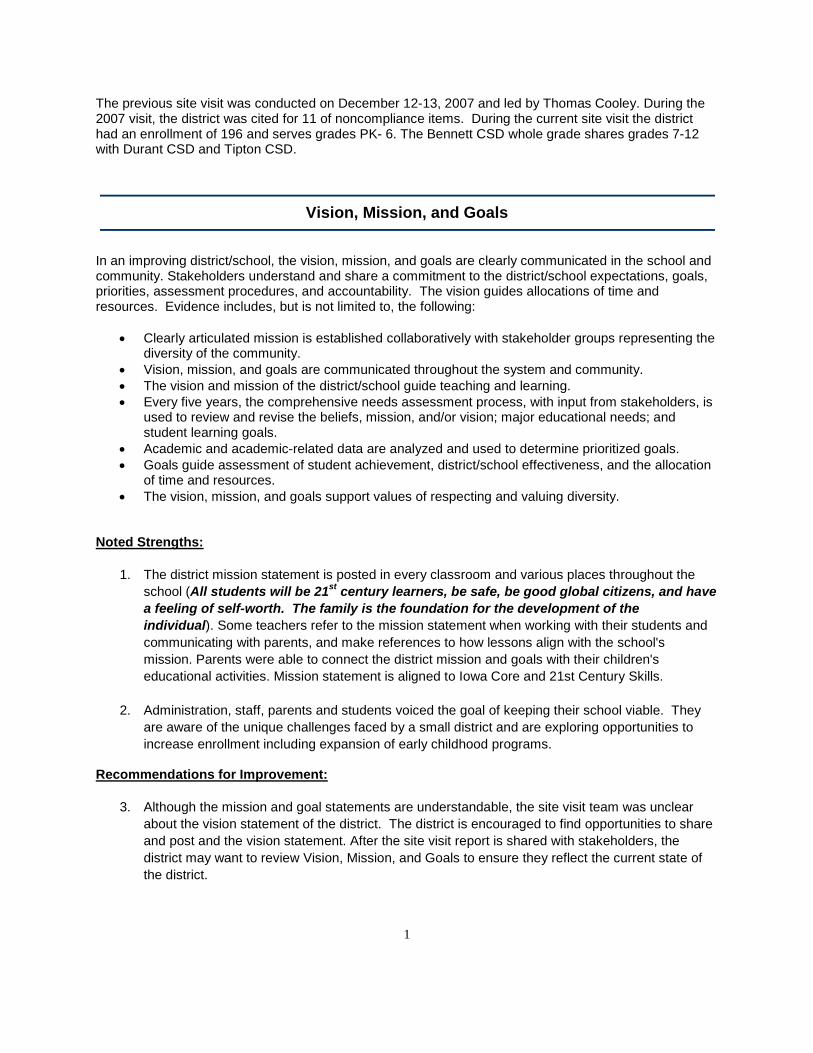
The previous site visit was conducted on December 12-13, 2007 and led by Thomas Cooley. During the 2007 visit, the district was cited for 11 of noncompliance items. During the current site visit the district had an enrollment of 196 and serves grades PK- 6. The Bennett CSD whole grade shares grades 7-12 with Durant CSD and Tipton CSD.
Vision, Mission, and Goals
In an improving district/school, the vision, mission, and goals are clearly communicated in the school and community. Stakeholders understand and share a commitment to the district/school expectations, goals, priorities, assessment procedures, and accountability. The vision guides allocations of time and resources. Evidence includes, but is not limited to, the following:
• Clearly articulated mission is established collaboratively with stakeholder groups representing the diversity of the community.
• Vision, mission, and goals are communicated throughout the system and community. • The vision and mission of the district/school guide teaching and learning. • Every five years, the comprehensive needs assessment process, with input from stakeholders, is
used to review and revise the beliefs, mission, and/or vision; major educational needs; and student learning goals.
• Academic and academic-related data are analyzed and used to determine prioritized goals. • Goals guide assessment of student achievement, district/school effectiveness, and the allocation
of time and resources. • The vision, mission, and goals support values of respecting and valuing diversity.
Noted Strengths:
1. The district mission statement is posted in every classroom and various places throughout the school (All students will be 21st century learners, be safe, be good global citizens, and have a feeling of self-worth. The family is the foundation for the development of the individual). Some teachers refer to the mission statement when working with their students and communicating with parents, and make references to how lessons align with the school's mission. Parents were able to connect the district mission and goals with their children's educational activities. Mission statement is aligned to Iowa Core and 21st Century Skills.
2. Administration, staff, parents and students voiced the goal of keeping their school viable. They are aware of the unique challenges faced by a small district and are exploring opportunities to increase enrollment including expansion of early childhood programs.
Recommendations for Improvement:
3. Although the mission and goal statements are understandable, the site visit team was unclear about the vision statement of the district. The district is encouraged to find opportunities to share and post and the vision statement. After the site visit report is shared with stakeholders, the district may want to review Vision, Mission, and Goals to ensure they reflect the current state of the district.
1
4. Students shared their desire to be identified as Bennett Bombers within the school and community. Since sporting opportunities are limited within the district, the district is encouraged to contact other whole-grade sharing districts to see how they have helped their students retain their home district identity (Bennett Bomber).
2
Leadership
In an improving district/school, leaders communicate a shared sense of purpose and understanding of the district/school’s values. Leaders have a visible presence, provide resources and ensure two-way communication between the educational system and stakeholders. Leaders provide encouragement, recognition, and support for improving student learning and staff performance. Leadership is committed, persistent, proactive, and distributed throughout the system. Evidence includes, but is not limited to, the following:
• Policies and procedures are established to effectively support district/school operations. • The school board and district/school administrators implement an evaluation system that provides
for the professional growth of all personnel. • Policies and practices are implemented to reduce and eliminate discrimination and harassment
and to reflect, respect, and celebrate diversity. • The role and responsibility of administrative leaders is supported, respected, and understood. • A clearly defined system and expectations are established for the collection, analysis, and use of
data regarding student achievement and progress with the CSIP section of C-Plan. • The capacity of staff, students, and parents to contribute and lead is built and supported. • Opportunities for participation are provided for input, feedback, and ownership for student and
system success among staff, students, parents, and community. • Equity in access to learning opportunities and compliance with local, state, and federal legislation
is ensured. • Leaders at all levels understand and manage the change process.
Noted Strengths:
5. Conversations with a variety of stakeholders indicate transition to new building leadership has been a positive experience for all stakeholders. Staff has been open to changes that come with new leadership. The principal shared he feels supported by staff. There appears to be an honest and open rapport.
6. Multiple interviewees reported leadership is supportive of educators advancing their knowledge and skills. For example, the district has supported teachers in completing the coursework necessary to attain endorsements. Staff has also been supported in attending conferences and implementing new information. The principal meets with staff at the beginning of the year and end of the year to determine goals and progress toward those goals. In addition, teachers have multiple opportunities to hold leadership positions on committees, community events, and communications.
7. Students have opportunities to hold leadership positions (student council, peer assisted learning). Students were pleased with the leadership opportunities they were afforded within the school building. They especially enjoyed activities that allowed them to participate with groups of cross-age peers. They gave examples such as mentoring a preschooler, reading to a younger student, and assisting with the "Winter Games" and Scavenger Hunt.
8. The School Board and current administration are commended for developing a leadership succession plan and for supporting current principal in transitioning to the superintendency.
3
Recommendations for Improvement:
9. The site visit team noted there was not a clear process for the curriculum cycle. The team encourages the district to continue to develop a shared vision for teaching and learning at Bennett CSD. Take the next steps to align instruction, assessment and professional development. Consider contacting Teri Hansen-Blair ([email protected]) at Mississippi Bend AEA for assistance in this area.
10. In preparing to support a beginning superintendent in the district, the site visit team recommends the board be very intentional in developing a leadership transition strategy includes a system of support. This may be in the form of a mentorship program or contracting support from a practicing superintendent who would be readily available for regularly scheduled meetings and on-call support. Local opportunities to develop a support system may be beneficial. In addition, the district is encouraged to develop the leadership skills of staff to assist in district responsibilities. Consider contacting School Administrators of Iowa (SAI) at http://www.sai-iowa.org for assistance in this area.
11. Building leadership would benefit from on-site instructional coaching to model and provide support with the various research-based instructional strategies for reading, written language, and math. Consider contacting Teri Hansen-Blair ([email protected]) at Mississippi Bend AEA for assistance in this area.
12. Parents indicated communication between the shared districts might be enhanced to make the transition to seventh grade easier. It was shared students entering Durant are considered "new" students and have extensive paperwork to complete. Also, being a new student prevents students from having a schedule at seventh grade Backpack Night so students cannot walk through to know the order and location of classes. Tipton parents reported students are given up to 10 extra credits points for summer reading; however, this program is not communicated to the students transitioning from Bennett. Since school choice is made by mid-March, parents suggested communication occurs at the end of the school year regarding necessary paperwork, deadlines, summer activities, and extra-curricular activities for each of the sharing districts.
13. Because of the limited technology supports, the district may want to consider developing sixth grade "technology leaders" as students become more savvy users of the technology available.
In an improving district/school, stakeholders understand and support the mission and goals of the district/school and have meaningful roles in the decision-making process. Collaboration results from a culture of participation, responsibility, and ownership among stakeholders from diverse community groups. Educators in the system develop and nurture a professional culture and collaborative relationships marked by mutual respect and trust inside and outside of the organization. The system works together with balance between district direction and school autonomy. Evidence includes, but is not limited to, the following:
• Instructional staff is provided opportunities for interaction to focus on professional issues. • Instructional staff constructively analyzes and critiques practices and procedures including
content, instruction, and assessment. • Instructional staff follows established procedures to resolve professional conflicts, solve
problems, share information about students, and communicate student information to parents. • Processes and procedures that invite and respect stakeholder input, support, and interaction are
implemented by the district/school. • Parents are involved as partners in the educational process. • Positive alliances among school staff, students, parents, and diverse community groups are
created and nurtured.
Noted Strengths:
14. All groups cited examples of strong and positive collaboration in several areas including among teachers, between teachers and paraprofessionals, and between staff and administration. Teachers reported the ability to collaborate cross-curriculum and districts
15. Strong community relationships and collaborations were reported across groups and include: • Books for Bennett • Backpack Buddy program • ISU Extension • Trinity Health Nursing • Police Department – Drug Abuse Resistance Education (DARE) • Lions Vision Screening • Jump Rope for Heart. • Family Literacy Night • Channel 9 Weather Lab
16. School Improvement Advisory Committee (SIAC) members spoke positively of their involvement in providing input about improvement efforts in the district (e.g. whole grade sharing, playground equipment,1:1 computers) Data is shared and explained to the Advisory committee. They described where areas of concern are identified, addressed and have improved when performance is reviewed annually. The members spoke highly of being able to coordinate projects with the community (e.g., having sidewalk work done when the city is working on their street projects). The parent-teacher organization (PILOTS) invites the community to various activities and events. The mayor was proud to share the defibulator is city property the school borrows, and staff is trained on how to use it in an emergency. The EMS does work with students’ and training with the teachers. The consensus of the advisory committee was the school and community has a generally cooperative spirit.
5
Recommendations for Improvement:
17. In order to keep the district focused on instruction and student achievement, it might be helpful for staff to learn about and implement professional learning communities who use the Data Team process with fidelity to help structure their collaborative efforts. This would allow teachers to be most efficient with their collaborative team time. A school level team may consider monitoring of areas improvement on a more frequent basis than annually (i.e. monthly).
18. In order to reach all district stakeholders, including residents of the district who do not have students in the school, the district might consider ensuring all box holders receive district newsletters, etc. This could serve as an avenue to market the district as well as draw community members to school events.
6
Learning Environment
In an improving district/school, the school environment is conducive to teaching and learning. The environment is safe, orderly, purposeful, and free from threat of physical, social, and emotional harm. Teachers are familiar with students’ cultures and know how to work effectively in a multi-cultural setting. Students are guided to think critically about learning and have opportunities to apply learning to real world situations. Classrooms are integrated with diverse learners (i.e., gender, race, special needs, at-risk, gifted). Evidence includes, but is not limited to, the following:
• Rules and procedures for behavior and consequences are clearly communicated and consistently administered.
• School facilities are physically accessible and school routines enhance student learning. • Materials, resources, technology, programs, and activities reflecting diversity are available to all
students. • The district/school provides a clean, inviting, welcoming environment. • A clearly understood crisis management plan is established, communicated, and implemented
when necessary. • Teaching and learning are protected from external disturbances and internal distractions. • The district/school reflects the contributions and perspectives of diverse groups and preserves
the cultural dignity of staff, students, and parents.
Noted Strengths:
19. The Bucket Filler program was mentioned by all interview groups as having a positive impact on the learning environment.
20. Counselors who work part-time in the district also work in Durant and Tipton. Students reported sharing schedules and talking about the difference between the buildings was helpful.
21. Technology is available to enhance the learning environment: 1:1 laptops grades 3-6, mobile computer labs PK-2, Smartboards in each classroom, with teachers are using them interactively, and LCD projectors. Teachers are using these projectors to share materials and information from their computers. Students are aware of the impact of the technology they have available to them and give examples of how technology is used in instruction. The technology also allows the students to have greater exposure and connection to the larger world.
22. The Title 1/Talented and Gifted (TAG) teacher envisions a Multiple Intelligences classroom where students will have learning activities they can experience that are aligned to the different intelligences. This would allow students to explore their strengths as well as work on some areas they would like to strengthen. This builds resiliency for their future education and lives.
Recommendations for Improvement:
23. Students in upper grades may view bucket program as more directed to younger students. The district may want explore opportunities to differentiate the program for older students regarding character building. There may be opportunities to streamline with the sharing districts to assist the older students in transitioning to behavior expectations in middle school.
7
24. Students and some teachers noted a desire for the physical environment to be improved to create brighter and brain-friendly classroom environments (e.g., rugs, clearly defined spaces for students to complete different types of activities - reading areas, written language spaces, explicit instruction areas, etc., warm lighting, plants, etc.). This might reinforce various learning styles.
25. Although the district practices Code Red and Code Green drills and has a front door security camera to help ensure student safety, interview groups indicated other safety measures may also be helpful. Suggestions included: • locking the front door and possibly changing the configuration of the front entrance • having the ability to lock classroom doors from the inside • adding crossing guards to assist children who need to cross the highway • working with the city to add more sidewalks along the local roads
8
Curriculum and Instruction
In an improving school, curriculum challenges each student to excel, reflects a commitment to equity, and demonstrates an appreciation of diversity. There is an emphasis on principles of high quality instruction, clear expectations for what is taught, and high expectations for student achievement. Educators have a common understanding of quality teaching and learning. Instruction is designed to accommodate a wide range of learners within the classroom. Teachers have knowledge and skills need to effectively implement characteristics of effective instruction. The staff accepts responsibility for the students’ learning of the essential curriculum (e.g., Iowa Core Curriculum). Instructional time is allocated to support student learning. Evidence includes, but is not limited to, the following:
• Educators implement effective instructional practices for each and every student. • School and classroom tasks and activities are inherently engaging, relevant, and lead to
applying knowledge to authentic tasks. • Content, instruction, assessments, and policy are aligned. • A shared vision of effective instruction is held by all instructional staff. • Curriculum and instruction reflect contributions from diverse racial, ethnic, and personal
backgrounds. • Students are provided opportunity and time to learn. • Teachers are provided with an instructional framework that employs research-based
strategies for use with diverse learner characteristics. • Instructional decisions utilize a process of collecting, analyzing, and summarizing data.
Noted Strengths:
26. The district has a strong relationship with Mississippi Bend AEA. This is evidenced by: • Agency staff coaching in the area of Iowa Core Math (how to understand and implement the
Standards of Mathematical Practice). • Teacher coaching in the best use of technology • Inclusion of the preschool paraeducator in GOLD training • Implementation of evidence-based strategies
27. Small class sizes allow teachers to individualize and differentiate instruction on a 1:1 basis in many cases. In other cases the individualization and differentiation occurs in small groups.
Recommendations for Improvement:
28. Based on the district overview as well as statements from staff members, the site visit team observed there appeared to be a disconnect of next steps regarding Iowa Core. The site visit team encourages the district to adopt the Iowa Core (rather than trying to "align" to the Core) and provide professional development around knowing the standards, as well as being able to "unwrap" the standards into student-friendly language. This will ensure all students receive universal/Core instruction. Other suggestions include: • Use curriculum materials to teach grade level core concepts and skills. • Use the data team’s process within PLCs to address Iowa Core standards through common
formative assessments and interventions matched to student need. • Share students across grade levels to maximize groupings according to student need.
9
Professional Development
In an improving district/school, staff is qualified for assignments and engages in ongoing learning opportunities to improve effectiveness. Student achievement and other sources of data are used to set goals for professional development. The district provides professional learning opportunities that include theory, demonstration, practice, and coaching. Evidence includes, but is not limited to, the following:
• Professional development focus is determined through the analysis of student achievement and performance data.
• Professional development is focused and based on research-based strategies. • Professional development sessions build on one another, are distributed throughout the
school year, and are sustained over time. • Time is provided for teachers to collaborate and apply new content and pedagogical
knowledge. • An established system provides support to monitor and evaluate implementation of
professional development and its impact on student learning. • Formative student data and teacher implementation data are used to adjust professional
development and guide instructional decisions. • All school staff members, instructional and non-instructional, are provided professional
development to support job roles and functions. • Professional development activities contribute to the capacity of all school staff to develop
cultural competence and to reflect and respect diversity in classroom and work environments.
Noted Strengths:
29. Paraeducators reported being included in professional development activities relevant to their job responsibilities and being paid for their time. There is an appreciation for the individual training on specific needs for students (e.g. strategies for working with a non-verbal student). The preschool paraeducator has been included in training regarding the Gold Assessment system in order to support the teacher with implementation of assessment practices in the classroom.
30. Learning support staff identified numerous professional development opportunities they receive with their discipline outside of the building/district.
31. Professional development is aligned to continuous improvement for staff and students. For example, the Data Teams process/Decision Making for Results philosophy means teachers will be able to select adult actions, or evidence-based strategies, matched to student need. They will use common formative assessment data to make decisions to help every student reach maximum potential. Staff shared they are aware learning and implementing the data teams process will take time and they are prepared to invest the time and energy.
Recommendations for Improvement:
32. The building has targeted assessment as a focus for professional development; however, they may want to determine the purpose of each assessment they give and how it will be used to
10
improve student outcomes. It may be helpful to identify the assessments by grade level by the purposes: screening, diagnostics, formative and summative.
33. School board members reported limited participation in professional development focused on board learning. The school board is encouraged to consider the benefits of establishing commitment to board development for the purpose of deepening its knowledge and skills in matters impacting policy decisions. Examples include, but are not limited to, the following: • Allocate time on one board meeting agenda each month to study and dialogue about a
chapter in the Iowa Association of School Board’s Leadership for Student Learning. • Allocate time on one board meeting agenda each month to study and dialogue about
professional reading related to curriculum (e.g., Iowa Core Curriculum), instruction, assessment, Iowa Professional Development Model, or leadership. Select an area of focus, plan the study, and sustain the focus until completion before moving to another topic.
11
Monitoring and Accountability
In an improving district/school, the district/school establishes a comprehensive system that monitors and documents performance of student progress, curriculum, instruction, programs, and initiatives. Results from assessments drive the goal setting and decision-making processes. Leadership supports a system that regularly analyzes student performance and program effectiveness. Instructional decision-making utilizes a process of collecting, analyzing, and summarizing data. Evidence includes, but is not limited to, the following:
• A system for district-wide student assessments, including multiple measures that are valid and reliable, is implemented.
• Decision-making for the continuous improvement of instruction and student learning using student achievement and teacher implementation data is employed.
• The district’s/school’s cycle of program evaluation as noted in its CSIP section of C-Plan is implemented.
• Summative evaluation processes are used to determine whether professional development has resulted in improved student learning.
Noted Strengths: 34. Students report their teachers provide frequent feedback ("always double check") and assist
students in redoing work. The students appreciate the review when they have missed an item. They also reported that their performance on Iowa Assessment has been reviewed with them.
35. Parents reported they are aware of their students' performance beyond conference times. Also, if they have any concerns, staff is easily accessible and concerns are addressed immediately.
36. The principal is present in classrooms on a daily basis. This allows him to keep up-to-date on delivery and implementation on instructional practices and fidelity of implementation. Teachers reported appreciation of this practice.
37. Basic Educational Data Survey (BEDS) data and site interviews indicate that appropriate Highly Qualified Teachers (HQT) components are being implemented with integrity in the district. Special education teachers are using the consultative model to provide instructional and support services to special education students. Students are benefiting from the combined expertise of general and special education teachers.
38. The district reported the use of strategies that ensure poor and minority students are not taught at a higher rate than other students by inexperienced, unqualified, or out-of-field teachers. All teachers are highly qualified.
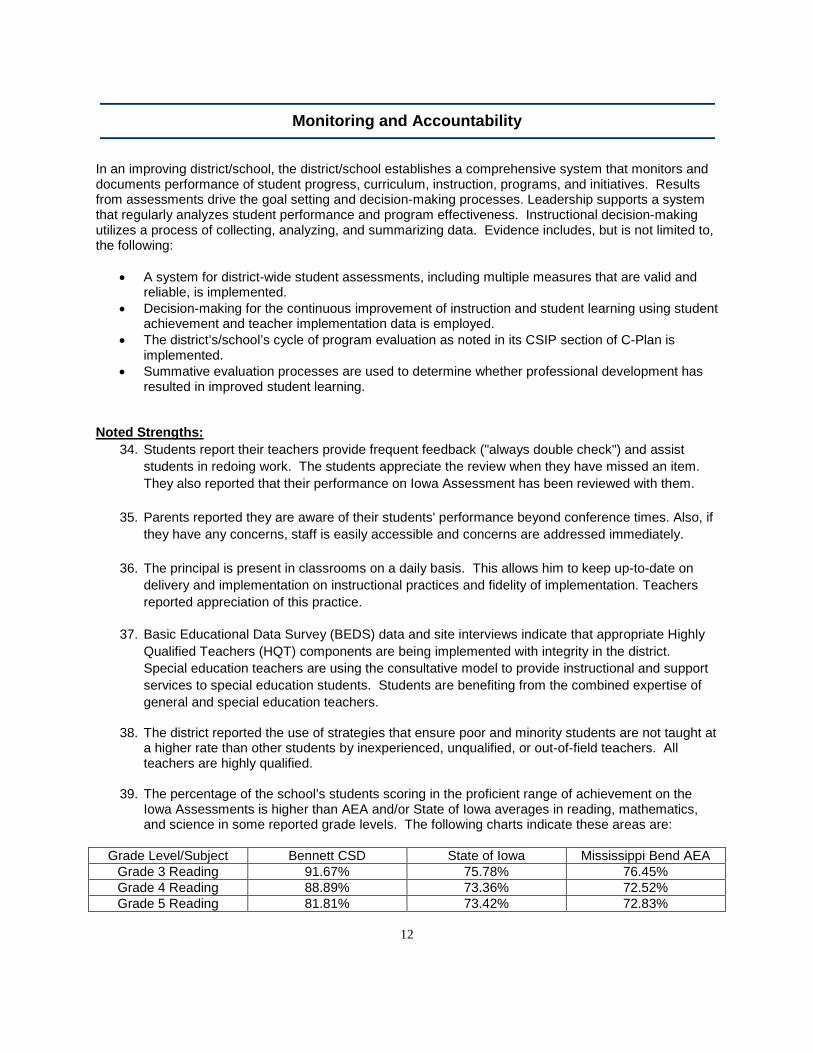
39. The percentage of the school’s students scoring in the proficient range of achievement on the Iowa Assessments is higher than AEA and/or State of Iowa averages in reading, mathematics, and science in some reported grade levels. The following charts indicate these areas are:
Grade Level/Subject Bennett CSD State of Iowa Mississippi Bend AEA Grade 3 Reading 91.67% 75.78% 76.45% Grade 4 Reading 88.89% 73.36% 72.52% Grade 5 Reading 81.81% 73.42% 72.83%
40. Although the principal is present in classrooms on a regular basis, it was unclear to the site visit team if a formalized process was being utilized. The district is encouraged to consider utilizing the Instructional Practices Inventory (IPI) walk-throughs in order to provide teachers with more detailed feedback regarding instructional practices.
41. With the multiple assessment tools being utilized by the district, the district may want to consider an "assessment "audit" to determine what assessments are essential and what can be eliminated. Required assessments include: universal screening, diagnostic, formative, and summative. Current assessments may align with the required areas; however, multiple assessments may be duplicative and taking away from active learning time. Contact Teri Hansen-Blair ([email protected]) for assistance in this area.
42. The percentage of the school’s students scoring in the proficient range of achievement on the Iowa Assessments is lower than AEA and/or State of Iowa averages in reading, mathematics, and science in some reported grade levels. The following charts indicate these areas are:
Grade Level/Subject Bennett CSD State of Iowa Mississippi Bend AEA Grade 4 Mathematics 55.55% 77.12% 77.49%
It would be beneficial to complete an in-depth disaggregated data analysis of non-proficient performers to identify whether common characteristics exist (e.g., similar skill deficit or similar demographics), identify potential barriers to learning, and provide an additional source of data for school improvement planning. Reviewing students’ performance on all district-wide assessment instruments (i.e., triangulating data) to determine validity and reliability of results (as well as the validity and reliability of district-developed assessments) is also recommended (e.g., Are there students who are not proficient on the Iowa Assessments, but are on other assessments?) In addition, the school is encouraged to:
• Continue analysis of disaggregated data and communication of results to improve instruction.
• Increase the use of cohort data (including subgroup cohorts) to identify trends and patterns over time, inform instructional decisions, and determine effectiveness of interventions.
Include broad involvement of teachers, SIAC members, administrators, school board, and instructional support staff in discussion of assessment data to increase understanding and ownership of the process.
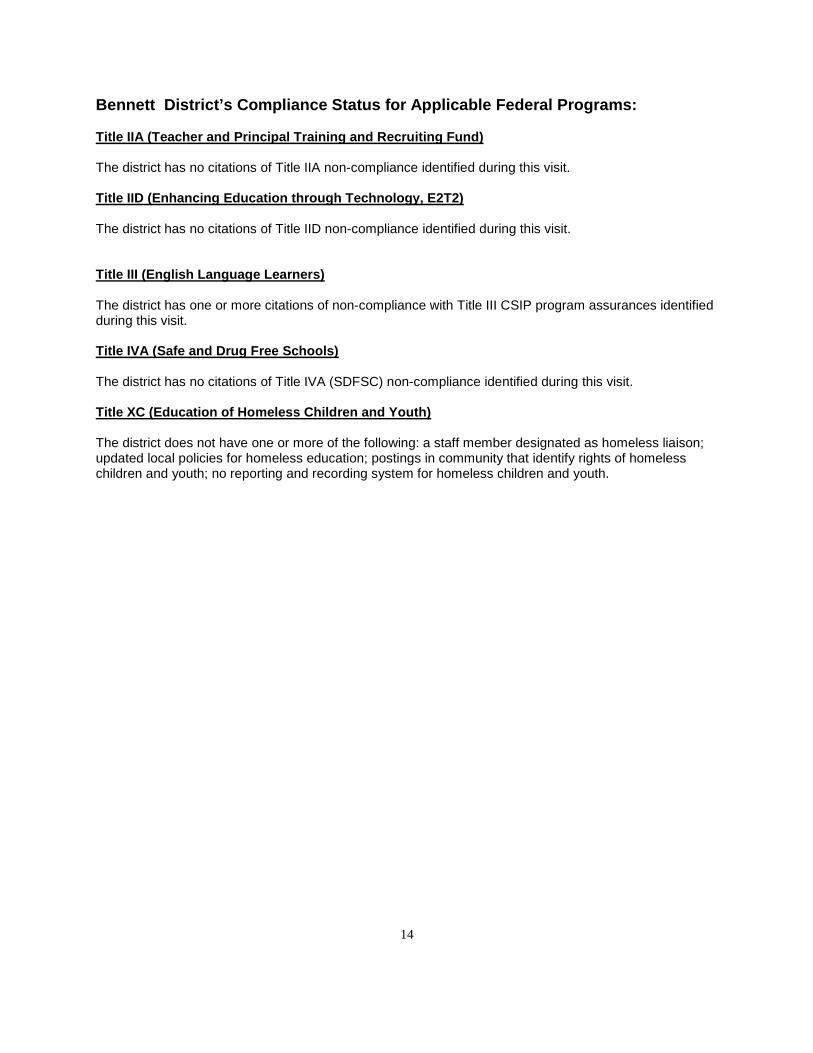
Bennett District’s Compliance Status for Applicable Federal Programs:
Title IIA (Teacher and Principal Training and Recruiting Fund)
The district has no citations of Title IIA non-compliance identified during this visit.
Title IID (Enhancing Education through Technology, E2T2)
The district has no citations of Title IID non-compliance identified during this visit.
Title III (English Language Learners)
The district has one or more citations of non-compliance with Title III CSIP program assurances identified during this visit.
Title IVA (Safe and Drug Free Schools)
The district has no citations of Title IVA (SDFSC) non-compliance identified during this visit.
Title XC (Education of Homeless Children and Youth)
The district does not have one or more of the following: a staff member designated as homeless liaison; updated local policies for homeless education; postings in community that identify rights of homeless children and youth; no reporting and recording system for homeless children and youth.
14
Areas of Non-Compliance: Chapter 12
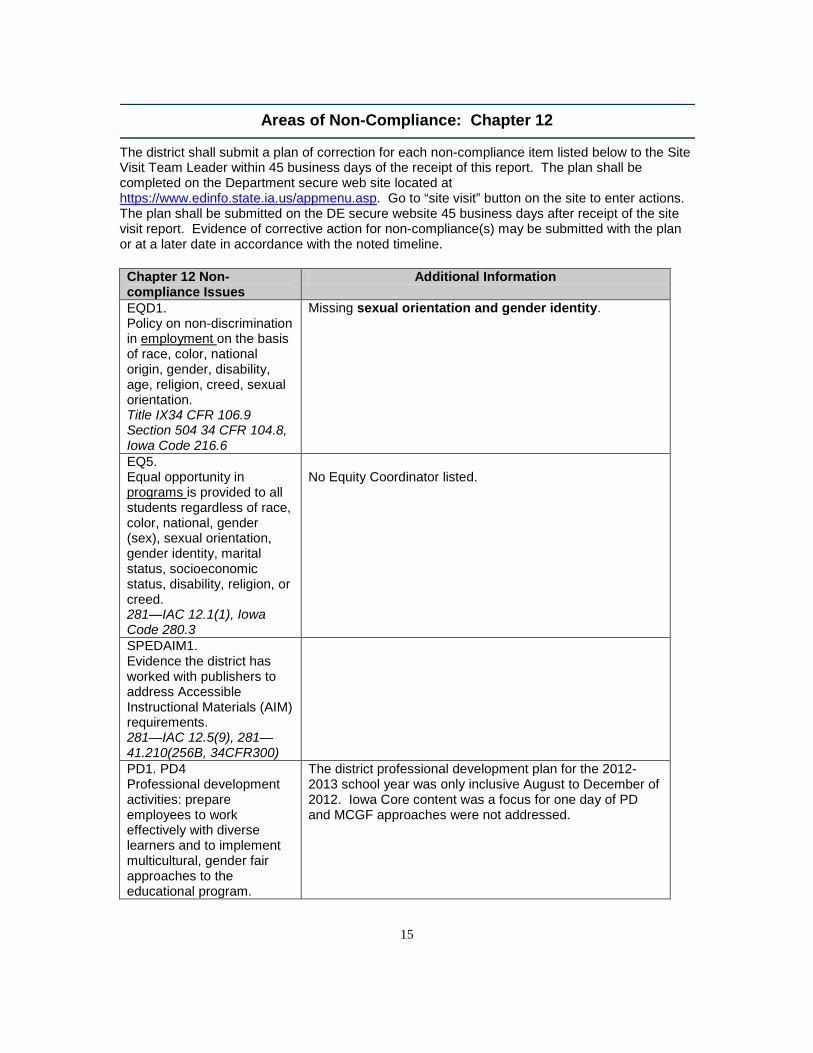
The district shall submit a plan of correction for each non-compliance item listed below to the Site Visit Team Leader within 45 business days of the receipt of this report. The plan shall be completed on the Department secure web site located at https://www.edinfo.state.ia.us/appmenu.asp. Go to “site visit” button on the site to enter actions. The plan shall be submitted on the DE secure website 45 business days after receipt of the site visit report. Evidence of corrective action for non-compliance(s) may be submitted with the plan or at a later date in accordance with the noted timeline.
Chapter 12 Non- Additional Information compliance Issues EQD1. Policy on non-discrimination in employment on the basis of race, color, national origin, gender, disability, age, religion, creed, sexual orientation. Title IX34 CFR 106.9 Section 504 34 CFR 104.8, Iowa Code 216.6
Missing sexual orientation and gender identity.
EQ5. Equal opportunity in programs is provided to all students regardless of race, color, national, gender (sex), sexual orientation, gender identity, marital status, socioeconomic status, disability, religion, or creed. 281—IAC 12.1(1), Iowa Code 280.3
No Equity Coordinator listed.
SPEDAIM1. Evidence the district has worked with publishers to address Accessible Instructional Materials (AIM) requirements. 281—IAC 12.5(9), 281— 41.210(256B, 34CFR300) PD1. PD4 Professional development activities: prepare employees to work effectively with diverse learners and to implement multicultural, gender fair approaches to the educational program.
The district professional development plan for the 2012-2013 school year was only inclusive August to December of 2012. Iowa Core content was a focus for one day of PD and MCGF approaches were not addressed.
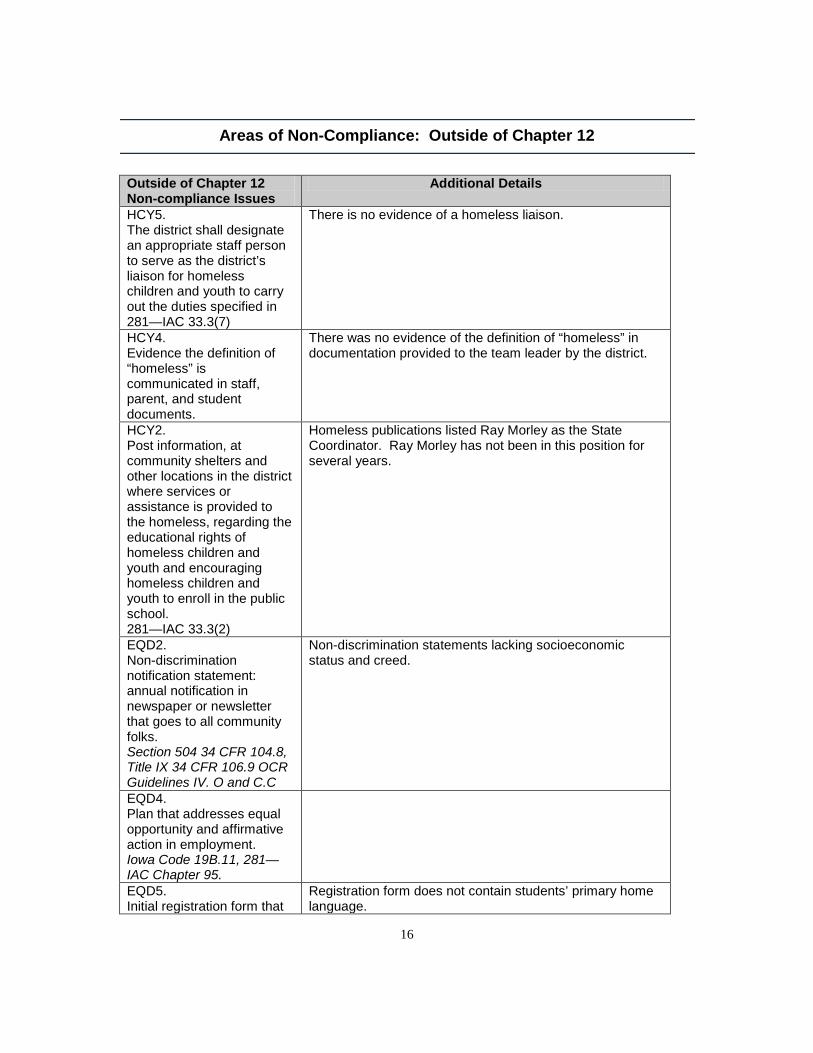
Outside of Chapter 12 Additional Details Non-compliance Issues HCY5. The district shall designate an appropriate staff person to serve as the district’s liaison for homeless children and youth to carry out the duties specified in 281—IAC 33.3(7)
There is no evidence of a homeless liaison.
HCY4. Evidence the definition of “homeless” is communicated in staff, parent, and student documents.
There was no evidence of the definition of “homeless” in documentation provided to the team leader by the district.
HCY2. Homeless publications listed Ray Morley as the State Post information, at Coordinator. Ray Morley has not been in this position for community shelters and several years. other locations in the district where services or assistance is provided to the homeless, regarding the educational rights of homeless children and youth and encouraging homeless children and youth to enroll in the public school. 281—IAC 33.3(2) EQD2. Non-discrimination statements lacking socioeconomic Non-discrimination status and creed. notification statement: annual notification in newspaper or newsletter that goes to all community folks. Section 504 34 CFR 104.8, Title IX 34 CFR 106.9 OCR Guidelines IV. O and C.C EQD4. Plan that addresses equal opportunity and affirmative action in employment. Iowa Code 19B.11, 281— IAC Chapter 95. EQD5. Initial registration form that
Registration form does not contain students’ primary home language.
Outside of Chapter 12 Additional Details Non-compliance Issues includes identification of students’ primary home language. Title VI Civil Rights Act, 281—IAC Chapter 60 PE8. Some form of evaluation of No evidence exists that the Superintendent or Principal administrators occurs have been evaluated regularly (annually). annually. No evidence exists that the Superintendent or Principal Evidence that (summative) have been evaluated based on the Iowa Standards for evaluation for School Leaders. administrators: assesses the administrator’s competence in the Iowa standards for school administrators and the goals of the individual administrator’s professional development plan. 281—IAC 12.33 (3), 281— IAC 83.12(3), Iowa Code 279.23A7
Signature verifies noncompliance items have been reviewed with the district and the district has been shown where the noncompliance items are located on the Department of Education secure website.
Superintendent Date
School Improvement Consultant Date
17
Appendix A Accreditation Site Visit Data Report Bennett (0603) Site Visit Year: 2012-2013
Iowa Department of Education Division of Learning and Results Bureau of School Improvement
~
-- --
..... - ~
T -
1~ 1~
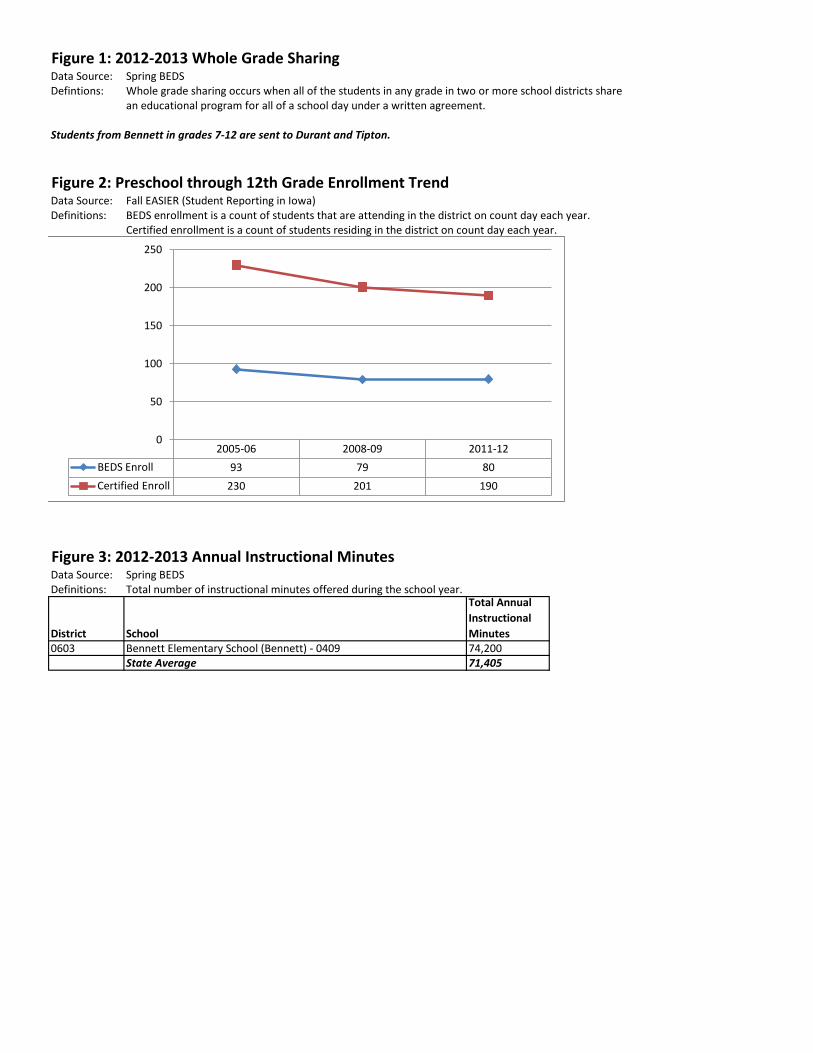
Figure 1: 2012-2013 Whole Grade Sharing Data Source: Spring BEDS Defintions: Whole grade sharing occurs when all of the students in any grade in two or more school districts share
an educational program for all of a school day under a written agreement.
Students from Bennett in grades 7-12 are sent to Durant and Tipton.
Figure 2: Preschool through 12th Grade Enrollment Trend Data Source: Fall EASIER (Student Reporting in Iowa) Definitions: BEDS enrollment is a count of students that are attending in the district on count day each year.
Certified enrollment is a count of students residing in the district on count day each year.
250
200
150
100
50
0 2005-06 2008-09 2011-12
BEDS Enroll 93 79 80 Certified Enroll 230 201 190
Figure 3: 2012-2013 Annual Instructional Minutes Data Source: Spring BEDS Definitions: Total number of instructional minutes offered during the school year.
District School
Total Annual Instructional Minutes
0603 Bennett Elementary School (Bennett) - 0409 74,200 State Average 71,405
...... ~
T
I I I I-+- I I I
Figure 4: School Year 2010-2011 Average Daily Attendance Data Source: Spring EASIER (Student Reporting in Iowa) Definitions: Total number of student days present divided by total number of student days enrolled.
100.00
95.00
90.00
85.00
80.00
75.00 2008-09 2009-10 2010-11
K-12 Attend Rate 96.10 95.57 97.03
Figure 5: 2012-2013 Schools/Districts in Need of Assistance Status Data Source: AYP Assessment File Definitions: SINA/DINA status is based on assessment participation, annual measureable objectives, and other academic
indicators. A status of delay is used to indicate that a location has met for a particular indicator, but it is their first year of meeting so they are not off the list.
This district does not have any SINA/DINA locations.
Figure 6: Percent of Kindergarteners Scoring At Benchmark on DIBELS/DIBELS Next Initial/First Sounds Fluency Data Source: Fall EASIER (Student Reporting in Iowa) Definitions: Districts are required to assess all kdg students using a literacy assessment and data are reported to
the state on each kdg student's score. If a district uses DIBELS/DIBELS Next for this assessment scores are reported below because of the confirmed validity/reliability of the assessment. At benchmark is equivalent to a score greater than 7 on DIBELS and greater than 9 on DIBELS Next.
100.00
80.00
60.00
40.00
20.00
0.00 2009-10 2010-11 2011-12
% At Benchmark 6.25 20.00 44.44
■
■
■
■
■
■
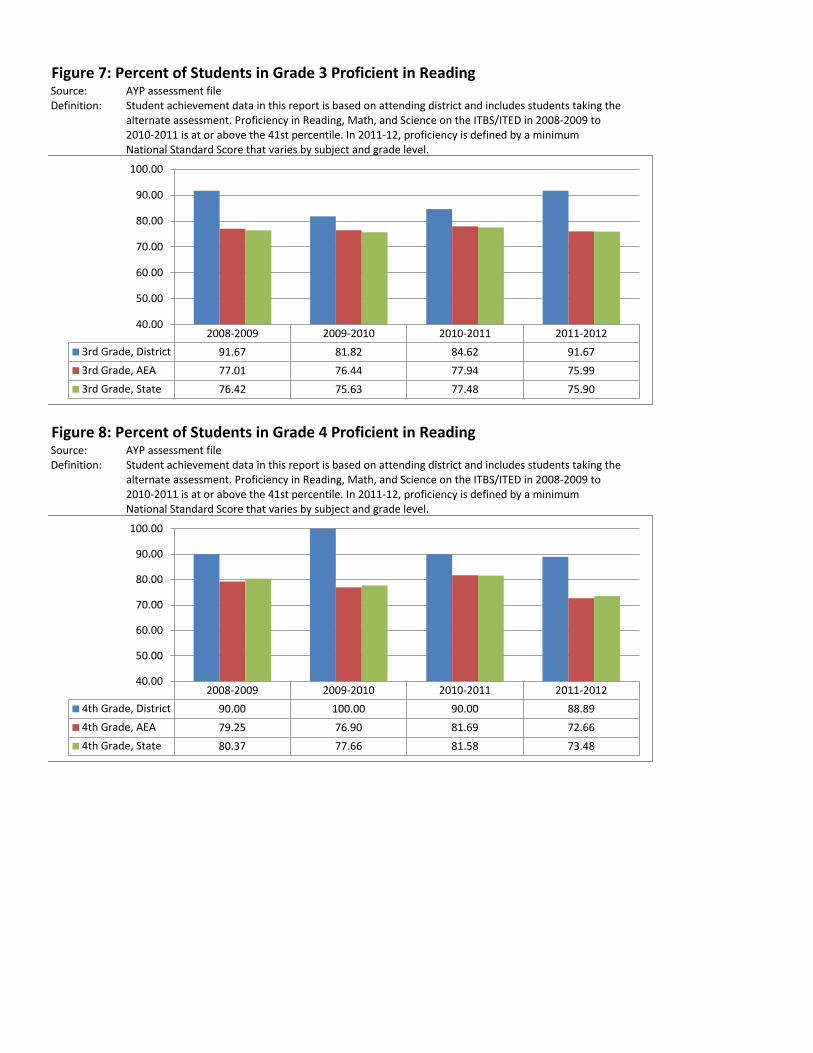
Figure 7: Percent of Students in Grade 3 Proficient in Reading Source: AYP assessment file Definition: Student achievement data in this report is based on attending district and includes students taking the
alternate assessment. Proficiency in Reading, Math, and Science on the ITBS/ITED in 2008-2009 to 2010-2011 is at or above the 41st percentile. In 2011-12, proficiency is defined by a minimum National Standard Score that varies by subject and grade level.
Figure 8: Percent of Students in Grade 4 Proficient in Reading Source: AYP assessment file Definition: Student achievement data in this report is based on attending district and includes students taking the
alternate assessment. Proficiency in Reading, Math, and Science on the ITBS/ITED in 2008-2009 to 2010-2011 is at or above the 41st percentile. In 2011-12, proficiency is defined by a minimum National Standard Score that varies by subject and grade level.
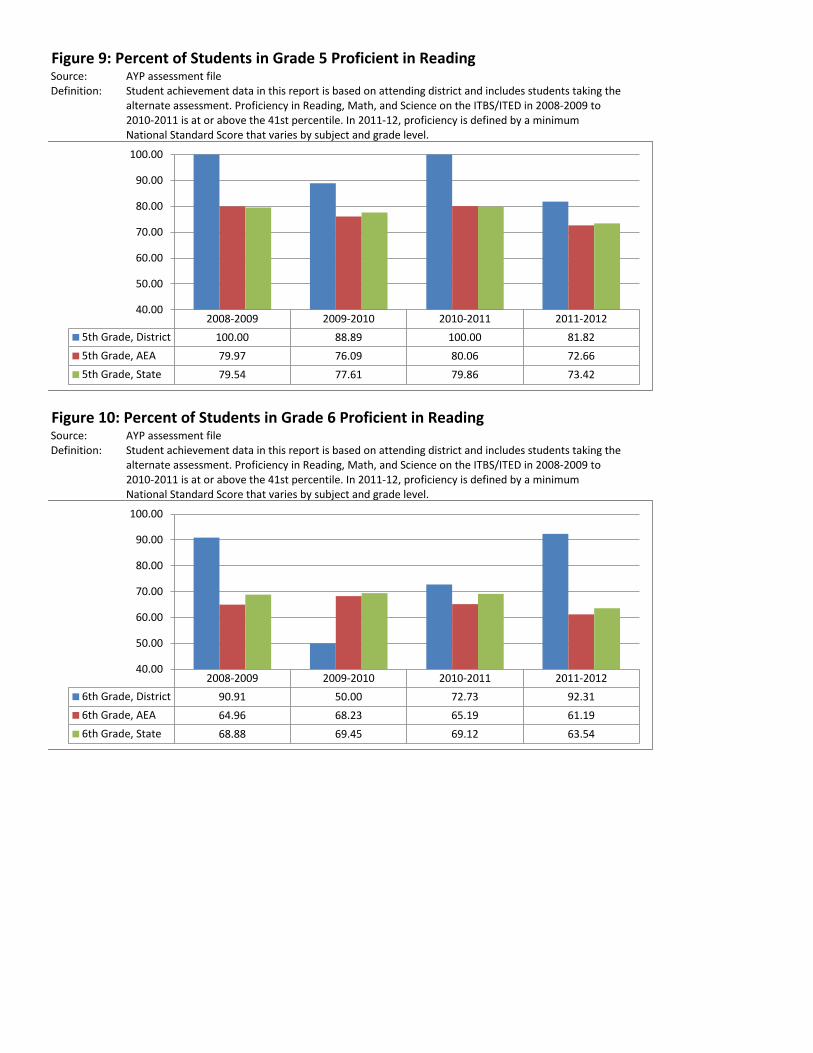
Figure 9: Percent of Students in Grade 5 Proficient in Reading Source: AYP assessment file Definition: Student achievement data in this report is based on attending district and includes students taking the
alternate assessment. Proficiency in Reading, Math, and Science on the ITBS/ITED in 2008-2009 to 2010-2011 is at or above the 41st percentile. In 2011-12, proficiency is defined by a minimum National Standard Score that varies by subject and grade level.
Figure 10: Percent of Students in Grade 6 Proficient in Reading Source: AYP assessment file Definition: Student achievement data in this report is based on attending district and includes students taking the
alternate assessment. Proficiency in Reading, Math, and Science on the ITBS/ITED in 2008-2009 to 2010-2011 is at or above the 41st percentile. In 2011-12, proficiency is defined by a minimum National Standard Score that varies by subject and grade level.
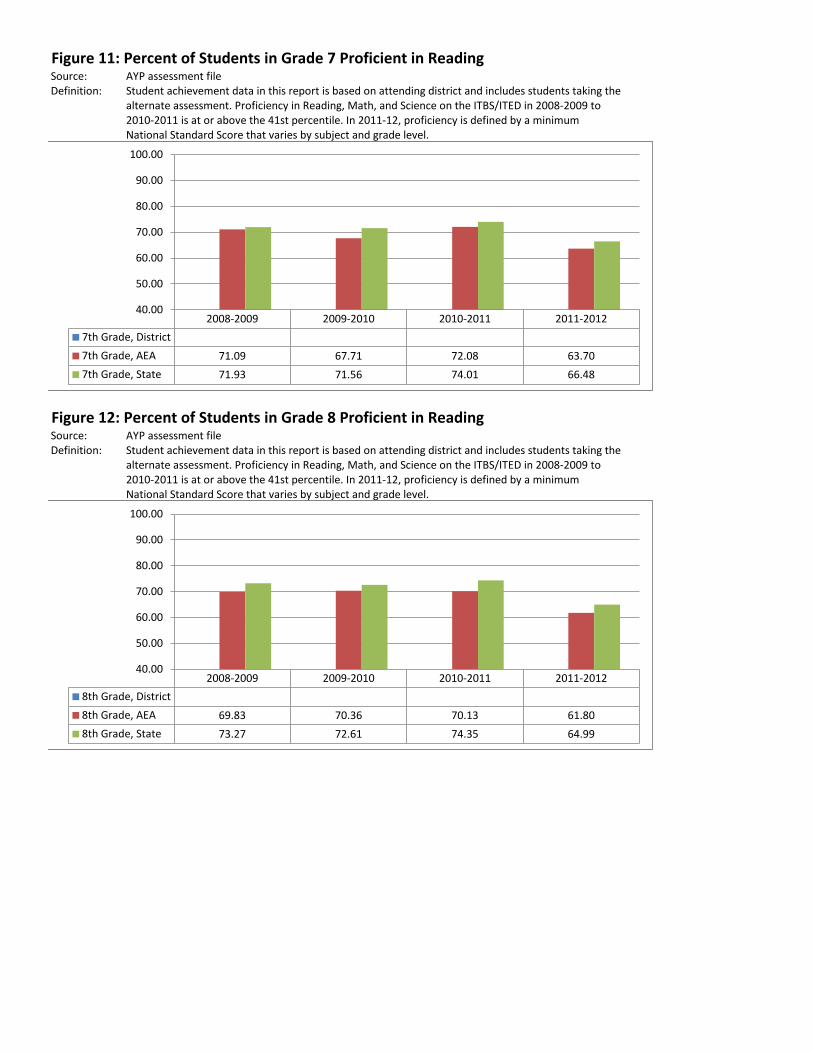
Figure 11: Percent of Students in Grade 7 Proficient in Reading Source: AYP assessment file Definition: Student achievement data in this report is based on attending district and includes students taking the
alternate assessment. Proficiency in Reading, Math, and Science on the ITBS/ITED in 2008-2009 to 2010-2011 is at or above the 41st percentile. In 2011-12, proficiency is defined by a minimum National Standard Score that varies by subject and grade level.
100.00
90.00
80.00
70.00
60.00
50.00
40.00 2008-2009 2009-2010 2010-2011 2011-2012
7th Grade, District 7th Grade, AEA 71.09 67.71 72.08 63.70 7th Grade, State 71.93 71.56 74.01 66.48
Figure 12: Percent of Students in Grade 8 Proficient in Reading Source: AYP assessment file Definition: Student achievement data in this report is based on attending district and includes students taking the
alternate assessment. Proficiency in Reading, Math, and Science on the ITBS/ITED in 2008-2009 to 2010-2011 is at or above the 41st percentile. In 2011-12, proficiency is defined by a minimum National Standard Score that varies by subject and grade level.
100.00
90.00
80.00
70.00
60.00
50.00
40.00 2008-2009 2009-2010 2010-2011 2011-2012
8th Grade, District 8th Grade, AEA 69.83 70.36 70.13 61.80 8th Grade, State 73.27 72.61 74.35 64.99
■
■
■
■
■
■
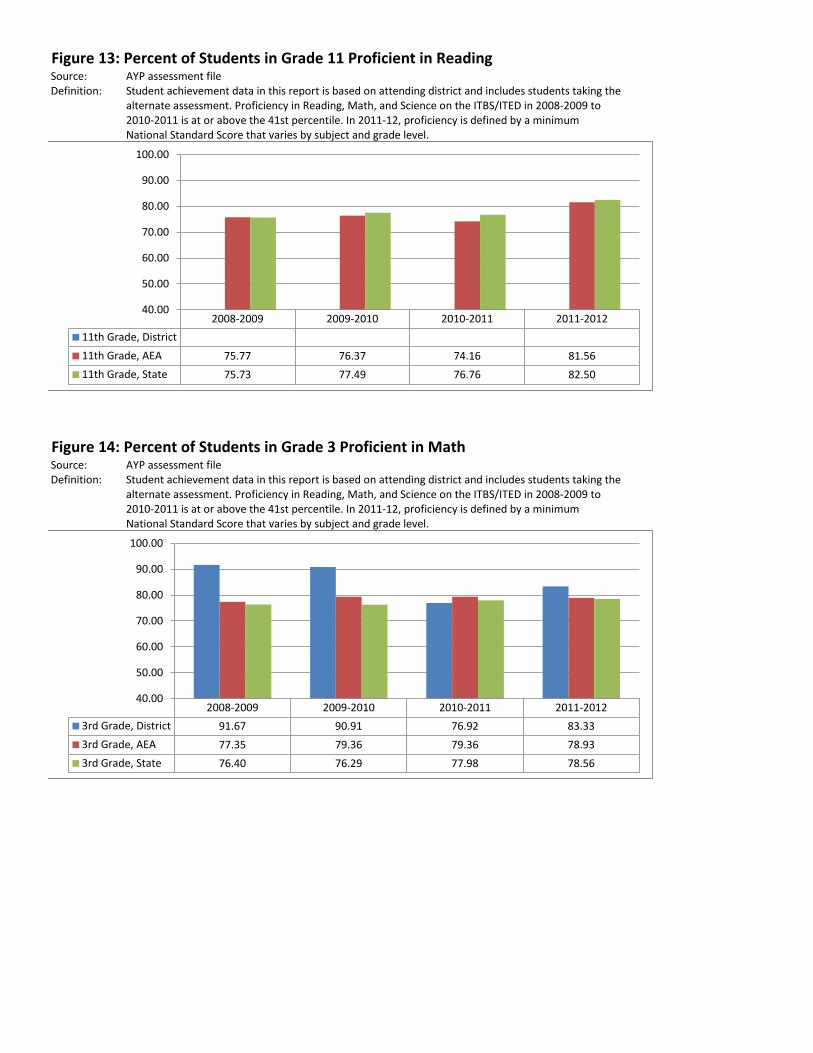
Figure 13: Percent of Students in Grade 11 Proficient in Reading Source: AYP assessment file Definition: Student achievement data in this report is based on attending district and includes students taking the
alternate assessment. Proficiency in Reading, Math, and Science on the ITBS/ITED in 2008-2009 to 2010-2011 is at or above the 41st percentile. In 2011-12, proficiency is defined by a minimum National Standard Score that varies by subject and grade level.
100.00
90.00
80.00
70.00
60.00
50.00
40.00 2008-2009 2009-2010 2010-2011 2011-2012
11th Grade, District 11th Grade, AEA 75.77 76.37 74.16 81.56 11th Grade, State 75.73 77.49 76.76 82.50
Figure 14: Percent of Students in Grade 3 Proficient in Math Source: AYP assessment file Definition: Student achievement data in this report is based on attending district and includes students taking the
alternate assessment. Proficiency in Reading, Math, and Science on the ITBS/ITED in 2008-2009 to 2010-2011 is at or above the 41st percentile. In 2011-12, proficiency is defined by a minimum National Standard Score that varies by subject and grade level.
Figure 15: Percent of Students in Grade 4 Proficient in Math Source: AYP assessment file Definition: Student achievement data in this report is based on attending district and includes students taking the
alternate assessment. Proficiency in Reading, Math, and Science on the ITBS/ITED in 2008-2009 to 2010-2011 is at or above the 41st percentile. In 2011-12, proficiency is defined by a minimum National Standard Score that varies by subject and grade level.
Figure 16: Percent of Students in Grade 5 Proficient in Math Source: AYP assessment file Definition: Student achievement data in this report is based on attending district and includes students taking the
alternate assessment. Proficiency in Reading, Math, and Science on the ITBS/ITED in 2008-2009 to 2010-2011 is at or above the 41st percentile. In 2011-12, proficiency is defined by a minimum National Standard Score that varies by subject and grade level.
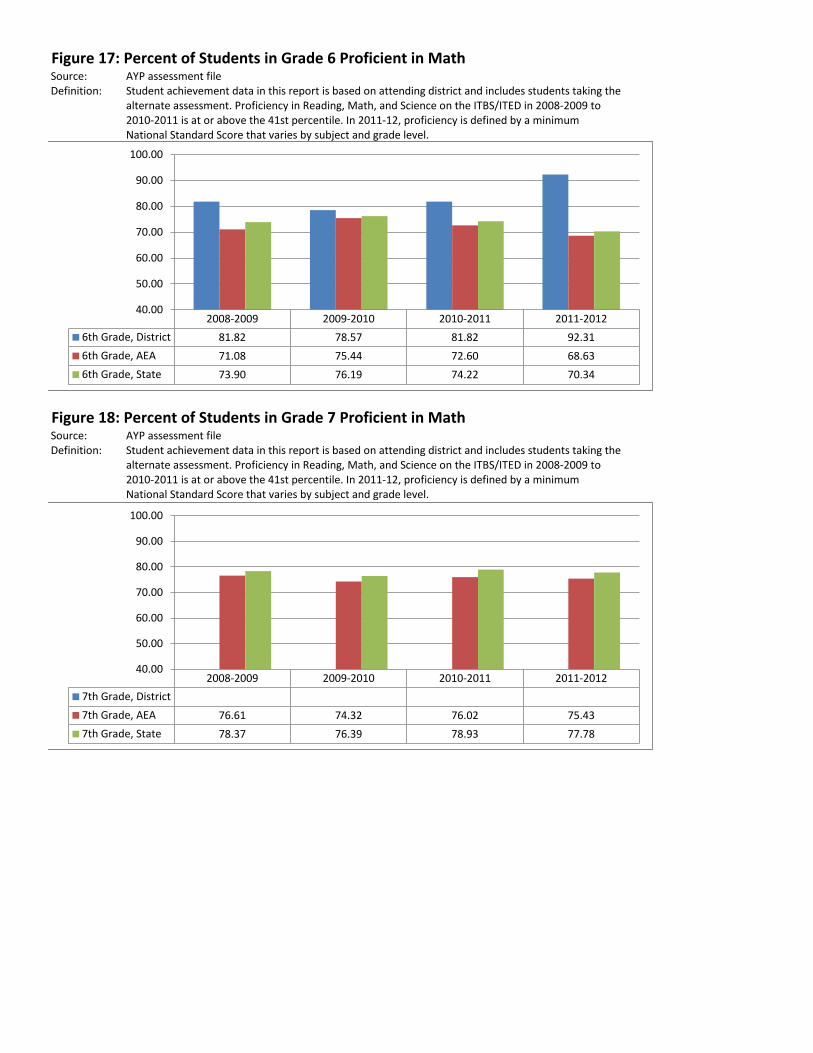
Figure 17: Percent of Students in Grade 6 Proficient in Math Source: AYP assessment file Definition: Student achievement data in this report is based on attending district and includes students taking the
alternate assessment. Proficiency in Reading, Math, and Science on the ITBS/ITED in 2008-2009 to 2010-2011 is at or above the 41st percentile. In 2011-12, proficiency is defined by a minimum National Standard Score that varies by subject and grade level.
Figure 18: Percent of Students in Grade 7 Proficient in Math Source: AYP assessment file Definition: Student achievement data in this report is based on attending district and includes students taking the
alternate assessment. Proficiency in Reading, Math, and Science on the ITBS/ITED in 2008-2009 to 2010-2011 is at or above the 41st percentile. In 2011-12, proficiency is defined by a minimum National Standard Score that varies by subject and grade level.
100.00
90.00
80.00
70.00
60.00
50.00
40.00 2008-2009 2009-2010 2010-2011 2011-2012
7th Grade, District 7th Grade, AEA 76.61 74.32 76.02 75.43 7th Grade, State 78.37 76.39 78.93 77.78
■
■
■
■
■
■
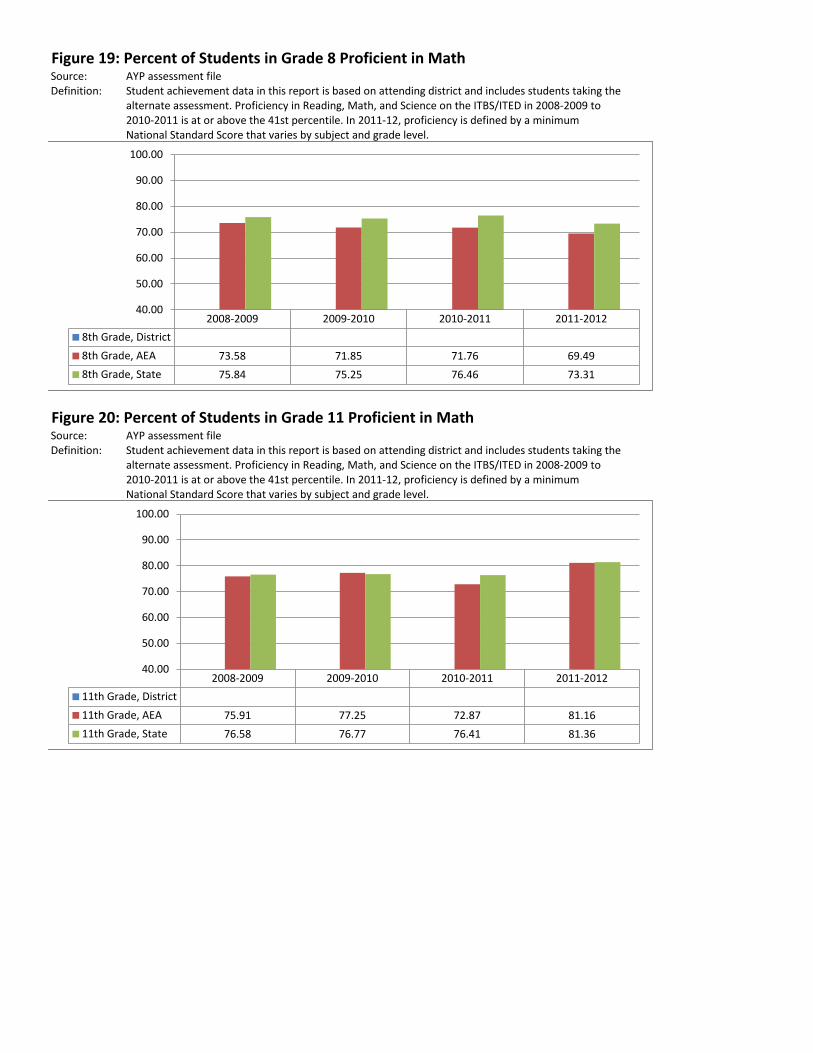
Figure 19: Percent of Students in Grade 8 Proficient in Math Source: AYP assessment file Definition: Student achievement data in this report is based on attending district and includes students taking the
alternate assessment. Proficiency in Reading, Math, and Science on the ITBS/ITED in 2008-2009 to 2010-2011 is at or above the 41st percentile. In 2011-12, proficiency is defined by a minimum National Standard Score that varies by subject and grade level.
100.00
90.00
80.00
70.00
60.00
50.00
40.00 2008-2009 2009-2010 2010-2011 2011-2012
8th Grade, District 8th Grade, AEA 73.58 71.85 71.76 69.49 8th Grade, State 75.84 75.25 76.46 73.31
Figure 20: Percent of Students in Grade 11 Proficient in Math Source: AYP assessment file Definition: Student achievement data in this report is based on attending district and includes students taking the
alternate assessment. Proficiency in Reading, Math, and Science on the ITBS/ITED in 2008-2009 to 2010-2011 is at or above the 41st percentile. In 2011-12, proficiency is defined by a minimum National Standard Score that varies by subject and grade level.
100.00
90.00
80.00
70.00
60.00
50.00
40.00 2008-2009 2009-2010 2010-2011 2011-2012
11th Grade, District 11th Grade, AEA 75.91 77.25 72.87 81.16 11th Grade, State 76.58 76.77 76.41 81.36
■
■
■
■
■
■
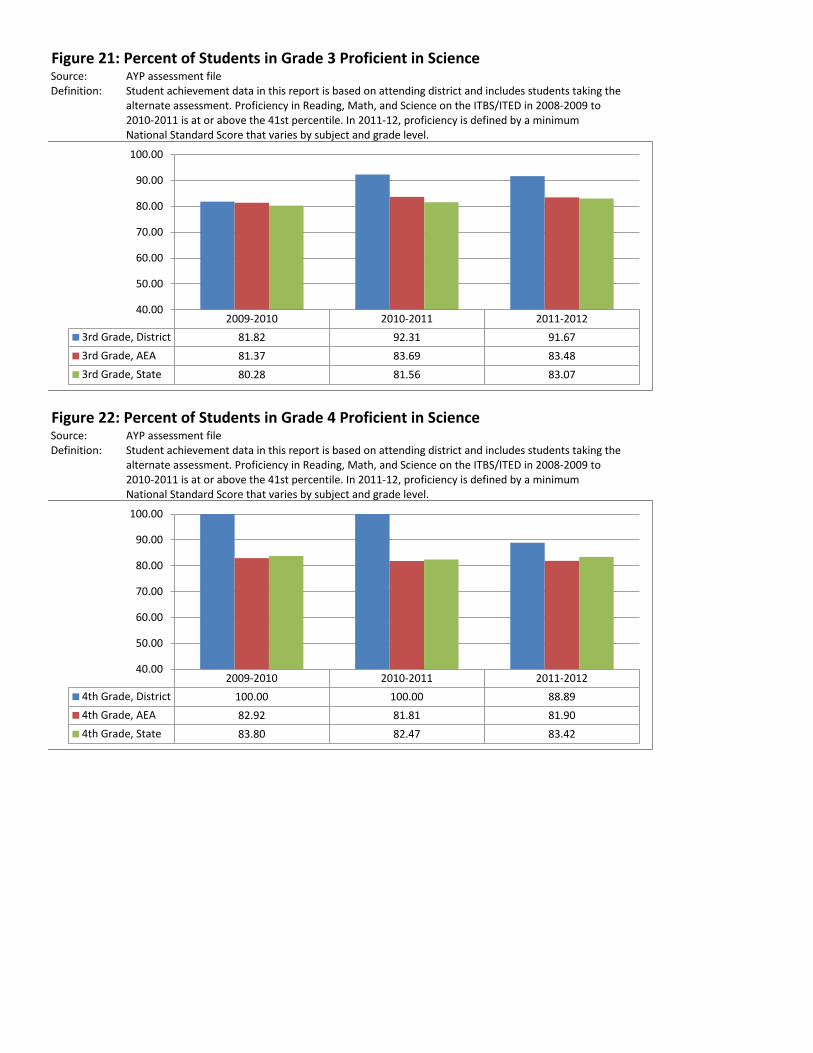
Figure 21: Percent of Students in Grade 3 Proficient in Science Source: AYP assessment file Definition: Student achievement data in this report is based on attending district and includes students taking the
alternate assessment. Proficiency in Reading, Math, and Science on the ITBS/ITED in 2008-2009 to 2010-2011 is at or above the 41st percentile. In 2011-12, proficiency is defined by a minimum National Standard Score that varies by subject and grade level.
100.00
90.00
80.00
70.00
60.00
50.00
40.00 2009-2010 2010-2011 2011-2012
3rd Grade, District 81.82 92.31 91.67 3rd Grade, AEA 81.37 83.69 83.48 3rd Grade, State 80.28 81.56 83.07
Figure 22: Percent of Students in Grade 4 Proficient in Science Source: AYP assessment file Definition: Student achievement data in this report is based on attending district and includes students taking the
alternate assessment. Proficiency in Reading, Math, and Science on the ITBS/ITED in 2008-2009 to 2010-2011 is at or above the 41st percentile. In 2011-12, proficiency is defined by a minimum National Standard Score that varies by subject and grade level.
100.00
90.00
80.00
70.00
60.00
50.00
40.00 2009-2010 2010-2011 2011-2012
4th Grade, District 100.00 100.00 88.89 4th Grade, AEA 82.92 81.81 81.90 4th Grade, State 83.80 82.47 83.42
■
■
■
■
■
■
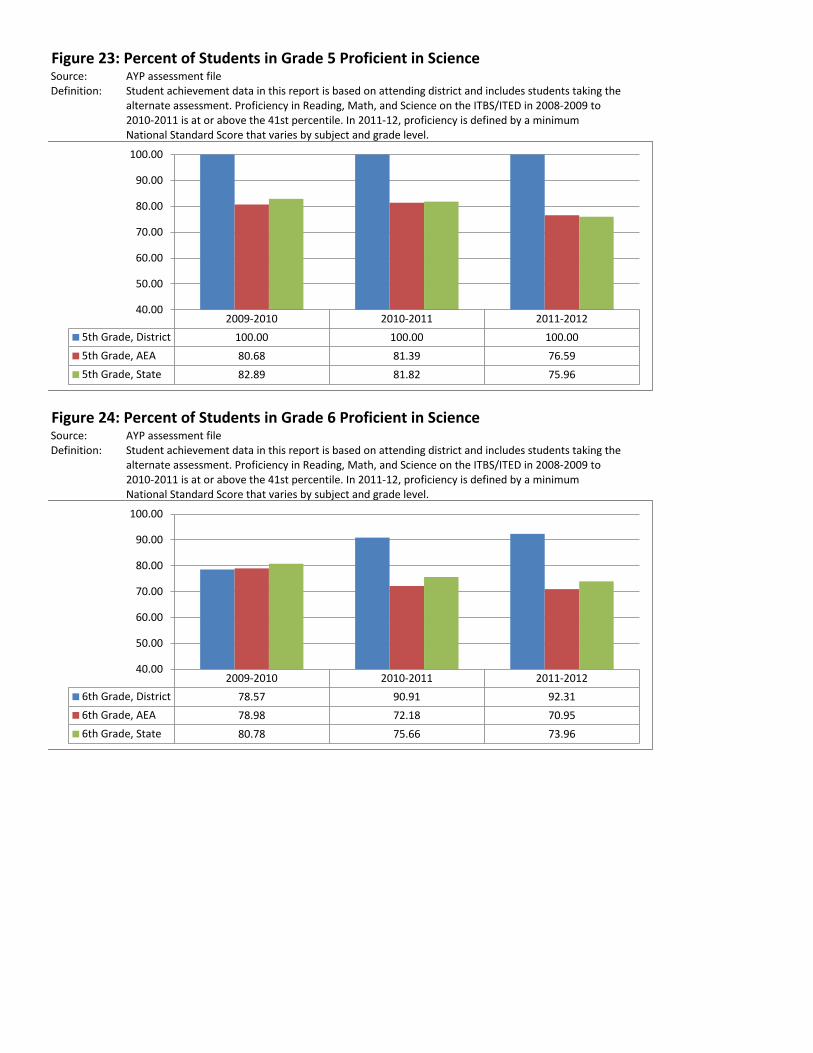
Figure 23: Percent of Students in Grade 5 Proficient in Science Source: AYP assessment file Definition: Student achievement data in this report is based on attending district and includes students taking the
alternate assessment. Proficiency in Reading, Math, and Science on the ITBS/ITED in 2008-2009 to 2010-2011 is at or above the 41st percentile. In 2011-12, proficiency is defined by a minimum National Standard Score that varies by subject and grade level.
100.00
90.00
80.00
70.00
60.00
50.00
40.00 2009-2010 2010-2011 2011-2012
5th Grade, District 100.00 100.00 100.00 5th Grade, AEA 80.68 81.39 76.59 5th Grade, State 82.89 81.82 75.96
Figure 24: Percent of Students in Grade 6 Proficient in Science Source: AYP assessment file Definition: Student achievement data in this report is based on attending district and includes students taking the
alternate assessment. Proficiency in Reading, Math, and Science on the ITBS/ITED in 2008-2009 to 2010-2011 is at or above the 41st percentile. In 2011-12, proficiency is defined by a minimum National Standard Score that varies by subject and grade level.
100.00
90.00
80.00
70.00
60.00
50.00
40.00 2009-2010 2010-2011 2011-2012
6th Grade, District 78.57 90.91 92.31 6th Grade, AEA 78.98 72.18 70.95 6th Grade, State 80.78 75.66 73.96
■
■
■
■
■
■
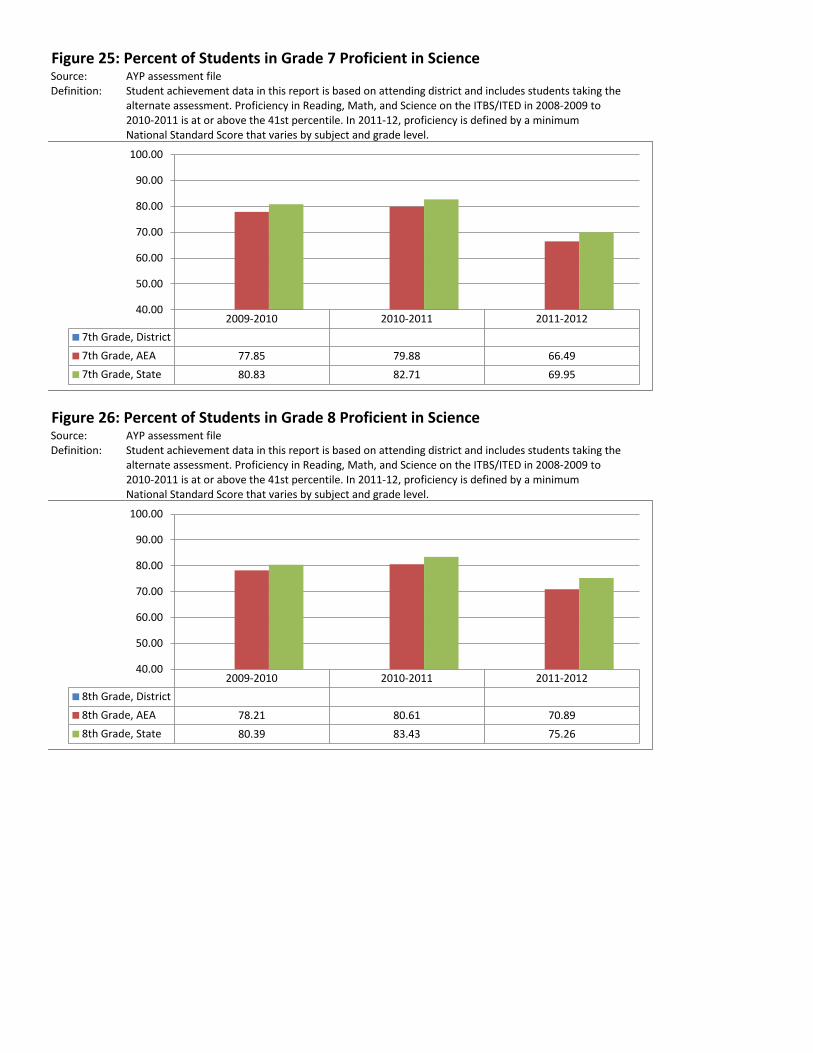
Figure 25: Percent of Students in Grade 7 Proficient in Science Source: AYP assessment file Definition: Student achievement data in this report is based on attending district and includes students taking the
alternate assessment. Proficiency in Reading, Math, and Science on the ITBS/ITED in 2008-2009 to 2010-2011 is at or above the 41st percentile. In 2011-12, proficiency is defined by a minimum National Standard Score that varies by subject and grade level.
100.00
90.00
80.00
70.00
60.00
50.00
40.00 2009-2010 2010-2011 2011-2012
7th Grade, District 7th Grade, AEA 77.85 79.88 66.49 7th Grade, State 80.83 82.71 69.95
Figure 26: Percent of Students in Grade 8 Proficient in Science Source: AYP assessment file Definition: Student achievement data in this report is based on attending district and includes students taking the
alternate assessment. Proficiency in Reading, Math, and Science on the ITBS/ITED in 2008-2009 to 2010-2011 is at or above the 41st percentile. In 2011-12, proficiency is defined by a minimum National Standard Score that varies by subject and grade level.
100.00
90.00
80.00
70.00
60.00
50.00
40.00 2009-2010 2010-2011 2011-2012
8th Grade, District 8th Grade, AEA 78.21 80.61 70.89 8th Grade, State 80.39 83.43 75.26
■
■
■
■
■
■
Figure 27: Percent of Students in Grade 11 Proficient in Science Source: AYP assessment file Definition: Student achievement data in this report is based on attending district and includes students taking the
alternate assessment. Proficiency in Reading, Math, and Science on the ITBS/ITED in 2008-2009 to 2010-2011 is at or above the 41st percentile. In 2011-12, proficiency is defined by a minimum National Standard Score that varies by subject and grade level.
100.00
90.00
80.00
70.00
60.00
50.00
40.00 2009-2010 2010-2011 2011-2012
11th Grade, District 11th Grade, AEA 78.44 76.88 82.12 11th Grade, State 80.22 81.17 84.84
Figure 28: Percent of Students with Disabilities in Grades 3-8, 11 Proficient in Reading Source: AYP assessment file Definition: Student achievement data in this report is based on attending district and includes students taking the
alternate assessment. Proficiency in Reading, Math, and Science on the ITBS/ITED in 2008-2009 to 2010-2011 is at or above the 41st percentile. In 2011-12, proficiency is defined by a minimum National Standard Score that varies by subject and grade level. Student demographic data is pulled from the district student information system to create the bar code. Missing data indicates there are fewer than 10 students who tested in the subgroup.
100.00
80.00
60.00
40.00
20.00
0.00 2008-09 2009-10 2010-11 2011-12
IEP, District IEP, AEA 26.43 26.91 30.03 26.08 IEP, State 31.32 31.82 33.65 30.55
■
■
■
■
■
■
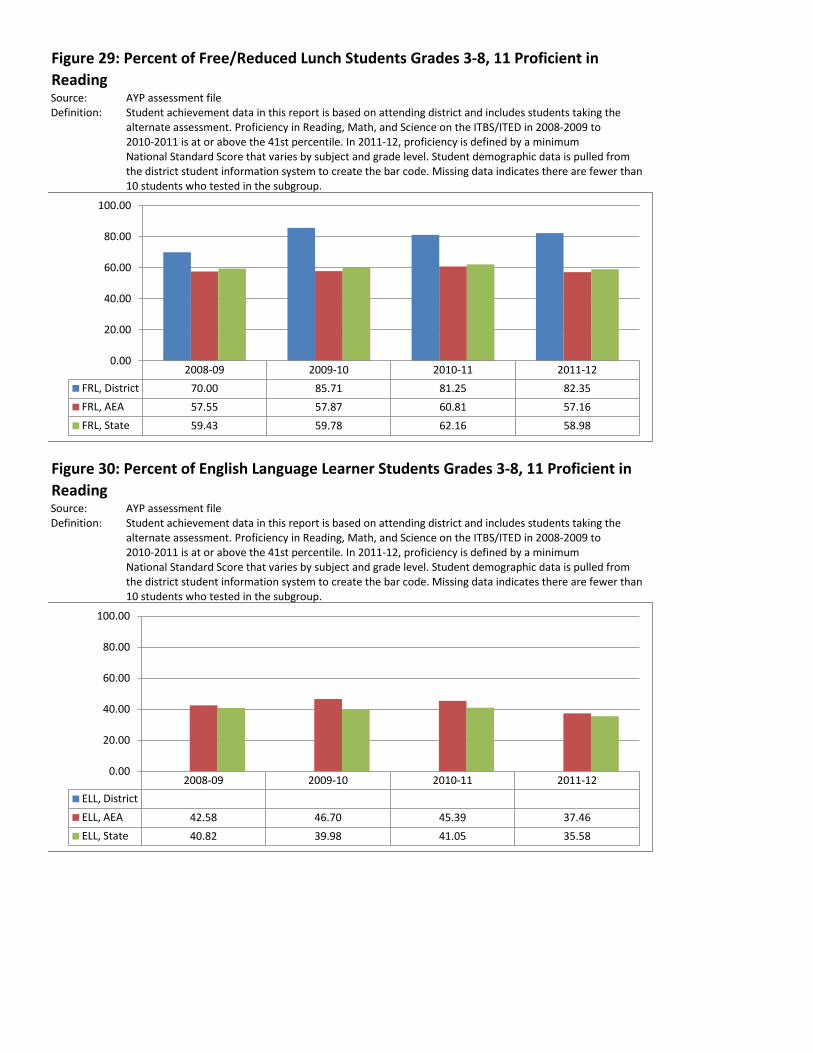
Figure 29: Percent of Free/Reduced Lunch Students Grades 3-8, 11 Proficient in Reading Source: AYP assessment file Definition: Student achievement data in this report is based on attending district and includes students taking the
alternate assessment. Proficiency in Reading, Math, and Science on the ITBS/ITED in 2008-2009 to 2010-2011 is at or above the 41st percentile. In 2011-12, proficiency is defined by a minimum National Standard Score that varies by subject and grade level. Student demographic data is pulled from the district student information system to create the bar code. Missing data indicates there are fewer than 10 students who tested in the subgroup.
100.00
80.00
60.00
40.00
20.00
0.00 2008-09 2009-10 2010-11 2011-12
FRL, District 70.00 85.71 81.25 82.35 FRL, AEA 57.55 57.87 60.81 57.16 FRL, State 59.43 59.78 62.16 58.98
Figure 30: Percent of English Language Learner Students Grades 3-8, 11 Proficient in Reading Source: AYP assessment file Definition: Student achievement data in this report is based on attending district and includes students taking the
alternate assessment. Proficiency in Reading, Math, and Science on the ITBS/ITED in 2008-2009 to 2010-2011 is at or above the 41st percentile. In 2011-12, proficiency is defined by a minimum National Standard Score that varies by subject and grade level. Student demographic data is pulled from the district student information system to create the bar code. Missing data indicates there are fewer than 10 students who tested in the subgroup.
100.00
80.00
60.00
40.00
20.00
0.00 2008-09 2009-10 2010-11 2011-12
ELL, District ELL, AEA 42.58 46.70 45.39 37.46 ELL, State 40.82 39.98 41.05 35.58
■
■
■
■
■
■
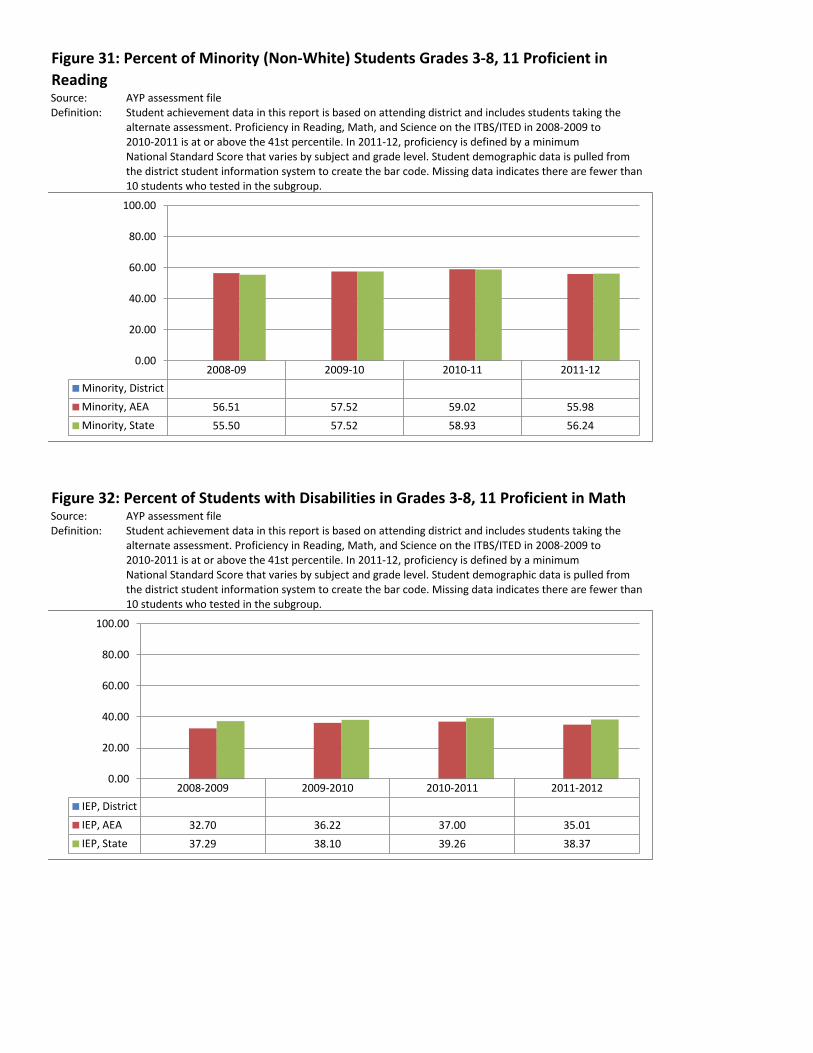
Figure 31: Percent of Minority (Non-White) Students Grades 3-8, 11 Proficient in Reading Source: AYP assessment file Definition: Student achievement data in this report is based on attending district and includes students taking the
alternate assessment. Proficiency in Reading, Math, and Science on the ITBS/ITED in 2008-2009 to 2010-2011 is at or above the 41st percentile. In 2011-12, proficiency is defined by a minimum National Standard Score that varies by subject and grade level. Student demographic data is pulled from the district student information system to create the bar code. Missing data indicates there are fewer than 10 students who tested in the subgroup.
100.00
80.00
60.00
40.00
20.00
0.00 2008-09 2009-10 2010-11 2011-12
Minority, District Minority, AEA 56.51 57.52 59.02 55.98 Minority, State 55.50 57.52 58.93 56.24
Figure 32: Percent of Students with Disabilities in Grades 3-8, 11 Proficient in Math Source: AYP assessment file Definition: Student achievement data in this report is based on attending district and includes students taking the
alternate assessment. Proficiency in Reading, Math, and Science on the ITBS/ITED in 2008-2009 to 2010-2011 is at or above the 41st percentile. In 2011-12, proficiency is defined by a minimum National Standard Score that varies by subject and grade level. Student demographic data is pulled from the district student information system to create the bar code. Missing data indicates there are fewer than 10 students who tested in the subgroup.
100.00
80.00
60.00
40.00
20.00
0.00 2008-2009 2009-2010 2010-2011 2011-2012
IEP, District IEP, AEA 32.70 36.22 37.00 35.01 IEP, State 37.29 38.10 39.26 38.37
■
■
■
■
■
■
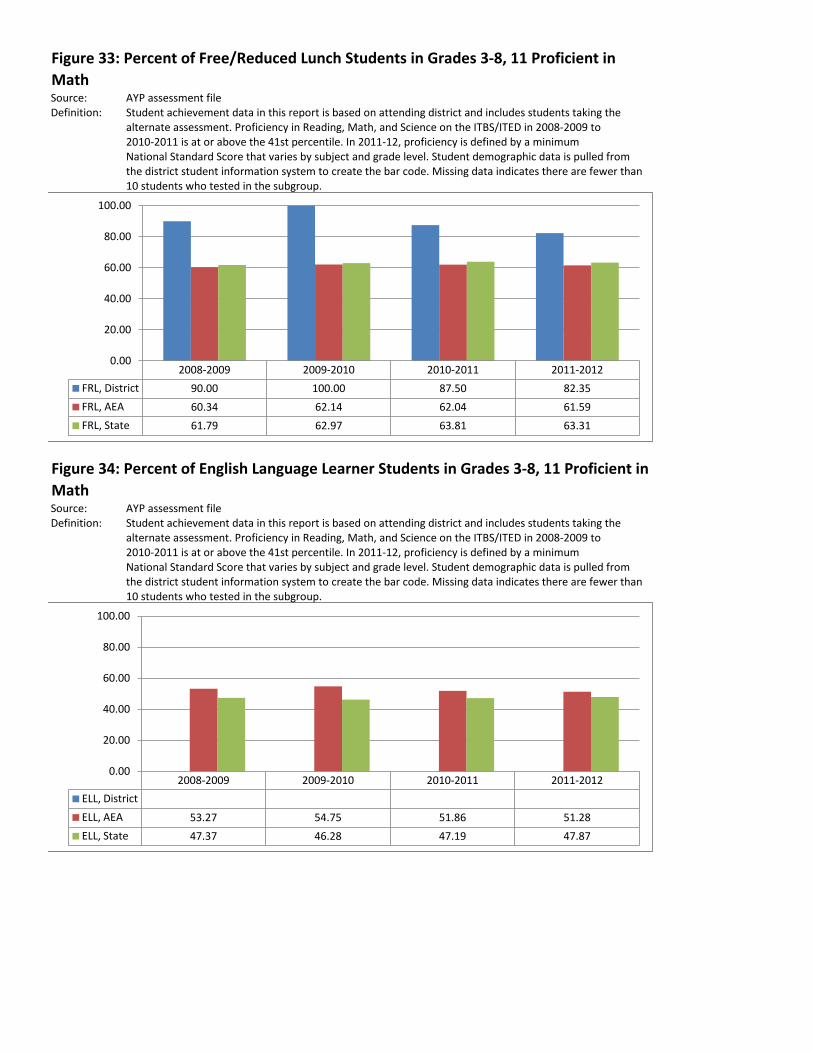
Figure 33: Percent of Free/Reduced Lunch Students in Grades 3-8, 11 Proficient in Math Source: AYP assessment file Definition: Student achievement data in this report is based on attending district and includes students taking the
alternate assessment. Proficiency in Reading, Math, and Science on the ITBS/ITED in 2008-2009 to 2010-2011 is at or above the 41st percentile. In 2011-12, proficiency is defined by a minimum National Standard Score that varies by subject and grade level. Student demographic data is pulled from the district student information system to create the bar code. Missing data indicates there are fewer than 10 students who tested in the subgroup.
100.00
80.00
60.00
40.00
20.00
0.00 2008-2009 2009-2010 2010-2011 2011-2012
FRL, District 90.00 100.00 87.50 82.35 FRL, AEA 60.34 62.14 62.04 61.59 FRL, State 61.79 62.97 63.81 63.31
Figure 34: Percent of English Language Learner Students in Grades 3-8, 11 Proficient in Math Source: AYP assessment file Definition: Student achievement data in this report is based on attending district and includes students taking the
alternate assessment. Proficiency in Reading, Math, and Science on the ITBS/ITED in 2008-2009 to 2010-2011 is at or above the 41st percentile. In 2011-12, proficiency is defined by a minimum National Standard Score that varies by subject and grade level. Student demographic data is pulled from the district student information system to create the bar code. Missing data indicates there are fewer than 10 students who tested in the subgroup.
100.00
80.00
60.00
40.00
20.00
0.00 2008-2009 2009-2010 2010-2011 2011-2012
ELL, District ELL, AEA 53.27 54.75 51.86 51.28 ELL, State 47.37 46.28 47.19 47.87
■
■
■
■
■
■
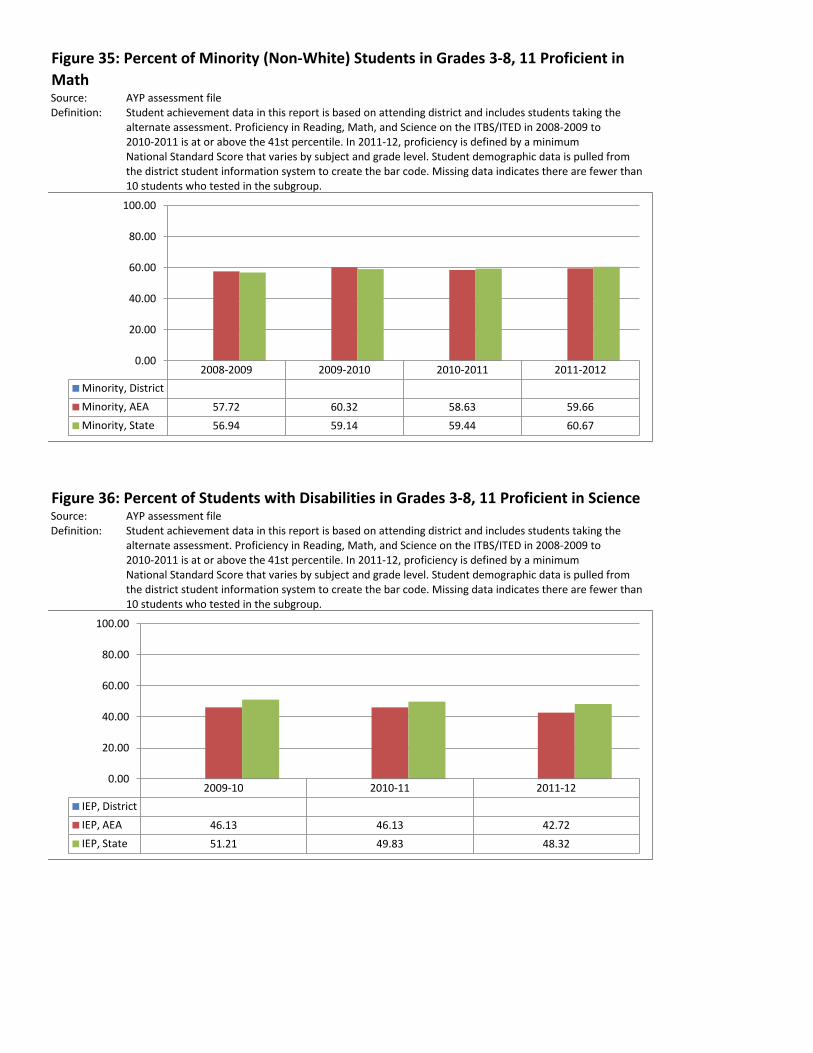
Figure 35: Percent of Minority (Non-White) Students in Grades 3-8, 11 Proficient in Math Source: AYP assessment file Definition: Student achievement data in this report is based on attending district and includes students taking the
alternate assessment. Proficiency in Reading, Math, and Science on the ITBS/ITED in 2008-2009 to 2010-2011 is at or above the 41st percentile. In 2011-12, proficiency is defined by a minimum National Standard Score that varies by subject and grade level. Student demographic data is pulled from the district student information system to create the bar code. Missing data indicates there are fewer than 10 students who tested in the subgroup.
100.00
80.00
60.00
40.00
20.00
0.00 2008-2009 2009-2010 2010-2011 2011-2012
Minority, District Minority, AEA 57.72 60.32 58.63 59.66 Minority, State 56.94 59.14 59.44 60.67
Figure 36: Percent of Students with Disabilities in Grades 3-8, 11 Proficient in Science Source: AYP assessment file Definition: Student achievement data in this report is based on attending district and includes students taking the
alternate assessment. Proficiency in Reading, Math, and Science on the ITBS/ITED in 2008-2009 to 2010-2011 is at or above the 41st percentile. In 2011-12, proficiency is defined by a minimum National Standard Score that varies by subject and grade level. Student demographic data is pulled from the district student information system to create the bar code. Missing data indicates there are fewer than 10 students who tested in the subgroup.
100.00
80.00
60.00
40.00
20.00
0.00 2009-10 2010-11 2011-12
IEP, District IEP, AEA 46.13 46.13 42.72 IEP, State 51.21 49.83 48.32
■
■
■
■
■
■
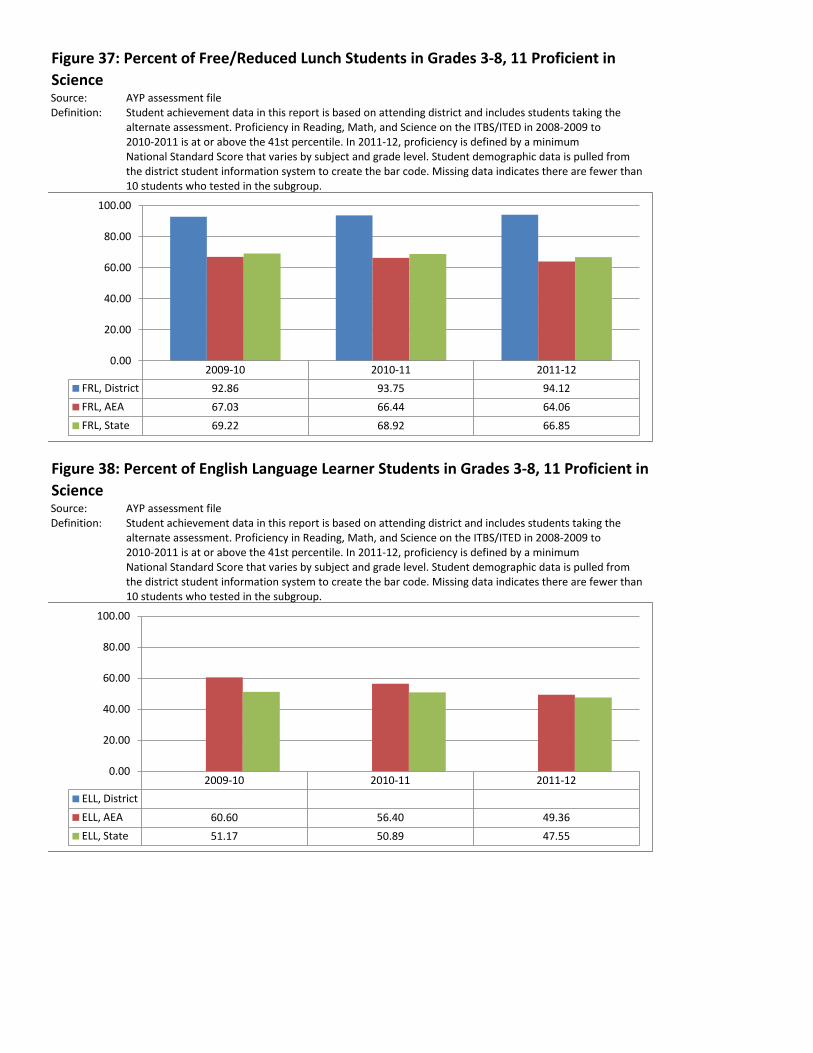
Figure 37: Percent of Free/Reduced Lunch Students in Grades 3-8, 11 Proficient in Science Source: AYP assessment file Definition: Student achievement data in this report is based on attending district and includes students taking the
alternate assessment. Proficiency in Reading, Math, and Science on the ITBS/ITED in 2008-2009 to 2010-2011 is at or above the 41st percentile. In 2011-12, proficiency is defined by a minimum National Standard Score that varies by subject and grade level. Student demographic data is pulled from the district student information system to create the bar code. Missing data indicates there are fewer than 10 students who tested in the subgroup.
100.00
80.00
60.00
40.00
20.00
0.00 2009-10 2010-11 2011-12
FRL, District 92.86 93.75 94.12 FRL, AEA 67.03 66.44 64.06 FRL, State 69.22 68.92 66.85
Figure 38: Percent of English Language Learner Students in Grades 3-8, 11 Proficient in Science Source: AYP assessment file Definition: Student achievement data in this report is based on attending district and includes students taking the
alternate assessment. Proficiency in Reading, Math, and Science on the ITBS/ITED in 2008-2009 to 2010-2011 is at or above the 41st percentile. In 2011-12, proficiency is defined by a minimum National Standard Score that varies by subject and grade level. Student demographic data is pulled from the district student information system to create the bar code. Missing data indicates there are fewer than 10 students who tested in the subgroup.
100.00
80.00
60.00
40.00
20.00
0.00 2009-10 2010-11 2011-12
ELL, District ELL, AEA 60.60 56.40 49.36 ELL, State 51.17 50.89 47.55
■
■
■
■
■
■
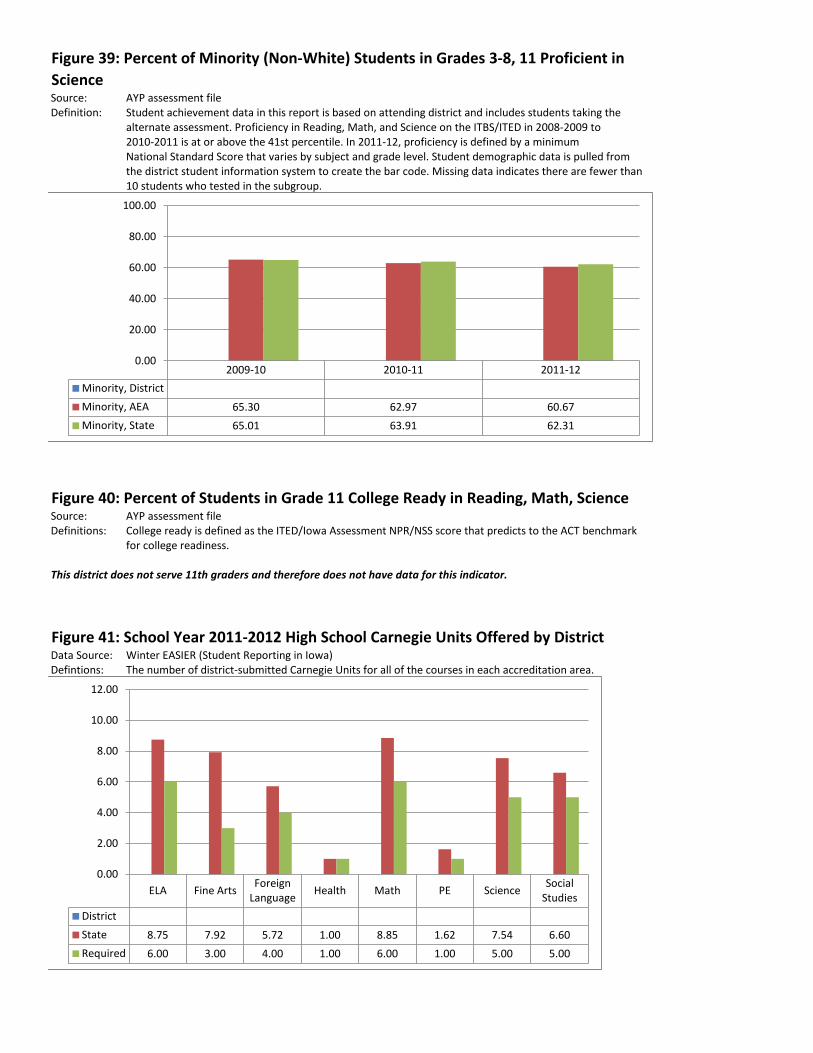
Figure 39: Percent of Minority (Non-White) Students in Grades 3-8, 11 Proficient in Science Source: AYP assessment file Definition: Student achievement data in this report is based on attending district and includes students taking the
alternate assessment. Proficiency in Reading, Math, and Science on the ITBS/ITED in 2008-2009 to 2010-2011 is at or above the 41st percentile. In 2011-12, proficiency is defined by a minimum National Standard Score that varies by subject and grade level. Student demographic data is pulled from the district student information system to create the bar code. Missing data indicates there are fewer than 10 students who tested in the subgroup.
100.00
80.00
60.00
40.00
20.00
0.00 2009-10 2010-11 2011-12
Minority, District Minority, AEA 65.30 62.97 60.67 Minority, State 65.01 63.91 62.31
Figure 40: Percent of Students in Grade 11 College Ready in Reading, Math, Science Source: AYP assessment file Definitions: College ready is defined as the ITED/Iowa Assessment NPR/NSS score that predicts to the ACT benchmark
for college readiness.
This district does not serve 11th graders and therefore does not have data for this indicator.
Figure 41: School Year 2011-2012 High School Carnegie Units Offered by District Data Source: Winter EASIER (Student Reporting in Iowa) Defintions: The number of district-submitted Carnegie Units for all of the courses in each accreditation area.
12.00
10.00
8.00
6.00
4.00
2.00
0.00 ELA Fine Arts Foreign
Language Health Math PE Science Social Studies
District State 8.75 7.92 5.72 1.00 8.85 1.62 7.54 6.60 Required 6.00 3.00 4.00 1.00 6.00 1.00 5.00 5.00
_.
- ---------- -- - -~
~
-&-
- -- ---. ~~
. T
~ V'
~
~
-&-
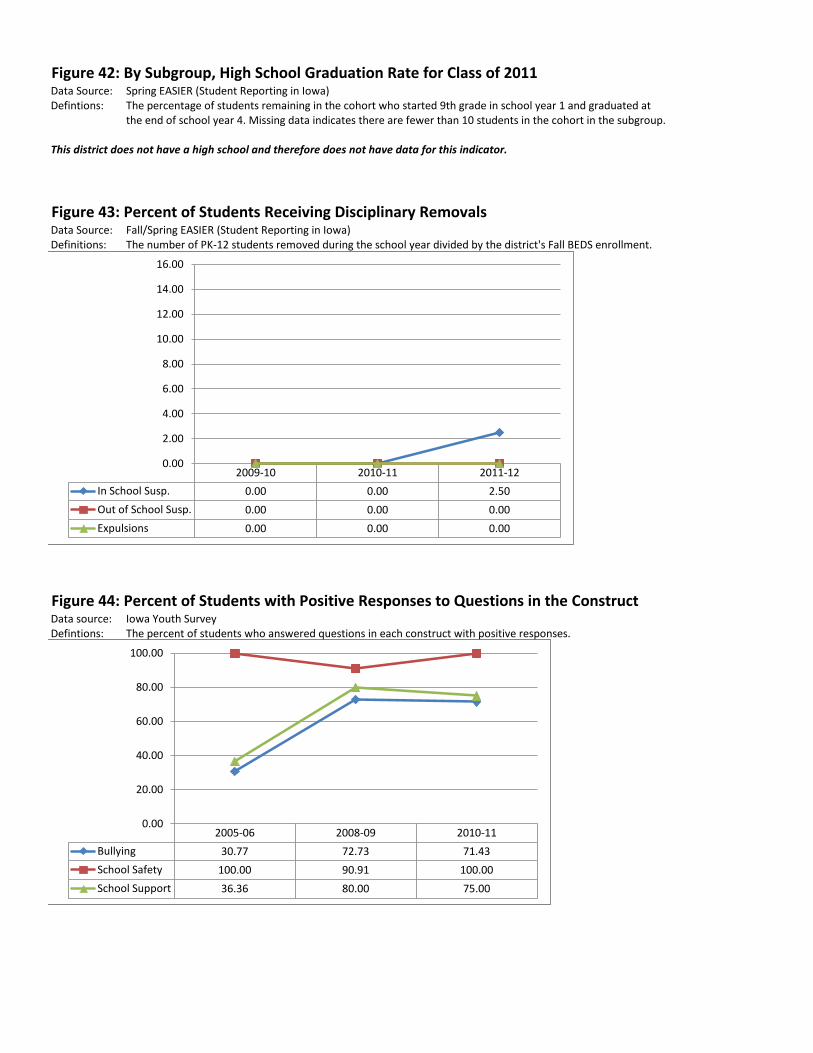
Figure 42: By Subgroup, High School Graduation Rate for Class of 2011 Data Source: Spring EASIER (Student Reporting in Iowa) Defintions: The percentage of students remaining in the cohort who started 9th grade in school year 1 and graduated at
the end of school year 4. Missing data indicates there are fewer than 10 students in the cohort in the subgroup.
This district does not have a high school and therefore does not have data for this indicator.
Figure 43: Percent of Students Receiving Disciplinary Removals Data Source: Fall/Spring EASIER (Student Reporting in Iowa) Definitions: The number of PK-12 students removed during the school year divided by the district's Fall BEDS enrollment.
2009-10 2010-11 2011-12 In School Susp. 0.00 0.00 2.50 Out of School Susp. 0.00 0.00 0.00 Expulsions 0.00 0.00 0.00
0.00
2.00
4.00
6.00
8.00
10.00
12.00
14.00
16.00
Figure 44: Percent of Students with Positive Responses to Questions in the Construct Data source: Iowa Youth Survey Defintions: The percent of students who answered questions in each construct with positive responses.
100.00
80.00
60.00
40.00
20.00
0.00 2005-06 2008-09 2010-11
Bullying 30.77 72.73 71.43 School Safety 100.00 90.91 100.00 School Support 36.36 80.00 75.00