231
Testwell CTC++ Test Coverage Analyzer for C/C++ User’s Guide Version 8.0.1
Testwell CTC++
Test Coverage Analyzer for C/C++
User’s Guide Version 8.0.1

CTC++ - Test Coverage Analyzer for C/C++ User’s Guide, V8.0.1
June 2016, upgraded for version v8.0.1
Previous document versions:
November 2015, upgraded for version v8.0 May 2015, upgraded for version v7.3.3 October 2014, upgraded for version v7.3.1 August 2014, upgraded for version v7.3 March 2014, upgraded for version v7.2 April 2013, upgraded for version v7.1.1 January 2013, upgraded for version v7.1 February 2012, upgraded for version v7.0.2 August 2011, upgraded for version v7.0 (pdf) March 2010, upgraded for version v6.5.6 (pdf) October 2009, upgraded for version v6.5.5 (pdf) February 2009, upgraded for version v6.5.4 (pdf) July 2008, upgraded for version v6.5.3 (pdf) January 2008, upgraded for version 6.5 (pdf) July 2007, upgraded for version 6.4 (pdf) January 2007, upgraded for version v6.3 (pdf) March 2006, upgraded for version v6.2 (pdf) August 2005, upgraded for version v6.1.1 (pdf) April 2005, upgraded for version v6.1 (pdf) July 2004, upgraded for version v6.0 (pdf) January 2004, upgraded for version v5.2.1 (.pdf) October 2003, upgraded for version v5.2 (.pdf) December 2002, upgraded for version v5.0.10 (.pdf) May 2002 (upgraded to v5.0.8 level, only as .pdf) October 2001 (upgraded to v5.0.6 level, paper and .pdf) February 2001 (.pdf version, correcting of typos, v5.0 level still) March 2000 (initial version of this CTC++ v5.0 level document, paper) Copyright (c) 1993-2013 Testwell Oy Copyright (c) 2013-2016 Verifysoft Technology GmbH
All distinctive marks are properties of their respective holders.
Verifysoft Technology GmbH
Technologiepark Offenburg In der Spoeck 10-12 D-77676 Offenburg, Germany URL. http://www.verifysoft.com
Contents
1. ABOUT THIS GUIDE ..................................................................................................2
1.1 OVERALL..........................................................................................................................2 1.2 ABOUT THIS VERSION OF CTC++....................................................................................5 1.3 ABOUT PREVIOUS VERSIONS OF CTC++ .........................................................................5
2. INTRODUCING CTC++..............................................................................................7
2.1 ABOUT CTC++ ................................................................................................................7 2.2 ABOUT CODE COVERAGE IN CTC++ .............................................................................10 2.3 ABOUT DYNAMIC ANALYSIS IN CTC++ ........................................................................13
3. INSTALLING CTC++ ................................................................................................15
3.1 GENERAL HARDWARE AND SOFTWARE REQUIREMENTS...............................................15 3.2 INSTALLATION PROCEDURE ...........................................................................................16 3.3 GENERAL CTC++ SOFTWARE STRUCTURE AFTER INSTALLATION................................16
4. TUTORIAL EXAMPLE.............................................................................................20
4.1 BASIC USE OF CTC++....................................................................................................20 4.2 TUTORIAL CONTINUED / PROGRAM CHANGES ..............................................................27 4.3 TUTORIAL CONTINUED / SEPARATE LINK COMMAND ...................................................27 4.4 TUTORIAL CONTINUED / USE WITH MAKEFILES ...........................................................28 4.5 TUTORIAL CONTINUED / USE WITH MAKEFILES VIA CTCWRAP ....................................29
5. USING CTC++ PREPROCESSOR...........................................................................31
5.1 INTRODUCTION...............................................................................................................32 5.2 STARTING CTC................................................................................................................32 5.3 CTC OPTIONS ..................................................................................................................33 5.4 THE INSTRUMENTATION PROCESS .................................................................................37 5.5 CHOOSING INSTRUMENTATION MODE ...........................................................................41 5.6 INSTRUMENTING ALL BUT SOME SELECTED FILES .......................................................41 5.7 INSTRUMENTING ONLY SOME SELECTED FILES.............................................................42 5.8 INSTRUMENTING CODE COMING FROM INCLUDED FILES..............................................43 5.9 REINSTRUMENTATION AFTER CHANGING SOME FILES ..................................................44 5.10 GETTING BACK TO NON-INSTRUMENTED EXECUTABLE............................................45 5.11 SKIPPING INSTRUMENTATION OF SELECTED FUNCTIONS ..........................................45 5.12 BUILDING AN INSTRUMENTED STATIC LIBRARY .......................................................47 5.13 WORKING WITH 32-BIT VS. 64-BIT CODE...................................................................48 5.14 ENQUIRIES OF INSTRUMENTATIONS...........................................................................49 5.15 SOME BUILD INTEGRATIONS......................................................................................49
5.15.1 ctcwrap Utility ..................................................................................................49

5.15.2 IDE Integrations at Windows ...........................................................................51
6. TEST RUNS WITH THE INSTRUMENTED PROGRAM ...................................53
6.1 INTRODUCTION...............................................................................................................53 6.2 RUNNING THE INSTRUMENTED PROGRAM .....................................................................54 6.3 CONFIGURATION FILE ....................................................................................................54 6.4 SAVING EXECUTION COUNTERS ....................................................................................54
6.4.1 When the Counters are Saved ...............................................................................54 6.4.2 Where the Counters are Saved..............................................................................57 6.4.3 When the Counters of a File are Not Saved..........................................................59 6.4.4 Appending vs. Overwriting Counters in a Datafile ..............................................59
6.5 64-BIT INSTRUMENTED PROGRAMS ...............................................................................60 6.6 TEST CASE CONCEPT .....................................................................................................61
7. USING CTC++ POSTPROCESSOR ........................................................................64
7.1 INTRODUCTION...............................................................................................................64 7.2 STARTING CTCPOST........................................................................................................66 7.3 CTCPOST OPTIONS ..........................................................................................................66 7.4 UNDERSTANDING CTCPOST BEHAVIOR ..........................................................................70
7.4.1 ctcpost Behavior when Producing Listings ..........................................................70 7.4.2 ctcpost Behavior when Adding Symbolfiles ..........................................................75 7.4.3 ctcpost Behavior when Adding Datafiles..............................................................75 7.4.4 ctcpost Behavior when Listing Symbolfile/Datafile Contents ..............................76
7.5 CTC++ LISTINGS ...........................................................................................................76 7.5.1 Execution Profile Listing ......................................................................................77 7.5.2 Coverage views .....................................................................................................81 7.5.3 Included files .........................................................................................................85 7.5.4 Untested Code Listing...........................................................................................90 7.5.5 Execution Time Listing .........................................................................................91 7.5.6 XML Form Coverage Report ................................................................................93 7.5.7 Symbolfile/Datafile Contents Listing ....................................................................99
8. USING CTCXMLMERGE UTILITY.....................................................................102
8.1 INTRODUCTION.............................................................................................................102 8.2 STARTING CTCXMLMERGE ...........................................................................................103 8.3 CTCXMLMERGE OPTIONS .............................................................................................103 8.4 CTCXMLMERGE BEHAVIOR ..........................................................................................105
8.4.1 Example, Code Files ...........................................................................................105 8.4.2 Example, Builds and Test Runs...........................................................................106 8.4.3 Example, Obtaining the Merged Coverage Report ............................................106 8.4.4 Example, Merged Profile Listing Explained.......................................................106 8.4.5 Example, Merged XML Summary.......................................................................108
8.5 A WORD OF WARNING OF CTCXMLMERGE’S USABILITY ............................................110
9. USING CTC2HTML UTILITY...............................................................................112
9.1 INTRODUCTION.............................................................................................................112 9.2 STARTING CTC2HTML...................................................................................................113
9.3 CTC2HTML OPTIONS.....................................................................................................113 9.4 CTC2HTML.INI CONFIGURATION FILE ...........................................................................116 9.5 FILES PRODUCED..........................................................................................................116 9.6 THE HTML DOCUMENT ..............................................................................................116
10. USING CTC2EXCEL UTILITY .............................................................................126
10.1 INTRODUCTION ........................................................................................................126 10.2 STARTING CTC2EXCEL .............................................................................................126 10.3 CTC2EXCEL OPTIONS ...............................................................................................126 10.4 CTC2EXCEL BEHAVIOR ............................................................................................127
11. CTC++ INSTRUMENTATION MODES ...............................................................129
11.1 FUNCTION COVERAGE .............................................................................................130 11.2 DECISION COVERAGE ..............................................................................................130 11.3 MULTICONDITION COVERAGE .................................................................................136 11.4 STATEMENT COVERAGE ..........................................................................................138 11.5 HOW STRUCTURAL COVERAGE PERCENT (TER%) IS CALCULATED ......................139 11.6 LINE COVERAGE ......................................................................................................140 11.7 TIMING (EXECUTION COST) INSTRUMENTATION.....................................................140 11.8 EXCLUSIVE VS. INCLUSIVE TIMING (EXECUTION COST) MEASURING ....................142 11.9 INLINE VS. SAFE COUNTER INCREMENTING ............................................................142
12. CONFIGURING CTC++..........................................................................................144
12.1 CONFIGURATION FILE ..............................................................................................144 12.2 CONFIGURATION FILE FINDING ...............................................................................145 12.3 CONFIGURATION FILE FORMAT ...............................................................................146 12.4 CONFIGURATION PARAMETERS ...............................................................................148
12.4.1 Software License Parameters .........................................................................148 12.4.2 Parameter KEYPORT.....................................................................................148 12.4.3 Parameter FLEXLM_LICENSE_FILE...........................................................148 12.4.4 Parameter TIMER ..........................................................................................149 12.4.5 Parameter TICK .............................................................................................150 12.4.6 Parameter EXECUTION_COST_TYPE.........................................................150 12.4.7 Parameter EMBED_FUNCTION_NAME......................................................150 12.4.8 Parameter SKIP_FUNCTION_NAME...........................................................151 12.4.9 Parameter COMMAND..................................................................................151 12.4.10 Parameter TYPE.............................................................................................152 12.4.11 Parameter PREPROC_C................................................................................152 12.4.12 Parameter PREPROC_CXX...........................................................................153 12.4.13 Parameter OPTCHARS ..................................................................................154 12.4.14 Parameter OPTFILE ......................................................................................154 12.4.15 Parameter PARAMS.......................................................................................155 12.4.16 Parameter PARAMS_SEPARATE..................................................................157 12.4.17 Parameter PARAMS_OPTIONAL..................................................................157 12.4.18 Parameter PARAMS_LIST .............................................................................157 12.4.19 Parameter PARAMS_LIST_SEPARATOR .....................................................157

12.4.20 Parameter OPT_ADD_PREPROC ................................................................158 12.4.21 Parameter OPT_COMPILE_ONLY ...............................................................158 12.4.22 Parameter OPT_COMP_OUT .......................................................................159 12.4.23 Parameter OPT_LINK_OUT..........................................................................159 12.4.24 Parameter OPT_NO_CTC .............................................................................159 12.4.25 Parameter OPT_NO_PREPROC ...................................................................159 12.4.26 Parameter OPT_NO_COMPILE....................................................................159 12.4.27 Parameter OPT_ADD_COMPILE.................................................................160 12.4.28 Parameter OPT_DO_2COMP .......................................................................160 12.4.29 Parameter EXT_C ..........................................................................................161 12.4.30 Parameter EXT_CXX .....................................................................................161 12.4.31 Parameter EXT_OTHER ................................................................................162 12.4.32 Parameter EXT_CSHARP ..............................................................................162 12.4.33 Parameter EXT_JAVA....................................................................................162 12.4.34 Parameter OBJECT_EXTENSION ................................................................162 12.4.35 Parameter DIFF_COMP_AND_LINK_OPTS...............................................163 12.4.36 Parameter LIBRARY.......................................................................................163 12.4.37 Parameter OPT_NO_LINK ............................................................................163 12.4.38 Parameters DIALECT_C and DIALECT_CXX..............................................163 12.4.39 Parameter TMP_DIRECTORY ......................................................................164 12.4.40 Parameter EXCLUDE, NO_EXCLUDE and NO_INCLUDE .......................164 12.4.41 Parameter SOURCE_IDENTIFICATION......................................................167 12.4.42 Parameter MAX_CMDLINE_LENGTH.........................................................168 12.4.43 Parameter OPT_NO_OPTFILE.....................................................................169 12.4.44 Parameter DATAFILE....................................................................................169 12.4.45 Parameter WARNING_LEVEL ......................................................................170 12.4.46 Using Additional/User-Defined Instrumentation Phases...............................170
13. HOST-TARGET TESTING.....................................................................................174
13.1 INTRODUCTION ........................................................................................................174 13.2 "TEACHING" THE CROSS-COMPILER COMMAND AND ITS OPTIONS TO CTC++ ......177 13.3 TEXTUALISED COVERAGE DATA FILE FORMAT ......................................................178 13.4 DEVELOPING THE RECEIVER PROGRAM INTO THE HOST.........................................179 13.5 DEVELOPING THE SENDER FUNCTION INTO THE TARGET........................................180 13.6 INSTRUMENTATION IN THE HOST.............................................................................180 13.7 TRIGGERING THE COUNTERS SENDING TO THE HOST..............................................182 13.8 USING CTC2DAT UTILITY.........................................................................................184 13.9 GETTING THE REPORTS............................................................................................186 13.10 USING BITCOV ADDON PACKAGE............................................................................186
14. CTC++ DETAILS......................................................................................................189
14.1 CTC++ INSTRUMENTATION PRAGMAS....................................................................189 14.2 SKIPPING SOURCE CODE IN INSTRUMENTATION......................................................190 14.3 SPECIAL COUNTERS .................................................................................................192 14.4 ANNOTATIONS .........................................................................................................192 14.5 SPECIFYING COST FUNCTION...................................................................................193
14.6 ENFORCING C-LIKE TIMING INSTRUMENTATION.....................................................193 14.7 ALLOCATING COUNTERS FROM HEAP .....................................................................194 14.8 PARALLEL ACCESS TO SYMBOLFILE AND TO DATAFILE ...........................................195 14.9 USE OF OPTION -NO-COMP .......................................................................................196 14.10 HANDLING OF ONE COMPILE-TIME ASSERT TRICK.................................................197 14.11 HANDLING OF ASSEMBLY CODE..............................................................................198 14.12 REMARKS AND RESTRICTIONS.................................................................................198
14.12.1 Parallel Execution ..........................................................................................198 14.12.2 Recursion ........................................................................................................198 14.12.3 Returns from Functions ..................................................................................199 14.12.4 Instrumentation Overhead in Timing .............................................................199 14.12.5 Granularity of timing measurements..............................................................199 14.12.6 About C Library Functions.............................................................................199 14.12.7 Instrumenting for Function Call Tracing .......................................................200 14.12.8 Mixed Windows Unix Use...............................................................................200
15. APPENDIX A: PREPROCESSOR ERROR MESSAGES ...................................201
16. APPENDIX B: TEST-TIME ERROR MESSAGES..............................................206
17. APPENDIX C: POSTPROCESSOR ERROR MESSAGES.................................209
18. APPENDIX D: CTC2HTML ERROR MESSAGES .............................................214
19. APPENDIX E: CTCXMLMERGE ERROR MESSAGES...................................216
20. APPENDIX F: CTC2EXCEL ERROR MESSAGES............................................218
21. APPENDIX G: CTC2DAT ERROR MESSAGES.................................................219
22. INDEX ........................................................................................................................221


i
1. About This Guide
1.1 Overall
This guide describes the use of Testwell CTC++, Test Coverage Analyzer for C/C++. The official tool brand name is “Testwell CTC++”. In this guide a shorter name “CTC++” is used.
CTC++ is currently available on a couple of host platforms, including Windows, Linux, Solaris and HP-UX, and some more (see detailed platform availability from Verifysoft web pages). This guide is intended to be used on all environments where CTC++ is available. See the README.TXT file on the delivery media for more information about the environment specific matters.
By default, CTC++ is licensed as a host-platform specific floating license. It facilittates the tool use at the specified type of machine. I.e., the code under test is compiled (and instrumented) at the host for the host, and the tests are run at the same host machine (or same kind of host machine and operating system), and coverage and reporting is also done in the same host.
Additionally, the default license contains the Host-Target addon (HOTA) and Bitcov addon packages. They facilitate a) instrumenting and compiling code for a target machine (that you may have), with a C/C++ cross-compiler (that you may be using), b) running the tests at the target machine context, c) capturing the coverage data to the host, d) converting the coverage data to normal CTC++/host toolchain form at the host, and use normal CTC++/host utilities to generate coverage reports.
HOTA and Bitcov are, in a way, alternative arrangements to collect coverage data from the instrumented target executable. Bitcov is meant to be used in very small targets (little RAM), and it records the execution information in one bit (vs. in host and HOTA arrangements the execution information is in 32-bit counters). Otherwise Bitcov is based on HOTA design.
As separately licensed addon packages, there are still adaptation packages for C# and Java. These addon packages are also based on HOTA design, as if the target C# or Java programs were yet-another-special targets. And in the instrumentation phase some C#/Java language specialities (as compared to C/C++) are taken care of.
Most of this guide discusses CTC++ host-only.
2

However, in the case of CTC++ use for embedded targets (HOTA style), the information of this guide is valid what comes how the code is instrumented and how the coverage reports are generated at the host machine. There are some special steps to be taken when the instrumented code is run at the target and how the coverage data is captured back to the host. HOTA is discussed in the chapter 13 - Host-Target Testing.
Use of CTC++ for embedded targets with Bitcov-style is basically similar to HOTA-style in code instrumentation phase. The difference comes when the coverage data is captured to the host after a test run. In Bitcov the coverage data (a global bit vector having the recorded execution hits) can be captured to host e.g. by a debugger. The detailed Bitcov usage instructions are described in the documentation of the Bitcov package itself.
The Windows host environment is somewhat specific to CTC++. There are many compilers in use, like Visual C++, Borland C++ or gcc/g++ (e.g. from Cygwin or MinGW). In command-line mode, CTC++ can be used with all these compilers. Basically, this User’s Guide describes that level of usage, which is the same that CTC++ supports on Unixes.
In addition, there are also the following add-on components in the CTC++/Windows delivery package:
• CTC++/Visual Studio Integration Kit: this facilitates CTC++ usage directly from Visual Studio IDE.
• CTC++/Eclipse Integration: this facilitates CTC++ usage from Eclipse IDE.
This User’s Guide does not discuss the usage of the above add-on components. Instructions for their usage are given in the add-on components themselves through the on-line helps, and in other text documents in the add-on installation subdirectories.
The examples in this guide are taken from the Windows environment and the compiler is assumed to be Visual C++ (‘cl’ command for compile/link, ‘link’ command for separate link) and CTC++ is used in command-line mode. CTC++ usage on Unix platforms is effectively similar, only the compile/link command is different, it has different options, and the file naming is slightly different.
In Unix environments, there are also man pages, ctc(1), ctcpost(1), ctc2html(1), ctc2excel(1), ctc2dat(1), ctcwrap(1) and ctcxmlmerge(1). In Windows environment, there are textualized versions of the manual pages in the DOC subdirectory of the CTC++ installation directory.
This guide is organized as follows:
3
• Chapter "2 - Introducing CTC++” describes the properties and purpose of CTC++.
• Chapter "3 - Installing CTC++" describes the overall arrangements of the installation and general hardware and software requirements for using CTC++.
• Chapter "4 - Tutorial Example" gives a complete example of the basic usage of CTC++.
• Chapter "5 - Using CTC++ Preprocessor" explains how the source files are instrumented and compiled/linked with CTC++ (the ctc utility).
• Chapter "6 - Test Runs with The Instrumented Program" explains how the test runs are carried out with the instrumented programs and how the collected execution counter data is stored to a datafile.
• Chapter "7 - Using CTC++ Postprocessor" explains how test coverage and other types of listings are produced and how the listings look (the ctcpost utility).
• Chapter "8 – Using ctcxmlmerge Utility" explains how coverage results of independently built and tested programs (e.g. different configurations of the program) can be summed up into one coverage report.
• Chapter "9 - Using ctc2html Utility" explains how a browsable HTML report is produced from an Execution Profile Listing (the ctc2html utility).
• Chapter "10 - Using ctc2excel Utility" describes how you can convert an Execution Profile Listing to an Excel input (TSV) file (the ctc2excel utility).
• Chapter "11 - CTC++ Instrumentation Modes" describes how the source files are instrumented with regard of what information will be collected at test time.
• Chapter "0 -
• Configuring CTC++" describes how you can configure CTC++ and adapt it into your operating environment and your usage conventions.
• Chapter "13 - Host-Target Testing" explains the concepts and usage of the CTC++/Host-Target add-on component.
• Chapter "14 - CTC++ Details" explains some details and advanced features as well as restrictions of CTC++.
• The error messages and instrumentation models are described in the appendices.
4

1.2 About This Version of CTC++
This CTC++ v8.0.1 is a bug fix version over v8.0. Several of the bugs relate to new C++11/C++14 features. This version contains also some smaller changes and enhancements. For details, please see the version.txt file.
1.3 About Previous Versions of CTC++
CTC++ has been initially developed in the companies Nokia Data Systems Oy / ICL Personal Systems Oy. The first CTC version was released in 1989. Yes, it didn’t have the "++" suffix, because that version supported only C. A C++ supporting version CTC++ v2.0 was released in 1991. The last version, which still came from ICL Personal Systems Oy, was CTC++ v3.0 in 1992.
At the end of 1993 Testwell took over the development of CTC++ and in spring 1993 the first Testwell branded version 3.1 was released. Along the years many versions have been released. You can read from version.txt file what they contained in detail. However listing here what versions have been released:
v3.1-v3.1.2 (1993-1994, 3 versions), v4.0-v4.3 (1995-1997, 9 versions). v5.0 from April 2000 was a major rewrite of the tool. v5.0-v5.0.10 (2000-2002, 13 versions), v6.0-v6.5.7 (2004-2010, 16 versions).
v7.0 from August 2011 was a major version upgrade. In it statement coverage and explicit MC/DC coverage measures were introduced, and some other enhancements. Along with CTC++ v7.0 the HOTA (v5.0), CTC4STD (v5.0) and CTCHRT (v2.0) add-on components were upgraded correspondingly.
v7.0.1 (October 2011) and v7.0.2 (February 2012) were primarily bug fix versions, although contained some enhancements, too.
CTC++ v7.1 (January 2013) upgraded the tool to the new C++11 standard level: lambda functions, range-for statement, trailing return type, etc. Also other enhancements and bug fixes.
CTC++ v7.1.1 (April 2013) and CTC++ v7.1.2 (May 2013) were primarily bug fix versions.
CTC++ v7.2 (March 2014) introduced test case concept to CTC++. The ctcxmlmerge utility was introduced (replacing the old ctcmerge utility). Also other enhancements and bug fixes.
5

CTC++ v7.3 (August 2014) extended multicondition coverage instrumentation to assignment statements of the form “var = boolean_expressions_having_&&_||;”. Also some improvements in the ctc2html and ctcxmlmerge utilities.
CTC++ v7.3.1 (October 2014) contained some bug fixes to the new v7.3 features and still some improvements in the ctc2html and ctcxmlmerge utilities.
CTC++ v7.3.3 (May 2015) was released on Windows platform only. Some of the v8.0 enhancements were already included in the v7.3.3
CTC++ v8.0 (November 2015) was a major version upgrade. The ctcpost utility was enhanced so that it could extract instrumented header files (and sum them if many same headers) and report them as own file entities, separate from the code files where the headers appeared. Redesigned the HTML coverage report look and feel. Introduced line coverage in the HTML report as background green/red color on the lines that were executed/not executed. Introduced annotations.
6
2. Introducing CTC++
2.1 About CTC++
Testwell CTC++, Test Coverage Analyzer for C/C++, is an instrumentation-based test (code) coverage and dynamic analysis tool for the C and C++ programming languages. CTC++ remarkably facilitates testing and tuning of software written in C or C++. Using the information provided by CTC++ it is easier to construct adequate test data and make the essential optimizations.
CTC++ helps in the program testing and tuning primarily by giving answers to the following two questions:
1. How thoroughly the program has been tested?
To characterize the effectiveness of test cases CTC++ presents the Test Effectiveness Ratio (TER). TER is a code coverage measure calculated for each function, source file and the whole program (instrumented part of it) under test. It is expressed as a percentage.
When a TER value below 100% is found, the places of low code coverage can be seen by examining for example the Execution Profile Listing written as a result of the test session(s). The information is shown using counters, which indicate how many times the statements of the code have been executed, how many times the decisions have been evaluated to true and false and how many times each sub-condition combination has been evaluated. Counters with zero value are highlighted in the listing. Those places should be studied further. The reason why some parts of the program have not been executed is normally insufficient test data, but the reason may also be an algorithmic error or dead code.
Often the coverage is reviewed in HTML form. In that representation CTC++ shows, besides the basic structural coverage information (how many times each program control branch has been taken), also line coverage. The code lines that are executed/are not executed have green/red color-coding in the HTML report.
2. Where are the bottlenecks of the program?
7
When CTC++ is used for searching for the execution bottlenecks, the execution counters help in finding them. In addition, and if instrumentation has been done correspondingly, function execution costs are provided. By default, CTC++ is configured to measure execution time. The standard library function clock() is used as a cost function. Provided that there are some other cost functions (CPU-time, number of page faults, number of I/O operations, etc.) available to you, you can easily change the cost function to some environment dependent function.
Besides the two above purposes, CTC++ may be useful in analyzing the program’s dynamic control flow (instrumenting for function call tracing).
CTC++ can be used when you have an executable program and you want to measure the code coverage or just analyze the dynamic behavior of some parts of your program.
CTC++ usage begins with instrumenting some selected C or C++ source file(s) of your program. The instrumentation is integrated into the compilation and linkage phases. If you would normally build your program something like the following
cl -c file1.c cl -c file2.c cl -c file3.c cl -Feprog.exe file1.obj file2.obj file3.obj
you do the instrumentation with "ctc-compile" and "ctc-link" instead, something like the following
ctc -i m -v cl -c file1.c ctc -i m -v cl -c file2.c ctc -i m -v cl -c file3.c ctc -v cl -Feprog.exe file1.obj file2.obj file3.obj
The same result could be obtained also by the following, where the 'cl' command compiles many files and finally links them
ctc -i m -v cl -Feprog.exe file1.c file2.c file3.c
The C/C++ source files on the command line are instrumented and compiled resulting in instrumented object files (overwriting the previous non-instrumented ones). If the command also links, the CTC++ run-time library is added to the linkage. Instrumentation means adding some additional statements, called probes, into the source file (but keeping the original source file intact) in some places that are relevant from code coverage measuring point of view.
The instrumentation process produces also a symbolfile (default is MON.sym in the current directory). In it CTC++ maintains descriptions of the instrumented files.
8
When the instrumented program runs, the inserted probes collect various counters of the execution in main memory. When the instrumented program ends, the execution counters are saved to a datafile (default is MON.dat1 in the same directory as MON.sym). The datafile contains the counters of the instrumented files that were executed during the program run. If the datafile already exists, and contains counters of the program's previous test run, the collected counters are added to the previous counters in the datafile. CTC++ checks that the previous counters originate from the same instrumentation of the source file, but if not, the old/obsolete counters of the source file are overwritten.
In an instrumented program there may be some files as instrumented and others as non-instrumented, in a mixture as you wish. For a single instrumented file you have means to determine if some functions should be left uninstrumented. Also you have means to control, if the code coming from included files (e.g. from some of your header files) is instrumented or not.
The instrumented program behaves functionally in the same way as the original non-instrumented program, except a small overhead (size and speed) that the instrumentation has introduced.
After test runs with the instrumented program have been done the human readable results of the tests are obtained by CTC++ Postprocessor (ctcpost) utility. Input to ctcpost is one or more symbolfiles and one or more datafiles. ctcpost looks what source files they contain (descriptions and execution counters), merges the information, and writes a textual report file as you have asked for. The primary report is Execution Profile Listing. It shows, in terms of each source file, how the files have been exercised and highlights the points that have not been exercised.
The textual Execution Profile Listing can further be converted to HTML format with the ctc2html utility. The resultant CTC++ Coverage Report can be browsed with any commonly used web browser. The report shows the code coverage at summary and detail level and the untested code portions are easily revealed. By default the original source files (their HTML'ized copies) become also part of the browsable HTML report. The report can be generated also without the original source files, which means that the detailed source code description is generated based solely on the information collected into the symbolfile at instrumentation time.
The Execution Profile Listing can be converted to Excel input file format by ctc2excel utility. ctcpost can write the coverage report also in XML format, which gives you possibilities to make your special analysis of the coverage data and helps you to make your own CTC++ integrations.
1 If test cases (concept introduced in CTC++ v7.2) are used, the datafile name is MONtestcasename.dat
9
The use of CTC++ makes testing an efficient, measurable, systematic, and visible activity. Moreover, the increased productivity obviously contributes to the satisfaction of the tester.
2.2 About Code Coverage in CTC++
Code coverage is a measure on how thoroughly the program code has been exercised in the tests. Technically in CTC++ (in CTC++ Preprocessor, ctc) there are three instrumentation modes for code coverage: function coverage (-i f), decision coverage (-i d) and multicondition coverage (-i m). However, in overall, partly by CTC++ Postprocessor (ctcpost) means, CTC++ gives the following coverage measures: function coverage, decision coverage, condition coverage, MC/DC coverage, multicondition coverage and a somewhat distinct statement coverage.
In HTML report there is still line coverage in the form of color-coding the source code lines that have/have not been executed.
In CTC++ coverage reports there are two TER% (Test Effectiveness Ratio) values. The primary and more important TER is of one of function, decision, condition, MC/DC or multicondition coverage. The second TER is of statement coverage. For line coverage there is no separate TER.
Function coverage: This measure tells if a function has been called (and how many times), or has it been called at all. This is the most lightweight instrumentation considering the overhead to the program execution.
But as there is no analysis how the function’s internal program flow has been exercised, this is a rather weak measure. This however gives some rough idea of the thoroughness of the testing in a compact form. Note that by ctcpost means you can obtain function coverage view of the report even if your code has been instrumented for higher code coverage measure (-i d or -i m).
Decision coverage: This measure includes function coverage and additionally it reveals what parts of the function have been executed/not executed. There is instrumentation for true/false evaluation on condition expressions in if, for, while, do-while and ternary-?: statements, in case blocks of a switch statement, in C++ try statements and in their catch blocks, in unconditional control transfers (goto, return, throw, break, continue).
If some of those program parts have not been executed at all, it is highlighted in the reports as shortage in the code coverage. By ctcpost means you can obtain decision coverage view of the report even if your code has been instrumented for higher multicondition code coverage measure (-i m).
10
Multicondition coverage: This measure is like decision coverage, the only difference is in condition expressions in if, for, while, do-while control statements, when they contain && or || operators. Consider the following code snippet:
if ((a || b) && (c || d)) { ...
In C/C++ there are 7 evaluation alternatives on the above condition expression. For decision coverage it suffices that in overall the condition expression is evaluated to true and false. For multicondition coverage it is required that also each evaluation alternative is executed at least once.
In TER calculus CTC++ sees here 9 “must points” that need to be met (overall decision true and false + each of the 7 evaluation alternatives executed at least once).
Multicondition instrumentation is done also in assignment statement, if the expression to be assigned is a boolean expression containing && or || operators, for example:
x = (a || b) && (c || d);
Multicondition coverage is in complex condition expression cases a demanding criterion. However, rationale on it could be: if the programmer has written some specific &&, ||, (), ! combination, and thought that it is needed for program’s correct behavior, there should be a test case for each evaluation combination to verify the program logic.
Condition coverage: This coverage measure is possible when the code has been instrumented for multicondition coverage. It is a ctcpost option (-fc) by which this coverage report is obtained. Consider again the code snippets:
if ((a || b) && (c || d)) { ... x = (a || b) && (c || d);
Condition coverage is met when the overall condition expression has been evaluated to true and false and each elementary condition, here a, b, c, d, have also been evaluated to true and false.
In TER calculus CTC++ sees here 10 “must points” that need to be met (overall decision true and false + each of the 4 elementary conditions true and false).
Meeting condition coverage is not so demanding than meeting multicondition coverage.
MC/DC coverage (modified condition/decision coverage): This coverage measure is possible when the code has been instrumented for multicondition coverage. It is a
11

ctcpost option (-fmcdc) by which this coverage report is obtained. Consider again the code snippets:
if ((a || b) && (c || d)) { ... x = (a || b) && (c || d);
MC/DC coverage is met when the overall condition expression has been evaluated to true and false and each elementary condition, here a, b, c, d, are shown to independently determine the overall condition expression to be true and false. The “independently determines” means that there is at least one evaluation pair, in which when only the given elementary condition evaluation change from true to false causes the overall condition expression result to change, and when all the other elementary conditions evaluate to the same (or are not not evaluated at all due to short-circuit rule). In more complex than trivial cases there can be many evaluation pairs, which can demonstrate the MC/DC property on an elementary condition, but execution of one pair suffices.
In TER calculus CTC++ sees here 6 “must points” (overall decision true and false + on each of the 4 elementary conditions an evaluation pair to demonstrate that their MC/DC property is met).
Meeting MC/DC coverage is not so demanding that meeting multicondition coverage, but more demanding than meeting condition coverage.
Statement coverage: There is no instrumentation mode (and no run-time overhead) for obtaining statement coverage. When the code is instrumented at least for decision coverage the ctcpost tool makes flow analysis on what parts of the function have been executed and maps it to number of statements that the code portions contained.
CTC++ calculates statements inside functions only. Each ‘;’ is counted as one statement. Additionally control statements, which can be written without ‘;’ (like if) are counted as one statement. Empty compound statement, i.e. ‘{}’, is counted as one statement.
Statement coverage is reported as percentage per functions, per files and per overall. The untested statement blocks can be concluded from the decision (or higher) coverage counters.
Statement coverage cannot be reported when the code is instrumented for function coverage only.
Line coverage: Like statement coverage there is no instrumentation mode for line coverage, and similarly it can only be reported when the code has been instrumented at least for decision coverage. Line coverage is “implemented” in ctc2html phase when constructing the HTML’ized version of the source code. The execution flow
12

analysis (done at ctcpost time) information is used to determine with what color the source code should be painted to indicate whether it was executed or not.
For clarity, a remark of the differences of ‘structural coverage’, ‘statement coverage and ‘line coverage’. Structural coverage (e.g. decision coverage) is a measure relating how thoroughly the control structure branches in the program have been executed. Statements are syntactical entities in a programming language. On one source code line there can be many statements, and one statement can reside on many code lines. Consider the following example, with line numbers added:
1 int foo(int i) { 2 if (i == 5) { 3 stm2; stm3; stm4; stm5; 4 stm6; stm7; stm8; stm9; j = 1; 5 } else { 6 stm11; j = 0; 7 } 8 stm13; 9 return j; 10 }
Assume foo() is called, but never with argument value 5. E.g. in decision coverage sense CTC++ gives 75% TER% on foo() (3/4): ‘foo’ entered, ‘if’ was always executed to false, never to true, ‘return’ executed.
In statement coverage sense CTC++ sees here 14 statements. 5 of them were executed (‘if’ entered, ‘stm11’, ‘j = 0;’, ‘stm13’, ‘return j;’), which gives 36% (5/14) statement coverage TER%.
In line coverage sense CTC++ reports (in HTML) in green the following lines 1, 2, 5, 6, (plain ‘{‘ or ‘}’ on a line does not get color-coding), 8 and 9 as executed. Lines 3 and 4 are reported in red, because they were not executed.
The supported code coverages are described in more detail in the chapter "11 - CTC++ Instrumentation Modes".
2.3 About Dynamic Analysis in CTC++
The examination of the run-time behavior of a program is called dynamic analysis. When measuring code coverage, CTC++ shows how many times each measurement point was executed, vs. not only the information “was executed” / “was not executed”. These execution counters already give a reasonable picture of the program behavior.
Additionally, CTC++ supports dynamic analysis through timing instrumentation. It measures how many times each function in the instrumented file was called and what
13

was the total, average and maximum (or “worst”) execution time of the function. This information can be used for finding program execution bottlenecks and for code optimizing.
Actually what is measured here need not be “execution time”. It can be more generally “execution cost”. It is a measurable amount of some resource that the function execution consumes. By default, CTC++ is configured to use clock() from <time.h>, i.e. to measure execution time, as the function by which the function resource consumption is measured. You can advise CTC++ to use some other function (and provide its implementation file to the linkage) for measuring something else, for example, CPU time or number of I/O operations.
When you select timing instrumentation, you also need to select whether the time measuring is inclusive or exclusive. Inclusive timing means that the time spent in the called functions is counted also to the time of the caller function. Exclusive timing means that the time spent in the called instrumented functions is counted away from the time of the caller function.
It should, however, be kept in mind that in the first place CTC++ is a code coverage tool. Execution time measurements produced by CTC++ are rough estimates that can be used for finding the program bottlenecks but they are not recommended for measuring actual and exact performance. At least, you should measure in your environment what overhead the timing instrumentation brings in your environment. Calling operating system service clock() may be a costly operation, if done in a tight loop of your program.
The timing instrumentation issues are described in more detail in the chapter "11 - CTC++ Instrumentation Modes".
CTC++ supports program dynamic analysis also by a function call trace. You can adjust CTC++’s instrumentation so that whenever a function is called and when it exits, a trace function (which you can specify) is also called. In the trace function you can display the name of the function to the screen, or do whatever recording you find useful to analyze the dynamic program call flow.
The procedure to instrument for function call tracing is described in the tracer.txt file in the doc subdirectory of CTC++ installation directory.
14
3. Installing CTC++
3.1 General Hardware and Software Requirements
In any environment where CTC++ is available, it should set no more hardware or software requirements than you have already satisfied in your normal C/C++ development environment. The disk space taken by the CTC++ installation is about 6-9 MB depending on the platform.
One specific CTC++ delivery package is specific to one host machine architecture and operating system (or to a set of operating systems, like Windows 10/8/7/Vista/XP/2000/NT, which are “similar enough” from CTC++’s perspective) and to C/C++ compilers running in the operating system (like in Sun/Solaris there might be Sun C/C++ (cc, CC), GNU C/C++ (gcc, g++), or any other compatible C/C++ compiler, that are “valid” from CTC++’s perspective, and generate code on the host machine architecture).
Note: compatibility to Windows 98/95 is no more guaranteed. Newer CTC++ versions may use such Windows features that may not be supported in those old Windows versions.
CTC++ can be used with some specific compiler, if, firstly, the compilation command and its options are “made known” to CTC++. CTC++ looks its known compilers in its configuration file, see the section 12.1- Configuration file. In the platform specific delivery package, there are already some commonly used compilers of the platform “taught” to CTC++. If "ctc-builds" with the new compiler will be done using the 'ctcwrap' command, the new compiler must be made known to it in a certain way. See section 5.15.1- ctcwrap Utility for more. Secondly, the CTC++ run-time library needs to be link-compatible with the used compiler. The CTC++ run-time library is effectively C. Thus, there are good chances that it is link-compatible with a number of compilers and their versions on the platform.
There is platform-specific additional documentation in the README.TXT file. It describes the compatibility issues of the delivery package in more detail and the special usage instructions at the platform.
15

3.2 Installation Procedure
The detailed machine specific installation procedure is described in separate documentation, usually in the form of INSTALL.TXT or README.TXT file, which comes on the delivery media.
On Windows platform, the installation program brings also some add-on components to your machine. They are Microsoft Visual Studio (various versions) IDE integration kits and an Eclipse integration kit. These integration kits need certain additional user-specific installation step for getting CTC++ usable in the corresponding build system. When you take these add-on components into use, you will find the additional installation instructions from the readme.txt file from the corresponding add-on subfolder.
The “CTC++ Host-Target add-on” (HOTA), “CTC++ Bitcov add-on“ (Bitcov), “CTC++ C# add-on” and “CTC++ Java add-on” packages are technically separate delivery packages. Their installation is roughly just copying some more files to the basic CTC++ installation directory. These add-on packages have their own installation instructions (in their readme.txt or similar).
3.3 General CTC++ Software Structure after Installation
On Windows, CTC++ is installed to some user-selected directory, by default to C:\Testwell\CTC. This directory is added to PATH and the environment variable CTCHOME is set to point to it. All CTC++ files come to the installation directory. Administration rights are needed for running the installation program.
At Unixes, CTC++ is installed to some user-selected root directory, $prefix, e.g. /opt/Testwell/CTC, and all CTC++ files come into its subdirectories: $prefix/bin (executables, needs to be in PATH), $prefix/lib (run-time libraries), $prefix/include (ctc.h file), $prefix/man (man pages, needs to be in MANPATH) and $prefix/lib/ctc (other CTC++ files, CTCHOME needs to specify this directory). If installation is made to /usr/local or to the user's HOME directory ~, it is not needed to set CTCHOME and PATH and MANPATH may already be in place. Depending on the installation directory, administration rights may be needed for running the installation script.
Once CTC++ has been installed, its files cannot “just like that” be copied to another location (especially in Unixes). This is because the installation program edits into the ctc.ini configuration file where from the CTC++ machinery expects to find certain files.
Considering a default installation at Windows, there will be the following files in the directory “C:\Testwell\CTC”:
16
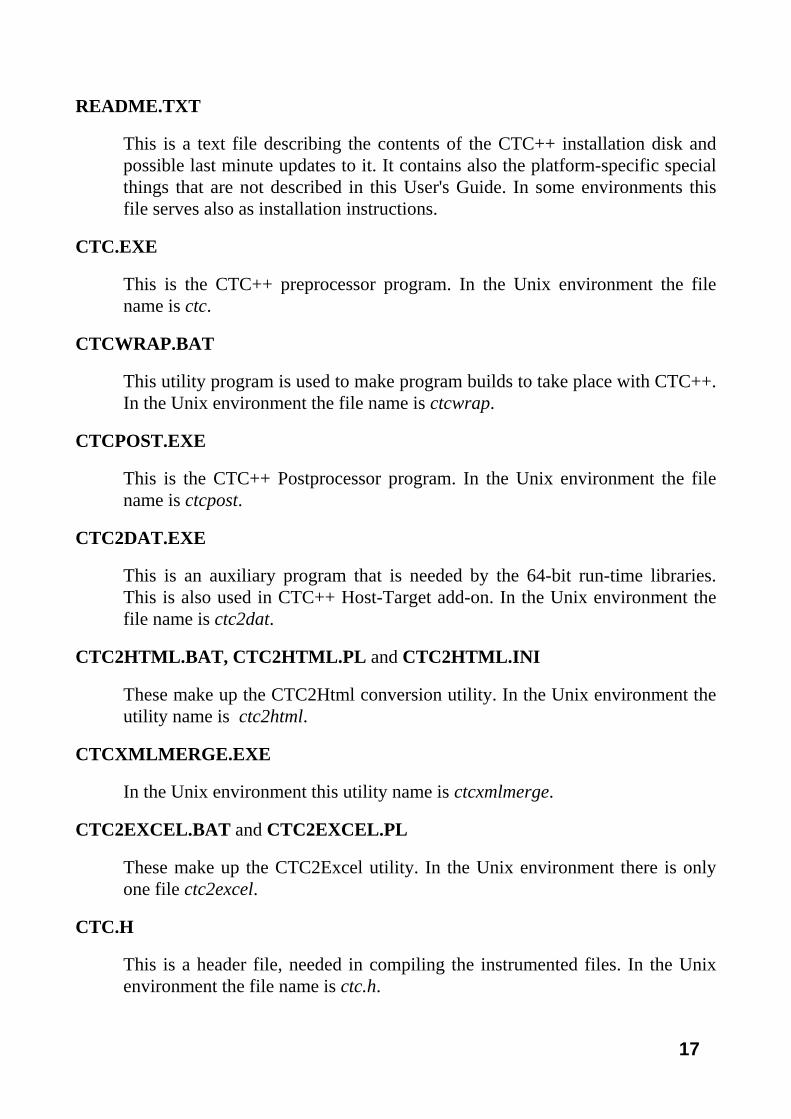
README.TXT
This is a text file describing the contents of the CTC++ installation disk and possible last minute updates to it. It contains also the platform-specific special things that are not described in this User's Guide. In some environments this file serves also as installation instructions.
CTC.EXE
This is the CTC++ preprocessor program. In the Unix environment the file name is ctc.
CTCWRAP.BAT
This utility program is used to make program builds to take place with CTC++. In the Unix environment the file name is ctcwrap.
CTCPOST.EXE
This is the CTC++ Postprocessor program. In the Unix environment the file name is ctcpost.
CTC2DAT.EXE
This is an auxiliary program that is needed by the 64-bit run-time libraries. This is also used in CTC++ Host-Target add-on. In the Unix environment the file name is ctc2dat.
CTC2HTML.BAT, CTC2HTML.PL and CTC2HTML.INI
These make up the CTC2Html conversion utility. In the Unix environment the utility name is ctc2html.
CTCXMLMERGE.EXE
In the Unix environment this utility name is ctcxmlmerge.
CTC2EXCEL.BAT and CTC2EXCEL.PL
These make up the CTC2Excel utility. In the Unix environment there is only one file ctc2excel.
CTC.H
This is a header file, needed in compiling the instrumented files. In the Unix environment the file name is ctc.h.
17

CTC.INI
This is the default CTC++ configuration file. It is read by ctc, by the instrumented programs, by ctcpost, and by ctc2dat. This file can be modified with any text editor to adapt CTC++ in your environment. Before its modification you are strongly recommended to make a backup copy. For detailed description of the configuration files and their usage, see the chapter "0 -
Configuring CTC++". In the Unix environment the name of this file is ctc.ini. For learning how this file is located by the various CTC++ system tool components, see the section "12.2 - Configuration File Finding".
WRAPCMDS.TXT
This is an auxiliary file listing the compiler and linker commands with which the ctcwrap utility has to cope with. In Unix environments, there is a subdirectory CTCHOME/wrap, which has a similar listing in the form of soft links.
LIB (directory)
If your distribution has a subdirectory LIB, it contains the CTC++ run-time support library variant(s) specific to your compiler environment(s). In Unix environments there are normally two library variants: libctc.a (used when instrumenting 32-bit code) and libctc64.a (used when instrumenting 64-bit code).
See the README.TXT file for information about what library variants are provided, how they have been created (relevant compile/linkage options) and what C/C++ compiler version they can be used with.
EXAMPLES (directory)
This subdirectory contains some examples how CTC++ can be used in the environment the delivery is meant for.
VERSION.TXT
This file contains version change history of CTC++.
DOC (directory)
This subdirectory contains the CTC++ User’s Guide in PDF format (ctcug.pdf) and some additional textual documentary files.
18

On Unix platforms the man-pages of the CTC++ utilities (ctc, ctcpost, etc.) are copied to installationdirectory/man/man1 (default location).
(Note that you can get a short command line help of the utilities by invoking it just by -h option.)
PERL (directory)
On Windows this subdirectory contains a Perl interpreter (a subset). CTC++ uses Perl in many of its tool components. In Unix environments, Perl is assumed to be available already and is not delivered.
VS_INTEG (directory)
On Windows platform, the CTC++/Visual Studio Integration Kit components reside here.
ECLIPSE (directory)
On Windows platform, the CTC++/Eclipse integration components reside here.
Additionally there can be other files that are internally used by the CTC++ system.
19
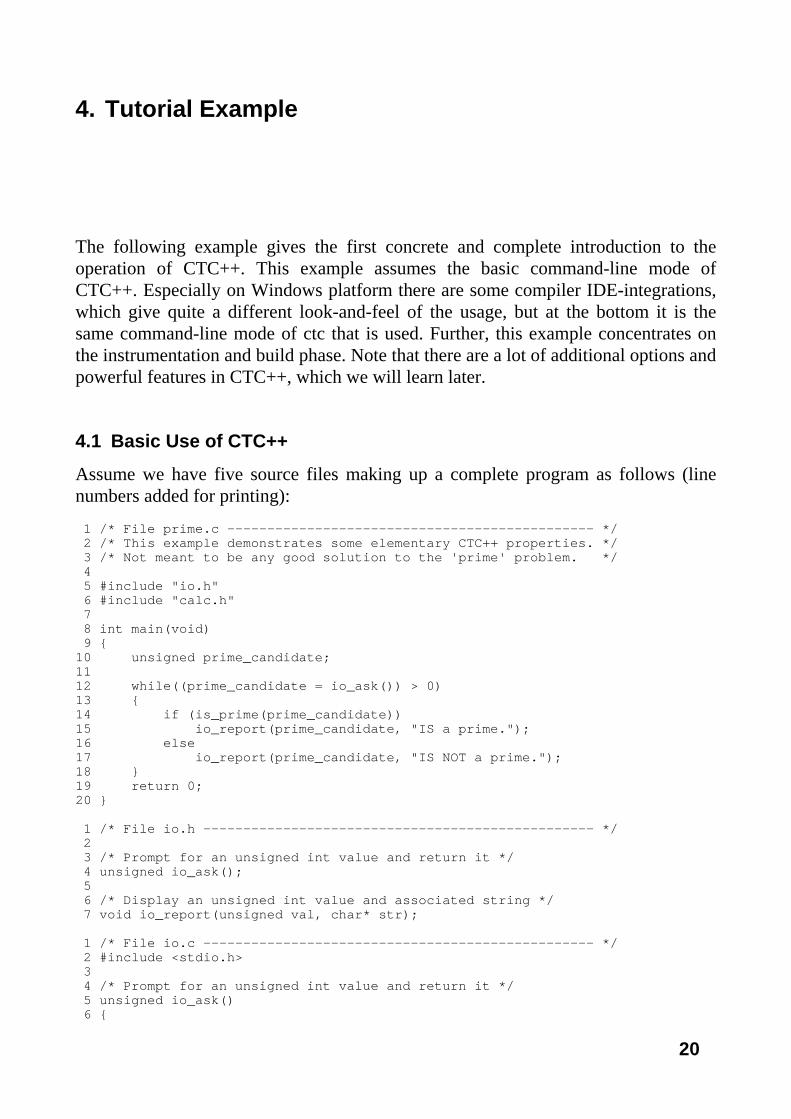
4. Tutorial Example
The following example gives the first concrete and complete introduction to the operation of CTC++. This example assumes the basic command-line mode of CTC++. Especially on Windows platform there are some compiler IDE-integrations, which give quite a different look-and-feel of the usage, but at the bottom it is the same command-line mode of ctc that is used. Further, this example concentrates on the instrumentation and build phase. Note that there are a lot of additional options and powerful features in CTC++, which we will learn later.
4.1 Basic Use of CTC++
Assume we have five source files making up a complete program as follows (line numbers added for printing):
1 /* File prime.c ---------------------------------------------- */ 2 /* This example demonstrates some elementary CTC++ properties. */ 3 /* Not meant to be any good solution to the 'prime' problem. */ 4 5 #include "io.h" 6 #include "calc.h" 7 8 int main(void) 9 { 10 unsigned prime_candidate; 11 12 while((prime_candidate = io_ask()) > 0) 13 { 14 if (is_prime(prime_candidate)) 15 io_report(prime_candidate, "IS a prime."); 16 else 17 io_report(prime_candidate, "IS NOT a prime."); 18 } 19 return 0; 20 } 1 /* File io.h ------------------------------------------------- */ 2 3 /* Prompt for an unsigned int value and return it */ 4 unsigned io_ask(); 5 6 /* Display an unsigned int value and associated string */ 7 void io_report(unsigned val, char* str); 1 /* File io.c ------------------------------------------------- */ 2 #include <stdio.h> 3 4 /* Prompt for an unsigned int value and return it */ 5 unsigned io_ask() 6 {
20

7 unsigned val; 8 int amount; 9 10 printf("Enter a number (0 for stop program): "); 11 if ((amount = scanf("%u", &val)) <= 0) { 12 val = 0; /* on 'non sense' input force 0 */ 13 } 14 return val; 15 } 16 17 /* Display an unsigned int value and associated string */ 18 void io_report(unsigned val, char* str) 19 { 20 printf("%u %s\n\n", val, str); 21 } 1 /* File calc.h ----------------------------------------------- */ 2 3 /* Tell if the argument is a prime (ret 0) or not (ret 1) */ 4 int is_prime(unsigned val); 1 /* File calc.c ----------------------------------------------- */ 2 3 /* Tell if the argument is a prime (ret 1) or not (ret 0) */ 4 int is_prime(unsigned val) 5 { 6 unsigned divisor; 7 8 if (val == 1 || val == 2 || val == 3) 9 return 1; 10 if (val % 2 == 0) 11 return 0; 12 for (divisor = 3; divisor < val / 2; divisor += 2) 13 { 14 if (val % divisor == 0) 15 return 0; 16 } 17 return 1; 18 }
The files of this program should be found also from the examples directory of the CTC++ delivery package. This program can be compiled and linked in many ways, one way being the following
cl –Feprime.exe prime.c io.c calc.c
which results in the prime.exe program. When it runs, it repeatedly prompts for int values and tells if the value is a prime or not. Finally, when input 0 is given, the program ends.
Now, we wish to apply CTC++ on our program, that is, we want to measure the files prime.c, io.c and calc.c and find out how thoroughly they were exercised in our test runs.
First we need to instrument the files we wish to measure. Assume we wish to measure multicondition coverage. This can be done as follows:
21

ctc -i m cl –Feprime.exe prime.c io.c calc.c
As a result we get the instrumented prime.exe program. Here 'ctc' is the CTC++ Preprocessor utility, which makes the instrumentation on the given C and C++ source files and drives compiling/linking of the new instrumented target. The '-i m' command-line options to ctc mean "instrument for multicondition".
When a file is compiled, its instrumentation means that ctc takes a temporary copy of the source file and adds there little additional code, often called as probes, and then compiles the file. The original source file remains intact, the object file gets replaced with instrumented version of the file. At linking phase ctc adds its run-time library to the linkage, because instrumented object files need it. The linking result is instrumented program, which replaces the original program.
Moreover, when ctc instruments source files, it maintains descriptions what the files contain (what interesting code there is to ctc, on what lines, etc.). This file is called symbolfile, and when it is not specified (like here) it will be MON.sym in current directory. Had this file existed already, it would just have been updated.
All right, now prime.exe is the instrumented version of the program. Let's do one test run on it as follows:
prime Enter a number (0 for stop program): 2 2 IS a prime. Enter a number (0 for stop program): 5 5 IS a prime. Enter a number (0 for stop program): 20 20 IS NOT a prime. Enter a number (0 for stop program): 0
After this first test run we notice that the file MON.dat has born in the current directory (same directory as the symbolfile MON.sym was created to). It is a datafile, containing the collected execution counters when the code in the instrumented files was executed. Had this file existed already, it would just have been updated.
Now we wish to see the results of our test, i.e. what parts of the program the above run has executed. We use the CTC++ Postprocessor utility as follows:
ctcpost MON.sym MON.dat -p profile.txt
What we are asking here is that ctcpost takes the symbolfile MON.sym and the datafile MON.dat as input and produces an Execution Profile Listing to the file
22

profile.txt. Had the file profile.txt existed already, it would have been overwritten. The resultant profile.txt file looks as follows:
***************************************************************************** * CTC++, Test Coverage Analyzer for C/C++, Version 8.0 * * * * EXECUTION PROFILE LISTING * * * * Copyright (c) 1993-2013 Testwell Oy * * Copyright (c) 2013-2015 Verifysoft Technology GmbH * ***************************************************************************** Symbol file(s) used : MON.sym (Tue Nov 17 08:13:14 2015) Data file(s) used : MON.dat (Tue Nov 17 08:13:44 2015) Listing produced at : Tue Nov 17 08:14:16 2015 Coverage view : As instrumented MONITORED SOURCE FILE : prime.c INSTRUMENTATION MODE : multicondition HITS/TRUE FALSE LINE DESCRIPTION ============================================================================= 1 8 FUNCTION main() 3 1 12 while (( prime_candidate = io_ask ( ) ) > 0) 2 1 14 if (is_prime ( prime_candidate )) 15 }+ 16 else 17 }+ 18 }+ 1 19 return 0 20 } ***TER 100 % ( 6/ 6) of FUNCTION main() 100 % ( 6/ 6) statement ----------------------------------------------------------------------------- ***TER 100 % ( 6/ 6) of FILE prime.c 100 % ( 6/ 6) statement ----------------------------------------------------------------------------- MONITORED SOURCE FILE : io.c INSTRUMENTATION MODE : multicondition HITS/TRUE FALSE LINE DESCRIPTION ============================================================================= 4 5 FUNCTION io_ask() 0 4 - 11 if (( amount = scanf ( "%u" , & val ) ) <= 0) 13 }+ 4 14 return val 15 } ***TER 75 % ( 3/ 4) of FUNCTION io_ask() 83 % ( 5/ 6) statement -----------------------------------------------------------------------------
23
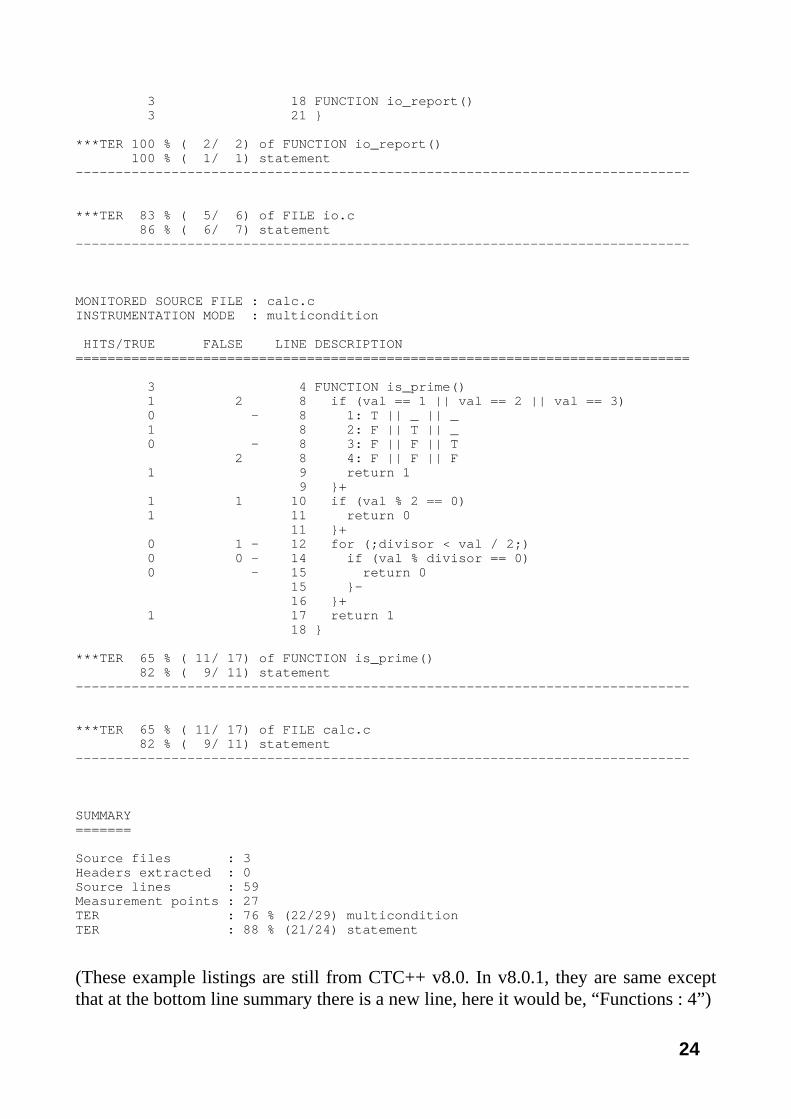
3 18 FUNCTION io_report() 3 21 } ***TER 100 % ( 2/ 2) of FUNCTION io_report() 100 % ( 1/ 1) statement ----------------------------------------------------------------------------- ***TER 83 % ( 5/ 6) of FILE io.c 86 % ( 6/ 7) statement ----------------------------------------------------------------------------- MONITORED SOURCE FILE : calc.c INSTRUMENTATION MODE : multicondition HITS/TRUE FALSE LINE DESCRIPTION ============================================================================= 3 4 FUNCTION is_prime() 1 2 8 if (val == 1 || val == 2 || val == 3) 0 - 8 1: T || _ || _ 1 8 2: F || T || _ 0 - 8 3: F || F || T 2 8 4: F || F || F 1 9 return 1 9 }+ 1 1 10 if (val % 2 == 0) 1 11 return 0 11 }+ 0 1 - 12 for (;divisor < val / 2;) 0 0 - 14 if (val % divisor == 0) 0 - 15 return 0 15 }- 16 }+ 1 17 return 1 18 } ***TER 65 % ( 11/ 17) of FUNCTION is_prime() 82 % ( 9/ 11) statement ----------------------------------------------------------------------------- ***TER 65 % ( 11/ 17) of FILE calc.c 82 % ( 9/ 11) statement ----------------------------------------------------------------------------- SUMMARY ======= Source files : 3 Headers extracted : 0 Source lines : 59 Measurement points : 27 TER : 76 % (22/29) multicondition TER : 88 % (21/24) statement
(These example listings are still from CTC++ v8.0. In v8.0.1, they are same except that at the bottom line summary there is a new line, here it would be, “Functions : 4”)
24

From the above execution profile listing file we can read quite a lot of information on how the code was exercised during the test run.
For example, we can see that in the file calc.c there is the function is_prime on line 4. That function was called 3 times.
The conditional expression on line 8 in file calc.c has been executed in both ways (once true, twice false). Because we instrumented the source for multicondition coverage (remember the option "-i m" on the ctc command line), there is a closer analysis on how that non-trivial decision was evaluated. We can see that the second combination "false || true || _", where '_' means "not evaluated", had determined the overall decision once to true. The fourth combination "false || false || false" had determined the overall decision to false on the two remaining cases. On combinations "true || _ || _" (first) and "false || false || true" (third) there is '-' mark, meaning that these combinations never determined the overall decision outcome. In other words the conditions "val == 1" and "val == 3" were never true. If this were acceptable testing, these conditions could equally well have been omitted from the program as they did not decide anything.
So, from the perspective of thorough testing the test input values 1 and 3 should be added so that the code of the is_prime function would be better tested. Later in the function there are more '-' markings, where we should derive the remaining test cases for 100% thorough testing when wanting this (multicondition) coverage criteria.
CTC++ shows the test thoroughness as TER, Test Effectiveness Ratio. It is a ratio: number of places that did get a hit / number of places that should have got a hit when considering thorough testing. The hit places are the ones where CTC++ had inserted a measuring probe and "hit" is its execution. Where CTC++ inserts probes in various instrumenting modes is described in the chapter "11 - CTC++ Instrumentation Modes".
In CTC++ v7.0 another TER, statement coverage TER, was introduced. It is calculated on functions, and then summed up on files and to overall summary levels. Look at the real source code of function is_prime() in file calc.c. ctc calculates that the there are 11 statements in that function (7 ‘;’ + 3 ‘if’ + 1 ‘for’). Then based on the control flow analysis, ctc can report that 9 of the 11 statements were executed.
In CTC++ v7.3.3/v8.0 line coverage was instroduced. Here it shows as some “}+” and “}-“ lines. They carry information if at test time program control had entered to the code following the “then-part”, “else-part”, “loop-body”, etc. This “control has been entered here” information is needed for the later ctc2html phase when it figures out proper line color painting to the HTML report.
25

With ctcpost we can get the following listing types, containing execution data: Execution Profile Listing, Untested Listing, Timing Listing (the timing listing is practically empty, because we did not instrument the code for timing), and XML Listing. For example
ctcpost MON.sym MON.dat -p profile.txt ctcpost MON.sym MON.dat -u untested.txt ctcpost MON.sym MON.dat -t timing.txt ctcpost MON.sym MON.dat -x xmlreport.xml
Now we could continue the testing and run the instrumented prime.exe program again and give the new test cases (here inputs 1, 3 and some other to the program), which we concluded from the execution profile listing. When the new test run ends, the MON.dat file is updated automatically. Then taking the execution profile listing we should see some increase in the gained coverage.
CTC++ still contains a feature, which facilitates the browsing of the information in the execution profile listing and the pertinent source files in a more convenient HTML-browsable format. The utility to be used is ctc2html, invoked as follows:
ctc2html -i profile.txt
ctc2html takes as input the execution profile listing (here, -i profile.txt), parses it, creates the subdirectory CTCHTML in the working directory and writes a couple of HTML files to that directory. Also the source files are copied there and converted to an HTML format.
We can then use any HTML-browser by starting the browsing from file .\CTCHTML\index.html. It starts "CTC Coverage Report - Files Summary" page. It contains TER summaries of the instrumented files (grouped by their directories). Clicking some file you come to “CTC++ Coverage Report – Execution Profile” on that file and can see the detailed source code mapped analysis of the structural coverage, statement coverage and line coverage information. Untested code is shown with appropriate color-coding.
The HTML page set contains also the following summary level pages: Overall (~the TER of the whole code base), Directory (~the TERs of the directories of the code files), Functions (~the TERs of the functions at their files at their directories). Finally there is Untested Code HTML page (~contains only the untested code locations).
See chapter "9 - Using ctc2html Utility" for a real example of the HTML-form CTC++ Coverage Report.
26

4.2 Tutorial Continued / Program Changes
Let us continue our little example. Assume we have to make some change to io.c file, perhaps a bug fix, and we wish to instrument the new io.c file and continue testing. Once io.c has been edited (and perhaps experimentally compiled for ensuring that it is syntactically correct -- CTC++ assumes that its input source files are correct C or C++ code) we can handle the case for example as follows:
ctc -i m cl /c io.c ctc cl prime.obj io.obj calc.obj
The first command line instruments and compiles the io.c file and leaves the result in the io.obj file. No linking takes place, because the '/c' options prevents it.
The second command line makes the linking. cl command is used as it can also be used for linking. On the command line there are no C or C++ source files and thus no instrumentation takes place there. However, there is one thing ctc does: it adds the CTC++ run-time library to the linking command that is finally executed. Here it is not necessary, but possible and having no effect, to give the "-i ..." option to ctc as there are no source files to be instrumented.
Then we do some additional testing with the new instrumented program:
prime ... some input
and finally get the coverage and profiling figures out, for example as follows:
ctcpost MON.sym MON.dat -p profile.txt
When we now look at the profile.txt execution profile listing, we notice that the counters for file io.c correspond only to the test run just executed. The counters for files prime.c and calc.c correspond cumulatively to all test runs. Because the code in io.c was changed and file reinstrumented its previous counters became obsolete and were left out (actually, here, overwritten in the file MON.dat).
4.3 Tutorial Continued / Separate Link Command
The compilation command is not always used for linking programs. Assume we would originally build our example program as follows:
27

cl /c *.c link /out:prime.exe *.obj
The first line compiles the prime.c, io.c and calc.c to .obj files and the second line links them to prime.exe. We could use wildcard notation, because we had no other .c and .obj files in our directory.
CTC++ can be used in this context also, as follows:
ctc -i m cl /c *.c ctc link /out:prime.exe *.obj
Here the first line instruments and compiles the three .c files to .obj files. No linkage takes place, because the '/c' option is present.
On the second line ctc is also first invoked. It sees 'link' and based on CTC++ configuration file settings it knows that 'link' is a command for making plain linking (similarly as with 'cl' command ctc knows that 'cl' is a command for making both compilation and linking). ctc invokes the link command and adds the CTC++ run-time library as one of the items to be linked. As net result we get the instrumented executable prime.exe.
Note that in "ctc link..." there need not be any instrumentation options present, because the link command does not compile anything and thus no source file instrumentation takes place.
As a side remark, the above instrumentation, compilation and linking could have been done also as follows:
ctc -i m cl -c *.c link /out:prime.exe *.obj %CTCHOME%\lib\ctcmsnt.lib
I.e. here the linking is not done via ctc-machinery. We have added the CTC++ runtime library explicitly to the link command.
4.4 Tutorial Continued / Use With Makefiles
Let us still continue our example. Assume we do the compilations and linking of the program with a makefile, which looks as follows:
# Makefile for building prime.exe EXE = prime.exe CMP = cl LNK = link all: $(EXE) prime.obj: prime.c io.h calc.h
28

io.obj: io.c io.h calc.obj: calc.c calc.h .c.obj: $(CMP) /nologo -c $< $(EXE): prime.obj io.obj calc.obj $(LNK) /nologo /out:$(EXE) prime.obj io.obj calc.obj clean: del prime.exe del prime.obj del io.obj del calc.obj
If we first say 'nmake clean' for deleting the .exe and .obj files and then
nmake "CMP=ctc -i m cl" "LNK=ctc link"
We see the following commands to be emitted by the makefile
ctc -i m cl /nologo -c prime.c ctc -i m cl /nologo -c io.c ctc -i m cl /nologo -c calc.c ctc link /nologo /out:prime.exe prime.obj io.obj calc.obj
First the source files are instrumented and compiled and then the instrumented objects are linked with the CTC++ run-time library.
Now if we change one of the source files and issue the same make command (with CMP and LNK redefined), we get instrumentation/compilation only of the changed source file and then linking of the instrumented target.
Note: When the original non-instrumented version of the program is wanted back the instrumented objects must all be rebuilt and the target relinked. For examples as follows:
nmake clean all
Note: If you wish to see what intermediate commands CTC++ invokes while instrumenting/compiling/linking your code, you can give the “-v” (verbose) option to ctc, and certain additional information is displayed on the screen.
4.5 Tutorial Continued / Use With Makefiles via ctcwrap
Assume again that we have the makefile as in the previous section. And we normally do the program building with nmake.
Building with CTC++ can be done also as simply as
29
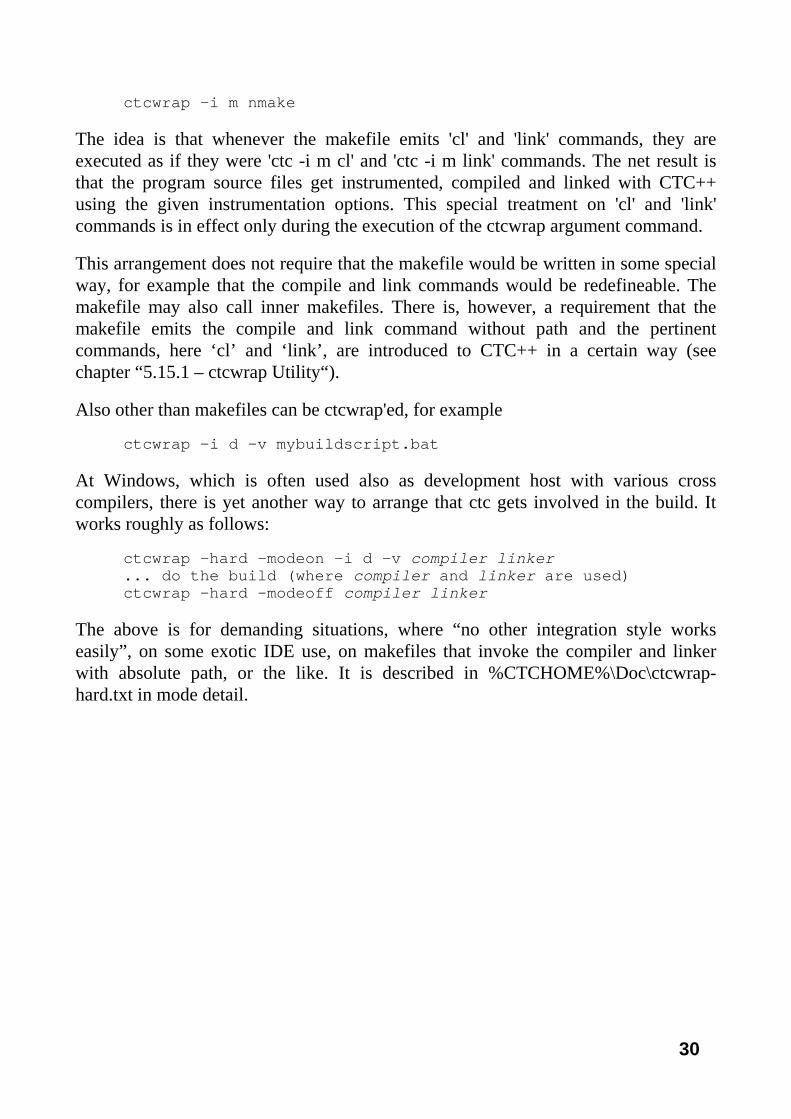
ctcwrap -i m nmake
The idea is that whenever the makefile emits 'cl' and 'link' commands, they are executed as if they were 'ctc -i m cl' and 'ctc -i m link' commands. The net result is that the program source files get instrumented, compiled and linked with CTC++ using the given instrumentation options. This special treatment on 'cl' and 'link' commands is in effect only during the execution of the ctcwrap argument command.
This arrangement does not require that the makefile would be written in some special way, for example that the compile and link commands would be redefineable. The makefile may also call inner makefiles. There is, however, a requirement that the makefile emits the compile and link command without path and the pertinent commands, here ‘cl’ and ‘link’, are introduced to CTC++ in a certain way (see chapter “5.15.1 – ctcwrap Utility“).
Also other than makefiles can be ctcwrap'ed, for example
ctcwrap -i d -v mybuildscript.bat
At Windows, which is often used also as development host with various cross compilers, there is yet another way to arrange that ctc gets involved in the build. It works roughly as follows:
ctcwrap –hard –modeon -i d -v compiler linker ... do the build (where compiler and linker are used) ctcwrap –hard -modeoff compiler linker
The above is for demanding situations, where “no other integration style works easily”, on some exotic IDE use, on makefiles that invoke the compiler and linker with absolute path, or the like. It is described in %CTCHOME%\Doc\ctcwrap-hard.txt in mode detail.
30

5. Using CTC++ Preprocessor
CTC++
Symbolfile
C/C++ source
file to be tested
CTC++
Preprocessor (ctc)
Command line parameters
ctc.ini file(s)
Instrumented
source file (temporary file)
Separately for each source file of interest,
i.e. to be tested / measured
C/C++ Compiler
Instrumented
object file
Rest of the code
to be tested
C/C++ Compiler/
Linker
CTC++ run-time library
Instrumented program
31
5.1 Introduction
Measuring code coverage or timing of a program is done with an instrumented version of the program. The instrumentation is done with the CTC++ Preprocessor program (ctc). You will decide which of the C or C++ source files of the program you will instrument and analyze with CTC++. If your program consists of some object or library files of which you do not have the source files in your control, you cannot instrument/analyze those portions of your program.
With default settings ctc does not instrument code coming from #included header files. E.g. many system headers contain lots of small inline funtions of which you hardly are interetested. But if you have some of your application headers, e.g. containing template functions definitions, which you would want to measure with CTC++, see discussion in “5.8” – “Instrumenting Code Coming From Included Files“.Normally you would not be using the ctc command directly. Instead, presumably, you would use ctcwrap (when command-line based building) or some CTC++ IDE integration (for example when using via Visual Studio IDE). But also those "higher abstraction level usage styles", at the bottom, use the basic ctc program for doing the instrumentation. When using those higher abstraction level layers it is needed to understand the concepts of the basic ctc program.
5.2 Starting ctc
The use of the CTC++ Preprocessor utility (ctc) is connected to the command for compiling/linking. ctc can be started in one of the following two ways:
ctc -h
This gives a short on-line help text of the available options, but actually ctc is used as follows.
ctc [ctc-options] comp/link-command comp/link-options-and-files
where [ctc-options] can be:
[-i {f|d|m|te|ti}…] [-n symbolfile] [-v] [-V] [-k] [@optionsfile]… [-c conf-file[;conf-file]…]… [-C conf-parameter=overriding-value] … [-C conf-parameter+appended-list-value] … [-C conf-parameter-toberemoved-list-value] … [-2comp] [-no-comp] [-no-templates] [-no-warnings]
32

Options must be separated from their arguments with a space. In arguments you may have to use “…” safeguarding to advise the command shell to interprete the argument as one entity or preventing it to expand wildcards. Here you have a couple of examples:
ctc cl -c myfile1.cpp myfile2.cpp ctc link /out:myprog.exe myfile1.obj myfile2.obj ctc –v –n XMON –C “NO_EXCLUDE+*\xdir\*.h” cl /Fexprog.exe x*.cpp ctc –i m D:\yproj\tests\MON.sym cl /Feyprog.exe *.c ctc -i dti -C TIMER=mytimerfunc cl -c mycriticalfile.c
5.3 ctc Options
The CTC++ Preprocessor (ctc) options are:
-i {f|d|m|te|ti}…
Specifies the instrumentation mode as follows:
f function coverage instrumentation d decision coverage instrumentation (implies f) m multicondition coverage instrumentation (implies fd) te timing exclusive instrumentation (implies f) ti timing inclusive instrumentation (implies f)
If no –i option is given, the default instrumentation mode is decision coverage (-i d).
There can be many –i options, the latest overrides. In one –i option there can be many coverage instrumentation arguments f, d, m, the “strongest” prevails.
There can be max one timing instrumentation argument te, ti.
Different files in a program need not be instrumented in the same way. If coverage instrumentation mode is only –i f, statement coverage reporting is not possible (at ctcpost time). Coverage instrumentation mode needs to be –i m, so that condition coverage and MC/DC coverage reporting would be possible (at ctcpost time).
The instrumentation modes are also discussed in chapter ”11 - CTC++ Instrumentation Modes".
33

-n symbolfile
This option specifies the file where CTC++ maintains descriptions of the instrumented source files. The default is the file MON.sym in the current directory. The symbolfile specification may contain a directory path, but if not, current directory is assumed. If the symbolfile specification does not end to “.sym”, that extension is implicitly added when the symbolfile is looked and created.
Remark: If you are building e.g. by a makefile, which compiles files at different directories, and if you have not specified the symbolfile, you will get MON.sym file in each of the directories. So, specify symbolfile with absolute path to get one symbolfile.
-v
(verbose). Displays to the screen (to stderr) what ctc is doing and what intermediate commands it internally invokes. The intermediate commands are: the command by which the original source file is C/C++-preprocessed by the compiler preprocessor to a temporary file and the command by which the instrumented file is compiled with the compiler from another temporary file to an object file. Also, the possible commands for invoking the additional instrumentation passes are displayed. These messages start with “ctc: “.
Using of this option is useful in understanding ctc behavior. When discussing with technical support, use of this option is often a “must” to properly describe what happened and in what phase some error message came. When everything works smoothly, use of this option may be “overkill” (much output).
-V
(VERBOSE). Displays to the screen (to stderr) the CTC++ Preprocessor header banner together with version number and such additional information. In this option the tool also displays what configuration files were found and loaded. This option (as only option) can also be used to check that ctc gets its license properly.
-k
(keep). Normally once ctc has done its job and the instrumented file has been compiled, ctc deletes the intermediate temporary C-preprocessed and instrumented source file. In some conditions ctc uses also temporary respone files for the compile or link command options and arguments. With this option ctc is advised not to delete those files, but allows you to study those files later. Use the -v option to see what temp file name was used for your code files. The
34

-k option is primarily meant for problem solving purposes, not to be used constantly in production use.
If you have used this option, you might from time to time delete these temp files from trashing your disk. These files reside in the temp directory (actually in the directory pointed by the ctc.ini setting TMP_DIRECTORY=…), and the file names have the following pattern CTC.numbers.numbers.extension.
@ optionsfile
This option allows off-loading some ctc-options (and, why not, also the compilation/linking command and its options) from command line into a text file. Newlines in the file are taken as spaces. Double quotes can be used to preserve spaces within an option defined in the ctc-options-file. There can be multiple @-options. The ctc-options-files can even be nested. The file can have options on many lines. A line starting with the ‘#’ character in the first column can be used for comments.
Also, if the compiler/linker has an options file and ctc needs to read its contents, ctc considers the #-starting lines as comment lines.
-c conf-file[;conf-file]…
This option specifies configuration files to be used in addition to those looked by default. Read more from section "12.2 - Configuration File Finding". There must be one space between -c and filenames. Multiple filenames are separated by a semicolon. Multiple -c options are concatenated and applied in the given order.
-C conf-parameter=overriding-value -C conf-parameter+appended-list-value -C conf-parameter-toberemoved-list-value
These options allow overriding (=) of a configuration parameter value, appending to it (+), or removing (-) a value from it. The use of the value appending or removing is reasonable only when the configuration parameter is a list. Appending (+) is done to the list end, and the list separator comma ',' is automatically inserted before the added value. Removing is done if the specified value is in the list, but if not, no effect.
These -C options are considered after the configuration file is searched and read from all of its default places (see section "12.2 - Configuration File Finding"). If there are multiple -C options for the same configuration parameter, the last one of them remains in effect (when the '=' case) or they all are obeyed cumulatively (when the '+' and ‘-‘ cases).
35
Examples: ctc -v -k -C TMP_DIRECTORY=. cl -c file*.c ctc -C EXCLUDE+file3.c,file5.c cl -c file*.c ctc -C OPT_ADD_COMPILE-/DCTC_HEAP_COUNTERS cl -c file*.c
If you wish to have spaces around '=', '+', '-', you need to enclose the whole argument in quotation marks so that the operating system shell can understand the argument as one entity. For example:
-C "EXCLUDE + e:\some dir with spaces\*" -C "NO_EXCLUDE = *\specialcode.inc"
Moreover, on Windows with certain batch files, the argument must really be enclosed with quotation marks when there is a ‘=’ character. Otherwise Windows considers ‘=’ a delimiter character and it will be “eaten away”.
-2comp
("double compilation"). With this option ctc is advised to first to execute the original command unchanged without ctc. Normally it is a compile command (compiling one or more source files), but it may also be a linking command. This extra compilation may be needed for making the compiler to generate some dependency files correctly based on the original source file and as may be needed by the rest of the build chain. The CTC++ instrumentation and compiling happens with slightly different arrangements (the dependency file generation options are dropped off, because they would specify the temporary file name) than the original compilation.
-no-comp
("no compile"). This option advises ctc not to emit a compilation command on the source file it had just instrumented. See section "14.9 - Use of option -no-comp" for more details.
-no-templates
With this option ctc is advised to leave all templates uninstrumented as if they were enclosed between the pragmas CTC SKIP and CTC ENDSKIP (see section "14.2 - Skipping Source Code in Instrumentation).
-no-warnings
("no warnings"). This option advises ctc not to give any warning messages that it would normally give. This option overrides what there is in configuration
36
parameter WARNING_LEVEL, as if it were made to ‘none’. The ctc warning messages are listed in "15 - Appendix A: Preprocessor Error Messages".
5.4 The Instrumentation Process
In this section we give an overview to the considerations and steps how the instrumentation actually takes place. Let us assume a command
ctc -i m cl /Femyprog.exe file*.cpp xfile.obj ylib.lib
and further assume that the operating system shell expands file*.cpp to file1.cpp, file2.cpp and file3.cpp.
When ctc is invoked, it first reads configuration files. Normally there is only one of them with name ctc.ini, but possibly there may be many configuration files. See section "12.2 - Configuration File Finding" where CTC++ looks for configuration files. With ctc option -V you can see which configuration files ctc actually found and loaded.
A configuration file has a section for general settings, for example for license control, and one or more command specific sections. In our case we have in the configuration file
... [Microsoft Visual C++] COMMAND = cl, cl.exe TYPE = compiler_linker ...
When ctc has parsed away its own command-line parameters, here "-i m", it sees '[possible_path\]cl' (or 'cl.exe'). Having parsed away also the "possible_path\" portion, ctc knows from the configuration file definitions that 'cl' is a command, which can both compile and link. The command specific section in the configuration file (not shown fully here) advises ctc, how the rest of the command line should be interpreted; notably, how ctc should treat the compiler options, what files are C files, C++ or other type files, etc.
At this point ctc looks if there was given any –C conf_par{=|+|-}value options, and applies them to the command block that came determined above. So, from command line you can fine-tune how ctc should behave in various respects, while the default behavior is determined by ctc.ini configuration file.
At this point, if the configuration parameter RUN_BEFORE_ALL contains any script (or scripts) to be called, they are called now. The script sees what are the ctc options and what the compile (or link) command line is. The script can change and add ctc
37
options that actually will be used. The RUN_BEFORE_ALL is for certain advanced use cases and normally it is not used.
After the optional RUN_BEFORE_ALL step, ctc checks if there is the ctc option -2comp or if there is some option on the compile command line triggering ctc to do a “double compilation”. See chapter “12.4.28 - Parameter OPT_DO_2COMP”. If “double-compilation” is to be done, ctc emits the full and unchanged original (compile) command. Sometimes this “double-compilation” step is needed to allow the original compilation to generate some dependency files correctly.
All right, at this phase, with the help of configuration file guidance ctc sees that on the command line there are some C or C++ source files, that are possible to instrument. The files here are file1.cpp, file2.cpp and file3.cpp. ctc also sees the files xfile.obj and ylib.lib, but concludes that they are not C/C++ files (advice coming from configuration parameters EXT_C and EXT_CXX) and does not touch them.
On each C/C++ source file given on compilation command line ctc repeats the following algorithm (logically):
First ctc considers should the source file be instrumented at all. ctc consults the EXCLUDE, NO_EXCLUDE and NO_INCLUDE configuration parameters. The usage and meaning of those configuration parameters is described later is this chapter and in section "12.4.40 - Parameter EXCLUDE, NO_EXCLUDE and NO_INCLUDE". If the source file falls to the "do not instrument category", ctc just emits the original compilation command for it and nothing more happens with the file. Use option –v for learning when this “plain compile” happens in regard to the other code files that are instrumented.
Besides considering to what category the source file falls in EXCLUDE/NO_EXCLUDE/NO_INCLUDE sense, it is also checked if there is some option at the compilation command, which is listed in the OPT_NO_CTC configuration parameter. If there is, the file is not instrumented but only compiled with its original options.
Assume next that these parameters do not prevent the source file from instrumentation.
Once ctc has parsed the source file and instrumented it to a temporary file, but before the compilation of the instrumented file, ctc will determine what symbolfile the file's description will be written to. The symbolfile may have been given with the -n option at the command line, but if not, the default is file MON.sym in the current directory.
If the symbolfile does not exist, it will be created, the file's description is written to it, and then the symbolfile is closed.
38

If the symbolfile exists, it will be opened and looked if it already contains the file's description. If it does not, the new description will be written (added) to the symbolfile, and the symbolfile is closed.
The following algorithm is used to determine if the file that is being instrumented is the same as some other file that is already recorded in the symbolfile. The starting point is the name of the file as it is given on the command line, for example "..\dir2\file5.cpp". Then configuration parameter SOURCE_IDENTIFICATION is consulted. Normally it has setting "as_given", but if there had been setting "absolute" we might get file name "D:\work\dir2\file5.cpp", which would be the file name how this file would be known in the symbolfile (and throughout the rest of the "ctc tool chain").
If the symbolfile exists and the file is already known there, the file's descriptions (one from this instrumentation and the other from the symbolfile) are compared. If they are different (the source code has changed since the previous instrumentation or in the previous instrumentation there was different compile flags, macros and conditional compilation, causing the effective source code to be different), the new file description is written over the old description in the symbolfile, and the symbolfile is closed. The description gets a new timestamp (meaning that at later phases the old coverage data collected earlier becomes obsolete). If the file descriptions are equivalent (meaning that ctc did not notice any change in the source code), the old instrumentation's time-stamp is inherited to the new instrumentation (meaning that test runs with the new instrumented code can accumulate coverage data to the coverage data of earlier test runs), the old description in the symbolfile is preserved, and the symbolfile is closed.
The critical time, when the symbolfile is under update, is guarded with a certain locking mechanism against parallel access. Read more from section "14.8 - Parallel access to symbolfile and to datafile".
Once the symbolfile has been closed, the instrumented version of the source file is compiled resulting in an instrumented object file.
The actual instrumentation takes place with the following steps (for using certain advanced user-defined additional steps here, please see section “12.4.46-Using Additional/User-Defined Instrumentation Phases“):
• The source file is first C/C++-preprocessed using the command model of PREPROC_C (if C file) or PREPROC_CXX (if C++ file) configuration parameter. In this phase the conditional compilation, macros and #includes get resolved. The result is written to a temporary file (into directory determined by configuration parameter TMP_DIRECTORY).
39

• The C/C++-preprocessed temporary file is then read and parsed by ctc. The actual instrumentation takes place in this phase. The result file is written to another temporary file. The symbolfile is handled at this phase as described above.
• Unless -no-comp option has been used, ctc invokes next the command (in our example '[possible_path\]cl') for compiling the instrumented temporary file. The resultant object file will come into the same object file as the original compilation command would have produced it.
• Once the compilation phase has been done the temporary files are deleted (unless -k option has been given).
Once all the source files from the command line have been instrumented and compiled to object files, ctc again looks at the command (here 'cl'). If the command also links (in our case 'cl' can link as well) and if there are any compiler option (like /c) that would deny the linkage. In our example the command also links and there was no compile-only option present. So, ctc once more invokes the '[possible_path\]cl' command but now so that the source files, which were instrumented, are replaced with their corresponding object files and all the other files remain on the command line (in our example xfile.obj and ylib.lib). On the linking command to be invoked ctc still adds the CTC++ run-time library. As net result we get the instrumented link target, myprog.exe.
The above example could have also been done as follows:
ctc -i m cl /c file*.cpp ctc link /out:myprog.exe file*.obj xfile.obj yfile.lib
where the "ctc -i m cl /c" makes the instrumentation and compilation substeps and the "ctc link" makes the linkage substep. So that ctc would know what 'link' means, in the configuration file there also must a command section something like the following:
... [Microsoft Linker] COMMAND = link, link.exe TYPE = linker ...
With 'ctc <linker-command>' ctc effectively only issues the '<linker-command>' and adds the CTC++ run-time library to one of the items to be linked. The item(s) to be added to the linking command are defined in the LIBRARY configuration parameter.
With command-line option -v we can ask ctc to display the commands that it internally invokes when it makes the instrumentation, compilation and linking. These
40

–v (verbose) messages are written to the screen, actually to stderr, and they are prefixed with “ctc: “.
For some demanding use cases, CTC++ provides certain “hooks” to fine-tune the instrumentation process further, see section “12.4.46 - Using Additional/User-Defined Instrumentation Phases”.
5.5 Choosing Instrumentation Mode
The instrumentation mode is chosen by a command-line parameter -i to the ctc command, for example as follows:
ctc -i mte cl /Femyprog.exe *.cpp
The possible instrumentation modes are:
-i f Function coverage.
-i d Decision coverage. Implies and is equivalent to -i fd.
-i m Multicondition coverage. Implies and is equivalent to -i fdm
-i te Timing, exclusive. Implies and is equivalent to -i fte
-i ti Timing, inclusive. Implies and is equivalent to -i fti
Any instrumentation mode combination can be specified, except if timing instrumentation is selected it must be either te or ti. Note that there is no option for line, statement, condition or MC/DC coverage. Line coverage is a HTML report property (generated by ctc2html utility), and it is enabled when statement coverage is available. Statement coverage comes automatically when instrumentation mode is higher than function coverage. Condition and MC/DC coverage are ctcpost properties to display the coverage of a code, which has been instrumented for multicondition coverage. What the various instrumentation modes mean in detail is described in chapter "11 - CTC++ Instrumentation Modes".
When no instrumentation mode parameter has been given, the default is as if "-i d" had been given. If several –i options are given, the last one prevails.
5.6 Instrumenting All But Some Selected Files
Assume we are compiling by a makefile many files and we apply ctc on the build, something like
41

ctcwrap –i m nmake –f myprogram.mak clean all
But we do not want that some selected files would be instrumented. Assume that we want that file2.cpp (in current directory) is only compiled, not instrumented.
This is done by EXCLUDE, NO_EXCLUDE and NO_INCLUDE configuration parameters. In configuration file these parameters normally have initial values
EXCLUDE = %INCLUDES% NO_EXCLUDE = NO_INCLUDE =
When we give the ctcwrap command as follows
ctcwrap –i m –C EXCLUDE+file2.cpp\ nmake –f myprogram.mak clean all
we get the desired effect. When ctc is about to instrument each file that the makefile compiles, it effectively sees the EXCLUDE values as
EXCLUDE = %INCLUDES%, file2.cpp NO_EXCLUDE = NO_INCLUDE =
and ctc does not instrument file2.cpp, only compiles it. In EXCLUDE you can specify multiple files, also directories (which means files which are in that directory or in some of its subdirectory). For a more detailed description, please see section "12.4.40 – Parameter EXCLUDE, NO_EXCLUDE and NO_INCLUDE.
5.7 Instrumenting Only Some Selected Files
Assume that we have the same situation as in previous chapter, but here we want that only file2.cpp is instrumented, all the other files are only compiled. This is done by fine-tuning the EXCLUDE, NO_EXCLUDE and NO_INCLUDE configuration parameters as follows:
ctcwrap –i m –C EXCLUDE=* -C NO_EXCLUDE=file2.cpp\ nmake –f myprogram.mak clean all
Now when ctc is about to instrument each file that the makefile compiles, it effectively sees the EXCLUDE, NO_EXCLUDE and NO_INCLUDE values as
EXCLUDE = * NO_EXCLUDE = file2.cpp NO_INCLUDE =
First each file is considered to fall to “not instrument” category, but then NO_EXCLUDE is checked and file2.cpp is instrumented after all.
42
Occasionally we have a situation where we build a big code base where the files reside in many directories. We want to instrument only code from some directories, but of them we still want to leave some portions uninstrumented. In such a case we could use for example:
ctcwrap –i m –C "EXCLUDE=*" \ -C NO_EXCLUDE="*\dir5\*,*\dir7\*" \ -C NO_INCLUDE="%INCLUDES%,*\dir5\subdir\*" \ nmake –f myprogram.mak clean all
First EXCLUDE says that every file falls to the “not instrument” category. Then NO_EXCLUDE is consulted, and if the file resides in either of these two directories, it is moved to the “instrument” category. Finally NO_INCLUDE is consulted, and if the file resides in the specified subdirectory, it falls to the “not instrument” category after all.
Note the use of %INCLUDES% here. It means that if the file comes to the compilation by #include (normally header code), the possible code from that file won’t be instrumented.
5.8 Instrumenting Code Coming From Included Files
Consider a source file afile.cpp, which looks like:
#include <iostream> #include "bfile.h" #include "afile.h" ... // some code #include "somecode.inc" ... // some code
and in the files afile.h and somecode.inc there is some code that we want to get instrumented. Assume that the ctc.ini settings are the default ones:
EXCLUDE = %INCLUDES% NO_EXCLUDE = NO_INCLUDE =
The following command
ctc -C "NO_EXCLUDE=*\afile.h,*\somecode.inc" \ cl /c afile.cpp
gives us the desired results, i.e. the code from afile.cpp, afile.h and somecode.inc will be instrumented. In case these include files would not be current directory they are specified with *\afile.h and *\somecode.inc (ctc’s “wildcard-machinery” matches these files against their real location at the directory three).
43

See “12.4.40 - Parameter EXCLUDE, NO_EXCLUDE and NO_INCLUDE” how you can specify files here. Generally, if some of your files include system headers, it is not wise to instrumented all included code (e.g. have EXCLUDE=… empty). System headers can bring quite a lot of small funtions, of which you actually are not interested; only makes the report very long and the overall TER% very low.
Also note that for a header to come instrumented, its basic code file must be instrumented, too. In ctcpost (and then in HTML report) you can select if the included headers are reported as their own file entities or as inside of the code files, where they are included in (-nhe option).
5.9 Reinstrumentation after Changing Some Files
Assume we have an instrumented program, with which we have done some test runs and got some coverage reports. Now we change some files and want to continue the testing. How to handle this in CTC++?
One usage convention is that everything is rebuilt as if CTC++ is used for the first time. All source files are recompiled and reinstrumented. Specifically there is no symbolfile from the previous instrumentation, which means that in the rebuild the files (also the unchanged ones) get new instrumentation timestamps. All tests are repeated. Specifically there is no datafile from previous test runs, which means that the collected coverage in the datafile is from the later test runs only.
CTC++ supports also usage convention, where the unchanged source files need not be reinstrumented, and where the coverage data of the unchanged files is accumulated in the datafile while only the changed file coverage is restarted from zero. This can be done as follows:
If the program was built by a makefile, just apply the ctcwrap command in the same way as in the initial build, like
ctcwrap –i m nmake -f myappl.mak
and have the old object files still present. The makefile dependency ruling compiles only the files that are changed, and they get re-instrumented. The old CTC++ symbolfile MON.sym needs to be present in the build.
When tests are done the old CTC++ datafile MON.dat is present. In the datafile the coverage data of unchanged files is accumulated, but started from zero on the changed files.
If the make machinery compiles all files, also the unchanged ones, this skema works still. So if the rebuild command were
44

ctcwrap –i m nmake -f myappl.mak clean all
where ‘clean’ would provoke rebuilding of everything. The key thing is that we have the previous symbolfile MON.sym present. When ctc instruments a file, ctc compares the newly derived file’s description to the description that there is in the symbolfile. If the instrumentation mode and the file’s descriptions are the same, ctc inherits from symbolfile the file’s instrumentation timestamp to the new instrumentation. This means that coverage data of the unchanged files can be accumulated in the datafile MON.dat, while the changed files restart their coverage data from zero.
5.10 Getting back to Non-Instrumented Executable
The default way how ctc makes the instrumentation is that it overwrites the original targets (objects, executables, libraries) with instrumented versions. When you are done with testing, you want to get back to such executable level, which does not contain any instrumented code.
The simplest way is to enforce total rebuild of the whole application with no ctc around at all (at least rebuild of those components that ctc has instrumented). For example
nmake -a -f myappl.mak clean all
If you are for some reason linking a program having instrumented object files but you are not linking the CTC++ run-time library, the linker will complain of some unresolved references. They are symbols starting with “ctc_”, often “ctc_register_module”.
5.11 Skipping Instrumentation of Selected Functions
In a source file, which otherwise would be instrumented, you can request that one or more functions are not instrumented after all. There are two ways to arrange this.
The first way is to edit the source file and insert there a pair of CTC++-specific pragmas around the function(s).
#pragma CTC SKIP #pragma CTC ENDSKIP
The pragma CTC SKIP starts “do-not-instrument” mode and the pragma CTC ENDSKIP reverts back to “instrument” mode. These pragmas can be nested and they have effect over “#include boundaries”. So, if an “#included file” has a starting CTC SKIP but not an ending CTC ENDSKIP, the skip mode continues in the file that included the “#include file”.
45

It is recommended that these pragmas are used only outside of function bodies. If these are used inside function bodies, it is required that they are used only in such places where an imaginary {…} block could be added and it would not make the program syntax erroneous or change the program logic. For example
int foo() { ... { <-- "imaginary" { #pragma CTC SKIP ... #pragma CTC ENDSKIP } <-- "imaginary" } ... }
Inside function bodies, where an executable statement can occur, the constructs "CTC SKIP"; and "CTC ENDSKIP"; can be used as alternatives to the #pragma directives. Those strings can also be used inside macro definitions, while the #pragmas cannot.
Using #pragma CTC SKIP/ENDSKIP inside a function invalidates statement coverage reporting of the function. The reason is that reliable control flow analysis cannot be done, because some control structures and their executions are “hidden” from ctc machinery (in any meaningful use if these pragmas inside a function). Statement coverage TER for the function is reported as “N.A. statement”. These pragmas are discussed along with other pragmas, see section "14.2 - Skipping Source Code in Instrumentation". However, a simple example of possible use is shown here:
46

#include <stdio.h> #include <bfile.h> ... int foo1() { ... } ... #pragma CTC SKIP int foo2() { ... } #pragma CTC ENDSKIP ... int foo3() { ... } ... #pragma CTC SKIP #include "somecode.inc" #pragma CTC ENDSKIP ...
Another way to leave some complete functions uninstrumented is to use the SKIP_FUNCTION_NAME configuration parameter. Its argument is a list of function names (‘*’-wildcards can be used) which, if met during the instrumentation process, are left uninstrumented as if they were enclosed between the pragmas CTC SKIP/ENDSKIP. The original source file need not be edited.
Normally this configuration parameter is empty in the ctc.ini file. A typical use of it would be from the command-line, for example:
ctc –C SKIP_FUNCTION_NAME=foo2,somefoo5,Aclass::memb cl …
5.12 Building an Instrumented Static Library
The build target is not necessarily a complete executable, it can also be a (static) library. CTC++ can be used to instrument source files of a library, too.
The instrumentation of the sources takes place normally and then the instrumented objects are put to the library with the library utility. The point to note is that the library will not contain the CTC++ run-time library. Thus, when you link the instrumented library to your final executable, you have to provide the CTC++ run-time-library at this stage. Here is an example:
rem The library: ctc cl /c file1.cpp cl /c file2.cpp ctc cl /c file3.cpp lib /out:mylib.lib file1.obj file2.obj file3.obj
47
rem The client program: cl /Femyprog.exe clnt1.cpp clnt2.cpp clnt3.cpp \ mylib.lib %CTCHOME%\Lib\ctcmsnt.lib
The above is just one way of doing this, but shows the idea anyway.
5.13 Working with 32-bit vs. 64-bit code
When CTC++ Preprocessor (ctc) instruments a source file there is no difference whether it is compiled as 32-bit or 64-bit code. The code is just C or C++.
The difference comes when linking the CTC++ run-time library to the instrumented program. What libraries, objects and options are added to the linkage command (when it is done “under ctc control”) is determined in the ctc.ini configuration parameter LIBRARY=… . The specified CTC++ run-time library variant must be compatible (in 32/64-bit regard) to how the code to be linked is compiled.
However, in a commonly used CTC++/Windows with VC++ compiler for normal x86 Windwos code, there is initially setting in ctc.ini in cl/link blocks:
LIBRARY = $(CTCHOME)\lib\ctcmsnt.lib LIBRARY + $(CTCHOME)\lib\ctcmsnt64.lib,/nologo
That is, both 32-bit and 64-bit CTC++ run-time libraries are given. Microsoft linker is so tolerant that it humbly picks that library variant that is compatible to code to be linked.
In CTC++/Linux the CTC++ installation script tries to conclude if the machine is 32 or 64 bit, and sets to the commonly used gcc/g++/ld blocks the LIBRARY parameter to either of the following (other line is #-commented out):
#LIBRARY = -L/installdirectory/lib,-lctc,-ldl,-lpthread LIBRARY = -L/installdirectory/lib,-lctc64
The GNU linker (ld) does not tolerate incompatible mode libraries in the linkage. So, if you have default 64-bit machine and compiler, but you sometimes compile 32-bit code, in the ctc-build you need to give proper CTC++ run-time library, e.g.:
ctcwrap ... –C LIBRARY=-L/installdirectory/lib,-lctc,-ldl,-lpthread \ make ...
On other platform or complers you just need to do the needful for getting to the linkage proper CTC++ run-time library.
When running 64-bit instrumented code at the host, the ctc2dat utility needs to be in PATH. The 64-bit CTC++ runtime will call it internally.
48
5.14 Enquiries of Instrumentations
As you remember from previous discussions ctc keeps track in the symbolfile of the source files that it had instrumented. By default the symbolfile is MON.sym in current directory, but with -n option to ctc (see section "5.3 - ctc Options") you can determine the symbolfile name explicitly.
With CTC++ Postprocessor (ctcpost) you can look what source files are known in given symbolfiles. Invoke ctcpost with -l or -L option, for example as follows:
ctcpost -l MON.sym MON2.sym MON3.sym ,or ctcpost -L MON.sym
The listing is outputted to stdout and it shows the names of the files whose instrumentation-time descriptions the symbolfiles have. Also the instrumentation timestamps are shown. The –L option shows still some more information. See section "7.5.7 - Symbolfile/Datafile Contents Listing" for more.
5.15 Some Build Integrations
In CTC++ production use it is perhaps rare that you use the 'ctc' command directly for doing "ctc-builds". You presumably use the 'ctcwrap' command (if your normal build would be by a makefile) or you would use some CTC++ IDE integration (if your normal build would be by the IDE, and if there is a CTC++ integration on that IDE).
However, technically, use of these build integrations boils down to the use of the basic 'ctc' command. That's why is it needed that you understand the concepts that are related to the basic use of 'ctc'. The CTC++ build integrations that are described next just give you a higher abstraction level and simpler way to use CTC++ at program building time.
5.15.1 ctcwrap Utility
ctcwrap is a simple to use way to do ctc-builds. It is used as follows:
ctcwrap ctc-options command command-options
For example, if normal way to do the build would be
nmake -a
the ctc-build would be done as follows
49

ctcwrap -i m -v nmake -a
Whenever the make machinery emits compilation and link commands, the ctcwrap machinery catches them and emits the same commands but prepended with "ctc ctc-options". The makefile need not to be written in some special way, for example having readiness to redefine the compile and link commands. The only requirement is that the compile and link commands are emitted without path.
The command that ctcwrap is applied on can be also something else than invoking a make utility. For example it can be running a script file, which runs inner script files, which invoke make files, which finally emit the compile/link commands that the ctcwrap-machinery converts to behave "ctc-wise".
The ctcwrap utility is prepared to recognize certain set of compile and link commands. For example, at Windows these commands include cl and link. On Unixes, gcc, g++, ld are among the recognized commands.
You can modify the set of commands that the ctcwrap utility will recognize. For example, when you use the CTC++ Host-target add-on component and wish to use ctcwrap with a new cross-compiler, you have to make this adjustment.
Windows platform:
File %CTCHOME%\wrapcmds.txt contains the list of commands that ctcwrap knows. Edit this file and add there the compiler name, for example cc386.exe.
After default installation at Windows in the wrapcmds.txt file there is not listed all the command names that the ctc.ini file knows. So, if you use some rarely used varianst of a command, e.g. synonym “cc” of “gcc” (MinGW), you need to check that wrapcmds.txt and add there the command you use.At Windows platform, the ctcwrap mechanism uses also %CTCWRAPDIR% environment variable. The user need not set it. It is set by the ctcwrap utility each time it is used, and it will designate a directory, which the ctcwrap mechanism will use for its purposes. Normally this directory is %TEMP%\ctc<n>, where <n> is 1, 2, 3,… etc (first “free”). Or if environment variable CTCWRAP_ROOT_DIR is defined, this directory is %CTCWRAP_ROOT_DIR%\ctc<n>.
Further at Windows, when CTC++/Visual Studio integration is used, including also command-line usage e.g. “ctcwrap … devenv …”, $(CTCWRAPDIR) must have been inserted into the beginning of the Visual Studio internal path, and %CTCWRAPDIR% must be defined and point to a usable directory (normally to %TEMP%\ctc). The CTC++/Visual Studio integration installation script takes care of these settings.
Unix platforms:
50
Find the directory where CTC++ has been installed and which contains the ctcagent file. It may be in /usr/local/lib/ctc/wrap directory, or something else, depending how the installation was done. In that directory there are some symbolic links to ctcagent (gcc, g++, ld, etc.). When wanting to introduce a new compiler or linker command to the ctcwrap machinery, for example cc386, in that directory give command
ln -s ctcagent cc386
Similarly as at Windows, in ctc.ini there are some more compilers listed than the installation probram initially “activates” by symlinks as described above. For example, if you would be using “clang++” (rarely used?, compatible to “g++”), you need to manually do the above symlink setting for getting it to work in the ctcwrap machinery.Depending how (to where) CTC++ has been installed, it may require administration rights to modify the wrapcmds.txt file (on Windows) or to specify new softlinks at the …/ctc/wrap directory (on Unixes).
Starting ctcwrap with -h option gives a little on-line help.
The ctcwrap arrangement, as it is described above, requires that the build system (e.g. make) emits the compile and link commands with their base names. If the build system invokes the compiler and linker with absolute path, the above described ctcwrap arrangement does not work.
In CTC++ v6.5.5, in the Windows version of ctcwrap, support was added for cases, where the compiler/linker is called with absolute path. It is meant for advanced users only. Read more from %CTCHOME%\Doc\ctcwrap-hard.txt.
5.15.2 IDE Integrations at Windows
The CTC++/Windows delivery version comes with some IDE integrations:
Visual Studio:
An IDE integration for Visual Studio resides in %CTCHOME%\Vs_integ directory. See the readme.txt file in that directory for installing and using this integration.
Visual Studio supports also builds from command line using commands devenv, vcbuild or msbuild. For example, as follows:
devenv mysolu.sln /rebuild debug
These kind of builds can be made to "ctc-builds" with the ctcwrap command, for example as follows:
51

ctcwrap -i m -v devenv mysolu.sln /rebuild debug
(For the above ctcwrap command to succeed, it is required that the additional installation step is performd as described in the readme.txt file at the %CTCHOME%\Vs_integ directory.)
Eclipse:
This integration resides at %CTCHOME%\Eclipse directory. See the readme.txt file in that directory for installing and using the integration.
52

6. Test Runs with The Instrumented Program
6.1 Introduction
Tests are run with the instrumented program, where one or more source files have been instrumented. The CTC++ run-time library has also been linked into the instrumented program.
The external behavior of the instrumented program is the same as with the original non-instrumented program. There is only a small overhead (program size and execution speed, depending on what instrumentation modes have been selected, generally quite modest) that the instrumentations introduce. When the program code visits the instrumented functions, the inserted probes collect execution counters into main memory. When the program execution ends normally, the CTC++ run-time library automatically writes the execution counters from main memory to datafile(s).
The datafile(s) and symbolfile(s) are then put together by CTC++ Postprocessor (ctcpost) to produce an execution profile and other forms of human readable listings.
Some input (not in CTC++'s control)
Some output (not inCTC++'s control)
One or more instrumented files and CTC++ run-time library
The test program
ctc.ini
datafile(s)
Possible error messages from CTC++ run-time library (to stderr)
53

Normally, when the program is executed one datafile, MON.dat, is born in the same directory as the symbolfile, MON.sym, when the program was instrumented. If the program does not end normally, or if it does not end at all, see chapter “6.4-Saving Execution Counters“ how to arrange the datafile writing.
6.2 Running the Instrumented Program
The instrumented program is run in the same way as the original program would be run, for example:
myprog
The instrumented program has the name that you have selected it to have, normally the same as the original program had (normally the instrumented program overrides the original one). If the program handles command-line parameters, they are fully handled by your code. By all means the instrumented program can also be a GUI program. The instrumented code can also be in a library, which is used by some non-instrumented code.
6.3 Configuration File
The instrumented program, actually the CTC++ run-time library part of it, looks for and reads the CTC++ configuration file(s). This takes place at the time when the program calls for the first time any of the instrumented files (some instrumented function there).
The CTC++ configuration files are looked from the same locations as the CTC++ Preprocessor (ctc) looks them (see section "12.2 - Configuration File Finding"). However the instrumented programs cannot search for the configuration files based on the -c command-line parameter, because CTC++ does not here handle the command-line parameters.
6.4 Saving Execution Counters
6.4.1 When the Counters are Saved
The execution counters are saved to a binary file called datafile.
The critical time when the datafile is under update is guarded with a certain locking mechanism against parallel access. Read more from the section "14.8 - Parallel access to symbolfile and to datafile”.
54

There are a couple of ways how the execution counter saving can be done (or how this act can be activated); the normal/default one (A, needing no actions from you) and a couple of special arrangements (B-F, for special cases and needing appropriate actions from you).
A. Normally this happens automatically at the end of the execution of the instrumented program. The CTC++ run-time library, when it was called along with the execution of the instrumented program, had registered itself to the C run-time system with the atexit() service. When the program is about to end, the C run-time system gives a testimonial call to the CTC++ run-time library, and so it can do the executions counter saving just before the program ends. In this arrangement, everything takes place automatically. No changes to the source code are needed.
On Windows, the CTC++ run-time library is a DLL and the automatic coverage data writing is associated with the event when Windows calls the DLL's DllMain() function with the DLL_PROCESS_DETACH reason. But conceptually the arrangement is roughly the same as with the atexit() service.
In situations, where the program does not end (e.g. it is a process that runs forever), or where atexit() is not available (could be e.g. in some embedded target cases), or when the program does not end normally (e.g. crash), certain special arrangements can be used as described next.
B. Inserting one or more lines
#pragma CTC APPEND
into the code to be instrumented. This line can be put into such a place where an executable statement can reside. Whenever this line, which maps to a call to CTC++ run-time library, is executed, the execution counters that are collected at the time are saved to the datafile. If the datafile is saved many times during the program execution, it does not cause bias to the counters. See also "14.1 - CTC++ Instrumentation Pragmas".
In this arrangement, some source files need to be modified for CTC++ purposes.
C. Use the EMBED_FUNCTION_NAME configuration parameter at instrumentation time. The parameter value is a list function names (or their wildcards). You could use this arrangement for example as follows:
ctcwrap ... -C EMBED_FUNCTION_NAME=foo,Cls::bar make ...
Here, when instrumenting the source files, if a stand-alone function foo() or a member function Cls::bar() is met, logically a #pragma CTC APPEND line is inserted
55

just before each return, throw and function end (if control can flow to the end). See also "12.4.7 - Parameter EMBED_FUNCTION_NAME.
In this arrangement, no source files need to be modified for CTC++ purposes.
D. The coverage data saving can be off-loaded to a separate thread, which wakes up periodically and activates the saving. If the program runs forever or if it can crash, you have the coverage data up to the last save point anyway. The arrangement goes as follows:
The instrumentation can be done for example like this:
ctcwrap ... -C OPT_ADD_COMPILE+-DCTC_LAUNCH_APPENDER \ -C LIBRARY+appendtrigger.obj make ...
The idea here is that under these settings the instrumented code (once per each instrumented file) calls the function ctc_append_trigger(). You have to provide implementation for it in some library or object file (here appendtrigger.obj), and CTC++ adds it to the linkage of the instrumented executable. The appendtrigger.c file needs to be compiled as C code (not C++ code).
The appendtrigger.c file could look as follows:
#include "ctc.h" void ctc_append_trigger(void) { /* must have this name */ static int first_time = 1; if (first_time == 1) { first_time = 0; ...launch_a_thread_from_the below_function; } return; }
void the_thread_function(void) { /* the side-thread */ while (1) { ...sleep_a_while; /* you determine how long */ ctc_append_all(); /* activate the saving */ } return; }
This schematic code shows only the idea. You need to implement this in a way that is possible in the operating system you are using. Instead of really activating the coverage data saving at each wake-up round, you can implement some additional logic when and if the saving is really done.
In this arrangement no source files need to be modified for CTC++ purposes.
56

F. Finally you may have an instrumented program, which is somehow “long-running”, and in your test arrangements you wish to terminate it by Control-C or some similar “kill-signal”. Different operating systems behave here differently if the default behavior described in (A) above is done or not, i.e the atexit() testimonial function is called by the system. In these cases (when wanting to catch Control-C kind of signals and activate the coverage data write out) you may use the following arrangement. This is a variation of the D arrangement above:
The instrumentation can be done for example like this:
ctcwrap ... -C OPT_ADD_COMPILE+-DCTC_LAUNCH_APPENDER \ -C LIBRARY+appendtrigger.obj make ...
You need to edit and compile (as C code, not C++ code) the appendtrigger.c file. It could look as the following. (Something like this has worked in Linux, here a new handler is assigned on segment violation SIGSEGV signal. Adjust the code for your needs):
#include <signal.h> #include "ctc.h" static void (*oldhandler)(int)=SIG_DFL; /* Default handler */ static void my_handler(int); void ctc_append_trigger(void) { static int first_time = 1; if (first_time == 1) { first_time = 0; oldhandler=signal(SIGSEGV, my_handler); } return; } static void my_handler(int i) { ctc_append_all(); /* first write out coverage data */ oldhandler(i); /* then do what was normally done */ }
Generally, let the arrangement be A, B, C, D or F, you need to ensure that coverage data saving does not happen in parallel from separate threads within a program.
6.4.2 Where the Counters are Saved
First consider default behavior when default settings are used (in this regard: in configuration file there is DATAFILE = %DEFAULT% and CTC_DATA_PATH
57
environment variable is not set). Assume the working directory at instrumentation time has been d:\prj1\build and the instrumentation command has been
ctc –i m cl –c file.c
There has come MON.sym file, i.e. d:\prj1\build\MON.sym, which contains description of file.c. At test time--regardless of the current directory!--the CTC++ run-time library writes the coverage data to file.c to d:\prj1\build\MON.dat.
If at the instrumentation command there had been ctc option “-n MON5.sym”, there would be MON5.sym/MON5.dat files in use in d:\prj1\build directory. But should ctc-option “-n d:\prj5\tests\MON.sym” be used, the used MON.sym/MON.dat files would be in d:\prj5\tests directory.
Normally all files in a program are instrumented with the same symbolfile, and so also their coverage data comes to the same datafile. But technically in a program there could be instrumented files, which use different datafiles, and at the end of the instrumented program many datafiles could get created/appended.
At test time there may not be such directory structure as it was at instrumentation time, for example, the tests are run in a different machine. For this purpose CTC++ run-time library recognizes CTC_DATA_PATH environment variable. If it is set, it specifies the directory where to the datafiles are written. From the symbolfile name the directory path is taken away and replaced with the value of CTC_DATA_PATH.
CTC_DATA_PATH is considered only at test time, not at CTC++ Preprocessor time or at CTC++ Postprocessor time.
The CTC++ configuration file parameter DATAFILE is an advanced feature by which the symbolfile/datafile directory and basename naming connection can be broken. When the parameter value is %DEFAULT%, the behavior is as described above. If the value is something else, it must be a working filename at test time context. It may contain absolute path or be relative to current directory. The datafile is written to that file.
For example, if we had the instrumentation command as
ctc –i m –C DATAFILE=MON5.dat cl –c file.c
the datafile would be MON5.dat in the current directory--whatever it is at test time! The symbolfile would be named according to its default rules.
58
6.4.3 When the Counters of a File are Not Saved
In normal course of work, when instrumented code is executed, the CTC++ run-time library asks the C run-time system with atexit() service that the C run-time system would still call the CTC++ run-time library just before the program ends. And at that time the CTC++ run-time library writes out (creates or appends) the counters to a datafile on the disk. If for some reason the CTC++ run-time library does not get the “testimonial call”, the coverage data writing must be arranged in another way.
On Windows, however, the automatic datafile writing is not arranged by the atexit() service. On Windows, the CTC++ run-time library is a DLL, and datafile writing happens when Windows calls the DllMain() function with reason DLL_PROCESS_DETACH. The net effect is the same as with the atexit() service.
The counters of an instrumented program are not usually saved when the program terminates abnormally. This can happen, for example, if the program calls function abort(), throws an exception which is not caught, the program is terminated by kill command or by Control-C. An exception to this is Windows 32 bit environment, where counters are saved even if the program is terminated with some of the listed ways.
Also, counters of an individual file are not saved when no instrumented functions in that file have been executed. The CTC++ run-time library is actually unaware of the whole existence of the instrumented file, if no instrumented functions in it have been called.
The whole datafile remains unwritten (unappended) if the program execution ran all the time in the uninstrumented portions of the program.
If the instrumented program is a never-ending process, the writing of the datafile must be arranged separately. The means for this are #pragma CTC APPEND, usage of the configuration parameter EMBED_FUNCTION_NAME, or using a periodic side-thread to activate the datafile writing.
6.4.4 Appending vs. Overwriting Counters in a Datafile
We have learned before that when the CTC++ run-time library writes the counters data out, it considers each instrumented file separately. The filename and directory, where the datafile resides, is also determined per each instrumented source file as described before.
If the datafile does not yet contain counter data of the source file, a new counter data block is written to the datafile.
59

But what about if the datafile contains counter data for the source file already? In this situation the existing counter data is either appended (the counters of the current test run are added to the counters of the datafile) or the counters in the datafile are overwritten. Appending takes place, if the previous counters in the datafile have been written from exactly the same instrumented source file that is now in execution. There are two things that the CTC++ run-time library checks here.
The first thing is the name of the file: how it is known in the instrumented program and in the datafile. At instrumentation time the configuration parameter SOURCE_IDENTIFICATION determines how the name of the file is recorded in the symbolfile, in the instrumented code and in the datafile. The alternatives are as_given, basename, absolute and absolute_without_drive. For example, if the file "..\dir2\file.cpp" was given at the instrumentation command line, CTC++ could record the file name as "..\dir2\file.cpp", "file.cpp", "D:\work\dir2\file.cpp" or "\work\dir2\file.cpp" depending on the SOURCE_IDENTIFICATION setting. The file name (how it is recorded in the "ctc-machinery") must be the same as in the datafile to be able to append the coverage data.
The second thing that is checked is the file's instrumentation timestamp. When a file is instrumented for the first time, it gets a timestamp. The timestamp is stored (with some other descriptions of the file) in the symbolfile. When a file is reinstrumented, the symbolfile is consulted, and if the file is unchanged (as CTC++ is able to conclude it from the previous symbolfile description) and the file has been instrumented with the same instrumentation mode, the old timestamp is preserved.
Now, at run-time, when the CTC++ run-time library determines whether to append the counters to the datafile or to overwrite them, two conditions must be met: of course, firstly, the file name must be the same (as it is recorded in the instrumented code and in the datafile) and, secondly, the file's timestamp in the instrumented code and in the datafile must be the same. If the timestamps differ, the file's coverage data in the datafile is overwritten.
When appending (summing up) the counter values to a datafile, CTC++ run-time library leaves a counter value at the maximum 32 bit, if the summing up of the counter value in memory and the earlier counter value from the datafile would become bigger. Note that this is an always in effect property, and separate from the safe counters concept (used to watch that counters do not overflow in main memory at test time).
6.5 64-bit Instrumented Programs
The 64-bit support came in CTC++ version v6.5.4 on all supported host platforms. The idea and assumption with them is that normal 32-bit executables can be run on
60
the 64-bit machine. Thus the instrumentations and reporting phases can be done with the normal 32-bit ctc and ctcpost utilities.
The CTC++ run-time layer in 64-bit executables is technically built using the CTC++ Host-Target add-on. When that run-time writes the coverage data out, it is done as follows:
1) First the coverage data is written in text-encoded form to a file. At Windows, the file %TEMP%\MON.process-id.txt (first) or %TMP%\MON.process-id.txt (next), or, if neither %TEMP% nor %TMP% is defined, .\MON.process-id.txt is used. At Unixes, the file $(TMPDIR)/MON.process-id.txt or, if $(TMPDIR) is not defined, /tmp/MON.process-id.txt is used. The process-id is used in the file naming so that the instrumented programs that run in parallel and possibly do the coverage write-out in parallel do not use the same text file.
2) Then the run-time invokes the 32-bit executable ctc2dat (needs to be in PATH!), which reads the text file and transfers the coverage data to the datafile. The name and location of the datafile are determined according to the same rules as with the normal 32-bit instrumented executables.
3) Finally the MON.process-id.txt file is deleted. If the step (2) had failed for any reason (ctc2dat was not in PATH, license could not be obtained,…), the file is not deleted.
The net effect is the same as with 32-bit instrumented programs, where the run-time writes/updates directly the datafile.
6.6 Test Case Concept
Test case concept was introduced in CTC++ v7.2. Its idea is the following:
The instrumented program is assumed to have a test driver portion. It can be instrumented or not. The test driver, which contains your test logic, calls the code under test, the actual instrumented code. In the test driver you may have wanted to group the calls to test cases, and you want to get the coverage collected – and later being able to report – per individual test cases (while coverage in normal use is collected per whole instrumented program execution). In this example it is assumed that you have names on test cases, say, “tc01”, “tc02”, etc.
The CTC++ runtime library API has a function with the following prototype:
61
void ctc_set_testcase(const char* tcname);
In the test driver you call this function when a new (first or next) test case starts. When this function is called, the following happens:
• Assume this is first test case, and the test case name is set to “tc01”:
o Coverage data that is collected from the program begin upto this point is written out to its normal datafile, which is some abspath\MON.dat. The datafile is created/appended in the normal manner.
o Coverage data from main memory is zeroed.
o The CTC++ runtime remembers that in the next coverage data write-out the used datafile name shall be abspath\MONtc01.dat.
• Assume this is some subsequent test case, which has the name “tc05” and the previously set test case has been “tc04”:
o Coverage data that is collected for the previous test case “tc04” is written out to abspath\MONtc04.dat, and the file is created or appended in the normal manner.
o Coverage data from main memory is zeroed.
o The CTC++ runtime remembers that in next coverage data write-out the used datafile name shall be abspath\MONtc05.dat.
The net result is that there comes abspath\MON.dat, abspath\MONtc01.dat, abspath\MONtc02.dat, etc. Test case specific coverage reports are obtained by ctcpost from MON.sym and MONtc<n>.dat. Coverage report over the whole test session is obtained by ctcpost from MON.sym and MONtc*.dat.
If the test program makes no ctc_set_testcase() calls, there will be only one datafile, the abspath\MON.dat. I.e., the test case concept, if not used, has no effect on the so far experienced CTC++ behavior in this respect.
The test case name tcname must such that when it is inserted into the abspath\MON.dat, the resultant file name must be valid (length, acceptable characters).
Setting the test case name to empty string (“”) means that coverage collecting continues to the initial abspath\MON.dat.
Coverage data of the last test case gets written to its datafile when the program ends.
62

If there are explicit coverage data write-out requests in the between (by #pragma CTC APPEND, by EMBED_FUNCTION_NAME arrangement, or by periodic write out from an auxiliary thread), the coverage data is written to that datafile, whose name is determined by the at-the-time-last-set test case name.
In datafile writing the environment variable CTC_DATA_PATH, if set, determines the directory where the datafile is written. It is similarly honored when test cases are used.
Instead of writing explicit ctc_set_testcase(“tcname”) call, it can be dressed also in a pragma form, to
#pragma CTC TESTCASE tcname
It has the benefit that if the test driver code is compiled without instrumentation, the file compiles (compiler may give a warning of an unknown pragma though), and the line has no effect. Another benefit is that the ctc tool does not give ctc’s own warning of user using identifiers that start with “ctc_” (meant to be for ctc’s internal use).
In practical programs (test drivers, which necessarily are not instrumented), it is perhaps best to write a prototype for ctc_set_testcase(), and then call it explicitly. Then you can also pass the test case name via a variable (of type char *), while in the #pragma style a variable cannot be used.
The ctc_set_testcase() in a way means changing the datafile where to the collected execution data is written from now on. If the code is instrumented for timing and if at the time of ctc_set_testcase() call there are “open functions” (in timing sense: the instrumented function has been entered, but not yet exited), the timing data in the datafiles is not correct for such functions.
63

7. Using CTC++ Postprocessor
7.1 Introduction
CTC++ Postprocessor, ctcpost, is the utility which is used to produce various human readable textual listings of the coverage data collected in the instrumented program runs. ctcpost can also be used to combine symbolfiles and datafiles. Further, ctcpost can be used to produce a listing of the contents of symbolfiles and datafiles. The primary use of ctcpost is the following (one of options -p, -u, -t, -x):
ctc.ini
various listings
datafile(s)
ctcpost
additional command-line parameter fine-tuning
symbolfile(s)
Combining (adding) symbolfiles into one is done as follows (-a option):
additional command-line parameter fine-tuning
target
symbolfile
ctc.ini
symbolfile(s)
ctcpost
64

Combining (adding) datafiles into one is done as follows (-a option):
additional command-line parameter fine-tuning
target datafile (to be created)
ctc.ini
datafile(s)
ctcpost
Getting the list of contents of one or more symbolfiles and/or datafiles is obtained as follows (-l and -L options):
additional command-line parameter fine-tuning
ctc.ini
symbolfile(s),
datafile(s)
ctcpost
list of contents
(to stdout)
ctcpost can produce the following listings: execution profile listing, untested listing, timing listing, xml-outputfile and contents of symbol/datafile listing.
The execution profile listing can further be transformed into a browsable hierarchical HTML document with the ctc2html utility. With the ctc2excel utility the execution profile listing can be converted to a form that is suitable for Excel processing.
One or more xml-outputfiles can be “back-converted” and merged to textual execution profile listing.
65

7.2 Starting ctcpost
The four modes of using CTC++ Postprocessor (ctcpost) have the following command-line syntaxes:
ctcpost [general-options] [symbolfile] …[datafile] … [-ff | -fd | -fc | -fmcdc] [-nhe] [-w report-width] {{-p | -u | -t | -x} reportfile}…
ctcpost [general-options] symbolfile … -a target-symbolfile
ctcpost [general-options] datafile … -a target-datafile
ctcpost [general-options] {-l | -L} {symbolfile | datafile}…
where the general-options are:
[general-options]: [-h] [-V] [-f source-file[;source-file] …]… [-nf source-file[;source-file] …]… [-c conf-file[;conf-file] …] … [-C conf-param=overriding_value] … [-C conf-param+appended_list_value] … [-v] [-V] [-h] [@optionsfile] …
7.3 ctcpost Options
The options are:
symbolfile…
Symbolfiles, whose contents ctcpost will read and process. Extension “.sym” added, if not given explicitly.
datafile…
Datafiles, whose contents ctcpost will read and process. Must have extension “.dat”.
66
-ff Forces function coverage view to be used in the listings even if the instrumentation was done with a higher (decision or multicondition) coverage.
-fd Forces decision coverage view to be used in the listings even if the instrumentation was done with a higher (multicondition) coverage.
-fc Forces condition coverage view to be used in the listings. This option has effect only when the instrumentation was done with multicondition coverage.
-fmcdc
Forces MC/DC coverage view to be used in the listings. This option has effect only when the instrumentation was done with multicondition coverage.
The -ff, -fd, -fc and -fmcdc options affect how the structural coverage is displayed and how its TER % is calculated. (The new TER % can be lower, same or higher than the TER % without these options being used!). Statement coverage, actually its TER% only, is displayed always if only the code has been instrumented with higher than function coverage,
-nhe By default (as of CTC++ v8.0) instrumented headers (containing complete functions) are reported as their own file entities. With this option (~no header extraction) the old behavior is kept, where the headers are reported inside the code files where they are included in.
-w report-width
The argument, which is an integer, advises ctcpost how long lines it can write to its output listings. ctcpost truncates lines that would become longer. By default the lines are written as long as they take, maximum 4096 characters.
-p profile-reportfile
Produces an execution profile listing to the specified file. If the file is specified with '-' or stdout, the listing is written to stdout.
-u untested-reportfile
Produces an untested listing to the specified file. If the file is specified with '-' or stdout, the listing is written to stdout.
-t timing-reportfile
Produces a timing listing to the specified file. If the file is specified with '-' or stdout, the listing is written to stdout.
67
-x xml-reportfile
Produces a text file, which contains all the information that is in the -p profile-outputfile and in the -t timing-outputfile. There is also some additional information. The output file format is XML. If the file is specified with '-' or stdout, the listing is written to stdout.
-a {target-symbolfile | target-datafile}
This option combines (adds) the other symbolfiles (datafiles) given on the command line and writes the combined symbolfile (datafile) to the specified file.
-l {symbolfile | datafile}…
This option produces Contents of Symbol/Data File Listing showing what instrumented source files the given symbolfiles and datafiles contain. Also the instrumentation timestamps are shown. The listing is written unconditionally to stdout.
-L {symbolfile | datafile}…
This option is like -l option, but additionally information of certain counter vector sizes and number of rewrites/updates is reported, too.
-f source-file[;source-file] …
Constrains the listings (-p, -u, -t, -x, -l, -L) and symbolfile/datafile summing (-a) to contain information of the selected source files only. The argument is an explicit file name (like "D:\work\Dir2\file.c" as it is identified in the symbolfile) or a wildcard (like "*\Dir2\*", only '*' is supported). The argument can contain many source files, separated with semicolons (;). There can also be many -f options in which case the union of their arguments is meant.
Depending on the operating system and its command shell wildcard resolving, the following doesnot work ‘-f foo*.c’ or ‘-f “foo*.c”’, if ‘foo*.c’ resolves to many files at the context. The -f option would apply only to the first expanded item. If you have this problem, you can use the following trick: give the option as follows: -f foo*.c;nevermind.x . Now command shell does not expand the ‘*’, and it gets passed to ctcpost.
Note also that the -f option argument (or a wildcard) is matched against the file names that are known in the symbolfile. If you have instrumented a file under name ..\src\file.c, and SOURCE_IDENTIFICATION=as_given is used in ctc.ini, the file is known with ..\src\file.c in symbolfile (and throughout the
68

CTC++ tool chain). Trying to specify the file here with its absolute name, perhaps D:\myproj5\src\file.c, does not give a match. Use ctcpost -l option to find out how the instrumented files are known in the symbolfile.
Note still that the -f option argument specifies the source file names that are actually compiled, not the instrumented #included files (that as of CTC++ v8.0 ctcpost utility can extract and report as their own MONITORED HEADER FILE entities).
When no -f options are present, all files known in the input symbolfiles are reported. When -f options are present, only those files are reported that match to some of the -f option arguments. The -nf option can be used to further restrict the report.
-nf source-file[;source-file] …
Constrains the listings (-p, -u, -t, -x, -l, -L) and symbolfile/datafile summing (-a) NOT to contain information of the selected source files. The argument is an explicit file name (like "D:\work\Dir2\file.c" as it is identified in the symbolfile) or a wildcard (like "*\Dir2\*", only '*' is supported). The argument can contain many source files, separated with semicolons (;). There can also be many -nf options in which case the union of their arguments is meant. When there are both the –f and –nf options, the –nf option restricts the set of files that became selected by the –f option.
Similar tricks and remarks apply on -nf option as on -f option.
When no -nf option is present, all files known in the input symbolfiles are reported, or those that were restricted by -f option.
-c conf-file[;conf-file] …
Specifies additional configuration file(s), which is (are) looked when all the other places for configuration files have been looked through. The behavior is similar as with CTC++ Preprocessor (ctc), see section "12.2 - Configuration File Finding".
-C conf-param=overriding_value -C conf-param+appended_list_value
These allow configuration parameter overriding (=) or appending (+) from the command line. The behavior is similar to CTC++ Preprocessor (ctc).
69

-V
This option (VERBOSE) advises ctcpost to display information what configuration files were searched, found and loaded. These extra information messages go to stderr.
-h
This option (help) advises ctcpost to display a small on-line help of its command-line options. Then ctcpost quits.
@optionsfile
This option (there may be more than one of them) specifies a file, which contains additional command-line options to ctcpost. This is similar behavior as with CTC++ Preprocessor (ctc). A line starting with the ‘#’ character in the first column can be used for comments.
When no command-line arguments at all are given, ctcpost displays a small on-line help of its command-line options, as if with -h option.
When -a option is present, no -nhe, -p, -u, -t, -x, -l, -L options may be present.
When -l or -L option is present, no -nhe, -p, -u, -t, -x, -a options may be present.
7.4 Understanding ctcpost Behavior
This section may be relevant only for a CTC++ superuser...
7.4.1 ctcpost Behavior when Producing Listings
This mode of ctcpost use is in question when there is no -a , -l, or -L option present. In this mode you
• specify a set of symbolfiles (either explicitly or implicitly), where each symbolfile contains some descriptions of modules (descriptions of instrumented files),
• specify a set of datafiles (either explicitly or implicitly), where each datafile contains some counter blocks of modules (execution counters of instrumented files); the number of datafiles may also be zero,
• ask ctcpost to produce one of the following listings: execution profile listing (-p), untested listing (-u), timing listing (-t), XML output file (-x),
70

• specify in what coverage view the listing is generated: options -ff, -fd, -fc, -fmcdc. When none of these options is given, the listing is generated in ”as instrumented” view.
• and possibly restrict the listing to contain only those modules, which pass the -f and -nf options "filter".
Normally the execution profile listing is taken out, which is then further processed with ctc2html utility for getting its information into HTML-browsable form.
The default rules for specifying the symbolfiles and datafiles are the following:
• When at least one symbolfile and at least one datafile have been given explicitly on the command line, they are used. No other ruling takes place in this case.
• When not a single symbolfile and not a single datafile has been given explicitly, the file MON.sym in the current directory is assumed, and also the file MON.dat is used, if it exists.
• When some symbolfiles, say xxx.sym and ..\otherdir\mymon1.sym have been specified explicitly but not a single datafile has been given, ctcpost uses the corresponding datafiles, here xxx.dat and ..\otherdir\mymon1.dat, if they exist.
• When some datafiles, say MON.dat and e:\counters\mymon2.dat, have been given explicitly and no symbolfiles have been given, ctcpost assumes that the corresponding symbolfiles, here MON.sym and e:\counters\mymon2.sym, exist and uses them.
It is a hard-coded property in ctcpost that a symbolfile must have extension .sym and datafile .dat.
Examples:
71
ctcpost MON.sym MON.dat -p prf.txt #use exactly these ctcpost MON.sym MON.dat \ MON2.sym MON2.dat -p prf.txt #use exactly these ctcpost MON -p prf.txt # use MON.sym (must be found) # and MON.dat (if found) ctcpost -p prf.txt # use MON.sym (must be found) # and MON.dat (if found) ctcpost MON.dat -p prf.txt # use MON.dat (must be found) # and MON.sym (must be found) ctcpost M1 M2 M3 -p prf.txt# use corresponding .sym files # (must be found) and corres- # ponding .dat files (if found)
Note that ctcpost does not consult the CTC_DATA_PATH environment variable when looking for the datafiles. You may remember that at instrumented program execution time this environment variable could be used to determine the directory where the datafiles were written.
All right, now we have learned that as input to ctcpost we specify one or more symbolfiles. Each symbolfile may contain zero (normally at least one) or more descriptions of instrumented modules (instrumented source files). ctcpost reads first all symbolfiles, one by one.
It is possible that two (or more) symbolfiles contain a description for a same module. The situation may not be common, but possible if the source file in question has been instrumented many times and the descriptions were written to different symbolfiles.
Each time ctcpost reads a description of a module (instrumented source file), it checks if the module (see “12.4.41- Parameter SOURCE_IDENTIFICATION“ with what name the module is known in CTC++) is known already. In such case the actual module descriptions are additionally compared. Here a similar comparing algorithm is used as when ctc uses when comparing if a source file after re-instrumentation is the same as in the earlier instrumentation in a symbolfile. If also the module descriptions are the same, ctcpost considers the modules to represent the same level of the source file, even though the instrumentation description timestamps may be different. [Later, when coverage data from the datafiles are read, the coverage data is accepted if it only carries any of the accepted timestamps as they were recognized in this phase.]
If the new module description is different from the previous module description, that module description is kept that has the most recent timestamp.
If -f option was given, ctcpost discards (or forgets) descriptions of those files that were not mentioned in the -f option arguments. If the file passed the possible -f option test, the possible -nf option is checked next, and the file can become discarded from inclusion to the report due to that option.
72

Now in our tour to the understanding of ctcpost behavior we are at the stage, where ctcpost has read in some set of module descriptions. Associated to one module there is normally one timestamp, but if many symbolfiles have been read in, there also can be a list of timestamps.
Next, ctcpost reads in the module counter blocks (coverage data), one by one, from the datafiles. This behavior is described next.
If ctcpost sees a counter block for an unknown module (there was no description at all for it in any of the symbolfiles or the module's description has got discarded because of -f or -nf option), ctcpost discards (forgets) the counter block.
If ctcpost sees a counter block for a module, which as such is known to it, but the instrumentation timestamp in the counter block does not match to the (list of) instrumentation timestamp(s) of the module description, ctcpost discards (forgets) the counter block.
If no proper (having matching timestamps) counter block has been met for a module that was read from some symbolfile, ctcpost emulates the counter values with zeroes for the module, as if the module was not executed at all.
If a counter block on a module was indeed discarded, the question is presumably that the counter block represented a test run with some old version of the instrumented module. It may also be that the test run represents some newer version of the instrumented module, but for some reason you did not provide the corresponding module description to ctcpost in the symbolfiles.
Finally it may be that ctcpost sees a counter block for a module for the second or more times and the timestamps match. This is possible, if the counter data of the exactly same instrumented module has been saved to many datafiles, e.g. tests have been done in many machines. Or it may have been that the same instrumented executable has been run many times and the CTC_DATA_PATH setting has been changed in the between, thus resulting multiple datafiles. Or perhaps datafiles had been moved and renamed, or added with ctcpost's -a option. In this situation ctcpost adds the new counter block values to the previous ones. So, here it takes place a kind of accumulation of counters. Normally the similar accumulation takes place to a datafile already when the test executable is run multiple times in the presence of the same datafile.
If ctcpost does not see any counter block for some module, it emulates the counter values with zeroes as if the module was not executed at all.
At this stage some set of modules (all that were seen from the symbolfiles, possibly restricted by –f and –nf options) has been determined and execution hits have been
73

assigned on them (possibly emulated by zero if no execution data or only incompatible data, or summed up if many execution datas from many datafiles).
Next, unless –nhe option (~no header extract) has been given, ctcpost extracts instrumented headers to their own reportable file entities. In a way the header code is pulled out from the code file it was included in, and if many code files had included same header, the counters are summed up for the header. Then in reporting the header file is displayed as separate MONITORED HEADER FILE item with its own coverage percent (TER). The initial code file displayed as MONITORED SOURCE FILE item, and in it does not contain the header file portions (their functions).
Normally everything goes smoothly and intuitively, but there are some special cases (rare?), which are discussed below.
Normally, and with default settings, header code (#included code) in not instrumented at all. So there is no issue in this regard. Only well-behaving headers are extracted. Here well-behaving means that included code portions stands for one or more complete functions. If the inclusion starts or ends at a middle of a function, the included code portion is left on its place and reported as part of the file where it was included (either the primare code file or the included file, which was included to the primary code file).
If a well-behaving header has already been extracted for some primery code file, and in a later primary code file there is include to same header file, certain additional cheks are done. The instrumentation modes must be same. The later include must be similar as the already encountered include: there must be same probes on same lines, same probe descriptions, same understanding of the amount of statement in then-parts, else-parts, etc. in a function, etc. If the later seen header does not pass this “sameness test”, the later header is left to its primary code file.
Now, finally, ctcpost is ready to write the coverage report, as asked for by the –p, -u, -t or –x option. The different report forms are described with an example in section "7.5 - CTC++ Listings".
Finally, if you experience any anomalies in the coverage reports, especially if the counters of some modules are surprisingly zero, you could study the additional CTCPost notices, which ctcpost writes (always, as of v6.5, to stderr). The CTCPost notices (see “17 - Appendix C: Postprocessor Error Messages”) inform the user of ctcpost’s behavior when same module (either file's description or coverage data block) was encountered two or more times and some of them got discarded. You could also study the symbolfile and/or datafile with ctcpost -l option for seeing the exact module names (file names) and their instrumentation timestamps. With the -L option you find out how many times the file has been reinstrumented (so that its
74
description has changed), and how many times the file’s coverage has been summed up or restarted from zero.
7.4.2 ctcpost Behavior when Adding Symbolfiles
In this mode there is -a option present, for example:
ctcpost MON.sym ..\otherdir\mymon1.sym -a joint.sym
The source symbolfiles (here MON.sym and ..\otherdir\mymon1.sym) are first read and processed in main memory. Processing here means:
• If -n or -nf options have been used, discarding some of the instrumented files from the resultant symbolfile.
• If different symbolfiles have descriptions of the same file, only one of them—the one with newest instrumentation timestamp—remains in the resultant symbolfile. So this operation is somewhat risky in the sense that information is lost in situations when there are multiple file descriptions of the same file with different timestamps.
Finally, the target symbolfile (here joint.sym) is created and the joined symbolfile is written there.
The target symbolfile can appear also as input file (in which case it will become overwritten with new contents). If also -f or -nf options are used, you have means to take away some unwanted file descriptions from the symbolfile.
7.4.3 ctcpost Behavior when Adding Datafiles
In this mode there is -a option present, for example:
ctcpost MON.dat ..\otherdir\mymon1.dat -a joint.dat
The source datafiles (here MON.dat and ..\otherdir\mymon1.dat) are first read and processed in main memory. Processing here means:
• If -n or -nf options have been used, discarding some of the instrumented files from the resultant datafile.
• If different datafiles have counter blocks of the same file and if their instrumentation timestamps are the same, the coverage data of them is summed up into the resultant datafile.
75

• If different datafiles have counter blocks of the same file but if their instrumentation timestamps are not the same, only that coverage data is kept in the resultant datafile, whose instrumentation timestamp is most recent. The older ones are discarded. So this operation is somewhat risky in the sense that information is lost in situations when there are multiple coverage data blocks of the same file but with different timestamps.
Finally the target datafile (here joint.dat) is created and joined/summed up coverage data is written there.
The target datafile can appear also as input file (in which case it will become overwritten with new contents).
7.4.4 ctcpost Behavior when Listing Symbolfile/Datafile Contents
In this mode there is -l (or -L) option present, examples:
ctcpost -l MON.sym ..\otherdir\mymon1.sym yyy.dat ctcpost -L MON.dat -f "*\dir5\*"
The listing is written to stdout. In -l case the listing contains the names and instrumentation timestamps of the modules that ctcpost could see from the given symbolfiles and datafiles. In –L case there comes additionally certain internal counter vector sizes and how many times the item has been rewritten (rwr count) and updated (upd count).
The listing can be constrained by -f and -nf options.
The listing form is described with an example in more detail in section "7.5.7 - Symbolfile/Datafile Contents Listing".
7.5 CTC++ Listings
CTC++ listings are produced by ctcpost utility. The textual listings are:
• Execution Profile Listing. This is the basic listing showing the missing coverage (structural coverage: the critical code locations that have not been visited) and how many times the corresponding code locations have actually been visited. Also statement coverage, its TER%, is shown. Often the execution profile listing is further used as input to ctc2html utility, which converts the information into a convenient-to-use HTML-browsable form.
• Untested Listing. This is effectively similar as the execution profile listing, but shows only the lines, where CTC++ shows insufficient (structural) test
76

coverage. Since introducing of the HTML reporting, which has a page for Untested Code, this listing may now be somewhat less useful.
• Timing Listing. This listing shows the cumulative, average and maximum execution times of functions. Timing listing makes sense only when the code has been instrumented for timing measurement.
• XML output file. This is a text file, which is generated in XML format. The information contents are a kind of union of Execution Profile Listing and Timing Listing. There is also some additional information that is not included in either of those listings. The XML output file is meant for further processing of the CTC++ measurements with some XML-based tool.
• In CTC++ v7.2 a new utility, ctcxmlmerge, was introduced. It gives new ways to get combined coverage reports, and in it the XML output file plays a role, read more from chapter “8 – Using ctcxmlmerge Utility“.
• Contents of Symbol/datafile Listing. This listing shows what modules (instrumented files) the given symbolfiles and datafiles contain.
Next, an example of each of these listing is shown and their relevant fields are explained. The listings are done by v8.0. In v8.0.1 the listings are the same except at the bottom line summary there is a new line “Functions : n”, telling the number of functions in the code files.
7.5.1 Execution Profile Listing
Here is an example of an execution profile listing:
***************************************************************************** * CTC++, Test Coverage Analyzer for C/C++, Version 8.0 * * * * EXECUTION PROFILE LISTING * * * * Copyright (c) 1993-2013 Testwell Oy * * Copyright (c) 2013-2015 Verifysoft Technology GmbH * ***************************************************************************** Symbol file(s) used : MON.sym (Tue Nov 17 08:13:14 2015) Data file(s) used : MON.dat (Tue Nov 17 08:13:44 2015) Listing produced at : Tue Nov 17 08:14:16 2015 Coverage view : As instrumented MONITORED SOURCE FILE : prime.c INSTRUMENTATION MODE : multicondition HITS/TRUE FALSE LINE DESCRIPTION =============================================================================
77

1 8 FUNCTION main() 3 1 12 while (( prime_candidate = io_ask ( ) ) > 0) 2 1 14 if (is_prime ( prime_candidate )) 15 }+ 16 else 17 }+ 18 }+ 1 19 return 0 20 } ***TER 100 % ( 6/ 6) of FUNCTION main() 100 % ( 6/ 6) statement ----------------------------------------------------------------------------- ***TER 100 % ( 6/ 6) of FILE prime.c 100 % ( 6/ 6) statement ----------------------------------------------------------------------------- MONITORED SOURCE FILE : io.c INSTRUMENTATION MODE : multicondition HITS/TRUE FALSE LINE DESCRIPTION ============================================================================= 4 5 FUNCTION io_ask() 0 4 - 11 if (( amount = scanf ( "%u" , & val ) ) <= 0) 13 }+ 4 14 return val 15 } ***TER 75 % ( 3/ 4) of FUNCTION io_ask() 83 % ( 5/ 6) statement ----------------------------------------------------------------------------- 3 18 FUNCTION io_report() 3 21 } ***TER 100 % ( 2/ 2) of FUNCTION io_report() 100 % ( 1/ 1) statement ----------------------------------------------------------------------------- ***TER 83 % ( 5/ 6) of FILE io.c 86 % ( 6/ 7) statement ----------------------------------------------------------------------------- MONITORED SOURCE FILE : calc.c INSTRUMENTATION MODE : multicondition HITS/TRUE FALSE LINE DESCRIPTION ============================================================================= 3 4 FUNCTION is_prime() 1 2 8 if (val == 1 || val == 2 || val == 3) 0 - 8 1: T || _ || _ 1 8 2: F || T || _ 0 - 8 3: F || F || T 2 8 4: F || F || F 1 9 return 1
78

9 }+ 1 1 10 if (val % 2 == 0) 1 11 return 0 11 }+ 0 1 - 12 for (;divisor < val / 2;) 0 0 - 14 if (val % divisor == 0) 0 - 15 return 0 15 }- 16 }+ 1 17 return 1 18 } ***TER 65 % ( 11/ 17) of FUNCTION is_prime() 82 % ( 9/ 11) statement ----------------------------------------------------------------------------- ***TER 65 % ( 11/ 17) of FILE calc.c 82 % ( 9/ 11) statement ----------------------------------------------------------------------------- SUMMARY ======= Source files : 3 Headers extracted : 0 Source lines : 59 Measurement points : 27 TER : 76 % (22/29) multicondition TER : 88 % (21/24) statement
The listing header tells that it was produced based on one symbolfile (MON.sym) and one datafile (MON.dat). The associated dates tell when these files were last modified.
The coverage view is "As instrumented". It means that no –ff, -fd, -fc, or -fmcdc options were given, i.e. the coverage data in the listing is not forced to some lower (structural) coverage view from that of the instrumentation. More of coverage views later.
The listing is not restricted in any way by the -f or -nf options. So all the files (prime.c, calc.c and io.c) that were known in MON.sym are reported in the listing. If the listing had been restricted with -f or -nf options, the chosen/unchosen files or their wildcards would have been mentioned in the listing header block and coverage of only the selected files would have been shown.
The listing contains a section of each instrumented file and overall summary section at the end of the listing. Each file section contains a section of each instrumented function and a file summary line. Each function section contains the detailed execution profile information (detailness depends on what instrumentation mode the file was instrumented with) and a function summary line.
79
Values in HITS/TRUE and FALSE columns are execution counters. LINE column tells the source file line number, where the probe for the execution counter(s) are. DESCRIPTION column tells what there is at that line in the source file.
Interpretation of the counters depend on what there is at source code. For example in file prime.c on line 8 we can see that function ‘main’ was called once and on line 19 a ‘return’ was also executed once. From line 12 we see that the ‘while’ was evaluated 3 times to true and once to false.
On line 16 there is ‘else’. It has no probe, but it is displayed so that the control structure nesting would be clearly understood from the listing. We can conclude from the previous ‘if’ (how many times it was evaluated to false) how many times the ‘else’ branch was entered.
On lines 15, 17 and 18 there is ”}+”. In the actual source file on lines 15 and 17 there is no ‘}’. But there could be, and logically at the end of those lines the “then-part” and “else-part” ends. The “}+” marking here means that program control had entered to the code after the ‘}’ (either was the ‘}’ in the source code or not). Later, in file calc.c, there is example of ”}-”. It is a marking that program control had not entered to the code after the exact point of ‘}’.
The “}+” and “}-“ descriptions help the later ctc2html step to make the line coverage color painting correctly in the HTML report.
Function ‘main’ ends on line 20. It has no probe, because the closing ‘}’ cannot be executed. Only with ‘void’ functions, and where according to ctc’s analysis the end-‘}’ can be executed, ctc puts a probe to function’s end-‘}’. In file io.c on function ‘io_report’ on line 21 there is an example of this.
In file io.c on line 11 there is an ‘if’, which was never evaluated to true. In code coverage sense it is insufficient testing. Such points are marked with ‘-‘ in the listing.
In file calc.c on line 8 there is an ‘if’, which has || or && operators. Because the instrumentation was with multicondition coverage, there is a detailed analysis of the evaluation alternatives of the condition expression. We can see that only 2 (1st and 4th) of them were executed, giving however the overall decision true and false outcomes allright. But evaluation alternatives 1 and 3 were not executed at all. They are shortages in testing in multicondition coverage sense and have ‘-‘ marking.
At each function there are two TER lines. The first is the primary (structural or control structure coverage) test effectiveness ratio of the function, i.e. percent how many > 0 counters there was divided by the total number of counters.
80

The second TER line is statement coverage TER. ctcpost calculates it based on its analysis what brances in the function have been executed and how many statements their execution counted for.
In TER percent calculation a 0.5 rounding is used. Except for getting 100%, really all has to be covered, and for getting 0%, nothing at all is covered.
The function TER values are summed up to file level, e.g. on file io.c structural is 83% and statement 86%. .
At the end of the report there is overall summary.
“Source files” tells how many code actual file this report contained, here 3.
“Headers extracted” tells how many included header files these source files had, and which have been “pulled out” from their code files and reported as their own file entities, here 0. Reporting of header files is discussed more in chapter “7.5.3 - Included files”.
“Source lines” tells the number of lines contained in the code files actually compiled, here 59. If the codes files had included other files, whose code was instrumented or not, the lines from the included files are not included in the “Source lines” count.
“Measurement points” tells how many probes there really are in the reported files, here 27. When multicondition instrumented code is involved, or when the coverage view is forced to lower than actual instrumentation, the “Measurement points” value can be different than the divisor, which is used in TER calculation.
The first summary TER line is overall structural coverage percent, here 76%.
The second summary TER line is overall statement coverage percent, here 88%. If on some of the functions statement coverage could not be calculated, e.g. the function was instrumented for function coverage only or #pragma CTC SKIP… ENDSKIP was used inside the function, the line is added with remark “(N.A. for n functions)”.
7.5.2 Coverage views
In coverage sense, the source files can be instrumented for multicondition coverage, for decision coverage or for function coverage. Coverage view is related on how the coverage is displayed in the report and how the TER is calculated. ctcpost can be asked to display the coverage data in a lower coverage mode, where possible, than the files have actually been instrumented with. For example it may be that you need to report and obtain only full, or high enough, decision coverage, but you anyway have the code instrumented with multicondition coverage.
81
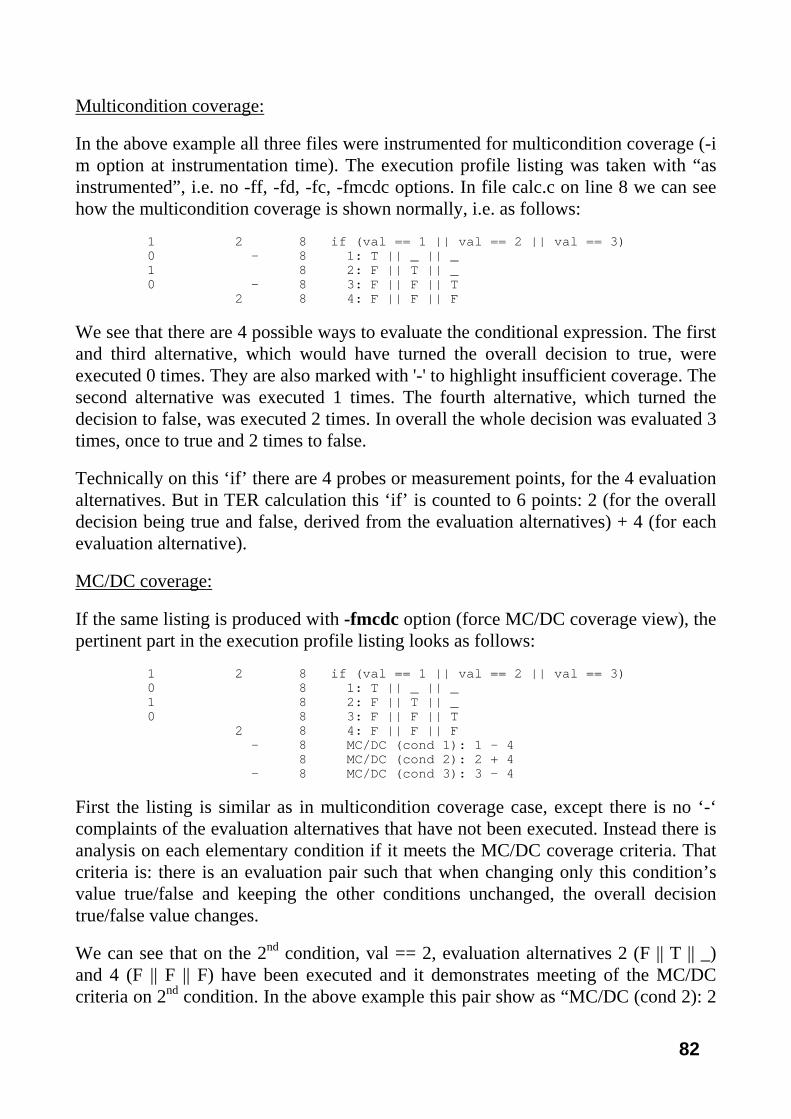
Multicondition coverage:
In the above example all three files were instrumented for multicondition coverage (-i m option at instrumentation time). The execution profile listing was taken with “as instrumented”, i.e. no -ff, -fd, -fc, -fmcdc options. In file calc.c on line 8 we can see how the multicondition coverage is shown normally, i.e. as follows:
1 2 8 if (val == 1 || val == 2 || val == 3) 0 - 8 1: T || _ || _ 1 8 2: F || T || _ 0 - 8 3: F || F || T 2 8 4: F || F || F
We see that there are 4 possible ways to evaluate the conditional expression. The first and third alternative, which would have turned the overall decision to true, were executed 0 times. They are also marked with '-' to highlight insufficient coverage. The second alternative was executed 1 times. The fourth alternative, which turned the decision to false, was executed 2 times. In overall the whole decision was evaluated 3 times, once to true and 2 times to false.
Technically on this ‘if’ there are 4 probes or measurement points, for the 4 evaluation alternatives. But in TER calculation this ‘if’ is counted to 6 points: 2 (for the overall decision being true and false, derived from the evaluation alternatives) + 4 (for each evaluation alternative).
MC/DC coverage:
If the same listing is produced with -fmcdc option (force MC/DC coverage view), the pertinent part in the execution profile listing looks as follows:
1 2 8 if (val == 1 || val == 2 || val == 3) 0 8 1: T || _ || _ 1 8 2: F || T || _ 0 8 3: F || F || T 2 8 4: F || F || F - 8 MC/DC (cond 1): 1 - 4 8 MC/DC (cond 2): 2 + 4 - 8 MC/DC (cond 3): 3 – 4
First the listing is similar as in multicondition coverage case, except there is no ‘-‘ complaints of the evaluation alternatives that have not been executed. Instead there is analysis on each elementary condition if it meets the MC/DC coverage criteria. That criteria is: there is an evaluation pair such that when changing only this condition’s value true/false and keeping the other conditions unchanged, the overall decision true/false value changes.
We can see that on the 2nd condition, val == 2, evaluation alternatives 2 (F || T || _) and 4 (F || F || F) have been executed and it demonstrates meeting of the MC/DC criteria on 2nd condition. In the above example this pair show as “MC/DC (cond 2): 2
82
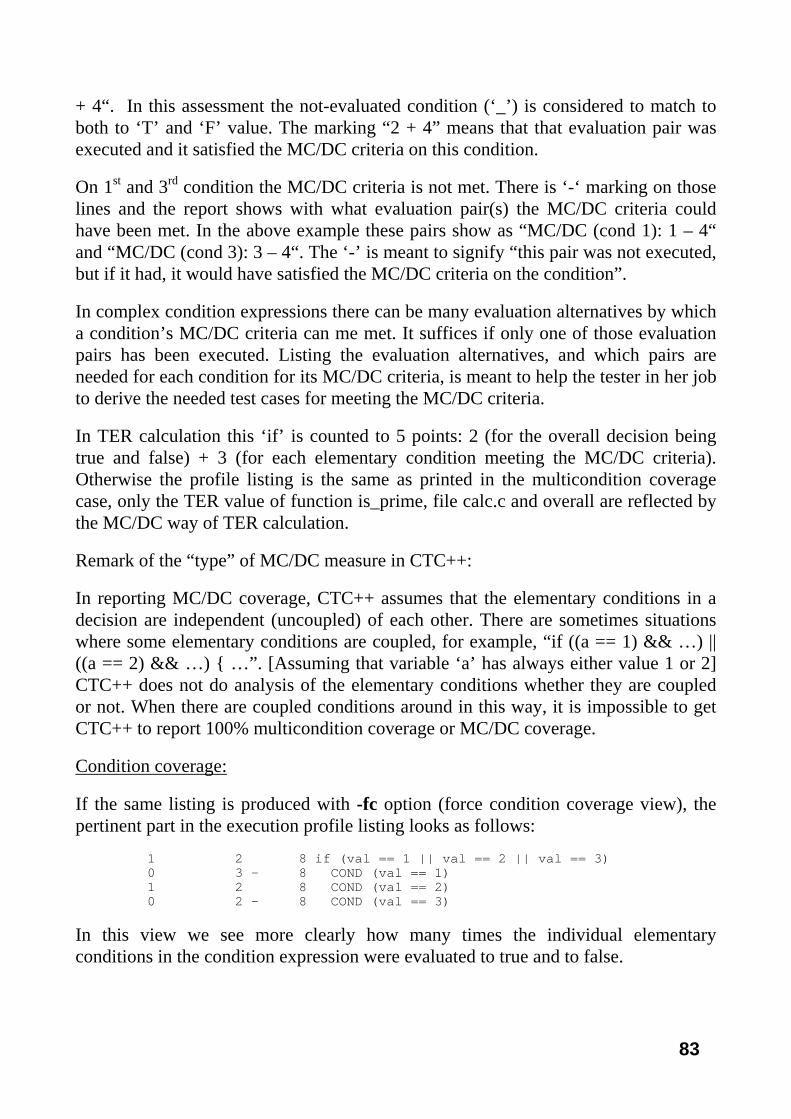
+ 4“. In this assessment the not-evaluated condition (‘_’) is considered to match to both to ‘T’ and ‘F’ value. The marking “2 + 4” means that that evaluation pair was executed and it satisfied the MC/DC criteria on this condition.
On 1st and 3rd condition the MC/DC criteria is not met. There is ‘-‘ marking on those lines and the report shows with what evaluation pair(s) the MC/DC criteria could have been met. In the above example these pairs show as “MC/DC (cond 1): 1 – 4“ and “MC/DC (cond 3): 3 – 4“. The ‘-’ is meant to signify “this pair was not executed, but if it had, it would have satisfied the MC/DC criteria on the condition”.
In complex condition expressions there can be many evaluation alternatives by which a condition’s MC/DC criteria can me met. It suffices if only one of those evaluation pairs has been executed. Listing the evaluation alternatives, and which pairs are needed for each condition for its MC/DC criteria, is meant to help the tester in her job to derive the needed test cases for meeting the MC/DC criteria.
In TER calculation this ‘if’ is counted to 5 points: 2 (for the overall decision being true and false) + 3 (for each elementary condition meeting the MC/DC criteria). Otherwise the profile listing is the same as printed in the multicondition coverage case, only the TER value of function is_prime, file calc.c and overall are reflected by the MC/DC way of TER calculation.
Remark of the “type” of MC/DC measure in CTC++:
In reporting MC/DC coverage, CTC++ assumes that the elementary conditions in a decision are independent (uncoupled) of each other. There are sometimes situations where some elementary conditions are coupled, for example, “if ((a == 1) && …) || ((a == 2) && …) { …”. [Assuming that variable ‘a’ has always either value 1 or 2] CTC++ does not do analysis of the elementary conditions whether they are coupled or not. When there are coupled conditions around in this way, it is impossible to get CTC++ to report 100% multicondition coverage or MC/DC coverage.
Condition coverage:
If the same listing is produced with -fc option (force condition coverage view), the pertinent part in the execution profile listing looks as follows:
1 2 8 if (val == 1 || val == 2 || val == 3) 0 3 - 8 COND (val == 1) 1 2 8 COND (val == 2) 0 2 - 8 COND (val == 3)
In this view we see more clearly how many times the individual elementary conditions in the condition expression were evaluated to true and to false.
83

In TER calculation this ‘if’ is counted to 8 points: 2 (for the overall decision being true and false) + 6 (for each 3 elementary conditions being true and false). Otherwise the profile listing is the same as printed in the multicondition coverage case, only the TER value of function is_prime, file calc.c and overall are reflected by the condition coverage way of TER calculation.
In literature, CTC++’s “condition coverage” is commonly called “condition/decision coverage”.
Decision coverage:
If the same listing is produced with -fd (force decision coverage view) option, the pertinent part in the execution profile listing looks as follows:
1 2 8 if (val == 1 || val == 2 || val == 3)
In TER calculation this ‘if’ is counted to 2 points (just for the overall decision being true and false). Otherwise the profile listing is the same as printed in the multicondition coverage case, only the TER value of function is_prime, file calc.c and overall are reflected by the decision coverage way of TER calculation.
Function coverage:
Lastly, if the same listing is produced with –ff (force function coverage view) option, the whole Execution Profile Listing in function coverage view looks as follows:
***************************************************************************** * CTC++, Test Coverage Analyzer for C/C++, Version 8.0 * * * * EXECUTION PROFILE LISTING * * * * Copyright (c) 1993-2013 Testwell Oy * * Copyright (c) 2013-2015 Verifysoft Technology GmbH * ***************************************************************************** Symbol file(s) used : MON.sym (Tue Nov 17 08:13:14 2015) Data file(s) used : MON.dat (Tue Nov 17 08:13:44 2015) Listing produced at : Tue Nov 17 08:22:29 2015 Coverage view : Reduced to function coverage MONITORED SOURCE FILE : prime.c INSTRUMENTATION MODE : multicondition HITS/TRUE FALSE LINE DESCRIPTION ============================================================================= 1 8 FUNCTION main() ***TER 100 % ( 1/ 1) of FILE prime.c 100 % ( 6/ 6) statement -----------------------------------------------------------------------------
84

MONITORED SOURCE FILE : io.c INSTRUMENTATION MODE : multicondition HITS/TRUE FALSE LINE DESCRIPTION ============================================================================= 4 5 FUNCTION io_ask() 3 18 FUNCTION io_report() ***TER 100 % ( 2/ 2) of FILE io.c 86 % ( 6/ 7) statement ----------------------------------------------------------------------------- MONITORED SOURCE FILE : calc.c INSTRUMENTATION MODE : multicondition HITS/TRUE FALSE LINE DESCRIPTION ============================================================================= 3 4 FUNCTION is_prime() ***TER 100 % ( 1/ 1) of FILE calc.c 82 % ( 9/ 11) statement ----------------------------------------------------------------------------- SUMMARY ======= Source files : 3 Headers extracted : 0 Source lines : 59 Measurement points : 27 TER : 100 % (4/4) function TER : 88 % (21/24) statement
There is only one line of each function telling how many times the function was called. In TER calculation each function is one point. Function coverage is met if the function is called at least once.
In the listing at file level and in overall summary there are TER lines on statement coverage. Because, in this example, the files anyway were instrumented at least for decision coverage, it has been possible to calculate the statement coverage TER. If the files had been instrumented only for function coverage, statement coverage TER could not be calculated, and on it there would show “100 % (0 / 0) statement (N.A. for n functions)”.
7.5.3 Included files
Executable code can reside in a file (here header.h) , which is included to a file (here file1.cpp), which is actually compiled. Such included file can bring small code
85

snippet inside some function in the file1.cpp, or it can bring complete functions to file1.cpp’s “translation unit”. By default settings ctc does not instrument code coming from included files, but you can request that ctc instruments such code (of the included files you specify).
Understand also that here we are not talking of a situation where the included file has macro definitions, which escalate by a “macro call” to executable code in the caller file context. Such code is instrumented in the “caller file” regardless if the header file is instrumented or not.
If the included (instrumented) file (assume snippet.inc) brings code code inside some function in the file1.cpp, it is reported in that function. Then, for example in the report there could be:
... MONITORED SOURCE FILE : file1.cpp ... 5 40 FUNCTION foo() 0 5 - 44 if (a > 5) 48 }+ 48 else #line 1 “possible\path\to\snippet.inc” 5 2 6 if (a > 10) 10 }+ #line 50 “file1.cpp” 52 }+ 55 } ...
The “possible\path\to\” portion in the #line directive is how C-preprocessor has named the included file. It may vary depending by the compiler, or by the used compiler options.
A more useful example is where we have a header file, which is included to one or more code files. The next example is by no means realistic, it just demonstrates ctcpost behavior here.
Assume we have header in file “header.h”:
template <class T> class C { public: int foo(T i) { if (i > 5) { return 10; } return 20; } };
Then we have file1.cpp:
#include "header.h" int bar(); int main() {
86
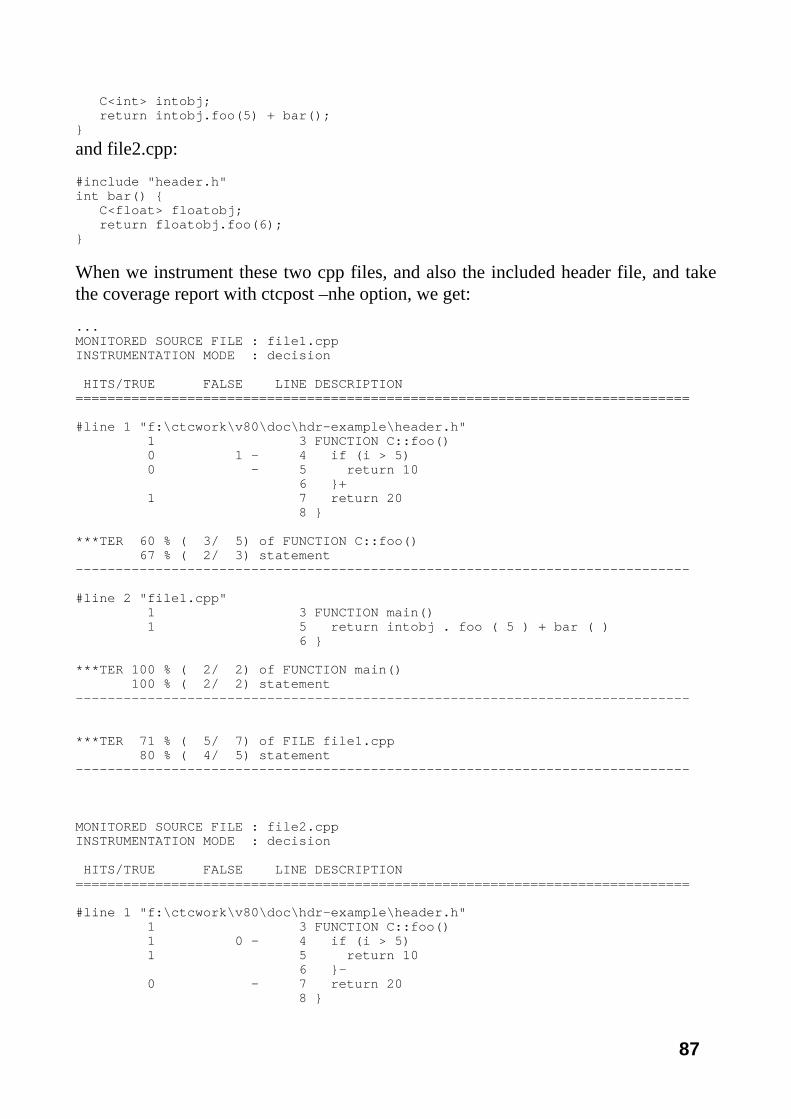
C<int> intobj; return intobj.foo(5) + bar(); }
and file2.cpp:
#include "header.h" int bar() { C<float> floatobj; return floatobj.foo(6); }
When we instrument these two cpp files, and also the included header file, and take the coverage report with ctcpost –nhe option, we get:
... MONITORED SOURCE FILE : file1.cpp INSTRUMENTATION MODE : decision HITS/TRUE FALSE LINE DESCRIPTION ============================================================================= #line 1 "f:\ctcwork\v80\doc\hdr-example\header.h" 1 3 FUNCTION C::foo() 0 1 - 4 if (i > 5) 0 - 5 return 10 6 }+ 1 7 return 20 8 } ***TER 60 % ( 3/ 5) of FUNCTION C::foo() 67 % ( 2/ 3) statement ----------------------------------------------------------------------------- #line 2 "file1.cpp" 1 3 FUNCTION main() 1 5 return intobj . foo ( 5 ) + bar ( ) 6 } ***TER 100 % ( 2/ 2) of FUNCTION main() 100 % ( 2/ 2) statement ----------------------------------------------------------------------------- ***TER 71 % ( 5/ 7) of FILE file1.cpp 80 % ( 4/ 5) statement ----------------------------------------------------------------------------- MONITORED SOURCE FILE : file2.cpp INSTRUMENTATION MODE : decision HITS/TRUE FALSE LINE DESCRIPTION ============================================================================= #line 1 "f:\ctcwork\v80\doc\hdr-example\header.h" 1 3 FUNCTION C::foo() 1 0 - 4 if (i > 5) 1 5 return 10 6 }- 0 - 7 return 20 8 }
87

***TER 60 % ( 3/ 5) of FUNCTION C::foo() 67 % ( 2/ 3) statement ----------------------------------------------------------------------------- #line 2 "file2.cpp" 1 2 FUNCTION bar() 1 4 return floatobj . foo ( 6 ) 5 } ***TER 100 % ( 2/ 2) of FUNCTION bar() 100 % ( 2/ 2) statement ----------------------------------------------------------------------------- ***TER 71 % ( 5/ 7) of FILE file2.cpp 80 % ( 4/ 5) statement ----------------------------------------------------------------------------- SUMMARY ======= Source files : 2 Headers extracted : 0 Source lines : 11 Measurement points : 14 TER : 71 % (10/14) decision TER : 80 % (8/10) statement
So, the header.h code is both inside file1.cpp and file2.cpp. The coverage hits are as they were obtained from the executions in both of their contexts. The overall TER percents are as shown above.
When we take the report without –nhe option, i.e. the headers are extracted (new feature as of CTC++ v8.0, default behavior), we get the following report:
... MONITORED HEADER FILE : f:\ctcwork\v80\doc\hdr-example\header.h INSTRUMENTATION MODE : decision HITS/TRUE FALSE LINE DESCRIPTION ============================================================================= 2 3 FUNCTION C::foo() 1 1 4 if (i > 5) 1 5 return 10 6 }+ 1 7 return 20 8 } ***TER 100 % ( 5/ 5) of FUNCTION C::foo() 100 % ( 3/ 3) statement ----------------------------------------------------------------------------- ***TER 100 % ( 5/ 5) of FILE f:\ctcwork\v80\doc\hdr-example\header.h 100 % ( 3/ 3) statement -----------------------------------------------------------------------------
88

MONITORED SOURCE FILE : file1.cpp INSTRUMENTATION MODE : decision HITS/TRUE FALSE LINE DESCRIPTION ============================================================================= #include "f:\ctcwork\v80\doc\hdr-example\header.h" 1 3 FUNCTION main() 1 5 return intobj . foo ( 5 ) + bar ( ) 6 } ***TER 100 % ( 2/ 2) of FUNCTION main() 100 % ( 2/ 2) statement ----------------------------------------------------------------------------- ***TER 100 % ( 2/ 2) of FILE file1.cpp 100 % ( 2/ 2) statement ----------------------------------------------------------------------------- MONITORED SOURCE FILE : file2.cpp INSTRUMENTATION MODE : decision HITS/TRUE FALSE LINE DESCRIPTION ============================================================================= #include "f:\ctcwork\v80\doc\hdr-example\header.h" 1 2 FUNCTION bar() 1 4 return floatobj . foo ( 6 ) 5 } ***TER 100 % ( 2/ 2) of FUNCTION bar() 100 % ( 2/ 2) statement ----------------------------------------------------------------------------- ***TER 100 % ( 2/ 2) of FILE file2.cpp 100 % ( 2/ 2) statement ----------------------------------------------------------------------------- SUMMARY ======= Source files : 2 Headers extracted : 1 Source lines : 11 Measurement points : 14 TER : 100 % (9/9) decision TER : 100 % (7/7) statement
Now the header code is extracted from file1.cpp and file2.cpp contexts and reported as its own “MONITORED HEADER FILE” item. In it the execution hits from the two incarnations of this header file are summed up. The code files no more have the header.h file portions. The TER percentages have been recalculated per these three reported files. The summary TERs are better compared if the header.h portions would have remained inside file1.cpp/file2.cpp.
89

There are two motives to extract the headers in the report. Firstly, just to get the header files reported as their own file entities. Secondly, if there are many users for a same header and all of them give execution hits on it, in the report the header is shown only once with execution hits summed up. The net result is also that the summary TER percentages are “better”.
ctcpost accepts to combine a later seen header only if it is exactly similar as the previously seen headers (same file name, same code on same lines, etc.). If a later seen header is different that the previously seen ones, the later seen header is left on its place and it gets reported along with the code file where it is included.
If the included code portion starts from a middle of a function and/or it ends to the middle of a later function, ctcpost does not extract such header (not well-behaving included code portion).
See chapter “12.4.40 - Parameter EXCLUDE, NO_EXCLUDE and NO_INCLUDE” how you can control what header files are instrumented. A header file is instrumented only if the code file where it is included is also instrumented.
7.5.4 Untested Code Listing
The untested listing is like the execution profile listing but only the places where the test coverage is inadequate are listed. An example:
***************************************************************************** * CTC++, Test Coverage Analyzer for C/C++, Version 8.0 * * * * UNTESTED CODE LISTING * * * * Copyright (c) 1993-2013 Testwell Oy * * Copyright (c) 2013-2015 Verifysoft Technology GmbH * ***************************************************************************** Symbol file(s) used : MON.sym (Tue Nov 17 08:13:14 2015) Data file(s) used : MON.dat (Tue Nov 17 08:13:44 2015) Listing produced at : Tue Nov 17 08:23:08 2015 Coverage view : As instrumented MONITORED SOURCE FILE : io.c INSTRUMENTATION MODE : multicondition HITS/TRUE FALSE LINE DESCRIPTION ============================================================================= 4 5 FUNCTION io_ask() 0 4 - 11 if (( amount = scanf ( "%u" , & val ) ) <= 0) -----------------------------------------------------------------------------
90

MONITORED SOURCE FILE : calc.c INSTRUMENTATION MODE : multicondition HITS/TRUE FALSE LINE DESCRIPTION ============================================================================= 3 4 FUNCTION is_prime() 1 2 8 if (val == 1 || val == 2 || val == 3) 0 - 8 1: T || _ || _ 0 - 8 3: F || F || T 0 1 - 12 for (;divisor < val / 2;) 0 0 - 14 if (val % divisor == 0) 0 - 15 return 0 ----------------------------------------------------------------------------- SUMMARY ======= Source files : 3 Headers extracted : 0 Source lines : 59 Measurement points : 27 TER : 76 % (22/29) multicondition TER : 88 % (21/24) statement
7.5.5 Execution Time Listing
The ‘prime’ program example is further worked from previous instrumentation where timing instrumentation was not selected at all. Here we re-instrumented the program with the following command:
ctc -i mte cl –Feprime.exe prime.c io.c calc.c
Multicondition coverage (m) and exclusive timing (te) was selected. During this ctc run there existed the previous MON.sym file in current directory.
One test run was done on the instrumented prime.exe and there existed the previous MON.dat in current directory. Same input as previously (2, 5, 20, 0) was given. In the program’s “Enter a number (0 for stop program):” prompt the input was entered in about 3 seconds, except in one input it was entered in about 7 seconds.
The timing listing looks as follows:
***************************************************************************** * CTC++, Test Coverage Analyzer for C/C++, Version 8.0 * * * * EXECUTION TIME LISTING * * * * Copyright (c) 1993-2013 Testwell Oy * * Copyright (c) 2013-2015 Verifysoft Technology GmbH * *****************************************************************************
91
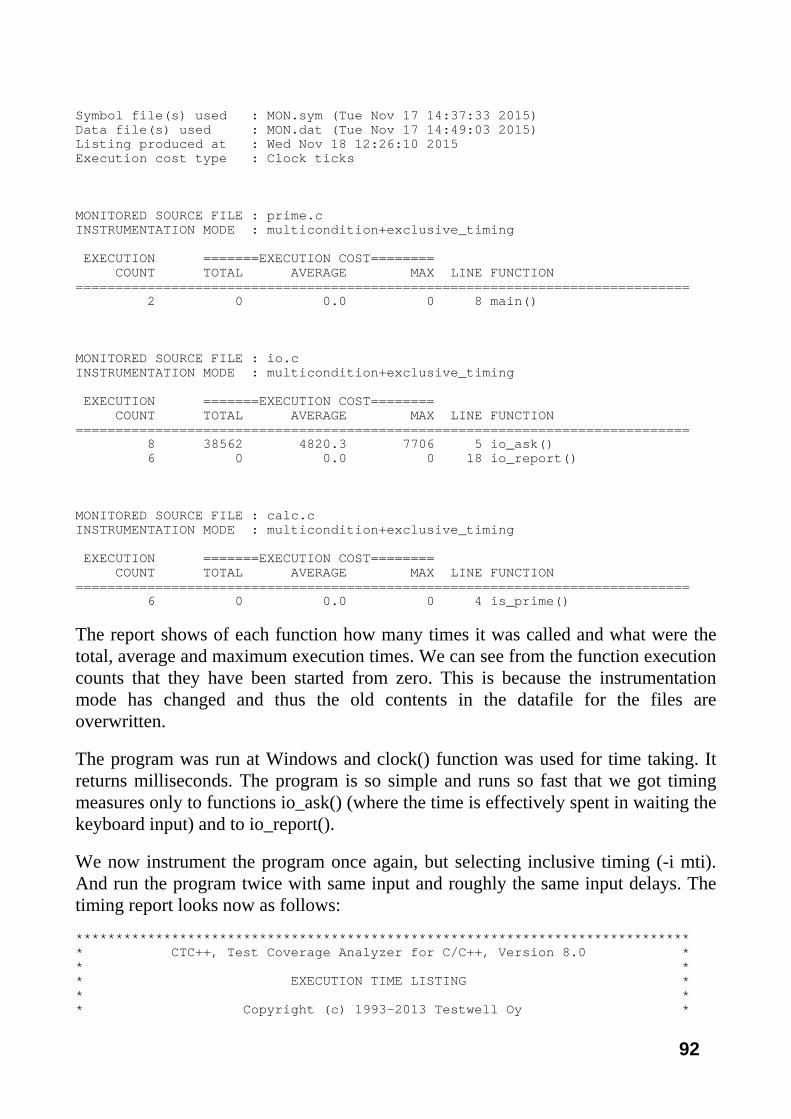
Symbol file(s) used : MON.sym (Tue Nov 17 14:37:33 2015) Data file(s) used : MON.dat (Tue Nov 17 14:49:03 2015) Listing produced at : Wed Nov 18 12:26:10 2015 Execution cost type : Clock ticks MONITORED SOURCE FILE : prime.c INSTRUMENTATION MODE : multicondition+exclusive_timing EXECUTION =======EXECUTION COST======== COUNT TOTAL AVERAGE MAX LINE FUNCTION ============================================================================= 2 0 0.0 0 8 main() MONITORED SOURCE FILE : io.c INSTRUMENTATION MODE : multicondition+exclusive_timing EXECUTION =======EXECUTION COST======== COUNT TOTAL AVERAGE MAX LINE FUNCTION ============================================================================= 8 38562 4820.3 7706 5 io_ask() 6 0 0.0 0 18 io_report() MONITORED SOURCE FILE : calc.c INSTRUMENTATION MODE : multicondition+exclusive_timing EXECUTION =======EXECUTION COST======== COUNT TOTAL AVERAGE MAX LINE FUNCTION ============================================================================= 6 0 0.0 0 4 is_prime()
The report shows of each function how many times it was called and what were the total, average and maximum execution times. We can see from the function execution counts that they have been started from zero. This is because the instrumentation mode has changed and thus the old contents in the datafile for the files are overwritten.
The program was run at Windows and clock() function was used for time taking. It returns milliseconds. The program is so simple and runs so fast that we got timing measures only to functions io_ask() (where the time is effectively spent in waiting the keyboard input) and to io_report().
We now instrument the program once again, but selecting inclusive timing (-i mti). And run the program twice with same input and roughly the same input delays. The timing report looks now as follows:
***************************************************************************** * CTC++, Test Coverage Analyzer for C/C++, Version 8.0 * * * * EXECUTION TIME LISTING * * * * Copyright (c) 1993-2013 Testwell Oy *
92

* Copyright (c) 2013-2015 Verifysoft Technology GmbH * ***************************************************************************** Symbol file(s) used : MON.sym (Wed Nov 18 12:29:50 2015) Data file(s) used : MON.dat (Wed Nov 18 12:30:26 2015) Listing produced at : Wed Nov 18 12:30:53 2015 Execution cost type : Clock ticks MONITORED SOURCE FILE : prime.c INSTRUMENTATION MODE : multicondition+inclusive_timing EXECUTION =======EXECUTION COST======== COUNT TOTAL AVERAGE MAX LINE FUNCTION ============================================================================= 1 19546 19546.0 19546 8 main() MONITORED SOURCE FILE : io.c INSTRUMENTATION MODE : multicondition+inclusive_timing EXECUTION =======EXECUTION COST======== COUNT TOTAL AVERAGE MAX LINE FUNCTION ============================================================================= 4 19546 4886.5 7706 5 io_ask() 3 0 0.0 0 18 io_report() MONITORED SOURCE FILE : calc.c INSTRUMENTATION MODE : multicondition+inclusive_timing EXECUTION =======EXECUTION COST======== COUNT TOTAL AVERAGE MAX LINE FUNCTION ============================================================================= 3 0 0.0 0 4 is_prime()
Because the timing is inclusive here we can see that all the execution times of io_ask() and io_report() is included also in main(), which calls those functions.
7.5.6 XML Form Coverage Report
An example:
<?xml version="1.0" encoding="ISO-8859-1"?> <ctc_xml_report> <header_info> <ctcpost_version>8.0</ctcpost_version> <copyright>Copyright (c) 1993-2013 Testwell Oy</copyright> <copyright>Copyright (c) 2013-2015 Verifysoft Technology GmbH</copyright> <license_notes> </license_notes> <symbolfiles> <symbolfile>
93

<name>MON.sym</name> <modified>Wed Nov 18 12:29:50 2015</modified> </symbolfile> </symbolfiles> <datafiles> <datafile> <name>MON.dat</name> <modified>Wed Nov 18 12:30:26 2015</modified> </datafile> </datafiles> <chosen_source_files> </chosen_source_files> <unchosen_source_files> </unchosen_source_files> <report_generated>Wed Nov 18 12:33:51 2015</report_generated> <requested_coverage_view>As instrumented</requested_coverage_view> <ctcpost_options>-x profile.xml</ctcpost_options> <execution_cost_function>clock</execution_cost_function> <execution_cost_type>Clock ticks</execution_cost_type> <execution_cost_scaling>1</execution_cost_scaling> </header_info> <ctcpost_notices> </ctcpost_notices> ctcxmlm <file name="prime.c"> <file_type>source</file_type> <instrumentation_mode>multicondition+inclusive_timing</instrumentation_mode> <instrumentation_timestamp>Wed Nov 18 12:29:49 2015</instrumentation_timestamp <sym_rewrite_count>2</sym_rewrite_count> <sym_update_count>0</sym_update_count> <data_rewrite_count>2</data_rewrite_count> <data_update_count>0</data_update_count> <function name="main"> <parameters>( void )</parameters> <category>standalone</category> <declared_in_file>prime.c</declared_in_file> <declared_at_line>8</declared_at_line> <defined_in_file>prime.c</defined_in_file> <defined_at_line>8</defined_at_line> <call_count>1</call_count> <total_execution_cost>19546</total_execution_cost> <average_execution_cost>19546.0</average_execution_cost> <max_execution_cost>19546</max_execution_cost> <body> <probe type="function" count1="1" line="8" sc_count="0" nesting="0" descr="FUNCTION main()" /> <probe type="while" count1="3" count2="1" line="12" sc_count="1" nesting="1" descr="while (( prime_candid= io_ask ( ) ) > 0)" /> <probe type="if" count1="2" count2="1" line="14" sc_count="1" nesting="2" descr="if (is_prime ( prime_candidate ))" /> <probe type="block_end" line="15" sc_count="2" nesting="2" exepassed="1" descr="}" /> <probe type="else" line="16" sc_count="2" nesting="2" descr="else" /> <probe type="block_end" line="17" sc_count="3" nesting="2" exepassed="1" descr="}" /> <probe type="block_end" line="18" sc_count="3" nesting="1" exepassed="1" descr="}" /> <probe type="return" count1="1" line="19" sc_count="4" nesting="1" descr="return 0" /> <probe type="function_end_nr" line="20" sc_count="4" nesting="0" descr="}" />
94

</body> <function_summary> <ter>100</ter> <hits>6</hits> <all>6</all> <statement_ter>100</statement_ter> <statement_hits>6</statement_hits> <statement_all>6</statement_all> <statement_available>yes</statement_available> </function_summary> </function> <file_summary> <lines>18</lines> <measurement_points>15</measurement_points> <ter>100</ter> <hits>6</hits> <all>6</all> <statement_ter>100</statement_ter> <statement_hits>6</statement_hits> <statement_all>6</statement_all> <statement_na_functions>0</statement_na_functions> </file_summary> </file> <file name="io.c"> <file_type>source</file_type> <instrumentation_mode>multicondition+inclusive_timing</instrumentation_mode> <instrumentation_timestamp>Wed Nov 18 12:29:50 2015</instrumentation_timestamp <sym_rewrite_count>2</sym_rewrite_count> <sym_update_count>0</sym_update_count> <data_rewrite_count>2</data_rewrite_count> <data_update_count>0</data_update_count> <function name="io_ask"> <parameters>( )</parameters> <category>standalone</category> <declared_in_file>f:\ctcwork\v80\doc\examples\io.h</declared_in_file> <declared_at_line>4</declared_at_line> <defined_in_file>io.c</defined_in_file> <defined_at_line>5</defined_at_line> <call_count>4</call_count> <total_execution_cost>19546</total_execution_cost> <average_execution_cost>4886.5</average_execution_cost> <max_execution_cost>7706</max_execution_cost> <body> <probe type="function" count1="4" line="5" sc_count="0" nesting="0" descr="FUNCTION io_ask()" /> <probe type="if" count1="0" count2="4" alarmed="1" line="11" sc_count="3" nesting="1" descr="if (( amount = scanf "%u" , & val ) ) <= 0)" /> <probe type="block_end" line="13" sc_count="4" nesting="1" exepassed="1" descr="}" /> <probe type="return" count1="4" line="14" sc_count="5" nesting="1" descr="return val" /> <probe type="function_end_nr" line="15" sc_count="5" nesting="0" descr="}" /> </body> <function_summary> <ter>75</ter> <hits>3</hits> <all>4</all> <statement_ter>83</statement_ter> <statement_hits>5</statement_hits> <statement_all>6</statement_all> <statement_available>yes</statement_available> </function_summary>
95
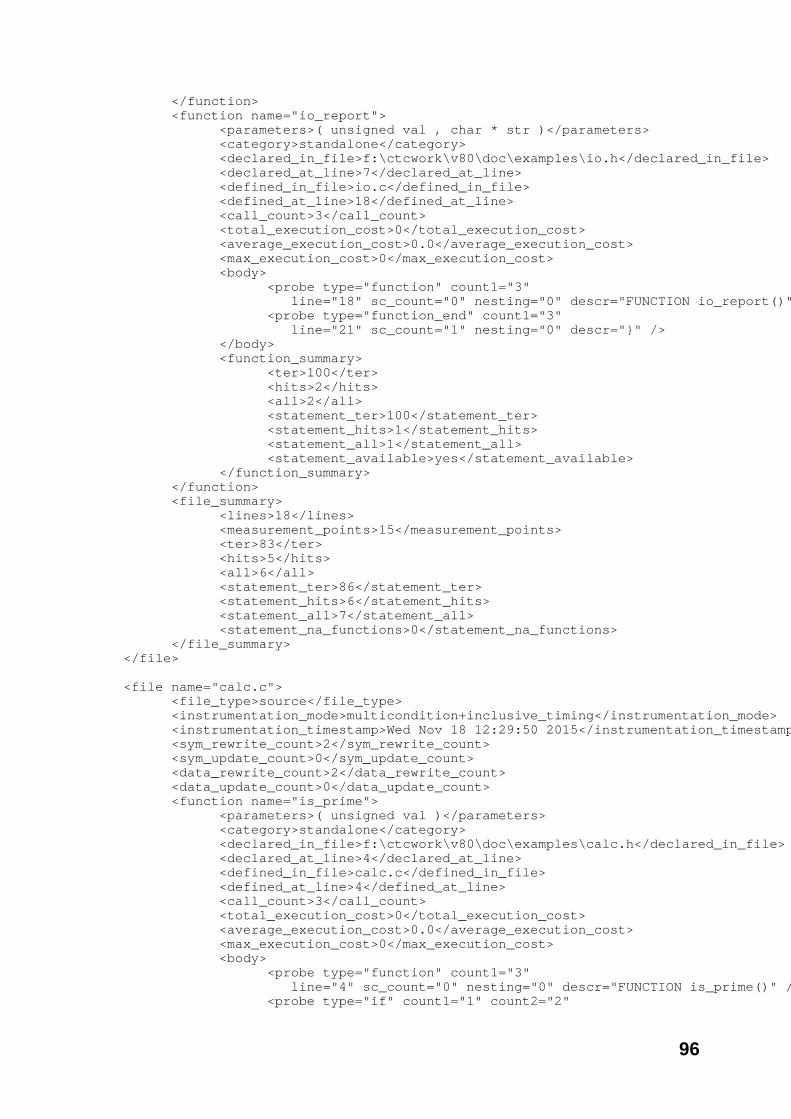
</function> <function name="io_report"> <parameters>( unsigned val , char * str )</parameters> <category>standalone</category> <declared_in_file>f:\ctcwork\v80\doc\examples\io.h</declared_in_file> <declared_at_line>7</declared_at_line> <defined_in_file>io.c</defined_in_file> <defined_at_line>18</defined_at_line> <call_count>3</call_count> <total_execution_cost>0</total_execution_cost> <average_execution_cost>0.0</average_execution_cost> <max_execution_cost>0</max_execution_cost> <body> <probe type="function" count1="3" line="18" sc_count="0" nesting="0" descr="FUNCTION io_report()" <probe type="function_end" count1="3" line="21" sc_count="1" nesting="0" descr="}" /> </body> <function_summary> <ter>100</ter> <hits>2</hits> <all>2</all> <statement_ter>100</statement_ter> <statement_hits>1</statement_hits> <statement_all>1</statement_all> <statement_available>yes</statement_available> </function_summary> </function> <file_summary> <lines>18</lines> <measurement_points>15</measurement_points> <ter>83</ter> <hits>5</hits> <all>6</all> <statement_ter>86</statement_ter> <statement_hits>6</statement_hits> <statement_all>7</statement_all> <statement_na_functions>0</statement_na_functions> </file_summary> </file> <file name="calc.c"> <file_type>source</file_type> <instrumentation_mode>multicondition+inclusive_timing</instrumentation_mode> <instrumentation_timestamp>Wed Nov 18 12:29:50 2015</instrumentation_timestamp <sym_rewrite_count>2</sym_rewrite_count> <sym_update_count>0</sym_update_count> <data_rewrite_count>2</data_rewrite_count> <data_update_count>0</data_update_count> <function name="is_prime"> <parameters>( unsigned val )</parameters> <category>standalone</category> <declared_in_file>f:\ctcwork\v80\doc\examples\calc.h</declared_in_file> <declared_at_line>4</declared_at_line> <defined_in_file>calc.c</defined_in_file> <defined_at_line>4</defined_at_line> <call_count>3</call_count> <total_execution_cost>0</total_execution_cost> <average_execution_cost>0.0</average_execution_cost> <max_execution_cost>0</max_execution_cost> <body> <probe type="function" count1="3" line="4" sc_count="0" nesting="0" descr="FUNCTION is_prime()" / <probe type="if" count1="1" count2="2"
96

line="8" sc_count="1" nesting="1" descr="if (val == 1 || val ==|| val == 3)" /> <probe type="multi_cond_t" count1="0" alarmed="1" line="8" sc_count="1" nesting="1" eval_no="1" descr="T || _ || /> <probe type="multi_cond_t" count1="1" line="8" sc_count="1" nesting="1" eval_no="2" descr="F || T || /> <probe type="multi_cond_t" count1="0" alarmed="1" line="8" sc_count="1" nesting="1" eval_no="3" descr="F || F || /> <probe type="multi_cond_f" count2="2" line="8" sc_count="1" nesting="1" eval_no="4" descr="F || F || /> <probe type="return" count1="1" line="9" sc_count="2" nesting="2" descr="return 1" /> <probe type="block_end" line="9" sc_count="2" nesting="1" exepassed="1" descr="}" /> <probe type="if" count1="1" count2="1" line="10" sc_count="2" nesting="1" descr="if (val % 2 == 0)" /> <probe type="return" count1="1" line="11" sc_count="3" nesting="2" descr="return 0" /> <probe type="block_end" line="11" sc_count="3" nesting="1" exepassed="1" descr="}" /> <probe type="for" count1="0" count2="1" alarmed="1" line="12" sc_count="5" nesting="1" descr="for (;divisor < va2;)" /> <probe type="if" count1="0" count2="0" alarmed="1" line="14" sc_count="5" nesting="2" descr="if (val % divisor == /> <probe type="return" count1="0" alarmed="1" line="15" sc_count="6" nesting="3" descr="return 0" /> <probe type="block_end" line="15" sc_count="6" nesting="2" exepassed="0" descr="}" /> <probe type="block_end" line="16" sc_count="6" nesting="1" exepassed="1" descr="}" /> <probe type="return" count1="1" line="17" sc_count="7" nesting="1" descr="return 1" /> <probe type="function_end_nr" line="18" sc_count="7" nesting="0" descr="}" /> </body> <function_summary> <ter>65</ter> <hits>11</hits> <all>17</all> <statement_ter>82</statement_ter> <statement_hits>9</statement_hits> <statement_all>11</statement_all> <statement_available>yes</statement_available> </function_summary> </function> <file_summary> <lines>18</lines> <measurement_points>15</measurement_points> <ter>65</ter> <hits>11</hits> <all>17</all> <statement_ter>82</statement_ter> <statement_hits>9</statement_hits> <statement_all>11</statement_all> <statement_na_functions>0</statement_na_functions> </file_summary> </file> <overall_summary>
97
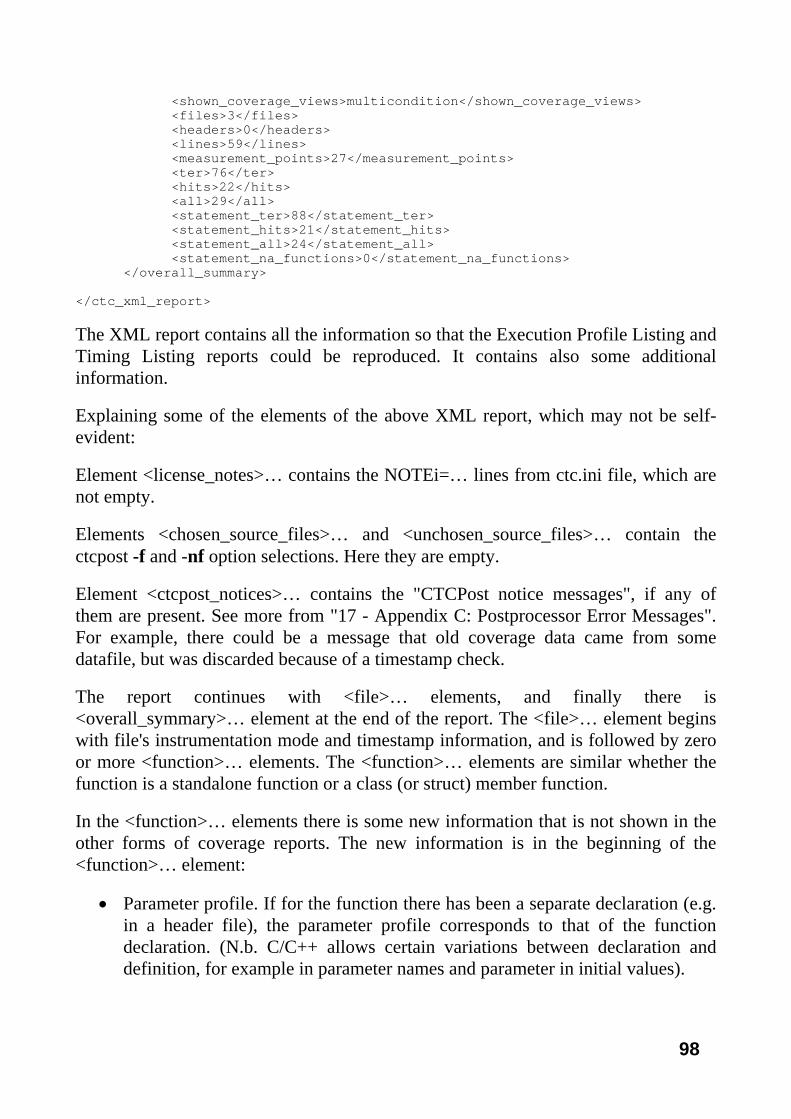
<shown_coverage_views>multicondition</shown_coverage_views> <files>3</files> <headers>0</headers> <lines>59</lines> <measurement_points>27</measurement_points> <ter>76</ter> <hits>22</hits> <all>29</all> <statement_ter>88</statement_ter> <statement_hits>21</statement_hits> <statement_all>24</statement_all> <statement_na_functions>0</statement_na_functions> </overall_summary> </ctc_xml_report>
The XML report contains all the information so that the Execution Profile Listing and Timing Listing reports could be reproduced. It contains also some additional information.
Explaining some of the elements of the above XML report, which may not be self-evident:
Element <license_notes>… contains the NOTEi=… lines from ctc.ini file, which are not empty.
Elements <chosen_source_files>… and <unchosen_source_files>… contain the ctcpost -f and -nf option selections. Here they are empty.
Element <ctcpost_notices>… contains the "CTCPost notice messages", if any of them are present. See more from "17 - Appendix C: Postprocessor Error Messages". For example, there could be a message that old coverage data came from some datafile, but was discarded because of a timestamp check.
The report continues with <file>… elements, and finally there is <overall_symmary>… element at the end of the report. The <file>… element begins with file's instrumentation mode and timestamp information, and is followed by zero or more <function>… elements. The <function>… elements are similar whether the function is a standalone function or a class (or struct) member function.
In the <function>… elements there is some new information that is not shown in the other forms of coverage reports. The new information is in the beginning of the <function>… element:
• Parameter profile. If for the function there has been a separate declaration (e.g. in a header file), the parameter profile corresponds to that of the function declaration. (N.b. C/C++ allows certain variations between declaration and definition, for example in parameter names and parameter in initial values).
98

• The line number where the function definition (body) has been seen (which is in the file whose name is shown in the enclosing <file>… element.)
• The file name and line number where the function declaration was seen, normally the corresponding header file. If the function was seen straight from its definition, the declaration location is the same as the definition location. (N.b. This toy example has been worked up from the same prime.c, io.c and calc.c source files as also the other previous examples. However, for this report, into the io.c and calc.c files there has been added #includes to their own headers. If that had not been done, the mappings to the header files would not be obtained.)
• The <category>… element has possible values standalone, public, private or protected reflecting what kind of function it is.
• The <call_count>… , <total_execution_cost>… , <average_execution_cost>…and <max_execution_cost>… elements reflect the information, which is seen in a Timing Listing (-t option). The timing information is included in the XML report as well. If the file was not instrumented for timing, values in these elements are empty.
The actual execution profile information is in the <body>… element in each <function>… element. When comparing the textual Execution Profile Listing, in this XML report there is one <probe>… element per each essential line of the Execution Profile Listing, with same information contents. However in XML report there is “extra” sc_count=”value”. It is count of ‘;’s or empty compound statements “{}”, which was used in calculating statement coverage TER. After the <body>… element the function summary is shown.
7.5.7 Symbolfile/Datafile Contents Listing
Here the listing has been taken with command
ctcpost –L MON.sym MON.dat
which writes to stdout
***************************************************************************** * CTC++, Test Coverage Analyzer for C/C++, Version 8.0 * * * * CONTENTS OF SYMBOL/DATA FILE LISTING * * * * Copyright (c) 1993-2013 Testwell Oy * * Copyright (c) 2013-2015 Verifysoft Technology GmbH * *****************************************************************************
99

Symbol file(s) used : MON.sym (Wed Nov 18 12:29:50 2015) Data file(s) used : MON.dat (Wed Nov 18 12:30:26 2015) Listing produced at : Wed Nov 18 12:42:29 2015 Instrumentation times and file names in symbol file(s): Wed Nov 18 12:29:49 2015 prime.c counters: F: 1, J: 1, D: 2, C: 0, T: 1, rwr: 2, upd: 0 Wed Nov 18 12:29:50 2015 io.c counters: F: 2, J: 2, D: 1, C: 0, T: 2, rwr: 2, upd: 0 Wed Nov 18 12:29:50 2015 calc.c counters: F: 1, J: 4, D: 3, C: 4, T: 1, rwr: 2, upd: 0 Source files: 3 Instrumentation times and file names in data file(s): Wed Nov 18 12:29:49 2015 prime.c counters: F: 1, J: 1, D: 2, C: 0, T: 1, rwr: 2, upd: 0 Wed Nov 18 12:29:50 2015 io.c counters: F: 2, J: 2, D: 1, C: 0, T: 2, rwr: 2, upd: 0 Wed Nov 18 12:29:50 2015 calc.c counters: F: 1, J: 4, D: 3, C: 4, T: 1, rwr: 2, upd: 0 Source files: 3
Here the listing has been taken from both MON.sym and MON.dat. It could have been taken also separately from each of them.
Of each instrumented source file that is known in the input symbolfiles and datafiles it is listed: when instrumented (instrumentation timestamp) and name of the instrumented file. If the listing had been taken with -l (small –l), that would be all, But here the listing was taken with -L (big –L), there is another line, which has certain counter vector sizes (F: ~functions, J: ~jumps or single-counter locations in general, D: ~decisions, both true and false vectors, C: multicondition evaluation alternatives) and “rwr” and “upd” fields. They are primarily meant for support.
But the “rwr” and “upd” fields may be useful to normal users in problem cases when trying to understand what has happened to the source files in the symbolfile and datafile.
In symbolfile case the “rwr” field tells how many times the file’s description has been overwritten. I.e. the file has been reinstrumented so that ctc has given to the file new instrumentation timestamp. The “upd” field is always 0 (future reservation).
In datafile case the “rwr” field tells how many times the counter data in the datafile for this source file has been overwritten (started from zero). It happens when the instrumented program has different timestamp for the source file as there is in the datafile for it. The “upd” field tells how many times the counter data for the file has been accumulated. This field starts initially from zero and it is zeroed each time the counter data for the file is overwritten. In the MON.dat case, we see that when the
100

program was last reinstrumented for –i mti and run for the first time, the “rwr:” got value 2 and “upd:” was started from 0. Next run had increased “upd:” to 1.
The listing can be restricted with the -f option(s), for example:
ctcpost -l MON.dat -f "*\dir1\*" -f "*\dir3\*"
101

8. Using ctcxmlmerge Utility
8.1 Introduction
There are two usage situations for which this utility is meant for:
• For combining coverage data of independently instrumented and tested code bases, whose coverage data cannot be combined by normal ctcpost means, and
• for getting the coverage data reported per header files. However, when in CTC++ v8.0 the ctcpost utility got capability to extract headers, sum them up, and report as their own header file entities, this ctcxmlmerge functionality is now of less importance.
The first one is the primary need for this utility. Assume we have a code file, which has conditional compilation like #if(CONF==1)...#elif(CONF==2)...#endif. Or if the file has code like ...if(i == FLAG) {... . And of the code base it has been built two or more variants and (after C preprocessing) ctc has seen the actual code file slightly differently. Even though in the builds and in their corresponding tests separate symbolfiles/datafiles were used, ctcpost refuses to sum up the coverage data of this file, because it considers the file to be different in the symbolfiles. Anyway, the original file is the same, and your company managers may want to see its coverage numbers over all build variants in one report.
The usage idea is that an independent XML form coverage report is generated from each build. Then such XML form coverage reports (one or more) are fed to this utility, which constructs a merged text form Execution Profile Listing. That listing can be further inputted to the ctc2html utility to get a HTML form report.
The primary goal is to get one coverage report, which shows what code locations have been executed/not executed, and based on which the structural TER% has been recalculated (on functions/files/overall).
Also statement coverage is recalculated on functions provided that the functions to be merged are similar (as ctc has seen them).
Assumptions for ctcxmlmerge use are the following:
102
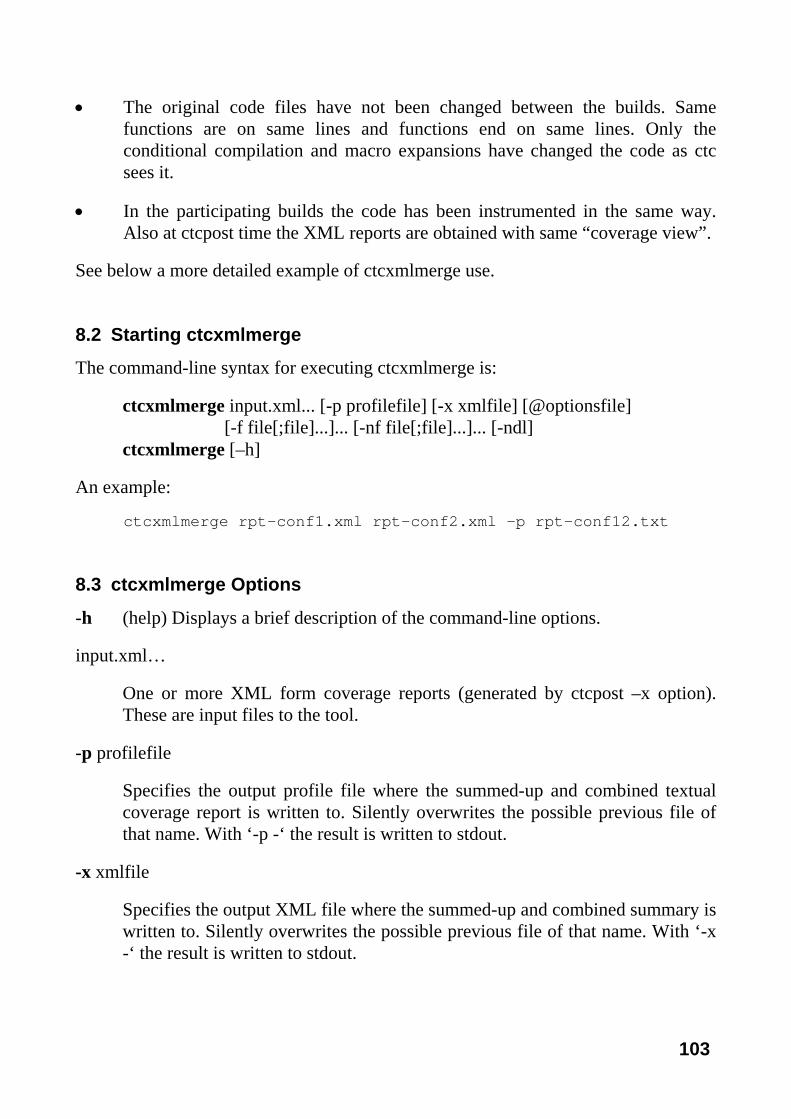
• The original code files have not been changed between the builds. Same functions are on same lines and functions end on same lines. Only the conditional compilation and macro expansions have changed the code as ctc sees it.
• In the participating builds the code has been instrumented in the same way. Also at ctcpost time the XML reports are obtained with same “coverage view”.
See below a more detailed example of ctcxmlmerge use.
8.2 Starting ctcxmlmerge
The command-line syntax for executing ctcxmlmerge is:
ctcxmlmerge input.xml... [-p profilefile] [-x xmlfile] [@optionsfile] [-f file[;file]...]... [-nf file[;file]...]... [-ndl] ctcxmlmerge [–h]
An example:
ctcxmlmerge rpt-conf1.xml rpt-conf2.xml –p rpt-conf12.txt
8.3 ctcxmlmerge Options
-h (help) Displays a brief description of the command-line options.
input.xml…
One or more XML form coverage reports (generated by ctcpost –x option). These are input files to the tool.
-p profilefile
Specifies the output profile file where the summed-up and combined textual coverage report is written to. Silently overwrites the possible previous file of that name. With ‘-p -‘ the result is written to stdout.
-x xmlfile
Specifies the output XML file where the summed-up and combined summary is written to. Silently overwrites the possible previous file of that name. With ‘-x -‘ the result is written to stdout.
103

-f file[;file]… …
Specifies the code files, which only (if appearing in the input) will be included to the output report. Similar behavior as in ctcpost –f option, except this option applies both to the “primary” code files (that are instrumented and compiled) and to the possible #included files, whose coverage data is drawn out from their “primary” code files. If the instrumented header code is extracted already in ctcpost phase (normally?), the header file is treated like a “primary code file”.
The option argument is a list of files, separated by ‘;’. There can be many -f options, in which case their union is meant. The file identification can be a wildcard, only ‘*’s are supported.
In the absence of this option, all code files that are encountered in the inputs are included to the output report.
Example: -f path\xfile5.cpp -f “path\yfile*.cpp”
-nf file[;file]… …
Specifies code files, which will not be included to the output report (if appearing in the input and if otherwise, after applying the possible -f option, would be included). Similar behavior as in ctcpost -nf option, except this option applies both to the “primary” code files (that are instrumented and compiled) and to the possible #included files, whose coverage data is drawn out from their “primary” code files. If the instrumented header code is extracted already in ctcpost phase (normally?), the header file is treated like a “primary code file”.
The option argument is a list of files, separated by ‘;’. There can be many -nf options, in which case their union is meant. The file identification can be a wildcard, only ‘*’s are supported.
In the absence of this option, no file exclusions take place, only the possible –f option file selections.
Example: -f “path\yfile*.cpp” -nf path\yfile6.cpp
-ndl (no drive letter) At Windows, if a source file name in XML inputs would have a drive letter, it is ignored (e.g. “S:\dir\file5.cpp” and “T:\dir\file5.cpp” would mean same file) and in the generated report it is dropped off (shows as “\dir\file5.cpp”). This option is for special usage conventions, where builds (e.g. for different configurations) are done in various places in directory tree,
104
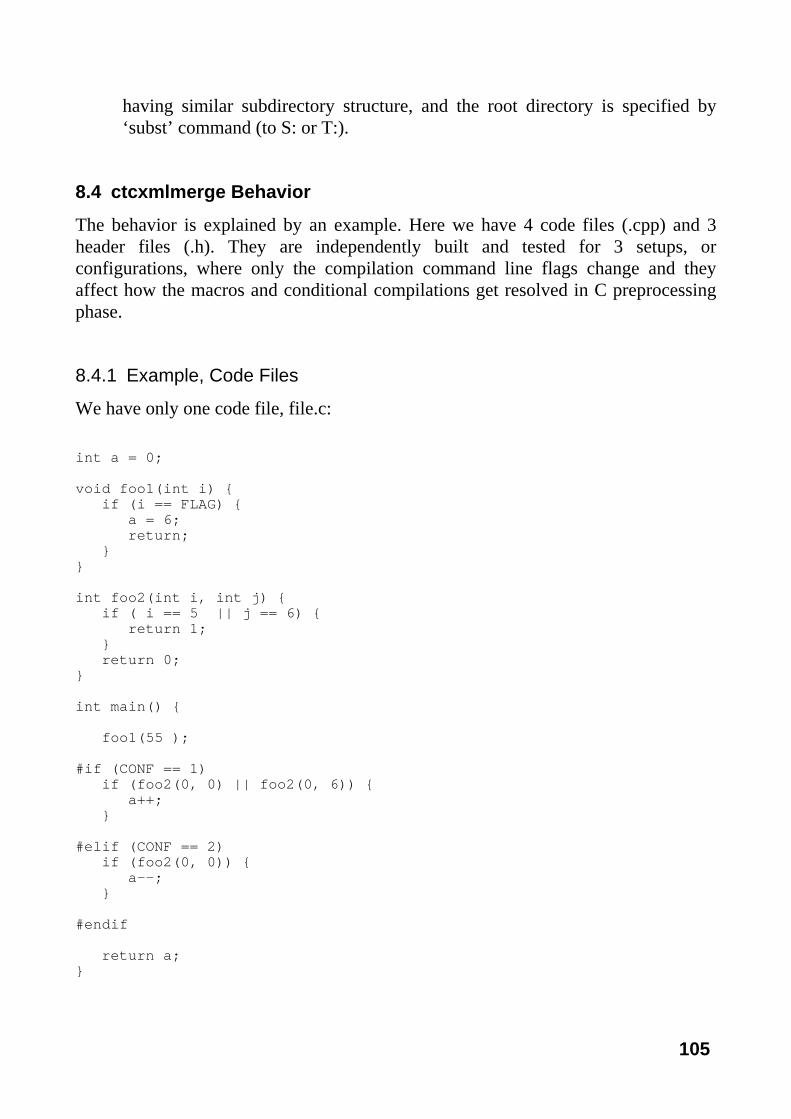
having similar subdirectory structure, and the root directory is specified by ‘subst’ command (to S: or T:).
8.4 ctcxmlmerge Behavior
The behavior is explained by an example. Here we have 4 code files (.cpp) and 3 header files (.h). They are independently built and tested for 3 setups, or configurations, where only the compilation command line flags change and they affect how the macros and conditional compilations get resolved in C preprocessing phase.
8.4.1 Example, Code Files
We have only one code file, file.c:
int a = 0; void foo1(int i) { if (i == FLAG) { a = 6; return; } } int foo2(int i, int j) { if ( i == 5 || j == 6) { return 1; } return 0; } int main() { foo1(55 ); #if (CONF == 1) if (foo2(0, 0) || foo2(0, 6)) { a++; } #elif (CONF == 2) if (foo2(0, 0)) { a--; } #endif return a; }
105
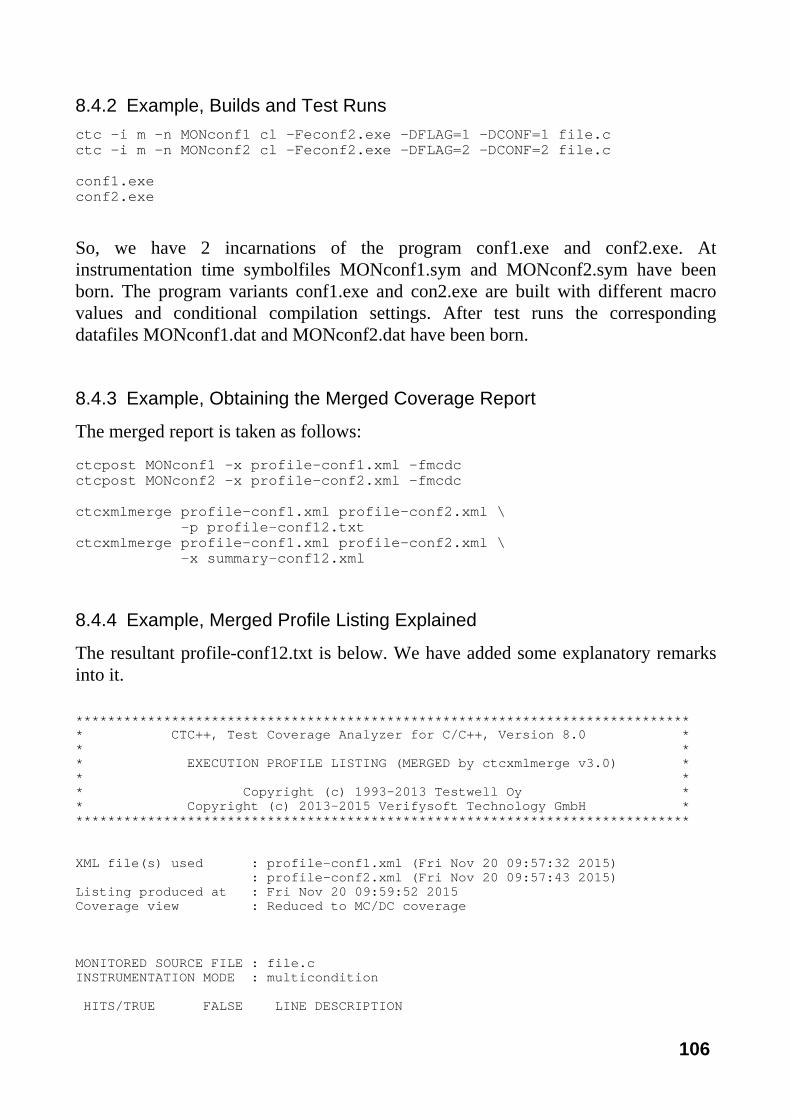
8.4.2 Example, Builds and Test Runs ctc -i m -n MONconf1 cl -Feconf2.exe -DFLAG=1 -DCONF=1 file.c ctc -i m -n MONconf2 cl -Feconf2.exe -DFLAG=2 -DCONF=2 file.c conf1.exe conf2.exe
So, we have 2 incarnations of the program conf1.exe and conf2.exe. At instrumentation time symbolfiles MONconf1.sym and MONconf2.sym have been born. The program variants conf1.exe and con2.exe are built with different macro values and conditional compilation settings. After test runs the corresponding datafiles MONconf1.dat and MONconf2.dat have been born.
8.4.3 Example, Obtaining the Merged Coverage Report
The merged report is taken as follows:
ctcpost MONconf1 -x profile-conf1.xml -fmcdc ctcpost MONconf2 -x profile-conf2.xml -fmcdc ctcxmlmerge profile-conf1.xml profile-conf2.xml \ –p profile-conf12.txt ctcxmlmerge profile-conf1.xml profile-conf2.xml \ –x summary-conf12.xml
8.4.4 Example, Merged Profile Listing Explained
The resultant profile-conf12.txt is below. We have added some explanatory remarks into it. ***************************************************************************** * CTC++, Test Coverage Analyzer for C/C++, Version 8.0 * * * * EXECUTION PROFILE LISTING (MERGED by ctcxmlmerge v3.0) * * * * Copyright (c) 1993-2013 Testwell Oy * * Copyright (c) 2013-2015 Verifysoft Technology GmbH * ***************************************************************************** XML file(s) used : profile-conf1.xml (Fri Nov 20 09:57:32 2015) : profile-conf2.xml (Fri Nov 20 09:57:43 2015) Listing produced at : Fri Nov 20 09:59:52 2015 Coverage view : Reduced to MC/DC coverage MONITORED SOURCE FILE : file.c INSTRUMENTATION MODE : multicondition HITS/TRUE FALSE LINE DESCRIPTION
106

============================================================================= 2 3 FUNCTION foo1() 0 1 - 4 if (i == 1) 0 1 - 4 if (i == 2) 0 - 6 return 7 } 2 8 } ***TER 57 % ( 4/ 7) of FUNCTION foo1() N.A. statement -----------------------------------------------------------------------------
In conf1 build on line 4 there was “if (i == 1)” and in conf2 build “if (i == 2)”, as ctc had seen the code after C-preprocessing. This is a use case where ctcxmlmerge is the only possibility to obtain combined coverage report of these kind of builds.
In the re-caclulated structural coverage TER% both incarnations of the line 4 are independently counted.
Combined statement coverage on this kind of function is doomed to “N.A.”, because execution flow analysis can not be generally done. The function incarnations are just different.
3 10 FUNCTION foo2() 1 2 11 if (i == 5 || j == 6) 0 11 1: T || _ 1 11 2: F || T 2 11 3: F || F - 11 MC/DC (cond 1): 1 – 3 11 MC/DC (cond 2): 2 + 3 1 12 return 1 13 }+ 2 14 return 0 15 } ***TER 86 % ( 6/ 7) of FUNCTION foo2() 100 % ( 3/ 3) statement -----------------------------------------------------------------------------
Function foo2() was same both in conf1 and conf2 builds. Both structural and statement coverage TER% are recalculated. Structural coverage TER% on this function just came better (86%) than when taking the reports separately from conf1 (50%) and from conf2 (43%).
2 17 FUNCTION main() 1 0 - 22 if (foo2 ( 0 , 0 ) || foo2 ( 0 , 6 )) 0 22 1: T || _ 1 22 2: F || T 0 22 3: F || F - 22 MC/DC (cond 1): 1 – 3 - 22 MC/DC (cond 2): 2 – 3 24 } 0 1 - 27 if (foo2 ( 0 , 0 )) 29 } 2 33 return a 34 }
107

***TER 50 % ( 4/ 8) of FUNCTION main() N.A. statement -----------------------------------------------------------------------------
Function main() has conditional compilation. Lines 22-24 are in conf1 build only while lines 27-29 are in conf2 build only. Structural coverage is recalculated. Statement coverage is doomed to “N.A.”.
***TER 64 % ( 14/ 22) of FILE file.c 100 % ( 3/ 3) statement (N.A. for 2 functions) ----------------------------------------------------------------------------- SUMMARY ======= Source files : 1 Headers extracted : 0 Source lines : 34 Measurement points : 20 TER : 64 % (14/22) MC/DC TER : 100 % (3/3) statement (N.A. for 2 functions)
The bottom line summary is as expected. In a more realistic example there would be much more files.
8.4.5 Example, Merged XML Summary
With -x option ctcxmlmerge generates an XML form summary report. It contains the functions/files/overall summary TER informations as they have come after the merge. The summary report does not contain the function internal probes.
In the above example, when taking the report as follows
ctcxmlmerge profile-conf1.xml profile-conf2.xml \ –x summary-conf12.xml
we get XML summary report. It looks as the following:
<?xml version="1.0" encoding="ISO-8859-1"?> <ctc_xmlmerge_report> <header_info> <ctcpost_version>8.0</ctcpost_version> <ctcxmlmerge_version>3.0</ctcxmlmerge_version> <copyright>Copyright (c) 1993-2013 Testwell Oy</copyright> <copyright>Copyright (c) 2013-2015 Verifysoft Technology GmbH</copyright>
108

<xmlfiles> <xmlfile> <name>profile-conf1.xml</name> <generated>Fri Nov 20 09:57:32 2015</generated> </xmlfile> <xmlfile> <name>profile-conf2.xml</name> <generated>Fri Nov 20 09:57:43 2015</generated> </xmlfile> </xmlfiles> <report_generated>Fri Nov 20 10:00:14 2015</report_generated> <requested_coverage_view>Reduced to MC/DC coverage</requested_coverage_view> <ctcxmlmerge_options>profile-conf1.xml profile-conf2.xml -x profile-conf12.xml</ctcxmlmerge_options> <execution_cost_function>clock</execution_cost_function> <execution_cost_type>Clock ticks</execution_cost_type> <execution_cost_scaling>1</execution_cost_scaling> </header_info> <file name="file.c"> <file_type>source</file_type> <instrumentation_mode>multicondition</instrumentation_mode> <function name="foo1"> <defined_at_line>3</defined_at_line> <call_count>2</call_count> <total_execution_cost></total_execution_cost> <average_execution_cost></average_execution_cost> <max_execution_cost></max_execution_cost> <function_summary> <ter>57</ter> <hits>4</hits> <all>7</all> <statement_ter>100</statement_ter> <statement_hits>0</statement_hits> <statement_all>0</statement_all> <statement_available>no</statement_available> </function_summary> </function> <function name="foo2"> <defined_at_line>10</defined_at_line> <call_count>3</call_count> <total_execution_cost></total_execution_cost> <average_execution_cost></average_execution_cost> <max_execution_cost></max_execution_cost> <function_summary> <ter>86</ter> <hits>6</hits> <all>7</all> <statement_ter>100</statement_ter> <statement_hits>3</statement_hits> <statement_all>3</statement_all> <statement_available>yes</statement_available> </function_summary> </function> <function name="main"> <defined_at_line>17</defined_at_line> <call_count>2</call_count> <total_execution_cost></total_execution_cost>
109
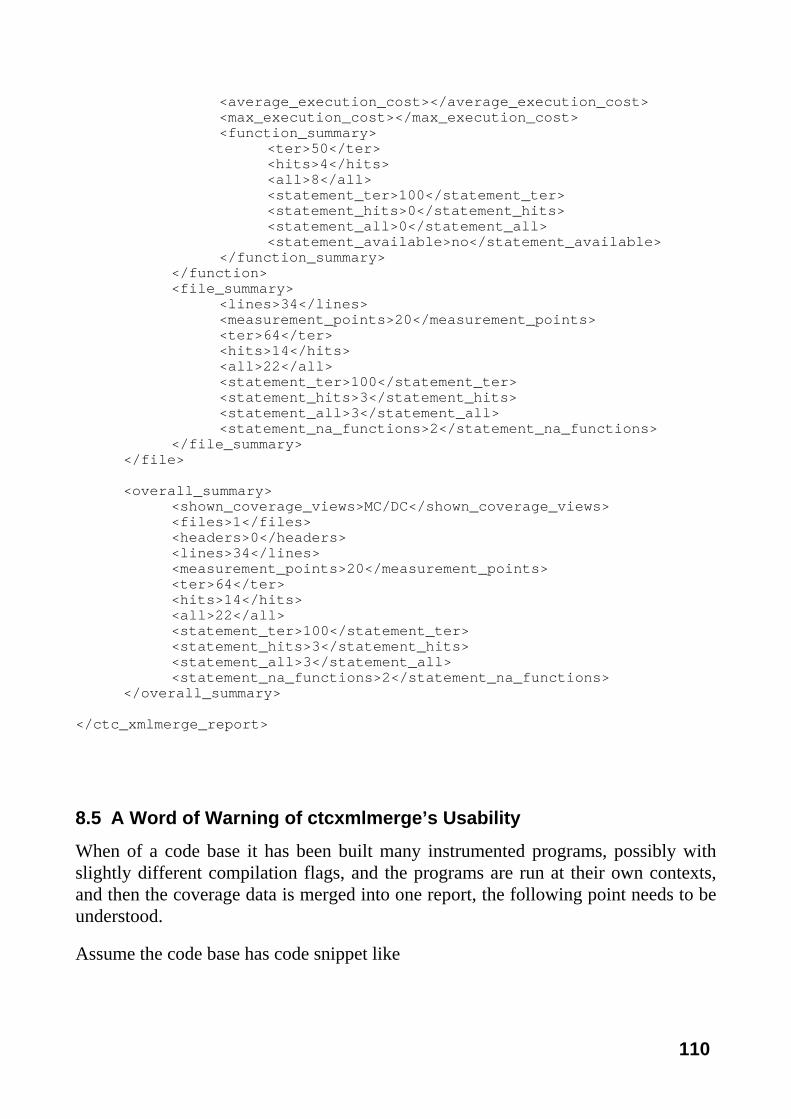
<average_execution_cost></average_execution_cost> <max_execution_cost></max_execution_cost> <function_summary> <ter>50</ter> <hits>4</hits> <all>8</all> <statement_ter>100</statement_ter> <statement_hits>0</statement_hits> <statement_all>0</statement_all> <statement_available>no</statement_available> </function_summary> </function> <file_summary> <lines>34</lines> <measurement_points>20</measurement_points> <ter>64</ter> <hits>14</hits> <all>22</all> <statement_ter>100</statement_ter> <statement_hits>3</statement_hits> <statement_all>3</statement_all> <statement_na_functions>2</statement_na_functions> </file_summary> </file> <overall_summary> <shown_coverage_views>MC/DC</shown_coverage_views> <files>1</files> <headers>0</headers> <lines>34</lines> <measurement_points>20</measurement_points> <ter>64</ter> <hits>14</hits> <all>22</all> <statement_ter>100</statement_ter> <statement_hits>3</statement_hits> <statement_all>3</statement_all> <statement_na_functions>2</statement_na_functions> </overall_summary> </ctc_xmlmerge_report>
8.5 A Word of Warning of ctcxmlmerge’s Usability
When of a code base it has been built many instrumented programs, possibly with slightly different compilation flags, and the programs are run at their own contexts, and then the coverage data is merged into one report, the following point needs to be understood.
Assume the code base has code snippet like
110
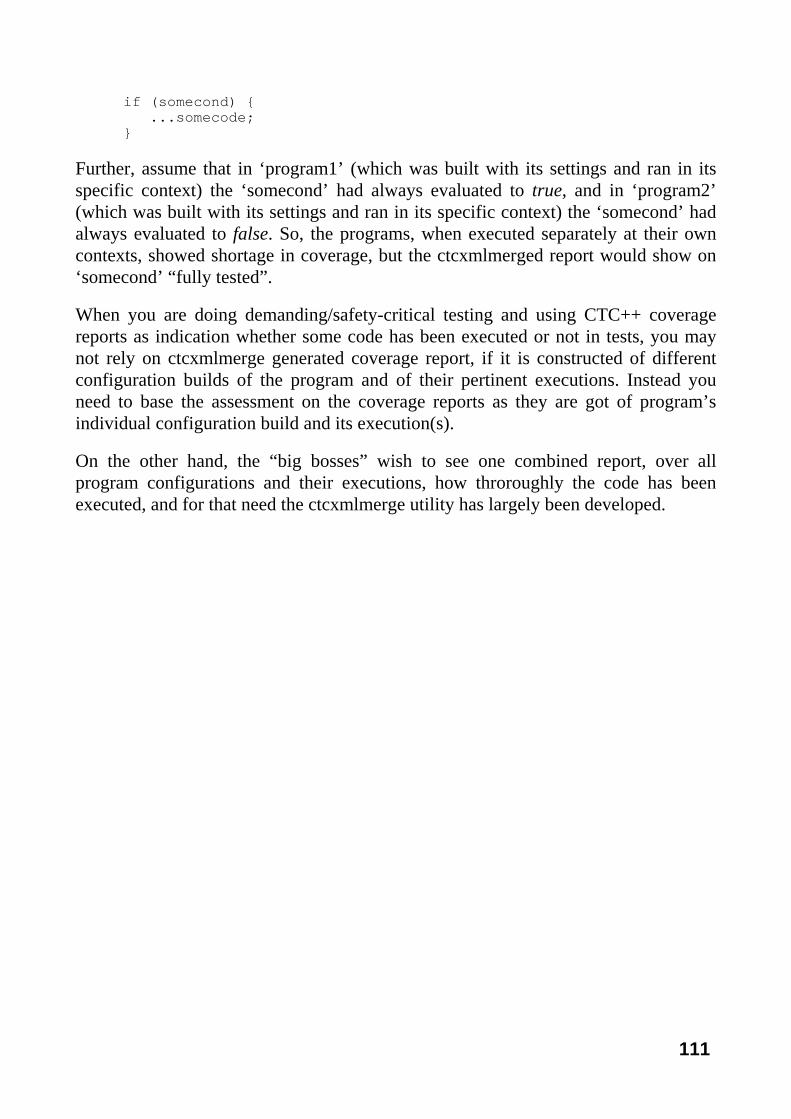
if (somecond) { ...somecode; }
Further, assume that in ‘program1’ (which was built with its settings and ran in its specific context) the ‘somecond’ had always evaluated to true, and in ‘program2’ (which was built with its settings and ran in its specific context) the ‘somecond’ had always evaluated to false. So, the programs, when executed separately at their own contexts, showed shortage in coverage, but the ctcxmlmerged report would show on ‘somecond’ “fully tested”.
When you are doing demanding/safety-critical testing and using CTC++ coverage reports as indication whether some code has been executed or not in tests, you may not rely on ctcxmlmerge generated coverage report, if it is constructed of different configuration builds of the program and of their pertinent executions. Instead you need to base the assessment on the coverage reports as they are got of program’s individual configuration build and its execution(s).
On the other hand, the “big bosses” wish to see one combined report, over all program configurations and their executions, how throroughly the code has been executed, and for that need the ctcxmlmerge utility has largely been developed.
111

9. Using ctc2html Utility
9.1 Introduction
ctc2html, CTC++ to HTML converter, produces a hierarchical and color-coded HTML document based on the textual Execution Profile Listing and on the original source files. The information in the HTML document is presented in sorted order, by directories and by file names.
The HTML document is hierarchical. The top level is Overall Summary. It shows complete listing how, or with what inputs, the input Execution Profile Listing was generated at ctcpost time. It also shows the overall TER% and some other summary information.
The next level is the Directory Summary, which shows the TER% of the directories and the overall TER%.
The next level is the Files Summary, which shows the TER% of the files, grouped and sorted to their directories. The HTML browsing starts from this page.
The next level is the Functions Summary, which shows the TER% of the functions of the files.
The next level is the Untested Code. It contains in one HTML page all the untested code lines.
The lowest and most detailed level is the Execution Profile. In CTC++ v7.3.3 the Execution Profile HTML page was greately rearchitectured and line coverage was added.
This HTML page contains the execution counters of the input Execution Profile Listing and the actual source code in one HTML page per one source file. These HTML pages are linked. If the actual source file could not be found, or if the -no-sources option was used, the Execution Profile page is constructed solely based on the input Execution Profile Listing.
The HTML document contains rich navigation capabilities both in first/previous/next/last direction and in up/down direction.
112
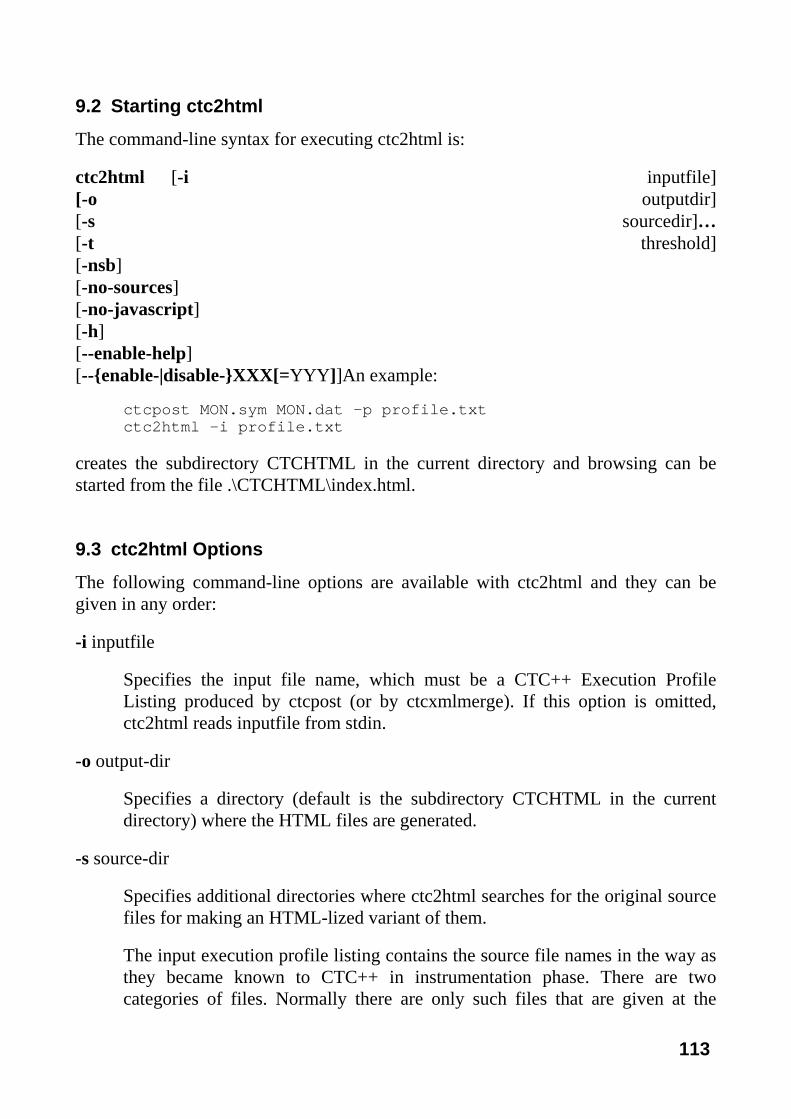
9.2 Starting ctc2html
The command-line syntax for executing ctc2html is:
ctc2html [-i inputfile] [-o outputdir] [-s sourcedir]… [-t threshold] [-nsb] [-no-sources] [-no-javascript] [-h] [--enable-help] [--{enable-|disable-}XXX[=YYY]]An example:
ctcpost MON.sym MON.dat -p profile.txt ctc2html -i profile.txt
creates the subdirectory CTCHTML in the current directory and browsing can be started from the file .\CTCHTML\index.html.
9.3 ctc2html Options
The following command-line options are available with ctc2html and they can be given in any order:
-i inputfile
Specifies the input file name, which must be a CTC++ Execution Profile Listing produced by ctcpost (or by ctcxmlmerge). If this option is omitted, ctc2html reads inputfile from stdin.
-o output-dir
Specifies a directory (default is the subdirectory CTCHTML in the current directory) where the HTML files are generated.
-s source-dir
Specifies additional directories where ctc2html searches for the original source files for making an HTML-lized variant of them.
The input execution profile listing contains the source file names in the way as they became known to CTC++ in instrumentation phase. There are two categories of files. Normally there are only such files that are given at the
113

compilation command line and instrumented, like myfile.cpp. The name of such files is recorded in CTC++ as advised by the ctc.ini configuration file setting SOURCE_IDENTIFICATION, normally it is “as given”. If there is instrumented code coming from an #included file, like myfile.h, the name of such a file is known as determined by the C-preprocessor.
Anyway, these file names are either relative to the directory where the instrumentation was done or absolute. If you are running the ctc2html utility in some other directory, you may need to advise the tool where to look for the source files.
The source file is first looked with the (path and) name as it shows in the input execution profile listing. If that fails, and if -s options(s) are given, two algorithms are tried for finding the source file: 1) The source file name (and its possible path) is catenated to the arguments of the -s options. If the file gets found, we are done. 2) If the file is still not found, the source file name is stripped off from its possible directory path component and tried to be found from the directories given in the -s options.
There can be many -s options. If the source file is not found at all, the HTML report is constructed plainly based on the input execution profile listing description information.
Implicitly, and in addition to the -s options, those directories where the symbolfiles reside are also used for searching the source files.
-t threshold
Sets the threshold percent, which is 100 by default. Untested sections of code and TER-levels not qualifying the specified threshold are highlighted with red color. This threshold-% applies both to structrucal coverage TER and statement coverage TER, unless for statement coverage TER a separate --enable-stmtthreshold=PERCENT is given.
-nsb
(no start browser) At Windows only. By default the PC’s default browser is automatically started on the generated HTML report. This option prevents it.
-no-javascript
With this option you can request that no Javascript is generated among the HTML files. You may want to use this option, if you are using such a browser (or have such setting in it) that it is "allergic" to Javascripts. If you select this
114

option, the only essential change is that at Directory Summary window certain column sorting just does not work.
-no-sources
With this option ctc2html does not draw source code to the HTML report (even if it were found) but constructs the HTML report solely based on the input execution profile listing information.
-li number
Limit Index frame at Execution Profile page to contain only the file names, if Index would become more than number lines. Default is 2000.
-h
Prints a brief description of the command-line options.
--enable-help
Prints a brief description of the advanced --enable-XXX=value command-line options. The current default values (either as the initial hard-coded ones, or the overriding ones that are read from ctc2html.ini file) are shown. The help print is the following: --enable-charset=CHARSET Set charset for HTML content (UTF-8). --enable-stmtthreshold=PERCENT Set stmt.coverage threshold, 0-100 (100). --enable-line_coverage=0/1 Use line coverage bg.color painting (1). --enable-mcdc_highlight=0/1 Enable highlighting of evaluation pairs when pointing MC/DC lines (1). --enable-syntax_highlight=0/1 Enable syntax highlighting of source (1). --enable-statement_coverage=0/1 Show statement coverage information (1). --enable-own_stylesheet=FILE Specify user's own stylesheet file (). --enable-own_javascript=FILE Specify user's own javascript file (). --enable-zoom=NUMBER Zoom the generated HTML font, 0.5-10 (1). --enable-visibility=0/1 Show '#pragma CTC ANNOTATION/COUNT' part (1). --enable-light_untested=0/1 Show only files at Untested Code page (0). --enable-files_reduction=0/1 Reduce shown Symbol/Data/(Un)chosen files (1). --enable-alarmch=CHARACTER Set alarm character (-). --enable-limit_index=NUMBER Show only files at Index of Execution Profile if num files and functions > number (2000). --enable-relativepath=0/1 Convert absolute filenames relative to current working directory (0). --enable-help Display this help of --enable-XXX options.
--{enable-|disable-}XXX[=YYY]
These options are used to fine-tune some graphical features of the generated HTML report and some other detailed behaviors.
Options that can have YYY value 1 or 0 can also be written as --enable-XXX and --disable-XXX instead of --enable-XXX=1 and --enable-XXX=0.
These options can live over ctc2html versions.
115
9.4 ctc2html.ini configuration file
The ctc2html utility uses certain hard-coded initial values for the --enable-XXX =value settings. But if file ctc2html.ini is found (normally, if it exists, it resides in directory pointed by CTCHOME environment variable; ctc2html.ini is looked from same folders as ctc.ini file is looked), it is read and some or all of the hard-coded values can be overridden. If the file ctc2html.ini is not found, the hard-coded initial values are used. Command-line option --enable-XXX=value overrides both hard-coded initial values and configuration file settings.
ctc2html.ini is a text file. Lines starting with ‘#’ (comments) and empty lines are ignored. The overriding --enable-XXX=value settings are given on their own lines in the format as they would be given explicitly from command line as ctc2html tool options. All settings need not be given. A later setting overrides a previous one.
9.5 Files Produced
ctc2html creates a directory specified by the –o option (default is subdirectory CTCHTML in the working directory) for holding the generated files. The directory contains file index.html, where the browser can be started.
The subdirectory CTCHTML is in a way "position independent" and "self-contained". Means, for example, that it can be copied to another location and still its links work and it can be browsed.
9.6 The HTML Document
The HTML document shows the information on pages titled CTC++ Coverage Report. There are actually 6 levels of them: Overall Summary, Directory Summary, Files Summary, Functions Summary, Untested Code and Execution Profile as shown in the examples below. The information is sorted and showed by directory names and by file names (as they could be concluded from the input Execution Profile Listing). On Windows, the directory part of the source file names are normalised to lowercase and to use ‘\’ as the directory separator.
The CTC++ Coverage report - Overall Summary page:
116

This page shows from what input the HTML report has been generated and some summary information over the whole code base. Same information is also at Directory Summary and Files Summary pages, but in case there were many input symbolfiles/datafiles (of which the input Execution Profile Listing was generated) they all are shown at this page while at the other two pages only the few first ones are shown.
Two coverage TER percentages and their histograms are shown. The first one is on structural coverage, here “75 % - (21/28)”. The histogram being red signifies that the coverage TER% is under the threshold percent. The second TER is on statement coverage, here “88 % (21/24)”.
If advanced option --disable-statement_coverage (or --enable-statement_coverage=0) was used, this HTML page (and the other lower level summary HTML pages) do not contain statement coverage information: “Statement threshold:”, statement coverage histogram area, “TER statement :”. Makes the report somewhat simpler, less items needing eye-focus and understanding,
The Overall Summary page is found by link OVERALL at the two other summary pages.
117
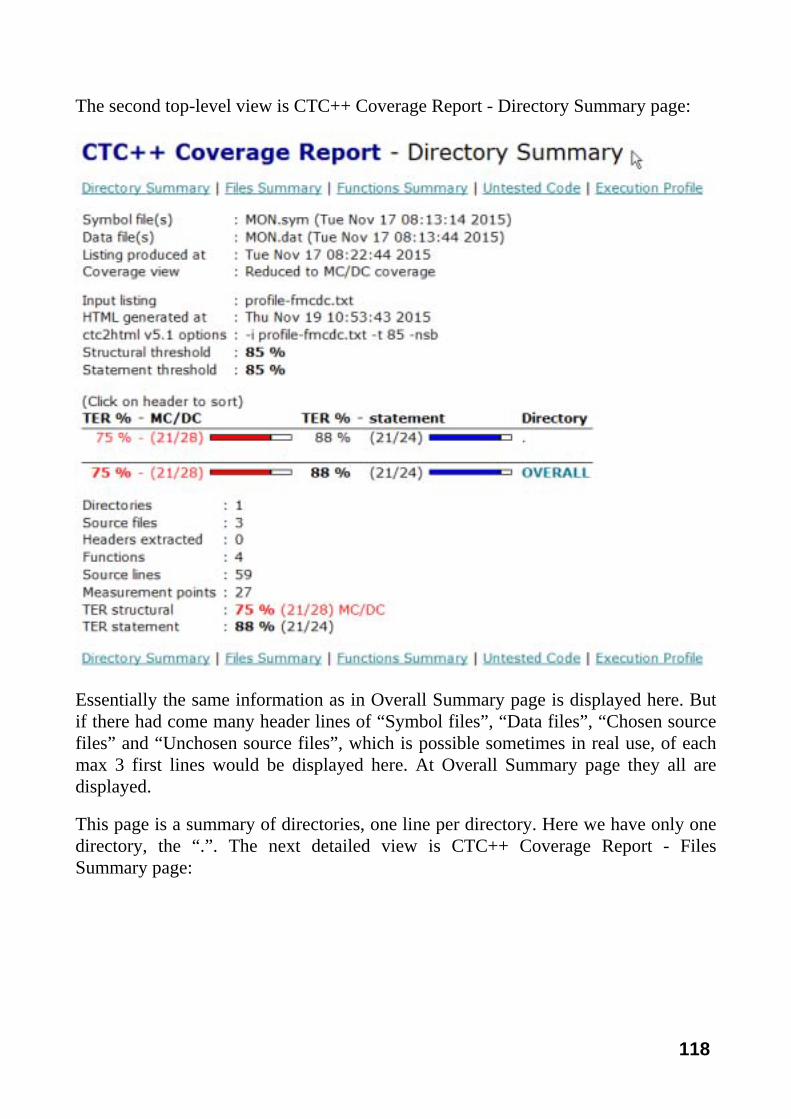
The second top-level view is CTC++ Coverage Report - Directory Summary page:
Essentially the same information as in Overall Summary page is displayed here. But if there had come many header lines of “Symbol files”, “Data files”, “Chosen source files” and “Unchosen source files”, which is possible sometimes in real use, of each max 3 first lines would be displayed here. At Overall Summary page they all are displayed.
This page is a summary of directories, one line per directory. Here we have only one directory, the “.”. The next detailed view is CTC++ Coverage Report - Files Summary page:
118

The browsing is started from this CTC++ Coverage Report - Files Summary page.
Throughout the HTML pages red color is used to show where the obtained TER (at summary levels) is lower than the threshold percent, or some specific code location (at execution profile level) is not executed. At the histograms the color-coding is: red (tested but TER is less than the goal), blue (tested and the TER met the goal), white (not tested).
File names are direct links to Execution Profile page of the file in question.
Link Functions Summary leads to CTC++ Coverage Report – Functions Summary page.
119
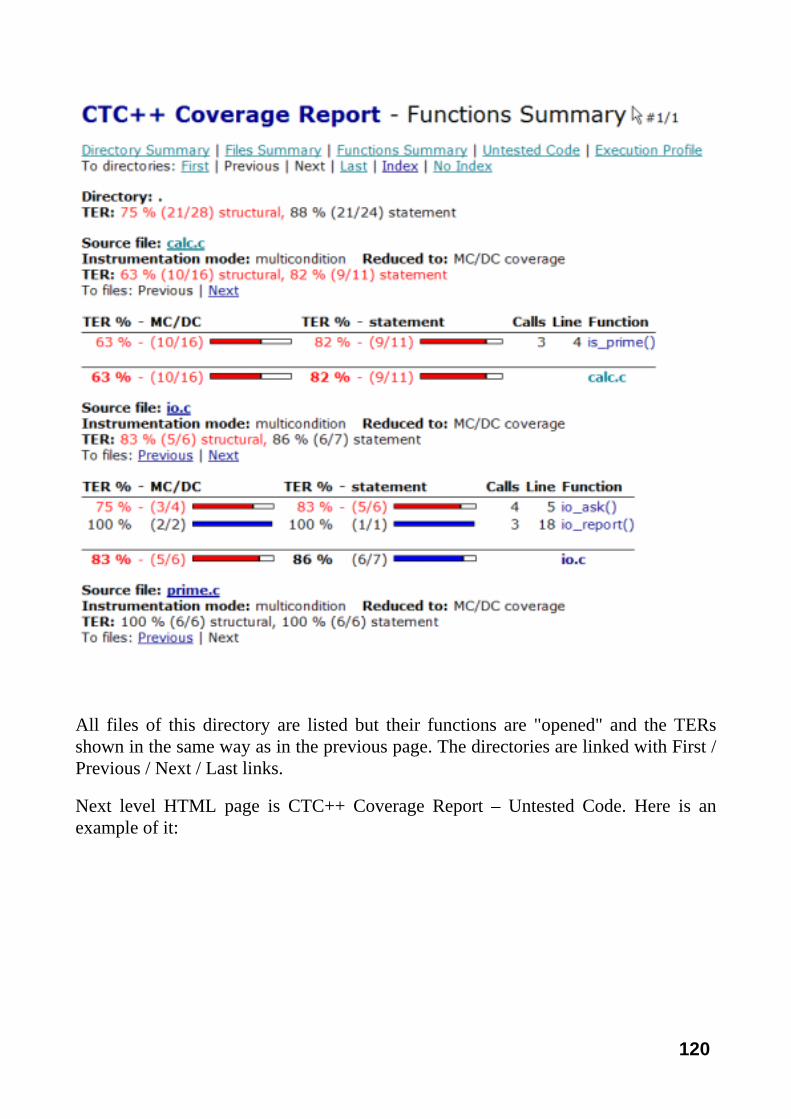
All files of this directory are listed but their functions are "opened" and the TERs shown in the same way as in the previous page. The directories are linked with First / Previous / Next / Last links.
Next level HTML page is CTC++ Coverage Report – Untested Code. Here is an example of it:
120

The page contains the untested locations of each code lines of each file. The lines in this HTML page are taken from the textual Execution Profile Listing, not from the actual source files.
Potentially the Untested Summary page can become very big (takes long time to load), if the source code volumes are big and if only a small portion of the code base has been executed so far. In such cases you could avoid clicking on the Untested Code link. Or you could also use --enable-light_untested=1 option in ctc2html phase, in which case only the file names are shown at the page (is much smaller) that have untested code.
From Files Summary and Functions Summary pages there are links to the detailed Execution Profile pages. Here is an example:
121

This is an example of CTC++ Coverage Report - Execution Profile page. There will be a separate page for each source file. The pages are linked with First / Previous / Next / Last links. At this page the execution counter data from the execution profile listing is displayed and associated to the lines of the actual source file.
The structural coverage execution hits are in the two left-most columns “Hits/True” and “False”. When the counter is > 0 (coverage is met), the number is shown in black and grey background. When the counter = 0 (coverage is not met), it is shown in red 0 with light red background.
However, when the report is taken in MC/DC coverage view, the multicondition evaluation alternatives are just displayed for your information, numbered “1:”, “2:”, etc., and do not have red zeros. See example at line 8. In MC/DC coverage the
122
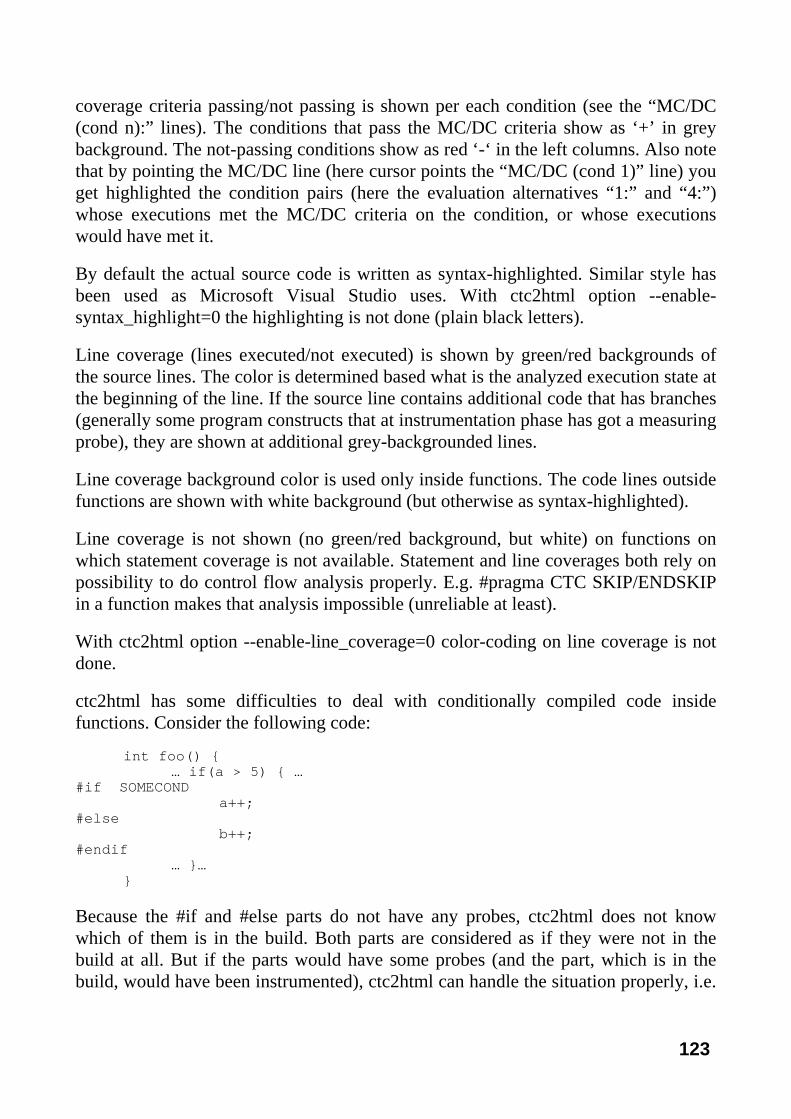
coverage criteria passing/not passing is shown per each condition (see the “MC/DC (cond n):” lines). The conditions that pass the MC/DC criteria show as ‘+’ in grey background. The not-passing conditions show as red ‘-‘ in the left columns. Also note that by pointing the MC/DC line (here cursor points the “MC/DC (cond 1)” line) you get highlighted the condition pairs (here the evaluation alternatives “1:” and “4:”) whose executions met the MC/DC criteria on the condition, or whose executions would have met it.
By default the actual source code is written as syntax-highlighted. Similar style has been used as Microsoft Visual Studio uses. With ctc2html option --enable-syntax_highlight=0 the highlighting is not done (plain black letters).
Line coverage (lines executed/not executed) is shown by green/red backgrounds of the source lines. The color is determined based what is the analyzed execution state at the beginning of the line. If the source line contains additional code that has branches (generally some program constructs that at instrumentation phase has got a measuring probe), they are shown at additional grey-backgrounded lines.
Line coverage background color is used only inside functions. The code lines outside functions are shown with white background (but otherwise as syntax-highlighted).
Line coverage is not shown (no green/red background, but white) on functions on which statement coverage is not available. Statement and line coverages both rely on possibility to do control flow analysis properly. E.g. #pragma CTC SKIP/ENDSKIP in a function makes that analysis impossible (unreliable at least).
With ctc2html option --enable-line_coverage=0 color-coding on line coverage is not done.
ctc2html has some difficulties to deal with conditionally compiled code inside functions. Consider the following code:
int foo() { … if(a > 5) { … #if SOMECOND a++; #else b++; #endif … }… }
Because the #if and #else parts do not have any probes, ctc2html does not know which of them is in the build. Both parts are considered as if they were not in the build at all. But if the parts would have some probes (and the part, which is in the build, would have been instrumented), ctc2html can handle the situation properly, i.e.
123

get the line coverage painting right and not apply any line coverage color on the part that is not even in the build.
In real life situations the source files can be hundreds of lines long. The link Line brings focus to the first untested location. And then after the line numbers are links to the next untested.
Pointing the cursor on the function end-} gives a tooltip on the structural and statement TER of the function.
Links Index and No_Index open and close to the page a sub-frame, which contains an index of the files and their function. It is useful in quickly navigating to various parts in the code base. For this feature to be functional, javascript must be enabled in the browser.
At this page understand also the following: The whole HTML report has been worked up from textual Execution Profile Listing (profile.txt), as generated by ctcpost or by ctcxmlmerge, and from the html’lized actual source file, and adding the coverage data into the HTML report. The profile.txt in turn has been worked up from a C-preprocessed version of the source file. Now, if on the actual source code there had been line, say, “if (a == MACRO) {…”, in profile.txt there might have been description “if (a == 5)”. In the HTML report the actual source file form is used.
Also, if on the actual source line there has been a macro, say, “…MACRO(params)…”, and if it has expanded to control structures that have been instrumented, the profile.txt lines of them show in the HTML report according to the same rule as described above.
Next we have an example of this Execution Profile page where the HTML report was generated with -no-sources option, or if the source file had not been found during the ctc2html run:
124

Here the source area is constructed from the input execution profile listing information only.
125

10. Using ctc2excel Utility
10.1 Introduction
ctc2excel, CTC++ to Excel converter, reads a textual Execution Profile Listing, extracts functions of it, and writes a simple Excel file of the functions. In the result file there is one line per function. With the result file, then, with Excel (or with another spreadsheet application), you can derive your own representations (special summaries and graphical representations) from the coverage data as your needs may be.
10.2 Starting ctc2excel
The command-line syntax for executing ctc2excel is:
ctc2excel [-i inpufile] [-o outputfile] [-u] [-efs ‘c’] [-full] [-nopath] ctc2excel [-h]
An example:
ctc2excel –i profile.txt –o excel.txt
10.3 ctc2excel Options
-h (help) Displays a brief description of the command-line options.
-i inputfile
The input Execution Profile Listing file produced by ctcpost based on which the Excel representation file is constructed. In the absense of this option, the input is read from stdin.
-o outputfile
The output file. In the absence of this option, the output is written to stdout.
126
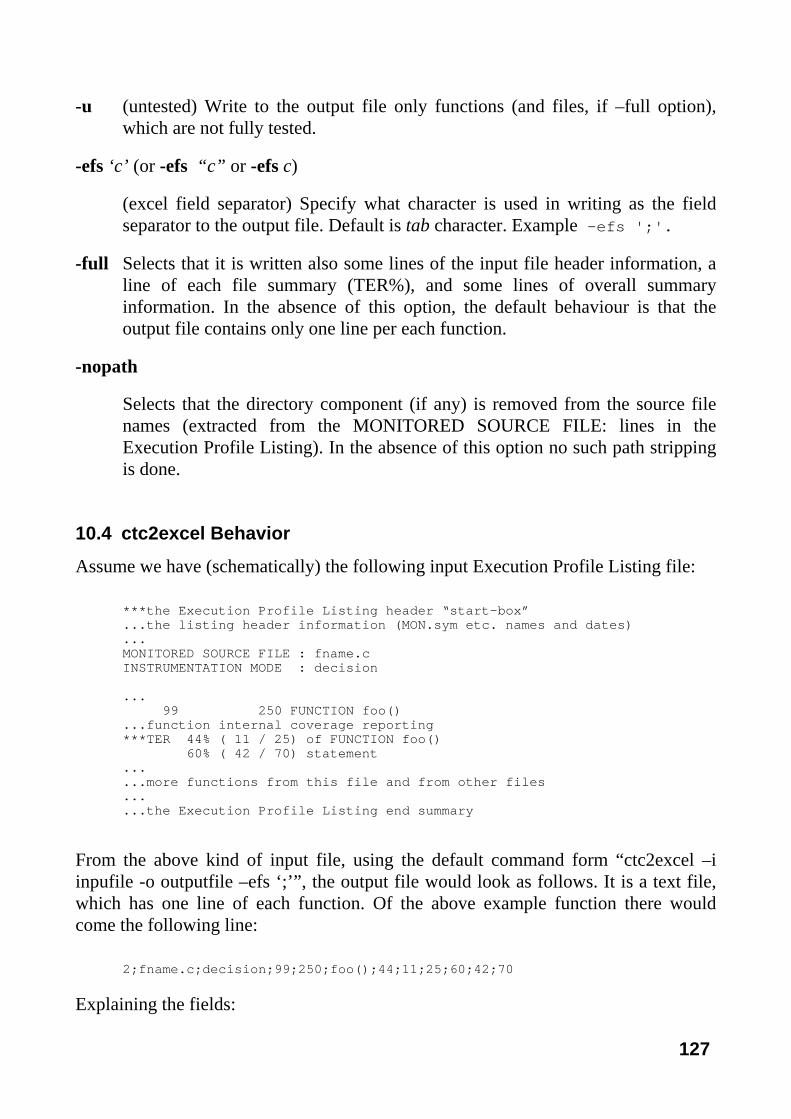
-u (untested) Write to the output file only functions (and files, if –full option), which are not fully tested.
-efs ‘c’ (or -efs “c” or -efs c)
(excel field separator) Specify what character is used in writing as the field separator to the output file. Default is tab character. Example -efs ';'.
-full Selects that it is written also some lines of the input file header information, a line of each file summary (TER%), and some lines of overall summary information. In the absence of this option, the default behaviour is that the output file contains only one line per each function.
-nopath
Selects that the directory component (if any) is removed from the source file names (extracted from the MONITORED SOURCE FILE: lines in the Execution Profile Listing). In the absence of this option no such path stripping is done.
10.4 ctc2excel Behavior
Assume we have (schematically) the following input Execution Profile Listing file:
***the Execution Profile Listing header “start-box” ...the listing header information (MON.sym etc. names and dates) ... MONITORED SOURCE FILE : fname.c INSTRUMENTATION MODE : decision ... 99 250 FUNCTION foo() ...function internal coverage reporting ***TER 44% ( 11 / 25) of FUNCTION foo() 60% ( 42 / 70) statement ... ...more functions from this file and from other files ... ...the Execution Profile Listing end summary
From the above kind of input file, using the default command form “ctc2excel –i inpufile -o outputfile –efs ‘;’”, the output file would look as follows. It is a text file, which has one line of each function. Of the above example function there would come the following line:
2;fname.c;decision;99;250;foo();44;11;25;60;42;70
Explaining the fields:
127

• 2: Tag value for the line type. This is a “function line”. With the -full option there would also be line types with tag values
o : “1”: The input profile.txt header lines, notably from what .sym/.dat files the listing was generated, when it was generated, etc.
o “3”: File-specific summary information (structural and statement TER as available) in the same way as on function lines.
o “4”: The input profile.txt bottom line overall SUMMARY section lines.
• fname.c: the name of the file.
• decision: Instrumentation mode (or more precisely, the coverage view how the Execution Profile Listing was produced, see ctcpost’s -ff, -fd, -fc, -fmcdc options).
• 99: How many times the function was called.
• 250: The line number where the function started.
• foo(): The name of the function.
• 44: TER % of the function. (*
• 11: How many probes there were that got a hit. (*
• 25: How many probes there were that should have got a hit to reach a 100% coverage. (*
• 60: Statement coverage TER% of the function. (**
• 42: How many statements executed. (**
• 70: How many statements altogether. (**
*) Structural coverage information is missing, if the file is instrumented only for function coverage (-i f). The coverage shows from the function call count.
**) Statement coverage information is missing, if it is not available (“N.A.”) for the function.
128
11. CTC++ Instrumentation Modes
For each source file the instrumentation mode can be selected independently of other instrumented source files. The instrumentation mode determines how much probes are inserted to the instrumented variant of the file and thus how much information is collected at the instrumented program execution time.
For (structural) code coverage there are function, decision and multicondition instrumentation modes, and one of them is always selected. There is no instrumentation mode on condition or MC/DC coverage. It is a ctcpost time property to generate the report with those coverage views.
There is no instrumentation mode on statement or line coverage. When the code is instrumented at least for decision coverage, the program control flow analysis is possible, and these coverages are automatically reported. Line coverage is shown in HTML form report as color-coding.
Timing instrumentation has submodes for inclusive and exclusive timing. Selecting timing instrumentation is optional, but if it is selected, it implies function coverage, unless higher code coverage instrumentation mode is selected.
The probes collect the execution information into ctc-generated main memory counter arrays. There are a couple of types of them as follows:
• START_COUNTERS: This counter array keeps track how many times each function has been called.
• JUMP_COUNTERS: This is a counter array, where one element tells "how many times the pertinent code location, like ‘goto’, ‘return’, etc., has been visited".
• DECISION_COUNTERS: This is a pair of counter arrays that are used to keep track how many times a complete branching decision has been evaluated to true and to false.
• MULTICONDITION_COUNTERS: This is a counter array, which is used to keep track how many times each individual combination of a condition expression containing && and || operators has been evaluated.
129

• TIMER_COUNTERS: This is a pair of counter arrays used to keep track of subprogram execution total and maximum timing (execution cost).
You can see with ctcpost -L option the sizes of these arrays.
11.1 Function Coverage
Function coverage is the lowest-overhead instrumentation. It is selected with "-i f" in the ctc command. Note that the ctc-options "-i d", "-i m" and "-i ti/-i te" also enforce function coverage instrumentation.
Each function (standalone function, class member function, constructor and destructor) body is instrumented as follows (logically):
{ INCREMENT_START_COUNTER; {original body} }
The execution profile listing shows how many times the function body was entered.
11.2 Decision Coverage
Decision coverage (-i d) is the next stronger instrumentation over function coverage. Decision coverage reveals, in addition of the information of function coverage, how many times each complete branching decision has been evaluated to true and to false and how many times each case branch in a switch statement has been entered. In literature this coverage is sometimes called as "branch coverage".
In addition to the actual decisions (what conditional branches taken) also the unconditional control transfers (like ‘goto’, ‘break’) are measured and their execution counts are reported. In decision coverage report there is still some “information probes”. In them (like in ‘else’ or block-end-}) there is no probe. They are however shown in the report making it more readable or helping the later statement and line coverage construction.
The instrumentations with decision coverage are as follows (logically):
130

Below the marking INCREMENT_JUMP_COUNTER means that the counter of an explicit control transfer counter is incremented. Marking INCREMENT_DECISION_COUNTER(expression) means that if the expression evaluates to true the corresponding true-counter is incremented. But if the expression evaluates to false, the corresponding false-counter is incremented.
Goto-statement:
{INCREMENT_JUMP_COUNTER; goto label;}
Label:
label: or label:+
Label does not have a counter. At instrumentation time the label name and location is anyway recorded and for readability etc. reasons it is displayed in execution profile listing. There is ‘+’ marking if, based on execution flow analysis, the label was not “flown to” but only “gotoed”. That information is used in ctc2html phase for line coverage needs.
Continue-statement:
{INCREMENT_JUMP_COUNTER; continue;}
Remark: In Java this can also be
continue label;
Break-statement:
{INCREMENT_JUMP_COUNTER; break;}
Remark: In Java this can also be
break label;
Return-statement:
{INCREMENT_JUMP_COUNTER; return [expression_if_any];}
Switch-statement:
switch(expression)
131

Switch does not have a counter. At instrumentation its location and expression is anyway recorded and for readability etc. reasons it is displayed in execution profile listing.
Case-label:
goto over; /* if otherwise “fall through” */ case expression: INCREMENT_JUMP_COUNTER; over:
Remark: In execution profile listing this probe’s description is “case n:” or “case n:+”. The “case n:+” is used if the case label was not directly “jumped to” but only “flown to”. Based on execution hits and on presence of ‘+’ the line coverage can be made better at ctc2html phase.
Default-label:
goto over; /* if otherwise “fall through” */ default: INCREMENT_JUMP_COUNTER; over:
Remark: In execution profile listing this probe’s description is “default:” or “default:+”. The “default:+” is used if the case label was not directly “jumped to” but only “flown to”. Based on execution hits and on presence of ‘+’ the line coverage can be made better at ctc2html phase.
If-statement:
if (INCREMENT_DECISION_COUNTER(expression)) original if-branch
See remark (*) below about “if (1) {…” kind of cases.
If-statement having a declaration in condition:
In C++ it can be written e.g.
if (int i = expr){...} possible else-branch
which is instrumented as follows:
{INCREMENT_FALSE_COUNTER; /* guess for false */ if (int i = expr){\ DECREMENT_FALSE_COUNTER;\ /* wrong guess, correct */ INCREMENT_TRUE_COUNTER;\ /* it was true after all */ {original if-branch}} possible else-branch}
132
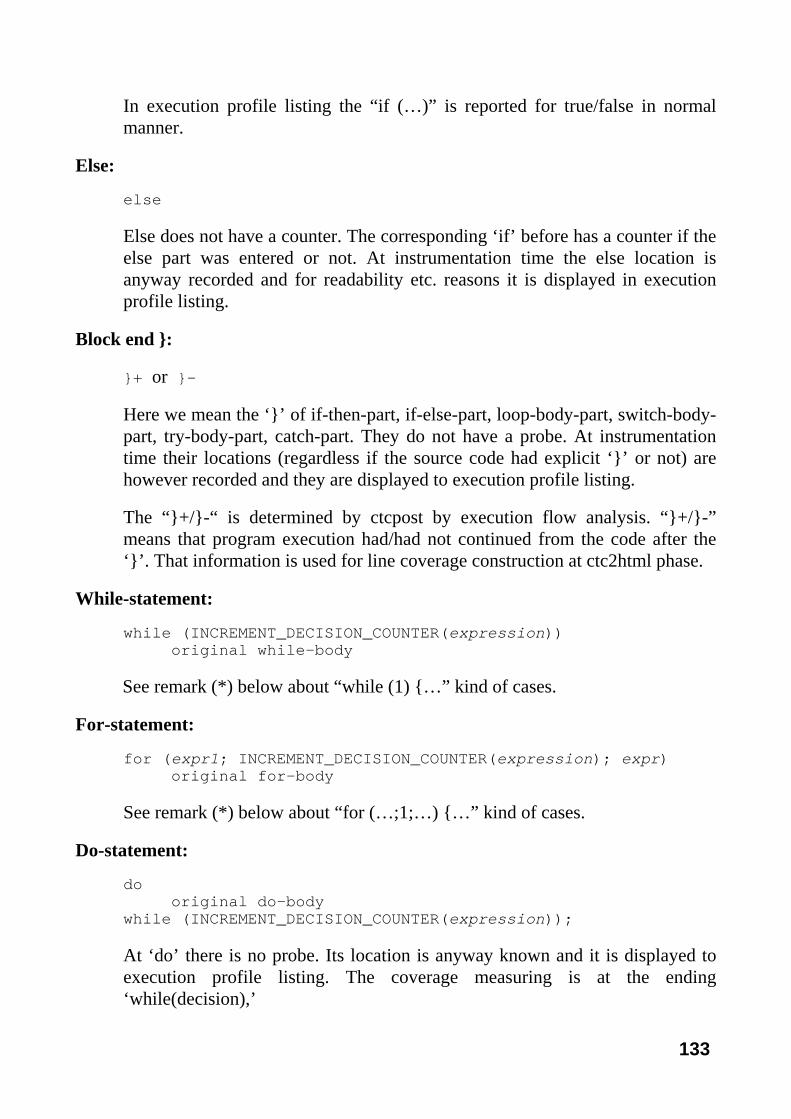
In execution profile listing the “if (…)” is reported for true/false in normal manner.
Else:
else
Else does not have a counter. The corresponding ‘if’ before has a counter if the else part was entered or not. At instrumentation time the else location is anyway recorded and for readability etc. reasons it is displayed in execution profile listing.
Block end }:
}+ or }-
Here we mean the ‘}’ of if-then-part, if-else-part, loop-body-part, switch-body-part, try-body-part, catch-part. They do not have a probe. At instrumentation time their locations (regardless if the source code had explicit ‘}’ or not) are however recorded and they are displayed to execution profile listing.
The “}+/}-“ is determined by ctcpost by execution flow analysis. “}+/}-” means that program execution had/had not continued from the code after the ‘}’. That information is used for line coverage construction at ctc2html phase.
While-statement:
while (INCREMENT_DECISION_COUNTER(expression)) original while-body
See remark (*) below about “while (1) {…” kind of cases.
For-statement:
for (expr1; INCREMENT_DECISION_COUNTER(expression); expr) original for-body
See remark (*) below about “for (…;1;…) {…” kind of cases.
Do-statement:
do original do-body while (INCREMENT_DECISION_COUNTER(expression));
At ‘do’ there is no probe. Its location is anyway known and it is displayed to execution profile listing. The coverage measuring is at the ending ‘while(decision),’
133

See remark (*) below about “do … while (1);” kind of cases.
Special loop variants:
Here it is meant the following kind of constructs (schematically):
for (var : set) {...} /* in C++11 */ for each (var in set] {...} /* VC++ extension */ foreach (var in set) {...} /* C# */ while (int i = expr) {...} /* C++ */ for (...;int i = expr;...) {...} /* C++ */
These are instrumented as follows:
loop_header_unchanged { \ INCREMENT_JUMP_COUNTER;\ {...}}
In execution profile listing of these kind of loops, there is one probe telling how many times the loop body has been entered.
Ternary-?: operator: … expr1 ? expr2 : expr3 :
… INCREMENT_DECISION_COUNTER(expr1) ? expr2 : expr3
See remark (*) below about “… 1 ? … : …” kind of cases.
Remark (*):
ctc recognizes if the expression is a single literal, like in “while (1) {…}”. Such expression cannot be evaluated to both true and false. Corollary, in structural TER% calculation it suffices if the program construct has just been executed, and let the evaluation outcome be either true or false. In the execution profile listing these kind of decisions are marked with “const-if, const-else if, const-for, const-while, const-do-while or const-ternary-?:”.
Try-statement:
try { /* in C++ / INCREMENT_START_COUNTER; {original body} }
__try { /* supported in some C environments / INCREMENT_START_COUNTER; {original body} }
134

Throw-statement:
{INCREMENT_JUMP_COUNTER; throw expression;} {INCREMENT_JUMP_COUNTER; __leave;} /* supported in some C environments */
Catch-statement:
catch (declaration) { /* in C++ */ INCREMENT_JUMP_COUNTER; {original body} }
__except (filter_expression) {/*some C environments*/ INCREMENT_JUMP_COUNTER; {original body} }
__finally { /* some C environments */ INCREMENT_JUMP_COUNTER; {original body} }
Function end-brace:
... /* function body */ INCREMENT_JUMP_COUNTER; }
Probe is inserted here only if the function is a ‘void’ function and the functions’s end-brace is reachable. When this probe is inserted, it will also be included in TER calculus.
Lambda function in global scope:
A lambda function in global scope (or at “file-level”, i.e. outside of functions), e.g. like
... auto n = [](int i){return i + 1;}; ...
is instrumented like a normal function. As the function name in an execution profile listing there is “lambda-[]()”.
Lambda function inside a function:
A lambda function inside a function, e.g. like
135

... a = b + [c]{if (c > 5) return 5; else return 6;}() + d; ...
is also instrumented. However nested lambda functions are not instrumented. In an execution profile listing there is a marking “lambda-[]()” at the beginning of a function-internal lambda, and its end is marked with “}”, which may have a probe, if the end is reachable. In TER% sense the execution hits of a function-internal lambda function are counted to its enclosing function.
User Counter: (see section "14.3 - Special Counters")
INCREMENT_JUMP_COUNTER; #pragma CTC COUNT token_sequence
In execution profile listing this shows User counter: token_sequence.
User Annotation: (see section "14.4 - Annotations")
#pragma CTC ANNOTATION token_sequence
User annotation has no counter. In execution profile listing this shows User annotation: token_sequence.
11.3 Multicondition Coverage
Multicondition coverage instrumentation (-i m) is like decision coverage, but the INCREMENT_DECISION_COUNTER(decision_expression) part is instrumented in another way, if there are && or || operators.
The question is of decision_expressions that are in "if", "while", "for" and "do-while" statements. If there are neither && nor || operators in the decision_expression, the instrumentation is done as with decision coverage.
Additionally the question can be of assignment statements, of the following form
variable = decision_expression_that_has_&&_or_||_operators;
The assignment statements that have operator +=, -=, *=, etc. are instrumented here in the same way as with = operator.
However, in the above case, if there are no && and || operators in the decision_expression, the assignment statement gets no instrumentation–it would not imply any conditional execution of the some portions of the expression.
In multicondition instrumentation the decision_expression is parsed to its atomic condition expressions and the instrumentation is as follows (logically):
136

MULTI_START instrumented_decision_expression MULTI_END
which contains one or more
MULTI_ATOM(atomic_condition_expression)
instrumentations, depending what is the decision_expression structure with regard to || and && operators.
For example, to clarify the difference between decision coverage and multicondition coverage, assume we originally have in the source code:
if (i == 5 || j == 6 || k == 7) {...
Decision coverage instrumentation gives how many times the whole decision_expression was evaluated to true and to false. Multicondition coverage gives how many times each of the possible ways to evaluate the whole decision_expression has been evaluated. Here the four possible ways are:
"i == 5" true, "j == 6" not eval, "k == 7" not eval "i == 5" false, "j == 6" true, "k == 7" not eval "i == 5" false, "j == 6" false, "k == 7" true "i == 5" false, "j == 6" false, "k == 7" false
The three first ones give the expression overall value true and the fourth one gives overall value false. In an Execution Profile Listing the evaluation alternatives (as actually executed) could show as follows:
4 7 6 if (i == 5 || j == 6 || k == 7) 3 6 1: T || _ || _ 0 - 6 2: F || T || _ 1 6 3: F || F || T 7 6 4: F || F || F
The true/false counters on the if-line are sums of actual executions of the various evaluation alternatives of the decision_expression. Above, the "false || true || not_eval" was never executed.
In “if”, “while”, “for”, “do-while” connections the multicondition evaluation alternatives analysis is reported as shown above. In the ‘var = cond_expr;’ connection the reporting is done similarly in profile listing, but using “expr-andor:” tag, for example as follows:
137

3 4 33 expr-andor: a == 55 || b == 66 && c == 77 3 33 1: T || _ && _ 0 - 33 2: F || T && T 1 33 3: F || T && F 3 33 4: F || F && _
See section "7.5.2-Coverage views" on how the multicondition instrumented code can be reported in condition coverage view or in MC/DC coverage view in these situations.
11.4 Statement Coverage
There is no instrumentation mode for statement coverage. Reporting the statement coverage is done by the ctcpost utility. When the code has been instrumented for decision or multicondition coverage, ctcpost makes a flow-analysis what function branches have been executed and calculates the statement coverage TER%. It is then summed up at file level and at overall level.
Statement coverge is calculated only of instrumented code, i.e. of function bodies. If there are such functions in a file that are not instrumented, their statements do not show in the file/overall summary levels. If code has been #included into a function from another file, but that code is not instrumented, statements from such code are not calculated in the statement coverage TER%.
CTC++ uses the following rules when counting statements:
• semicolon (;) is considered one statement.
• Empty compound statement {} is considered one statement.
• The following control structure keywords are considered one statement on their own right: if, else if, for, while (in while(cond){…} context, not in do{…}while(cond); context), switch, and try.
Then understand that CTC++’s statement coverage is only an estimate. Consider the following code fragment: if (cond) {stm1; stm2; stm3;}. If code coverage measures show that the then-branch was entered, statement coverage calculus assumes that it is (in this specific case) also executed to its end. But it may be that some of the statement list statements has thrown an exception and the statement list was not executed fully.
If inside a function body, a #pragma CTC SKIP or #pragma CTC ENDSKIP has been encountered, a warning message of it is given at instrumentation time, and at the report statement coverage of the function is marked as “N.A.” (“not available”). A smallest possible function, like void foo(){}, would have at least one statement, i.e.
138

that of the {}. Because any sensible use of #pragma CTC SKIP/ENDSKIP would be to leave some control structures (points where CTC++ would insert measuring probes) uninstrumented, control flow analysis would very likely give biased results anyway. That’s why this “N.A.” reporting.
Statement coverage of functions is summed up to file level and to overall summary. If there was some functions that had “N.A.” for statement coverage, at the summary levels the statement coverage reflects those functions of which it was available and there is additional marking “(N.A. for n functions)”.
In practical use and in big picture, however, we think that the reported statement coverage figure is a useful measure. But even if a 100% statement coverage TER is reported, it cannot be used as a proof that all statements had been executed.
11.5 How Structural Coverage Percent (TER%) is Calculated
Structural coverage is a measure how thoroughly the control structures of the program have been exercised. The instrumentation probes and the counter values that they collect from test runs are used here.
TER% = 100 * (“must points” covered / “must points” total).
What is a “must point”? Quite often it is same as the number of probes (“Measurement points” field in report bottom line summary), but not always. Cases when it can differ are:
• multicondition instrumentation (-i m), reporting “as instrumented”: Concretely there is a probe only for each evaluation alternative. In reporting they each are one “must point”. Additionally the overall decision being true and false is taken as 2 more “must points”.
• multicondition instrumentation (-i m), reporting in MC/DC coverage view (-fmcdc): Now as a “must point” it is taken that the elementary conditions meet the MC/DC criteria, 1 point of each, and additionally that the overall decision has been true and false (2 points).
• multicondition instrumentation (-i m), reporting in condition coverage view (-fc): ): Now as a “must point” it is taken that all elementary conditions have been true and false (2 points of each), and additionally that the overall decision has been true and false (2 points).
• if(0){…, while(1){… kind of cases: These decisions ctc has recognized to be constants. At test time they cannot get both true and false values. Technically
139

they consume 2 probes, but in TER calculation it suffices if the code is only executed (yielding true or false as the case may be), i.e. 1 “must point”.
• taking the coverage report with lower coverage view (options –ff, -fd) as the code actually is instrumented. For example in function coverage view (-ff) as 1 “must point” of a function there is only that the function is called.
The lowest %-summary is function level. The must points covered and total are calculated in the above described way. Then file and overall levels are obtained by just summing up.
11.6 Line Coverage
In CTC++ with line coverage we mean roughly “what lines in a function have been or have not been executed”. CTC++ shows line coverage in HTML report (generated by ctc2html utility) in the detailed Execution Profile page by color-coding of the source code lines.
Line coverage is based on the control flow analysis that was already done for statement coverage needs. In the profile listing the execution hits being 0 or >0 and additional markings }+, }-, case n:+, default:+ and L:+ help ctc2html utility to decide the color on the lines to follow. Line coverage is not provided under same conditions when statement coverage can not be provided. On line coverage CTC++ does not give any numerical value, only color-coding in the HTML report.
11.7 Timing (Execution Cost) Instrumentation
When the timing instrumentation mode (-i ti/-i te) has been selected, ctc instruments functions with timers, which measure the execution costs of the functions. These are called timers, because time is the most common cost measure. However, the cost can be almost anything measurable: wall clock time, CPU time, number of page faults, number of I/O operations. To measure time you must supply CTC++ with a cost function which, when called, returns the current value of the quantity to be measured.
There are two timing values that are maintained of a function: total execution time (and when function call count is known, also average execution time can be reported) and maximum execution time.
CTC++ uses the TIMER configuration parameter as the function, which it calls at execution cost measuring. By default, the ctc.ini file has the setting
140

TIMER = clock
which means using the standard C library function clock() found from <time.h> for execution cost measuring. Normally, the implementation for the clock() function is also automatically found from the standard C library when linking the instrumented executable. You can change the setting to your own function, which however must return a value of type clock_t defined in <time.h>. And when linking the instrumented executable you need to introduce the object or library file containing the implementation for your own timer function.
Note also that CTC++ maintains the timing data as 32-bit values. Thus, if your own timer runs very fast, a timer data “wrap-around” is possible resulting in unreliable measurements. In such a case, assuming that you would base your timing measuring on something, which actually is more than 32 bits (e.g. machine cycles?), you could do an intermediate timer function, which ctc runtime calls and gets 32 bit values. Your intermediate function would shift the over 32 bit values to the right (losing the least significant bits) and return a 32 bit value. When interpreting the timing values you know how many bits are lost from the measures, i.e. how coarse the measures are.
One detail to know is that CTC++ interprets the timing value as signed int. It means that a timing measure can also be less than previous one, and cumulative timing value can also be negative. You might use this feature e.g. if your timer function would be “free heap size”, i.e. you would find out in which functions heap is consumed and released.
By default, whether the default clock() or your own timer function is used, and whether the instrumented code is C or C++, the timer function is assumed to have “C-linkage”. I.e., it needs to be compiled as “C-code”. You can also use a timer function that has “C++-linkage” (i.e. compiled as “C++ code”), but at instrumentation time you need to inform CTC++ about it. See the example below and comments in ctc.h for more.
Here is an example (an own timer having “C++-linkage”):
ctc –i mti -C TIMER=mycpptimer \ -C OPT_ADD_COMPILE+-DCTC_CPP_TIMER_FUNC \ -C LIBRARY+mycpptimer.obj \ cl –FeMyprog.exe *.cpp
Each function is associated with a timer. Immediately when the function has been entered, its timer is started by calling the cost function and storing the value. When the function returns (just before a return-statement or function ending-‘}’) the timer is stopped by calling the cost function again. The time spent in the function is computed and the result is added to the time spent in the function during previous calls. When
141
maintaining the maximum execution time, the comparison if the latest measurement is a new maximum is done by signed integral value comparison.
If the code under test is C++ and if the function return takes place with an exception, the timer is stopped and function cumulative time collected also in that situation.
With timing instrumentation there can be any coverage (function, decision, multicondition) instrumentation at the same time. If no coverage instrumentation is selected, function coverage is enforced.
With regard to instrumentation overhead (speed), perhaps the timing instrumentation is most costly. Especially so, if the cost measuring is taken by clock() function or some similar, which makes an operating system interrupt each time it is called.
Generally you should not use timing instrumentation, if the code under test is multithreaded. The measured times may be meaningless. Especially in such situation you should not use Exclusive Timing, because in it the implementation uses global pointer variables and the program may even crash in some situations.
Function-internal lambda functions are not instrumented for timing even though their enclosing function would be.
11.8 Exclusive vs. Inclusive Timing (Execution Cost) Measuring
The function execution timing can be collected in two ways:
• Inclusive (-i ti): The time spent in the called timing-instrumented functions is counted also into the time of the caller function.
• Exclusive (-i te): The time spent in the called timing-instrumented functions is excluded from the time of the caller function.
11.9 Inline vs. Safe Counter Incrementing
By looking the ctc.h file you can see that there is some code defined behind conditional compilation:
#ifdef CTC_SAFE ... some macro definitions #else ... same macro definitions in another way #endif
These macro definitions are related to how the counters are incremented at test time in main memory. If CTC_SAFE is defined, the counters are incremented by making a
142
function call, which makes the incrementing and at the same time watches that the counter will not overflow. If CTC_SAFE is not defined, then the counter incrementing is done inline and counter overflow is not guarded. In practice and in current 32-bit machines this has not been experienced to be any problem.
CTC_SAFE can be defined permanently into ctc.h file, see the file header. CTC_SAFE can also be defined per each instrumentation from the command line, for example as follows:
ctc –i m -C OPT_ADD_COMPILE+-DCTC_SAFE cl -c myfile.cpp
CTC++ default behavior is that CTC_SAFE is not defined, i.e., the counters are incremented with inline code and their wrap-around is not guarded.
Note that the following will not work (provided that the default settings in ctc.ini are preserved):
ctc –i mti cl -c –DCTC_SAFE myfile.cpp
The explanation is that the “-D...” options on the compilation command line are only applied when doing the C-preprocessing on the file to be instrumented. Those “-D...” options are no more re-applied when the instrumented file is compiled. With the ctc option “-C OPT_ADD_COMPILE+-D...” we can enforce options that will be applied when compiling the instrumented code. And in this case“-DCTC_SAFE” has effect on ctc.h, which gets resolved when compiling the instrumented code.
In CTC++ summing up of the counters happens also in other places than at test time in main memory. In all those other places the counter wrap around is ensured not to happen. If such would come, the summed up value remains at the biggest 32-bit value (ULONG_MAX).
These “other places” are e.g. when instrumented program saves counter value to a datafile and the datafile has some counter value already, when ctcpost sums up counter values from many datafiles, when ctcpost sums up counter values on instrumented headers, when ctc2dat sums up counter values to a datafile, when ctcxmlmerge sums up counter values.
143

12. Configuring CTC++
12.1 Configuration file
CTC++ behavior can be adapted to various situations by modifying the configuration file ctc.ini. The modifications are done with a text editor. It is strongly recommended that a backup copy of the configuration file is made before modifying it in any way. If the configuration file is erroneous CTC++ may not start again. In CTC++ preprocessor (ctc) and postprocessor (ctcpost) utilities some configuration parameters can be fine-tuned with –C option from the command line, i.e. without actually needing to modify the configuration file. Certain configuration file settings are used also in license control.
The configuration parameters mostly affect CTC++ preprocessor (ctc). The configuration file in a way instructs ctc what is the used compilation command, what options it can have, how ctc should treat each of the options, what files are C and C++ source files, etc.
Normally CTC++ comes as preconfigured for some compiler(s) and you very seldom need to touch the configuration parameters. But if you have the CTC++/Host-Target add-on component, you need to "teach" CTC++ to know relevant options of the used cross-compiler. (You may also need to "teach" the new compiler to the ctcwrap command, if you you are using that in the builds.)
When teaching CTC++ (notably the ctc component of CTC++) of the compiler options, only such compiler options need to be introduced that are relevant. You need not introduce such options, which can be freely copied also to the compiler preprocessing command (which ctc internally invokes for the source) and which options are either parameterless or the option parameter, if any, is always connected to the option without a space between.
Some compilers allow some of its options to be written either in uppercase or in lowercase, or by so many characters only that the option is unique. These are somewhat problematic to deal in a configuration file. When you need to introduce such an option to a configuration file, do it in the form in which it is normally used. If you use alternate forms of the option, also those need to be introduced in the configuration file. Luckily, the usage conventions tend to be that only one form is used.
144

Also the CTC++ run-time library (the instrumented programs) and the CTC++ Postprocessor (ctcpost) read this file and check its validity. In Host-Target testing the instrumented program at the target does not read the configuration file.
12.2 Configuration File Finding
Configuration files are searched from multiple locations. All found files are read and their configuration parameters are merged. When a file is read, its parameters override parameters (=) or append (+, if a list type parameter) of the same name in earlier files. Furthermore, if a parameter is defined more than once in the same file, the last definition overrides/appends earlier definitions. Each file need not define all the parameters, but once the whole search is done, all parameters the tool component needs must have been found.
The configuration files are looked from following locations, in order:
• File /usr/local/lib/ctc/ctc.ini (Unix only)
• File lib/ctc/ctc.ini in the user’s home directory (Unix only)
• File ctc.ini in the directory specified by the environment variable CTCHOME. (recommended way, The used arrangement on Windows)
• File .ctc.ini in the user’s home directory (Unix only)
• Files specified by the environment variable CTCINIT. Multiple files can be separated by a semicolon and they are read in the order they are specified (not recommended way, use only if some special reason)
• File ctc.ini (in Windows) or file .ctc.ini (in Unix) in the current directory (not recommended way)
• Configuration file explicitly specified in the command line by the -c option (is a usable practice e.g. in temporary use cases). The option argument can also be multiple files, separated by a semicolon, and they are read in the given order.
Multiple configuration files could be used for example in situations where the default configuration parameters are in a common location (perhaps write protected from ordinary users) and the user/project specific parameters are in a configuration file, which is read after the default parameters.
However, using many configuration files should be avoided. If many configuration files are found, it often means difficult to find problems in the tool use when not knowing what configuration settings are actually in effect.
145
When invoking the tool (ctc or ctcpost) with -V option you see what configuration files were looked for, and if found, loaded.
12.3 Configuration File Format
A configuration file is a text file. A line whose first non-space character is '#' is considered a comment. Empty lines are allowed.
If a non-comment line ends with '\' character, the next line is concatenated to it and '\' is removed.
Marking $(env_var_name) is replaced with the corresponding value of the operating system environment variable, or with an empty string if the value is undefined. Use two dollar signs instead of one to pass an environment variable string as is, for example $$(not_replaced).
A single configuration parameter has the syntax:
PARAMETER_NAME {=|+|-} PARAMETER_VALUE
There can be spaces around the '=', '+' or ‘-‘ character. The PARAMETER_NAME part is case-sensitive.
A single parameter may be a list or not. If the parameter is a list, the list values are separated by a comma (',') in the PARAMETER_VALUE.
If a parameter setting is done with '=' character, the given parameter value totally overrides the possible previous parameter value.
If the parameter setting is done with '+' or ‘-‘ character, the question is of a list parameter. At ‘+’ the list is appended with the given value. One implicit ',' is added automatically. At ‘-‘ the PARAMETER_VALUE is removed from the list, if it is there.
Note that the command-line option -C in ctc and ctcpost can be used to set/append the configuration parameters, too. When giving configuration parameters at the command line, use no spaces at all, or enclose the whole argument in quotation marks so that the operating system shell does not split the argument. Also, if the argument contains the character '*', you should use quotation marks to prevent the operating system to expand the argument. The general structure of a configuration file is as follows:
# Common parameters... PAR1 = ... PAR2 = ... ...
146

[Identifying text of the COMMAND block aaa] COMMAND = aaa, aaa.exe COMMAND_TYPE = compiler_linker ... more descriptions when compile/link command ... aaa is used ... [Identifying text of the COMMAND block bbb] COMMAND = bbb, bbb.exe COMMAND_TYPE = linker ... more descriptions when compile/link command ... bbb is used ... [Identifying text of the COMMAND block ccc] COMMAND = ccc, ccc.exe COMMAND_TYPE = compiler_linker ... more descriptions when compile/link command ... ccc is used ... # etc more compiler/linker specific command blocks
The beginning of the file, up to the first [identifying text of the COMMAND block xxx] contains common parameters that are applied on all command blocks. In a command block there can be overridings on the common parameters.
Normally within the common parameters there are the license control parameters and possibly some other settings that are the same with all compilers.
For example, consider the following instrumentation command:
ctc -v -i m aaa -c myfile1.cpp mmyfile2.cpp
Here ctc parses and handles its own command-line parameters immediately after 'ctc'. Then it encounters something (here 'aaa', no more matches to ctc parameters) that it expects to be a compilation or linking command. ctc searches from the configuration file a compiler/linker block having "COMMAND = aaa". This also determines the used configuration parameters. They are: the common configuration parameters and the ones that are defined in the [identifying text of the COMMAND block aaa]. If you call the compiler with "aaa.exe" (e.g. your makefile could invoke it so), you need to have also the "aaa.exe" variant in the COMMAND = … line.
Should the command line had been
ctc –i d bbb ...something
the used configuration parameters would have been the common ones and those defined in the block having "COMMAND = bbb".
Note. If you are using multiple configuration files, for example a local ctc.ini in current directory (or in Unixes .ctc.ini in your home directory), where you specify
147
some additional settings for the compiler you use, remember to give also the [ identifying text of the COMMAND block xxx ]. For example you might supplement the configuration settings with the following file:
# My special add-on settings for never # instrumenting file stdafx.cpp [Identifying text of the COMMAND block aaa] EXCLUDE + stdafx.cpp
When you give additional configuration file settings straight from command line with –C option, they apply to the configuration block that has come selected by the used compile or link command.
12.4 Configuration Parameters
12.4.1 Software License Parameters
The (global) configuration parameters TOOL, USER, COMPUTER, LICENCE, TARGET_CHECK, EXPIRATION, NOTE1 to NOTE5, and CONTROL are used for identifying the CTC++ software license. Do not modify these settings by your own. If they are modified, the CTC++ will not work any more.
12.4.2 Parameter KEYPORT
In some PC environments the license may be controlled by a physical control key module ("dongle") inserted into a parallel port. Global parameter KEYPORT defines the number of the parallel port on which the license key is connected (LPT1, LPT2, etc.). This parameter is not required if license key is not used.
Example: KEYPORT=1
Remark: As of v6.5.3, the CTC++ installation script on Windows no more supports dongle-licensing.
12.4.3 Parameter FLEXLM_LICENSE_FILE
In some environments the license may be controlled by FLEXlm license manager. The license may be a floating license or a node-locked license. Global parameter FLEXLM_LICENSE_FILE specifies the port and host of the license manager daemon (if a floating license is used), or it specifies the license control file normally named 'testwell.lic' (if a FLEXlm-based node-locked license is used). This parameter is not required if FLEXlm licensing is not used.
148

Example1: FLEXLM_LICENSE_FILE=27000@flxserver
Floating license. License manager daemon runs on machine flxserver, port 27000 will be used.
Example2: FLEXLM_LICENSE_FILE=@flxserver
As example1, but FLEXlm itself finds the port number to use.
Example3: FLEXLM_LICENSE_FILE=
Perhaps a floating license but the connection is found based on the environment variables LM_LICENSE_FILE, TESTWELLD_LICENSE_FILE, or on the value TESTWELLD_LICENSE_FILE in the registry (Windows) or on the file $(HOME)\.flexlmrc (Unix).
Example4: FLEXLM_LICENSE_FILE=\ /usr/local/flexlm/licenses/testwell.lic
Floating or node-locked license.
Example5: FLEXLM_LICENSE_FILE=$(CTCHOME)\testwell.lic
Floating or node-locked license.
12.4.4 Parameter TIMER
TIMER defines the name of the cost function, which the instrumented code uses for execution cost measurement, if timing instrumentation has been selected. It is the user's responsibility to ensure that the function specified really exists. The cost function must be parameterless and it has to return a value of a type compatible with clock_t defined in the C compiler's library header file<time.h>.
Example: TIMER=clock
This parameter is normally global. By default, the timer function is assumed to have C linkage. If you want to introduce a timer-function, which has C++ linkage, you have to make the instrumentation under “-C OPT_ADD_COMPILE+-DCTC_CPP_TIMER_FUNC” definition.
It is noted that the difference of two consecutive timing measurements can result in a negative value (especially if some special timer function is used or if the (32-bit) timer value "wraps around").
149

12.4.5 Parameter TICK
ctcpost uses TICK value for scaling timer values to timing listing.
Example1: TICK=1
Example2: TICK=1000
The cost function usually returns the execution time given in some very small units (e.g. milliseconds). The timer values printed by ctcpost in the final execution timing listing are divided by the value of TICK. For example if the cost function returns the execution time in milliseconds, the definition“TICK=1000” causes the time to be displayed in seconds in the timing listing. The definition of TICK must represent a positive integer constant.
This parameter is normally global. You have to check the validity of this parameter, if you change the TIMER setting.
12.4.6 Parameter EXECUTION_COST_TYPE
This setting defines a string to ctcpost to be printed to the timing listing. It informs the reader about the type of execution cost values.
Example1: EXECUTION_COST_TYPE=Clock ticks
Example2: EXECUTION_COST_TYPE=Seconds
This parameter is normally global. The parameter should be consistent with TIMER and TICK settings.
12.4.7 Parameter EMBED_FUNCTION_NAME
Normally the instrumented program saves the counter data automatically at the end of its execution. If the counter data should also be saved in some other point, or saving at the end of execution is not possible, EMBED_FUNCTION_NAME (now not very good name on this feature, but it has certain history behind…) is one way to arrange it. If ctc sees a function whose name matches with any of the values in EMBED_FUNCTION_NAME, the instrumented program saves its data always when the function is executed. The behavior is the same as if there had been a user-inserted "#pragma CTC APPEND" immediately before each return and throw statement, and at the function end (provided that ctc considers that the program execution can flow to the function end-brace).
Example1: EMBED_FUNCTION_NAME=
150

Example2: EMBED_FUNCTION_NAME=foo
Example3: EMBED_FUNCTION_NAME=foo, bar, MyClass::method5
This setting is a list. Normally this parameter can be left empty as shown in the example1. It could be conveniently set by the -C command-line option in the ctc command. Example:
ctc –i m –C EMBED_FUNCTION_NAME=MyClass::close cl ...
The argument list item can also be a wildcard. It applies to all those functions whose names match the wildcard.
12.4.8 Parameter SKIP_FUNCTION_NAME
This parameter (not very good name either…) allows you to specify a list of functions that should be left uninstrumented, if encountered during the instrumentation. This is an alternate way for editing explicit #pragma CTC SKIP … #pragma CTC ENDSKIP lines around the functions.
The argument is a list of explicit function names or their wildcards. Only ‘*’ is supported as the wildcard character.
Example1: SKIP_FUNCTION_NAME=
Example2: SKIP_FUNCTION_NAME=foo2, MyClass::method6
Example3: SKIP_FUNCTION_NAME="moc*, YYClass::*,*xxx*"
Perhaps, rather than defining these functions in the configuration file, it might be more convenient to use the –C option at instrumentation time. Example.
ctc –i m –C “SKIP_FUNCTION_NAME=foo2,MyClass::*” cl …
12.4.9 Parameter COMMAND
Example: [Microsoft Visual C++] COMMAND = cl, cl.exe TYPE = compiler_linker
The COMMAND parameter advises ctc what is a command. For example, if there has been given on command line "ctc -i m cl -c myfile1.cpp", ctc expects to see a command after the possible ctc-specific options (here "-i m"). Here ctc sees "cl" and it expects to find a section in the ctc.ini file describing the command "cl".
151
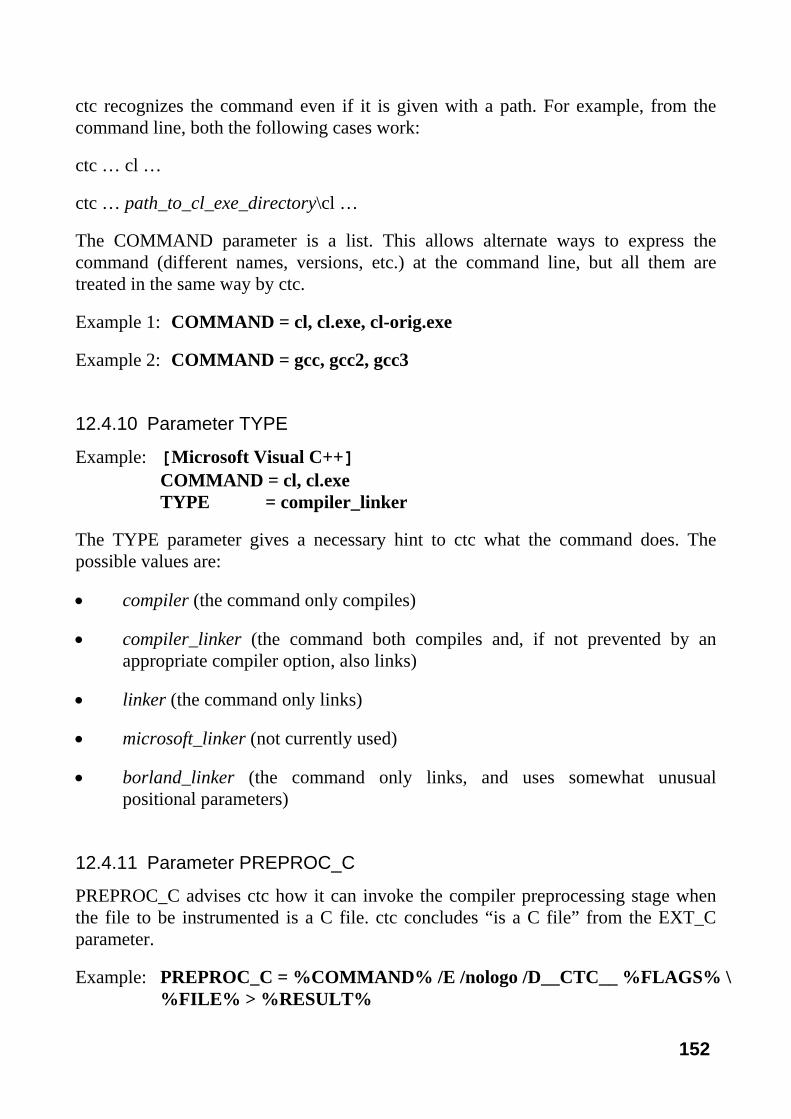
ctc recognizes the command even if it is given with a path. For example, from the command line, both the following cases work:
ctc … cl …
ctc … path_to_cl_exe_directory\cl …
The COMMAND parameter is a list. This allows alternate ways to express the command (different names, versions, etc.) at the command line, but all them are treated in the same way by ctc.
Example 1: COMMAND = cl, cl.exe, cl-orig.exe
Example 2: COMMAND = gcc, gcc2, gcc3
12.4.10 Parameter TYPE
Example: [Microsoft Visual C++] COMMAND = cl, cl.exe TYPE = compiler_linker
The TYPE parameter gives a necessary hint to ctc what the command does. The possible values are:
• compiler (the command only compiles)
• compiler_linker (the command both compiles and, if not prevented by an appropriate compiler option, also links)
• linker (the command only links)
• microsoft_linker (not currently used)
• borland_linker (the command only links, and uses somewhat unusual positional parameters)
12.4.11 Parameter PREPROC_C
PREPROC_C advises ctc how it can invoke the compiler preprocessing stage when the file to be instrumented is a C file. ctc concludes “is a C file” from the EXT_C parameter.
Example: PREPROC_C = %COMMAND% /E /nologo /D__CTC__ %FLAGS% \ %FILE% > %RESULT%
152

Example2: PREPROC_C = %COMMAND% -E -D__CTC__ %FLAGS% \ %FILE% -o %RESULT%
Here the %...% parts mean the following: %COMMAND% is the value of the COMMAND parameter, i.e. the actual compilation command (including the possible path-part as it may have been given in the command line). Into %FLAGS% ctc puts those options from the original compilation command that need to be preserved when the source file is preprocessed. %FILE% is the name of the original source file. %RESULT% is a ctc-generated internal temporary file name to receive the C-preprocessed version of the source file. The %FLAGS% part is optional.
Adding the -D__CTC__ macro is a useful convention. E.g. it enables you to write in original source code #ifdef __CTC__ … #endif sections, which come in effect only in ctc-instrumentation.
The C-preprocessing command is further affected by configuration parametres OPT_NO_PREPROC (takes the specified options away, if present) and OPT_ADD_PREPROC (adds the specified options). See their descriptions later.
If the compiler support –o option to specify the %RESULT% file, it should be used instead of ‘>’. This is because some compiler C-preprocessors may under some conditions write messages to stdout, and so they also come to the %RESULT% file and make the net result non-compilable.
Some “ctc-unfriendly” compilers, their C-preprocessing phase, do not support specifying the %RESULT% file. Instead it gets created under a name, which is derived from the source file name. In such situation intermediate phase RUN_AFTER_CPP can be used for moving the C-preprocessed file to the name and location (%RESULT%) as the CTC++ internal toolchain requires.
12.4.12 Parameter PREPROC_CXX
PREPROC_CXX is similar as PREPROC_C described above, but it is applied when the source file is C++ code. ctc concludes “is a C++ file” from the EXT_CXX parameter.
Example: PREPROC_CXX = %COMMAND% /E /nologo /D__CTC__%FLAGS% \ %FILE% > %RESULT%
153

12.4.13 Parameter OPTCHARS
This setting advises ctc what are the option characters that the command recognizes. This parameter is a list. If some option characters can be used interchangeably on the command line, those characters are given consecutively.
Examples: OPTCHARS = - OPTCHARS = -, + OPTCHARS = -/
In the second example some options start solely by '-' and some others solely by '+'. In the third example all options can start either with '-' or with '/' (as for example in the 'cl' command of the Microsoft Visual C++).
12.4.14 Parameter OPTFILE
This setting advises ctc with what character sequence a response file (options file, command file) is expressed on the command line. This parameter is a list. Normally the supported option character is only '@'.
Example: OPTFILE = @
If ctc needs to generate a response file (see MAX_CMDLINE_LENGTH parameter), it uses this setting.
Note: Do not confuse this to the @options-file parameter that ctc and ctcpost utilities themselves recognize as a way to give their command-line parameters. To ctc and ctcpost that file is always specified by @... .
With some compilers/linkers the situation can be more complicated. For example, there could be (option is two, three or four chars):
-@file A response file, normal case
-@@file A response file, with certain side effects
-@E=file Not a response file
-@E+file Not a response file
Here, the following settings advise ctc to recognize "-@" and "-@@" as response file options.
OPTFILE = -@@, -@
PARAMS = …., -@E=, -@E+, …
154
When ctc sees on the compilation command line an argument, which ctc suspects to specify a response file, ctc checks also the PARAMS list before making the decision. If there is a "better" (longer) option match in the PARAMS list than the suspected OPTFILE option is, the argument is not considered a response file. For example, if on command line there was "-@E=error.log", based on the starting characters "-@", it is initially suspected to specify a response file. But as in the PARAMS list there was a longer match "-@E=", this is after all not considered to be a response file.
In the input direction, ctc allows that the response file name is either connected to the option or separated with a space. Where ctc needs to generate a reponse file, and if the compiler/linker requires that the response file name is separated from the option by one space, the option must be listed also in the PARAMS_SEPARATE setting. For example
OPTFILE = --via
PARAMS_SEPARATE = … , --via, ...
When ctc sees a compiler/linker response file, it ”opens” it for seeing if there are any options or files that ctc should do something on, and in all cases uses in later phases the ”opened” form of the response file in constructing further commands. If the compiler/linker really uses a response file, but ctc is not informed of it (parameter OPTFILE is unset), in the response file there should not be any options or files that ctc should really pay some attention to.
See also OPT_NO_OPTFILE for some advanced situations how ctc constructs options files in case of long commands.
12.4.15 Parameter PARAMS
With PARAMS, PARAMS_SEPARATE, PARAMS_OPTIONAL and PARAMS_LIST (and with PARAMS_LIST_SEPARATOR), ctc is advised how certain command-line options and their possible arguments need to be parsed and associated to the option.
When ctc encounters an option from command line (which can be plain option or an option immediately followed by its parameter), it checks the command line item againsts these four lists. The option is searched from these settings in the above mentioned order. When an option (and its possible parameter) has been identified, further search is stopped. No match is also possible when the option is not any of these “parameter-category” ones.
Each one of these settings is a list of options. In all lists (except in PARAMS_SEPARATE), if there is a short option, which is same as the beginning of
155

a long option, the long option has to be before the short one. For example, gcc has options -iwithprefixbefore and -iwithprefix. They have one mandatory parameter, immediately following or as space separated. The longer one must be given first for ensuring correct parameter identification.
ctc should be advised at least of all options having such arguments that can be separated from the option. Otherwise ctc cannot associate the argument to the option and can interprete it in an unpredictable way. But ok, the configuration file definitions need not be complete, if ctc never faces the problematic/unspecified options.
The PARAMS setting advises ctc what options have one mandatory argument. The argument is connected to the option or, if the compiler or linker command allows it, it may also be separated from it. This definition is a list.
If the (mandatory or optional) argument of some option is always connected to the option and the option is of no interest to ctc, i.e. it may “just blindly be copied” to the command line by which the instrumented code is compiled, the option need not be mentioned in any of these four settings.
In later settings, notably in OPT_COMPILE_ONLY, OPT_COMP_OUT, OPT_LINK_OUT, OPT_NO_CTC, OPT_NO_PREPROC, OPT_NO_COMPILE, and OPT_NO_LINK, other options, which are not listed in these four settings, can be mentioned. Such “other options” must, however, be “simply-behaving” and they cannot have arguments.
Options having an argument (or a list of arguments) separated by a space from the option need to be listed in PARAMS, PARAMS_SEPARATE, or PARAMS_LIST so that ctc recognizes the argument and does not, for example, assume it to be a name of a file to be compiled. If the separating space is optional, the option belongs to PARAMS. If the separating space is mandatory, the option belongs to PARAMS_SEPARATE. If an option may take more than one argument, it belongs to PARAMS_LIST.
ctc looks these four settings in the order presented here and when a “match” is found, the “option category” gets determined.
Example: PARAMS = /Fe,/Fo,/Fp,/D,/U,/I,/Tc,/Tp,/V,/FI,/H,/Zm
This list is parsed from left to right until the first match, if any, is found. Thus, a longer option needs to be before a shorter one starting in the same way.
156
12.4.16 Parameter PARAMS_SEPARATE
This setting advises ctc of the options having one mandatory argument, which must always be separated from the option with at least one space. This definition is a list.
Example: PARAMS_SEPARATE = -o
12.4.17 Parameter PARAMS_OPTIONAL
This setting advises ctc of the options having an optional argument. The argument, if present, must be connected to the option (no space is allowed before the argument). This definition is a list.
Example: PARAMS_OPTIONAL = /Fa, /FA, /Fd, /Fm, /Fr, /FR, \ /Gs, /Yc, /Yu, /YX, /Zp
This list is parsed from left to right until the first match, if any, is found. Thus, a longer option needs to be before a shorter one starting in the same way.
12.4.18 Parameter PARAMS_LIST
This setting advises ctc of the options having a list of arguments (at least one) and the arguments being separated by a list separator (see PARAMS_LIST_SEPARATOR below). Further, the first argument must be separated from the option with at least one space.
The whole argument list is parsed (upto the last argument which is no more followed by the argument list separator character as defined in the PARAMS_LIST_SEPARATOR setting) and is associated to the option. Spaces before and after the argument list separator character are allowed.
Example: (see below PARAMS_LIST_SEPARATOR)
12.4.19 Parameter PARAMS_LIST_SEPARATOR
This setting is associated with PARAMS_LIST and advises ctc what character is used to separate the arguments of the options defined in PARAMS_LIST. Example:
PARAMS_LIST = -XX, -YY PARAMS_LIST_SEPARATOR = ,
Now, for example, the following commands could be parsed
ctc … xxcompiler … -XX arg1, arg2 ,arg3, arg4 … -YY arg1 …
157

Actually, several separator characters can be specified (example: PARAMS_LIST_SEPARATOR = ,:;) and each of the separator characters is interpreted as a replacement for each other.
When no separator character is specified, the rest of the command line is taken as the argument list of the option. Example:
COMMAND = cl TYPE = compiler_linker … PARAMS_LIST = /link PARAMS_LIST_SEPARATOR =
Now, for example, the arguments of /link are correctly associated to it:
ctc …cl file1.cpp file2.cpp /link /dll /out:somedll.dll somelib.lib
12.4.20 Parameter OPT_ADD_PREPROC
With this setting, the C-preprocessing command, which ctc internally uses, can be extended with some additional parameters.
Example: OPT_ADD_PREPROC = /ID:\path\to\some\dir
Whether the PREPROC_C or PREPROC_CXX C-preprocessing command model (see description of these settings above) is used, the addition is done after the %FLAGS% placeholder.
If there arises need for this setting, it may be the case that normal compilations are done with precompiled header files, but normal compilation's INCLUDE context is not sufficient to find all the needed header files when precompiled headers are not used. In such a case you might give the additional "-I help", typically from the commad line, something like
ctcwrap -i d -v -C OPT_ADD_PREPROC+-ID:\path\to\some\dir make all
12.4.21 Parameter OPT_COMPILE_ONLY
This setting advises ctc which options make only compilation and denies linkage. If the command could as such make linkage as well, ctc does not launch the linking phase with the command.
Example: OPT_COMPILE_ONLY = /c
158

Some compilers allow alternate options for “compile only”, like -c and -nolink. In such case, if both are also used, both of them need to be mentioned here.
12.4.22 Parameter OPT_COMP_OUT
This setting advises ctc which options are used for specifying the object output file of the compilation.
Example: OPT_COMP_OUT = /Fo
ctc uses this option when compiling the instrumented source file to object file for getting the object file name right.
12.4.23 Parameter OPT_LINK_OUT
This setting advises ctc which options are used for specifying the linkage output file.
Example: OPT_LINK_OUT = /Fe
12.4.24 Parameter OPT_NO_CTC
This setting is a list. When ctc sees any of these options, ctc will not do any instrumentation or linking on the files it sees on the command line, only emits the original command with its original parameters.
Example: OPT_NO_CTC = /E, /EP, /P, /?, /help, /HELP, /Zg, /Zs
12.4.25 Parameter OPT_NO_PREPROC
This setting is a list. Here ctc is informed of such command options, which, even if present on command line, will not be used in the ctc-invoked command for doing the C/C++-preprocessing as suggested in parameters PREPROC_C and PREPROC_CXX.
Example: OPT_NO_PREPROC = /link,/Fp,/Yc,/Yu,/YX,/FR,/Fr
12.4.26 Parameter OPT_NO_COMPILE
This setting is a list. Here ctc is informed of such command options, which, even if present on command line, will not be used in the ctc-invoked command by which the instrumented source file is compiled to an object file.
159

Example: OPT_NO_COMPILE = /D,/I,/FI,/link,/Yc,/Yu,/YX,/FR,/Fr
Options that can be listed here fall to categories
• Options that have had their effect already at the C-preprocessing phase. In the above example the /D and /I options are dropped off from the command by which the instrumented code is compiled.
• Options which advise linker.
• Options which are related to generation and use of precompiled headers or generation of dependency files. Those options cannot be used when compiling the ctc-named temporary instrumented file. In ctc’s toolchain these situations are handled differently.
12.4.27 Parameter OPT_ADD_COMPILE
This setting is a list. Here ctc is advised what options and other arguments it should add on the ctc-invoked command line by which the instrumented source file is compiled to an object file.
Example: OPT_ADD_COMPILE = /I$(CTCHOME), /nologo
Minimally this setting must contain the –Idirectory where the ctc.h file is found when compiling the instrumented file.
If you want some –D flags to be applied on ctc.h file (when compiling the instrumented code), you need to given them by this configuration parameter. For example as follows
ctc ...–C OPT_ADD_COMPILE+-DCTC_SAFE cl –c ...
The following would not have effect
ctc ... cl -c –DCTC_SAFE ...
12.4.28 Parameter OPT_DO_2COMP
This parameter is a kind of replacement on explicit ctc option -2comp. If the compilation command has any of the options listed in this parameter, the original (compilation) command is first executed as such. After that normal instrumentation processing is done on the command.
Example: OPT_DO_2COMP = /Fr,/FR
160

These options are Visual C++ (cl) options for generating source browsing files. For those files being meaningful they need to be generated based in the compilation of the original source files, not in the compilation of the ctc-named temporary instrumented files. Doing a ctc-free compilation first generates these dependency files with their correct names.
Using this OPT_DO_2COMP is more “economical” than always using ctc option -2comp, because the “double-compilation” gets done only when needed.
12.4.29 Parameter EXT_C
This setting is a list. Here ctc is advised how it can judge if a file is a C file or not. If an item on the compilation command line, which is not an option or an argument to it, ends to '.' followed to one of the extensions specified here, ctc considers the file to be a C source file.
Example: EXT_C = c
If the parameter value is empty, it signifies to ctc that the current compilation command will not handle C files at all, that all the files that the command compiles are C++ files at most.
As said the argument is a list. One possible list value is %DEFAULT%. See discussion of it below along with option EXT_OTHER.
12.4.30 Parameter EXT_CXX
This setting is a list. Here ctc is advised how it can judge if a file is a C++ file or not. If an item on the compilation command line, which is not an option or an argument to it, ends to '.' followed to one of the extensions specified here, ctc considers the file to be a C++ source file.
Example: EXT_CXX = cpp, cxx, cc, C
If the parameter value is empty, it signifies to ctc that the current compilation command will not handle C++ files at all, that all the files that the command compiles are C files at most.
As said the argument is a list. One possible list value is %DEFAULT%. See discussion of it below along with option EXT_OTHER.
161

12.4.31 Parameter EXT_OTHER
This setting is a list. Here ctc is advised of other types of files (besides those specified in EXT_C and EXT_CXX) that ctc should be aware of and which files will not be instrumented. For example, assuming that the command can compile besides C and C++ files, also assembler files, and the assembler file extension is .asm, then the corresponding assembler file extension would be mentioned in this EXT_OTHER.
Related to all the EXT_C, EXT_CXX and EXT_OTHER definitions, they can have as a value %DEFAULT%. It means any extension, which is not known to ctc, or a situation when the file has not an extension at all. The %DEFAULT% string can be at most in one of these EXT_C, EXT_CXX or EXT_OTHER. Normally it is in EXT_OTHER signifying that all unknown type files are not instrumented.
Example: EXT_OTHER = %DEFAULT%
12.4.32 Parameter EXT_CSHARP
This setting is a list, similar to EXT_CXX. This is introduced in v7.1. Currently ctc instruments C# code assuming it be C++ code. In v7.1 the only exception is C#’s special loop structure “foreach(…){…}”, which is recognized and instrumented only, if the file name has an extension specified in this EXT_CSHARP parameter. In future CTC++ versions there may come other C# specific special features, whose proper handling as C# code depends on this setting.
Example: EXT_CSHARP = cs
12.4.33 Parameter EXT_JAVA
This setting is a list, similar to EXT_CXX. This is introduced in v7.1. In v7.1 ctc instruments Java code assuming it be C++ code. In future CTC++ versions there may come Java specific special features, whose proper handling as Java code depends on this setting.
Example: EXT_JAVA = java
12.4.34 Parameter OBJECT_EXTENSION
Here ctc is advised what is the extension for object files.
Example: OBJECT_EXTENSION = obj
162
12.4.35 Parameter DIFF_COMP_AND_LINK_OPTS
ctc plays with commands that do compile-only, do compile-and-link, or do link-only. For the compile activity and link activity the command has some option, as defined in OPT_COMP_OUT and OPT_LINK_OUT. Here ctc is advised, if the compiler output file option is different (argument ON) or is not different (argument OFF) from the linker output file option. For example, with Microsoft Visual C++ the definition is ON, because the cl command has "/Fo" for output object files and "/Fe" for output executable files. But with gcc the definition is OFF because "-o" is used both for object files and for target executables.
Example: DIFF_COMP_AND_LINK_OPTS = ON
12.4.36 Parameter LIBRARY
This setting is a list. Here ctc is advised what it should add on the command line when linkage is done. The primary purpose is to introduce the CTC++ run-time library, which needs to be linked into the instrumented executable. Also other libraries and/or command-line options could be introduced.
Example: LIBRARY = $(CTCHOME)\Lib\ctcmsnt.lib, /nologo Example: LIBRARY = $(CTCHOME)\Lib\ctcmsnt64.lib, /nologo
12.4.37 Parameter OPT_NO_LINK
This setting is a list. Here ctc is informed of such command options, which, even if present on command line, will not be used in the ctc-invoked command by which the instrumented object files are linked.
Example: OPT_NO_LINK = /TC,/TP
12.4.38 Parameters DIALECT_C and DIALECT_CXX
Some C/C++ compilers have some reserved words of their own in addition to those defined by ANSI C/C++. ctc needs to know what C or C++ dialect is used to be able to analyze code containing these additional keywords. The DIALECT_C and DIALECT_CXX parameter can be used to select the C and C++ programming language dialects according to which ctc processes the files. The selected dialect also affects the appearance of the instrumented code that is generated. Moreover, this dialect setting advises ctc what syntax it assumes for inline assembly code. For example, with the gcc compiler (ANSI dialect) the inline assembly code syntax is different from the cl compiler’s (MICROSOFT dialect).
163

The definitions of DIALECT_C and DIALECT_CXX need not be the same.
The supported dialects are:
ANSI ANSI C and C++. In Unixes this should be used.
MICROSOFT ANSI C and C++ with Microsoft extension keywords, e.g., __declspec.
BORLAND ANSI C and C++ with Borland extension keywords. Also advises ctc of the C/C++ preprocessed file format, which is Borland-specific.
Example: DIALECT_C = MICROSOFT
12.4.39 Parameter TMP_DIRECTORY
ctc uses temporary files when doing the instrumentation. Here ctc is advised into what directory it can create those temporary files. ctc automatically deletes those temporary files unless -k (keep) option has been used.
Example: TMP_DIRECTORY = $(TEMP)
Example: TMP_DIRECTORY = /usr/local/tmp
Example: TMP_DIRECTORY = .
12.4.40 Parameter EXCLUDE, NO_EXCLUDE and NO_INCLUDE
These settings are used to control should a source file be instrumented or not. ctc sees source files in two ways. Firstly, the file can be given explicitly on the command line. Secondly, if the file given on the command line has been accepted to be instrumented, other files may become visible via #including, and the question is shall the #included code be instrumented or not.
EXCLUDE, NO_EXCLUDE and NO_INCLUDE are lists, where the elements are certain kind of "file match items" (see description below). First ctc considers the EXCLUDE list. If the filename matches to any of the items in the list, the file is not instrumented, only compiled. Or, if the file is #included in another file, which is instrumented, the code coming from this #included file is not instrumented.
Next ctc looks at the NO_EXCLUDE list. If the filename matches any of the items in that list, the file (the code coming from that file) will be instrumented after all.
164

But before finally deciding on the file, ctc still looks at the NO_INCLUDE list. If the filename matches any of the items in that list, the file (the code coming from that file) will not be instrumented.
This EXCLUDE/NO_EXCLUDE/NO_INCLUDE modeling has evolved over CTC++ versions. It is meant to be simple and intuitive. However the pattern matching capability in it is not full "regular expressions". Also there are some special cases.
As mentioned these settings are lists. The list items are a kind of "file match items". And with each of them a question is asked does the given pattern match to the concrete file. In these explanations it is assumed that the current work directory, where the instrumentation is done, is D:\Work\Dir1. When comparing the real file name (a file whose name was given at the compilation command line, or which was #included to the file to be instrumented), it is converted to absolute path, if needed. For example, if at the compilation command line the file is given as ..\Dir2\file.c, D:\Work\Dir2\file.c is the real file name that is compared. On Windows the comparison is case-insensitive and insensitive of the used directory separator ‘\’ and ‘/’.
The EXCLUDE/NO_EXCLUDE/NO_INCLUDE "file match items" are assessed, in left to right order, as follows:
%INCLUDES% This is a special marking and designates an #included file. If the real file is #included to the compilation (either directly or indirectly), we have a match.
* Matches all files.
*. We have a match, if the basename (i.e. possible directories stripped off) has no extension. E.g. "file"
*.* We have a match, if the basename (i.e. possible directories stripped off) has an extension. E.g. "file.c".
*EEEEE The pattern starts with '*' and has no other '*' chars: We have a match, if the real file name ends with "EEEEE". E.g. "*.c" matches all files that end with ".c". E.g.2 "*\file.c" matches all "file.c" files in all directories.
FFFFF The pattern has no '*', and FFFFF designates a file: The file can be given with absolute path, e.g. "D:\Work\Dir1\file.c", or relatively to current directory, e.g. "file.c", meaning "D:\Work\Dir1\file.c". E.g.2: "..\Dir2\file.c" means "D:\Work\Dir2\file.c". We have a match, if the real file is the same as the pattern suggests. E.g.3: If the setting has "file.c" (meaning that file in the current directory)
165
and the file specification given on the command line specifies the same file (in the current directory), there is a match.
DDDDD The pattern has no '*', and DDDDD designates a directory: The directory can be given with absolute path, e.g. "D:\Work\Dir2", or relatively to current directory, e.g. "..\Dir2", meaning "D:\Work\Dir2". The directory designations can be given also with the trailing directory separator, as "D:\Work\Dir2\\" and "..\Dir2\\" correspondingly. We have a match, if the real file is at the designated directory or in any of its subdirectory.
Note: A more natural, and now the recommended style, is to designate the directories with '*' at the end of the pattern, e.g. "D:\Work\Dir2\*" and "..\Dir2\*". The "*-less" is way to designate the directory is kept for compatibility reasons to prior CTC++ v6.3 versions.
pattern The pattern contains one or more '*' characters. Note that the case when there is one '*', which is at the beginning of the pattern is already handled above!
For example, assume pattern "*abc*de*". Matching is done from left to right. First '*' matches zero or more characters. First "abc" gets freezed. Then the second '*' matches to zero or more characters until "de" is found. The last '*' matches to the possible remaining characters in the real file name.
More examples: Assume the real file name to be "D:\Work\Dir2\file.c". The following patterns: "D:\*.c" => match, "*\dir2\*" => match, "*\Dir*.cpp" => no match, "f*.c" (effectively meas "D:\Work\Dir1\f*.c") => no match, "..\Dir2\*.c" (effectively meaning "D:\Work\Dir2\f*.c") => match.
A reasonable and typical definition is
EXCLUDE = %INCLUDES% NO_EXCLUDE = NO_INCLUDE=
The thinking in the above is that all files are instrumented except code coming from #included files (EXCLUDE=%INCLUDES%). The NO_EXCLUDE and NO_INCLUDE have no additional effect. This is also the default setting the ctc.ini file.
166

Then consider the following usage case
ctcwrap –i m –C “EXCLUDE=*” \ -C “NO_EXCLUDE=*\dir5\*,*\dir7\*” \ -C “NO_INCLUDE=%INCLUDES%” \ -C “NO_INCLUDE+*\dir5\subdir2\*,*\dir7\file77.cpp” \ make –f bigbuild.mak clean all
Here the thinking is that first nothing is instrumented (EXCLUDE=*). Then with the NO_EXCLUDE setting we say that files coming from directories *\dir5 and *\dir7 are instrumented after all. But finally with the NO_INCLUDE setting we rule out instrumentation of code coming from any #included files, subdirectory *\dir5\subdir2 and one individual file *\dir7\file77.cpp. In the above, understand also the use of ‘=’ and ‘+’.
More usage examples: Assume Xheader.h contains code, perhaps member function inline code or template code that we want to instrument. Use:
ctc …. -C "NO_EXCLUDE+*\Xheader.h" cl ….
Assume that in a build we compile and instrument a large number of files, but files from Dir2 directory should be left as un-instrumented. Use:
ctc …. -C "EXCLUDE+*\Dir2\*" cl ….
12.4.41 Parameter SOURCE_IDENTIFICATION
ctc keeps track of the instrumented source files in a symbolfile. The name of the file determines how ctc separates two files from each other. (The instrumentation timestamp has also its effect, but that topic is not discussed here).
This parameter specifies how ctc records the source file name that is instrumented. The recorded form is then used troughout the rest of the "ctc-machinery": at the instrumented program execution time when updating the datafile and at ctcpost time when writing the coverage reports. The allowed values for this parameter are:
as_given Exactly in the same form as given in the compilation command line. E.g., if "ctc … cl … ..\Dir2\file.c", the name "..\Dir2\file.c" is used. This is the default setting and conforms to the pre CTC++ v6.3 behavior.
basename The possible path is stripped-off. In the above example the file is known as "file.c". You might use this setting, if your program memory is extremely limited. Shorter file name literals will be
167
generated into the instrumented code. But you should be aware of possible file name conflicts (which ctc handles in its way), if you have several files with the same basename in several directories.
absolute If needed, the source file name is converted to absolute. In the above example "..\Dir2\file.c" would become "D:\work\Dir2\file.c". You might use this setting if you have two or more build contexts and the same source files are instrumented in them but referred to with varying relative paths. With this setting ctc understands that the same file is meant in both cases. Another good reason to use “absolute” is that you want the coverage reports to contain directory names (e.g. ctc2html makes the HTML report grouped by directories).
absolute_without_drive
Like the previous one, but the drive designation is left out. In the above example "..\Dir2\file.c" would become "\Work\Dir2\file.c". Some (Windows-hosted) development environments use this convention to specify source files.
Above, when describing the EXCLUDE, NO_EXCLUDE and NO_INCLUDE parameters, there is a step where the source file (as it is given on the command line) is compared against certain file name patterns. When that comparison is made this SOURCE _IDENTIFICATION "treatment" is not yet done.
If you instrument #included code, it shows in an execution profile listing with exactly the same file name that the C preprocessing phase has determined (in #line directives). I.e. for those file names this SOURCE_IDENTIFICATION setting has no effect.
12.4.42 Parameter MAX_CMDLINE_LENGTH
ctc constructs and issues some operating system commands (C/C++-preprocessing, C/C++-compilation/linking). This parameter specifies the maximum length of the shell command line. If the constructed command to be issued would become “too long”, under some conditions ctc uses its own response file, i.e. in a way off-loads long constructed command to a separate text file.
First condition is that parameter OPTFILE specifies the option that the command recognizes as “response file option”. Second condition is that this parameter MAX_CMDLINE_LENGTH specifies some limit. If either of these parameters is
168

unset, ctc does not use response files, but constructs and issues the command as as long it becomes.
Because Unixes do not have limitations on command line lengths, the MAX_CMDLINE_LENGTH can be empty (recommended).
At Windows (when Windows XP or later, and partly because of ctc internal technical reasons, not explaining the details) it is recommended to use 8191 on MAX_CMDLINE_LENGTH.
12.4.43 Parameter OPT_NO_OPTFILE
Some compilers/linkers have special options, which they require as first on the command line. Or they cannot recognize the option, if it resides in a response file. In a situation where ctc has constructed a response file, such option would also be put into a response file, and things would not work. Parameter OPT_NO_OPTFILE is meant to handle these situations. Here is an example (Microsoft link command):
OPTFILE = @ MAX_CMDLINE_LENGTH = 8191 OPT_NO_OPTFILE = /lib, -lib
In link command the /lib (or –lib) must be the first argument and it cannot be in a response file. This parameter setting leaves this option to the constructed command line and does not move it to the constructed response file in case of a long command.
When you look at the ctc.ini link block parameter OPT_NO_CTC, the /lib is mentioned also there. OPT_NO_CTC means that in the presence of the listed options, ctc should not do anything (in linking a static library, not even a ctc runtime library is added), only run the original link command. But “running the original link command” does not mean that it could not come “too long”, e.g. if wildcards were opened or if original response files were opened.
In QCC compiler case the option –lang-c++ needs to be handled also by parameter OPT_NO_OPTFILE, if danger of long commands.
12.4.44 Parameter DATAFILE
In the normal course of work, the datafile name is MON.dat. When the instrumented program ends, coverage data is written to that file in the directory where the instrumentation took place (where MON.sym resides). The ctc -n option, ctc2dat -o option and environment variable CTC_DATA_PATH has certain effect here, but not discussed now.
169
With the DATAFILE parameter the (path and) name of the datafile can be determined explicitly, not following the derivation rule from the symbolfile. The possible DATAFILE argument values are:
- %DEFAULT%: Datafile path and name is derived from the symbolfile.
- explicit_path_and_name: The given file name is used (.dat extension added, if not given).
Example: DATAFILE = %DEFAULT% Example: DATAFILE = ABC.dat
12.4.45 Parameter WARNING_LEVEL
At instrumentation phase ctc can give some warnings. Whether those warningsa are ultimately displayed or not can be controlled with WARNING_LEVEL parameter. Its possible values are “none”, “warn” and “info”.
- none: no warnings are displayed. Same effect as -no-warnings ctc-option.
- warn: normal warnings are displyed.
- info: besides normal warnings also warnings that could be categorized as “tool limitation” are displayed.
Example: WARNING_LEVEL = warn
12.4.46 Using Additional/User-Defined Instrumentation Phases
There are four configuration parameters: RUN_BEFORE_ALL, RUN_AFTER_CPP, RUN_AFTER_INSTR and RUN_AFTER_COMP. These options are meant for "ctc integrators", not for normal users.
Normally these settings are empty, in which case nothing additional is done. The arguments of these settings are lists, and one list element is a name of a program (or a script file), which ctc calls at corresponding instrumentation phase, as follows:
RUN_BEFORE_ALL:
The specified program is called when ctc has identified, what the compiler or linker command was, and has parsed the command line, but has not yet started the actual "ctc-processing". The program that is invoked is given as arguments:
- return file name, e.g. "I:\temp\CTC.3088.0.ret", in ARGV[1]
170

- compiler or linker command name, e.g. "cc386", in ARGV[2]. The command has also the path part, if it was used.
- the rest of the command line arguments in ARGV[3]….
Additionally, the invoked program can read from the environment variable CTCOPTS (ctc has set it) what were the ctc-options by which ctc was initially called.
In the invoked program you can analyse the ctc-options and the command line and do whatever you find appropriate. But especially the invoked program can give feedback to ctc on how it should process the user's command.
The feedback arrangement is the following: The return file is an empty existing file, created by ctc. The invoked program opens the return file for writing and writes there new ctc-options, which supplement or override the ctc-options that were initially given (as seen in CTCOPTS). The return file is a text file. The ctc-options can be all on one line, or they can be on multiple lines. "…" safeguarding on arguments needs to be used in the same way as when giving ctc-options from the command line. -V and -c options cannot be used (they would be meaningless), because they are already processed.
The RUN_BEFORE_ALL could be used for example:
- to fine-tune EXCLUDE/NO_EXCLUDE/NO_INCLUDE settings. Note that here you need to “dress” these configuration file modifications to ctc’s –C option.
- to enforce -n option based on source file path and name
- to study if there are problematic compiler options, e.g. some dependency file generation, and act accordingly, e.g. enforce the -2comp option.
RUN_AFTER_CPP:
The specified program is called just after ctc has done the C-preprocessing phase to the original source file. As arguments to the program that is invoked it is given
- compilation command, e.g. "cc386", in ARGV[1]
- name of the original source file, e.g. "myfile.c", in ARGV[2]
- name of the temporary file, where the C-preprocessed code has been generated to, e.g. "I:\temp\CTC.3048.1.i", in ARGV[3]
171

- the original compilation command in full, eg. "cc386 -c myfile.c", in ARGV[4],…
The script can read the used ctc options from the CTCOPTS environment variable.
RUN_AFTER_INSTR:
The specified program is called just after ctc has done the instrumentation of the C-preprocessed file and written the instrumented temporary file of the source. As arguments to the program that is invoked it is given
- compilation command, e.g. "cc386", in ARGV[1]
- name of the original source file, e.g. "myfile.c", in ARGV[2]
- name of the temporary file, which contains the instrumented version of the source file, e.g. "I:\temp\CTC.3048.2.c", in ARGV[3]
- the original compilation command in full, eg. "cc386 -c myfile.c", in ARGV[4]…
The script can read the used ctc options from the CTCOPTS environment variable.
RUN_AFTER_COMP:
The specified program is called just after ctc has done the compilation of the instrumented file and an instrumented version of the object file has been obtained. As arguments to the program that is invoked it is given
- compilation command, e.g. "cc386", in ARGV[1]
- name of the original source file, e.g. "myfile.c", in ARGV[2]
- name of the temporary file, which contains the instrumented version of the source file, e.g. "I:\temp\CTC.3048.2.c", in ARGV[3]
- the original compilation command in full, eg. "cc386 -c myfile.c", in ARGV[4]…
The script can read the used ctc options from the CTCOPTS environment variable.
These additional instrumentation steps are meant for advanced CTC++ users only. Especially in some CTC++ Host-target use cases there can be such difficult (or "non-standard") compilers that need additional processing phases in the instrumentation.
172

For example, one compiler did not have an option to name the object file that the compiler produces. Instead it produced the object file name based on the source file. In RUN_AFTER_COMP this can be fixed by copying or renaming the object file to its correct name based how it should come according to the original source file name.
Another example is handling some exotic C compiler inline assembly dialects or other non-standard compiler directives. In RUN_AFTER_CPP these code fragments can be "hidden" from the source file, then let ctc to do its instrumentation (and ctc does not get confused of these non-standard structures). Then in RUN_AFTER_INSTR phase the "hidden" code fragments are made again "visible", for the final compilation.
173

13. Host-Target Testing
13.1 Introduction
The CTC++ Host-Target add-on, sometimes called HOTA, is an extension package to the basic CTC++ host-only. It is the same on all host platforms.
The CTC++ Host-Target add-on facilitates the following use scenario: instrumenting/compiling/linking the source code in the host (your cross-compiler for the target is used here), down-loading the instrumented program for execution into a target (perhaps some embedded system), capturing the execution counters back to the host, producing the execution profile and other listings in the host.
The instrumentation/compilation phase is as with the true host-based CTC++, only the CTC++ run-time library is provided in C source form (a somewhat stripped version of it).
The test runs in the target and execution capturing back to the host is illustrated in the following picture.
Program under test, some portions of it instrumented
CTC++ target run-time routines
Sender funct.
Datafile
ctc2dat utility
Low level receiver program
Text file
Host computer Target computer
or 3)
or 2)Text file
move separatelyto host1)
or 4)
174

There are four thinkable ways how the coverage data is got from the target to the host: 1) If the target environment supports normal C file I/O, the coverage data is written to a text file at the target side, and you separately move it to the host. 2) Some targets allow writing a text file directly to the host's file system. 3) Using some communication means (serial line, whatever…), the data is written to the host to your program, which writes the data to a text file. 4) The sender function writes the coverage data to some communication line, which the ctc2dat utility at the host can read directly.
Writing the textualised coverage data needs no CTC++ internal knowledge. The data is just printable ASCII characters, which are pulled out from the CTC++ layer one by one and written to a file.
The textual form coverage data is inputted to the ctc2dat utility, which converts it to a binary form datatafile, and if the file existed previously, sums up the coverage data of the previous test sessions in the same way as in the host based use.
The human readable reports are obtained with CTC++ Postprocessor (ctcpost) and CTC++ to HTML converter (ctc2html) in the host in a normal manner.
The arrangement assumes that you have a full CTC++ for the host environment.
The CTC++ HOTA architecture does not assume any specific target environment, like what type of hardware it is, what operating system (if any) it runs, what cross-compiler is used. However, the cross-compiler is assumed to run in the host environment, where the CTC++ Preprocessor (ctc) runs. Further it is assumed that you implement the low-level data transfer layer between your host and target machines.
The code to be instrumented for the target can be C or C++.
In using the CTC++ Host-Target add-on package there are certain setup type of tasks that need to be done. They need to be done only once per each host-target pair and they are:
• Host side: "Teaching" to CTC++ System the used cross-compiler command and its options. This is done by establishing a new configuration block in the ctc.ini file. Read more of this from section '13.2 - "Teaching" the Cross-Compiler Command and its Options to CTC++'.
• Host side: Also, if you are normally using makefile based builds, which emit compile and link commands to your cross-compiler, and you want to use the ctcwrap command for doing "ctc-build", you need to "teach" the ctcwrap utility to know your cross-compiler and linker. Read more from "5.15.1 - ctcwrap Utility".
175

• Target side: Implementing the sender function. It is a simple C function void ctc_send_data() (its interface and definition is simple, the implementation may be more laborious), whose mission is to write ASCII characters, one at a time, although the routine may do simple line-buffering, to “somewhere”. These characters should ultimately come to host side to input to ctc2dat utility. If a file-based data transfer is used, this is simply writing a text file, and there is a default implementation for the function (assuming the availability stdio).
• Target side: Customizing some functions (ctc_alloc(), ctc_exit() and ctc_show_error()) if needed. There is a default implementation, which assumes the availability of stdlib. ctc_alloc() needs to be implemented only if the ctc counters vectors are allocated from heap (by default ctc does the instrumentation so that the counter vectors are statically allocated inside the code files). Implementing functions ctc_exit() and ctc_show_error() is somewhat “optical”, primarily just to get error conditions reported better.
• Target side: Using the cross-compiler to compile the CTC++ run-time support layer, to be linked to the instrumented programs. Most part of it comes in C source code form, but it contains your implementation of the ctc_send_data() function, if you cannot use the default implementation.
• Host side: If you have to use some line communication means to read the textualised coverage data from the target, you need to implement the program, which reads the communication line and writes the data to a text file. But if you get the textualised coverage data to the host side already in a file, you are saved from doing anything for this. It may also be possible that ctc2dat utility can read the communication line like a file, and once the reading seems to be done, ctc2dat can be terminated e.g. by control-C.
Of course the target must have enough memory to bear the instrumentation overhead that CTC++ brings. It is generally quite modest. It can also be controlled by instrumentation modes (some modes are more light-weight than some others) and/or instrumenting only selected files, if the overhead is an issue.
The tasks to be done at each normal use-cycle of the CTC++ Host-Target add-on:
• The code is instrumented in the host. In this phase the CTC++ Preprocessor (ctc) must be used together with the cross C/C++ compiler for the target, not with the native host C/C++ compiler. This phase results in the instrumented and compiled object files and a symbolfile describing the instrumented source files.
• The instrumented object files, the target-specific CTC++ run-time library (provided in the HOTA delivery package in C-source form), the function
176
ctc_send_data(), and possible other non-instrumented code sections for the target are compiled/linked to the target executable with the cross compiler/linker.
• The instrumented executable is downloaded to the target and executed there.
• Depending on how the coverage transfer from the target to the host is arranged: 1) writing a file to the target machine: move it to the host, 2) writing a file directly to the host machine: ok, life is easy to you, 3) writing the coverage data to the host by some communication channel: you need to ensure that the receiver program at the host is running and ready to read the coverage data, when the target sends it.
• Run the ctc2dat program at the host and give it the textual form coverage data file as input. ctc2dat converts the textual form coverage data to a binary form datafile.
• Finally the normal host-based CTC++ Postprocessor (ctcpost) and CTC++ to HTML converter (ctc2html) are used to get the human-readable reports visible.
13.2 "Teaching" the Cross-Compiler Command and its Options to CTC++
Assume that the cross compiler that runs in the host is started with command 'xcc'. So, the compilations are done something like
xcc -c myfile1.c ...
and we would like to do the instrumentations like
ctc -i m xcc -c myfile1.c ...
We must teach to ctc that xcc is a command and how ctc should treat with the xcc command options.
What we need to do is to introduce into ctc.ini file a new command block for the xcc. So we add something like
[The xcc cross compiler for xxx target] COMMAND = xcc, xcc.exe TYPE = compiler_linker ...
See the xcc compiler documentation what options it uses. Then read chapter "0 -
177

Configuring CTC++" for more detailed instructions on how the compiler and its options are introduced to CTC++.
If the cross compiler uses a separate cross linker as well, say 'xlink' command, that needs to be introduced also into ctc.ini. That would mean another block there, something like
[The xlink cross linker for xxx target] COMMAND = xlink, xlink.exe TYPE = linker ...
In this specific case, assuming that the platform is Windows, you might also "teach" xcc and xlink to the ctcwrap utility. You would edit to %ctchome%\wrapcmds.txt file two lines, xcc.exe and xlink.exe.
CTC++ has been used with quite many different cross-compilers. You might ask the vendor, if he already has a working ctc.ini file for your cross-compiler.
13.3 Textualised Coverage Data File Format
The format is:
Header_comment_text coverage_data
There can be many of them in the file (reflecting how many times at the test session the coverage data has been written out).
The header_comment_text is either empty or any commentary text lines not having "<START:". For example date and time of the coverage data writing could be documented here for logging/debugging purposes.
The coverage_data starts with "<START:" and ends with ">". In the between there are printable ASCII characters carrying the encoded coverage data. Between any of these characters there can be '\n' (newline) characters, which have no effect (other than readability).
Textualised coverage data file could look as follows (from ‘Prime’ example, which has three code files):
Dump of CTC++ coverage data from target at Wed Feb 12 15:07:30 2014: <START:MODUL,6,b,1,4,3,4,0,1QeTf8,1b,1Z,1k,1b,k,1b,18,w,1U,1b,1s,1b, 1v,1n,1q,1j,1U,1u,t,m,1U,1s,1d,1r,1s,1r,1U,1g,1n,1s,1Z,1s,1d,1r,1s,1 U,1F,1H,1G,k,1c,1Z,1s,3,1,1,0,1,1,0,0,1,1,0,2,0,1,0,MODUL,4,b,2,2,1, 0,0,1QeTdB,1h,1n,k,1b,18,w,1U,1b,1s,1b,1v,1n,1q,1j,1U,1u,t,m,1U,1s,1 d,1r,1s,1r,1U,1g,1n,1s,1Z,1s,1d,1r,1s,1U,1F,1H,1G,k,1c,1Z,1s,4,3,4,3
178
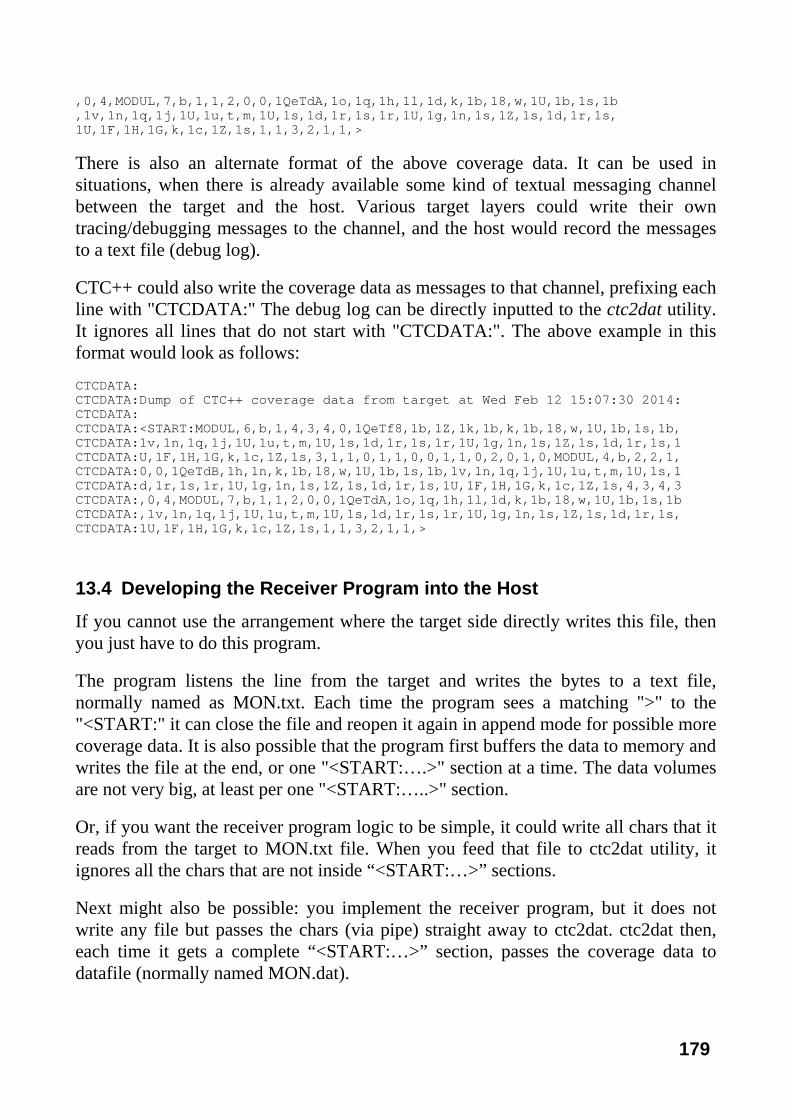
,0,4,MODUL,7,b,1,1,2,0,0,1QeTdA,1o,1q,1h,1l,1d,k,1b,18,w,1U,1b,1s,1b ,1v,1n,1q,1j,1U,1u,t,m,1U,1s,1d,1r,1s,1r,1U,1g,1n,1s,1Z,1s,1d,1r,1s, 1U,1F,1H,1G,k,1c,1Z,1s,1,1,3,2,1,1,>
There is also an alternate format of the above coverage data. It can be used in situations, when there is already available some kind of textual messaging channel between the target and the host. Various target layers could write their own tracing/debugging messages to the channel, and the host would record the messages to a text file (debug log).
CTC++ could also write the coverage data as messages to that channel, prefixing each line with "CTCDATA:" The debug log can be directly inputted to the ctc2dat utility. It ignores all lines that do not start with "CTCDATA:". The above example in this format would look as follows:
CTCDATA: CTCDATA:Dump of CTC++ coverage data from target at Wed Feb 12 15:07:30 2014: CTCDATA: CTCDATA:<START:MODUL,6,b,1,4,3,4,0,1QeTf8,1b,1Z,1k,1b,k,1b,18,w,1U,1b,1s,1b, CTCDATA:1v,1n,1q,1j,1U,1u,t,m,1U,1s,1d,1r,1s,1r,1U,1g,1n,1s,1Z,1s,1d,1r,1s,1 CTCDATA:U,1F,1H,1G,k,1c,1Z,1s,3,1,1,0,1,1,0,0,1,1,0,2,0,1,0,MODUL,4,b,2,2,1, CTCDATA:0,0,1QeTdB,1h,1n,k,1b,18,w,1U,1b,1s,1b,1v,1n,1q,1j,1U,1u,t,m,1U,1s,1 CTCDATA:d,1r,1s,1r,1U,1g,1n,1s,1Z,1s,1d,1r,1s,1U,1F,1H,1G,k,1c,1Z,1s,4,3,4,3 CTCDATA:,0,4,MODUL,7,b,1,1,2,0,0,1QeTdA,1o,1q,1h,1l,1d,k,1b,18,w,1U,1b,1s,1b CTCDATA:,1v,1n,1q,1j,1U,1u,t,m,1U,1s,1d,1r,1s,1r,1U,1g,1n,1s,1Z,1s,1d,1r,1s, CTCDATA:1U,1F,1H,1G,k,1c,1Z,1s,1,1,3,2,1,1,>
13.4 Developing the Receiver Program into the Host
If you cannot use the arrangement where the target side directly writes this file, then you just have to do this program.
The program listens the line from the target and writes the bytes to a text file, normally named as MON.txt. Each time the program sees a matching ">" to the "<START:" it can close the file and reopen it again in append mode for possible more coverage data. It is also possible that the program first buffers the data to memory and writes the file at the end, or one "<START:….>" section at a time. The data volumes are not very big, at least per one "<START:…..>" section.
Or, if you want the receiver program logic to be simple, it could write all chars that it reads from the target to MON.txt file. When you feed that file to ctc2dat utility, it ignores all the chars that are not inside “<START:…>” sections.
Next might also be possible: you implement the receiver program, but it does not write any file but passes the chars (via pipe) straight away to ctc2dat. ctc2dat then, each time it gets a complete “<START:…>” section, passes the coverage data to datafile (normally named MON.dat).
179

13.5 Developing the Sender Function into the Target
If you cannot use the default implementation that is in the delivery package (it uses stdio and writes the file .\MON.txt at the target disk), you need to develop the following function:
#include "targdata.h" void ctc_send_data(void) { int ch; ctc_prepare_upload(); while ((ch = ctc_get_character() > 0) { ... send the ch via whatever communication means ... to the host computer to the Receiver Program, ... which is assumed to be waiting in the function ... ctc_receive_data and being ready to read the ... character. If a text file based data transfer ... can be used, the implementation here is just ... writing the characters to the file. } }
The targdata.h and targdata.c files come in C source form along with the CTC++/Host-Target package. The functions ctc_prepare_upload() and ctc_get_character() reside in targdata.c.
This little function, ctc_send_data is then compiled (with the cross compiler) and linked to the instrumented executable for the target.
The delivery package has a ready-made/default implementation for this function for situations where the target system has normal C file I/O available, and a local text file can be written at the target. You can adapt that code for your needs at your target.
13.6 Instrumentation in the Host
Instrumentation is done in the host with the cross-compiler in quite the same way as it would be done in the host with its native C/C++ compiler. For example, something like the following (in ctc.ini you have introduced the xcc compiler):
ctcwrap -i m -v xmake -f targprog.mak
When the instrumented program is linked, you have to give also the following three files (compiled with the cross compiler):
• Object of targdata.c (comes in C source form along with the CTC++/Host-Target package).
180

• Object of targcust.c (comes in C source form along with the CTC++/Host-Target package). This file contains implementations of the functions ctc_alloc, ctc_exit, and ctc_show_error. These functions may be customized. In the default implementation these functions do almost nothing.
• Object of the file (assume named to targsend.c) containing the function void ctc_send_data(), which you had implemented.
Note that these three files, which make up the CTC++ run-time layer at the target, must not be instrumented.
Assuming these three objects are targdata.obj, targcust.obj and targsend.obj and they reside in HOTA subdirectory of the CTC++ installation directory, you might set the LIBRARY configuration parameter in xcc and xlink blocks in the ctc.ini file as follows:
LIBRARY = $(CTCHOME)\hota\targdata.obj LIBRARY + $(CTCHOME)\hota\targcust.obj LIBRARY + $(CTCHOME)\hota\targsend.obj
Now when CTC++ emits a "ctc-link" command, it adds those three objects as well to the link command line. If you do the target executable linking manually, you need to add those three objects explicitly.
If your target code (the code files that you plan to measure for code coverage) is an operating system kind of file collection, and if there is boot code around, you need to consider the following before instrumenting such code (assume here that ctc counter vectors are are allocated inside the code files, not allocated from heap):
Instrumenting the code as such succeeds, perhaps also running of the instrumented boot code files (initially), but later the target crashes. The reason can be that when at early boot phase some instrumented files (their functions) were called, ctc runtime was also called and it had maintained certain chain of registered modules (list if instrumented files that have been called). Later the boot machinery may nullify some memory areas (the boot code that is no more needed), and along with it the ctc runtime maintained chain got corrupted causing the crash later. So, at least in the begin with in these cases, you should instrument only code files that get called after the boot phase is happily over. (You could consider also Bitcov as alternative to HOTA…)
One thing you need to understand is do you instrument the code so that the counter vectors are allocated from heap (-DCTC_HEAP_COUNTERS) or statically inside each instrumented file. The latter is the default, and works in most cases.
181

The issue comes if the target uses so-called dynamically loaded and freed modules. When the code files of such module are instrumented using statically allocated counters, certain chain goes via the data areas inside the instrumented files. When such module is freed from memory, the chain gets broke, and a likely crash follows later. If the counters are allocated from heap, they (the chain and counter values) survive in good health at module freeing.
Speculating to instrument near-boot code and using counter vector allocation from heap: It may have difficulties, because at the early boot phase the heap management may not yet be ready to receive any calls (if ctc_alloc() is planned to be mapped to normal malloc()). So, again, near-boot code may not be instrumented in HOTA style…Running the Tests in the Target
CTC++/Host-Target does not specify how you download the instrumented executable to the target and start its execution there. Presumably you do it in the same way as you do it with the original non-instrumented program.
If you have to use a specially developed Receiver Program, you need to have it running at the host at the time when the target program runs and chooses to send the coverage data.
13.7 Triggering the Counters Sending to the Host
The question here is when and how the target executable writes the coverage data from memory to a file (if that arrangement is used) or sends the data via some communication channel to the host (if that arrangement is used). More precisely, the question is when and how the function ctc_send_data() is called (or gets called) in the target executable.
There are a couple of methods how the arrangements can be made. We study the typical cases in the following.
(1) If the target executable exits sometimes (vs. it would in principle run forever), and if the counter writing to the host are wanted at that time, and if the target system supports atexit() system function, the arrangement is simple:
The delivery level of file targdata.c is so configured that when it is compiled without –DNO_STDLIB flag, it automatically uses the atexit() service from stdlib. I.e. without you having done anything in this respect, when the instrumented program is about to end, there will come one additional call from stdlib to the ctc_send_data() function, which will write out the coverage data from the memory.
In many cases, however, the target environment either may not support the atexit() service (in such case, for getting the targdata.c to compile, you have to compile it
182

with –DNO_STDLIB flag) or, perhaps more commonly, the executable is a process, which does not end at all. In these situations you have to arrange by yourself that ctc_send_data() gets called at some appropriate time.
The strategy here is to study the target executable and find some function (or functions), assume it be foo(), which gets called only periodically or when the executable gets some special input stimulus. This function foo() is made to activate the counter sending to the host each time it is called. It can be arranged in one of the following ways:
(2) When the file, assume it be foofile.c, containing the function foo() is instrumented, it is done as follows:
ctc -C EMBED_FUNCTION_NAME=foo xcc -c foofile.c
which means that each time foo() is called, the counters are sent to the host just before the function foo() returns. The behavior is as if there had been inserted explicit #pragma CTC APPEND before each return statement in the foo() function. See also section “12.4.7 – Parameter EMBED_FUNCTION_NAME“.
(3) Alternatively, an explicit
#pragma CTC APPEND
can be inserted into the original source code into foofile.c at such critical place, whose execution will trigger the counter sending. This method, however assumes editing some CTC++-specific lines to the original source code while the previous method did not assume it. On the other hand this method allows the counter sending to take place elsewhere than immediately before a return statement. And this method allows the counter sending to be put in such a file, which is not otherwise instrumented by CTC++.
(4) Quite similar properties as above has the following method: At some proper place in your code you insert the following lines:
#ifdef __CTC__ extern void ctc_send_data(void); ctc_send_data(); #endif
If in methods (2), (3) and (4) the counter sending to the host is done multiple times, it doesn't distort the results as seen in the host side. When CTC++ reads one counter value, normally an unsigned long value, from the target memory where the values are collected, the counter location is also zeroed. Then CTC++ converts the value to a couple of printable ascii characters and forwards them to the output routine for transferring to the host. At each "write-out" the counter arrays are scanned once in
183

certain order. In parallel with the "write-out" thread there could also be other threads running, which could produce execution hits to the counter areas at the target memory. Subsequent sending of the counter data has only the execution profile since the last sending.
(5) See section "6.4.1-When the Counters are Saved" about the arrangement where the coverage data writing is triggered from a "side-thread", which wakes up periodically and writes the coverage data out.
13.8 Using ctc2dat Utility
The text-encoded coverage data (normally named MON.txt) is converted to a CTC++ datafile (normally named MON.dat) with the ctc2dat utility. Running it does not require that the symbolfile would be available, or that the run context would be the same as in the instrumentation, or even that the utility would be run in the same (type of) machine where the instrumentation or test runs were done.
The ctc2dat utlity has the following command line options:
-h (help) The utility displays command line help.
-i inputfile
(input) The input text-encoded coverage data file, normally MON.txt. In the absence of this parameter, the input is read from stdin.
-o outputfile
(output) The output datafile name, including its possible path. In the absence of this option, the output datafile name and path is got from each instrumented file (is encoded in the textual representation).
Additionally to the above the CTC_DATA_PATH environment variable, if defined, is noticed in the same way as when writing the datafile by the CTC++ run-time library at host.
-b (brief-verbosity) The utility writes to stdout brief messages about its processing.
-s (silent-verbosity) The utility writes no messages about its processing, except possible error messages.
In the absence of options –b or –s, the utility runs in verbose mode and writes some more messages about its processing to stdout.
184

The utility writes possible error messages to stderr.
The inputfile is zero or more data sets (”data”). One such data set is lexically “<START:” + encoded characters + “>”. An empty data set is “<START:>”. In a data set there can be zero or more modules (“module”, ~one instrumented code file). (An empty data set is possible, if at the target the coverage write-out is commanded, but there has not come any new hits to any instrumented code file since the last coverage data write-out.)
Each module starts with “MODUL,”. It is is followed in certain ctc-internal coding of various module identification and size information and finally the execution hit values.
Each time ctc2dat has read in a complete data set (having modules), it writes/appends the coverage hits of the modules to a datafile (at host disk) and closes it. That data set is fully processed. Then ctc2dat continues reading the input file for possible more data sets to process.
ctc2dat does certain sanity checking that the data structures encoded in “<START:…>” and in “MODULE,…” are healthy. They could be erroneous because of data transmission error or other data corruption. If such bad data is encountered, a message is written and the whole data set is discarded and ctc2dat seeks for next good start from next “<START:”, if there is any.
Example of a ctc2dat run:
ctc2dat -i MON.txt -o MON.dat Starting CTC++ Host-Target receiver v3.3 Waiting for data #1 Receiving data Module 1 (calc.c): 1:(time stamp: Mon Jul 09 11:41:36 2012) 2:(data file: mon.dat) 3:4:5:6:7:8:9 Module 2 (io.c): 1:(time stamp: Mon Jul 09 11:41:18 2012) 2:(data file: mon.dat) 3:4:5:6:7:8:9 Module 3 (prime.c): 1:(time stamp: Mon Jul 09 11:41:17 2012) 2:(data file: mon.dat) 3:4:5:6:7:8:9 Data received, 3 module(s) Appending modules Done.
185
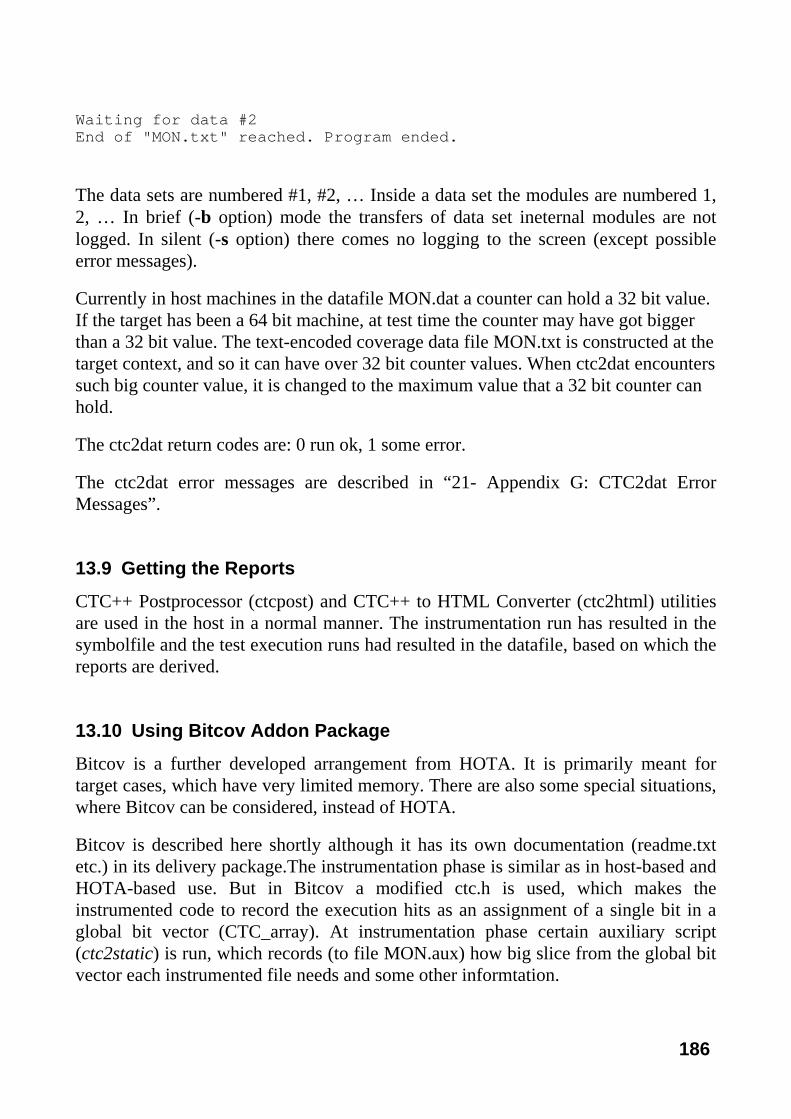
Waiting for data #2 End of "MON.txt" reached. Program ended.
The data sets are numbered #1, #2, … Inside a data set the modules are numbered 1, 2, … In brief (-b option) mode the transfers of data set ineternal modules are not logged. In silent (-s option) there comes no logging to the screen (except possible error messages).
Currently in host machines in the datafile MON.dat a counter can hold a 32 bit value. If the target has been a 64 bit machine, at test time the counter may have got bigger than a 32 bit value. The text-encoded coverage data file MON.txt is constructed at the target context, and so it can have over 32 bit counter values. When ctc2dat encounters such big counter value, it is changed to the maximum value that a 32 bit counter can hold.
The ctc2dat return codes are: 0 run ok, 1 some error.
The ctc2dat error messages are described in “21- Appendix G: CTC2dat Error Messages”.
13.9 Getting the Reports
CTC++ Postprocessor (ctcpost) and CTC++ to HTML Converter (ctc2html) utilities are used in the host in a normal manner. The instrumentation run has resulted in the symbolfile and the test execution runs had resulted in the datafile, based on which the reports are derived.
13.10 Using Bitcov Addon Package
Bitcov is a further developed arrangement from HOTA. It is primarily meant for target cases, which have very limited memory. There are also some special situations, where Bitcov can be considered, instead of HOTA.
Bitcov is described here shortly although it has its own documentation (readme.txt etc.) in its delivery package.The instrumentation phase is similar as in host-based and HOTA-based use. But in Bitcov a modified ctc.h is used, which makes the instrumented code to record the execution hits as an assignment of a single bit in a global bit vector (CTC_array). At instrumentation phase certain auxiliary script (ctc2static) is run, which records (to file MON.aux) how big slice from the global bit vector each instrumented file needs and some other informtation.
186

Once all files have been instrumented utilities ctcpost –L and any2mem are run for calculating how big CTC_array is needed to store the 1-bit counters of all the instrumented files. A global variable char CTC_array[] is then added to somewhere with proper or big-enough size, and the instrumented program is linked up.
The instrumented program has no CTC++ runtime layer. The instrumentation probes just “shoot a bit up” in the CTC_array vector.
The coverage data is captured to host side e.g. as follows: The program is run at the target under debugger. At some point the program is stopped to a breakpoint and the CTC_array contents is dumped to host side to a file (MON.dmp). Then, at the host, utility dmp2txt is run, which converts MON.dmp to MON.txt form with the help of MON.aux file.
The MON.txt uses same representation as in normal HOTA. Then, as in normal HOTA use, ctc2dat utility is used to convert MON.txt to MON.dat form. That after the processing continues normally with ctcpost utility.
The coverage reports that have been obtained via Bitcov usage chain are similar as already described in this guide. Except the counter values only reveal “executed” (value > 0) or “not executed” (value 0). Counter values > 1 are possible if to same MON.dat file many test runs are summed up. Also, in the case of multicondition instrumentation (-i m), the evaluation alternatives may have 0/1 values, but when the values are summed up to decision level, there may come > 1 values.
CTC++ use means two kind of memory overhead to the instrumented program: “code-bloat” and “data-bloat”. In data-bloat sense the Bitcov arrangement is optimal. Memory consumption is only one bit per one counter. No other auxiliary data structures are needed.
In code-bloat sense, i.e. how much instructions are needed to record the execution of a code location, the Bitcov cost is about the same as in normal instrumentation. Depending of the target instruction set, it is about 15 bytes per one counter. It comes from machine code representing “load CTC_array[n] to a register”, “OR proper bit up in the register”, “store register back to CTC_array[n]”.
The code-bloat can be reduced, if on the “executed”/”not executed” insformation a whole byte is reserved. The saving comes when one counter recoding can be just machine instructions “store 1 to CTC_array[n]”. Storing literal 1 to a byte is much simpler job than updating a bit in a byte in memory. The penalty is in data-bloat side, when the CTC_array needs to be 8 times as big as before. But in overall the meory consumption per one counter could reduce to about 8 bytes, depending of the target instruction set. See details from the Bitcov documentation of using Bitcov in “Bytecov style”.
187

188
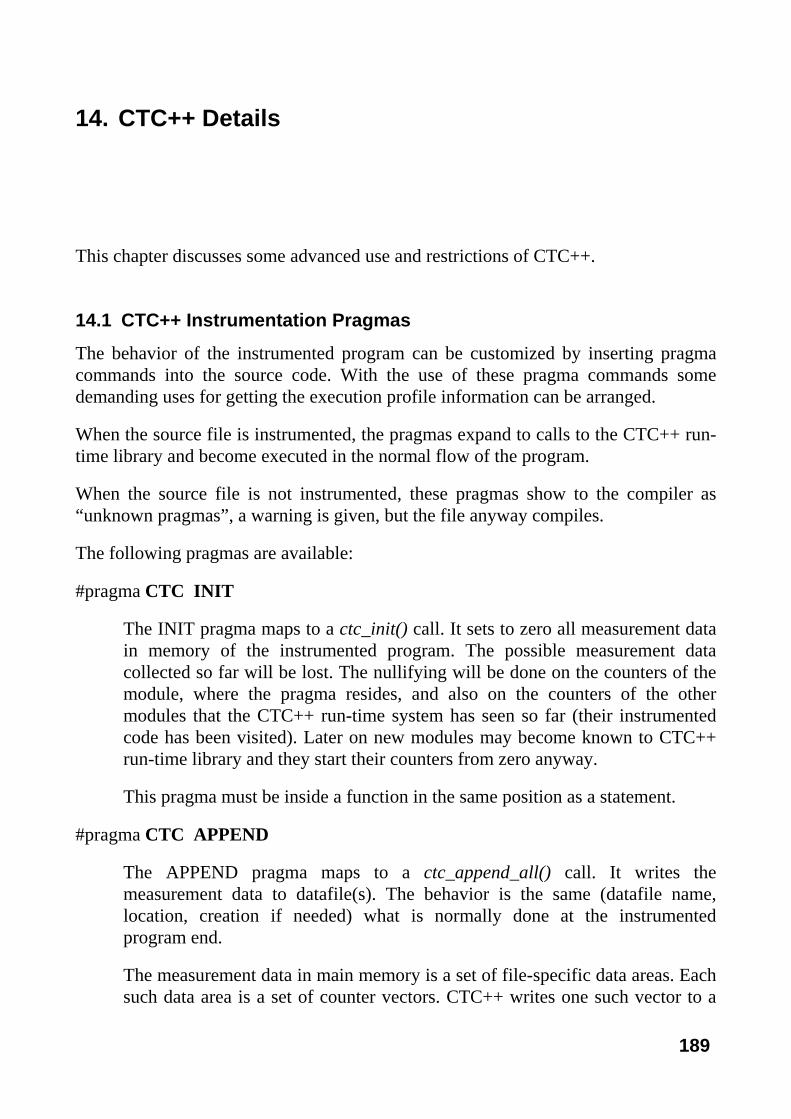
14. CTC++ Details
This chapter discusses some advanced use and restrictions of CTC++.
14.1 CTC++ Instrumentation Pragmas
The behavior of the instrumented program can be customized by inserting pragma commands into the source code. With the use of these pragma commands some demanding uses for getting the execution profile information can be arranged.
When the source file is instrumented, the pragmas expand to calls to the CTC++ run-time library and become executed in the normal flow of the program.
When the source file is not instrumented, these pragmas show to the compiler as “unknown pragmas”, a warning is given, but the file anyway compiles.
The following pragmas are available:
#pragma CTC INIT
The INIT pragma maps to a ctc_init() call. It sets to zero all measurement data in memory of the instrumented program. The possible measurement data collected so far will be lost. The nullifying will be done on the counters of the module, where the pragma resides, and also on the counters of the other modules that the CTC++ run-time system has seen so far (their instrumented code has been visited). Later on new modules may become known to CTC++ run-time library and they start their counters from zero anyway.
This pragma must be inside a function in the same position as a statement.
#pragma CTC APPEND
The APPEND pragma maps to a ctc_append_all() call. It writes the measurement data to datafile(s). The behavior is the same (datafile name, location, creation if needed) what is normally done at the instrumented program end.
The measurement data in main memory is a set of file-specific data areas. Each such data area is a set of counter vectors. CTC++ writes one such vector to a
189

datafile in one elementary write operation, and once completed, the vector is zeroed. This ensures that the same measurement data is not appended twice.
This pragma must be inside a function in the same position as a statement.
The configuration parameter EMBED_FUNCTION_NAME is an alternate way to trigger the coverage data writing to the datafile(s). It has the benefit that the actual source file need not be edited for this purpose.
#pragma CTC QUIT
The QUIT pragma maps to a ctc_quit() call. It ends the instrumented program execution without writing the measurement data to datafile and calls exit(0).
This pragma must be inside a function in the same position as a statement.
#pragma CTC TESTCASE testcasename
The TESTCASE pragma maps to a ctc_set_testcase(“testcasename”) call. Its behaviour is described at “6.6 – Test Case Concept“.
This pragma must be inside a function in the same position as a statement.
14.2 Skipping Source Code in Instrumentation
Sometimes it would be desirable to leave some complete functions without instrumentation, although the other functions in the same file should be instrumented. This can be done as follows:
Specify the function names in the SKIP_FUNCTION_NAME configuration parameter, for example
ctcwrap –i m \ –C SKIP_FUNCTION_NAME="foo,bar,MyClass::*,moc*" \ make –f mymakefile.mak all
Or, although perhaps not recommended, because the original source file needs to be modified, edit around the not-to-be-instrumented-functions the following pragma lines:
#pragma CTC SKIP ... one or more functions not to be instrumented #pragma CTC ENDSKIP
190

Sometimes there is also a need to leave some code portion inside a function without instrumentation. CTC++ allows the use of these #pragmas inside a function as well. But note the following about such use:
• In some cases, if doing this wrong, the instrumented file does not compile.
• At instrumentation time a warning is given that some portions of a function internal code was left uninstrumented.
• At reporting time the statement coverage measure on the function won’t be calculated, instead ”N.A.” is shown. The execution flow analysis for the statement coverage measure would anyway be erroneous, because some control branches are not visible. Actually, also structural coverage measure is biased on the function.
In function body the null-behaving string statements
“CTC SKIP”; “CTC ENDSKIP”;
can be used as an alternate way to specify the start and end point of the “not instrumentation”. These are meant to be used only in macro #define bodies (where you cannot use #pragma lines). In a direct/ctc-free compilation a decent compiler optimizes these string statements away.
CTC++ treats these “CTC [END]SKIP”; statements slightly differently than the #pragma CTC [END]SKIP pragmas, as follows: no warning of a function-internal skipping of code instrumentation is given, and the function is not doomed to “no statement coverage is available” category. Here CTC++ trusts you, the user, that you use this feature correctly.
The rationale behind this policy is: these “CTC [END]SKIP”;s are used only in macro definitions where the motive is to hide the control structures of the macro expansion from the coverage report. Logically the macro is seen as a black box and coverage of its internal control structures is not wanted to be included in the coverage report.
When using #pragma CTC SKIP/ENDSKIP (or their string literal counterparts) inside a function, they must be used where a statement can occur, and so that the control structure nesting association won’t get broken. As if there were still imaginary {…} around them. For example:
{ /* imaginary extra '{' */ #pragma CTC SKIP (or “CTC SKIP”;) ... some list of statements
191

#pragma CTC ENDSKIP (or “CTC ENDSKIP”;) } /* imaginary extra '}' */
Note that "CTC SKIP"; and "CTC ENDSKIP"; are syntactically statements. If you are using them, either directly or indirectly via a macro, be aware that the program logic does not change. For example, changing …if (cond) {statements} … to if (cond) "CTC SKIP"; {statements} "CTC ENDSKIP"; … would be wrong (changing the program logic in a ctc-free compilation).
14.3 Special Counters
In some cases, it is useful to have additional counters in the code to measure some special event. One would like to measure, for example, how many times a function has been called from certain point. This can be made by inserting the pragma
#pragma CTC COUNT description
in the code just before the call. For example:
void error_handler(int status) { if (status > 0) fprintf(stderr, "Error: %s\n", error_text[status]; else fprintf(stderr, "Unknown error\n"); #pragma CTC COUNT Exit from error handler fatal_exit(); }
CTC++ replaces the pragma with an additional counter whenever the file is instrumented either with decision coverage or with multicondition coverage. In the profile listing the counter value is displayed with the description text "Exit from Error handler".
In execution profile listing this shows as
User counter: description
This pragma must be inside a function in the same position as a statement.
14.4 Annotations
Annotations are special comments in the source code, which remain in execution profile listing and in HTML report. With annotations you can for example explain,
192
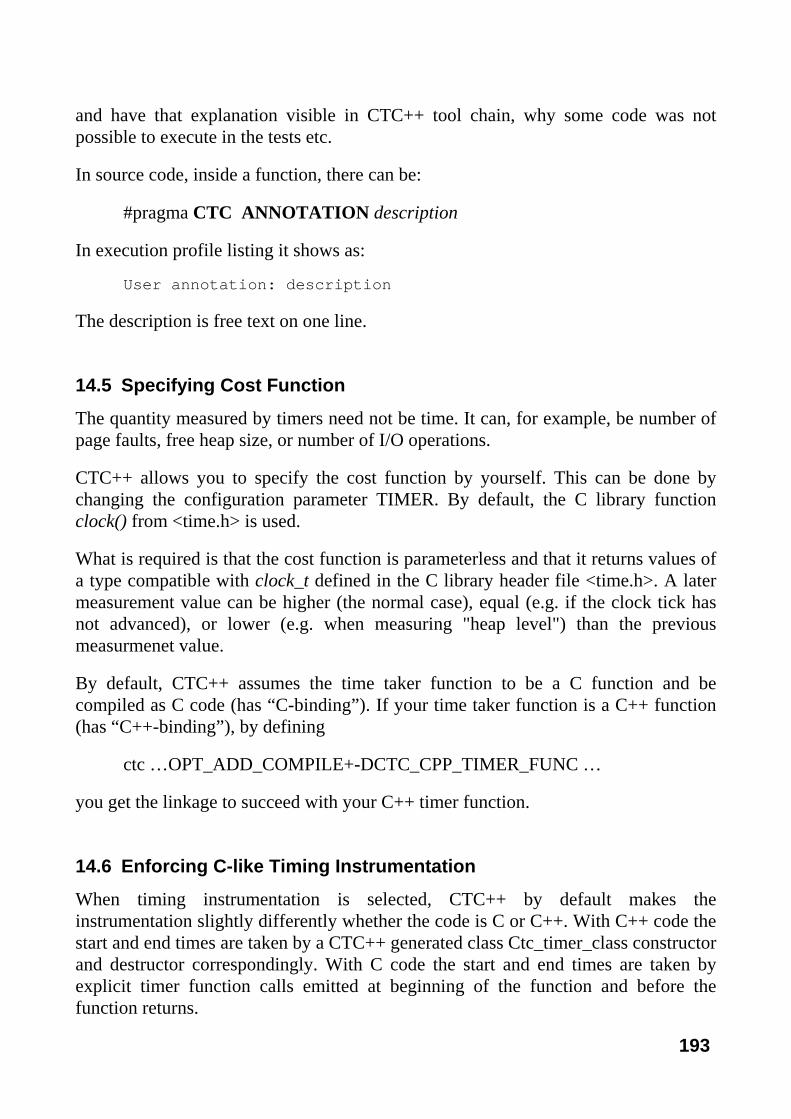
and have that explanation visible in CTC++ tool chain, why some code was not possible to execute in the tests etc.
In source code, inside a function, there can be:
#pragma CTC ANNOTATION description
In execution profile listing it shows as:
User annotation: description
The description is free text on one line.
14.5 Specifying Cost Function
The quantity measured by timers need not be time. It can, for example, be number of page faults, free heap size, or number of I/O operations.
CTC++ allows you to specify the cost function by yourself. This can be done by changing the configuration parameter TIMER. By default, the C library function clock() from <time.h> is used.
What is required is that the cost function is parameterless and that it returns values of a type compatible with clock_t defined in the C library header file <time.h>. A later measurement value can be higher (the normal case), equal (e.g. if the clock tick has not advanced), or lower (e.g. when measuring "heap level") than the previous measurmenet value.
By default, CTC++ assumes the time taker function to be a C function and be compiled as C code (has “C-binding”). If your time taker function is a C++ function (has “C++-binding”), by defining
ctc …OPT_ADD_COMPILE+-DCTC_CPP_TIMER_FUNC …
you get the linkage to succeed with your C++ timer function.
14.6 Enforcing C-like Timing Instrumentation
When timing instrumentation is selected, CTC++ by default makes the instrumentation slightly differently whether the code is C or C++. With C++ code the start and end times are taken by a CTC++ generated class Ctc_timer_class constructor and destructor correspondingly. With C code the start and end times are taken by explicit timer function calls emitted at beginning of the function and before the function returns.
193

In some build contexts the C++-like timing has been problematic. For such cases the timing can be enforced to be done in C-style. This is done by macro CTC_CLIKE_TMING, as follows:
ctc –i mt –C OPT_ADD_COMPILE+-DCTC_CLIKE_TIMING ... cl ...
This macro affects to ctc.h causing the timing to be C-like, when the instrumented file is compiled.
See also “11.7 - Timing (Execution Cost) Instrumentation”.
14.7 Allocating Counters from Heap
Normally, ctc makes the instrumentation so that the data area (a couple of vectors) where the execution counters are stored at test time is statically allocated inside the instrumented file itself. In most cases this works nicely without problems.
The situation where this “allocate counters as static data” brings problems is the following: Assume that the instrumented file is part of a run-time module, which gets removed from main memory in the middle of a test session and the memory area that it occupied gets re-written. It means that not only the ctc counter values get corrupted, but worse, certain ctc’s internal data structures (a linked list among others) get also corrupted. Later, at the time when ctc writes out the coverage data and traverses the linked list of the instrumented files, the behavior is unpredictable. Most likely the result is a program crash. On Windows environment the dynamically (or programmatically) loaded/freed .DLLs are one situation, where this phenomenon can occur.
As of CTC++ v5.2 there is an easy-to-use way to handle the situation: ctc is advised to make the instrumentation so that the counters are allocated from heap. Now, should some module be removed from the memory, the coverage data and ctc’s internal control data related to it remain intact in the heap and writing the coverage data to a datafile does not fail due to corrupted data.
This arrangement is activated as follows: The files whose code is under the risk of being removed from memory in the middle of a test run must be instrumented as follows:
ctc –C OPT_ADD_COMPILE+-DCTC_HEAP_COUNTERS ... cl ...
This macro definition affects the way how the instrumentation is done. This addition to OPT_ADD_COMPILE configuration parameter can be edited permanently to the ctc.ini file. Check the ctc.ini file what initial values it has.
194
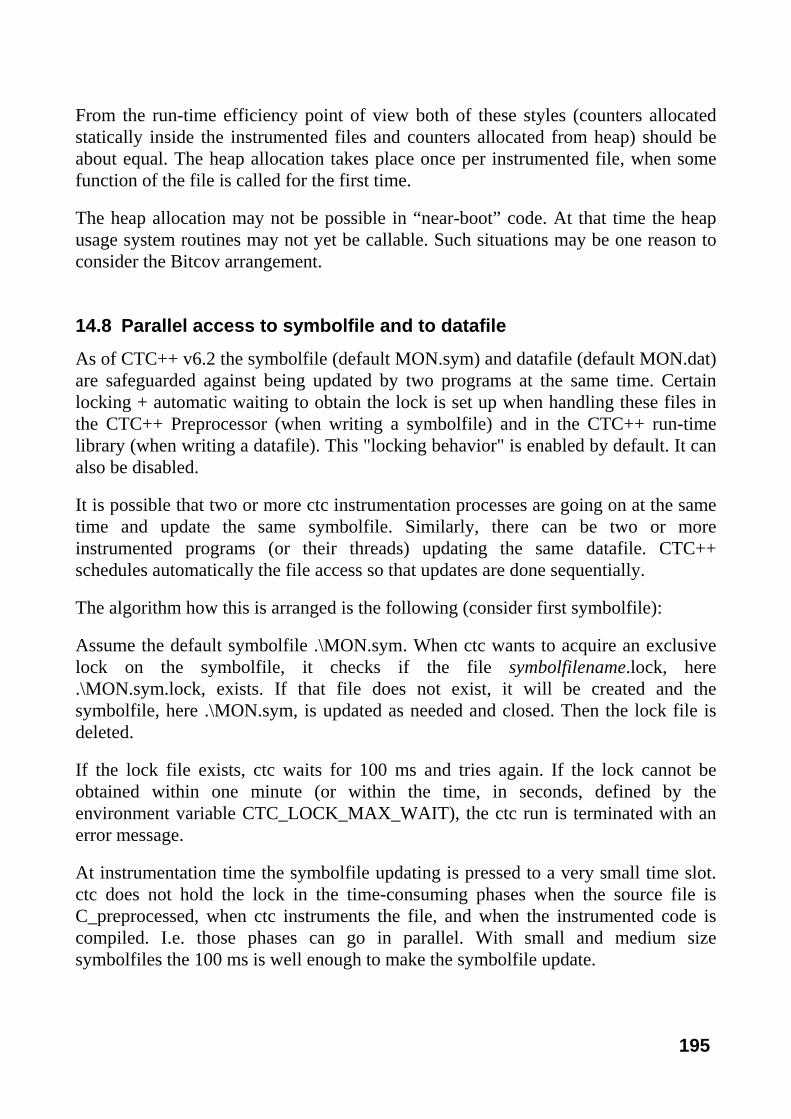
From the run-time efficiency point of view both of these styles (counters allocated statically inside the instrumented files and counters allocated from heap) should be about equal. The heap allocation takes place once per instrumented file, when some function of the file is called for the first time.
The heap allocation may not be possible in “near-boot” code. At that time the heap usage system routines may not yet be callable. Such situations may be one reason to consider the Bitcov arrangement.
14.8 Parallel access to symbolfile and to datafile
As of CTC++ v6.2 the symbolfile (default MON.sym) and datafile (default MON.dat) are safeguarded against being updated by two programs at the same time. Certain locking + automatic waiting to obtain the lock is set up when handling these files in the CTC++ Preprocessor (when writing a symbolfile) and in the CTC++ run-time library (when writing a datafile). This "locking behavior" is enabled by default. It can also be disabled.
It is possible that two or more ctc instrumentation processes are going on at the same time and update the same symbolfile. Similarly, there can be two or more instrumented programs (or their threads) updating the same datafile. CTC++ schedules automatically the file access so that updates are done sequentially.
The algorithm how this is arranged is the following (consider first symbolfile):
Assume the default symbolfile .\MON.sym. When ctc wants to acquire an exclusive lock on the symbolfile, it checks if the file symbolfilename.lock, here .\MON.sym.lock, exists. If that file does not exist, it will be created and the symbolfile, here .\MON.sym, is updated as needed and closed. Then the lock file is deleted.
If the lock file exists, ctc waits for 100 ms and tries again. If the lock cannot be obtained within one minute (or within the time, in seconds, defined by the environment variable CTC_LOCK_MAX_WAIT), the ctc run is terminated with an error message.
At instrumentation time the symbolfile updating is pressed to a very small time slot. ctc does not hold the lock in the time-consuming phases when the source file is C_preprocessed, when ctc instruments the file, and when the instrumented code is compiled. I.e. those phases can go in parallel. With small and medium size symbolfiles the 100 ms is well enough to make the symbolfile update.
195

When running the instrumented program and when it updates the datafile, similar locking takes place. At run-time the lock file is datafilename.lock, here .\MON.dat.lock. Normally one instrumented executable uses only one datafile, but in principle it can create or update many datafiles. Each datafile access is separately guarded with the locking. At run-time the locking is primarily against parallel instrumented programs, but also against multiple threads of one instrumented program. The lock is requested just before updating the datafile starts and released immediately after the updating is done.
If the lock file, here MON.sym.lock or MON.dat.lock, has remained on the disk in a crash or some other problem situation, it prevents further CTC++ usage. Deleting the lock file manually recovers the situation.
ctc2dat updates datafile. It uses similar locking towards datafile as instrumented programs. Actually, the CTC++ runtime library is linked to ctc2dat.
ctcpost also reads the symbolfile and datafile. However, it does not apply locking when accessing these files. On one hand, ctcpost's access is read-only. On the other hand, the thinking is that you can control the time when to run ctcpost and not do it when there is instrumentation updating the symbolfile or a test run updating the datatfile.
This "locking behavior" can be disabled by defining the environment variable CTC_LOCK_MAX_WAIT and setting the value 0 to it.
If the environment variable CTC_LOCK_MAX_WAIT is not defined at all, it is assumed to have value 60. It means that the lock is waited at most 60 seconds until an error message is given and the execution is terminated. Giving some other reasonable value to this environment value specifies the maximum time in seconds how long the lock is waited.
As of CTC++ v8.0.1 on Unix platforms the datafile access exclusivity is additionally ensured by flock(…,LOCK_EX) and flock(…,LOCK_UN) calls.
14.9 Use of option -no-comp
This option is meant for advanced use scenarios where ctc is used to obtain only instrumented versions of the source files, and not compiling them. The compilation would then be arranged by you later, possibly in another machine.
In the normal course of work, ctc performs the following steps: 1. run C-preprocessing on the source file (result to a temp file), 2. instrument the temp file (result to another temp file), 3. run C/C++ compilation on the instrumented version of
196

the source file, 4. run linking command (unless some option like -c prevents it). At appropriate phase, ctc deletes the temp files that it had used.
The option -no-comp advises ctc not to perform the step 3. above.
Using this option alone is not useful, because the instrumented version of the code comes to a temp file, which is deleted. It needs to be captured from the temp file. At Windows this could be arranged as follows:
First edit the following command script file, say CopyInstrFile.bat
REM To be called by RUN_AFTER_INSTR phase... copy /y %3 .\INSTR\%~nx2
This script copies the instrumented version of the source file to the subdirectory INSTR to the file's base name (possible path stripped off). This script file should reside somewhere in PATH, for example in %CTCHOME%.
This could be used as follows:
mkdir INSTR ctcwrap -i m -no-comp \ -C RUN_AFTER_INSTR+CopyInstrFile.bat \ make -f mymakefile.mak
Copies of the instrumented files come to the INSTR directory.
14.10 Handling of One Compile-Time Assert Trick
Clever C coders have invented the following arrangement to do compile-time assertions, perhaps encapsulated to a macro, which has the condition as parameter:
void myCTAssert(int arr[condition ? 1 : -1]);
If the condition evaluates to false, the code does not compile. When these “assertions” are inside functions, ctc instruments the ternary condition, and it comes dynamic while the C/C++ language requires it to be constant (static). Thus, even in “true” case, the instrumented code does not compile.
For one specific function name, __compile_time_assert, in ctc there is hard-coded that ternarys in the function prototype parameter list are instrumented. If you are using other function name here, the workaround to this ctc problem is:
197

ctc ... –C OPT_ADD_PREPROC+-DmyCTAssert=__compile_time_assert ...
14.11 Handling of Assembly Code
CTC++ does not instrument (measure, report) assembly code. But it needs to be prepared to encounter assembly code in the C/C++ files it instruments.
There is large variety in the way how assembly code can be written in different compilers. ctc is prepared to handle the following variants:
• one-liner assembly: [_][_]asm[_][_] assembly tokens
• multi-liner assembly block: [_][_]asm[_][_] {assembly tokens}
• C++ style assembly: [_][_]asm[_][_] (“assembly tokens”);
• gcc style assembly: [_][_]asm[_][_] (gcc style written arguments);
• assembly function: [_][_]asm[_][_] type name (parlist){ assembly body}
14.12 Remarks and Restrictions
This section discusses the restrictions of the CTC++ system.
14.12.1 Parallel Execution
The execution counters are allocated, incremented, collected, reported per program, not per each thread of a program.
If the code contains instrumented functions that are executed simultaneously by several threads, it is obvious that the measured timing information for them may be meaningless. This is because the threads may start and stop timers in a non-determined order. The execution counter values are, with high probability, correct.
Exclusive timing should never be used with multithreaded programs.
14.12.2 Recursion
The timing measurement of (directly or indirectly) recursive functions may be incorrect. This is because when a function calls itself, its timer is started again before stopping it. On the other hand, with recursive functions it is not very clear how the execution time of the function should be defined.
198

14.12.3 Returns from Functions
When we have C code (or CTC_CLIKE_TIMING), the function timer is stopped before executing the return-statement. This means that the time spent on computing the return value is not included in the execution time of the function.
When we have C++ code, the instrumentation and time measuring is done so (by a temporary object, whose destructor stops the timing) that the return statement (and the time spent in evaluating the return value) is included in the timing.
14.12.4 Instrumentation Overhead in Timing
Executing the statements inserted by CTC++ takes time. Remember this, when you examine the execution timing information. For example, when inclusive timing option is used if an instrumented function f1 calls another instrumented function f2, the timer of function f1 contains the execution time of f1 + instrumentation overhead of f1 + execution time of f2 + instrumentation overhead of f2.
The instrumentation overhead time depends on the environment. What presumably is more "time-consuming" is the execution time of the timer function itself. It may end up to some operating system service call, and is the most "costly" code sequence that is executed. You can study it in your environment by executing the same code as non-instrumented and as instrumented.
14.12.5 Granularity of timing measurements
By default, CTC++ uses clock() from <time.h> as the timer function. In many operating systems, clock() is a rather bad time taking function. clock()’s granularity is so “poor” that successive calls to it often give the same value and the timing value is zero. On some types of programs clock() may be quite a reasonable timer function, especially when looking the execution cost measures at higher levels of the program architecture.
If you introduce your own (better?) timer function, (see section “12.4.4 - Parameter TIMER”), note the following: If the underlying timer runs very fast, possibly using more than 32 bits, CTC++ sees only the lower 32 bits in its counters. This means that the timer values may “wrap around” and they are no more correct.
14.12.6 About C Library Functions
Some functions in the C compiler's standard library have influence on the control flow of the program, e.g. longjmp.
199
If the code contains calls on longjmp or other control transfer functions they should be taken into account when examining the execution profile listing. Timers in functions using longjmp are also usually incorrect.
14.12.7 Instrumenting for Function Call Tracing
CTC++ has special means to modify how the beginning of a function body and exiting a function are instrumented. The idea is that a user-defined tracer function is called at those places. The name of the called function and whether it is an entry or exit is given as a parameter to the tracer function. The user’s tracer function, then, can do whatever is useful with the parameters, for example, display to the screen the dynamic call/exit sequence as the instrumented program flow goes on.
The Doc subdirectory of the CTC++ installation directory contains a text file tracer.txt. It describes in more detail the instructions how to use this capability.
14.12.8 Mixed Windows Unix Use
If you copy a symbolfile (a text file, normally named MON.sym) from Windows to Unix or vice versa,
• you can take coverage reports with ctcpost
• you can continue instrumentation to the symbolfile provided that you have done appropriate dos2unix or unix2dos conversion on the symbolfile. Another question is if this use scenario is practical…
If you copy a datafile (a binary file, normally named MON.dat) from Windows to Unix or vice versa,continued use of the datafile in the other environment, e.g. for obtaining a coverage report, with CTC++ utilities is possible provided that the endianness (in what order the bits and bytes are in the hardware architecture) is the same where the datafile was created and where it is used.
200

15. Appendix A: Preprocessor Error Messages
CTC++ Preprocessor (ctc) error messages are in the following format:
CTC++ error error-code: error-text
or
CTC++ warning error-code: warning-text
where error-code is an integer value identifying the error and error-text or warning-text is the actual message.
Writing of warning messages is controlled by WARNIG_LEVEL configuration setting. If its value is
• none: No warnings are written. (option -no-warnings enforces this, too)
• warn: Normal warnings are written.
• info: Normal warnings and also warnings that are rated as “tool limitations” are written. See the message list below what warnings fall to this category.
The messages are written to stderr. Also, an exit code 1 is returned whenever preprocessing is aborted by an error. Normal return takes place with exit code 0.
Below is the list of the error and warning messages and their explanations. The error/warning code displayed is mainly used for internal CTC++ error reporting purposes.
0: Configuration parameter X has illegal value Y
There is a problem in some of the configuration files read. See with -V options what configuration files get read and correct the erroneous definition from one of those files.
1: Bad configuration format X in file Y at line Z
There is a problem in the specified configuration file line.
201
2: Bad identification stamp in symbol file X
The file X, which ctc assumes to be a symbolfile, does not start in a way how a symbolfile for this CTC++ version should start.
3: Bad or misplaced CTC++ pragma X in file Y at line Z
This is a warning. There has been #pragma CTC X, and the X is unknown to CTC++ or is in an unacceptable place.
4: Environment variable X has illegal value Y
The value of the specified environment variable is not accepted by CTC++.
5: Cannot close file X: Y
Closing of the file X failed for the indicated reason.
7: Cannot execute C or C++ preprocessor or preprocessing failed: Y
The configuration parameter PREPROC_C or PREPROC_CXX was used as a model in constructing the command for C/C++ preprocessing the source file to be instrumented. ctc failed to invoke that command successfully. Note that even if ctc had succeeded in the command invocation, the command execution itself may have been failed. System’s return code is Y.
8: Cannot execute C or C++ compiler or compilation failed: Y
For some reason the invoking of the command for compiling has failed. Note that even if ctc had succeeded in the command invocation, the command execution itself may have been failed. System’s return code is Y.
9: Cannot create file X: Y
Failed to create the file X for the indicated reason.
10: Identifier begins with 'ctc_' in file X at line Y
This is a warning. In parsing the source file to be instrumented ctc has detected an identifier starting with "ctc_". Because CTC++ itself uses, for example inserts into the instrumented file, such identifiers, this is a warning that your use of such identifiers may conflict with CTC++'s use.
11: Misplaced string X in file Y at line Z
This is a warning. In parsing the source file to be instrumented, ctc has detected the string “CTC SKIP” or “CTC ENDSKIP” that is inside a function body but is not used as a statement. These strings are not accepted as
202

alternatives to #pragma CTC SKIP/ENDSKIP unless they are used as a statement.
12: Cannot get current directory: Y
Operating system service call for resolving what is the current working directory had failed for the indicated reason.
13: Erroneous command line, X Y
The command-line options and/or parameters given to ctc are erroneous.
14: Unknown error
Some ctc internal sanity-checks. No detailed reason for the error message is available.
15: Licence problem: X
There is a problem with the CTC++ license. The additional information X tells more of the nature of the problem. For example X might be "the licence has expired", "wrong TOOL version", "cannot check out FLEXlm licence", etc.
16: Cannot execute linker or linking failed
For some reason the invoking of the command for linking has failed. Note that even if ctc had succeeded in the command invocation, the command execution itself may have been failed.
17: Cannot create lock file X.lock: Y
Failed to create the lock file X.lock for the symbolfile X for the indicated reason.
18: Cannot remove lock file X.lock: Y
Failed to delete the lock file X.lock of the symbolfile X for the indicated reason.
19: Mismatched CTC ENDSKIP in file X at line Y
In source file to be instrumented there was a "#pragma CTC ENDSKIP" without a prior matching "#pragma CTC SKIP".
20: Missing definition X in configuration file
Configuration parameter X is missing.
203

22: Cannot open file X: Y
Opening of the specified file failed for the indicated reason.
23: Out of memory
Some ctc-internal operation requiring free heap space had failed.
24: Cannot read file X: Y
Reading of the specified file failed for the indicated reason.
25: Pragma X encountered in function body (file X:Y)
This is a warning. "#pragma CTC SKIP" or "#pragma CTC ENDSKIP" was in a function body which is not recommended, because it may result in non-compilable code, if not used correctly. Additionally, use of these inside a function causes that statement coverage of a function will not be reported (0/0 is emulated).
26: Syntax error in file X at line Y
CTC++ assumes the source files to be instrumented to be syntactically correct C or C++ and does not actually make syntax checking. However, when parsing some portions of the source files, some minimal syntax checking is done, and if problems are detected, they are reported with this error message.
27: Cannot create temporary file
ctc could not create a temporary file.
28: Too complex code, reduced to decision coverage in file X at line Y
This is an info-category warning (tool limitation). The source file X was instrumented for multicondition coverage. At line Y there has been a decision with many && or || operators, such that there would be over 500 possible ways (current tool limit) to evaluate the decision. The decision is instrumented only for decision coverage, which reveals the overall true/false counts anyway.
29: Counter limit reached X
You hardly have so big files where this error message would come, because the limit for various counters is INT_MAX.
30: Cannot execute the user-specified command or the command failed: "X"
Configuration parameter RUN_BEFORE_ALL, RUN_AFTER_CPP, RUN_AFTER_INSTR or RUN_AFTER_COMP was defined, the command
204

specified by it was invoked but it returned with a non-zero code. The "X" is the invoked command and the used arguments.
31: Declarations in while or for conditions not instrumented (file X:Y)
(No more used as of v7.1…)
32: Abnormal use of case/default, not instrumented (file X:Y)
This is an info-category warning (tool limitation). A case i: or default: label was encountered, but it was not immediately in the compound statement of the switch body. For technical reasons such oddly placed case labels are not instrumented.
33: Capacity restriction, something too big for CTC++ (file X:Y)
There is some CTC++ internal capacity problem arising from the specified file and line.
34: Cannot write file X: Y
Writing to the specified file failed for the indicated reason.
35: Original compile/link command failed (-2comp)
This is a warning. There has been an explicit -2comp option or the OPT_DO_2COMP configuration setting has provoked execution of the original compile or link command, but it had failed. It should not happen, but in certain very rare situations it can happen from a CTC++ reason. In spite of this, the actual instrumentation is attempted to be done to its completion.
36: Ternary-?: instrumented for decision coverage only in file X at line Y
This is an info-category warning (tool limitation). File X was instrumented for multicondition coverage and the ternary decision contained && or || operators. For technical reasons the decision could not be instrumented for multicondition coverage. It is anyway instrumented for decision coverage.
37: Decision not instrumented (because of 'const') in file X at line Y
This is an info-category warning (tool limitation). A const variable declaration was initialized by an expression containing a ternary decision. For technical reasons the decision is not instrumented. (This is a precaution if the variable would be later used in array size declaration, which code would not compile)
205

16. Appendix B: Test-Time Error Messages
The instrumented program may give error messages of the following format:
CTC++ run-time error error-code: error-text
where error-code is an integer value identifying the error and error-text is the actual error message.
The messages are given by CTC++ run-time library and they are written to stderr. In some windowing environments (e.g. in Windows NT) messages are displayed with a message box, which needs to be “Ok-clicked” for continuing.
The exit value of the test program is 1 when an error has occurred in the initialization of the CTC++ run-time library internal data structures and 2 when an error has occurred when processing a #pragma command. When an error occurs during the datafile writing at the program exit, the exit value of the original program is used.
In the CTC++/Host-Target variant of the run-time library, which is somewhat stripped in functionality (no configuration file handling, no license control, no datafile handling, etc.), and there by default comes no error messages at all.
Following is the list of the error messages and their explanations. The error codes are used mainly for internal CTC++ error reporting purposes.
1: Incompatible number format in file X
When CTC++ run-time updates an existing datafile X, it makes some sanity checks that the datafile looks like it were also written by CTC++ in the same type machine (endianness). Here such check has failed; certain numeric fields look like they were not written by CTC++.
2: Bad identification stamp in file X. Delete it and rerun.
When CTC++ run-time updates an existing datafile X, it makes some sanity checks that the datafile looks like it were also written by CTC++. Here such check has failed. The datafile X may be corrupted or perhaps it has been created with some non-compatible version of CTC++.
206

3: Bad definition X in configuration file
Also the CTC++ run-time library reads the configuration file(s), see section "12.2 - Configuration File Finding". There has been some problem in the file in those portions that are checked here.
4: Cannot close file X: Y
Closing of the specified file failed for the indicated reason.
5: Cannot create file X: Y
Creation of the specified file failed for the indicated reason.
6: Licence problem: X
License problem as specified in more detail in X.
7: Missing definition X in configuration file
The specified configuration parameter missing.
8: Cannot open file X: Y
Opening of the specified file failed for the indicated reason.
9: Out of memory
Some internal processing in CTC++ run-time requiring heap space had failed.
10: Cannot read file X: Y
Reading from the specified file failed for the indicated reason.
11: Cannot write file X: Y
Writing to the specified file failed for the indicated reason.
12: Cannot create lock file X.lock: Y
Failed to create the lock file X.lock for the datafile X for the indicated reason.
13: Cannot remove lock file X.lock: Y
Failed to delete the lock file X.lock of the datafile X for the indicated reason.
14: Environment variable X has illegal value Y
The value of the specified environment variable is not accepted by CTC++ run-time.
207

15: Bad control data of file 'X' in memory
Some information concerning the specified source file is not valid in the memory. For example, the name of a source file is an empty string or its timestamp is zero.
16: Bad data file X
The specified data file is corrupted. Some information concerning a source file is not valid. For example, the name of a source file is missing or its timestamp is zero.
17: Too long testcase name X
The testcase name X is longer than its 32 char maximum. Also note that when the testcase name is used to construct the datafile name, the file system’s constraints on file name length and form must be met, too.
100:
This is a message by the 64-bit library. Failed to run the ‘ctc2dat’ utility used internally by the 64-bit library. Reasons can be: ctc2dat could not even be started (not in PATH?) or it could be started, but it returned with error code for some reason (not finding ctc.ini, datafile writing failed?).
101:
This is a message by the 64-bit library. Failed to remove a temporary text file used internally by the 64-bit library.
208

17. Appendix C: Postprocessor Error Messages
CTC++ Postprocessor (ctcpost) may give error messages and notices. Their format is as follows:
CTCPost error error-code: error-text
or
CTCPost notice: notice-text
where error-code is an integer value identifying the error and error-text or notice-text is the actual message.
The messages are written to stderr. Also, an exit value 1 is returned whenever postprocessor execution is aborted by an error.
The notice texts are informative additional texts informing some of the ctcpost behavior in more detail.
First, below there is the list of the error messages and their explanations. The error code displayed is mainly used for CTCPost error reporting purposes. The possible error messages are:
0: Configuration parameter X has illegal value Y
As the message says.
1: Bad configuration format X in file Y at line Z
There is a problem in the specified configuration file line.
2: Bad data file X
The specified datafile is corrupted.
3: Bad identification stamp in file X
The specified symbolfile or datafile is corrupted, or perhaps it has been created with some non-compatible version of CTC++.
209
4: Incompatible number format in file X
The specified symbolfile or datafile has some bad data in it. Perhaps the file is corrupted or perhaps it is not written by CTC++.
5: Error in symbol file X
Problem with the specified symbolfile. Perhaps it is corrupted. Delete the file and do the instrumentation again.
6: Cannot close file X: Y
The specified file could not be closed for the indicated reason.
8: Cannot create file X: Y
The specified file could not be created for the indicated reason.
9: Erroneous command line, X Y
The ctcpost command line has been erroneous as explained more is arguments X and Y.
10: License problem: X
License problem as specified in more detail in X.
11: Internal error
Some internal error detected in ctcpost.
12: Missing definition X in configuration file
The specified configuration parameter is missing from ctc.ini file.
14: Cannot open file X: Y
The specified file could not be opened for the indicated reason.
15: Out of memory
Some internal processing in ctcpost requiring heap space had failed.
16: Cannot read file X: Y
The specified file could not be read for the indicated reason.
17: Cannot write file X: Y
Writing of the specified file failed for the indicated reason.
210
The CTCPost notice messages are additional information to the user. They are displayed (to stderr) in situations described below.
If you have played for a longer time with your program (lots of correction rounds on files, their re-instrumentations, many testing cycles, having many symbolfiles and datafiles that are merged in one ctcpost run, etc.) and if you are wondering why you get such coverage listing as you get, these messages should make the ctcpost behavior more understandable.
When ctcpost is used to write a coverage report, and if there are these kind of CTCpost notice messages, an extra header line, like
*** 7 verbose notice(s) written to stderr
is written to the report telling how many such notices were given. The rationale is that otherwise these notices might easily remain unnoticed, because they are written to stderr.
The CTCPost notice messages and their explanations are the following:
Newer instrumentation for a file X in symbol file Y encountered (overrides the previous).
There has been given two (or more) symbolfiles to ctcpost. For file X a description info has already been seen. From another symbolfile Y there however comes also a description for file X reflecting a newer instrumentation, and which description is different than the one that was already seen. The newer description and its timestamp will be used by ctcpost. This situation is possible if the same file has been instrumented multiple times, the descriptions have been written to separate symbolfiles, and ctcpost considers the descriptions to be different.
Old instrumentation for a file X in symbol file Y encountered (discarded).
There has been given two (or more) symbolfiles to ctcpost. For file X a description info has already been seen. From another symbolfile Y there however comes also a description for file X reflecting an older instrumentation, and which description is different than the one that was already seen. The older description will be just skipped by ctcpost; the already seen newer description will be used. This situation is possible if the same file has been instrumented multiple times, the descriptions have been written to separate symbolfiles, and ctcpost considers the descriptions to be different.
211
Too new (compared to symbol file info) counter data for file X coming from datafile Y (discarded).
ctcpost first reads all symbolfiles given to it. For file X there may have been a description block in many symbolfiles (normally only in one, however). If the descriptions are similar (although different timestamps), ctcpost accepts all descriptions. On file X ctcpost has assigned one or more timestamps.
Now there however comes from datafile Y a counter block for file X, whose instrumentation timestamp is not any of those that ctcpost knows for file X, and which represents a still newer instrumentation. Because ctcpost does not have a description of that level of instrumentation, ctcpost rejects the counter data block. Perhaps this is your "error", you missed to give the most up-to-date symbolfile to ctcpost.
Old counter data for file X coming from datafile Y (discarded).
ctcpost first reads all symbolfiles given to it. For file X there may have been a description block in many symbolfiles (normally only in one, however). If the descriptions are similar (although different timestamps), ctcpost accepts all descriptions. On file X ctcpost has assigned one or more timestamps.
Now there however comes from datafile Y a counter block for file X, whose instrumentation timestamp is not any of those that ctcpost knows for file X, and which represents some older and so perhaps an obsolete instrumentation. Because ctcpost works only with the most new instrumentation description seen, the old and obsolete counter data block for file X is discarded.
Counter data for an unknown file X encountered coming from datafile Y (discarded).
ctcpost first reads all symbolfiles given to it and thus sees some set of instrumented files (their descriptions). Now there however comes from datafile Y a counter block for file X and file X is unknown to ctcpost. Such counter block is discarded. Behind to this there may a user error. Perhaps the user has forgot to give to ctcpost the symbolfile containing the description of file X.
Newer counter data for file X coming from datafile Y (old counter data discarded).
This can occur when adding (use of -a option) datafiles. In the candidate summary datafile there was already counter data for file X. But then there came from datafile Y with newer (younger instrumentation timestamp) coverage data for file X. The younger data overrides the older.
212
Counter data for file X encountered coming from datafile Y, instrumentation times the same but counter data sizes not (discarded).
With today's fast machines it is possible to instrument some file (here X) within one second (which is CTC++'s granularity in its timestamps) two times so that the file is changed in the between. So it is possible to get two instrumented executables having an instrumented file with same name and timestamp, but the coverage data vector sizes are different. Both executables have written their datafiles. When merging the datafiles ctcpost detects the data size incompatibility and the coverage data from datafile Y for file X is discarded.
This same notice message is given also when the file X is encountered in a symbolfile and in a datafile, having same timestamp, but the coverage data vector sizes are different.
Header file X included at or via source file Y is different from what it was when it was extaracted previously (this header file was not extracted).
There are instrumented header files around. Previously in code file Y1.c the header code X was seen, and it was extracted to a separate “monitored header file X” element. Later in code file Y2.c (Y) the same H was seen, but it did not represent the same code level as before. This (later) incarnation of H remains inside Y2.c and comes reported as part of Y2.c. Note that the header file H may also be #included to Y2.c via an intermediate included file.
213

18. Appendix D: CTC2html Error Messages
CTC2html utility (ctc2html) gives errors and warnings. The error messages are in the following format:
ctc2html: error-text
The error messages are written to stderr. Exit value zero is returned when CTC2html run succeeds, not zero otherwise.
The warning messages are in the following format:
ctc2html: warning: warning-text
The warning-text messages are meant to be self-explanatory. The error-text messages are the following:
Following is the list of the messages and their explanations:
Cannot open file FILE
Opening a file for reading had failed.
Cannot create file FILE
Creating a file had failed.
Cannot append file FILE
Opening the file for writing (appending) had failed.
Erroneous command line, description
ctc2html was started with erroneous command-line arguments.
File FILE is not a valid Execution Profile Listing
The input file was not a CTC++ Execution Profile Listing produced by ctcpost.
214

File DIR exists and is not a directory
Command line option –o DIR was used (or if not used, it defaulted to ./CTCHTML). There was a regular file DIR. ctc2html was not able to use or create the target directory with the name DIR for the HTML files.
File FILE is not a valid version 8 Execution Profile Listing
The input file was not a CTC++ Execution Profile Listing produced by ctcpost v8.x.
215

19. Appendix E: CTCXMLMerge Error Messages
CTCXMLMerge utility (ctcxmlmerge) error messages are in the following format:
*** ctcxmlmerge error n (i / j): error-text
where n is error number and (i/j) is internal error code (helping the vendor in problem solving). The error numbers (n) and error-texsts are:
1: Option @ requires argument without space.
As the message says, no space after ‘@’.
2: Option -p requires argument.
3: Option -x requires argument.
4: Option -f requires argument.
5: Option -nf requires argument.
As the message says, argument separated by a space.
6: Unknown option: <reason>
As the message says.
7: Input XML file name extension not allowed: <file>
8: Input XML file name extension missing: <file>
As input file the file extension has to be “.xml”
9: Input XML file does not exist: <file>
10: No input XML file.
11: Options file does not exist: <file>
As the message says.
12: Input is not CTC++ XML report: <file>
The given input file does not look like a ctcpost-generated XML report.
216

13: Version <= 7.1.1 input CTC++ XML report not supported.
Some of the input XML report files is generated by ctcpost v7.1.1 (which was still in CTC++ v7.1.2) or earlier.
14: File instrumented with CTC++ version < 7.2 not supported: <file>
The referred file, which was in some of the input XML reports was instrumented with too old CTC++ version.
15: Input header info missing: <file>
The referred XML input file is missing something, bad input.
16: Different coverage view inputs can not be merged.
The XML input files are not all generated with same “coverage view”.
17: Different instrumentation modes: <file>
The referred code file is in two XML input files, and the file is not instrumented in same way.
18: Out of range exception: <reason>
19: Out of memory.
20: Internal error exception.
Tool internal technical error.
21: Output option missing.
Either -p or -x option missing.
22: Unknown probe type.
217

20. Appendix F: CTC2Excel Error Messages
CTC2Excel utility (ctc2excel) error messages are in the following format:
ctc2excel: error-message
The CTC2Excel error messages are written to stderr.
Following is the list of the possible error messages :
Error commandline option: erroneous argument
Can not open file inputfilename for reading: op-system message
Can not open file outputfilename for writing: op-system message
Wrong input file listing
The input file is not Execution Profile Listing
218

21. Appendix G: CTC2dat Error Messages
CTC2dat utility (ctc2dat) error messages are in the following format:
*** ctc2dat error: message
The messages are written to stderr. They can be the following, and explained where felt necessary:
No input; give it either with -i option or by a pipe
Aborted by transmission error
Logically the input file reading is like reading the target e.g. via some serial port one char at a time. There has happened an error in reading the input.
No coverage data in input
The input file did not have a single “<START:…>” section, perhaps it is a totally wrong file?
Input file name missing after –i
Output file name missing after –o
Unknown parameter <text>
Internal error.
Should not happen, something wrong.
Sanity check/<location>. Bad data encountered on line l, before column c. Ignoring this data. Seeking resync to next data.
A data set (<START:…> section) is being read. There has been a problem at location (module start, etc.), or when the whole input file is seen as lines and columns, on the referred point. The so-far read modules and the remaining modules of this data set are ignored and not written to datafile.
Sanity check/<location>. Expected ‘x’, got ‘y’ on line l, before column c. Ignoring this data. Seeking resync to next data.
A data set (<START:…> section) is being read. There has been a problem at location (e.g. reading counter values), or when the whole input file is seen as
219

lines and columns, on the referred point. The so-far read modules and the remaining modules of this data set are ignored and not written to datafile.
Out of memory
Should not happen, some malloc() had failed.
Could not open file <filename>
CTC++ run-time error <n>: <text>
When ctc2dat has read the input file, it writes the datafile using the services of the normal CTC++ runtime library at the host. In that connection there can come various error messages from the CTC++ runtime library. See their explanations separately.
If there has come sanity check error messages where a data set was ignored, at the end of ctc2dat run there comes message to stdout (in all verbosity modes):
n invalid data sequence(s), they were ignored.
220

22. Index
64-bit code............................................................................................................................61 Annotations ........................................................................................................................191 Assembly code ...........................................................................................................163, 197 C Preprocessing..................................................................................................................152 C# code...............................................................................................................................161 C++ Preprocessing .............................................................................................................153 Configuration file ...................................................................................................35, 54, 143 Constraining ctcpost listing by files ...............................................................................68, 69 Control-C and similar program terminations .......................................................................57 Cost function ..................................................................................................................8, 148 Cost measure scaling..........................................................................................................149 Coverage
Condition..............................................................................................................11, 67, 83 Decision .......................................................................................................10, 67, 84, 129 Function .......................................................................................................10, 67, 84, 129 Line ........................................................................................................7, 10, 12, 122, 139 MC/DC.................................................................................................................11, 67, 82 Multicondition....................................................................................................11, 82, 135 Statement............................................................................................................12, 67, 137
Coverage view....................................................................................67, 71, 79, 81, 127, 128 ctc, CTC++ Preprocessor tool ..............................................................................................31 ctc.h ......................................................................................................................................18 ctc.ini ............................................................................................................................18, 144 CTC_DATA_PATH ......................................................................................................58, 72 CTC_LOCK_MAX_WAIT ...............................................................................................195 CTC_SAFE ........................................................................................................................141 ctc_send_data()...................................................................................................................179 CTC++ Host/Target
Instrumentation ..............................................................................................................179 Sender Function .............................................................................................................179 Test Runs........................................................................................................................181
CTC++ run-time library .............................................................................................162, 173 ctc2excel, the CTC++ to Excel converter tool ...................................................................125 ctc2html, the CTC2Html tool.............................................................................................111 CTCHOME ........................................................................................................................144 CTCHTML.........................................................................................................................115 CTCINIT ............................................................................................................................144 ctcpost, CTC++ Postprocessor tool......................................................................................64
221

ctcwrap ...........................................................................................................................29, 50 ctcxmlmerge, the execution profile listing merger tool .....................................................101 datafile ............................................................................................................................54, 99 Dynamic analysis .................................................................................................................13 Eclipse IDE Integration........................................................................................................52 Environment variable
CTC_DATA_PATH ........................................................................................................57 CTC_LOCK_MAX_WAIT...........................................................................................195 CTCHOME ....................................................................................................................144 CTCINIT........................................................................................................................144 CTCOPTS ......................................................................................................................170 CTCWRAP_ROOT_DIR ................................................................................................51 CTCWRAPDIR ...............................................................................................................50
Examples ....................................................................................18, 20, 77, 81, 90, 91, 93, 99 Excel report ........................................................................................................................125 Execution cost ......................................................................................................................14 execution counters................................................................................................................54 Execution Profile Listing......................................................................................................22 Exit value....................................................................................................200, 206, 209, 214 FLEXlm..............................................................................................................................147 Function execution costs ........................................................................................................8 Help
in ctc.............................................................................................................................4, 32 in ctc2dat ........................................................................................................................183 in ctc2excel ................................................................................................................4, 125 in ctc2html..................................................................................................................4, 114 in ctcpost ............................................................................................................................4 in ctcwrap.........................................................................................................................51 in ctcxmlmerge...........................................................................................................4, 102
HTML report ..................................................................................................................9, 111 Installation ............................................................................................................................15 Instrumentation.....................................................................................................................37 Instrumentation mode.............................................................................................33, 41, 128 Invoking
ctc .....................................................................................................................................32 ctc2dat ............................................................................................................................183 ctc2excel.........................................................................................................................125 ctc2html..........................................................................................................................112 ctcpost ..............................................................................................................................66 ctcwrap .............................................................................................................................50 ctcxmlmerge...................................................................................................................102
Java code ............................................................................................................................161 License key.........................................................................................................................147 License Parameters.............................................................................................................147 Locking...............................................................................................................................194
222
Microsoft Visual Studio IDE integrations............................................................................16 MON.dat...............................................................................................................................71 MON.sym ........................................................................................................................34, 71 Multi-threaded code ...........................................................................................................197 Options
in ctc.................................................................................................................................33 in ctc2dat ........................................................................................................................183 in ctc2excel ....................................................................................................................125 in ctc2html......................................................................................................................112 in ctcpost ..........................................................................................................................66 in ctcxmlmerge...............................................................................................................102
Parallel builds .....................................................................................................................194 Parallel test runs .................................................................................................................194 Perl........................................................................................................................................19 Pragmas
CTC ANNOTATION ....................................................................................................192 CTC APPEND .........................................................................................................55, 188 CTC COUNT.................................................................................................................191 CTC ENDSKIP........................................................................................................46, 189 CTC INIT.......................................................................................................................188 CTC QUIT .....................................................................................................................189 CTC SKIP ................................................................................................................46, 189 CTC TESTCASE.............................................................................................................63
Programmatically loaded/freed instrumented code............................................................193 Return codes...............................................................................................200, 206, 209, 214 Savepoint function................................................................................................56, 149, 182 Skipping Source Code..........................................................................................46, 150, 189 Special Counters.................................................................................................................191 Specifying Cost Function...................................................................................................192 symbolfile.......................................................................................................................34, 99 Templates .............................................................................................................................37 TER ..................................................................................................................7, 10, 113, 138 Test case ...............................................................................................................................61 Test Effectiveness Ratio.................................................................................................7, 138 Threshold-% .......................................................................................................................113 Timing ................................................................................................................................198 Timing mode ........................................................................................................................91 Use With Makefiles..............................................................................................................28 Version information .........................................................................................................5, 18 When counters are not saved..............................................................................................149 Visual Studio IDE Integration........................................................................................19, 52 wrapcmds.txt ........................................................................................................................18 XML ...............................................................................................................................68, 93
223


