3

Test DietsThe native starch used to formulate diet A (Table II) contained
only 0.5% RS, a value similar to that reported by Berry (1986).Treated starch contained 11.47% RS, almost all (97-100%)measured as insoluble fiber (Prosky et al 1988). Native starchand treated starch constituted 74.9% of the diets; other dietcomponents added to meet the rats' nutrient requirements (NRC1987) accounted for the remaining 25.1% (Table II). Antibiotics,where used, were added to the drinking water and includedstreptomycin sulfate (5 mg/ml), neomycin sulfate (4 mg/ml),bacitracin (4 mg/ ml), and amphotericin B (0.1 mg/ ml); the levelsused were as prescribed by Srivastava et al (1976). Water con-taining antibiotics was freshly prepared on a regular basis.
AnimalsThree groups of male, weanling rats (10 rats per diet) of the
Sprague-Dawley strain (Harlan Sprague-Dawley, Indianapolis,IN) were housed individually in mesh-bottom, stainless steel cagesin a controlled environment. Each rat was allowed to consumean adequate, and identical, amount of total diet during the four-week test period. Deionized water was offered ad libitum. Bodyweight records were maintained.
Fecal CollectionFor each rat, feces were collected quantitatively throughout
the four-week test period, pooled, air-dried, weighed, and storedunder refrigeration. A few freshly voided fecal pellets were alsocollected at frequent intervals, analyzed for moisture content, andthen added to the pool collection.
AnalyticalRS in starch samples was determined by the enzymatic-gravi-
metric method of Prosky et al (1988); this method measuresinsoluble fiber and soluble fiber separately. Moisture in freshlyvoided fecal samples was determined by air-drying the feces atroom temperature. Calculated factors (Table III) were used toconvert dry fecal weight (air-dried feces) to wet fecal weight. Fecalvolume was measured in a long-stem graduated cylinder usingfine sand as the embedding medium (Table III). Feces recoveredfrom the sand were finely ground and analyzed for RS againusing the method of Prosky et al (1988).
StatisticalMean comparisons were made with Duncan's multiple-range
test using the Statistical Analysis System (SAS 1982).
RESULTS AND DISCUSSION
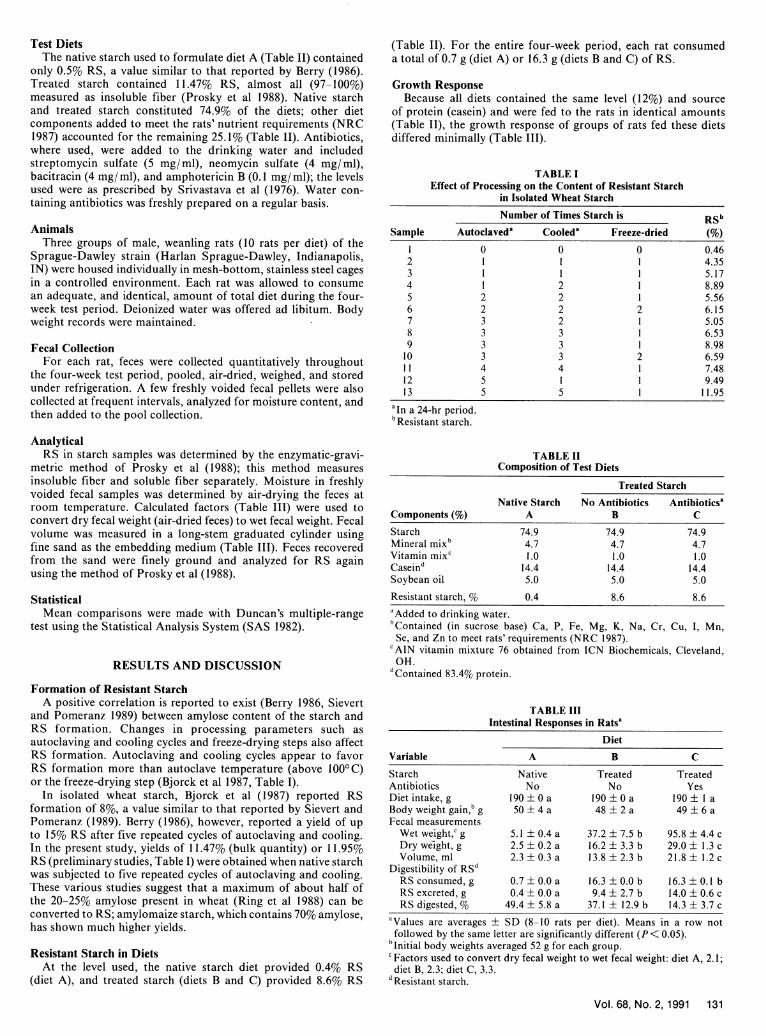
Formation of Resistant StarchA positive correlation is reported to exist (Berry 1986, Sievert
and Pomeranz 1989) between amylose content of the starch andRS formation. Changes in processing parameters such asautoclaving and cooling cycles and freeze-drying steps also affectRS formation. Autoclaving and cooling cycles appear to favorRS formation more than autoclave temperature (above 1000C)or the freeze-drying step (Bjorck et al 1987, Table I).
In isolated wheat starch, Bjorck et al (1987) reported RSformation of 8%, a value similar to that reported by Sievert andPomeranz (1989). Berry (1986), however, reported a yield of upto 15% RS after five repeated cycles of autoclaving and cooling.In the present study, yields of 11.47% (bulk quantity) or 11.95%RS (preliminary studies, Table I) were obtained when native starchwas subjected to five repeated cycles of autoclaving and cooling.These various studies suggest that a maximum of about half ofthe 20-25% amylose present in wheat (Ring et al 1988) can beconverted to RS; amylomaize starch, which contains 70% amylose,has shown much higher yields.
Resistant Starch in DietsAt the level used, the native starch diet provided 0.4% RS
(diet A), and treated starch (diets B and C) provided 8.6% RS
(Table II). For the entire four-week period, each rat consumeda total of 0.7 g (diet A) or 16.3 g (diets B and C) of RS.
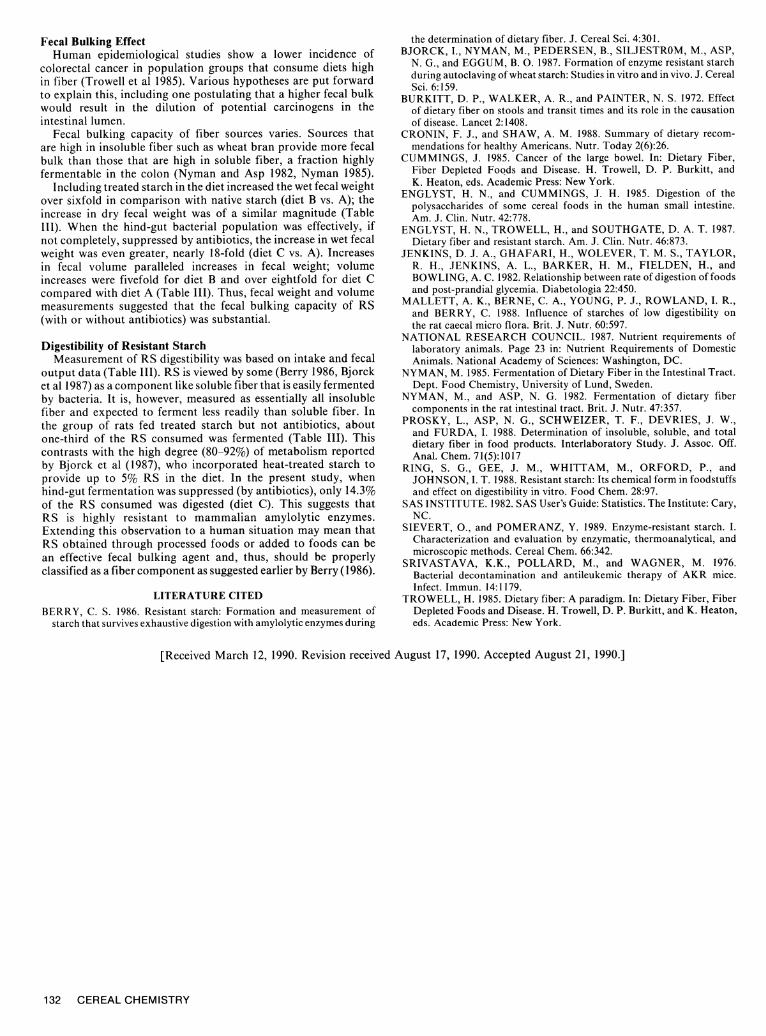
Growth ResponseBecause all diets contained the same level (12%) and source
of protein (casein) and were fed to the rats in identical amounts(Table II), the growth response of groups of rats fed these dietsdiffered minimally (Table III).
TABLE IEffect of Processing on the Content of Resistant Starch
in Isolated Wheat Starch
Number of Times Starch is RSbSample Autoclaveda Cooleda Freeze-dried (%)
1 0 0 0 0.462 1 1 1 4.353 1 1 1 5.174 1 2 1 8.895 2 2 1 5.566 2 2 2 6.157 3 2 1 5.058 3 3 1 6.539 3 3 1 8.98
10 3 3 2 6.5911 4 4 1 7.4812 5 1 1 9.4913 5 5 1 11.95
'In a 24-hr period.bResistant starch.
TABLE IIComposition of Test Diets
Treated StarchNative Starch No Antibiotics Antibioticsa
Components (%) A B CStarch 74.9 74.9 74.9Mineral mixb 4.7 4.7 4.7Vitamin mixc 1.0 1.0 1.0Caseind 14.4 14.4 14.4Soybean oil 5.0 5.0 5.0
Resistant starch, % 0.4 8.6 8.6
'Added to drinking water.bContained (in sucrose base) Ca, P, Fe, Mg, K, Na, Cr, Cu, I, Mn,
Se, and Zn to meet rats' requirements (NRC 1987).'AIN vitamin mixture 76 obtained from ICN Biochemicals, Cleveland,
OH.dContained 83.4% protein.
TABLE IIIIntestinal Responses in Ratsa
DietVariable A B CStarch Native Treated TreatedAntibiotics No No YesDiet intake, g 190 + 0 a 190 + 0 a 190 ± I aBody weight gain,b g 50 + 4 a 48 + 2 a 49 ± 6 aFecal measurements
Wet weight,c g 5.1 ± 0.4 a 37.2 ± 7.5 b 95.8 ± 4.4 cDry weight, g 2.5 + 0.2 a 16.2 + 3.3 b 29.0 ± 1.3 cVolume, ml 2.3 + 0.3 a 13.8 ± 2.3 b 21.8 ± 1.2 c
Digestibility of RSdRS consumed, g 0.7 + 0.0 a 16.3 ± 0.0 b 16.3 + 0.1 bRS excreted, g 0.4 + 0.0 a 9.4 ± 2.7 b 14.0 ± 0.6 cRS digested, % 49.4 + 5.8 a 37.1 ± 12.9 b 14.3 ± 3.7 c
aValues are averages + SD (8-10 rats per diet). Means in a row notfollowed by the same letter are significantly different (P < 0.05).
bInitial body weights averaged 52 g for each group.c Factors used to convert dry fecal weight to wet fecal weight: diet A, 2.1;
diet B, 2.3; diet C, 3.3.dResistant starch.
Vol. 68, No. 2,1991 131
Fecal Bulking EffectHuman epidemiological studies show a lower incidence of
colorectal cancer in population groups that consume diets highin fiber (Trowell et al 1985). Various hypotheses are put forwardto explain this, including one postulating that a higher fecal bulkwould result in the dilution of potential carcinogens in theintestinal lumen.
Fecal bulking capacity of fiber sources varies. Sources thatare high in insoluble fiber such as wheat bran provide more fecalbulk than those that are high in soluble fiber, a fraction highlyfermentable in the colon (Nyman and Asp 1982, Nyman 1985).
Including treated starch in the diet increased the wet fecal weightover sixfold in comparison with native starch (diet B vs. A); theincrease in dry fecal weight was of a similar magnitude (TableIII). When the hind-gut bacterial population was effectively, ifnot completely, suppressed by antibiotics, the increase in wet fecalweight was even greater, nearly 18-fold (diet C vs. A). Increasesin fecal volume paralleled increases in fecal weight; volumeincreases were fivefold for diet B and over eightfold for diet Ccompared with diet A (Table III). Thus, fecal weight and volumemeasurements suggested that the fecal bulking capacity of RS(with or without antibiotics) was substantial.
Digestibility of Resistant StarchMeasurement of RS digestibility was based on intake and fecal
output data (Table III). RS is viewed by some (Berry 1986, Bjorcket al 1987) as a component like soluble fiber that is easily fermentedby bacteria. It is, however, measured as essentially all insolublefiber and expected to ferment less readily than soluble fiber. Inthe group of rats fed treated starch but not antibiotics, aboutone-third of the RS consumed was fermented (Table III). Thiscontrasts with the high degree (80-92%) of metabolism reportedby Bjorck et al (1987), who incorporated heat-treated starch toprovide up to 5% RS in the diet. In the present study, whenhind-gut fermentation was suppressed (by antibiotics), only 14.3%of the RS consumed was digested (diet C). This suggests thatRS is highly resistant to mammalian amylolytic enzymes.Extending this observation to a human situation may mean thatRS obtained through processed foods or added to foods can bean effective fecal bulking agent and, thus, should be properlyclassified as a fiber component as suggested earlier by Berry (1986).
LITERATURE CITEDBERRY, C. S. 1986. Resistant starch: Formation and measurement of
starch that survives exhaustive digestion with amylolytic enzymes during
the determination of dietary fiber. J. Cereal Sci. 4:301.BJORCK, I., NYMAN, M., PEDERSEN, B., SILJESTROM, M., ASP,
N. G., and EGGUM, B. 0. 1987. Formation of enzyme resistant starchduring autoclaving of wheat starch: Studies in vitro and in vivo. J. CerealSci. 6:159.
BURKITT, D. P., WALKER, A. R., and PAINTER, N. S. 1972. Effectof dietary fiber on stools and transit times and its role in the causationof disease. Lancet 2:1408.
CRONIN, F. J., and SHAW, A. M. 1988. Summary of dietary recom-mendations for healthy Americans. Nutr. Today 2(6):26.
CUMMINGS, J. 1985. Cancer of the large bowel. In: Dietary Fiber,Fiber Depleted Foods and Disease. H. Trowell, D. P. Burkitt, andK. Heaton, eds. Academic Press: New York.
ENGLYST, H. N., and CUMMINGS, J. H. 1985. Digestion of thepolysaccharides of some cereal foods in the human small intestine.Am. J. Clin. Nutr. 42:778.
ENGLYST, H. N., TROWELL, H., and SOUTHGATE, D. A. T. 1987.Dietary fiber and resistant starch. Am. J. Clin. Nutr. 46:873.
JENKINS, D. J. A., GHAFARI, H., WOLEVER, T. M. S., TAYLOR,R. H., JENKINS, A. L., BARKER, H. M., FIELDEN, H., andBOWLING, A. C. 1982. Relationship between rate of digestion of foodsand post-prandial glycemia. Diabetologia 22:450.
MALLETT, A. K., BERNE, C. A., YOUNG, P. J., ROWLAND, I. R.,and BERRY, C. 1988. Influence of starches of low digestibility onthe rat caecal micro flora. Brit. J. Nutr. 60:597.
NATIONAL RESEARCH COUNCIL. 1987. Nutrient requirements oflaboratory animals. Page 23 in: Nutrient Requirements of DomesticAnimals. National Academy of Sciences: Washington, DC.
NYMAN, M. 1985. Fermentation of Dietary Fiber in the Intestinal Tract.Dept. Food Chemistry, University of Lund, Sweden.
NYMAN, M., and ASP, N. G. 1982. Fermentation of dietary fibercomponents in the rat intestinal tract. Brit. J. Nutr. 47:357.
PROSKY, L., ASP, N. G., SCHWEIZER, T. F., DEVRIES, J. W.,and FURDA, 1. 1988. Determination of insoluble, soluble, and totaldietary fiber in food products. Interlaboratory Study. J. Assoc. Off.Anal. Chem. 71(5):1017
RING, S. G., GEE, J. M., WHITTAM, M., ORFORD, P., andJOHNSON, I. T. 1988. Resistant starch: Its chemical form in foodstuffsand effect on digestibility in vitro. Food Chem. 28:97.
SAS INSTITUTE. 1982. SAS User's Guide: Statistics. The Institute: Cary,NC.
SIEVERT, O., and POMERANZ, Y. 1989. Enzyme-resistant starch. I.Characterization and evaluation by enzymatic, thermoanalytical, andmicroscopic methods. Cereal Chem. 66:342.
SRIVASTAVA, K.K., POLLARD, M., and WAGNER, M. 1976.Bacterial decontamination and antileukemic therapy of AKR mice.Infect. Immun. 14:1179.
TROWELL, H. 1985. Dietary fiber: A paradigm. In: Dietary Fiber, FiberDepleted Foods and Disease. H. Trowell, D. P. Burkitt, and K. Heaton,eds. Academic Press: New York.
[Received March 12, 1990. Revision received August 17, 1990. Accepted August 21, 1990.]
132 CEREAL CHEMISTRY


