Scoring Performance • Objective v. Subjective Scoring . Objective scoring is based on observable qualities and not affected by other things. Subjective scoring relies on private and personal criteria that are not open to observation.
Transcript
Scoring Performance
• Objective v. Subjective Scoring. Objective scoring is based on observable qualities and not affected by other things. Subjective scoring relies on private and personal criteria that are not open to observation.
2 Families of Derived Scores
• Scores of Relative Standing that define a person’s performance in terms of the performances of other similar individuals. (e.g., percentiles and standard scores)
• Developmental Scores that define a person’s performance in terms of the average of particular group’s performance. (e.g., age equivalents and grade equivalents).
Scores of Relative Standing
• Advantages– They mean the same thing regardless of a
student's age or the content being tested. – They allow us to compare one person's
performance on several tests, for example Jerry's scores on math, science, and language subtests.
– They also allow us to compare several people on the same test, for example Jerry, Mary, and Tony on a math subtest.
. . . Percentiles
• Percentiles. Express a person’s performance in terms of the percent of people who score as well or worse than the test taker
• Used with ordinal and equal interval scales.
. . . 4 Steps in Percentile Calculation
1. Arrange scores from best to worst.2. Compute the percentage of people with
scores below the score to which you want to assign a percentile.
3. Compute the percentage of people earning the score to which you want to assign a percentile.
4. Add the percentage of people below the score to ½ the people earning the score.
Calculating percentiles, An Example
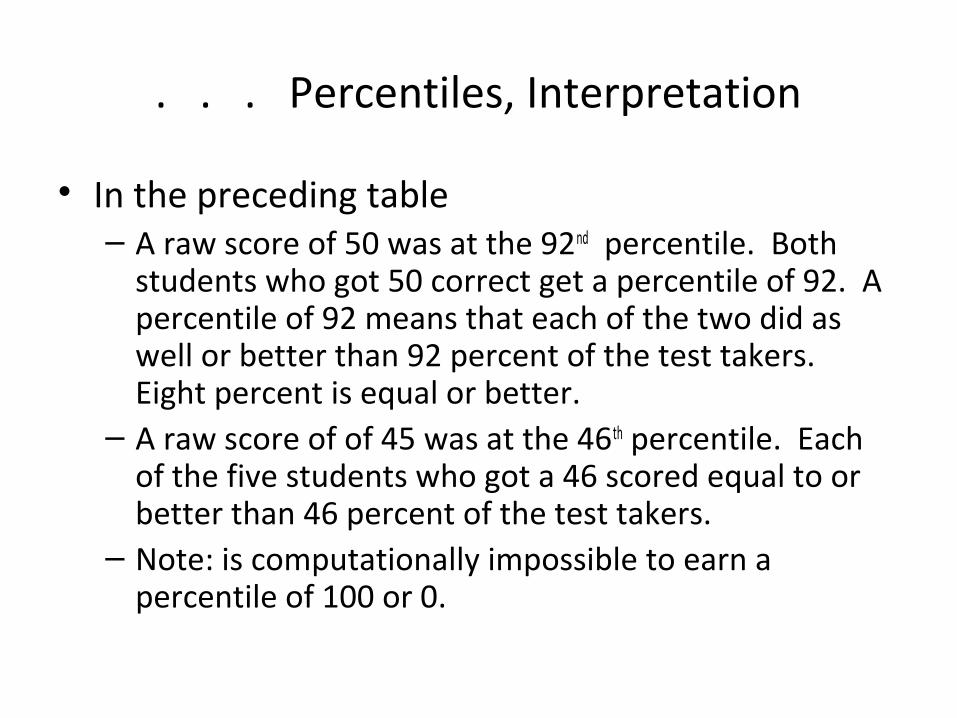
. . . Percentiles, Interpretation
• In the preceding table– A raw score of 50 was at the 92nd percentile. Both
students who got 50 correct get a percentile of 92. A percentile of 92 means that each of the two did as well or better than 92 percent of the test takers. Eight percent is equal or better.
– A raw score of of 45 was at the 46th percentile. Each of the five students who got a 46 scored equal to or better than 46 percent of the test takers.
– Note: is computationally impossible to earn a percentile of 100 or 0.
. . . Percentile Family
• Deciles divide the percentile range into bands of 10 percentiles. The first decile goes from 0.1 to 9.9. The second decile goes from 10 to 19.9. etc.
• Quartiles divide the percentile range into four bands, each 25 percentiles wide. The first quartile goes from 0.1 to 24.9; the second, from 25 to 49.9. etc.
• Other bands are possible – tertiles, quintiles dodecadiles, etc.
. . . Percentiles, concluding comments
• Percentiles are ordinal. The difference between adjacent values are not the same across the score.
• Because the are ordinal you cannot add, subtract, multiple, divide, or average them
• The 50th percentile is the median. If the distribution is normal, it is also the mean and mode.
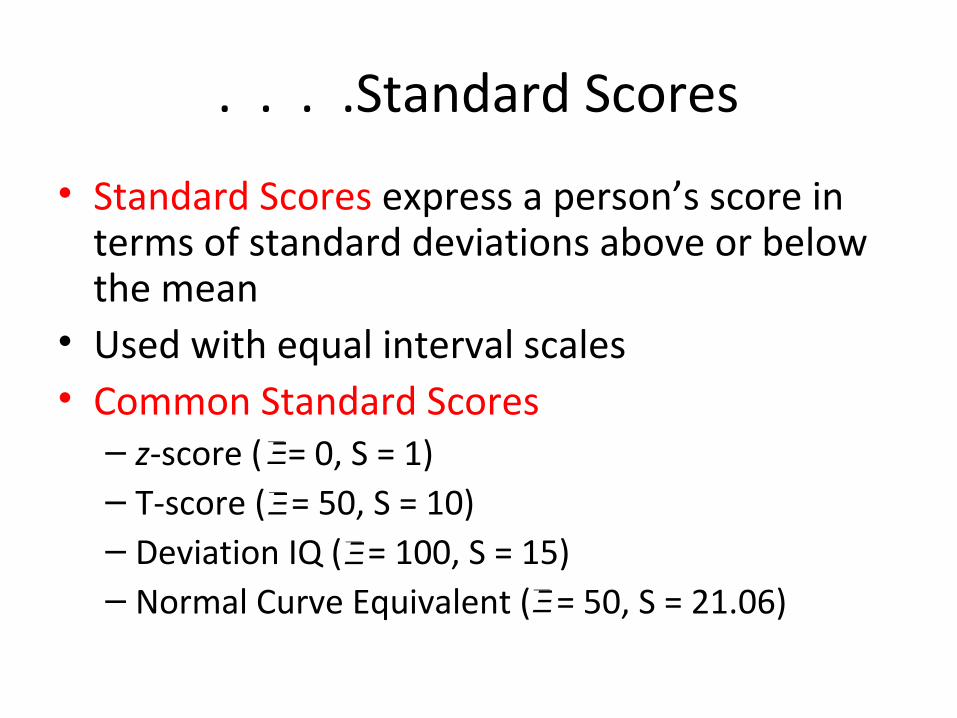
. . . .Standard Scores
• Standard Scores express a person’s score in terms of standard deviations above or below the mean
• Used with equal interval scales• Common Standard Scores– z-score ( = 0, S = 1)– T-score ( = 50, S = 10)– Deviation IQ ( = 100, S = 15)– Normal Curve Equivalent ( = 50, S = 21.06)
€
Ξ
€
Ξ
€
Ξ
€
Ξ
. . . Calculating z-scores
• z = (raw score – mean)/ standard deviation– Example: raw score = 31, mean =27, S = 6.• z = (31 – 27) / 6• = 4/6 or .67• Interpretation: the person scored .67 standard deviations above
the mean.
– Example 2: raw score = 18, mean = 27, S = 6• z = (18 - 27) / 6• = -9 / 6 or -1.5• Interpretation: the person scored 1.5 standard deviations below
the mean.
. . . Calculating any other Standard Score
• z-scores can be changed to any other standard score (SS) if the mean and standard deviation of that SS are known with the following formula.– SS = meanss + (z) (Sss)
– An Example: suppose we wanted to convert a z-score to a deviation IQ. (Recall µ = 100 and S = 15.) A student with a z-score of .6 would earn a standard score of 109, that is, 100 + (15)(0.6.
. . . Stanines
• Stanines. Short for standard nines are standard score bands that divide a distribution into nine parts. The second through eighth stanines are 0.5 standard deviations wide. The fifth stanine is centered on the mean and goes from -0.25 to +0.25 S. The first and ninth stanines are each 1.75 standard deviations wide.
• Stanines were once popular, but are seldom used today.
Standard Scores, Advantages
• Standard scores are equal interval scales so they can be added, subtracted, multiplied, divided, and averaged.
• They allow two important comparisons.– Several scores for the same student can be directly
compared.– Several individuals can be directly compared on the
same score.• Warning: Standard scores are not ratio scales.
Thus, a student with an IQ of 150 is not twice as smart as a student with a 75 IQ.
Standard Scores, Disadvantages
• Standard scores are not readily interpreted by individuals without some measurement background (e.g., students and their parents).
• Standard scores often imply greater precision than a test may allow.
Developmental Scores
• Developmental scores are of two types: equivalents and quotients.
• A developmental equivalent is the age or grade at which a raw score on a test is the average (mean or median) scores
Developmental Equivalent, an example
• Suppose you tested 50 students in each of five age groups: 6, 7, 8, 9, and 10 years of age. Assume the mean of 6 year olds was 15, of 7 year olds was 20, of 8 year olds was 30, of 9 year olds was 45, and of 10 year olds was 55.– If Sam earns a score of 30, he would have earned the same score as the
mean of 8 year olds. Thus Sam would earn an age equivalent of 8 – 0.– If Sam earned a score of 45, his age equivalent would have been 9 – 0.
• Formats: Age equivalents always contain an hyphen to indicate years and months. Grade equivalents always contain a decimal to indicate tenths of a year.– 7 – 6 is seven years, six months– 7.6 is the 7 and six tenths grade or 6/10 through seventh grade.
Developmental Scores, Quotients
• Developmental quotients (DQs) are the ratio of developmental age divided by chronological age (CA), with the quotient multiplied by 100. DQs are always expressed as whole numbers.– Social Quotient = (social age/CA)(100)– Intelligence Quotient = (mental age/CA)(100)
• Note: IQs are no longer calculated this way.
Avoid Using Developmental Scores
• These scores are fatally flawed.– Systematic misinterpretation– Dubious interpolation and extrapolation – Promotion of typological thinking– False standard of performance– Scales are ordinal, not equal interval– Variance differ at different ages so quotients are
uninterpretible.
Developmental Scores Conclusion
• The International Reading Association, the American Psychological Association, the National Council on Measurement in Education, and the Council for Exceptional Children do not support the use of developmental scores.
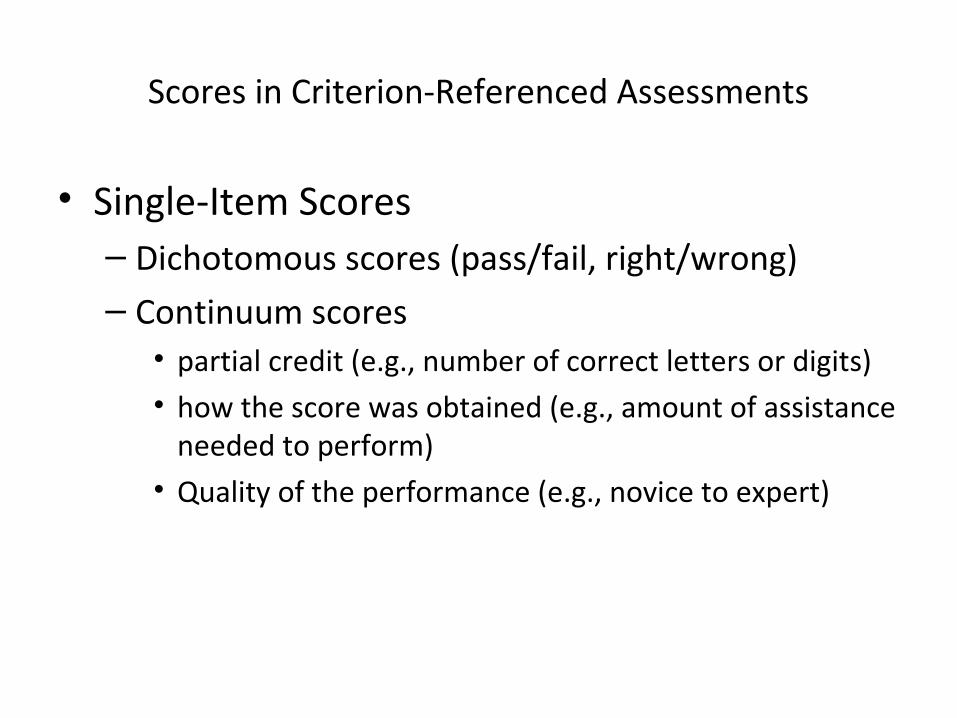
Scores in Criterion-Referenced Assessments
• Single-Item Scores– Dichotomous scores (pass/fail, right/wrong)– Continuum scores • partial credit (e.g., number of correct letters or digits)• how the score was obtained (e.g., amount of assistance
needed to perform)• Quality of the performance (e.g., novice to expert)
Criterion-Referenced Scores
• Multiple Item Scores– Percent Correct (correct responses ÷ number of