+ All Categories
Home > Documents > Test Statistics for the Comparison of Means for Two ...

Test Statistics for the Comparison of Means for Two ...

Date post: 15-Jan-2022
Category:
Upload: others
View: 1 times
Download: 0 times
Share this document with a friend
22
Journal of Modern Applied Statistical Methods Volume 16 | Issue 1 Article 9 5-1-2017 Test Statistics for the Comparison of Means for Two Samples at Include Both Paired and Independent Observations Ben Derrick University of the West of England, [email protected] Bethan Russ Office for National Statistics, [email protected] Deirdre Toher University of the West of England, [email protected] Paul White University of the West of England, [email protected] Follow this and additional works at: hp://digitalcommons.wayne.edu/jmasm Part of the Applied Statistics Commons , Social and Behavioral Sciences Commons , and the Statistical eory Commons is Regular Article is brought to you for free and open access by the Open Access Journals at DigitalCommons@WayneState. It has been accepted for inclusion in Journal of Modern Applied Statistical Methods by an authorized editor of DigitalCommons@WayneState. Recommended Citation Derrick, B., Russ, B., Toher, D., & White, P. (2017). Test statistics for the comparison of means for two samples that include both paired and independent observations. Journal of Modern Applied Statistical Methods, 16(1), 137-157. doi: 10.22237/jmasm/ 1493597280
Transcript

Journal of Modern Applied StatisticalMethods

Volume 16 | Issue 1 Article 9

5-1-2017

Test Statistics for the Comparison of Means forTwo Samples That Include Both Paired andIndependent ObservationsBen DerrickUniversity of the West of England, [email protected]

Bethan RussOffice for National Statistics, [email protected]

Deirdre ToherUniversity of the West of England, [email protected]

Paul WhiteUniversity of the West of England, [email protected]

Follow this and additional works at: http://digitalcommons.wayne.edu/jmasm

Part of the Applied Statistics Commons, Social and Behavioral Sciences Commons, and theStatistical Theory Commons

This Regular Article is brought to you for free and open access by the Open Access Journals at DigitalCommons@WayneState. It has been accepted forinclusion in Journal of Modern Applied Statistical Methods by an authorized editor of DigitalCommons@WayneState.

Recommended CitationDerrick, B., Russ, B., Toher, D., & White, P. (2017). Test statistics for the comparison of means for two samples that include bothpaired and independent observations. Journal of Modern Applied Statistical Methods, 16(1), 137-157. doi: 10.22237/jmasm/1493597280

Journal of Modern Applied Statistical Methods

May 2017, Vol. 16, No. 1, 137-157. doi: 10.22237/jmasm/1493597280

Copyright © 2017 JMASM, Inc.

ISSN 1538 − 9472

Ben Derrick is a Lecturer with the Applied Statistics Group. Email at [email protected]. Bethan Russ is an associate with the Applied Statistics Group at UWE. Email at [email protected]. Dr. Toher is a Senior Lecturer with the Applied Statistics Group. Email at [email protected]. Dr. White is an Associate Professor and the academic lead for the Applied Statistics Group. Email at [email protected].

137

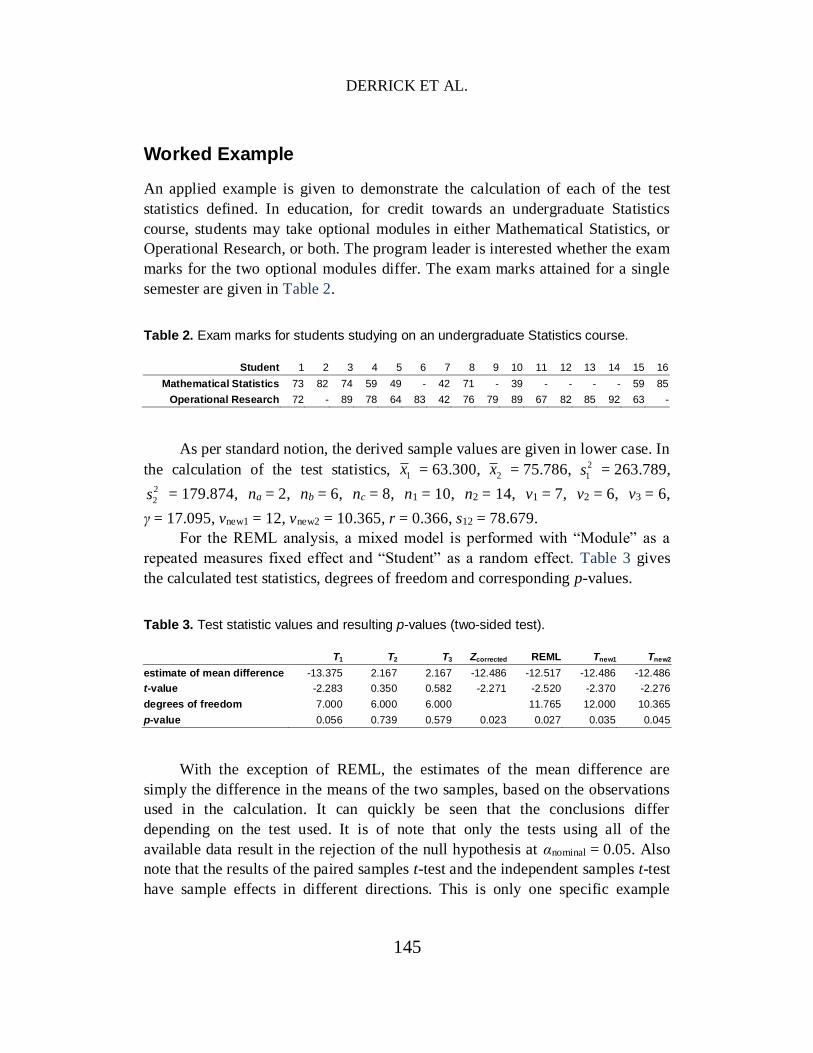
Test Statistics for the Comparison of Means for Two Samples That Include Both Paired and Independent Observations

Ben Derrick University of the West Of England

Bristol, England, UK

Deirdre Toher University of the West Of England

Bristol, England, UK

Bethan Russ Office for National Statistics

Newport, Wales, UK

Paul White University of the West Of England

Bristol, England, UK

Standard approaches for analyzing the difference in two means, where partially overlapping samples are present, are less than desirable. Here are introduced two test statistics, making reference to the t-distribution. It is shown that these test statistics are Type I error robust, and more powerful than standard tests. Keywords: partially overlapping samples, test for equality of means, corrected z-test,

partially correlated data, partially matched pairs

Introduction

Hypothesis tests for the comparison of two population means, μ1 and μ2, with two

samples of either independent observations or paired observations are well

established. When the assumptions of the test are met, the independent samples

t-test is the most powerful test for comparing means between two independent

samples (Sawilowsky and Blair, 1992). Similarly, when the assumptions of the

test are met, the paired samples t-test is the most powerful test for the comparison

of means between two dependent samples (Zimmerman, 1997). If a paired design

COMPARISON OF MEANS FOR TWO SAMPLES

138

can avoid extraneous systematic bias, then paired designs are generally

considered to be advantageous when contrasted with independent designs.

There are scenarios where, in a paired design, some observations may be

missing. In the literature, this scenario is referred to as paired samples that are

either “incomplete” (Ekbohm, 1976) or with “missing observations” (Bhoj, 1978).

There are designs that do not have completely balanced pairings. Occasions where

there may be two samples with both paired observations and independent

observations include:

i) Two groups with some common element between both groups. For

example, in education when comparing the average exam marks for

two optional subjects, where some students take one of the two

subjects and some students take both.

ii) Observations taken at two points in time, where the population

membership changes over time but retains some common members.

For example, an annual survey of employee satisfaction may include

new employees that were unable to respond at time point one,

employees that left after time point one, and employees that

remained in employment throughout.

iii) When some natural pairing occurs. For example, in a survey taken

comparing views of males and females, there will be some matched

pairs (couples) and some independent individuals (single).

The examples given above can be seen as part of the wider missing data

framework. There is much literature on methods for dealing with missing data and

the proposals in this paper do not detract from extensive research into the area.

The simulations and discussion in this paper are done in the context of data

missing completely at random (MCAR).

Two samples that include both paired and independent observations is

referred to using varied terminology in the literature. The example scenarios

outlined can be referred to as “partially paired data” (Samawi and Vogel, 2011).

However, this terminology has connotations suggesting that the pairs themselves

are not directly matched. Derrick et al. (2015) suggest that appropriate

terminology for the scenarios outlined gives reference to “partially overlapping

samples.” For work that has previously been done on a comparison of means

when partially overlapping samples are present, “the partially overlapping

DERRICK ET AL.

139

samples framework… has been treated poorly in the literature” (Martínez-

Camblor, Corral, and María de la Hera, 2012, p.77). In this paper, the term

partially overlapping samples will be used to refer to scenarios where there are

two samples with both paired and independent observations.

When partially overlapping samples exist, the goal remains to test the null

hypothesis H0 : μ1 = μ2. Standard approaches when faced with such a situation, are

to perform the paired samples t-test, discarding the unpaired data, or alternatively

perform the independent samples t-test, discarding the paired data (Looney and

Jones, 2003). These approaches are wasteful and can result in a loss of power.

The bias created with these approaches may be of concern. Other solutions

proposed in a similar context are to perform the independent samples t-test on all

observations ignoring the fact that there may be some pairs, or alternatively

randomly pairing unpaired observations and performing the paired samples t-test

(Bedeian and Feild, 2002). These methods distort Type I error rates (Zumbo,

2002) and fail to adequately reflect the design. This emphasizes the need for

research into a statistically valid approach. A method of analysis that takes into

account any pairing but does not lose the unpaired information would be

beneficial.

One analytical approach is to separately perform both the paired samples t-

test on the paired observations and the independent samples t-test on the

independent observations. The results are then combined using Fisher’s (1925)

Chi-square method, or Stouffer’s (Stouffer, et al., 1949) weighted z-test. These

methods have issues with respect to the interpretation of the results. Other

procedures weighting the paired and independent samples t-tests, for the partially

overlapping samples scenario, have been proposed by Bhoj, (1978), Kim et al.

(2005), Martínez-Camblor, Corral, and María de la Hera (2012), and Samawi and

Vogel (2011).

Looney and Jones (2003) proposed a statistic making reference to the

z-distribution that uses all of the available data, without a complex weighting

structure. Their corrected z-statistic is simple to compute and it directly tests the

hypothesis H0 : μ1 = μ2. They suggest that their test statistic is generally Type I

error robust across the scenarios that they simulated. However, they only consider

normally distributed data with a common variance of 1 and a total sample size of

50 observations. Therefore their simulation results are relatively limited,

simulations across a wider range of parameters would help provide stronger

conclusions. Mehrotra (2004) indicates that the solution provided by Looney and

Jones (2003) may not be Type I error robust for small sample sizes.

COMPARISON OF MEANS FOR TWO SAMPLES

140

Early literature for the partially overlapping samples framework focused on

maximum likelihood estimates, when data are missing by accident rather than by

design. Lin (1973) use maximum likelihood estimates for the specific case where

data is missing from one of the two groups. Lin (1973) uses assumptions such as

the variance ratio is known. Lin and Strivers (1974) apply maximum likelihood

solutions to the more general case, but find that no single solution is applicable.

For normally distributed data, Ekbohm (1976) compared Lin and Strivers

(1974) tests with similar proposals based on maximum likelihood estimators.

Ekbohm (1976) found that maximum likelihood solutions do not always maintain

Bradley’s liberal Type I error robustness criteria. The results suggest that the

maximum likelihood approaches are of little added value compared to standard

methods. Furthermore the proposals by Ekbohm (1976) are complex

mathematical procedures and are unlikely to be considered as a first choice

solution in a practical environment.

A solution available in most standard software is to perform a mixed model

using all of the available data. In a mixed model, effects are assessed using

Restricted Maximum Likelihood estimators (REML). Mehrotra (2004) indicates

that for positive correlation, REML is Type I error robust and more powerful

approach than that proposed by Looney and Jones (2003).

For small sample sizes, an intuitive solution to the comparison of means

with partially overlapping samples, would be a test statistic derived using

concepts similar to that of Zumbo (2002) so that all available data are used

making reference to the t-distribution.

Here, two test statistics are proposed. The proposed solution for equal

variances acts as a linear interpolation between the paired samples t-test and the

independent samples t-test. The consensus in the literature is that Welch’s test is

more Type I error robust than the independent samples t-test, particularly with

unequal variances and unequal samples sizes (Derrick, Toher and White, 2016;

Fay and Proschan, 2010; Zimmerman and Zumbo, 2009). The proposed solution

for unequal variances is a test that acts as a linear interpolation between the paired

samples t-test and Welch’s test.

Standard tests and the proposal by Looney and Jones (2003) are given below.

This is followed by the definition of the presently proposed test statistics. A

worked example using each of these test statistics and REML is provided. The

Type I error rate and power for the test statistics and REML is then explored

using simulation, for partially overlapping samples simulated from a Normal

distribution.

DERRICK ET AL.

141

Notation

Notation used in the definition of the test statistics is given in Table 1. Table 1. Notation used in this paper.

an = number of observations exclusive to Sample 1

bn = number of observations exclusive to Sample 2

cn = number of pairs

n1 = total number of observations in Sample 1 (i.e. n1 = na + nc)

n2 = total number of observations in Sample 2 (i.e. n2 = nb + nc)

X1 = mean of all observations in Sample 1

X2 = mean of all observations in Sample 2

aX = mean of the independent observations in Sample 1

bX = mean of the independent observations in Sample 2

cX1 = mean of the paired observations in Sample 1

cX2 = mean of the paired observations in Sample 2

S2

1 = variance of all observations in Sample 1

S2

2 = variance of all observations in Sample 2

aS2 = variance of the independent observations in Sample 1

bS2 = variance of the independent observations in Sample 2

cS2

1 = variance of the paired observations in Sample 1

cS2

2 = variance of the paired observations in Sample 2

S12 = covariance between the paired observations

r = Pearson’s correlation coefficient for the paired observations

All variances above are calculated using Bessel’s correction, i.e. the sample

variance with ni − 1 degrees of freedom (see Kenney and Keeping, 1951, p.161).

COMPARISON OF MEANS FOR TWO SAMPLES

142

As standard notation, random variables are shown in upper case, and derived

sample values are shown are in lower case.

Definition of Existing Test Statistics

Standard approaches for comparing two means making reference to the t-

distribution are given below. These definitions follow the structural form given by

Fradette et al. (2003), adapted to the context of partially overlapping samples.

To perform the paired samples t-test, the independent observations are

discarded so that

1 21

2 2

1 2 1 22

c c

c c c c

c c c

X XT

S S S Sr

n n n

The statistic T1 is referenced against the t-distribution with v1 = nc − 1

degrees of freedom.

To perform the independent samples t-test, the paired observations are

discarded so that

21 1

a b

p

a b

X XT

Sn n

where

2 21 1

1 1

a a b b

p

a b

n S n SS

n n

The statistic T2 is referenced against the t-distribution with v2 = na + nb − 2

degrees of freedom.

To perform Welch’s test, the paired observations are discarded so that

32 2

a b

a b

a b

X XT

S S

n n

The statistic T3 is referenced against the t-distribution with degrees of

freedom approximated by

DERRICK ET AL.

143

22 2

3 2 22 2

/ 1 / 1

a b

a b

a ba b

a b

S S

n nv

S Sn n

n n

For large sample sizes, the test statistic for partially overlapping samples

proposed by Looney and Jones (2003) is

1 2corrected

2 2121 2

2 c

a c b c a c b c

X XZ

n SS S

n n n n n n n n

The statistic Zcorrected is referenced against the standard Normal distribution.

In the extremes of na = nb = 0, or nc = 0, Zcorrected defaults to the paired samples

z-statistic and the independent samples z-statistic respectively.

Definition of Proposed Test Statistics

Two new t-statistics are proposed; Tnew1, assuming equal variances, and Tnew2,

when equal variances cannot be assumed. The test statistics are constructed as the

difference between two means taking into account the covariance structure. The

numerator is the difference between the means of the two samples and the

denominator is a measure of the standard error of this difference. Thus the test

statistics proposed here are directly testing the hypothesis H0 : μ1 = μ2.

The test statistic Tnew1 is derived so that in the extremes of na = nb = 0, or

nc = 0, Tnew1 defaults to T1 or T2 respectively, thus

1 2new1

1 2 1 2

1 12 c

p

X XT

nS r

n n n n

where

2 2

1 1 2 2

1 2

1 1

1 1p

n S n SS

n n

The test statistic Tnew1 is referenced against the t-distribution with degrees of

freedom derived by linear interpolation between v1 and v2 so that

COMPARISON OF MEANS FOR TWO SAMPLES

144

new1

11 .

2

a b cc a b

a b c

n n nv n n n

n n n

In the extremes, when na = nb = 0, vnew1 defaults to v1; or when nc = 0, vnew1

defaults to v2.

Given the superior Type I error robustness of Welch’s test when variances

are not equal, a test statistic is derived making reference to Welch’s approximate

degrees of freedom. This test statistic makes use of the sample variances, 2

1S and

2

2S . The test statistic Tnew2 is derived so that in the extremes of na = nb = 0, or

nc = 0, Tnew2 defaults to T1 or T3 respectively, thus

1 2new2

2 2

1 21 2

1 2 1 2

2 c

X XT

S S nS Sr

n n n n

The test statistic Tnew2 is referenced against the t-distribution with degrees of

freedom derived as a linear interpolation between v1 and v3 so that

new2

11

2

cc a b

a b c

nv n n n

n n n

where

22 2

1 2

1 2

2 22 2

1 21 2

1 2

/ 1 / 1

S S

n n

S Sn n

n n

In the extremes, when na = nb = 0, vnew2 defaults to v1; or when nc = 0, vnew2

defaults to v3.

Note that the proposed statistics, Tnew1 and Tnew2, use all available

observations in the respective variance calculations. The statistic Zcorrected only

uses the paired observations in the calculation of covariance.

DERRICK ET AL.

145

Worked Example

An applied example is given to demonstrate the calculation of each of the test

statistics defined. In education, for credit towards an undergraduate Statistics

course, students may take optional modules in either Mathematical Statistics, or

Operational Research, or both. The program leader is interested whether the exam

marks for the two optional modules differ. The exam marks attained for a single

semester are given in Table 2. Table 2. Exam marks for students studying on an undergraduate Statistics course.

Student 1 2 3 4 5 6 7 8 9 10 11 12 13 14 15 16

Mathematical Statistics 73 82 74 59 49 - 42 71 - 39 - - - - 59 85

Operational Research 72 - 89 78 64 83 42 76 79 89 67 82 85 92 63 -

As per standard notion, the derived sample values are given in lower case. In

the calculation of the test statistics, 1x = 63.300, 2x = 75.786, 2

1s = 263.789, 2

2s = 179.874, na = 2, nb = 6, nc = 8, n1 = 10, n2 = 14, v1 = 7, v2 = 6, v3 = 6,

γ = 17.095, vnew1 = 12, vnew2 = 10.365, r = 0.366, s12 = 78.679.

For the REML analysis, a mixed model is performed with “Module” as a

repeated measures fixed effect and “Student” as a random effect. Table 3 gives

the calculated test statistics, degrees of freedom and corresponding p-values. Table 3. Test statistic values and resulting p-values (two-sided test).

T1 T2 T3 Zcorrected REML Tnew1 Tnew2

estimate of mean difference -13.375 2.167 2.167 -12.486 -12.517 -12.486 -12.486

t-value -2.283 0.350 0.582 -2.271 -2.520 -2.370 -2.276

degrees of freedom 7.000 6.000 6.000

11.765 12.000 10.365

p-value 0.056 0.739 0.579 0.023 0.027 0.035 0.045

With the exception of REML, the estimates of the mean difference are

simply the difference in the means of the two samples, based on the observations

used in the calculation. It can quickly be seen that the conclusions differ

depending on the test used. It is of note that only the tests using all of the

available data result in the rejection of the null hypothesis at αnominal = 0.05. Also

note that the results of the paired samples t-test and the independent samples t-test

have sample effects in different directions. This is only one specific example

COMPARISON OF MEANS FOR TWO SAMPLES

146

given for illustrative purposes, investigation is required into the power of the test

statistics over a wide range of scenarios. Conclusions based on the proposed tests

cannot be made without a thorough investigation into their Type I error robustness.

Simulation Design

Under normality, Monte-Carlo methods are used to investigate the Type I error

robustness of the defined test statistics and REML. Power should only be used to

compare tests when their Type I error rates are equal (Zimmerman and Zumbo,

1993). Monte-Carlo methods are used to explore the power for the tests that are

Type I error robust under normality.

Unbalanced designs are frequent in psychology (Sawilowsky and Hillman,

1992), thus a comprehensive range of values for na, nb and nc are simulated. These

values offer an extension to the work done by Looney and Jones (2003). Given

the identification of separate test statistics for equal and unequal variances,

multiple population variance parameters { 2 2

1 2, } are considered. Correlation has

an impact on Type I error and power for the paired samples t-test (Fradette et al.,

2003), hence a range of correlations {ρ} between two normal populations are

considered. Correlated normal variates are obtained as per Kenney and Keeping

(1951). A total of 10,000 replicates of each of the scenarios in Table 4 are

performed in a factorial design.

All simulations are performed in R version 3.1.2. For the mixed model

approach utilizing REML, the R package lme4 is used. Corresponding p-values

are calculated using the R package lmerTest, which uses the Satterthwaite

approximation adopted by SAS (Goodnight, 1976).

For each set of 10,000 p-values, the proportion of times the null hypothesis

is rejected, for a two sided test with αnominal = 0.05 is calculated. Table 4. Summary of simulation parameters

Parameter Values

μ1 0

μ2 0 (under H0); 0.5 (under H1)

σ12 1, 2, 4, 8

σ22 1, 2, 4, 8

na 5, 10, 30, 50, 100, 500

nb 5, 10, 30, 50, 100, 500

nc 5, 10, 30, 50, 100, 500

ρ -0.75, -0.50, -0.25, 0.00, 0.25, 0.50, 0.75

DERRICK ET AL.

147

Type I Error Robustness

For each of the test statistics, Type I error robustness is assessed against Bradley’s

(1978) liberal criteria. This criteria is widely used in many studies analyzing the

validity of t-tests and their adaptions. Bradley’s (1978) liberal criteria states that

the Type I error rate α should be within αnominal ± 0.5 αnominal. For αnominal = 0.05,

Bradley’s liberal interval is [0.025, 0.075].

Type I error robustness is firstly assessed under the condition of equal

variances. Under the null hypothesis, 10,000 replicates are obtained for the

4 × 6 × 6 × 6 × 7 = 6,048 scenarios where 2 2

1 2 . Figure 1 shows the Type I

error rates for each of the test statistics under equal variances for normally

distributed data.

Figure 1. Type I error rates where σ1

2 = σ22, reference lines show Bradley’s (1978) liberal

criteria.

Figure 1 indicates that when variances are equal, the statistics T1, T2, T3,

Tnew1 and Tnew2 remain within Bradley’s liberal Type I error robustness criteria

throughout the entire simulation design. The statistic Zcorrected is not Type I error

robust, thus confirming the smaller simulation findings of Mehrotra (2004).

Figure 1 also shows that REML is not Type I error robust throughout the entire

COMPARISON OF MEANS FOR TWO SAMPLES

148

simulation design. A review of our results shows that for REML the scenarios that

are outside the range of liberal Type I error robustness are predominantly those

that have negative correlation, and some where zero correlation is specified.

Given that negative correlation is rare in a practical environment, the REML

procedure is not necessarily unjustified.

Type I error robustness is assessed under the condition of unequal variances.

Under the null hypothesis, 10,000 replicates were obtained for the

4 × 3 × 6 × 6 × 6 × 7 = 18,144 scenarios where 2 2

1 2 . For assessment against

Bradley’s (1978) liberal criteria, Figure 2 shows the Type I error rates for unequal

variances for normally distributed data.

Figure 2. Type I error rates when σ1

2 ≠ σ22, reference lines show Bradley’s (1978) liberal

criteria.

Figure 2 illustrates that that the statistics defined using a pooled standard

deviation, T2 and Tnew1, do not provide Type I error robust solutions when equal

variances cannot be assumed. The statistics T1, T3 and Tnew2 retain their Type I

error robustness under unequal variances throughout all conditions simulated.

The statistic Zcorrected maintains similar Type I error rates under equal and

unequal variances. The statistic Zcorrected was designed to be used only in the case

DERRICK ET AL.

149

of equal variances. For unequal variances, we observe that the statistic Zcorrected

results in an unacceptable amount of false positives when ρ ≤ 0.25 or

max{na, nb, nc} − min{na, nb, nc} is large. In addition, the statistic Zcorrected is

conservative when ρ is large and positive. The largest observed deviations from

Type I error robustness for REML are when ρ ≤ 0 or

max{na, nb, nc} − min{na, nb, nc} is large. Further insight to the Type I error rates

for REML can be seen in Figure 3 showing observed p-values against expected p-

values from a uniform distribution.

Figure 3. P-P plots for simulated p-values using REML procedure. Selected parameter

combinations (na, nb, nc, σ12, σ2

2, ρ) are as follows; A = (5,5,5,1,1,-0.75), B = (5,10,5,8,1,0), C = (5,10,5,8,1,0.5), D = (10,5,5,8,1,0.5).

If the null hypothesis is true, for any given set of parameters the p-values

should be uniformly distributed. Figure 3 gives indicative parameter combinations

where the p-values are not uniformly distributed when applying a mixed model

assessed using REML. It can be seen that REML is not Type I error robust when

the correlation is negative. In addition, caution should be exercised if using

REML when the larger variance is associated with the smaller sample size.

COMPARISON OF MEANS FOR TWO SAMPLES

150

REML maintains Type I error robustness for positive correlation and equal

variances or when the larger sample size is associated with the larger variance.

Power of Type I Error Robust Tests under Equal Variances

The test statistics that do not fail to maintain Bradley’s Type I error liberal

robustness criteria are assessed under H1. REML is included in the comparisons

for ρ ≥ 0. The power of the test statistics are assessed where σ12 = σ2

2 = 1,

followed by an assessment of the power of the test statistics where σ12 > 1 and

σ22 = 1.

Table 5 shows the power of T1, T2, T3, Tnew1, Tnew2 and REML, averaged

over all sample size combinations where σ12 = σ2

2 = 1. Table 5. Power of Type I error robust test statistics σ1

2 = σ22 = 1, α = 0.05, μ2 − μ1 = 0.5.

ρ T1 T2 T3 Tnew1 Tnew2 REML

na = nb

0.75 0.785 0.567 0.565 0.887 0.886 0.922

0.50 0.687 0.567 0.565 0.865 0.864 0.880

0.25 0.614 0.567 0.565 0.842 0.841 0.851

0 0.558 0.567 0.565 0.818 0.818 0.829

<0 0.481 0.567 0.565 0.778 0.778 -

na ≠ nb

0.75 0.784 0.455 0.433 0.855 0.847 0.907

0.5 0.687 0.455 0.433 0.84 0.832 0.861

0.25 0.615 0.455 0.433 0.823 0.816 0.832

0 0.559 0.455 0.433 0.806 0.799 0.816

<0 0.482 0.455 0.433 0.774 0.766 -

Table 5 shows that REML and the test statistics proposed in this paper, Tnew1

and Tnew2, are more powerful than standard approaches, T1, T2 and T3, when

variances are equal. Consistent with the paired samples t-test, T1, the power of

Tnew1 and Tnew2 is relatively lower when there is zero or negative correlation

between the two populations. Similar to contrasts of the independent samples t-

test, T2, with Welch’s test, T3, for equal variances but unequal sample sizes, Tnew1

is marginally more powerful than Tnew2, but not to any practical extent. For each

of the tests statistics making use of paired data, as the correlation between the

paired samples increases, the power increases.

As the correlation between the paired samples increases, the power

advantage of the proposed test statistics relative to the paired samples t-test

becomes smaller. Therefore the proposed statistics Tnew1 and Tnew2 may be

especially useful when the correlation between the two populations is small.

DERRICK ET AL.

151

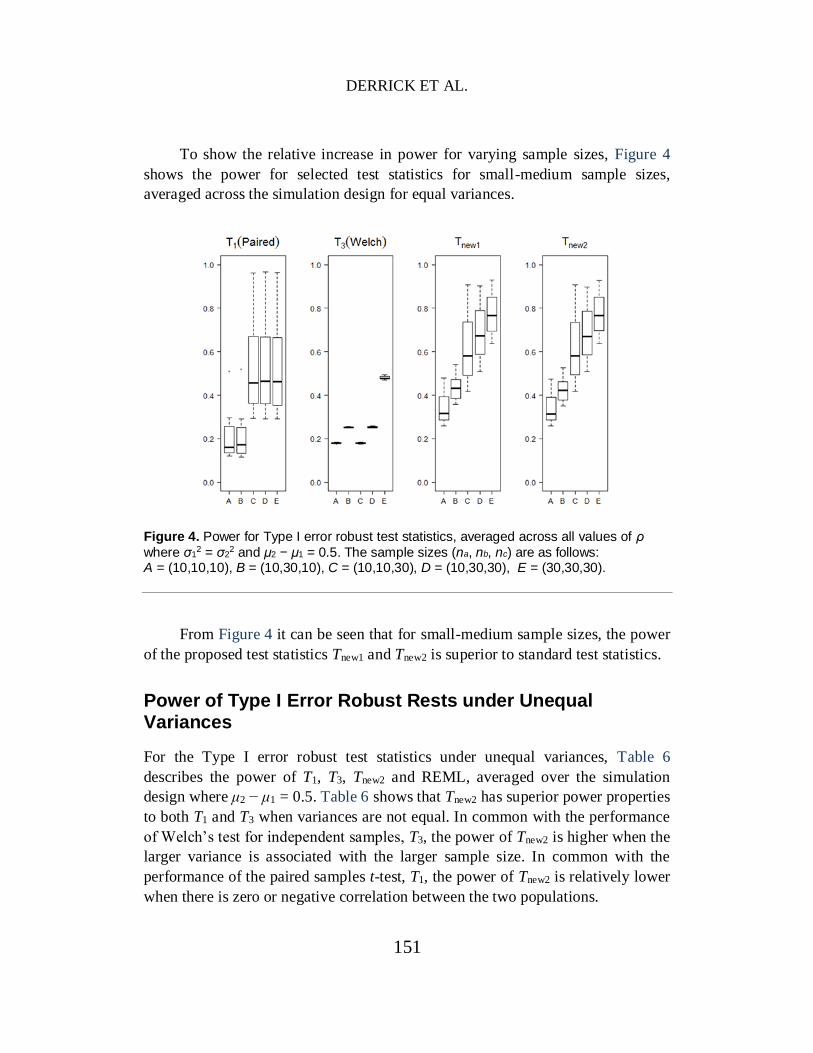
To show the relative increase in power for varying sample sizes, Figure 4

shows the power for selected test statistics for small-medium sample sizes,

averaged across the simulation design for equal variances.

Figure 4. Power for Type I error robust test statistics, averaged across all values of ρ

where σ12 = σ2

2 and μ2 − μ1 = 0.5. The sample sizes (na, nb, nc) are as follows: A = (10,10,10), B = (10,30,10), C = (10,10,30), D = (10,30,30), E = (30,30,30).

From Figure 4 it can be seen that for small-medium sample sizes, the power

of the proposed test statistics Tnew1 and Tnew2 is superior to standard test statistics.

Power of Type I Error Robust Rests under Unequal Variances

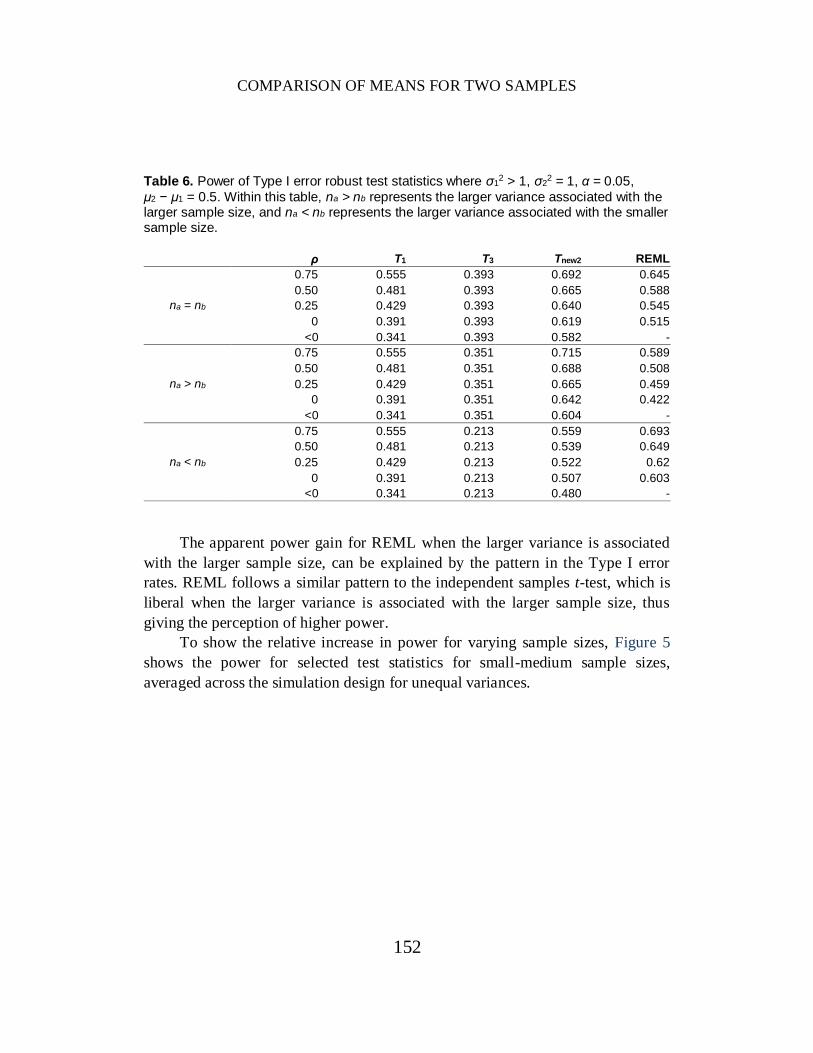
For the Type I error robust test statistics under unequal variances, Table 6

describes the power of T1, T3, Tnew2 and REML, averaged over the simulation

design where μ2 − μ1 = 0.5. Table 6 shows that Tnew2 has superior power properties

to both T1 and T3 when variances are not equal. In common with the performance

of Welch’s test for independent samples, T3, the power of Tnew2 is higher when the

larger variance is associated with the larger sample size. In common with the

performance of the paired samples t-test, T1, the power of Tnew2 is relatively lower

when there is zero or negative correlation between the two populations.

COMPARISON OF MEANS FOR TWO SAMPLES

152

Table 6. Power of Type I error robust test statistics where σ1

2 > 1, σ22 = 1, α = 0.05,

μ2 − μ1 = 0.5. Within this table, na > nb represents the larger variance associated with the larger sample size, and na < nb represents the larger variance associated with the smaller sample size.

ρ T1 T3 Tnew2 REML

na = nb

0.75 0.555 0.393 0.692 0.645

0.50 0.481 0.393 0.665 0.588

0.25 0.429 0.393 0.640 0.545

0 0.391 0.393 0.619 0.515

<0 0.341 0.393 0.582 -

na > nb

0.75 0.555 0.351 0.715 0.589

0.50 0.481 0.351 0.688 0.508

0.25 0.429 0.351 0.665 0.459

0 0.391 0.351 0.642 0.422

<0 0.341 0.351 0.604 -

na < nb

0.75 0.555 0.213 0.559 0.693

0.50 0.481 0.213 0.539 0.649

0.25 0.429 0.213 0.522 0.62

0 0.391 0.213 0.507 0.603

<0 0.341 0.213 0.480 -

The apparent power gain for REML when the larger variance is associated

with the larger sample size, can be explained by the pattern in the Type I error

rates. REML follows a similar pattern to the independent samples t-test, which is

liberal when the larger variance is associated with the larger sample size, thus

giving the perception of higher power.

To show the relative increase in power for varying sample sizes, Figure 5

shows the power for selected test statistics for small-medium sample sizes,

averaged across the simulation design for unequal variances.

DERRICK ET AL.

153

Figure 5. Power for Type I error robust test statistics σ1

2 > σ22 and μ2 − μ1 = 0.5. The

sample sizes (na, nb, nc) are as follows: A = (10,10,10), B1 = (10,30,10), B2 = (30,10,10), C = (10,10,30), D1 = (10,30,30), D2 = (30,10,30), E = (30,30,30).

Figure 5 shows a relative power advantage when the larger variance is

associated with the larger sample size, as per B2 and D2. A comparison of Figure 4

and Figure 5 shows that for small-medium sample sizes, power is adversely

affected for all test statistics when variances are not equal.

Discussion

The statistic Tnew2 is Type I error robust across all conditions simulated under

normality. The greater power observed for Tnew1, compared to Tnew2, under equal

variances, is likely to be of negligible consequence in a practical environment.

This is in line with empirical evidence for the performance of Welch’s test, when

only independent samples are present, which leads to many observers

recommending the routine use of Welch’s test under normality (e.g. Ruxton,

2006).

The Type I error rates and power of Tnew2 follow the properties of its

counterparts, T1 and T3. Thus Tnew2 can be seen as a trade-off between the paired

samples t-test and Welch’s test, with the advantage of increased power across all

conditions, due to using all available data.

COMPARISON OF MEANS FOR TWO SAMPLES

154

The partially overlapping samples scenarios identified in this paper could be

considered as part of the missing data framework and all simulations have been

performed under the assumption of MCAR.

The statistics proposed in this paper form less computationally intensive

competitors to REML. The REML procedure does not directly calculate the

difference between the two sample means, in a practical environment this makes

its results hard to interpret. The statistics proposed in this paper also lend

themselves far more easily to the development of non-parametric tests.

Conclusion

A commonly occurring scenario when comparing two means is a combination of

paired observations and independent observations in both samples, this scenario is

referred to as partially overlapping samples. Standard procedures for analyzing

partially overlapping samples involve discarding observations and performing

either the paired samples t-test, or the independent samples t-test, or Welch’s test.

These approaches are less than desirable. In this paper, two new test statistics

making reference to the t-distribution are introduced and explored under a

comprehensive set of parameters, for normally distributed data. Under equal

variances, Tnew1 and Tnew2 are Type I error robust. In addition they are more

powerful than standard Type I error robust approaches considered in this paper.

When variances are equal, there is a slight power advantage of using Tnew1 over

Tnew2, particularly when sample sizes are not equal. Under unequal variances,

Tnew2 is the most powerful Type I error robust statistic considered in this paper.

We recommend that when faced with a research problem involving partially

overlapping samples and MCAR can be reasonably assumed, the statistic Tnew1

could be used when it is known that variances are equal. Otherwise under the

same conditions when equal variances cannot be assumed the statistic Tnew2 could

be used.

A mixed model procedure using REML is not fully Type I error robust. In

those scenarios in which this procedure is Type I error robust, the power is similar

to that of Tnew1 and Tnew2.

The proposed test statistics for partially overlapping samples provide a real

alternative method for analysis for normally distributed data, which could also be

used for the formation of confidence intervals for the true difference in two means.

DERRICK ET AL.

155

References

Bedeian, A. G., & Feild, H. S. (2002). Assessing group change under

conditions of anonymity and overlapping samples. Nursing research, 51(1), 63-65.

doi: 10.1097/00006199-200201000-00010

Bhoj, D. (1978). Testing equality of means of correlated variates with

missing observations on both responses. Biometrika, 65(1), 225-228. doi:

10.1093/biomet/65.1.225

Bradley, J. V. (1978). Robustness? British Journal of Mathematical and

Statistical Psychology, 31(2), 144-152. doi: 10.1111/j.2044-8317.1978.tb00581.x

Derrick, B., Dobson-McKittrick, A., Toher, D., & White P. (2015). Test

statistics for comparing two proportions with partially overlapping samples.

Journal of Applied Quantitative Methods, 10(3)

Derrick, B., Toher, D., & White, P. (2016). Why Welch’s test is Type I error

robust. The Quantitative Methods for Psychology, 12(1), 30-38. doi:

10.20982/tqmp.12.1.p030

Ekbohm, G. (1976). On comparing means in the paired case with

incomplete data on both responses, Biometrika, 63(2), 299-304. doi:

10.1093/biomet/63.2.299

Fay, M. P., & Proschan, M. A. (2010). Wilcoxon-Mann-Whitney or t-test?

On assumptions for hypothesis tests and multiple interpretations of decision rules.

Statistics surveys, 4(1). doi: 10.1214/09-SS051

Fisher, R. A. (1925). Statistical methods for research workers. New Delhi,

India: Genesis Publishing Pvt. Ltd.

Fradette, K., Keselman, H. J., Lix, L., Algina, J., & Wilcox, R. (2003).

Conventional and robust paired and independent samples t-tests: Type I error and

power rates. Journal of Modern Applied Statistical Methods, 2(2), 481-496. doi:

10.22237/jmasm/1067646120

Kenney, J. F., & Keeping, E. S. (1951). Mathematics of statistics, Pt. 2 (2nd

Ed). Princeton, NJ: Van Nostrand.

Kim, B. S., Kim, I., Lee, S., Kim, S., Rha, S. Y., & Chung, H. C. (2005).

Statistical methods of translating microarray data into clinically relevant

diagnostic information in colorectal cancer. Bioinformatics, 21(4), 517-528. doi:

10.1093/bioinformatics/bti029

COMPARISON OF MEANS FOR TWO SAMPLES

156

Lin, P. E. (1973). Procedures for testing the difference of means with

incomplete data. Journal of the American Statistical Association, 68(343), 699-

703. doi: 10.1080/01621459.1973.10481407

Lin, P. E., & Strivers L. (1974). Difference of means with incomplete data.

Biometrika, 61(2), 325-334. doi: 10.1093/biomet/61.2.325

Looney, S., & Jones, P. (2003). A method for comparing two normal means

using combined samples of correlated and uncorrelated data. Statistics in

Medicine, 22, 1601-1610. doi: 10.1002/sim.1514

Martínez-Camblor, P., Corral, N., & María de la Hera, J. (2013). Hypothesis

test for paired samples in the presence of missing data. Journal of Applied

Statistics, 40(1), 76-87. doi: 10.1080/02664763.2012.734795

Mehrotra, D. (2004). Letter to the editor, a method for comparing two

normal means using combined samples of correlated and uncorrelated data.

Statistics in Medicine, 23(7), 1179–1180. doi: 10.1002/sim.1693

R Core Team. R: A language and environment for statistical computing. R

Foundation for Statistical Computing, Vienna, Austria. www.R-project.org. 2014;

version 3.1.2.

Ruxton, G. (2006). The unequal variance t-test is an underused alternative to

Student's t-test and the Mann-Whitney U test. Behavioral Ecology, 17(4), 688.

doi: 10.1093/beheco/ark016

Goodnight, J. H. (1976). General linear models procedure. S.A.S. Institute.

Inc.

Samawi, H. M., & Vogel, R. (2011). Tests of homogeneity for partially

matched-pairs data. Statistical Methodology, 8(3), 304-313. doi:

10.1016/j.stamet.2011.01.002

Sawilowsky, S. S., & Blair, R. C. (1992). A more realistic look at the

robustness and type II error properties of the t-test to departures from population

normality. Psychological Bulletin, 111(2), 352. doi: 10.1037/0033-

2909.111.2.352

Sawilowsky, S. S., & Hillman, S. B. (1992). Power of the independent

samples t-test under a prevalent psychometric measure distribution, Journal of

Consulting and Clinical Psychology, 60(2), 240-243. doi: 10.1037/0022-

006X.60.2.240

Stouffer, S. A., Suchman, E. A., DeVinney, L. C., Star, S. A., & Williams Jr,

R. M. (1949). The American soldier: adjustment during army life (Studies in

DERRICK ET AL.

157

Social Psychology in World War II, Vol. I). Princeton, NJ: Princeton University

Press.

Zimmerman, D. W. (1997). A note on the interpretation of the paired

samples t-test. Journal of Educational and Behavioral Statistics, 22(3), 349 – 360.

doi: 10.3102/10769986022003349

Zimmerman, D. W., & Zumbo, B. D. (1993). Significance testing of

correlation using scores, ranks, and modified ranks. Educational and

Psychological Measurement, 53(4), 897-904. doi:

10.1177/0013164493053004003

Zimmerman, D. W., & Zumbo, B. D. (2009). Hazards in choosing between

pooled and separate-variances t tests. Psicológica: Revista de Metodología y

Psicología Experimental, 30(2), 371-390.

Zumbo, B. D. (2002). An adaptive inference strategy: The case of auditory

data. Journal of Modern Applied Statistical Methods, 1(1), 60-68. doi:

10.22237/jmasm/1020255000


Recommended