40
TESTING OF PAA AND SODIUM HYPOCHLORITE FOR WET WEATHER DISINFECTION Jason Beck, PE Brian Clark

TESTING OF PAA
AND SODIUM
HYPOCHLORITE
FOR WET
WEATHER
DISINFECTION
Jason Beck, PE
Brian Clark

• Barry Zerkle, Superintendent, City of Sidney
• Brian Clark, Assistant Superintendent, City of
Sidney
• Gregg Mitchell, Laboratory Chemist, City of
Sidney
• Jamie Gellner, Hazen and Sawyer
• Tony Farina, Hazen and Sawyer
Acknowledgements
Project Background
Presentation Overview
Bench Scale Testing
of PAA and Hypo
Results and Discussion
Full Scale Implications
LOG
(E. c
oli
)
C*T

Project background
Bench scale testing
of PAA and Hypo
Results and Discussion
Full Scale Implications
Presentation Overview

• Permitted capacity: 7 mgd
– Peak wet weather flows up to 36 mgd
• All flows must be disinfected prior to
discharge
• Current secondary effluent disinfection
method: chlorine gas
• UV selected for secondary effluent –
alternate disinfection needed for wet weather
• E. coli limits
– Weekly: 284 / 100 mL
– Monthly: 126 / 100 mL
• TRC: 0.038 mg/L
Plant / Project Overview
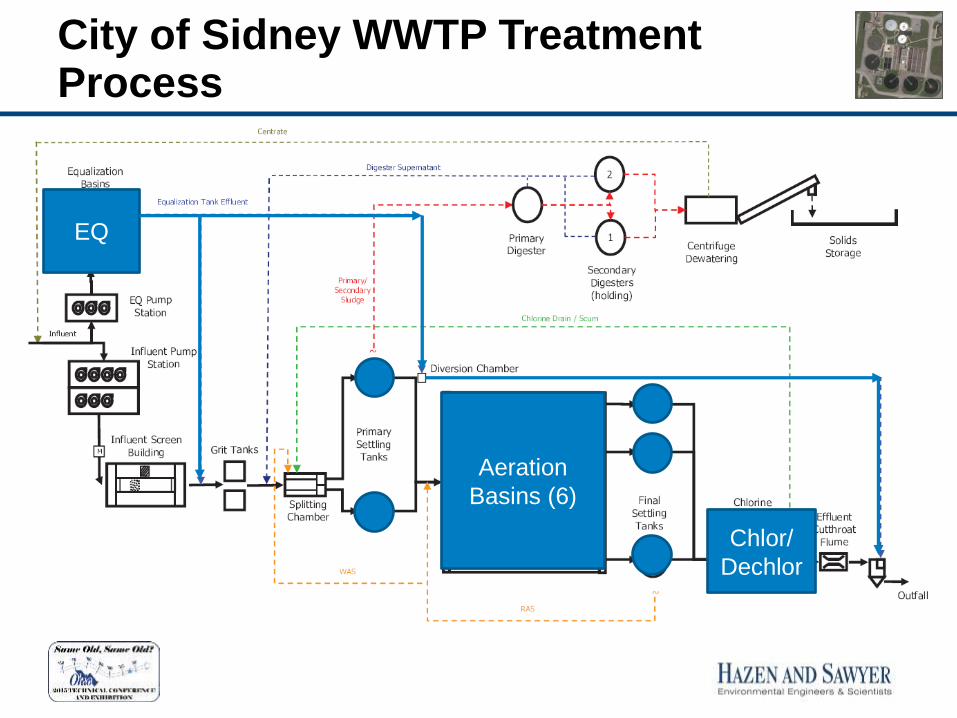
City of Sidney WWTP Treatment Process
EQ
Aeration
Basins (6)
Chlor/
Dechlor

• Sodium hypochlorite
– Long track record. Similar to chlorine disinfection
currently used for secondary effluent
• Peracetic acid (PAA)
– Relatively new to municipal disinfection
– Highly effective disinfectant
• On site hypo generation (OSG)
– Low concentration of hypo produced high storage
volume
– Intermittent use, long payback period
Disinfection Alternatives Considered
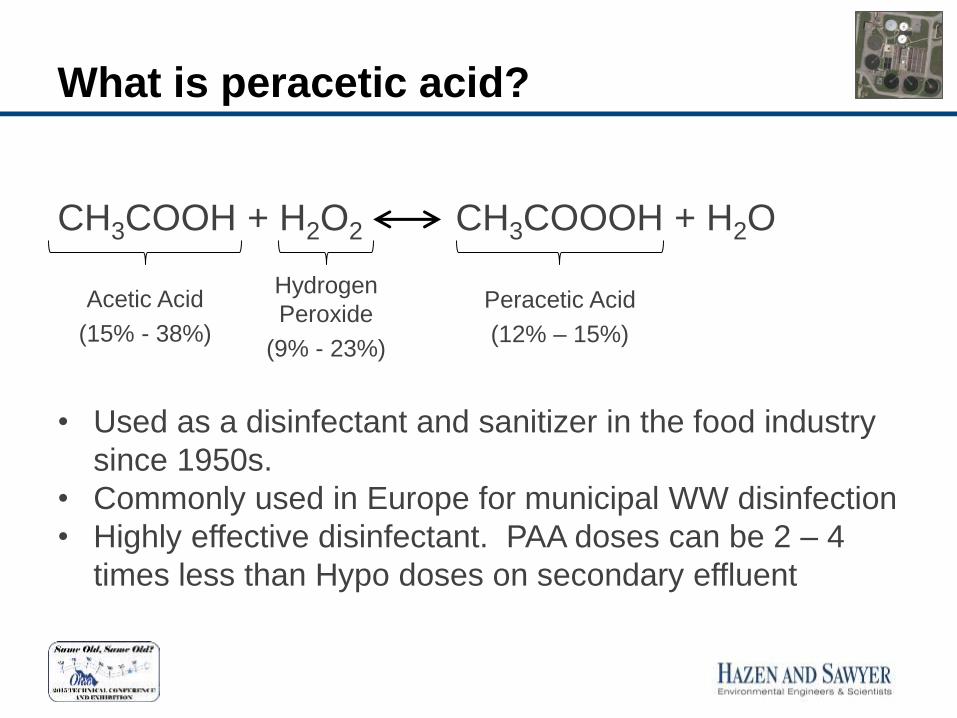
What is peracetic acid?
CH3COOH + H2O2 CH3COOOH + H2O
Acetic Acid
(15% - 38%)
Hydrogen
Peroxide
(9% - 23%)
Peracetic Acid
(12% – 15%)
• Used as a disinfectant and sanitizer in the food industry
since 1950s.
• Commonly used in Europe for municipal WW disinfection
• Highly effective disinfectant. PAA doses can be 2 – 4
times less than Hypo doses on secondary effluent

PAA Manufacturers and Chemical Information
Manufacturer Chemical PAA Hydrogen
Peroxide
Acetic
Acid
Solution
Density
PeroxyChem VigorOX WWTII 15% 9 – 11% 33 – 38% 9.42
lb/gal
Enviro Tech Bio Side HS 15% 22% 15 – 16%
Solvay Proxitane WW-12 12% 18.5% 15% 9.2 lb/gal
• Freezing point: - 50 to - 60 oF.

Case Studies – Other Locations and Design Doses
Location Application Dose Residual
Steubenville,
OH Secondary Effluent 1.5 mg/L 0.4 mg/L
Pittsburgh, PA
(ALCOSAN) Primary Effluent 5.5 – 6 mg/L
Detroit CSO 10 mg/L 6 – 8 mg/L
Louisville, KY
Primary Effluent 10 mg/L
Secondary Effluent 1.5 - 2 mg/L
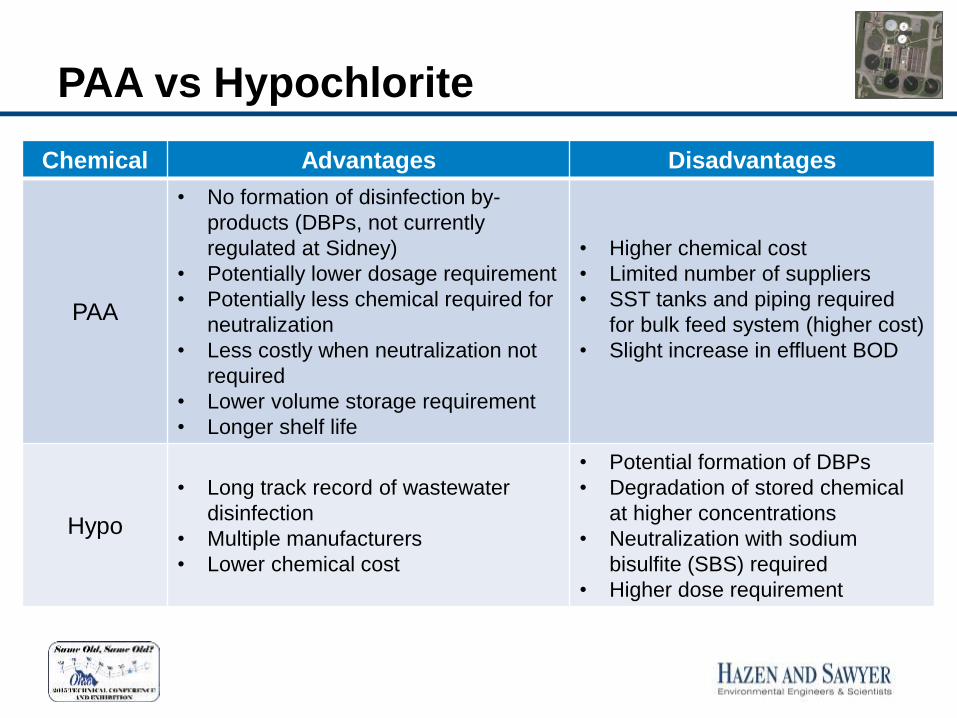
PAA vs Hypochlorite
Chemical Advantages Disadvantages
PAA
• No formation of disinfection by-
products (DBPs, not currently
regulated at Sidney)
• Potentially lower dosage requirement
• Potentially less chemical required for
neutralization
• Less costly when neutralization not
required
• Lower volume storage requirement
• Longer shelf life
• Higher chemical cost
• Limited number of suppliers
• SST tanks and piping required
for bulk feed system (higher cost)
• Slight increase in effluent BOD
Hypo
• Long track record of wastewater
disinfection
• Multiple manufacturers
• Lower chemical cost
• Potential formation of DBPs
• Degradation of stored chemical
at higher concentrations
• Neutralization with sodium
bisulfite (SBS) required
• Higher dose requirement

Project background
Presentation Overview
Bench scale testing
of PAA and Hypo
Results and Discussion
Full Scale Implications
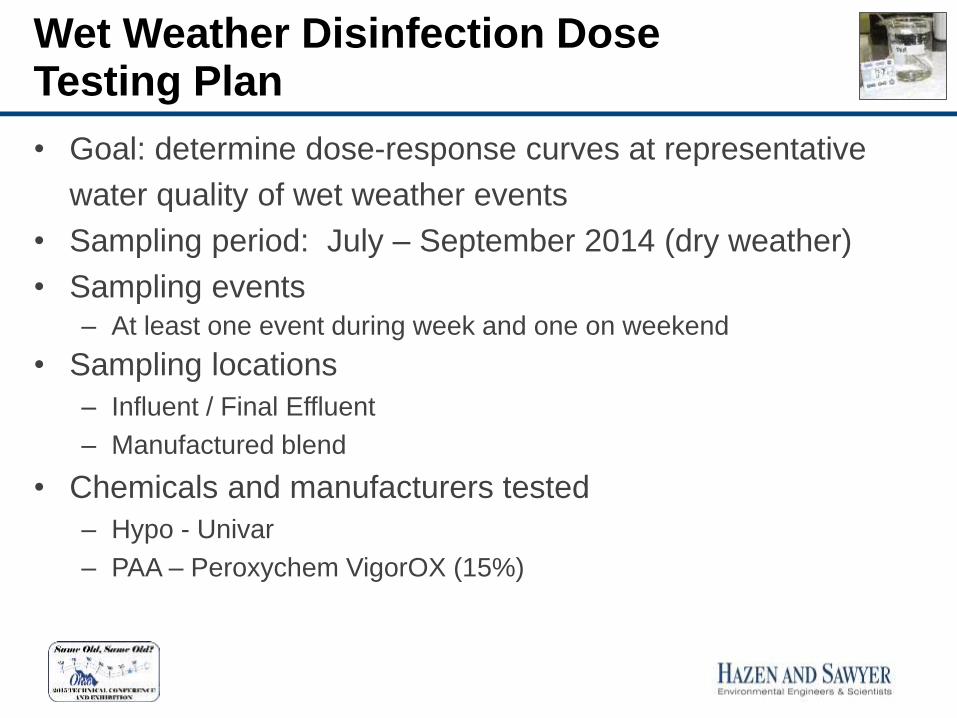
Wet Weather Disinfection Dose Testing Plan
• Goal: determine dose-response curves at representative
water quality of wet weather events
• Sampling period: July – September 2014 (dry weather)
• Sampling events – At least one event during week and one on weekend
• Sampling locations
– Influent / Final Effluent
– Manufactured blend
• Chemicals and manufacturers tested
– Hypo - Univar
– PAA – Peroxychem VigorOX (15%)
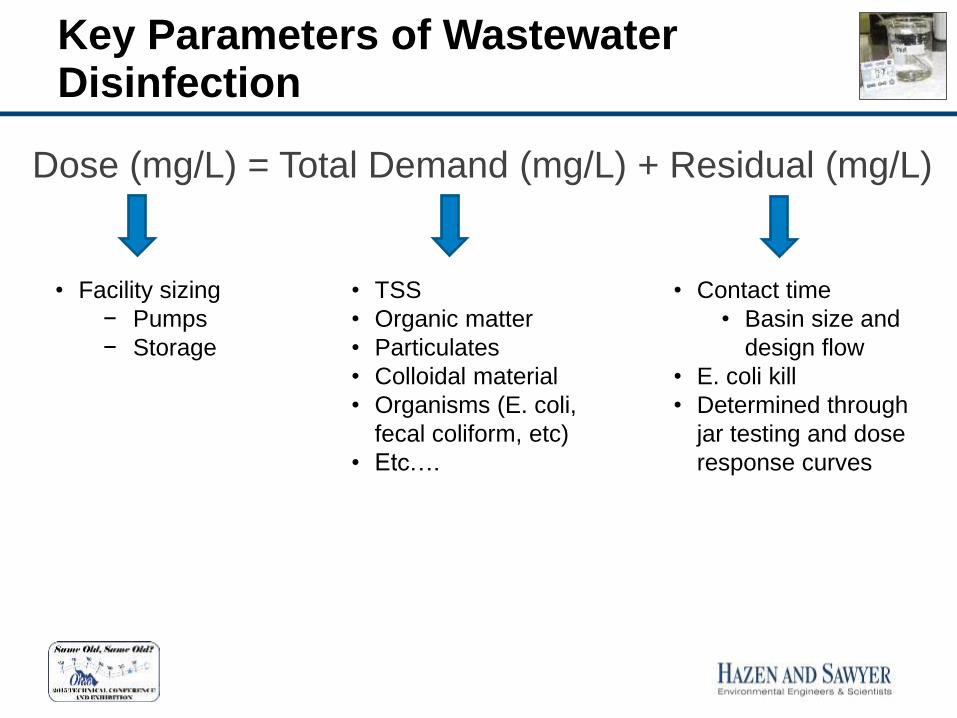
Dose (mg/L) = Total Demand (mg/L) + Residual (mg/L)
Key Parameters of Wastewater Disinfection
• TSS
• Organic matter
• Particulates
• Colloidal material
• Organisms (E. coli,
fecal coliform, etc)
• Etc….
• Contact time
• Basin size and
design flow
• E. coli kill
• Determined through
jar testing and dose
response curves
• Facility sizing
− Pumps
− Storage
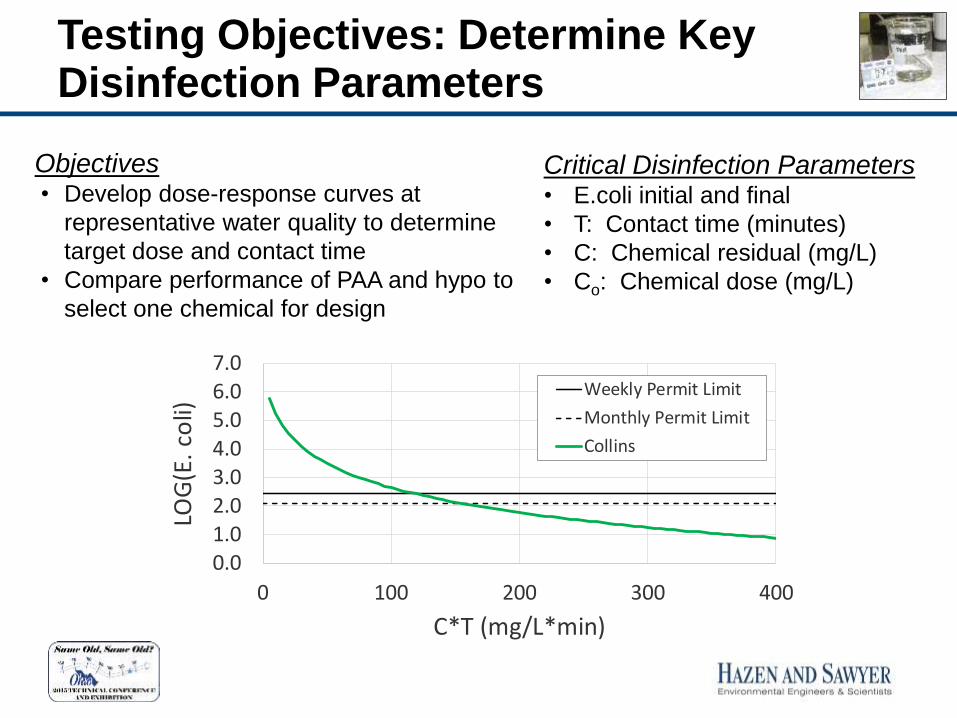
Testing Objectives: Determine Key Disinfection Parameters
0.01.02.03.04.05.06.07.0
0 100 200 300 400
LOG
(E.
coli)
C*T (mg/L*min)
Weekly Permit Limit
Monthly Permit Limit
Collins
Critical Disinfection Parameters • E.coli initial and final
• T: Contact time (minutes)
• C: Chemical residual (mg/L)
• Co: Chemical dose (mg/L)
Objectives • Develop dose-response curves at
representative water quality to determine
target dose and contact time
• Compare performance of PAA and hypo to
select one chemical for design

Wet Weather Flow Characterization
0
10
20
30
40
50
60
70
80
TSS CBOD TKN
Co
nce
ntr
atio
n (m
g/L)
2014 Testing (25% INF, 75% SE) Average
2011 EQ Basin Overflow Sampling
Collection System and Process Modeling

Wet Weather Disinfection Testing
• City staff performed benchtop testing
– 7 testing events, each included PAA and hypo at multiple
doses and contact times
– Blend of 25% influent and 75% secondary effluent (based on
achieving TSS and CBOD5 concentrations similar to
anticipated wet weather concentrations)
Total Contact Time
20 30 60
Dose
5
7
10
15
20
- PAA (11)
- Hypo (12)

E. Coli Concentration in Wet Weather Flows
400,000 (Ave)
4,600,000
6,100,000
Manufactured Blend -
1,650,000 (Ave)
0.0
1.0
2.0
3.0
4.0
5.0
6.0
7.0
2011 2012 2013 2014 2015
E.C
oli
(#/1
00
mL)
Mill
ions

Dose-Response Testing Samples
• Analysis
– TSS, CBOD, TKN, alkalinity, pH, fecal coliform, E. coli, temp
– Total residual chlorine/PAA
• Contact time periods
– 5, 10, 15, 20, 30, 60 min
• Hypo, PAA doses
– 5, 7, 10, 15, 20 mg/L (also 0 mg/L control)

• Simulated wet weather samples dosed with PAA / hypo
and stirred initially to simulate rapid mixing
• Samples were not continuously mixed during remainder
of test to simulate a typical contact tank
Sampling procedures

• PAA and hypo residual: Total
Chlorine method (8167).
– PAA determined by applying PAA
factor (1.07 * equivalent CL2 dose)
Sampling Procedures (cont’d)
• E.coli sample incubation: Model
251 incubator bath
– Incubation temperature: 35 deg C
– Duration: 18 – 22 hours
• E. coli sample measurement:
– IDEXX Colilert-18
• Samples were collected and
analyzed for E.coli and
disinfectant residual

Project background
Presentation Overview
Bench scale testing
of PAA and Hypo
Results and Discussion
Full Scale Implications
LOG
(E. c
oli
)
C*T

Test Results – Measured Residual
LOG
(E. c
oli
)
C*T
0
2
4
6
8
10
12
14
16
18
20
0 5 10 15 20 25 30
Res
idu
al (m
g/L)
Contact Time (min)
Dose Response - Residual
5 mg/L 7 mg/L 10 mg/L 15 mg/L
Initial rapid demand ~ 5 mg/L
Slow demand period

Determination of Design C*T
0.0
1.0
2.0
3.0
4.0
5.0
6.0
7.0
0 100 200 300 400
LOG
(E.
coli)
C*T (mg/L*min)
PAA
Hypo
Weekly Permit Limit
Monthly Permit Limit
Collins-Selleck (max Yo)
LOG
(E. c
oli
)
C*T
Design C*T = 150 mg/L*min
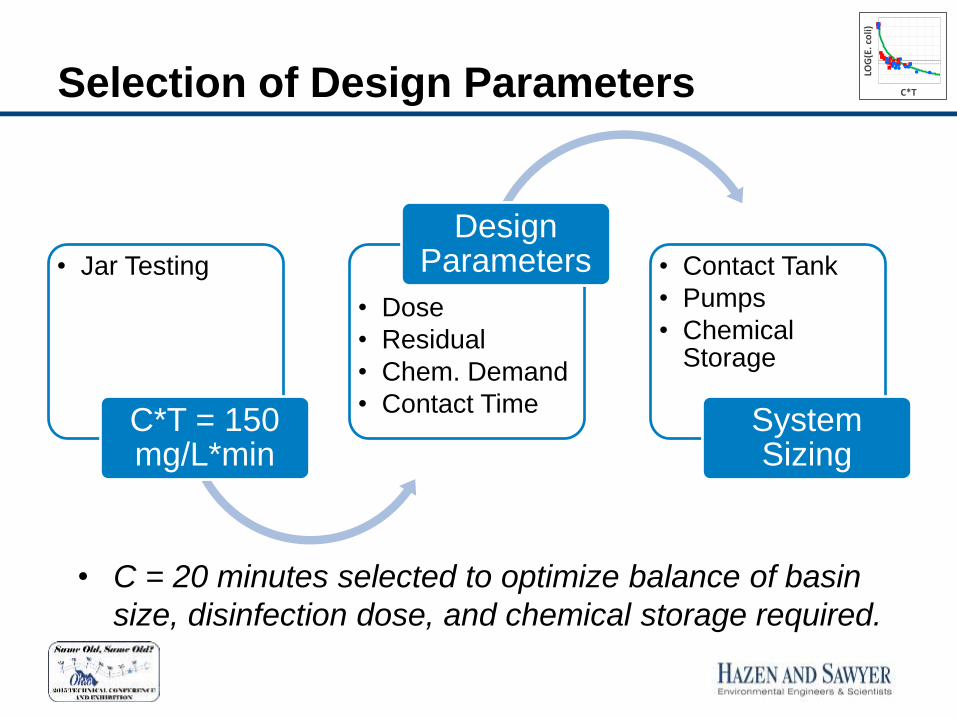
Selection of Design Parameters
• Jar Testing
C*T = 150 mg/L*min
• Dose
• Residual
• Chem. Demand
• Contact Time
Design Parameters • Contact Tank
• Pumps
• Chemical Storage
System Sizing
• C = 20 minutes selected to optimize balance of basin
size, disinfection dose, and chemical storage required.
LOG
(E. c
oli
)
C*T

Estimation of Chemical Demand at T = 20 minutes LO
G(E
. co
li)
C*T
0
2
4
6
8
10
12
14
0 5 10 15 20 25
Tota
l Dem
and
(mg/
L)
Initial Dose (mg/L)
PAA
Hypo
Average total
demand = 7.5 mg/L

Total Demand (mg/L) + Residual (mg/L) = Dose (mg/L)
Design Dose
7.5 mg/L based
on design C*T =
150 mg/L*min
15 mg/L 7.5 mg/L at C
= 20 minutes
• Design dose was the same for PAA and hypo based on
jar testing results
LOG
(E. c
oli
)
C*T

• Current NPDES Total Residual Chlorine Limit:
0.038 mg/L
• Expected residual limit if PAA selected
• Neutralization with sodium bisulfite (SBS)
assumed to be required for both chemicals
Neutralization
LOG
(E. c
oli
)
C*T
SBS Dose = 1.5*(Hypo/PAA) residual

Disinfection Design Criteria – Dose / Contact Time
Parameter PAA Hypo
Peak Flow (MGD) 22.5 22.5
Peak Volume per Event (MG) 18 18
Target C*T (mg/L*min) 150 150
Contact Time (min) 20 20
Contact Basin Volume (Gal) 315,000 315,000
Target Residual (mg/L) 7.5 7.5
Estimated Demand (mg/L) 7.5 7.5
Design Dose (mg/L) 15 15
SBS Required? Yes Yes
SBS Dose (mg/L) 12 12
1. Peak flow based on maximum influent pumping capacity of 36 MGD and secondary
treatment maximum hydraulic capacity of 13.5 MGD.
2. Estimated demand observed during testing for similar feed dose and contact time. Actual
demand will vary depending on feed dose and other variables.
LOG
(E. c
oli
)
C*T
Project background
Presentation Overview
Bench scale testing
of PAA and Hypo
Results and Discussion
Full Scale Implications

PAA vs Hypo
PAA Hypo
Strength Available 12% or 15% 5% - 12.5%
Anticipated feed dose (mg/L) 15 15
Shelf life (per manufacturer) 6-12 months 3-6 months (5%)
Neutralization required? Yes Yes
Availability Limited number of suppliers
(2, possibly more) Widely available
Disinfection byproducts Does not form Can form trace
amounts
Impact on other parameters Increases BOD, decreases pH Increases pH
Storage options Totes or SST tank (totes
replaced after a few months) Totes or Plastic
Tank Piping materials of construction
SST PVC, PE

Chemical Costs – PAA vs Hypo
PAA Hypo
Cost per gallon $7.41 (12%) $1.12 (8%)
Cost per pound of active
chemical ($/lb) $6.67 $1.67
Cost for one storm event $15,200 (12%) $3,160 (8%)
Average volume per year
(gal) 4,700 6,500
Average cost per year1 $35,700 $7,300
Average cost of SBS per
year1 $2,600 $2,600
1) Assumes no chemical is wasted and no degradation occurs. SBS
dose based on target disinfectant concentration of 7.5 mg/L at end of
contact zone; cost is based on $1.89/gallon, and 25% strength.
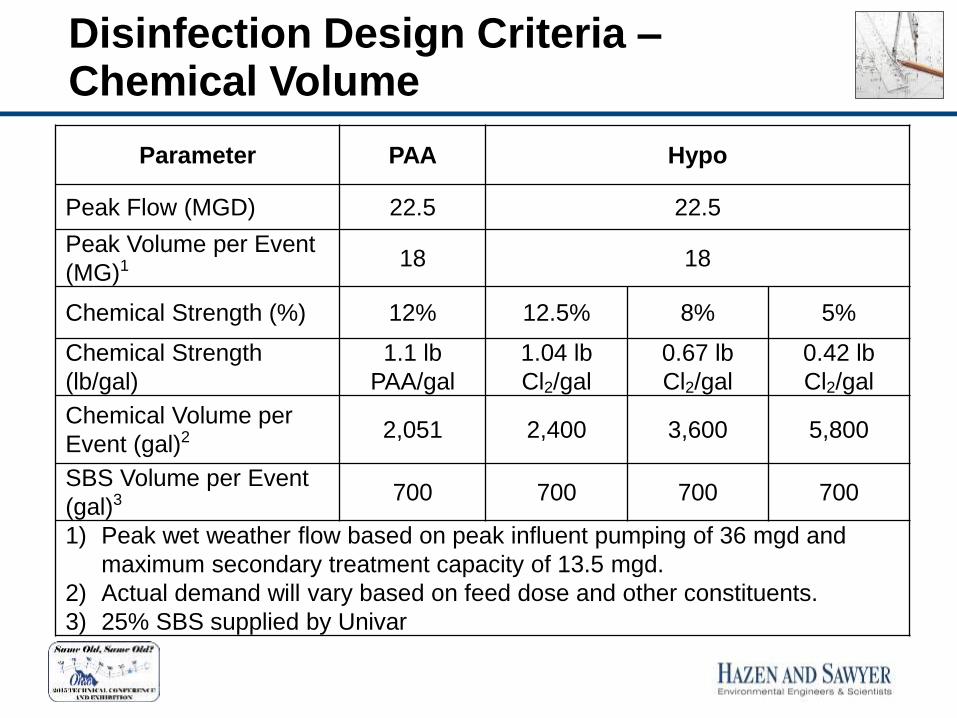
Disinfection Design Criteria – Chemical Volume
Parameter PAA Hypo
Peak Flow (MGD) 22.5 22.5
Peak Volume per Event
(MG)1 18 18
Chemical Strength (%) 12% 12.5% 8% 5%
Chemical Strength
(lb/gal)
1.1 lb
PAA/gal
1.04 lb
Cl2/gal
0.67 lb
Cl2/gal
0.42 lb
Cl2/gal
Chemical Volume per
Event (gal)2 2,051 2,400 3,600 5,800
SBS Volume per Event
(gal)3 700 700 700 700
1) Peak wet weather flow based on peak influent pumping of 36 mgd and
maximum secondary treatment capacity of 13.5 mgd.
2) Actual demand will vary based on feed dose and other constituents.
3) 25% SBS supplied by Univar

• Hypo degraded from 12% to 8% during testing (~6 weeks)
• Similar results observed during a study in Detroit
Hypo Degradation
4
5
6
7
8
9
10
11
12
0
20
40
60
80
100
120
140
160
180
200
Na
OC
l C
on
c. (
Tra
de
%)
Elapsed Time (Days)
11.0% 8.0% 5.65%
Ave. span between events =
95 days (2003 – 2013)
Maximum span > 200 days between bypass events

Chemical Selected for Final Design
• 5% Hypo selected based on preliminary
cost evaluation
– High annual cost for PAA vs. Hypo
– Neutralization required for both chemicals
– Higher cost materials of construction

Wet Weather Disinfection Facilities
• Contact Zone
– Volume: 312,500 gal @ 20 min
– Inside or adjacent to EQ Basins
• Chemical Feed Building
– Hypo storage (tank) and feed pumps
– SBS storage (totes) and feed pumps
– Concrete foundation, pre-engineered metal building
– Chemical piping: tube inside PVC carrier pipe,
slope to allow draining
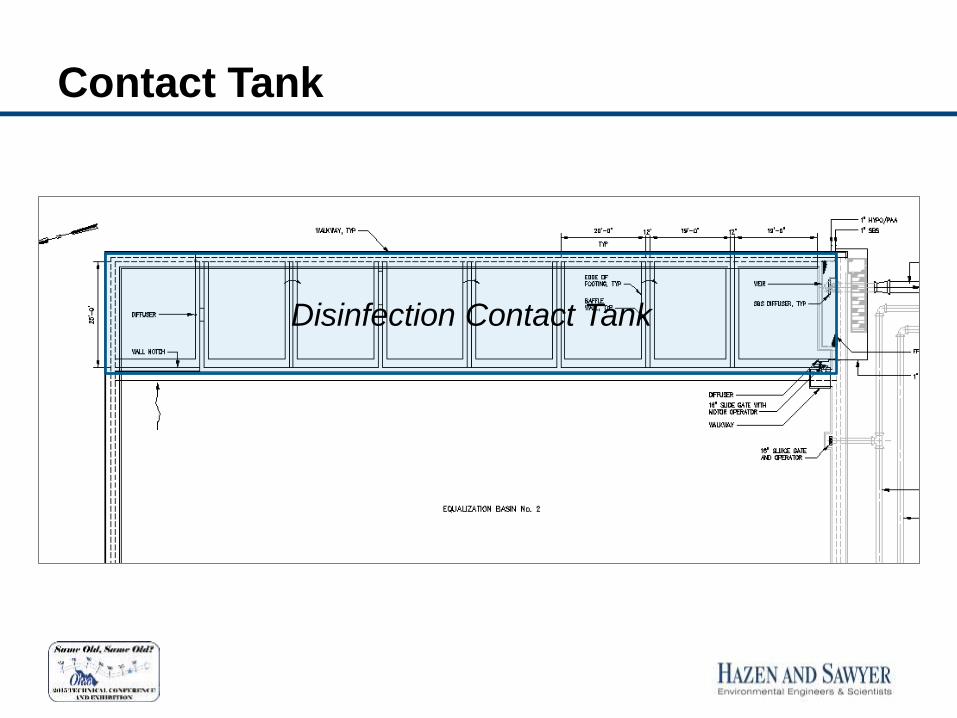
Contact Tank
Disinfection Contact Tank
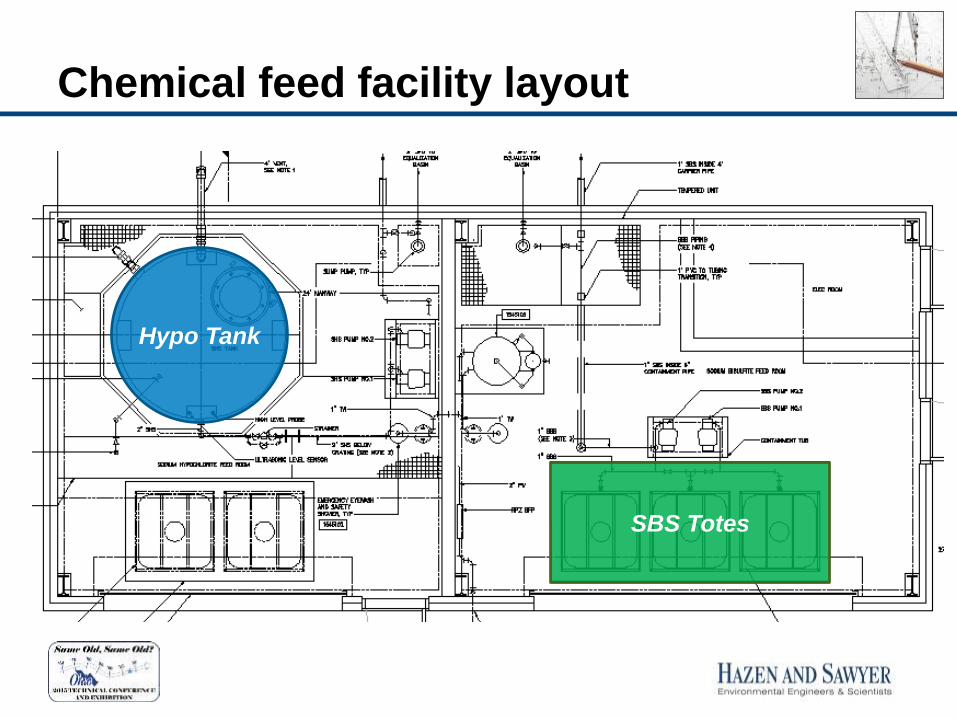
Chemical feed facility layout
Hypo Tank
SBS Totes

• Both PAA and hypo were found to be effective
disinfectants for wet weather flows.
• Similar dosages were required for both PAA and
hypo to achieve equivalent E.coli kills for wet
weather flows.
– Based on anticipated doses and residuals, both PAA and
hypo would require neutralization
– Hypo selected for full scale implementation based on
costs
• Initial demand and residual for both was high –
likely due to wet weather primary effluent quality
Summary
Questions?
Jason Beck: 513-469-5110
Brian Clark: 937-498-8726


