Reference No. 652.300-1 August 2014 Testing Poultry Litter Biochar as a Soil Amendment for Annual Ornamental Crops: Effects on Fertilizer Need and Potential for Drought Protection for Bedding Plants Prepared for: British Columbia Ministry of Agriculture Prepared by: Institute for Sustainable Horticulture Kwantlen Polytechnic University 12666 – 72th Ave Surrey BC, V3W 2M8 April 2014
Transcript
Reference No. 652.300-1 August 2014
Testing Poultry Litter Biochar as a Soil Amendment for Annual Ornamental Crops: Effects on Fertilizer Need and
Potential for Drought Protection for Bedding Plants
Prepared for: British Columbia Ministry of Agriculture
Prepared by: Institute for Sustainable Horticulture
Kwantlen Polytechnic University 12666 – 72th Ave
Surrey BC, V3W 2M8
April 2014
Page 2 of 21
Page 3 of 21
Acknowledgements This project was funded through Growing Forward 2, a federal-provincial-territorial initiative.
Disclaimers Opinions expressed in this document are those of the author and not necessarily those of Agriculture and Agri-Food Canada or the BC Ministry of Agriculture. The Government of Canada, the BC Ministry of Agriculture or its directors, agents, employees, or contractors will not be liable for any claims, damages, or losses of any kind whatsoever arising out of the use of, or reliance upon, this information.
Trial Site: Institute for Sustainable Horticulture Research Greenhouse 20902 Langley Bypass, Langley BC, V3 8G9 Director: Deborah Henderson Research Trial Coordinator: Andres Torres
Page 4 of 21
Page 5 of 21
EXECUTIVE SUMMARY A range of concentrations of poultry litter biochar (0 – 25%) were used in bedding plant media with and without fertilizer to determine effects on germination and growth of two flowering annuals, Snapdragon and Angelonia. At 5 to 10% of the total media volume, poultry litter biochar had positive effects on plant growth. At this level, it provided a reasonable nutrient supply of potassium and phosphorus. The volume, pH and electro conductivity were also supportive of plant growth. Leaf chlorophyll levels were highest in plants with the 5-10% rates. The recommended rate of addition of this biochar to bedding plant media is therefore 5-10% by volume. In its chemical characteristics, this poultry litter biochar like most others, was very strongly alkaline with a pH of 10.5, which is high enough to limit growth and plant performance if used at high rates. The greatest contributors to the pH value were bicarbonates (HCO3
-) and sulphates (SO4-). Salinity (EC) was high and was
measured at 10 mS/cm or higher. Soluble potassium was the greatest contributor to salinity. Sodium was also high, indicating that it was not properly balanced by calcium and magnesium. Boron was elevated at 1.47 ppm which on its own could cause tip and edge burning on the foliage of a broad range of plants. Chloride was high as well which can reduce plant growth and yield by direct toxicity. Poultry litter biochar had reasonable phosphorus content, however just a few plant species would be expected to become established at this salinity level. The same elemental nutrient trends were also found in the drain water collected. Our results reflected these limitations, in that higher poultry litter biochar rates were indeed detrimental to plant performance, and were reflected as reduced chlorophyll content and overall smaller plant canopy and lower growth. Water retention increased with the concentration of the biochar in the media, with the peak at 25%. This was presumed to be due to two factors; the physical properties of biochar in general and specifically the small particle size of this biochar. Particle size of this biochar was rated as fine; 97.9% of the material by dry weight passed through the 12.7 mm (½ inch) screen, and a full 20.1% passed through a 0.5 mm screen. Small particle size biochar, while making it dusty to work with especially at the higher rates, generally increases media water retention over larger particle size biochar. This is a valuable characteristic for production of bedding plants for nursery sales since the young plant roots are in very small media volumes and can quickly dry out at the retail sale point if weather is warm and sunny and watering is sporadic. Germination rates of Snapdragon and Angelonia seeds were not affected by different poultry litter biochar rates, likely because water was not limited in the germination trial as our goal was to test simple germination. Future trials will investigate this potential since our water retention results from the bedding plants showed promising water retention rates with increasing rates of biochar. OBJECTIVES
• To investigate the benefits and disadvantages of using poultry litter biochar as an amendment for annual ornamental crops in greenhouse potted production.
• To determine the potential uses of poultry litter biochar for the greenhouse industry in BC in terms of its effects on fertilizer need and drought protection for bedding plants.
Page 6 of 21
BACKGROUND Biochar is the carbon-rich product obtained when biomass, such as wood, manure or leaves, is heated in a closed container in the absence of air. In more technical terms, biochar is produced by thermal decomposition of organic material under a limited supply of oxygen (O2) and relatively low temperatures (< 700°C). Biochar is produced with the intent to be applied to the soil and to improve soil productivity, carbon storage, or filtration of soil water. Biochar is applied in settings outside agriculture, for purposes such as promoting soil remediation or other environmental services. The term emphasizes its biological origin, distinguishing it from charred plastics or other non-biological materials. ‘Char’ is a term that is often used interchangeably with charcoal, but it sometimes is applied to refer to a material that is charred to a lesser extent than charcoal, typically as a product of fire (Lehmann and Joseph, 2009). It is important to note that carbonization conditions such as temperature and time have an impact on the chemical and physical properties of the resultant biochar including: yield of biochar, fixed carbon content and ash content. If the temperature is changed from 300 to 800°C, biochar yield can be decreased from 66.5 to 25.6%, and fixed carbon can be increased from 55.8 to 93.5%. Ash in biochar affects the chemical properties as well. It can be increased from 0.67 to 1.26% when the carbonization temperature increases from 300 to 800° C. Subsequently, the proportion of ash directly influences the pH value, for example, from 7.6 at 310°C to 9.7 at 850°C. The porous structure of biochar is intimately related to its water holding capacity, gas adsorption, and liquid adsorption capacities, all of which are dependent on the surface area and the volume of minute pores (Ogawa et al., 2006). Some of the biochar impacts and applications found in the literature are: Biochar’s impact of plant health:
• Improves plant immunity and resistance to foliar fungi such as Botrytis and Mildews (Graber et al., 2010).
• Inhibits algae growth and colonization of new areas (Anderson et al., 2011). • Increases plant yield or productivity (from 30 up to 40%) and encourages the overall healthy growth of
plants (Carter et al., 2013; Graber et al., 2010). • Improves plant productivity directly as a result of nutrient content and release and indirectly, via
improved retention of nutrients (Graber et al., 2010). • Helps promote and sustain populations of beneficial microbial species because the porous structure of
the biochar provide physical refuge (Graber et al., 2010). • Improves the efficiency of nutrient uptake by plants or synergism (i.e. plant-mycorrhizal fungus
mutualism mechanism) (Chase et al., 2013; Laird et al., 2010). Biochar’s impact on soil:
• Improves fertility: increased Cation Exchange Capacity (CEC) and Electrical Conductivity (EC) (Dumroese et al., 2011).
• Acts as a liming agent, raising the pH of acidic soil; however, due to its longevity in the soil, it also acts as a long-term buffer against future changes in pH (Chan et al., 2008; Warnock et al., 2007).
• Adds Water-Holding Capacity of media, yet also improves drainage and aeration (Brockhoff et al., 2010; Carter et al., 2013; Ogawa and Okimon, 2010).
• Decreases N and P leaching from media, and also provides micronutrients (Brockhoff et al., 2010). • Replenishes the rapid depletion of soil carbon sustainably and organically (Lehmann and Joseph, 2009). • Buffers toxicity from harmful pesticides, heavy metals, allelopathic compounds and deodorizes excreta
(Ogawa et al., 2006).
Page 7 of 21
Biochar’s applications: • Media amendment with an extremely slow decomposition rate and excellent dispersal • Amendment for highly acidic or heavily nutrient-leached soils • Forestry, turf-grass and landscape applications for stressed or diseased plants • Bioremediation and restoration of damaged ecosystems • Decreased chemical N-P-K fertilizer use in modern agriculture • Compost activator and able to mix up to a 1:1 ratio (by volume) with compost materials • Carbon sequestration agent (reduces greenhouse gases, as well as soil emissions of N2O, CH4 • Replacement of perlite and vermiculite for the horticultural industry • Potential as a green-roof substrate (due to its longevity and nutrient retention ability) (Beck et al., 2011) • Re-useable water filtration agent (as old or used biochar undergoes pyrolysis again to achieve sterility) • Biochar ratios > 50% may be less desirable because of high C: N, high bulk density (Dumroese et al.,
2011) • Biochar best effects were found when added in to soils and soilless media from 3 to 5% (Carter et al.,
2013; Graber et al., 2010) MATERIALS and METHODS The experiment was conducted at the Kwantlen Polytechnic University Institute for Sustainable Horticulture’s research greenhouse. The greenhouse is a Venlo type located at 49°6’38” N and 122°38’36” W Langley BC. The greenhouse environment is controlled by Argus Titan Environment Control System (Argus Controls Systems, White Rock, British Columbia). The experiment was carried out in compartment 4. The compartment is 16 x 7.8 m or 125 m2 with a 6 m gutter height. The greenhouse environment was set for 18-20°C days and 16-18°C nights with a 12 hour photoperiod. The plants were light supplemented with high pressure sodium lamps for 14 hours during and after seeding. The plants were grown in 4” pots, one plant per pot; and set up in long hydroponic trays with 10 pots per tray. The study endeavoured to replicate the most common climatic greenhouse growing conditions in BC. The scope of the trial was to study the plant response to biochar as part of the media for greenhouse potted production. A small amount of biochar was produced from 100 % broiler litter by Langara College in a small scale pyrolysis unit. Two batches were produced, approximately 10 liters each. The first batch, received December 4, was used for the Snapdragon crop and second batch, received on December 30, was used for the Angelonia crop. The moisture content of the broiler litter feed stock when received was 23.5%, while moisture content after oven drying was <1%. Highest heating temperature of the pyrolysis unit was 500°C, while active heating time was 2.5 hours. The average yield of biochar from dried feed stock was 36.3%. In this study, the amount of biochar received was the limiting factor to set up the different treatments ratios and number of replicates and size of crops. For that reason, the % of biochar in treatments was adjusted from the original proposal (T16, T17, T18) from 40 % to 25% biochar. This allowed us to complete a meaningful trial using less biochar. Biochar is not generally used at 40% so this was the best treatment to change. Originally we proposed a 40% treatment to demonstrate the effects of too much biochar. The crops Snapdragon and Angelonia annual crops were used in this trial. The seedlings were started in our facility. All the treatments were applied to seedlings as well as to the pots. Slow release fertilizer (SRF) Scott 14- 14-14 was used as part of the treatments at an intermediate rate of 5 grams per liter (manufacturer’s labeled recommendation). A 288 cell germination tray was used for seedlings. Media was blended individually for each treatment. Each tray was divided into three sections or replicates and 24 seeds were used per replicate. Eighteen
Page 8 of 21
treatments per crop were planted into each media blend. All the trays were placed in 14 m long adjacent rows. The trays were irrigated with a misting system above the row, with water volume based on light accumulation automatically calculated by the Argus control System. Snapdragon and Angelonia annual crops were planted on January 3 and January 20 respectively. One seed per cell was planted with 72 seeds per treatment. Snapdragon and Angelonia were transplanted into 4” pots, one plant per pot, on February 13 and March 3 respectively. Irrigation A 2 litre water emitter was installed in each pot. The pots were irrigated overnight before transplanting. Five 4” pots were used for each treatment. One moisture sensor GS #3 type (capable of reading temperature (°C), electrical conductivity (EC) and volumetric water content (VWC %)) was installed in one pot of each of the following treatments which were representative of the experiment; T2, T5, T8, T11, T14 and T17. The purpose of these sensors was to track media behavior and trends during the experiment. The irrigation system was set up to water the pots every time that the moisture sensor reached 14% of volumetric water content in treatment T5. The irrigation pulse time was 30 seconds with 24 ml per pulse on average. Pest management in the experimental greenhouse compartment An Integrated Pest Management Program (IPM) was implemented for the two crops. A weekly monitoring schedule was developed and biological control agents were introduced on a weekly basis. Among the main pest were thrips, fungus gnats, and leaf hopper. Ornamental pepper plants (var. purple flash and black pearl) were used as banker plants to maintain a population of Orius insidiosus to assist in management of thrips; a Dicyphus banker plant (Mullein plant) was used for white fly and fungus gnat management. Encarsia formosa cards (Biobest Ltd) were used as well for white fly control. No disease established during this experiment. Data collection For this study the following parameters were measured: Biochar
• Physical properties Biochar physical properties such as bulk density, water retention, air space, readily available water and percolation rate were analyzed.
• Chemical properties Macro and microelement nutrient content, pH and EC were evaluated for the two biochar batches received. To determine trends and fluctuations, a chemical analysis was also performed on each treatment applied.
Water and Nutrients • Drain Nutrient Lab Analysis
A full nutrient analysis of drain water was analyzed once during snapdragon growing.
• Drain water EC and pH The drain water was collected for regular in-house EC and pH measurements for both Snapdragon and Angelonia crops. These values were compared with the lab analysis results.
Page 9 of 21
• City Water analysis
To quantify the water nutrient content in irrigation water (city of Langley), a sample was sent for lab analysis as well.
• Volumetric Water Content and Media electrical conductivity
One GS3 moisture sensor (Decagon Devices Pullman, Washington USA) was installed in a rotating pattern in the treatments to study volumetric water content (VWC) (%) and electrical conductivity (EC) (mS/cm) daily during this study.
• Water holding capacity (pot weight measurements) This parameter was measured weighing the pots before and after irrigation to determine differences in water holding capacity among treatments.
Plants • Germination
This parameter was evaluated by counting the number of emerged plants twice post seeding for Snapdragon (January 23 and 31, 2014).
Plants: after transplantation • Chlorophyll content and Leaf colour
Chlorosis is defined as the yellowing or whitening of normally green plant tissue. This is caused by the loss or decreased production of chlorophyll due to mineral deficiency or excess, lack of light or diseases; which, as a result, makes leaves appear pale. The most commonly used instrument for measuring color are spectrophotometers. The spectrophotometer (Konica Minolta CM 600d) measured leaf colour, quantifying lightness and the amount of green and yellow colour on the leaf surface of Snapdragon once on March 25, forty days post planting. Chlorophyll was measured using a Chlorophyll content meter (CCM 300 Opti-Science, Inc. USA) in the Snapdragon crop once on March 25, forty days post planting.
• Media analysis and nutrient content The media physical analyses and nutrient content were completed by Soil and Plant Laboratory, Inc. Anaheim, CA, USA. City water and drain water samples for analysis were sent to Relab den Haan Lab, the Netherlands.
• Plant development and canopy Weekly photographs were taken to record differences in plant growth and visual attractiveness. Plant growth, leaf size, number of flower buds and leaf size were monitor regularly. Data was analyzed using JMP-In Version 5.1 (SAS Institute, Chicago, IL). Means were compared using Tukey-Kramer HSD (P = 0.05).
Treatments Standard starter mix: peat moss + slow release fertilizer (SRF) These treatments were blended for both seedling and pot media as well.
RESULTS For a better understanding and indicating important results, some data are highlighted in red and blue in Tables. Physical Properties Results of poultry litter biochar physical property analyses are shown in Table 1. To compare and understand these physical properties, a column with coco coir values is also displayed. Biochar presented significantly higher bulk density, water retention (vol %), readily available water, and percolation rate compared with coco coir. Contrarily, coco coir presented significantly more air space (vol %) and water retention (% dry wet). Note that water retention (vol %) is how much space is taken up by water in the container on a volume basis; water retention by dry weight is how much water is held by weight compared to the dry weight of the growing media. The higher the volume or % dry weight, the more water a sample can hold to be available for plants. Too much water will not allow sufficient gas exchange. If a small amount of water is held, watering will need to be more frequent. Density, water retention (vol %) and air space data for poultry litter biochar at different centibars of pressure or suction test are also shown in Table 1. Appendix 1 shows poultry litter biochar particle sizes passing through different screen openings.
Water retention (vol %) 57.7 38.0 35.3 29.1 22.1 -
Air space (vol %) 20.1 51.0 42.4 48.6 55.6 77.7
Water retention % dry wet 215 546
Readily available water (vol %) 35.5 23.9
Percolation rate (in./hr) 393.4 >200
Saturated bulk density (lb/cu. ft) 65.2 59.9
TABLE 1 Poultry litter biochar physical properties bulk density, water retention (vol %), air space (vol %), water retention (% dry weight), readily available (vol %), percolation rate2 (Soil and Plant Lab, Inc.). Container capacity was determined using 6 inch column.
Page 11 of 21
Chemical Properties Table 2 shows the poultry litter biochar chemical properties and nutrient content. The pH and electrical conductivity in both biochar batches were above 7.0 and 4.0 mS/cm respectively. Chloride (Cl-), bicarbonate (HCO3
-) and sodium (Na+) also showed high values of 709, 421 and 83 ppm respectively. The analysis also revealed a significant amount of phosphorus (P), potassium (K+) and magnesium (Mg2+) in this poultry litter biochar.
Batch pH EC mS/cm
ppm
NO3 Cl SO4 HCO3 P NH4 K Na Ca Mg Si Fe Mn Zn B Cu Mo
TABLE 2 Biochar nutrient analysis report (two batches) in ppm. Media analysis by treatment revealed a significant effect of biochar rate on pH and EC (Table 3). Thus, pH significantly increased from 5.8 in treatment T3 (0% biochar + 0% SRF) to 8.0 in T18 (25% biochar + 0% SRF). The EC also increased from 1.2 to 2.8 mS/cm between the same treatments. These results of pH and EC by treatment are displayed in Figure 1. Media analysis reports also revealed a considerable increase in Chloride, Bicarbonate, and Sodium concentration with increasing biochar in the media. Thus, element concentration increased from 11 to 316, 12 to 104 and 9 to 64 ppm for chloride, bicarbonate and sodium respectively (Table 3; Figures 2 & 3). Table 3 also shows that with increasing biochar rate, there was a large increase in phosphorus and potassium concentration from 4 to 37 and from 51 to 626 ppm respectively. In Appendix 2, a guideline for heavy metals concentration is presented according with various sources. The heavy metal concentration test showed significantly high values for copper and zinc in this biochar.
TABLE 3 Media nutrient content analysis (Snapdragon) in ppm for treatments with biochar.
Figure 1 Media electrical conductivity (EC) mS/cm and pH by treatment for those treatments including biochar without added fertilizer.
Treatment Biochar pH EC mS/cm
ppm
NO3 Cl SO4 HCO3 P NH4 K Na Ca Mg Si Fe Mn Zn B Cu Mo
Biochar treatments: electrical conductivity and pH
pH EC
Page 12 of 21
Figure 2 Media chloride and potassium concentration by treatment without added fertilizer.
Figure 3 Media nutrient concentration by treatment; bicarbonates, phosphorus, and sodium for biochar treatment without added fertilizer.
City Water Analysis Since the experiment was irrigated with the City of Langley’s potable water, a water analysis was performed to determine if the water quality could influence the treatments applied. For example, if water has high bicarbonate concentration, it could affect the bicarbonate media concentration. Table 4 shows the pH, EC and nutrient concentration in city potable water during the experiment. We concluded that the City of Langley’s water did not have a significant effect on pH, EC or nutrient concentrations in the media.
City water
pH EC mS/cm
ppm
NO3 Cl SO4 HCO3 P NH4 K Na Ca Mg Si Fe Mn Zn B Cu Mo
Drain Water Analysis Tables 5 and 6 reveal the pH and EC drain water values by treatment. Both pH and EC were increased in response to increased levels of biochar in the treatments. Thus, pH changed from 6.6 to 8.2 and EC changed from 1.0 to 3.4 mS/cm between T2 (0% biochar + 50% SRF) and T17 (25% biochar + 50% SRF) for Snapdragon. The pH changed from 6.4 to 7.9, and EC changed from 1.4 to 4.0 (mS/cm) between T3 (0% biochar + 0% SRF) and T18 (25% biochar + 0% SRF) for the Angelonia crop. Drain water was collected after the 4th irrigation for Snapdragon and after the 1st for Angelonia. Because of this difference in sampling, a slightly higher EC value was found in Angelonia while a slightly higher pH value was measured for Snapdragon.
Treatment Snapdragon
EC mS/cm pH
T17 (25% biochar + 50% SRF) 3.4 a 8.2 a
T11 (15% biochar + 50% SRF) 2.8 ab 7.5 b
T14 (20% biochar + 50% SRF) 2.6 ab 7.9 ab
T8 (10% biochar + 50% SRF) 2.4 ab 7.0 c
T5 (5% biochar + 50% SRF) 1.8 bc 6.8 c
T2 (0% biochar + 50% SRF) 1.0 c 6.6 c
Table 5 Drain water EC and pH by treatment in Snapdragon (after 4th irrigation) Z.Z Values are given as a mean of five replications. Values with the same letter are not significantly different. Mean analyzed by Tukey-Kramer HSD standardized range test (p ≤ 0.05).
Treatments with 0% SRF Angelonia
EC mS/cm pH
T18 (25% biochar) 4.0 a 7.9 a
T15 (20% biochar) 4.1 a 7.7 a
T12 (15% biochar) 3.4 a 7.3 b
T9 (10% biochar) 3.5 a 6.9 b
T6 (5% biochar) 3.4 a 6.4 c
T3 (0% biochar) 1.4 b 6.4 c Table 6 Drain water EC and pH by treatment in Angelonia (after 1st irrigation) Z.Z Values are given as a mean of five replications. Values with the same letter are not significantly different. Means analyzed by Tukey-Kramer HSD standardized range test (p ≤ 0.05).
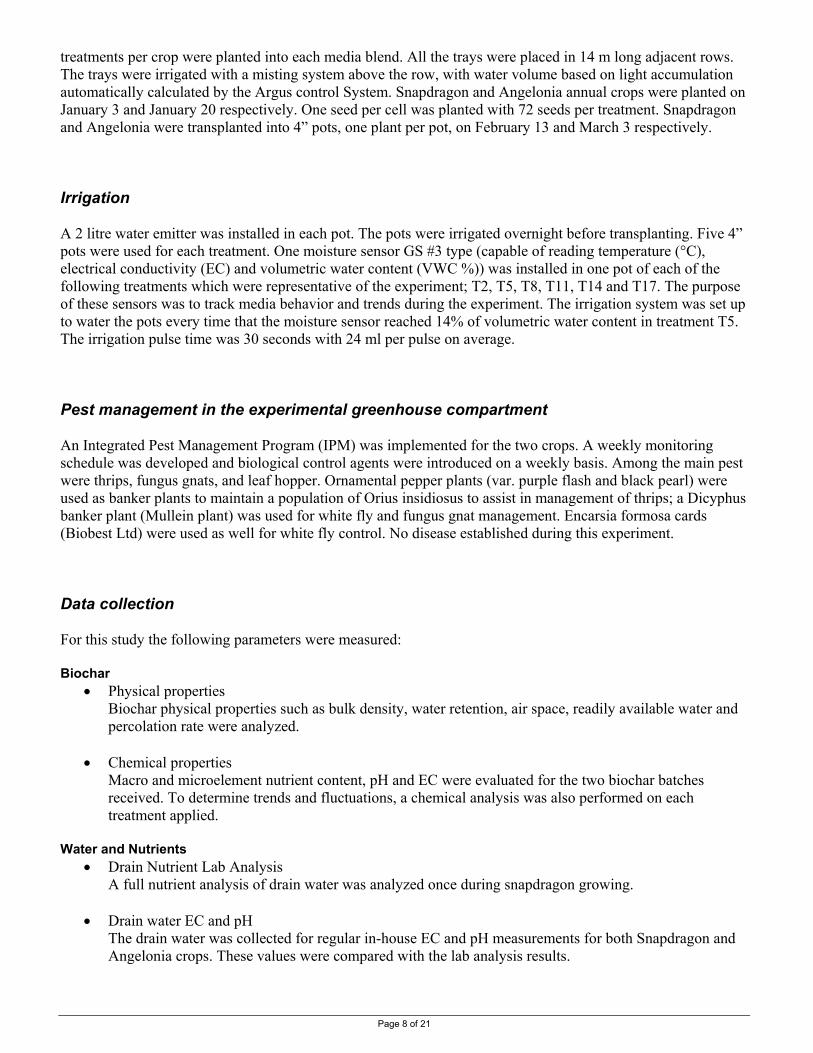
A complete drain water nutrient analysis was performed by treatment. Results in Table 7 demonstrate the direct effect of poultry litter biochar on pH, EC, chloride (Cl-), bicarbonate (HCO3
-), phosphorus (P), potassium (K+) and sodium (Na+) concentration. This water analysis was performed 73 days after planting (31 days after transplanting).
Page 14 of 21
Table 7 Drain water analysis by treatment, nutrient concentration by element in ppm.
To further investigate the effect of biochar in the media the Kwantlen School of Horticulture House mix (Appendix 3) was blended with 15 and 20% biochar. The three media samples were sent to the lab for analysis. These results are shown in Table 8. As expected, biochar proportion affected the pH, EC, chloride, sulphate, bicarbonate, phosphorus, potassium and sodium concentrations in the media (Table 8).
Table 8 School of Horticulture (SoH) House media mix blended with 15, 20% biochar analysis in ppm.
Germination Table 9 shows the number of germinated Snapdragon seeds by treatment; 21 and 28 days post planting. Data show no significant difference between treatments with different biochar rates during seedling. In this germination trial, water was not a limiting factor. Because of the small volume of biochar available for these trials, it was not possible to spare enough to conduct a desiccation stress trial, therefore this will be studied for germinating seedlings in a future trial.
Table 9 Snapdragon seed germination number by treatment days after planting (DAP) Z n=24. Z Values are given as a mean of three replications. Values with the same letter are not significantly different. Mean analyzed by Tukey-Kramer HSD standardized range test (p ≤ 0.05).
Treatments with 50% SRF pH EC
mS/cm Ppm
NO3 Cl SO4 HCO3 P NH4 K Na Ca Mg Si Fe Mn Zn B Cu Mo
Figure 4 shows the electrical conductivity of biochar treatments over time. Treatment T2 with 0% biochar presented the lowest EC. In contrast, T17 with 25% biochar presented the highest EC value. Treatment differences were maintained throughout the growth of the bedding plants, even though there was a slow decrease in the media electrical conductivity over time.
Chlorophyll Content A significantly higher chlorophyll content was found in leaves with the lowest biochar rates 0, 5 and 10% with an average of 317 mg/m2 in treatments T1, T3, T6 and T9 respectively (Table 10). Leaf Colour and Chlorosis Each color has its own distinct appearance, based on three components: hue; chroma; and lightness. Hue is how we perceive an object’s color, for example red, blue, yellow, green. Chroma describes the vividness or dullness of a color. Lightness is the luminous intensity of a colour. The colour systems utilizes three coordinates to locate a colour in a colour space for instance, L*a*b*. The L* defines lightness, a* denotes the red/green value and b* the yellow/blue value. Snapdragon leaf colour showed significant differences among treatments within the three parameters evaluated (Table 10). Treatments with higher biochar rates presented with less green and more lightness and yellow. On the other hand, treatments with lower biochar rates had significantly less lightness and higher green colour, indicating better support of plant health.
T3 (0% biochar + 0% SRF) 314.3 ab 44.7 b - 8.5 b 20.9 b T6 (5% biochar + 0% SRF) 314.7 ab 47.9 b - 8.7 b 21.1 b T9 (10% biochar + 0% SRF) 323.3 ab 46.4 b - 9.6 a 22.7 b T12 (15% biochar + 0% SRF) 266.0 b 47.6 b - 9.7 a 24.8 b T15 (20% biochar + 0% SRF) 270.3 b 52.8 a - 9.7 a 30.9 a T18 (25% biochar + 0% SRF) 266.0 b 53.8 a - 9.0 ab 32.3 a T1 (0% biochar + 100% SRF) 386.3 a - - -
Table 10 Snapdragon leaf chlorophyll content by treatment, and spectrophotometer levels of lightness, red/green or yellow/blue colour Z.Z Values are given as a mean of five replications. Values with the same letter are not significantly different. Mean analyzed by Tukey-Kramer HSD standardized range test (p ≤ 0.05).
00.05
0.10.15
0.20.25
0.30.35
0.40.45
EC (m
S/cm
)
Overtime
Media Electrical Conductivity
T5 T2 T8 T11 T14 T17
Page 16 of 21
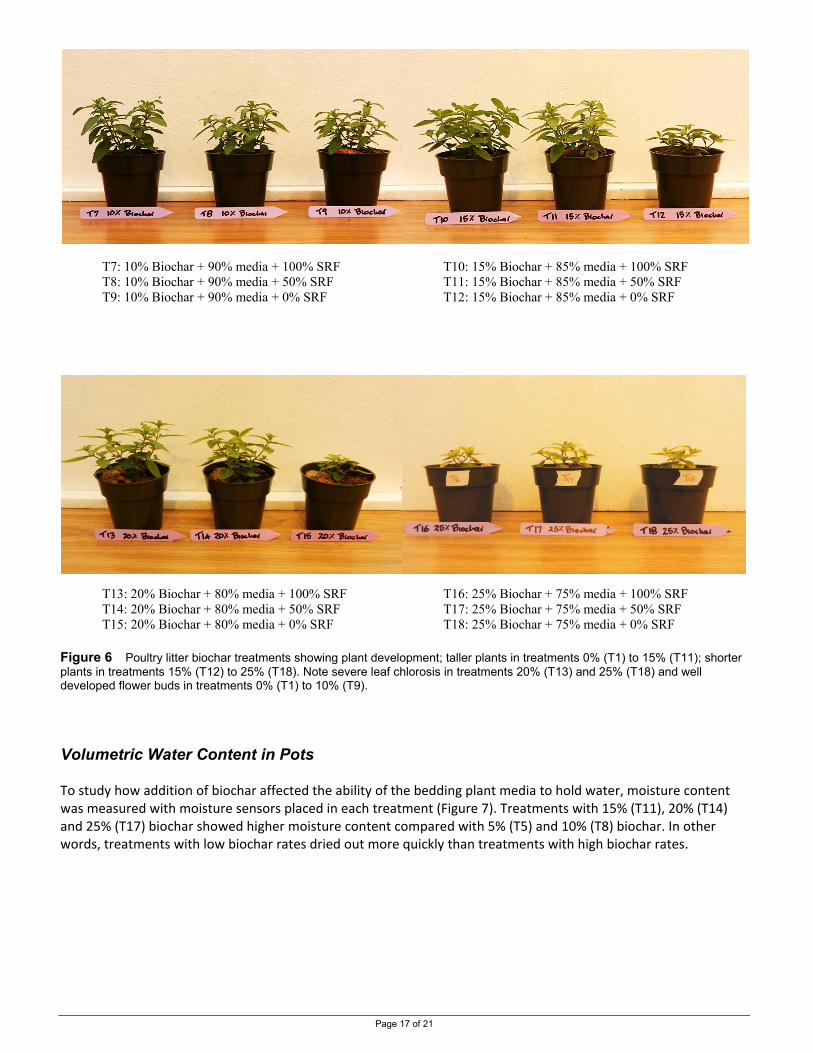
Treatments with 0% (T1), to 15% (T11) biochar showed more flower development compared with 20% (T15) to 25% (T18) (Appendix 4). This result was predicted based on the growth and chlorophyll results. Figure 5 shows snapdragon leaf size and colour ordered by biochar treatment. At the bottom T15 and T18 with 20 and 25% biochar showed chlorosis and smaller leaf size. Middle biochar concentration treatments T6, T9 and T12 with 5, 10 and 15% biochar showed greater leaf size (larger plant canopy) and greener colour. Overall, plants in treatments with lower levels of biochar showed more plant canopy. A complete sequence of plant development and canopy colour is displayed in Figure 6. Green leaves and better plant development were demonstrated for treatments with 0% (T1) to 15% (T12) biochar. Treatments with 20% (T13) and 25% (T18) biochar showed stunted plant development and leaf chlorosis. The presence of the slow release fertilizer helped, but without it the following treatments; 0% (T3), 5% (T6), 10% (T9), 15% (T12), 20% (T15) and 25% (T18) biochar, showed significantly less plant development and overall reduced plant canopy. Overall, treatments with the full slow release fertilizer rate (100%) performed better than treatments with 0 or 50% rate, no matter what level of biochar was added.
Figure 5 Poultry litter biochar treatments showing leaf area and colour. At the bottom are treatments with 20 and 25% biochar showing leaf chlorosis.
T1: 0% Biochar + 100% media + 100% SRF T4: 5% Biochar + 95% media + 100% SRF T2: 0% Biochar + 100% media + 50% SRF T5: 5% Biochar + 95% media + 50% SRF T3: 0% Biochar + 100% media + 0% SRF T6: 5% Biochar + 95% media + 0% SRF
Page 17 of 21
T7: 10% Biochar + 90% media + 100% SRF T10: 15% Biochar + 85% media + 100% SRF T8: 10% Biochar + 90% media + 50% SRF T11: 15% Biochar + 85% media + 50% SRF T9: 10% Biochar + 90% media + 0% SRF T12: 15% Biochar + 85% media + 0% SRF
T13: 20% Biochar + 80% media + 100% SRF T16: 25% Biochar + 75% media + 100% SRF T14: 20% Biochar + 80% media + 50% SRF T17: 25% Biochar + 75% media + 50% SRF T15: 20% Biochar + 80% media + 0% SRF T18: 25% Biochar + 75% media + 0% SRF
Figure 6 Poultry litter biochar treatments showing plant development; taller plants in treatments 0% (T1) to 15% (T11); shorter plants in treatments 15% (T12) to 25% (T18). Note severe leaf chlorosis in treatments 20% (T13) and 25% (T18) and well developed flower buds in treatments 0% (T1) to 10% (T9). Volumetric Water Content in Pots To study how addition of biochar affected the ability of the bedding plant media to hold water, moisture content was measured with moisture sensors placed in each treatment (Figure 7). Treatments with 15% (T11), 20% (T14) and 25% (T17) biochar showed higher moisture content compared with 5% (T5) and 10% (T8) biochar. In other words, treatments with low biochar rates dried out more quickly than treatments with high biochar rates.
Page 18 of 21
Figure 7 Poultry litter biochar moisture content over time [VWC (%)] by treatment; 0% (T2), 5% (T5), 10% (T8), 15% (T11), 20% (T14), 25% (T17) biochar concentration.
Water Retention of Media in pots Snapdragon pots were weighed on two occasions to record water holding capacity and compare it to the volumetric water content of the media. In Table 11, data shows snapdragon pot weight by treatment. Significant differences were found among the treatments; T15 and T18 with 20 and 25% biochar were the heaviest pots compared with 0% (T3) biochar. The same results were obtained at both weighing events.
Treatment Pot weight (g) Feb 27, 2014 Pot weight (g) March 24, 2014
Before After Before After
T3 (0% biochar + 0% SRF) 138.0 g 244.2 gh 150.9 defgh 270.9 efg
T15 (20% biochar + 0% SRF) 195.4 a 277.4 abc 221.6 ab 302.1 ab
T18 (25% biochar + 0% SRF) 177.9 abc 271.4 abcde 219.3 ab 302.3 ab
Table 11 Snapdragon 4’’ inch pots weight before and after water irrigation by treatment Z. Z Values are given as a mean of five replications. Values with the same letter are not significantly different. Mean analyzed by Tukey-Kramer HSD standardized range test (p ≤ 0.05).
These results indicate that a significant amount of water can be retained by media which includes biochar, even at lower % levels. Unfortunately we were unable conduct a desiccation stress trial with plants to determine how many hours or days of desiccation protection each biochar level would confer since the amount of biochar available for the trials was very limited. This will be included in future trials.
0
8
16
24
32
40
48
56
Volu
met
ric W
ater
Con
tent
(%)
Treatments media moisture content overtime
T5 T2 T8 T11 T14 T17
Page 19 of 21
CONCLUSIONS • The poultry litter biochar studied in this experiment had high pH, high electrical conductivity and high
concentration of some elements like chloride, bicarbonate, potassium and sodium. • Poultry litter biochar pH was directly related to the high bicarbonate and sulphate concentrations and the
high EC was strongly associated with the high potassium and sodium concentrations. • Poultry litter biochar was also found to have a fairly high amount of phosphorus, magnesium and boron
elements. • This poultry litter biochar can supply a fair amount of potassium and phosphorus to plants and crops. • Poultry litter biochar changed an acidic peat moss media to alkaline. As biochar rate increased, pH of the
media also increased with the highest value of pH 8.0 reached with 25% biochar. • The EC also increased with the biochar application rate, to a high of 2.8 mS/cm with 25% biochar. • The EC in treatments with high biochar was found to hold onto this value for a longer period of time
compare with lower concentration treatments. • The high pH and EC in the biochar supplemented media, were confirmed by the measurements of the drain
water from the treatments. • The media’s pH and EC had a high impact on the plant performance. Plant development parameters affected
included: overall canopy development, leaf colour and size, flowering time, chlorophyll content and plant appeal.
• Lower biochar concentrations of 5, 10 up to 15% were found to promote better performance and positive plant response.
• Biochar increased water retention in media as % of biochar increased. • No effects on germination were found with biochar treatments applied in the absence of desiccation stress. • Among the challenges found working with this product was the dust and odour. Safety equipment such as
goggles and dust mask are required to work with fine particle biochar. • Because of the high EC of this poultry litter biochar, small crusts of bicarbonate and/or sodium were
frequently found on grow trays and pots so this could have a corrosive impact on machinery and equipment. RECOMMENDATIONS • This poultry litter biochar is recommended for use in media or soil with a slightly acidic pH rather than
alkaline or sodic soils. For most crops, a pH close to 6.5 is optimal for plant growth and quality. • The lower biochar concentrations of 5% to 10% (and possibly 15% for some crops) should be used to
promoted better plant growth and development. • Because of its high concentration of chloride, bicarbonates and sodium, this biochar could have
unfavourable effects in some crops and soils that are susceptible to these elements. A good range of crops and soil types should be studied before general recommendations are made.
• Studies using water soluble fertilizers instead of Slow Release Fertilizer will give important information regarding media pH and element behaviours and trends.
• Trials with poultry litter biochar in other growing media or with other amendments will be important in order to understand it’s behaviour in a media other than the slightly acidic media used in this study, for example; peat, its effect on compost, vermicompost, soil, sawdust, etc.
• Further study with desiccation stress tests would be valuable in promoting its use in bedding plants.
Page 20 of 21
REFERENCES Anderson T., Dobson J., Yang J., Drozdowski B., Anyia A. (2011) High value biochar from forest wastes,
Alberta Innovates Technology Futures, Vegreville. pp. 1-70. Beck D.A., Johnson G.R., Spolek G.A. (2011) Amending greenroof soil with biochar to affect runoff water
quantity and quality. Environmental Pollution 159:2111-2118. Brockhoff S.R., Christians N.E., Killorn R.J., Horton R., Davis D.D. (2010) Physical and mineral nutrition
properties of sand based turfgrass root zones amended with biochar. Agronomy Journal 102:1627-1631. Carter S., Simon S., Saran S., Tan S., Stephan H. (2013) The Impact of Biochar Application on Soil Properties
and Plant Growth of Pot Grown Lettuce (Lactuca sativa) and Cabbage (Brassica chinensis). Agronomy 3:404-418.
Chan K., Zwieten L.v., Meszaros I., Downie A., Joseph S. (2008) Using poultry litter biochars as soil amendments. Australian Journal of Soil Research 46:437-444.
Chase L., A M.C., A R.J., C H.W., J S.J. (2013) Nitrogen, biochar, and mycorrhizae: Alteration of the symbiosis and oxidation of the char surface. Soil Biology & Biochemistry 58:248-254.
Dumroese R.K., Heiskanen J., Englund K., Tervahauta A. (2011) Pelleted biochar: Chemical and physical properties show potential use as a substrate in container nurseries Biomass and Bioenergy 35:2018-2027.
Graber E.R., Harel Y.M., Kolton M., Cytryn E., Silber A., David D.R., Tsechansky L., Borenshtein M., Elad Y. (2010) Biochar impact on development and productivity of pepper and tomato grown in fertigated soilless media. Plant Soil 337:481-496.
Laird D., Fleming P., Wang B., Horton R., Karlen D. (2010) Biochar impact on nutrient leaching from a Midwestern agricultural soil. Geoderma 158:436-442.
Lehmann J., Joseph S. (2009) Biochar for Environmental Management Science and Technology. Ogawa M., Okimon Y. (2010) Pioneering works in biochar research, Japan. Australian Journal of Soil Research
48:489-500. Ogawa M., Okimori Y., Takahashi F. (2006) Carbon Sequestration by carbonization of biomass and forestation:
three case studies Springer. Warnock D.D., Lehmann J., Kuyper T.W., Rilling M.C. (2007) Mycorrhizal responses to biochar in soil -
concepts and mechanims. Plant Soil 300:9-20.
Page 21 of 21
APPENDIX 1
Poultry Litter Biochar size particle. After passing through a 12.7 mm (½ inch) screen - dry weight basis
Screen size % passing
Passing 9.5 mm 98.4
Passing 6.4 mm 92.5
Passing 4.75 mm 85.4
Passing 2.36 mm 67.8
Passing 1.0 mm 32.0
Passing 0.50 mm 20.1 2 Soil and Plant Lab, Inc.
APPENDIX 2 Heavy metals analysis report from Soil and Plant Lab Inc.
Analysis (total element)
Result 2 Quantitation limit 2 EPA limit 3 Concentration 4