Testing Students with Testing Students with Disabilities Disabilities Special Education Special Education Administrators Administrators Spring Conference Spring Conference March 24, 2011 March 24, 2011
Transcript
Testing Students with DisabilitiesTesting Students with Disabilities
Special Education Special Education AdministratorsAdministrators
Spring ConferenceSpring ConferenceMarch 24, 2011March 24, 2011
Office of AssessmentOffice of Assessment
Suzanne Swaffield
Douglas Alexander
Chris Webster
South Carolina AssessmentsSouth Carolina Assessments
Top 10 Testing Quotes from 2010Top 10 Testing Quotes from 2010
10.10. “Johnny broke his wrist last night. Can he use “Johnny broke his wrist last night. Can he use dictation for the writing test?”dictation for the writing test?”
9.9. “We didn’t like the way the man was signing on the “We didn’t like the way the man was signing on the DVD, so we just turned it off and signed it ourselves.”DVD, so we just turned it off and signed it ourselves.”
8. 8. “The CD-ROMs didn’t read all of the answer choices, “The CD-ROMs didn’t read all of the answer choices, so the TA read them to the student.”so the TA read them to the student.”
7.7. “I thought cueing meant that I could rephrase the “I thought cueing meant that I could rephrase the questions.”questions.”
6.6. “ We ran out of CD-ROMs, so we just read all of the “ We ran out of CD-ROMs, so we just read all of the questions and all of the answers to the student.”questions and all of the answers to the student.”
Top 10 Testing Quotes (cont.)Top 10 Testing Quotes (cont.)
5.5. “She refused to spell every third word in her writing “She refused to spell every third word in her writing composition.”composition.”
4.4. “The teacher let them use the computer for the writing “The teacher let them use the computer for the writing test and forgot to disable spell-check.”test and forgot to disable spell-check.”
3.3. “ We didn’t order test booklets for the students using “ We didn’t order test booklets for the students using CD-ROMs.”CD-ROMs.”
2.2. ““They were not supposed to get an oral They were not supposed to get an oral administration, but the teacher read it to them administration, but the teacher read it to them anyway.”anyway.”
11.. “He was supposed to get an oral administration, “He was supposed to get an oral administration, but we forgot!”but we forgot!”
Test Security ViolationsTest Security Violations
60 to 70 percent of all test security 60 to 70 percent of all test security violations relate to testing students violations relate to testing students with disabilities.with disabilities.
ResourcesResources
Accommodations ManualAccommodations Manual
The five-step process :The five-step process :
STEP 1: Expect students with disabilities to achieve STEP 1: Expect students with disabilities to achieve grade-level academic content standardsgrade-level academic content standards
STEP 2: Learn about accommodations for instruction STEP 2: Learn about accommodations for instruction and assessmentand assessment
STEP 3: Select accommodations for instruction and STEP 3: Select accommodations for instruction and assessment for individual studentsassessment for individual students
STEP 4: Administer accommodations for instruction STEP 4: Administer accommodations for instruction and assessmentand assessment
STEP 5: Evaluate and improve use of accommodationsSTEP 5: Evaluate and improve use of accommodations
Accommodations Selection Process Accommodations Selection Process (AccSelPro)(AccSelPro)
A research-based Web A research-based Web tool designed by the tool designed by the SCDE through the AVAAD Enhanced SCDE through the AVAAD Enhanced Assessment Grant to assist IEP and 504 plan Assessment Grant to assist IEP and 504 plan teams with making appropriate decisions teams with making appropriate decisions regarding individual student regarding individual student accommodations.accommodations.
www.accselpro.org
Test Administration ManualsTest Administration Manuals
Appendix C: Appendix C: Testing Students with DisabilitiesTesting Students with Disabilities
Appendix D: Appendix D: ESOL/LEP StudentsESOL/LEP Students
Order customized materials including oral Order customized materials including oral administration CDs and any scripts for a administration CDs and any scripts for a specific student through pre-code.specific student through pre-code.
Order oral administration scripts per test Order oral administration scripts per test administrator through on-line enrollment.administrator through on-line enrollment.
Alternate Assessments on Alternate Assessments on Alternate Achievement Alternate Achievement Standards (AA-AAS)Standards (AA-AAS)
1% Assessments –1% Assessments –
No more than one percent of all No more than one percent of all students assessed can be counted as students assessed can be counted as proficient for AYP on AA-AASproficient for AYP on AA-AAS..
SC-Alt is the state assessment on SC-Alt is the state assessment on alternate achievement standards.alternate achievement standards.
Alternate Assessment on Alternate Assessment on Modified Achievement Modified Achievement Standards (AA-MAS)Standards (AA-MAS)
2% Assessments-2% Assessments-
No more than two percent of all No more than two percent of all students assessed can be counted students assessed can be counted as proficient as proficient for AYP on AA-MAS.for AYP on AA-MAS.
Use of Accommodations and Use of Accommodations and Performance of Students with Performance of Students with
Disabilities on PASS 2010Disabilities on PASS 2010
Participation of Students with Participation of Students with Disabilities in Statewide TestingDisabilities in Statewide Testing
43,257 students with disabilities (SWD) were 43,257 students with disabilities (SWD) were tested in grades 3-8 in 2010 (includes PASS tested in grades 3-8 in 2010 (includes PASS and SC-Alt students)and SC-Alt students)
SWD made up 13.4% of all students tested in SWD made up 13.4% of all students tested in grades 3-8grades 3-8
6.0% of SWD were tested with SC-Alt6.0% of SWD were tested with SC-Alt
The number of students tested with SC-Alt The number of students tested with SC-Alt was 0.8% of all students tested with PASS and was 0.8% of all students tested with PASS and SC-Alt (SWD and Non-SWD)SC-Alt (SWD and Non-SWD)
Standard AccommodationsStandard AccommodationsAll Content Areas Grades 3-8 with Exceptions NotedAll Content Areas Grades 3-8 with Exceptions Noted
SettingSetting TimingTiming SchedulingScheduling Oral or Signed AdministrationOral or Signed Administration
(except ELA grades 3-4)(except ELA grades 3-4) Use of calculator with Math Use of calculator with Math
(except grades 3-4)(except grades 3-4) Response OptionsResponse Options Supplementary Materials or DevicesSupplementary Materials or Devices
Use of spell check, grammar check, Use of spell check, grammar check,
word prediction software word prediction software
Use of calculator in mathUse of calculator in math Grades 3-4Grades 3-4
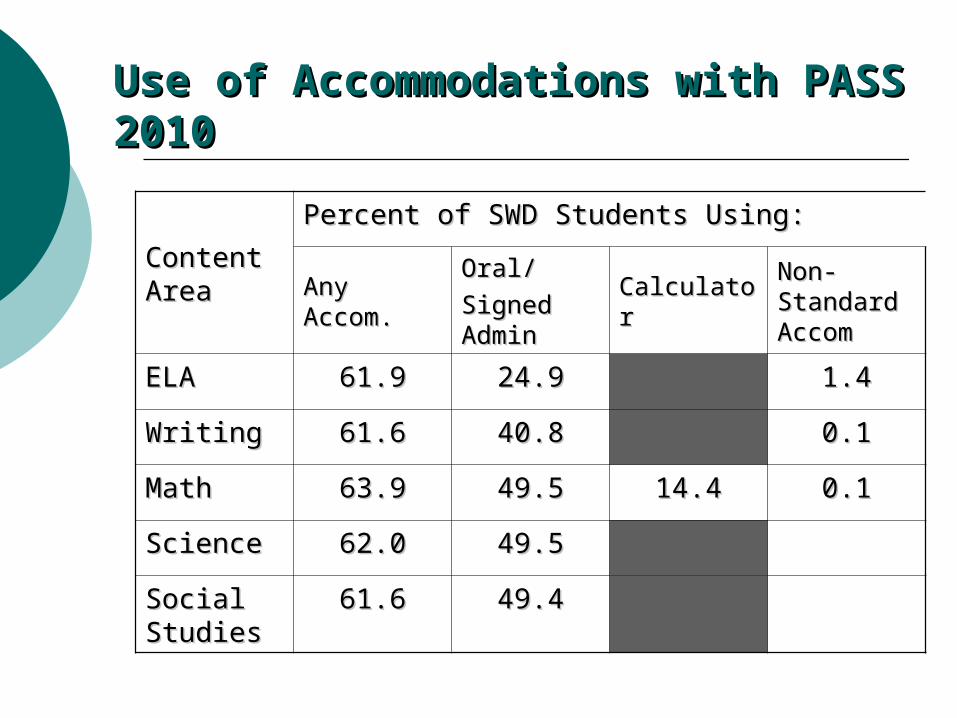
Use of Accommodations with PASS 2010Use of Accommodations with PASS 2010
Content Content AreaArea
Percent of SWD Students Using:Percent of SWD Students Using:
Any Any Accom.Accom.
Oral/Oral/
Signed Signed AdminAdmin
CalculatorCalculatorNon-Non-Standard Standard AccomAccom
ELAELA 61.961.9 24.924.9 1.41.4
WritingWriting 61.661.6 40.840.8 0.10.1
MathMath 63.963.9 49.549.5 14.414.4 0.10.1
ScienceScience 62.062.0 49.549.5
Social Social StudiesStudies
61.661.6 49.449.4
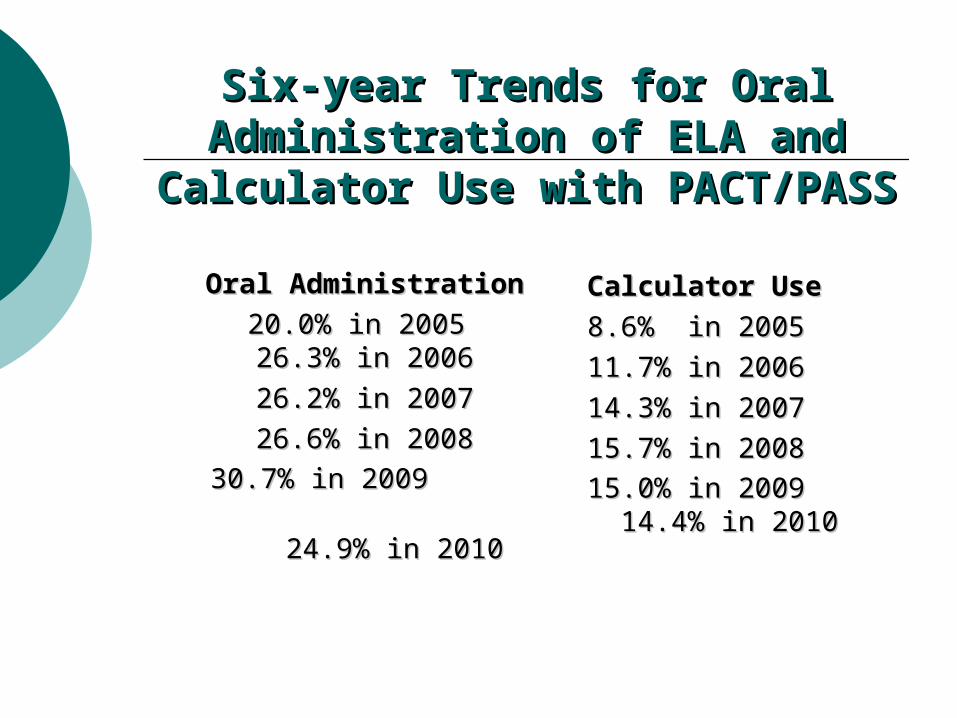
Six-year Trends for Oral Administration Six-year Trends for Oral Administration of ELA and Calculator Use with of ELA and Calculator Use with
PACT/PASSPACT/PASS
Oral AdministrationOral Administration
20.0% in 2005 26.3% 20.0% in 2005 26.3% in 2006in 2006
26.2% in 200726.2% in 2007
26.6% in 200826.6% in 2008
30.7% in 200930.7% in 2009
24.9% in 201024.9% in 2010
Calculator Use Calculator Use
8.6% in 20058.6% in 2005
11.7% in 200611.7% in 2006
14.3% in 200714.3% in 2007
15.7% in 200815.7% in 2008
15.0% in 2009 15.0% in 2009 14.4% in 201014.4% in 2010
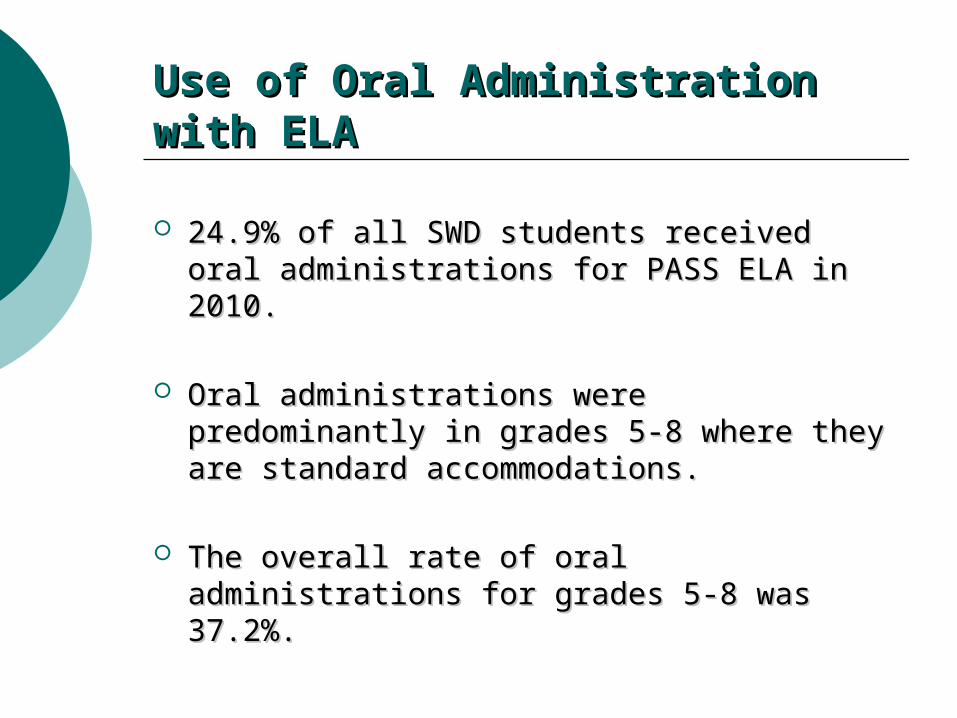
Use of Oral Administration with ELAUse of Oral Administration with ELA
24.9% of all SWD students received oral 24.9% of all SWD students received oral administrations for PASS ELA in 2010.administrations for PASS ELA in 2010.
Oral administrations were predominantly in Oral administrations were predominantly in grades 5-8 where they are standard grades 5-8 where they are standard accommodations.accommodations.
The overall rate of oral administrations for The overall rate of oral administrations for grades 5-8 was 37.2%.grades 5-8 was 37.2%.
Percent of SWD ReceivingPercent of SWD ReceivingOral Administration of ELA by GradeOral Administration of ELA by Grade
2008-20102008-2010
20
30.130.2
26.223.2
31.3
37.734.8
24.9
36.8
30.3
22.2
40.637.138.7
32.7
43.6
0
10
20
30
40
50
60
70
80
Gr 3 Gr 4 Gr 5 Gr 6 Gr 7 Gr 8
Per
cent
of
Stud
ents
200820092010
Rates of Oral AdministrationRates of Oral Administrationby Disability Groupsby Disability Groups
By disability group percentage, students By disability group percentage, students with mild and moderate cognitive disability with mild and moderate cognitive disability had the largest oral administration rateshad the largest oral administration rates
(53 – 65%).(53 – 65%).
Used by 29% of students with learning Used by 29% of students with learning disabilities, and being the largest disability disabilities, and being the largest disability group, made up approximately 70% of all group, made up approximately 70% of all students receiving oral administrations.students receiving oral administrations.
ELA Performance of SWD TestedELA Performance of SWD Tested
With and Without Oral Administration (OA)With and Without Oral Administration (OA)
60.4
12.6
2719.9
2.9
77.3
0
10
20
30
40
50
60
70
80
90
100
Not Met Met Exemplary
Per
cent
of
Stud
ents
Without OAWith OA
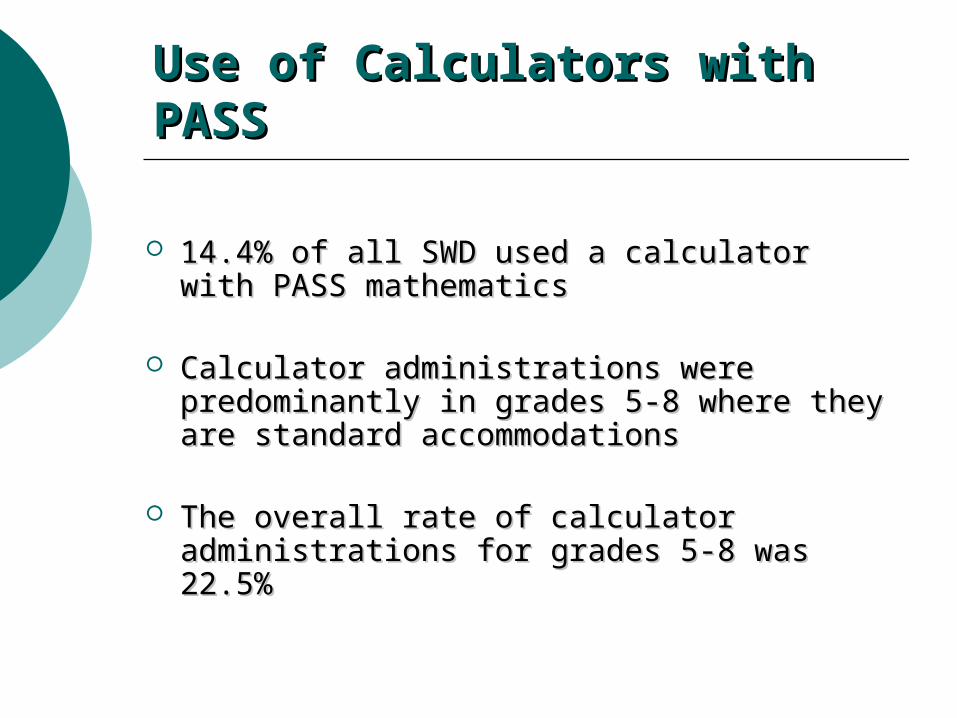
Use of Calculators with PASSUse of Calculators with PASS
14.4% of all SWD used a calculator with 14.4% of all SWD used a calculator with PASS mathematicsPASS mathematics
Calculator administrations were Calculator administrations were predominantly in grades 5-8 where they are predominantly in grades 5-8 where they are standard accommodationsstandard accommodations
The overall rate ofThe overall rate of calculatorcalculator administrations for grades 5-8 was 22.5%administrations for grades 5-8 was 22.5%
Percent of SWDPercent of SWDUsing Calculator AdministrationsUsing Calculator Administrations
by Grade 2008-2010by Grade 2008-2010
3.8
30.7
26.4
95.9
21.3
30.528.6
4.7
19.8
8.1
2.5
32.2
20.3
10.6
0.3 0.4
28.3
0
10
20
30
40
50
60
70
80
Gr 3 Gr 4 Gr 5 Gr 6 Gr 7 Gr 8
Per
cent
of
Stud
ents
200820092010
Rates of Calculator Use by Disability Rates of Calculator Use by Disability GroupsGroups
By disability group percentage, students By disability group percentage, students with mild and moderate cognitive disability with mild and moderate cognitive disability and students with traumatic brain injury and students with traumatic brain injury had the largest calculator use rateshad the largest calculator use rates(19 – 25%).(19 – 25%).
Used by 16% of students with learning Used by 16% of students with learning disabilities, and being the largest disability disabilities, and being the largest disability group, made up approximately 68% of all group, made up approximately 68% of all students receiving calculator students receiving calculator administrations.administrations.
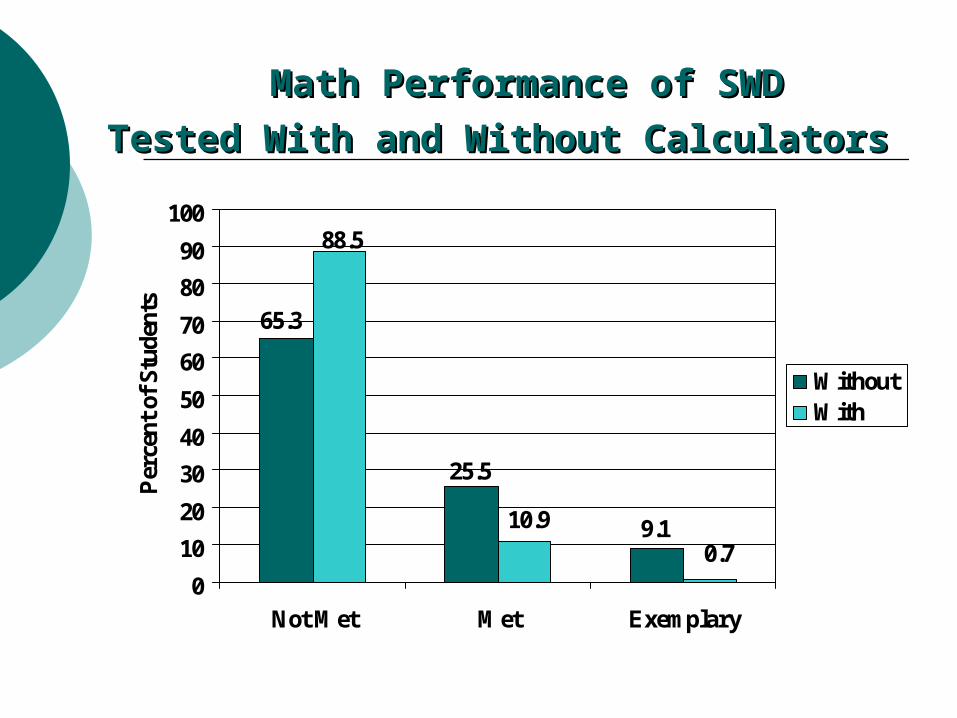
Math Performance of SWDMath Performance of SWD
Tested With and Without CalculatorsTested With and Without Calculators
65.3
9.1
25.5
10.9
0.7
88.5
0
10
20
30
40
50
60
70
80
90
100
Not Met Met Exemplary
Per
cent
of
Stud
ents
Without With
South CarolinaSouth CarolinaAccountability WorkbookAccountability Workbook
Link for information on AYP inclusion:Link for information on AYP inclusion:
Including Students with Disabilities Including Students with Disabilities in NAEPin NAEP
To Help Ensure Validity of ResultsTo Help Ensure Validity of Results
OverviewOverview
National Assessment of Educational Progress National Assessment of Educational Progress Only ongoing nationwide assessment Only ongoing nationwide assessment Representative sample across statesRepresentative sample across states State- and national-level resultsState- and national-level results
State grades 4 and 8State grades 4 and 8 National-grades 4, 8, and 12National-grades 4, 8, and 12
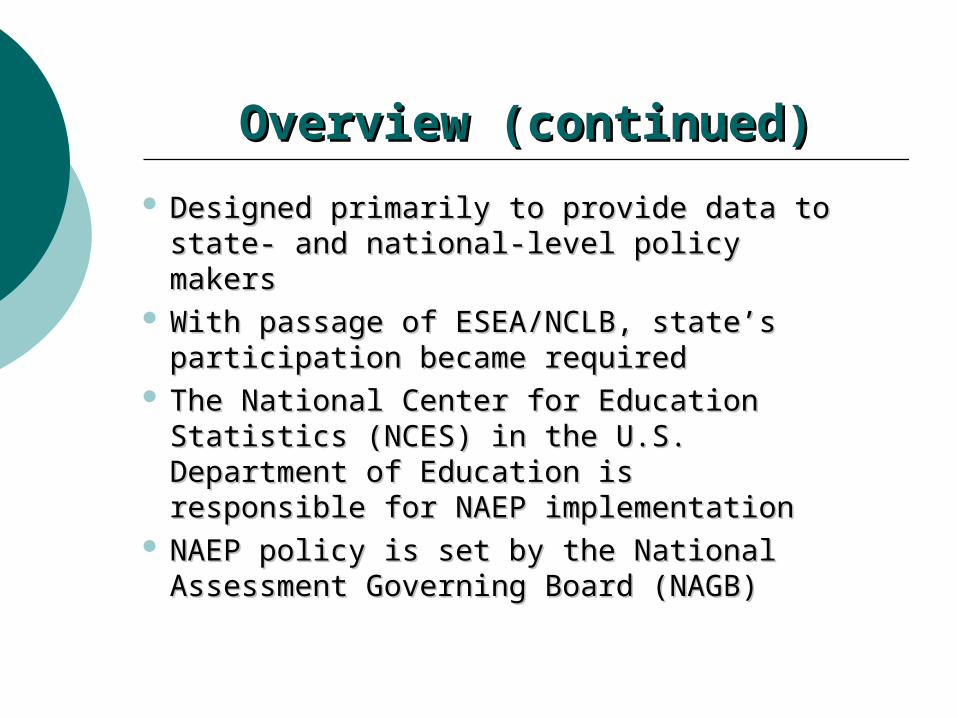
Designed primarily to provide data to Designed primarily to provide data to state- and national-level policy makersstate- and national-level policy makers
With passage of ESEA/NCLB, state’s With passage of ESEA/NCLB, state’s participation became requiredparticipation became required
The National Center for Education The National Center for Education Statistics (NCES) in the U.S. Department Statistics (NCES) in the U.S. Department of Education is responsible for NAEP of Education is responsible for NAEP implementationimplementation
NAEP policy is set by the National NAEP policy is set by the National Assessment Governing Board (NAGB)Assessment Governing Board (NAGB)
New NAEP Inclusion PolicyNew NAEP Inclusion Policy
New policy becomes effective with NAEP New policy becomes effective with NAEP 20132013
Focus on states’ inclusion of students with Focus on states’ inclusion of students with disabilities (SD) and English language disabilities (SD) and English language learners (ELLs) learners (ELLs)
As a percentage of total population, total As a percentage of total population, total excluded (SD/ELL) should not be more than excluded (SD/ELL) should not be more than 5%. 5%.
As a percentage of the identified group, As a percentage of the identified group, excluded should not exceed 15%.excluded should not exceed 15%.
Subject Subject GradeGrade % of Total% of Total% of SD % of SD GroupGroup
MathematicsMathematics 44 2.02.0 12.212.2
MathematicsMathematics 88 4.44.4 31.931.9
ReadingReading 44 5.35.3 31.131.1
ReadingReading 88 6.46.4 42.442.4
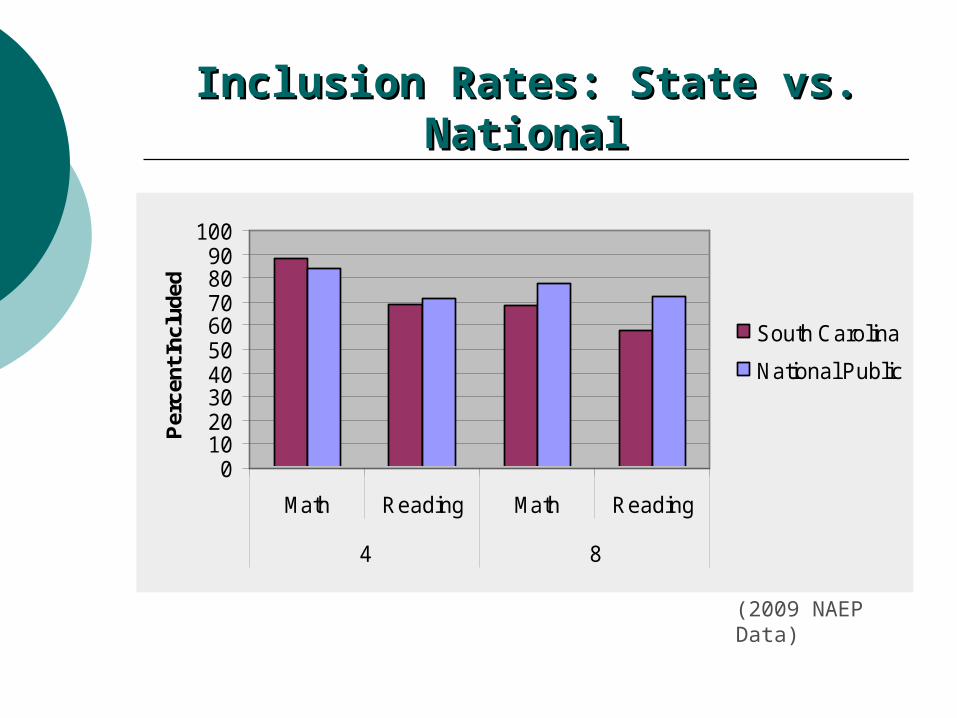
Inclusion Rates: State vs. NationalInclusion Rates: State vs. National
0102030405060708090
100
Math Reading Math Reading
4 8
Per
cent
Incl
uded
South Carolina
National Public
(2009 NAEP Data)
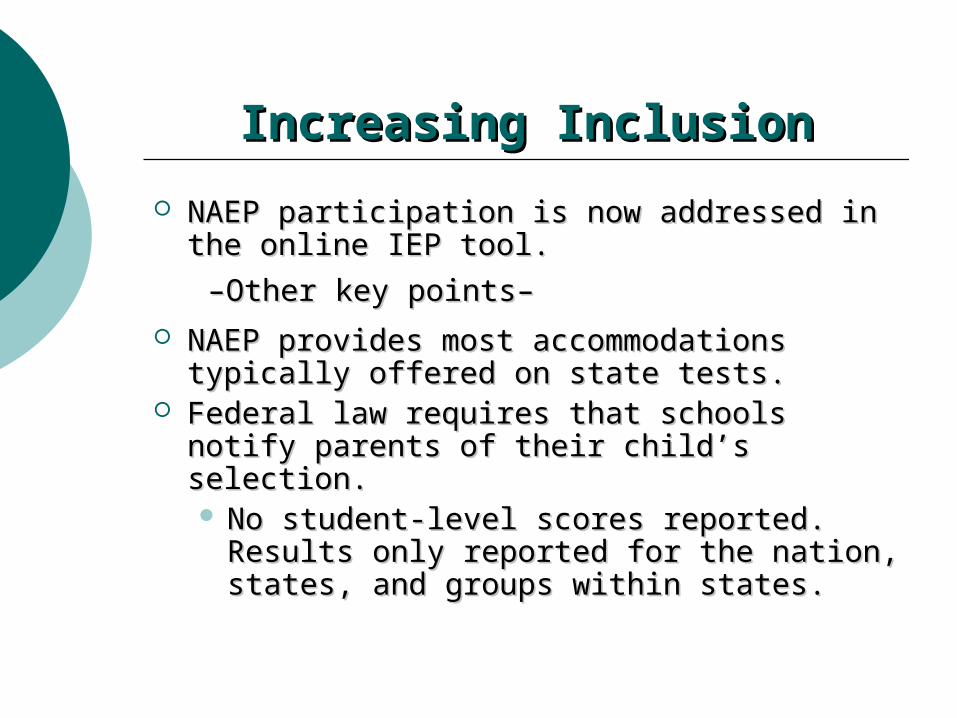
Increasing InclusionIncreasing Inclusion
NAEP participation is now addressed in the NAEP participation is now addressed in the online IEP tool.online IEP tool.
– –Other key points– Other key points– NAEP provides most accommodations NAEP provides most accommodations
typically offered on state tests.typically offered on state tests. Federal law requires that schools notify Federal law requires that schools notify
parents of their child’s selection.parents of their child’s selection. No student-level scores reported. Results No student-level scores reported. Results
only reported for the nation, states, and only reported for the nation, states, and groups within states.groups within states.