Page 1
TESTING THE HYDROGEN PEROXIDE - WATER HYPOTHESIS OF LIFE ON
MARS USING THE DIFFERENTIAL SCANNING CALORIMETER AS AN
ANALOG FOR THE TEGA INSTRUMENT ON
THE MARS PHOENIX LANDER
BY
CAROL LOUISE TURSE
A thesis submitted in partial fulfillment of the requirements for the degree of
MASTER OF SCIENCE IN ENVIRONMENTAL SCIENCE
WASHINGTON STATE UNIVERSITY
School of Earth and Environmental Sciences
AUGUST 2009
Page 2
ii
To the Faculty of Washington State University:
The member of the Committee appointed to examine the thesis of
CAROL LOUISE TURSE find it satisfactory and recommend that it be accepted.
Dirk Schulze-Makuch, Ph.D., Chair
Michael C. Pope, Ph.D.
Louis Scudiero, Ph.D.
Page 3
iii
ACKNOWLEDGEMENT
I would like to acknowledge my advisor, Dr. Dirk Schulze-Makuch for his
wonderful support and help in completing this research. I would also like to thank Dr.
Louis Scudiero for the use of his DSC instrument. Without both of your help this project
never would have happened.
Page 4
iv
TESTING THE HYDROGEN PEROXIDE - WATER HYPOTHESIS OF LIFE ON
MARS USING THE DIFFERENTIAL SCANNING CALORIMETER AS AN
ANALOG FOR THE TEGA INSTRUMENT ON
THE MARS PHOENIX LANDER
Abstract
By Carol Louise Turse, M.S.
Washington State University
August 2009
Chair: Dirk Schulze-Makuch
In the time since the Viking life detection experiments were conducted on Mars, many
missions have enhanced our knowledge about the environmental conditions on the Red
Planet. However, the martian surface chemistry and the Viking lander results remain
puzzling. Non-biological explanations that favor a strong inorganic oxidant are currently
favored (e.g., Mancinelli, 1989; Plumb et al.,1989; Quinn and Zent, 1999; Klein, 1999,
Yen et al., 2000), but problems remain regarding the lifetime, source, and abundance of
that oxidant to account for the Viking observations (Zent and McKay, 1994).
Alternatively, a hypothesis that favors the biological origin of a strong oxidizer has
recently been advanced (Houtkooper and Schulze-Makuch, 2007). Here, we report about
laboratory experiments that simulate the experiments to be conducted by the Thermal and
Evolved Gas Analyzer (TEGA) instrument of the Phoenix lander, which is to descend on
Mars in May 2008. We also report on laboratory experiments involving water activity
and hydrogen peroxide solutions. Our experiments provide a baseline for unbiased tests
for chemical versus biological responses, which can be applied to the Phoenix mission
and future Mars missions.
Page 5
v
TABLE OF CONTENTS
Page
ABSTRACT……………………………………………………………………….…....iv
LIST OF FIGURES…………………………………………………………………vi-vii
LIST OF TABLES……………………………………………………………………viii
CHAPTER ONE: MARS, VIKING, PHOENIX AND H2O2
1. INTRODUCTION…………………………………………………………….1
2. MATERILAS AND METHODS…………………………………………….12
3. RESULTS……………………………………………………………………28
4. DISCUSSION….…………………………………………………………….42
CHAPTER TWO: WATER ACTIVITY AND HYDROGEN PEROXIDE
1. INTRODUCTION…………………………………………………………..50
2. MATERIALS AND METHODS……………………………………………53
3. RESULTS……………………………………………………………………56
4. DISCUSSION….…………………………………………………………….61
APPENDIX A: COPY OF PUBLISHED PAPER BASED ON DSC RESULTS………64
APPENDIX B: SUPPLEMENTARY DSC THERMOGRAMS………………………..81
REFERENCES…………………………………………………………………………..92
Page 6
vi
LIST OF FIGURES
1. Diagram of the Mars Viking Life Detection Experiments………………..……3
2. Viking Lander-1 Labeled Release Data………….…………………..…….….7
3. Structural Formulas of Chemical Stabilizers……………….………………...13
4. Thermograms of 40 Minute Hydrogen Peroxide…………………………..…15
5. Limit of Detection of Hydrogen Peroxide……………………………….……28
6. Thermograms of Millipore Water……………………………………….....….29
7. Thermograms of 17.5% Hydrogen Peroxide………………………………….30
8. Thermograms of 35% Hydrogen Peroxide……………………………………31
9. Thermograms of 35% H2O2 and 10% NaPPi…………………………………32
10. Thermograms of Phenacetin…………………………………………………33
11. Thermograms of 35% H2O2 and Phenacetin…………………………………34
12. Thermograms of 35% H2O2 at a Lower Scan Rate…………………………..35
13. Thermograms of Quartz Sand Mixtures……………………………………..36
14. Thermograms of JSC-1 Mars Analog Soil Mixtures……………………..…37
15. Thermograms of Titanium (IV) Oxide Mixtures……………………………38
16. Thermograms of Iron (III) Oxide Mixtures…………………………………39
17. Thermograms of Phenacetin at 10% Mass Fraction…………………………40
18. Thermograms of Bacterial Cultures………………………………………….41
19. Water Activity of Millipore Water…………………………………………..56
20. Water Activity of 35% Hydrogen Peroxide………………………………….57
21. Water Activity of 17.5% Hydrogen Peroxide………………………………..58
Page 7
vii
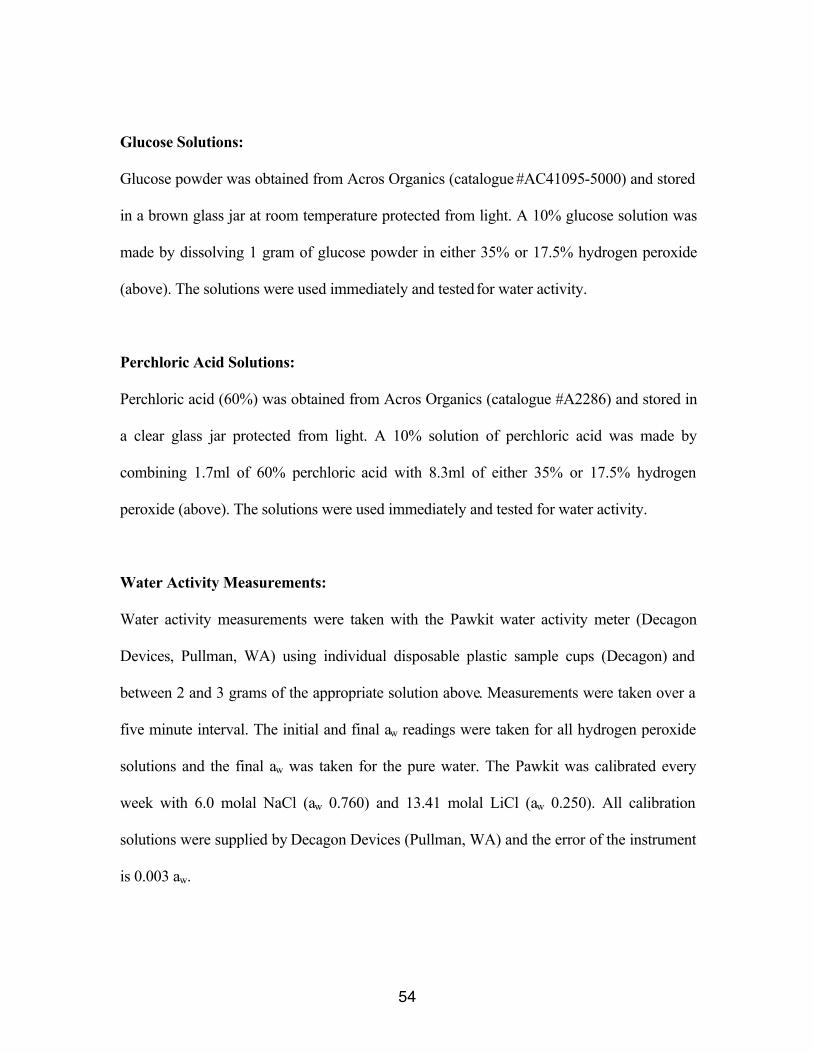
22. Water Activity of 35% Hydrogen Peroxide Solutions……………………….59
23. Water Activity of Trinidad Lake Asphalt…………………………………….60
24. Chemical Stabilizers………………………………………………………….77
25. Thermograms of Various Solutions…………………………………………..78
26. Thermograms of Media and Solutions………………………….…………….80
27. Thermograms of Bacterial Cultures…………………………………………..82
28. Thermogram of Water and Hydrogen Peroxide Solutions……………………83
29. Thermograms of Various 35% Hydrogen Peroxide Solutions……………….84
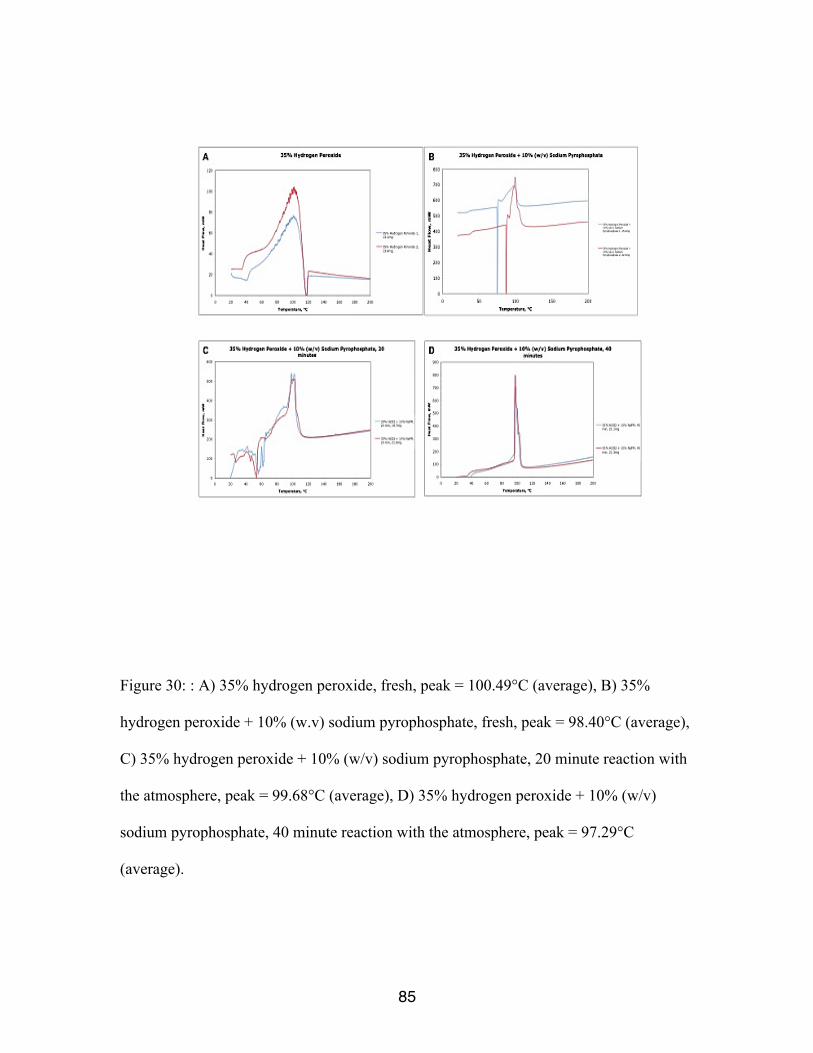
30. Thermograms of 35% Hydrogen Peroxide Solutions………………………..85
31. Thermograms of JSC-1 Soil Analog Mixtures………………………………86
32. Thermograms of Quartz Sand Mixtures……………………………………..87
33. Thermograms of Iron (III) Oxide Mixtures………………………………….88
34. Thermograms of Titanium (IV) Oxide Mixtures…………………………….89
35. Thermograms of Hydrogen Peroxide and Phenacetin………………………..90
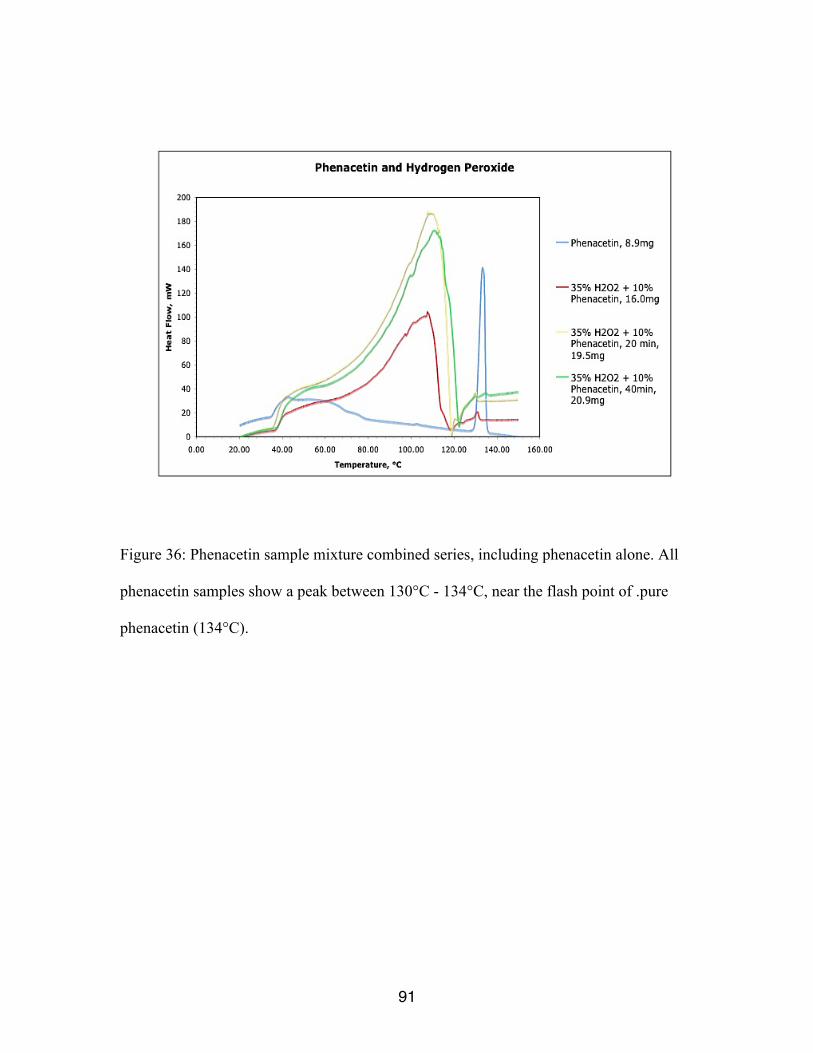
36. Thermograms of Phenacetin Mixtures………………………………………..91
Page 8
viii
LIST OF TABLES
1. Indium Standard DSC-7 Parameters………………………………………17
2. Baseline DSC-7 Parameters………………………………………………17
3. Millipore Water DSC-7 Parameters………………………………………18
4. 35% Hydrogen Peroxide DSC-7 Parameters……………………………..19
5. 17.5% Hydrogen Peroxide DSC-7 Parameters……………………………19
6. 35% H2O2 – 10% NaPPi DSC-7 Parameters………………………………20
7. JSC-1 Soil Simulant DSC-7 Parameters…………………………………..21
8. Quartz Sand DSC-7 Parameters…………………………………………..22
9. Iron (III) Oxide DSC-7 Parameters……………………………………….23
10. Titanium (IV) Oxide DSC-7 Parameters………………………………….24
11. Phenacetin DSC-7 Parameters…………………………………………….25
12. Bacterial Sample DSC-7 Parameters……………………………………..26
13. Water Activities of Common Foods……………………………………...51
Page 9
ix
Dedication
This thesis is dedicated to my mother, father and husband
who provided unfailing support and faith.
Page 10
1
CHAPTER ONE: MARS, VIKING, PHOENIX AND H2O2
INTRODUCTION
As we explore the planets in our solar system, we continue to find evidence that
many planets and their satellites may have been able to support life in the past and may
even be capable of supporting life in the present. From Mars with its wind-swept plains,
to the subsurface oceans of Europa, the possible habitats for life are numerous. The
search for life on any planet must begin with a consideration of the basic requirements of
life. Some of these requirements include a nutrition source, energy source and water or
other suitable solvent availability.
Before moving our attention to other solar bodies we must first consider the limits
within which life is found on our own planet. On Earth, microorganisms have been found
in a wide variety of environments and indeed seem to define the very limits of biological
life. Psychrophiles have been found actively growing at -20°C (Rivkina, Friedmann,
McKay, & Gilichinsky, 2000) and thermophiles and hyperthermophiles have been found
at temperature of up to 121°C (Kashefi & Lovley, 2003). Most microorganisms tolerate
an external pH range from about 5 to 9 pH units. However, there are some acidophiles
that tolerate pH values below 2 and some alkaliphiles that tolerate external pH values of
up to 11 (Konhauser, 2007). Microorganisms can also tolerate a wide range of pressures
from deep subsurface to interstellar space, a wide variety of aqueous habitats from acid
mine drainage to alkaline lakes and even extreme desiccation (Rothschild & Mancinelli,
Page 11
2
2001). Given these fairly broad constraints for life, it is possible to consider the
environments of other solar bodies as refuges for life.
As one of our nearest neighbors in space, Mars has always been an object of
fascination and interest. The martian surface boasts a canyon system larger than the
Grand Canyon and peaks higher than Mt. Everest. The atmospheric pressure is about 7
mbar with a composition of mostly CO2 (95%), N2 (2%) and Argon (1%) with
temperature ranges from -125°C in the poles to about 20°C near the equator (NASA
Mars, 2009). Dust storms can sometimes range over the entire planet and the atmosphere,
though thin by Earth standards, is enough to support clouds and weather systems.
The Viking mission to Mars began an era of investigation and hoped to answer
the age-old question, are we alone? The two Viking Landers, Viking 1 and Viking 2
landed on Mars between July and September of 1976. Viking 1 landed on the western
slopes of Chryse Planitia on July 20, 1976 and the Viking 2 landed in Utopia Planitia on
September 3, 1976 (NASA Viking, 2009). Both spacecraft contained three main life
detection experiments as shown in Figure 1: the Pyrolitic Release experiment (PR or
Carbon Assimilation), the Gas Exchange experiment (GEx) and the Labeled Release
(LR) experiment (Klein, 1976). A gas chromatograph-mass spectrometer (GCMS) was
also on board the spacecraft as well as a seismograph (Klein, 1976).
Page 12
3
Figure 1: Diagram of the three life detection experiments on the Viking mission (from
McFadden, 2007).
The Carbon Assimilation or Pyrolitic Release (PR) experiment tested the idea that
potential martian microorganisms could utilize labeled 14
CO2 or 14
CO gases during either
light or dark metabolism reactions. In the experiment, 0.25g of martian regolith was
enclosed in a 4ml sample chamber and exposed to the radiolabeled gases, with or without
added water vapor. The light source was a simulated martian spectrum (335-1000nm) and
the reactions were allowed to run for 120 hours at temperatures between 8 ad 26°C
(pressure was 10 mbar). The control samples were treated to all the same conditions
except they were first heated to either 90°C or 175°C, with the later temperature
considered a “sterilization” temperature (Klein et al., 1976). After the incubation period
the samples vented and then pyrolyzed at 625°C to release any organic compounds and
run through a gas chromatography column. The 14
CO2 and 14
CO gases were fixed in
small but significant amounts: 7 pmole of CO or 26 pmole of CO2. Additionally, the
Page 13
4
reactions were not inhibited by water vapor or heating to 90°C, were enhanced by the
simulated martian light source and reduced by 90% when heated to 175°C (Klein, 1976).
While the pyrolitic release results could be interpreted as consistent with
microbial life on Mars there are several arguments against the biological explanation.
Klein (1978) stated that since heating the samples to 90°C had no inhibiting effect and
heating to 175°C only partially inhibited the release, then a non-biological explanation is
supported. Horrowitz et al. (1977) argued against the biological explanation due to the
fact that water vapor tended to inhibit or have no effect on the reactions, even though
water would be predicted to enhance a biological reaction. Furthermore, the gas
chromatography mass spectrometer (GCMS) onboard the Viking landers did not detect
any soil organics (Biemann et al., 1976). While all these arguments are indeed
compelling it is important to remember that: 1) extremophilic bacteria on Earth can
withstand and even grow in temperatures up to 121°C (Kashefi & Lovley, 2003) and
down to -2°C (Junge, Eicken, & Deming, 2004), 2) the GCMS used on the Viking
mission failed to detect organic molecules in the Antarctic soil even though such organics
were known to exist in the samples (Levin and Straat, 1981) and 3) the addition of water
to a sample of martian regolith unused to such high amounts of the solvent could well
have been detrimental to any microbes in the sample.
The objective of the Gas Exchange experiment (GEx) was to detect the evolution
of gases resulting from microbial activity in hydrated regolith. The GEx could detect the
following gases in both “humid” and “wet” mode: hydrogen, nitrogen, oxygen, carbon
monoxide, nitrous oxide, methane, carbon dioxide, nitric oxide, hydrogen sulfide, neon,
argon and krypton. The humid mode allowed the martian regolith to be exposed to water
Page 14
5
vapor and the wet mode exposed the sample to an aqueous mixture of metabolites (amino
acids, vitamins, salts and organic compounds) (Brown et al., 1978 and Oyama and
Berdahal, 1977). All samples were tested at a total of 200 mbar (7 mbar of martian
atmosphere plus added carbon dioxide, helium and krypton) with temperatures between
8°C and 15°C (Klein et al., 1976). Almost immediately after a 1 ml sample of regolith
was humidified a large increase in O2 was observed along with a smaller increase in CO2.
After 2.5 hours the CO2 had increased 5-fold while the O2 content had increased over
200-fold (Oyama and Berdahl, 1977). In the wet mode however, the amount of CO2 and
O2 slowly decreased over several martian sols. The aqueous solution of nutrients was
added to the samples several times and after each addition the absorption of CO2 slowed
down. This result was expected, however, since the same phenomena was observed in
pre-launch tests using sterile terrestrial soil (Oyama et al., 1976).
The rapid release of oxygen after addition of water vapor was a complete surprise
to the Viking team (Klein, 1978), as earlier experiments on Earth with terrestrial or lunar
soils yielded no such result (Oyama et al., 1976). One chemical explanation for this rapid
release of oxygen is that a peroxide or superoxide released the O2 upon addition of the
water vapor and that any carbonates or metal oxide ions the soil reacted with the water to
create a slightly basic solution which could then re-adsorb the CO2 (Klein 1978 and Klein
et al., 1976).
The final life detection experiment, the Labeled Release (LR) experiment, was the
only experiment aboard the Viking mission not to use copious amounts of water in the
sample reaction. The experiment used 14
C-labeled carbohydrates reacting with the
martian regolith to produce 14
CO2 evolved gas. Both the Krebs cycle in aerobic
Page 15
6
metabolism and the Embden-Meyerhof pathway in anaerobic metabolism can make
highly efficient use of 14
C-labeled metabolites and both can then produce 14
C-labeled
carbon dioxide (Levin et al., 1964). Briefly, about 0.5 g of regolith was placed in a closed
reaction chamber with 7 mbar of the ambient atmosphere. The chamber was then brought
to 10°C and a series of helium and nutrient (radiolabeled carbohydrates) solution
injections proceeded. The injections were about 115!l each and the pressure was about
92 mbar after the first injection and 116 mbar after the second injection. Evolved 14
CO2
gas was monitored for several sols after each injection (Levin and Straat, 1979a, 1979b).
Levin (1963) had previously shown that the Labeled Release experiment was
sensitive in detecting metabolic activity from a wide range of aerobic and anaerobic
microorganisms including Bascillus subtilis, Micrococcus spp., Staphylococcus
epidermidis and Pseudomonas spp. In fact, as little as 1-2!Ci.ml of 14
C-labeled nutrient
solution was optimum for detecting 10-12 viable bacteria per ml within 1-3 hours of
nutrient addition. Also, the increase in evolved carbon dioxide linearly corresponded to
cell density so that each doubling of cell count resulted in doubling of the counts-per-
minute (cpm) detected from the 14
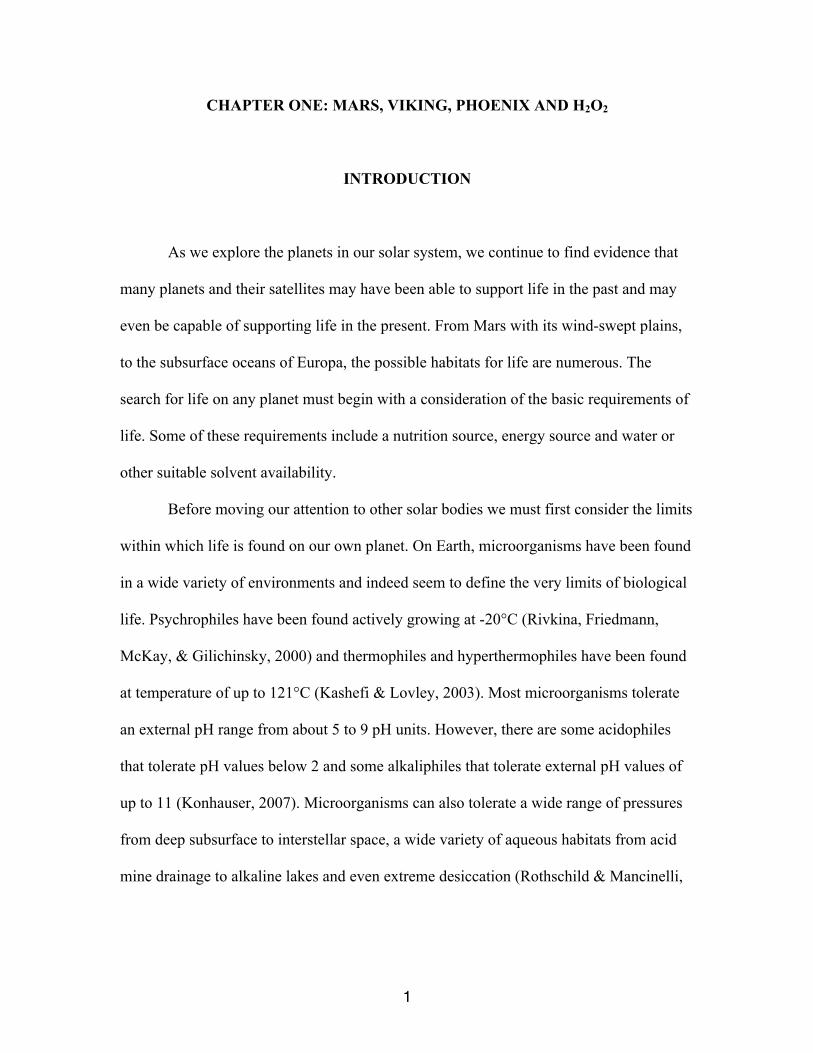
C-labeled carbon dioxide (Levin et al., 1964). Figure 2
shows the LR results from Viking Lander-1 from two samples of non-heat treated
regolith and one sample of heat-treated (160°C, 3 hours) regolith. The two active or non-
heat treated samples show the classical biological response as seen by Levin (1964) and
were taken to be evidence of biological activity in the martian regolith (Levin and Straat,
1979a, 1979b).
Page 16
7
Figure 2: Viking Lander-1 data from the Labeled Release experiment. Cycles 1 and 3
were from non-heat treated sampled while cycle 2 was heat-sterilized for 3 hours at
160°C before the assay (Levin and Straat, 1979a).
While these results were seen as the strongest support for biological activity in the
martian regolith they were also the most controversial. The objections are based on two
key points: 1) following a second injection of the labeled nutrient solution the
radioactivity decreased instead of increasing and 2) no organics were found with the
GCMS aboard the Viking (Biemann et al., 1976). Levin and Straat (1979b) responded to
the criticism involving the second nutrient injection by showing that this could have been
caused by a chemical equilibrium reaction between carbon dioxide, water and regolith in
the sample cell. As for the negative results in the GCMS organic molecule data, the same
instrument used on the Viking mission failed to detect organics in the Antarctic soil when
Page 17
8
those organics were known to be present (Levin and Straat, 1981). Still today, the LR
results are considered unverified by most of the Astrobiological community.
On the whole, many questions were left unanswered and many controversies
remained after the Viking mission to Mars. One such question relates to the nature of the
oxidant in the martian regolith (Zent and McKay, 1994; Quinn and Zent, 1999; Yen et al.,
2000; Mancinelli, 1989; Klein, 1999; Benner et al., 2000; Hurowitz et al., 2007;
Houtkooper and Schulze-Makuch, 2007). The common explanation is that H2O2 and other
strong oxidizing compounds oxidized the organic material near the surface. Based on the
reactivity of the surface measured by the Viking Gas Exchange experiment (GEx), the
amount of H2O2 on the martian surface was estimated to be between 1 ppm (Zent and
McKay, 1994) and 250 ppm (Mancinelli, 1989). Yet, photochemical processes generate
H2O2 in the atmosphere at a much lower rate, specifically in the parts per billion range.
Atmospheric H2O2 abundances vary between 20 and 40 ppb by volume over the planet
(Encrenaz et al. 2004), which appears to be a maximum concentration that occurs during
favorable weather conditions (Atreya and Gu, 1994). Several hypotheses have been
proposed to deal with this discrepancy and Nussinov et al. (1978) argued that, instead of
H2O2, oxygen gas physically trapped in soil micropores might have been responsible for
the Viking observations. Alternatively, Plumb et al. (1989) pointed out that a large
number of diverse features of the GEx and Labeled Release experiment could be
reproduced with ultraviolet-irradiated potassium nitrate. Possible oxidant reactions and
their environmental problems on Mars were summarized by Zent and McKay (1994),
who concluded that none of the hypotheses presented in the literature was free of serious
troubles, many of which have to do with the instability of putative oxidants in the
Page 18
9
presence of heat, light, or atmospheric carbon dioxide. Other objections included the
problem that the suggested hypotheses would require elaborate formation mechanisms for
which there is no evidence. Instead, Zent and McKay suggested that the results obtained
by Viking could be best explained by some kind of heterogeneous surface chemistry that
yields one or more types of oxidizing surfaces on the Martian regolith particles. Quinn
and Zent (1994) proposed that hydrogen peroxide chemisorbed on titanium dioxide may
have been responsible for the chemical reactivity seen in the Viking life detection
experiments while Yen et al. (2000) suggested superoxide ions instead of H2O2.
Alternatively, Levin and Straat (1981) and Levin (2007) argued for a biological
explanation but struggled to explain (1) the evolution of O2 upon wetting the soil, (2) the
apparent absence of organic molecules in the soil, and (3) the weakly positive results of
the single control test in the Pyrolytic Release experiment. Using a different approach,
Houtkooper and Schulze-Makuch (2007) suggested that putative martian organisms might
employ a novel biochemistry; specifically, that they could utilize a water-hydrogen peroxide
(H2O-H2O2) mixture rather than water alone as an intracellular liquid. This adaptation would
have the particular advantages of providing a low freezing point, a source of oxygen, and
hygroscopicity in the martian environment, which would allow organisms to scavenge water
molecules directly from the atmosphere, and address many of the puzzling Viking findings.
H2O2-H2O solutions are mostly known as disinfectants and sterilizing agents on Earth, but
some microbial organisms produce hydrogen peroxide (e.g., certain Streptococcus and
Lactobacillus sp.; Eschenbach et al., 1989), while other microbes utilize H2O2 (e.g.,
Neisseria sicca, Haemophilus segnis; Ryan and Kleinberg, 1995). Sensitivity to H2O2
varies drastically among microorganisms (Anders et al., 1970; Alcorn et al., 1994; Stewart
Page 19
10
et al., 2000). Reported microbial survival rates range from greater than 80 % to less than
0.001 % after exposure to 30 mM hydrogen peroxide (Alcorn et al., 1994), and at least one
organism, the microbe Acetobacter peroxidans, uses H2O2 in its metabolism (overall
reaction H2O2 (aq) + H2 (aq) " 2H2O; Tanenbaum, 1956). Mixtures of H2O2 and H2O
freeze at temperatures significantly below the freezing point of water. Indeed, The lower
eutectic point lies at -56.5oC for a mixture with 61.2 weight % H2O2
(Foley and Giguère,
1951). Also, mixtures with a high H2O2 concentration tend to super cool, which sometimes
results in the formation of glasses, down to liquid-air temperatures (Giguère, and Secco,
1954).
On Earth, microorganisms commonly use a salt-water mixture as an antifreeze.
Salts are common and readily available as they are highly soluble in the abundant water
present on Earth. Thus, organisms on Earth learned to adapt to higher salt concentrations
and use salts as antifreeze in cold environments such as in high mountain regions and the
Arctic. Bacteria have been found surviving and thriving in the salt brine pockets of frozen
wintertime sea ice in the Arctic at temperatures down to -20°C (Junge, Eicken and
Deming, 2004). On Mars, however, liquid water was never as abundant as on Earth. Even
during the wetter early martian history, liquid water bodies may not have remained
permanently on the surface. Hydrogen peroxide, however, is naturally present on Mars at
much higher concentrations than on Earth, today and probably in the past. These
inorganic concentrations are still low, much too low to explain the Viking results, but its
presence should have been sufficient to warrant biochemical adaptations. Putative
martian microorganisms might have learned to use the properties of hydrogen peroxide to
their advantage, especially as the planet dried up and became colder during its history. A
Page 20
11
comparable process occurred on Earth more than 2 billions years ago, when microbes
developed the ability to live with free oxygen and then thrive by using it in their favour
(Brocks et al., 1999, Raymond and Segre, 2006; Catling and Buick, 2006). Thus, the
antifreeze properties of hydrogen peroxide and its hygroscopic properties would become
a great advantage for making a living on the dry and cold Mars. Also, adaptation to H2O2
would require adaptation to oxidation stress (e.g., protection from protein oxidation),
which would have likely conveyed resistance to radioactivity as well (Daly et al. 2007),
another trait useful to have in the martian near-surface environment.
The NASA Mars Phoenix Mission, which finished its mission on Mars in
February of 2009, provides the unique possibility to test various hypotheses to explain the
Viking results. The Phoenix lander includes the Thermal Evolved Gas Analyzer (TEGA)
instrument, which is a combination of a high-temperature furnace and a mass
spectrometer that will be used to analyze martian ice and soil samples. Once a sample is
successfully received and sealed in the TEGA oven, temperature is slowly increased at a
constant rate up to 1000°C, and the power required for heating is carefully and
continuously monitored. This process, called scanning calorimetry, shows the transitions
from solid to liquid to gas of the different materials in the sample. We used a
complimentary technique, differential scanning calorimetry (DSC), to simulate the results
of the TEGA instrument with various solutions of hydrogen peroxide, water, martian soil
simulants and bacterial species Pseudomonas spp. and Lactococcus lactus (a hydrogen
peroxide producing organism).
Page 21
12
MATERIALS AND METHODS
Both a brief description and detailed description of the materials and methods are
included below.
BRIEF DESCRIPTION
We used differential scanning calorimetry to analyze phase transitions and
thermodynamic properties of the oxidant compounds investigated. Two thermal cells
were employed, one cell holding the reference capsule, the other the sample. A computer
control system measured the amount of heat required to increase the temperature of each
cell. If the temperature in one cell was not rising as fast as the temperature in the other
cell, the instrument sent more energy (heat) to the heating coils in that cell to maintain the
same temperature in each cell. The computer then recorded the difference between the
energy requirements for each cell. The resulting graph (thermogram) of temperature
versus energy difference between the two cells displays a peak whenever a phase
transition occurred. The area under a positive peak (peak area) represents the energy
required for the transition (enthalpy of the reaction, !H), thus any positive peaks are
representative of endothermic reactions, while negative peaks are representative of
exothermic reactions. The onset of a peak usually corresponds to the melting or
evaporation temperature of a tested substance. If the weight of the sample is known, then
Page 22
13
the Differential Scanning Calorimeter (DSC) can calculate the energy required per gram
of sample (J/g) for the transition. In an exothermic process, less heat would be required
by the sample than by the reference cell to keep a steady change in temperature. In this
case, the resulting peak on the thermogram is a negative peak. The heat of the phase
change can be adsorbed or released depending on the change in specific heat
characteristics of each phase.
Sample compounds investigated included millipure water, 17.5% and 35 %
hydrogen peroxide solution, 99.9% pure Fe2O3, 99.9% pure TiO2, tetrasodium
pyrophosphate (Na4P2O7), phenacetin (C10H13NO2), quartz sand, JSC-1 martian regolith
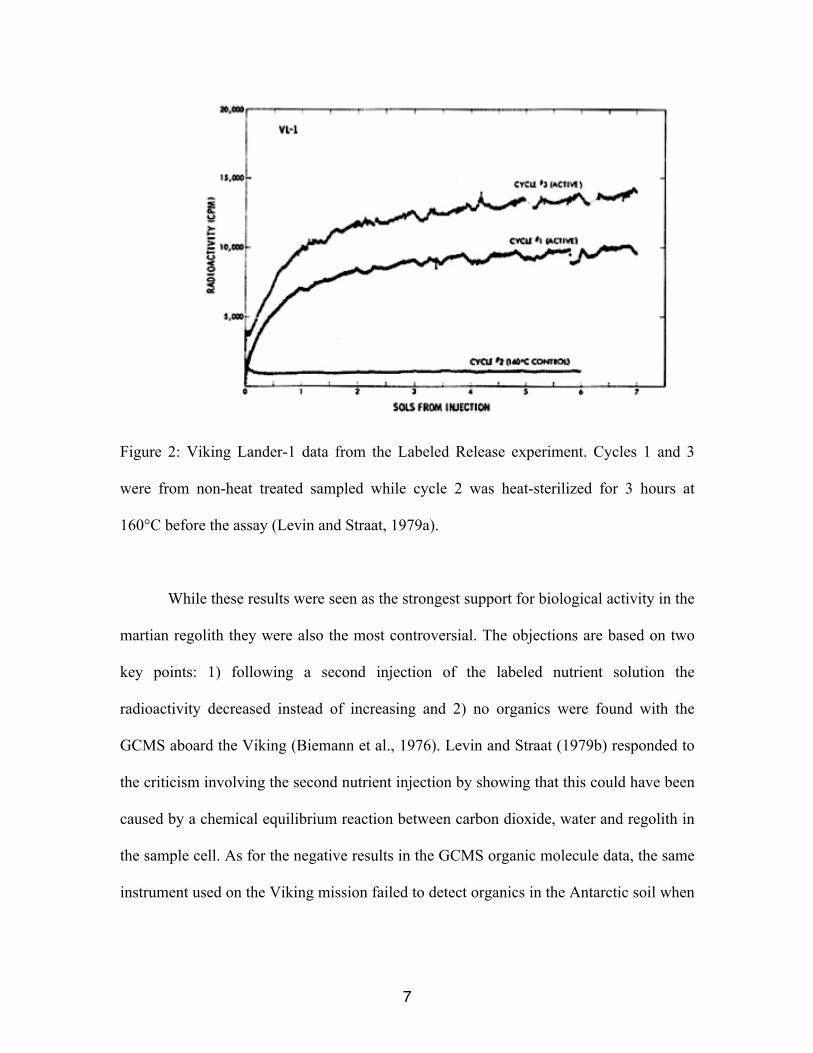
simulant soil, and combinations thereof. Na4P2O7 and phenacetin are stabilizers of H2O2
(Fig. 3) and were included in the test set because, if the martian H2O2 is mostly of
biological nature, a chemical stabilizer has to be invoked to control the reactivity of the
hydrogen peroxide.
Figure 3: Structural formula of chemical stabilizers of hydrogen peroxide, a. sodium
pyrophosphate, b. phenacetin .
Page 23
14
Other potential chemical stabilizers for H2O2 solutions include sodium silicate
(Na2SiO3), poly(#)hydroxyacrylic acid, phytate, citrate, and malonate (Charron et al.,
2006; Watts et al., 2007). Tetrasodium pyrophosphate was chosen here due to its
simplicity, efficacy (e.g., common use in commercial applications), and its similarity to
ATP. Phenacetin was chosen due to its demonstrated long-term (> 3 months)
effectiveness to keep hydrogen peroxide stable (Madanská et al., 2004). The martian
regolith simulant is the <1mm fraction of weathered volcanic ash from Pu’u Nene, a
cinder cone on the island of Hawaii, and was provided by the Johnson Space Center. We
also tested two bacterial cultures: Lactococcus lactis subsp. lactis, which has been shown
to produce hydrogen peroxide concentrations up to a level of about 350 ppm (Ito et al.,
2003), and Pseudomonas sp., a non-hydrogen peroxide producing bacterium.
Lactococcus lactis subsp. lactis bacteria were obtained from the American Type Culture
Collection (ATCC #11454, Manassas, VA) and were propagated according to standard
procedures. Briefly, the freeze-dried pellet was rehydrated in 1.0mL of ATCC#17 broth
and then added to 5.0mL of ATCC#17 broth in a 50mL conical tube. The resulting
mixture was incubated at 37°C with shaking for 24 hours. Pseudomonas sp., cultured
from a single colony from an agar plate, was resuspended in 5mL of sterile Tryptic Soy
Broth (TSB, Difco #211825) in a sterile 50mL conical tube and incubated at 37°C with
shaking for 24 hours.
Page 24
15
The scanning rate of the DSC was set at 10oC per minute, and the sample amount
used was 10 to 20 mg to simulate the thermograms that will be obtained by the TEGA
instrument on Mars. Samples were put in standard 20 µl aluminum sample pans with
covers and sealed with the standard sample pan crimper press. Each pan was fully loaded
and weighted before and after the addition of the sample. The sample preparation was
completed in less than 5 minutes, since it was observed that the hydrogen peroxide
started to decompose under atmospheric conditions within 40 min, which affected some
of the thermograms by not showing an exothermic peak (Figure 4). All data from the 20
minute and 40 minute DSC run were still saved in the archive files. An indium standard
was used to calibrate the DSC and a baseline run with the use of an empty aluminum pan
was conducted prior to each sample run. The DSC was programmed to automatically
subtract each baseline run from the sample run.
Figure 4: Example of 35% hydrogen peroxide thermogram exposed to the air for 40
minutes before commencing sample run.
0
50
100
150
200
250
300
350
400
450
500
0 50 100 150 200 250
Hea
t F
low
, m
W
Temperature, °C
35% Hydrogen Peroxide, 40 minutes
Page 25
16
MATERIALS AND METHODS
DETAILED DESCRIPTION
All DSC spectra were processed on a Perkin Elmer (Perkin Elmer, Waltham, MA
USA) DSC 7 (Differential Scanning Calorimeter) instrument using the standard thermal
analysis DSC 7 program. Two different types of sample pans were used in the analysis;
the aluminum 20!l volatile two-piece pans (Perkin Elmer #02190062), which were
sealed using the Perkin Elmer volatile sealer assembly (Perkin Elmer #02190061) and the
standard aluminum sample pans with covers (Perkin Elmer #02190041) which were
sealed using the standard sample pan crimper press (Perkin Elmer #02190048). Each pan
was loaded up to the maximum amount of sample (20!l or 20mg) using a Labmate P20
pipette for the volatile samples and a stainless steel micro-spatula for the solid samples.
Pans were weighed before and after the addition of sample so that a milligram weight
could be determined for each sample. A baseline run using an empty aluminum pan of the
appropriate type was used for each DSC run and an indium standard was used to calibrate
the DSC 7 at the beginning of each day. All baseline files were automatically subtracted
from the sample runs according to the parameters below. Independent replicates were run
of each sample on separate days and samples were not re-used.
Reference Standards Parameters:
Each day before sample collection on the DSC 7, an indium standard was run and
used to check the status of the instrument. Indium run parameters are shown below in
Page 26
17
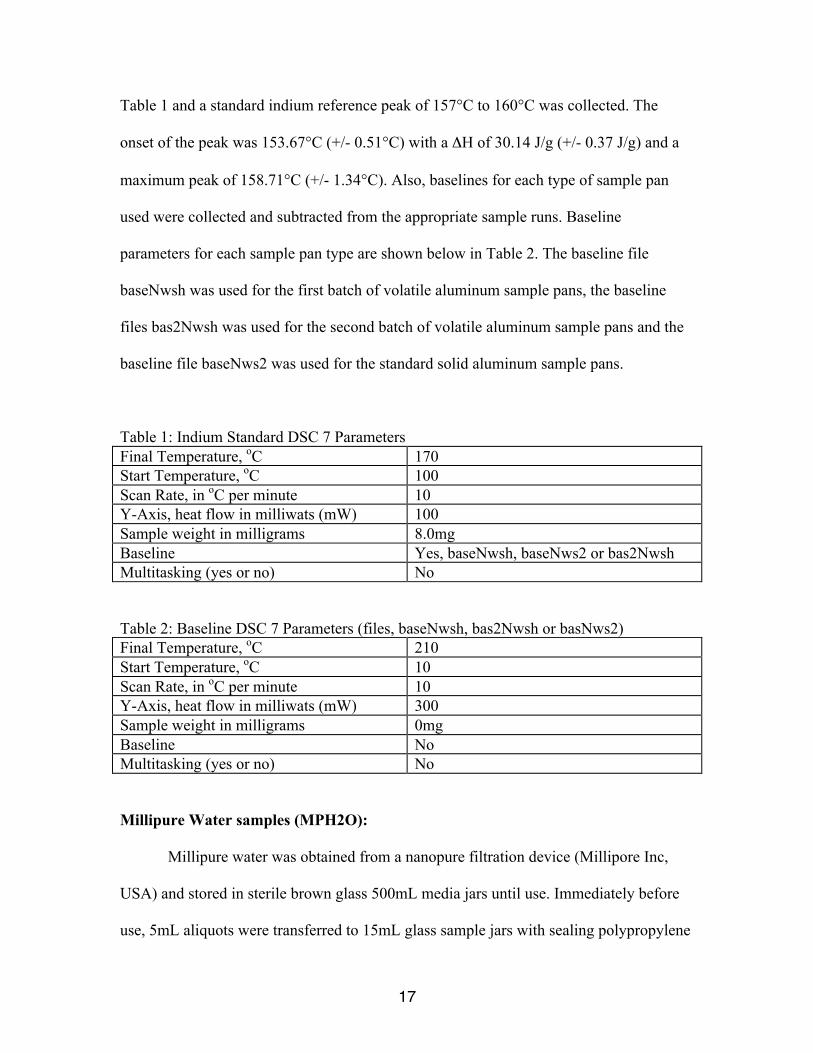
Table 1 and a standard indium reference peak of 157°C to 160°C was collected. The
onset of the peak was 153.67°C (+/- 0.51°C) with a !H of 30.14 J/g (+/- 0.37 J/g) and a
maximum peak of 158.71°C (+/- 1.34°C). Also, baselines for each type of sample pan
used were collected and subtracted from the appropriate sample runs. Baseline
parameters for each sample pan type are shown below in Table 2. The baseline file
baseNwsh was used for the first batch of volatile aluminum sample pans, the baseline
files bas2Nwsh was used for the second batch of volatile aluminum sample pans and the
baseline file baseNws2 was used for the standard solid aluminum sample pans.
Table 1: Indium Standard DSC 7 Parameters
Final Temperature, oC 170
Start Temperature, oC 100
Scan Rate, in oC per minute 10
Y-Axis, heat flow in milliwats (mW) 100
Sample weight in milligrams 8.0mg
Baseline Yes, baseNwsh, baseNws2 or bas2Nwsh
Multitasking (yes or no) No
Table 2: Baseline DSC 7 Parameters (files, baseNwsh, bas2Nwsh or basNws2)
Final Temperature, oC 210
Start Temperature, oC 10
Scan Rate, in oC per minute 10
Y-Axis, heat flow in milliwats (mW) 300
Sample weight in milligrams 0mg
Baseline No
Multitasking (yes or no) No
Millipure Water samples (MPH2O):
Millipure water was obtained from a nanopure filtration device (Millipore Inc,
USA) and stored in sterile brown glass 500mL media jars until use. Immediately before
use, 5mL aliquots were transferred to 15mL glass sample jars with sealing polypropylene
Page 27
18
lids. The 20!l portions were then transferred from the sample jar to the volatile aluminum
sample pans using a P100 pipet. The pans were sealed using the volatile sealer assembly.
The sample pan was then placed directly into the DSC 7 and run with the parameters
below in Table 3. The water sample was exposed to the atmosphere for no more than 5
minutes during the preparation.
Table 3: MP H2O DSC 7 Parameters:
Final Temperature, oC 150
Start Temperature, oC 20
Scan Rate, in oC per minute 10
Y-Axis, heat flow in milliwats (mW) 320
Sample weight in milligrams Varies per sample between 12-22mg
Baseline Yes, file = baseNwsh, volatile pan
Multitasking (yes or no) No
35% Hydrogen Peroxide samples (35% H2O2):
35% Hydrogen Peroxide, 500mL, was obtained from the Acros Organics
Chemical Company (catalogue #202465000) and stored in a 500mL sterile brown glass
media jar at +4oC until use. Immediately before use, small aliquots (5-10mL) were
transferred to 15mL glass sample jars with sealing polypropylene lids. Fresh samples
were exposed to the atmosphere for no more than 5 minutes. For the samples reacted with
the atmosphere, the 35% hydrogen peroxide was allowed to sit in the sterile glass sample
jar with the lid removed for 20 or 40 minutes. The samples indicated as “fresh” were
transferred from the 15mL glass sample jar to the volatile aluminum samples pans using a
P100 pipet (20!l portions) and sealed using the volatile sealer assembly. The sample pans
were then placed directly into the DSC 7 and run using the parameters below in Table 4.
The 20 minute and 40 minute samples were prepared and run in the same manner except
Page 28
19
they were allowed to sit in the glass sample jar with the lid off for either 20 or 40
minutes.
Table 4: 35% H2O2 DSC 7 Parameters:
Final Temperature, oC 200
Start Temperature, oC 20
Scan Rate, in oC per minute 10
Y-Axis, heat flow in milliwats (mW) 200
Sample weight in milligrams Varies per sample between 12-22mg
Baseline Yes, file = baseNwsh or bas2Nwsh,
volatile pan
Multitasking (yes or no) No
17.5% Hydrogen Peroxide (17.5% H2O2):
The 17.5% hydrogen peroxide solution was made by combining 4mL of the 35%
hydrogen peroxide mentioned above with 4mL of the millipure water with mixing into q
15mL glass sample jar with sealing polypropylene lid. The solution was used
immediately (fresh sample, up to 5 minutes to prepare) or was exposed to the atmosphere
for 20 or 40 minutes. The samples indicated as “fresh” were transferred from the 15mL
glass sample jar to the volatile aluminum samples pans using a P100 pipet (20!l portions)
and sealed using the volatile sealer assembly. The sample pans were then placed directly
into the DSC 7 and run using the parameters below in Table 5. The 20 minute and 40
minute samples were prepared and run in the same manner except they were allowed to
sit in the glass sample jar with the lid off for either 20 or 40 minutes.
Table 5: 17.5% H2O2 DSC 7 Parameters:
Final Temperature, oC 200
Start Temperature, oC 20
Scan Rate, in oC per minute 10
Y-Axis, heat flow in milliwats (mW) 200
Sample weight in milligrams Varies per sample between 12-22mg
Baseline Yes, file = baseNwsh or bas2Nwsh,
volatile pan
Multitasking (yes or no) No
Page 29
20
35% Hydrogen Peroxide with 10% (w/v) Tetrasodium Pyrophosphate, anhydrous
(35% H2O2/10% NaPPi)
One gram of tetrasodium pyrophosphate or sodium pyrophosphate (anhydrous,
NaPPi) was obtained from Sigma-Aldrich Chemical Company (catalogue #P-8010) and
combined with 9.0mL of the 35% hydrogen peroxide with stirring to obtain a final
concentration of 10% NaPPi in a sealed 15mL glass jar with sealing polypropylene lid.
The samples indicated as “fresh” were transferred from the 15mL glass sample jar to the
volatile aluminum samples pans using a P100 pipet (20!l portions) and sealed using the
volatile sealer assembly. The sample pans were then placed directly into the DSC 7 and
run using the parameters below in Table 6. The 20 minute and 40 minute samples were
prepared and run in the same manner except they were allowed to sit in the glass sample
jar with the lid off for either 20 or 40 minutes.
Table 6: 35% H2O2/10%NaPPi DSC 7 Parameters:
Final Temperature, oC 200
Start Temperature, oC 20
Scan Rate, in oC per minute 10
Y-Axis, heat flow in milliwats (mW) 200
Sample weight in milligrams Varies per sample between 12-22mg
Baseline Yes, file = baseNwsh or bas2Nwsh,
volatile pan
Multitasking (yes or no) No
JSC-1 Martian Analog Soil Samples
A 200 g aliquot of JSC-1 Martian regolith simulant was obtained from the NASA
Johnson Space Center through Dr. Carlton C. Allen. JSC-1 samples were run with the
soil alone, with 10% Millipure water, (from above) with 10%, 35% hydrogen peroxide
(from above), with 10%, 17.5% hydrogen peroxide (above) or with 10% of the 35%
Page 30
21
hydrogen peroxide/10% sodium pyrophosphate mixture (from above). The JSC-1 soil
samples were run using the standard aluminum sample pans and covers, with a stainless
steel micro-spatula used to transfer the soil from the glass sample jar to the sample pan.
The standard aluminum sample pans were sealed using the standard pan crimper press
and then placed immediately into the DSC-7 and run according to the parameters below.
All mixtures were prepared as before in 15mL glass sample jars with sealing
polypropylene lids. Mixing was achieved with a glass stir rod. All samples were used
“fresh” and were allowed to react with the atmosphere for no more than 5 minutes.
Samples were transferred from the 15mL glass sample jars to the standard solid
aluminum sample pans using a stainless steel micro-spatula and were then sealed using
the standard sample pan crimper press. The sample pans were placed immediately into
the DSC-7 and run according to the parameters in table 7.
Table 7: JSC-1 Soil Simulant DSC-7 Parameters:
Final Temperature, oC 200
Start Temperature, oC 20
Scan Rate, in oC per minute 10
Y-Axis, heat flow in milliwats (mW) 200
Sample weight in milligrams Varies per sample between 16-25mg
Baseline Yes, file = baseNws2, solid pan
Multitasking (yes or no) No
Quartz Samples
The crystalline silica (quartz) used for the quartz samples was obtained from
Quikrete ® (Quikrete Play Sand, Premium 22.7kg, catalogue #1113). Quartz samples
were run with the quartz alone, with 10% Millipure water, (from above) with 10%, 35%
hydrogen peroxide (from above), with 10%, 17.5% hydrogen peroxide (above) or with
10% of the 35% hydrogen peroxide/10% sodium pyrophosphate mixture (from above).
Page 31
22
The quartz samples were run using the standard aluminum sample pans and covers, with
a stainless steel micro-spatula used to transfer the quartz from the glass sample jar to the
sample pan. The standard aluminum sample pans were sealed using the standard pan
crimper press and then placed immediately into the DSC-7 and run according to the
parameters below. All mixtures were prepared as before in 15mL glass sample jars with
sealing polypropylene lids. Mixing was achieved with a glass stir rod. All samples were
used “fresh” and were allowed to react with the atmosphere for no more than 5 minutes.
Samples were transferred from the 15mL glass sample jars to the standard solid
aluminum sample pans using a stainless steel micro-spatula and were then sealed using
the standard sample pan crimper press. The sample pans were placed immediately into
the DSC-7 and run according to the parameters in table 8.
Table 8: Quartz Sand DSC-7 Parameters
Final Temperature, oC 200
Start Temperature, oC 20
Scan Rate, in oC per minute 10
Y-Axis, heat flow in milliwats (mW) 200
Sample weight in milligrams Varies per sample between 19-25mg
Baseline Yes, file = baseNws2, solid pan
Multitasking (yes or no) No
Iron (III) Oxide Samples
The iron (III) oxide (anhydrous) was obtained from Fisher Chemicals (catalogue
#I116-500). Iron oxide samples were run with the chemical alone, with 10% Millipure
water, (from above) with 10%, 35% hydrogen peroxide (from above), with 10%, 17.5%
hydrogen peroxide (above) or with 10% of the 35% hydrogen peroxide/10% sodium
pyrophosphate mixture (from above). The iron oxide samples were run using the standard
aluminum sample pans and covers, with a stainless steel micro-spatula used to transfer
Page 32
23
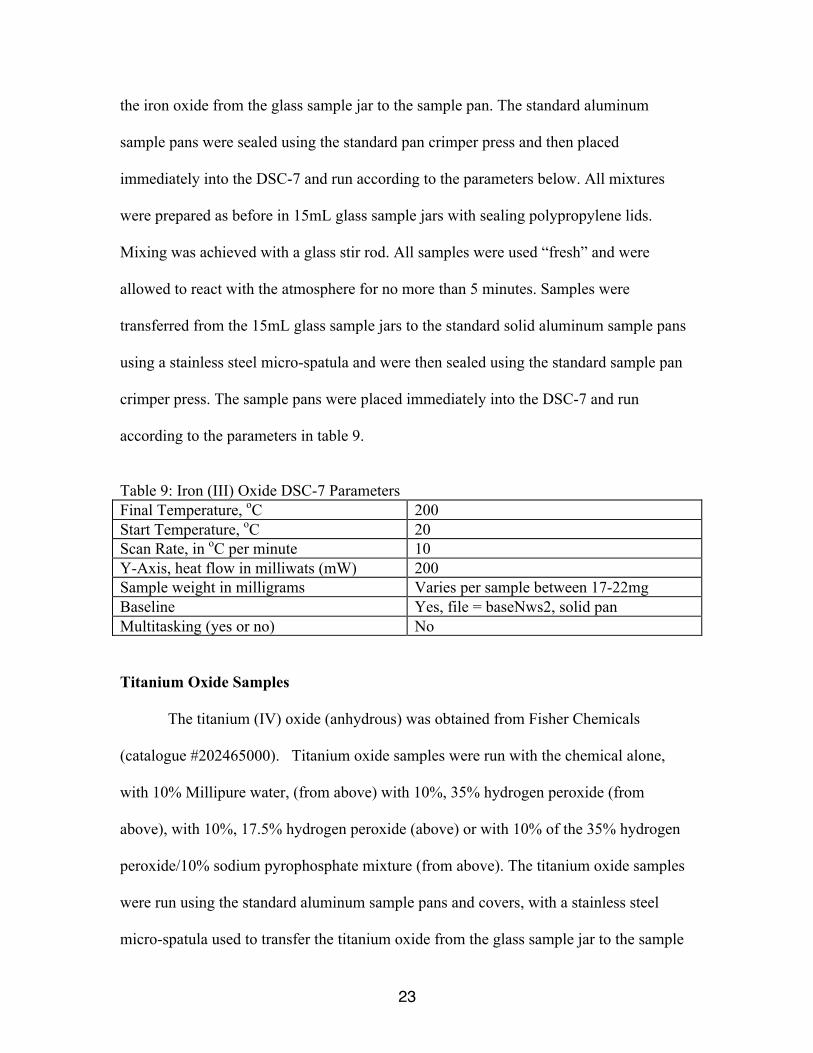
the iron oxide from the glass sample jar to the sample pan. The standard aluminum
sample pans were sealed using the standard pan crimper press and then placed
immediately into the DSC-7 and run according to the parameters below. All mixtures
were prepared as before in 15mL glass sample jars with sealing polypropylene lids.
Mixing was achieved with a glass stir rod. All samples were used “fresh” and were
allowed to react with the atmosphere for no more than 5 minutes. Samples were
transferred from the 15mL glass sample jars to the standard solid aluminum sample pans
using a stainless steel micro-spatula and were then sealed using the standard sample pan
crimper press. The sample pans were placed immediately into the DSC-7 and run
according to the parameters in table 9.
Table 9: Iron (III) Oxide DSC-7 Parameters
Final Temperature, oC 200
Start Temperature, oC 20
Scan Rate, in oC per minute 10
Y-Axis, heat flow in milliwats (mW) 200
Sample weight in milligrams Varies per sample between 17-22mg
Baseline Yes, file = baseNws2, solid pan
Multitasking (yes or no) No
Titanium Oxide Samples
The titanium (IV) oxide (anhydrous) was obtained from Fisher Chemicals
(catalogue #202465000). Titanium oxide samples were run with the chemical alone,
with 10% Millipure water, (from above) with 10%, 35% hydrogen peroxide (from
above), with 10%, 17.5% hydrogen peroxide (above) or with 10% of the 35% hydrogen
peroxide/10% sodium pyrophosphate mixture (from above). The titanium oxide samples
were run using the standard aluminum sample pans and covers, with a stainless steel
micro-spatula used to transfer the titanium oxide from the glass sample jar to the sample
Page 33
24
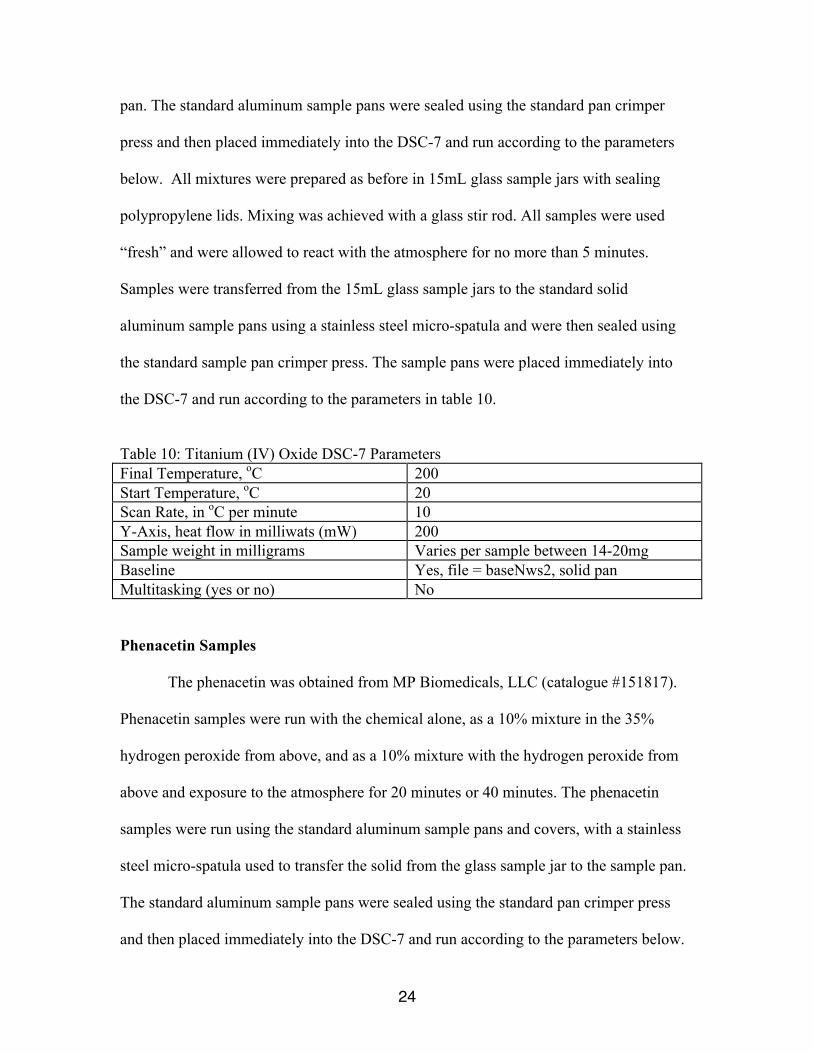
pan. The standard aluminum sample pans were sealed using the standard pan crimper
press and then placed immediately into the DSC-7 and run according to the parameters
below. All mixtures were prepared as before in 15mL glass sample jars with sealing
polypropylene lids. Mixing was achieved with a glass stir rod. All samples were used
“fresh” and were allowed to react with the atmosphere for no more than 5 minutes.
Samples were transferred from the 15mL glass sample jars to the standard solid
aluminum sample pans using a stainless steel micro-spatula and were then sealed using
the standard sample pan crimper press. The sample pans were placed immediately into
the DSC-7 and run according to the parameters in table 10.
Table 10: Titanium (IV) Oxide DSC-7 Parameters
Final Temperature, oC 200
Start Temperature, oC 20
Scan Rate, in oC per minute 10
Y-Axis, heat flow in milliwats (mW) 200
Sample weight in milligrams Varies per sample between 14-20mg
Baseline Yes, file = baseNws2, solid pan
Multitasking (yes or no) No
Phenacetin Samples
The phenacetin was obtained from MP Biomedicals, LLC (catalogue #151817).
Phenacetin samples were run with the chemical alone, as a 10% mixture in the 35%
hydrogen peroxide from above, and as a 10% mixture with the hydrogen peroxide from
above and exposure to the atmosphere for 20 minutes or 40 minutes. The phenacetin
samples were run using the standard aluminum sample pans and covers, with a stainless
steel micro-spatula used to transfer the solid from the glass sample jar to the sample pan.
The standard aluminum sample pans were sealed using the standard pan crimper press
and then placed immediately into the DSC-7 and run according to the parameters below.
Page 34
25
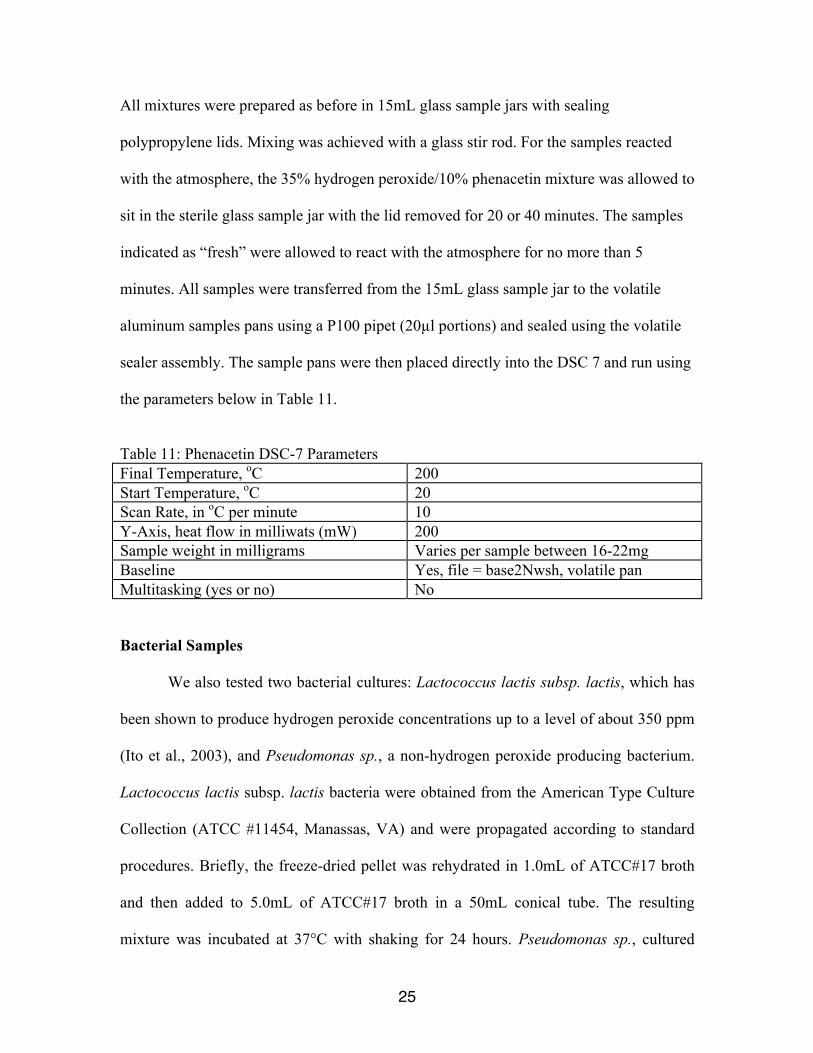
All mixtures were prepared as before in 15mL glass sample jars with sealing
polypropylene lids. Mixing was achieved with a glass stir rod. For the samples reacted
with the atmosphere, the 35% hydrogen peroxide/10% phenacetin mixture was allowed to
sit in the sterile glass sample jar with the lid removed for 20 or 40 minutes. The samples
indicated as “fresh” were allowed to react with the atmosphere for no more than 5
minutes. All samples were transferred from the 15mL glass sample jar to the volatile
aluminum samples pans using a P100 pipet (20!l portions) and sealed using the volatile
sealer assembly. The sample pans were then placed directly into the DSC 7 and run using
the parameters below in Table 11.
Table 11: Phenacetin DSC-7 Parameters
Final Temperature, oC 200
Start Temperature, oC 20
Scan Rate, in oC per minute 10
Y-Axis, heat flow in milliwats (mW) 200
Sample weight in milligrams Varies per sample between 16-22mg
Baseline Yes, file = base2Nwsh, volatile pan
Multitasking (yes or no) No
Bacterial Samples
We also tested two bacterial cultures: Lactococcus lactis subsp. lactis, which has
been shown to produce hydrogen peroxide concentrations up to a level of about 350 ppm
(Ito et al., 2003), and Pseudomonas sp., a non-hydrogen peroxide producing bacterium.
Lactococcus lactis subsp. lactis bacteria were obtained from the American Type Culture
Collection (ATCC #11454, Manassas, VA) and were propagated according to standard
procedures. Briefly, the freeze-dried pellet was rehydrated in 1.0mL of ATCC#17 broth
and then added to 5.0mL of ATCC#17 broth in a 50mL conical tube. The resulting
mixture was incubated at 37°C with shaking for 24 hours. Pseudomonas sp., cultured
Page 35
26
from a single colony from an agar plate, was resuspended in 5mL of sterile Tryptic Soy
Broth (TSB, Difco #211825) in a sterile 50mL conical tube and incubated at 37°C with
shaking for 24 hours.
All samples used were allowed to react with the atmosphere for no more
than 5 minutes. Samples were transferred from the 50mL conical tube to the standard
solid aluminum sample pans using a Labmate P20 (20!l) and were then sealed using the
standard sample pan crimper press. The sample pans were placed immediately into the
DSC-7 and run according to the parameters in table 12.
Table 12: Bacterial Sample DSC-7 Parameters
Final Temperature, oC 200
Start Temperature, oC 20
Scan Rate, in oC per minute 10
Y-Axis, heat flow in milliwats (mW) 200
Sample weight in milligrams Varies per sample between 16-21mg
Baseline Yes, file = baseNws2, solid pan
Multitasking (yes or no) No
Data Analysis
All sample data files were saved on the Perkin Elmer DSC-7 as text files and then
transferred to Microsoft Excel and converted into Excel files and all paper copies of the
run parameters were saved in a three-ring binder. As discussed above, all baseline files
were automatically subtracted from the sample runs, however, the heat flow raw data
from the text files must be manually corrected due to a “shift” that occurs when the raw
data is saved on disk from the DSC-7 and then imported to Excel. The manual correction
involves recording up to seven temperature and associated heat flow (value = Y) values
from the DSC-7 sample run. These values are recorded in the Excel spreadsheet along
with the Excel heat flow (value = Y1) values corresponding to the recorded DSC-7
Page 36
27
temperature values. The correction value is calculated by dividing the Y values (DSC-7
heat flow values) by the Y1 values (Excel heat flow values). These corrected heat flow
(mW) values are then averaged together. The Excel heat flow values are then divided by
the average heat flow value (corrected). This results in a corrected heat flow (mW) value
that can them be graphed with the corresponding temperature (°C) values. All values for
the heat of decomposition were taken directly from the areas of the curves (or negative
curves) on the DSC-7 read-out. Readings were recorded as J/g and then converted to
kJ/mol for comparison to theoretical values.
Page 37
28
RESULTS
The thermograms of various solutions of different concentrations of hydrogen peroxide
are shown in Figure 5. This group of thermograms was used to determine the limit of
detection of hydrogen peroxide using the DSC-7. The graph shows that a range of
concentrations was successfully detected from 70 ppm (.007%) to 438 ppm (.04%) but
the sharpest thermogram peak was observed at the 368 ppm (about .04%) concentration.
Figure 5: Various concentrations of hydrogen peroxide (ppm) used to determine the limit
of detection of hydrogen peroxide solutions on the DSC-7.
The thermograms of the various compounds and solutions of hydrogen peroxide with and
without the chemical stabilizers are shown in Figures 6 through 11 below. Any
0
20
40
60
80
100
120
0 50 100 150 200
Hea
t F
low
, m
W
Temperature, °C
Hydrogen Peroxide Limit of Detection 70ppm
H2O2 88ppm
123ppm
193ppm
875ppm
325ppm
368ppm
438ppm
Page 38
29
differences observed in peaks, ranges, and energies in duplicate runs (Fig. 6-11) were a
function of the total amount of solutes used in the DSC and due to instrument variation.
Figure 6: Millipure water thermogram with a peak value of 114°C (+/- 3°C). The peak
ranged from 80°C (+/- 1°C) to 117°C (+/- 3°C) and the peak area was 1403 J/g (+/- 105
J/g).
Page 39
30
Figure 7: 17.5% Hydrogen peroxide solution thermogram with a peak value of 117°C
(+/- 3°C). The peak area was 1270 J/g (+/- 0.2 J/g) with the peak ranging from 68°C (+/-
4) to 123°C (+/- 2°C). The solution also exhibited a small negative peak at 123°C (+/-
1°C) with an area of –7 J/g (+/- 0.3°C).
Page 40
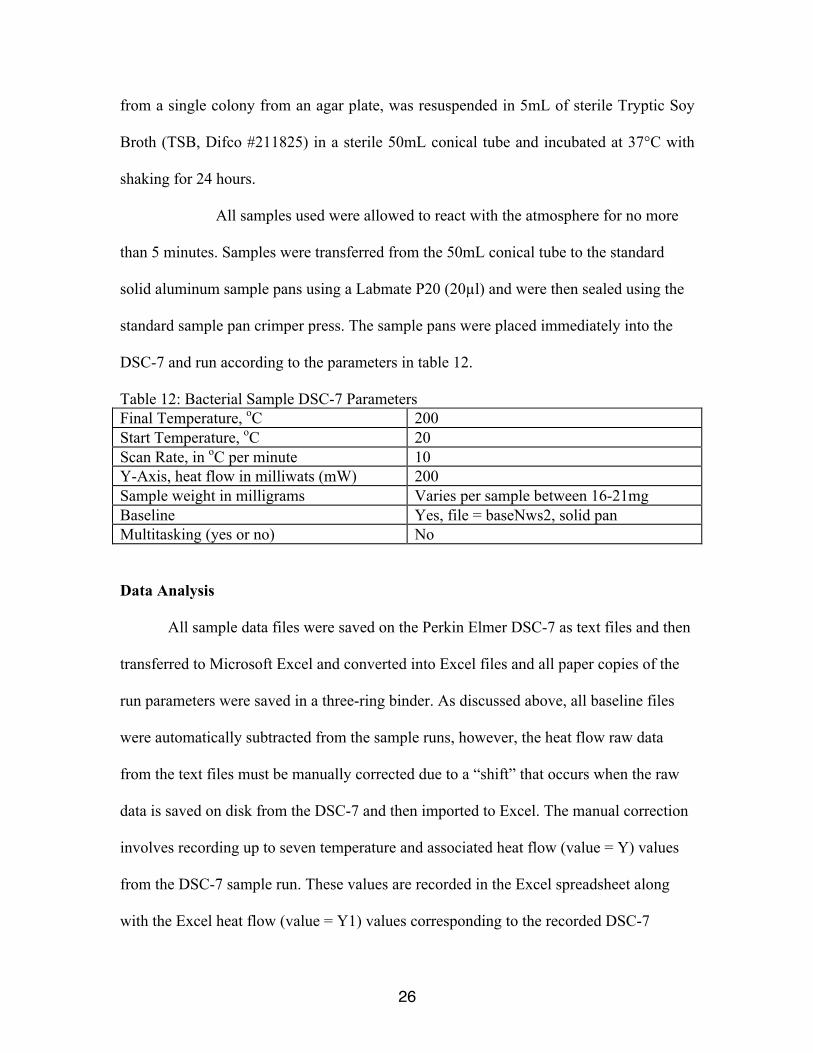
31
Figure 8: 35% Hydrogen peroxide solution thermogram with a peak value of 101oC (+/-
1°C). The peak ranged from 52oC (+/-1) to 117
oC +/-1). The negative peak is at 117
oC
(+/-1°C) with an area of -27J/g (+/- 5J/g).
Page 41
32
Figure 9: 35% Hydrogen peroxide solution thermogram with sodium pyrophosphate at a
ratio of 9 to 1. The thermogram revealed a large exothermic peak at about 86oC with an
area of –103 J/g (+/- 71 J/g). The main peak had a value of 97°C (+/- 3°C), a range from
87°C (+/- 0.5°C) to 107°C (+/- 6°C) and an area of 874 J/g (+/- 570 J/g).
Page 42
33
Figure 10: The phenacetin thermogram revealed a single peak at 133°C (+/- 1°C) with an
area under the curve of 173 J/g (+/- 8 J/g).
Page 43
34
Figure 11: 35 % hydrogen peroxide solution with 10 % phenacetin thermogram. The peak
was at 108°C (+/- 1°C) with a range of 61°C (+/- 3°C) to 118°C (+/- 1°C) and an area
under the curve of 785 J/g (+/- 37 J/g). The phenacetin peak appears as a minor peak at a
value of 131°C (+/- 1°C) with an area of 4 J/g (+/- 1 J/g). The solution also displayed
again a small negative peak at 118°C (+/- 1°C) characteristic for the exothermic reaction
of H2O2 with an area under the curve of –8 J/g (+/- 1 J/g).
The millipure water (Fig. 6) revealed a behavior characteristic of the phase
transition from liquid water to water vapor with a peak at about 110oC. The 17.5 %
hydrogen peroxide solution revealed a very similar behavior to pure water, but also
exhibited a small negative peak at 123°C (Fig. 7). This negative peak was more
pronounced when using a 35 % hydrogen peroxide solution (Fig. 8). The area under the
large positive (endothermic) peak of the 35 % hydrogen peroxide solution is 1.096 kJ/g
+/- 0.31 kJ/g. A solution of 35% hydrogen peroxide with tetra sodium pyrophosphate at a
Page 44
35
ratio of 9:1 revealed a very different pattern (Fig. 9). It produced a strong exothermic
response at about 80oC and a large endothermic peak close to 100
oC. The thermogram of
the chemical stabilizer phenacetin reveals a characteristic single peak at about 132°C
(Fig. 10), which is revealed as well in the thermogram of the 35 % hydrogen peroxide
solution when phenacetin was added at a 9:1 mass ratio of 35% H2O2 to phenacetin (Fig.
11). The phenacetin peak appears at a value of 131°C for the hydrogen peroxide solution,
while the main peak correlates to 108°C. The thermogram displays again a small negative
peak at 118°C. Thermograms at slower scan rates were also produce (Figure 12).
Figure 12: 35% hydrogen peroxide and 35% hydrogen peroxide with 10% tetra
sodium pyrophosphate run at a scan rate of 2°C per minute. The sodium pryophosphate
solutions had negative peaks at 74°C and 86°C respectively, while the 35% hydrogen
peroxide gave a negative peak at 123°C.
0
100
200
300
400
500
600
700
800
0 50 100 150 200 250
35% Hydrogen Peroxide Solutions, 2°C Scan Rate
35% Hydrogen Peroxide + 10% (w/v) Sodium Pyrophosphate 1, 15.4mg
35% Hydrogen Peroxide + 10% (w/v) Sodium Pyrophosphate 2, 22.3mg
35% Hydrogen Peroxide, 21.5mg
Page 45
36
In the next set of sampling runs, various soil media and metal oxides were
exposed to the previously tested solutions (Figures 13-16 below). The soil media
included JSC-1 Mars analog soil and quartz sand while the metal oxides used were iron
(III) oxide and titanium (IV) oxide.
Figure 13: Thermogram of quartz sand and quartz sand solutions. The first peaks appear at
a value of 44!C (+/- 4!C) with a range of 35!C (+/- 6!C) to 50!C (+/- 9!C) and a peak area
of 8 J/g (+/- 1 J/g). The second, larger peaks have a value of 77!C (+/- 5!C) with a range
from 45!C (+/- 1!C) to 91!C (+/- 6!C) and a peak area of 117 J/g (+/- 21 J/g). A sharp
phenacetin peak is observed at 132!C for the hydrogen peroxide solution with 10 %
phenacetin.
Page 46
37
Figure 14: JSC-1 Mars stimulant soil and solutions thermogram. The first peaks appear at a
value of 41!C (+/- 1!C) with a range from 35!C (+/- 1!C) to 46!C (+/- 1!C) and a peak area
of 9 J/g (+/- 2 J/g). The second, larger peaks average at a value of 92!C (+/- 2!C) with a
range from 55!C (+/- 6!C) to 120!C (+/- 8!C) and a peak area of 224 J/g (+/- 47 J/g). The
phenacetin peak is again observed at a value of 132!C, but smaller in magnitude.
0
10
20
30
40
50
60
70
80
90
100
0 50 100 150 200 250
Hea
t F
low
, m
W
Temperature, °C
JSC-1 Mars Analog Soil
JSC-1 Mars
Analog Soil, 23.1mg
90% JSC-1 Soil +
10% (w/v) Milipure Water,
17.3mg
90% JSC-1 Soil +
10% (w/v) 17.5% H2O2, 20.2mg
90% JSC-1 Soil +
10% (w/v) 35% H2O2, 24.6
90% JSC-1 Soil +
10% (w/v) 35% H2O2/10% NaPPi,
19.3mg
70% JSC-1 Soil +
30%, 35% H2O2 + 10% Phenacetin,
21.4mg
Page 47
38
Figure 15: Titanium (IV) oxide and solutions thermogram. The first peaks have a value of
42!C (+/- 1!C) with a range from 35!C (+/- 4!C) to 46!C (+/- 1!C) and a peak area of 6 J/g
(+/- 3 J/g). The second, larger peaks show much variation with a range from 62!C (+/-
16!C) to 90!C (+/- 9!C) and an average peak area of 69 J/g (+/- 41 J/g). The phenacetin
peak is observed again at a value of 127!C.
Page 48
39
Figure 16: Iron (III) oxide and solutions thermogram. The first peaks have a value of 41!C
(+/- 3!C) with a range from 37!C (+/- 4!C) to 47!C (+/- 3!C) and a peak area of 7 J/g (+/- 4
J/g). The second, larger peaks vary largely with a range from 49!C (+/- 6!C) to 85!C (+/-
11!C) and an average peak area of 146 J/g (+/- 49 J/g). The phenacetin peak is observed at a
value of 130!C.
When the mass ratio of the phenacetin spiked hydrogen peroxide solution was
lowered to 10 % of the mass fraction of the soil (phenacetin ~ 1 % of the total mass of the
soil), the signature of the phenacetin was too small to be unambiguously identified in the
JSC-1 soil and the metal oxides tested (Figure 17).
Page 49
40
Figure 17: Thermograms with phenacetin at 10% the mass fraction of the media tested.
JSC-1 soil + 10% (35% hydrogen peroxide +10% sodium pyrophosphate), peak =
93.13°C (+/- 1°C).
The two bacterial cultures tested generated two distinctly different thermograms
(Fig. 18). The hydrogen peroxide producing Lactococcus strain thermogram displays a
larger peak area with a peak that is significantly shifted toward a higher temperature,
while the Psedomonas strain displays a peak shifted towards a lower temperature.
0
10
20
30
40
50
60
0 50 100 150 200 250
Hea
t F
low
, m
W
Temperature, °C
90% JSC-1 Mars Analog Soil + 10% [ 35% Hydrogen Peroxide+
10% Phenacetin]
"90% JSC-1 +
10% [35%
H2O2 + 10%
Phenacetin],
24.6mg"
"90% JSC-1 Soil
+ 10% [ 35%
H2O2 + 10%
Phenacetin],
16.3mg"
Page 50
41
Figure 18: Thermograms of hydrogen peroxide producing Lactococcus lactis subsp.
lactis and Pseudomonas sp. (non-hydrogen peroxide producing). The thermograms
shown are the result of four independent DSC runs for each culture. The average peak
area is 1,871 J/g (+/-61 J/g) for Lactococcus lactis and 1,488 J/g (+/-169 J/g) for
Pseudomonas sp. The Lactococcus lactis subsp. lactis peak has an average peak
temperature of 93°C (+/- 3°C), while the Pseudomonas sp. peak has an average peak
temperature of 85°C (+/- 3°C).
Additional thermograms, including individual sample runs, can be found in
Appendix B. These thermograms were used to create the grouped Figures discussed
above.
Page 51
42
DISCUSSION
A range of concentrations of hydrogen peroxide was successfully detected in
Figure 5 from 70 ppm (.007%) to 438 ppm (.04%). However, the sharpest thermogram
peak was observed at the 368 ppm (about .04%) concentration. There was a bell-curve
type relationship apparent between the concentration of hydrogen peroxide and the
sharpness of the peak observed. The lowest (70 ppm) and highest (875 ppb)
concentrations of hydrogen peroxide gave the smallest, broadest peaks, while the mid-
range concentrations (i.e. 368 ppm) showed sharp well-defined peaks. With
concentrations of hydrogen peroxide on the martian surface varying from 1 ppm (Zent
and McKay, 1994) to 250 ppm (Mancinelli, 1998), the TEGA instrument on the Mars
Phoenix lander should be able to detect most of the hydrogen peroxide on the surface
through calorimetry.
The thermograms for milllipure water (Figure 6) show a peak value of 114°C (+/-
3°C), which differ from the theoretical boiling point of pure water (100°C). This
difference is most likely due to the range of temperatures seen in the indium standard
runs used when calibrating the DSC instrument. While the theoretical values for the
indium peak are between 157°C and 160°C, the instrument gave a peak value of
158.71°C (+/- 1.34°C) with an onset of the peak at 153.67°C (+/- 0.51°C). This slight
shift from the theoretical values would explain the shift in the millipure water peak so
that it was not exactly 100°C.
The 17.5 % hydrogen peroxide solution revealed a very similar behavior
to pure water, but also exhibited a small negative peak at 123°C (Fig. 7). The negative
peak appeared when almost all of the water had evaporated and represents the heat given
Page 52
43
off by the H2O2 as it decomposed exothermally. This negative peak was more
pronounced when using a 35 % hydrogen peroxide solution (Fig. 8). The area under the
large positive (endothermic) peak of the 35 % hydrogen peroxide solution is 1.096 kJ/g
+/- 0.31 kJ/g. The characteristic thermogram of a 35 % H2O2 solution was clearly
identifiable at concentrations down below 450 ppm or about 9 ng (Fig. 1). A solution of
35% hydrogen peroxide with tetra sodium pyrophosphate at a ratio of 9:1 revealed a very
different pattern (Fig. 9). It produced a strong exothermic response at about 80oC, which
was likely due to the hydrolysis of the pyrophosphate ion, and a large endothermic peak
close to 100oC. The stabilizing effect of the pyrophosphate must have ceased after all the
pyrophosphate ions had been hydrolyzed. It should be noted that the overall energy
required for the phase transition was greatly increased compared to millipure water and
the hydrogen peroxide solutions (scale on y-axis of Fig. 9). The thermogram of the
chemical stabilizer phenacetin reveals a characteristic single peak at about 132°C (Fig.
10), which is revealed as well in the thermogram of the 35 % hydrogen peroxide solution
when phenacetin was added at a 9:1 mass ratio of 35% H2O2 to phenacetin (Fig. 11). The
phenacetin peak appears at a value of 131°C for the hydrogen peroxide solution, while
the main peak correlates to 108°C. The thermogram displays again a small negative peak
at 118°C, which is characteristic for the exothermic decomposition of hydrogen peroxide.
To confirm that the negative peaks seen in the thermograms of hydrogen
peroxide and hydrogen peroxide/tetra sodium pyrophosphate solutions were not an
artifact of the DSC instrument, several sample runs were completed at a much lower scan
rate of 2°C per minute. As seen in Figure 12, the negative peaks are still seen in the
hydrogen peroxide solutions at the lower scan rate. After these confirmatory
Page 53
44
thermograms, the scan rate was again increased to 10°C to mimic the scan rate used on
the Mars Phoenix lander.
The thermograms of quartz sand (Fig. 13) display a characteristic peak at about
44oC, which, for thermograms of JSC-1 Mars simulant soil (Fig. 14), appears more
pronounced. The second, larger peak reflects the evaporation of water. The addition of
the chemical stabilizers Na4P2O7 and phenacetin resulted in a shift of the peaks toward
higher temperatures. In addition, the phenacetin peak is clearly identifiable for all media
when phenacetin was used at a mass fraction of 3 % (Figs. 13-16). However, when the
mass ratio of the phenacetin spiked hydrogen peroxide solution was lowered to 10 % of
the mass fraction of the soil (phenacetin ~ 1 % of the total mass of the soil), the signature
peak of the phenacetin was too small to be unambiguously identified in the JSC-1 soil
and the metal oxides tested (Figure 17).
The negative peak of the decomposition of hydrogen peroxide is not discernable
when using soil media and metal oxides. When using the JSC-1 martian simulant soil,
which contains many metal oxides, a larger amount of endothermic energy was needed to
evaporate the water. The peak energy was reached at significantly higher temperatures
compared to quartz sand (Figs. 13,14). The same pattern is revealed when using titanium-
and iron oxides as a medium (Figs. 15 and 16, respectively). However, the second, larger
peak varies much more for the different solutions within metal oxides as a medium. For
example, when using TiO2 as a medium, a plateau is displayed for water and most
hydrogen peroxide solutions between the two peaks. A prominent peak, however, appears
if phenacetin was added to the solutions and if the tested medium contained metal oxides
(JSC-1 soil and metal oxides). In the metal-oxide containing media, the phenacetin peak
Page 54
45
at about 132oC is not as strong as in quartz sand, but still discernable at the
concentrations tested.
The thermograms for the JSC-1 simulant soil and the metal oxides are very
similar, which indicates that the thermogram of JSC-1 soil is dominated by the response
of its metal oxide composition. The thermograms are very sensitive to moisture and allow
an easy detection of water. The exothermic decomposition of H2O2 is detectable down to
concentrations of at least 368 ppm and below, but more difficult to detect within soil
media. Further compounding the difficulty of H2O2 detection was that laboratory runs
under atmospheric conditions indicated that H2O2 had its characteristic signature decay.
This is also the case under martian atmospheric conditions, because light, especially UV
irradiation, destabilizes hydrogen peroxide. The average lifetime of H2O2 is on the order
of only 2 days (Atreya et al. 2006). The Phoenix lander was equipped with a soil sampler,
however, which ensured that the tested samples were not exposed for too long a time to
martian atmospheric conditions. We can infer from our testing that H2O2 would be easier
to detect by TEGA within liquid water rather than within a soil matrix.
The addition of a chemical stabilizer to a hydrogen peroxide solution can be
identified in the thermogram. More endothermic energy is required during the heating
process, which shifts the peak energy toward higher temperatures. In addition, phenacetin
generates a characteristic peak at about 132oC. The detection of the chemical stabilizer is
more challenging at lower concentrations within a soil matrix. The phenacetin was
clearly identifiable in all four tested media at a tested mass fraction of about 3 % (Figs.
13-14) but the peak generated at a tested mass fraction of about 1 % is not significant
Page 55
46
(Figure 17). Concentrations of Na4P2O7 have to be even higher in concentration to be
clearly discernable in the thermograms.
The two bacterial cultures tested generated two distinctly different thermograms
(Fig. 18). The hydrogen peroxide producing Lactococcus strain thermogram displays a
larger peak area with a peak that is significantly shifted toward a higher temperature.
However, hydrogen peroxide concentrations within the Lactococcus strain were not high
enough to display its characteristic negative peak and neither phenacetin nor tetrasodium
pyrophosphate were identified. However, the presence of a chemical stabilizer can be
inferred from the characteristic shift toward higher peak temperatures (Figure 18). Lactic
acid bacteria exhibit an inducible oxidative stress response when exposed to sublethal
levels of H2O2 (Condon, 1987), which can be at least as high as 350 ppm (Ito et al.,
2003), and would also be expected to employ a chemical stabilizer to control the
reactivity of H2O2.
If the H2O2-H2O hypothesis of martian life (Houtkooper and Schulze-Makuch,
2007) is applied, then an organic stabilizer such as phenacetin could be understood as a
more sophisticated evolutionary adaptation of life to martian conditions than an inorganic
stabilizer such as Na4P2O7. Both, however, would serve as a biomarker for possible life
on Mars. The advantage of phenacetin is that its biosignature can be more easily detected
in thermograms (via the signature peak) and there is no plausible way of an inorganic
production of this organic compound. Alternatively, the H2O2 in the martian soil may be
due to inorganic processes (Hurowitz et al., 2007), in which case no stabilizer and no
evidence for a stabilizer would be present.
Page 56
47
Obviously, the idea that the Viking lander observations, which implied a strong
oxidizing agent for the observed reactions (Klein, 1999), were a result of biology are
highly speculative, but so is nearly any conjecture in astrobiology. The main distinction
here is that the biological and the chemical hypotheses presented are testable, which is
rare in this field of study. The experiments reported here were conducted to simulate the
analyses of the TEGA instrument of the Phoenix lander and future Mars lander
instruments as well. The results of the Phoenix lander have been decidedly mixed. While
the mission did confirm the presence of water ice just below the surface and found
evidence of perchlorates and calcium carbonates(Smith et al, 2009; Hecht et al, 2009 and
Boynton et al., 2009), the TEGA results have been inconclusive and prone to instrument
error (ice clogging the sample doors for instance). New hope is being given, however, to
the Mars Science Laboratory (MSL) mission and its Sample Analysis at Mars (SAM)
suite.
The Mars Science Laboratory (MSL) is a new rover/lander that is scheduled to
launch in the fall of 2011 and land on Mars in 2012. The whole purpose of the MSL is to
assess the habitability of Mars. In other words, to find out if Mars can support microbial
life in the present or has ever supported microbial life in the past (NASA JPL, 2009). The
lander will carry a variety of instruments including cameras, spectrophotometers,
radiation detectors and environmental sensors (Atreya et al., 2006). The instrument suite
specific to our discussion, however, is the SAM (sample analysis at Mars suite). This
suite carries many of the basic functions of chemistry laboratory here on Earth.
Specifically, the SAM will search for carbon compounds (including methane, hydrogen,
oxygen and nitrogen) using a gas chromatograph (GC), mass spectrometer (MS) and
Page 57
48
tunable laser spectrometer (TLS) (Mahaffy, 2007). The three SAM instruments are
complimented by a sample manipulation system (SMS) and a Chemical Separation and
Processing Laboratory (CSPL). The CSPL includes micro valves, gas manifolds (with
heaters and monitors), chemical and mechanical pumps, pressure monitors and pyrolysis
ovens (Mahaffy, 2007). The results of the SAM instrument, and the pyrolysis oven in
particular, should be comparable to our results with the DSC here on Earth. Any chemical
stabilizers should show up as a shift in the thermogram peaks or as a signature peak.
Also, hydrogen peroxide itself should be readily visible in the graphs with its
characteristic broad endothermic peak followed by the sharp negative peak (allowing for
scan rates between 2°C and 10°C per minute).
With either the TEGA instrument on the Mars Phoenix lander or the pyrolysis
oven on the Mars Science Laboratory, the detection of a sufficient amount of H2O2 by
itself would not provide evidence for the H2O2-H2O hypothesis. However, the H2O2-H2O
hypothesis for life on Mars would be supported by the following observations: The
detection of hydrogen peroxide plus (1) the detection of fragments of organic molecules
by the mass spectrometer (MS) of TEGA, (2) the production of excess heat (exothermic
signature) and the detection of the gaseous decomposition products of organic molecules
such as CO2, H2O, O2, and N2 (the decomposition product of H2O2 would only be H2O
and O2), and (3) a measured distinct change in isotope fractionation ratios of 13
C/12
C and
18O/
16O toward lighter isotopes at temperatures at which organic molecules decompose.
In addition, the identification of the characteristic signatures of the chemical
stabilizers(such as phenacetin or tetrasodium pyrophosphate) or the characteristic shift
produced by a chemical stabilizer in the thermograms, would add another line of
Page 58
49
evidence. Thus, by combining the experimental results of the DSC, the TEGA results of
the Mars Phoenix lander and the SAM results of the MSL rover, a better understanding of
the surface of Mars can be reached as well as a broadening of our search for life on other
planets.
Page 59
50
CHAPTER TWO: WATER ACTIVITY AND HYDROGEN PEROXIDE
INTRODUCTION
Water is not only essential to life on Earth but it is also a major component of living
organisms. While the meaning of the term water content is usually familiar, the term water
activity is mainly used in food handling and processing and not in general use. Water
content refers to the amount water present in a sample and is usually determined by
assessing the wet weight versus dry weight of a sample (Duckworth, 1975). Even as water
content is crucial in meeting labeling requirements of food, it is a poor indicator in
predicting microbial responses in solutions (Prior, 1979). To predict microbial behavior a
new measurement, called water activity, is needed. Water activity (aw) is a measurement of
how tightly water is bound (either structurally or chemically) in a sample and is indicative of
the energy status of the water in a sample (Troller and Christian, 1978). Water activity is
measured as the relative humidity of a sample in a sealed instrument chamber; in fact the
liquid phase of the water in the sample is equilibrated with the vapor phase of the water in
the headspace of the chamber (Prior, 1979). Water activity is closely related to a property of
thermodynamics called water potential (also called chemical potential or !). This water
potential is the change in Gibbs free energy (G) when water concentration changes and
equilibrium in a system is achieved when the ! is the same everywhere in the system
(pawkit manual, 2008). Thus, when there is equilibrium between the liquid and vapor phases
of water in a sample, the ! is same in both phases. It is this property of water potential that
allows us to measure the water activity of a sample. The water activity measurement is key
Page 60
51
in determining the perishability of a substance and the relative activity of microorganisms in
the substance.
As a standard baseline, the water activity of pure water is 1.0, while the water
activity of a saturated NaCl solution is 0.75 and a saturated MgCl2 solution is 0.3 (Ha and
Chan, 1999). The lowest water activity in which bacteria will grow or spores will germinate
is around 0.6-0.7 and no activity is recorded at 0.5 (Duckworth, 1975 and Mugnier and
Jung, 1985). Honey, for example, with its water activity of 0.6 does not support the growth
of microorganisms but often contains endospores of the bacterium Clostridium botulinum,
which can cause illness in young children (Shapiro, 1998). As a reference the water
activities of several common food items are given below in table 13.
Table 13: Water Activities of Common Food Items (adapted from Duckworth, 1975)
Food Item Water Activity, aw
Milk 0.97
Bacon, cooked ~0.85
Orange Juice 0.97
Dried Fruits 0.5-0.6
While humans can survive almost two weeks without food, the human body can
only last two days without water. On Mars, however, liquid water was never as abundant
as on Earth. Even during the wetter early martian history, liquid water bodies may not
have remained permanently on the surface. Hydrogen peroxide, however, is naturally
present on Mars at much higher concentrations than on Earth, today and probably in the
past. These inorganic concentrations are still low but its presence should have been
Page 61
52
sufficient to warrant biochemical adaptations. Putative martian microorganisms might
have learned to use the properties of hydrogen peroxide to their advantage, especially as
the planet dried up and became colder during its history. A comparable process occurred
on Earth more than 2 billions years ago, when microbes developed the ability to live with
free oxygen and then thrive by using it in their favour (Brocks et al., 1999, Raymond and
Segre, 2006; Catling and Buick, 2006). Thus, the antifreeze properties of hydrogen
peroxide and its hygroscopic properties would become a great advantage for making a
living on the dry and cold Mars.
The hygroscopic properties of hydrogen peroxide are of particular interest to our
hydrogen peroxide-water hypothesis of life on Mars. If putative microorganisms on Mars
do indeed use a hydrogen peroxide-water mixture as a type of antifreeze and water
gathering, then the hygroscopic properties of such a mixture are of particular interest.
Fortunately, water activity can be measured readily using a hardy portable device. Here
we use the Pawkit water activity meter (Decagon Devices) to measure the water activities
of various hydrogen peroxide-water solutions with added glucose, salt and perchloric
acid. Samples from the pitch or asphalt lakes in Trinidad (Trinidad and Tobego) are also
measured for comparison purposes. The hygroscopic and water-scavenging properties of
these solutions are then evaluated.
Page 62
53
MATERIALS AND METHODS
Hydrogen Peroxide/Water Solutions:
35% hydrogen peroxide, 500mL, was obtained from the Acros Organics Chemical
Company (catalogue #202465000) and stored in a 500mL sterile brown glass media jar at
+4oC until use. Immediately before use, small aliquots (5-10mL) were transferred to
15mL glass sample jars with sealing polypropylene lids. Fresh samples were exposed to
the atmosphere for no more than 5 minutes and the remaining was stored at +4°C for up
to one hour. The 17.5% hydrogen peroxide solution was made by combining 4mL of the
35% hydrogen peroxide mentioned above with 4mL of the millipure water with mixing
into q 15mL glass sample jar with sealing polypropylene lid. The solution was used
immediately (fresh sample, up to 5 minutes to prepare) or stored at +4°C and tested up to
one hour later. Sterile Millipore water was stored in brown glass jars (500mL) and
aliquoted into sterile 50mL conical tubes 5 minutes before use.
Salt Solutions:
Sodium Chloride (NaCl) was obtained from Acros Organics (catalogue #AC42429-0250)
and stored at room temperature. A 10% NaCl (w/v) solution was made by dissolving 1 gram
of solid NaCl in 9 ml of 35% or 17.5% hydrogen peroxide (above). The solutions were then
immediately tested for water activity.
Page 63
54
Glucose Solutions:
Glucose powder was obtained from Acros Organics (catalogue #AC41095-5000) and stored
in a brown glass jar at room temperature protected from light. A 10% glucose solution was
made by dissolving 1 gram of glucose powder in either 35% or 17.5% hydrogen peroxide
(above). The solutions were used immediately and tested for water activity.
Perchloric Acid Solutions:
Perchloric acid (60%) was obtained from Acros Organics (catalogue #A2286) and stored in
a clear glass jar protected from light. A 10% solution of perchloric acid was made by
combining 1.7ml of 60% perchloric acid with 8.3ml of either 35% or 17.5% hydrogen
peroxide (above). The solutions were used immediately and tested for water activity.
Water Activity Measurements:
Water activity measurements were taken with the Pawkit water activity meter (Decagon
Devices, Pullman, WA) using individual disposable plastic sample cups (Decagon) and
between 2 and 3 grams of the appropriate solution above. Measurements were taken over a
five minute interval. The initial and final aw readings were taken for all hydrogen peroxide
solutions and the final aw was taken for the pure water. The Pawkit was calibrated every
week with 6.0 molal NaCl (aw 0.760) and 13.41 molal LiCl (aw 0.250). All calibration
solutions were supplied by Decagon Devices (Pullman, WA) and the error of the instrument
is 0.003 aw.
Page 64
55
Trinidad Lake Samples:
Samples of pitch from the asphalt lakes of Trinidad (Trinidad and Tobego) were collected
by hand by Dirk Schulze-Makuch and placed into 100ml plastic sample containers with
screw top lids. 2-3 gram samples were then scooped into the Decagon Devices disposable
plastic sample cups using a metal spatula. The water activity was taken using the Pawkit
water activity meter (Decagon Devices).
Page 65
56
RESULTS
The water activity measurements of pure Millipore water are shown in Figure 21. The
recorded value of 0.98 (+/- 0.01) falls near the theoretical value of aw=1.0 for pure water.
Figure 19: Graph of Millipore water: water activity averaged over 10 samples was 0.98 (+/-
0.01), weight = 2.9 g (+/- 0.2 g), temperature = 21.5°C (+/- 1.5°C).
Figure 22 shows the water activity of 35% hydrogen peroxide at both room
temperature (20.7°C +/- 1.3°C) and at +4°C (+/- 0.9°C). At room temperature, the water
activity starts at an initial aw of 0.75 (+/- .04) and increases to 1.00 (+/- .02) after five
minutes. At +4°C the aw starts at .75 (+/- .04) and increases to .00 (+/- .02) after five
minutes.
"#$%&
"#$%'&
"#$(&
"#$('&
"#$)&
"#$)'&
"#$$&
"#$$'&
*+,-.&/0,121,3&4+56&
!"##"$%&'()*+'&,(*-(
718819:.-&*+,-.&
Page 66
57
Figure 20: Water activity of 35% hydrogen peroxide at various temperatures. At room
temperature, 20.7°C (+/- 1.3°C), the aw began at .75 (+/- .04) and increased to 1.00 (+/- .02)
after five minutes with a sample weight of 3.31 g (+/- 1.2 g). At cooler temperatures, 4.6°C
(+/- .3°C), the aw began at .75 (+/- .04) and increased to .99 (+/- .02) after five minutes with
a sample size of 2.96 g (+/- .5 g). Measurements averaged over ten samples each.
With a decreased hydrogen peroxide content of 17.5%, the water activities remained
significantly unchanged from initial reading to five minutes later. In Figure 23 the initial
water activity readings for both room temperature and 4°C are 0.99 (+/- .01) and both
readings end at 1.01 (+/- .01) after five minutes. The temperature for the room temperature
sample was 20.7°C (+/- .8°C) while the cooler temperature was 4.7°C (+/- .2°C).
"&
"#;&
"#<&
"#%&
"#)&
=&
=#;&
*+,-.&+0,121,3&4+56>&1?1,1+8&*+,-.&+0,121,3&4+56>&@1?+8&
)*+'&(./+"0"+1(234(5676(
A'B&C;D;>&E<!F&
A'B&C;D;>&GH&
Page 67
58
Figure 21: Water activity of 17.5%% hydrogen peroxide at various temperatures. At room
temperature, 20.7°C (+/- .8°C), the aw began at .99 (+/- .01) and increased to 1.01 (+/- .01)
after five minutes with a sample weight of 3.4 g (+/- .2 g). At cooler temperatures, 4.7°C
(+/- .2°C), the aw began at .99 (+/- .01) and increased to 1.01 (+/- .01) after five minutes with
a sample size of 3.2 g (+/- .2 g). Measurements averaged over ten samples each treatment.
The water activity of several different 35% hydrogen peroxide solutions was then
tested at room temperature in Figure 24. Initially the 35% H2O2 sample started with a water
activity of 0.75 (+/- .4) and increased to 1.00 (+/- .02) after five minutes. The 35% H2O2
solutions plus 10% NaCl, 10% glucose or 10% perchloric acid started with aw values of 0.87
(+/- .01), 0.89 (+/- .02) and 0.89 (+/- .02) respectively and ended after five minutes with aw
values of 0.98 (+/- .02), 0.99 (+/- .02) and 0.99 (+/- .02) respectively. Each increase was
statistically significant throughout the samples.
"#$<&
"#$'&
"#$%&
"#$(&
"#$)&
"#$$&
=&
=#"=&
=#";&
=#"A&
=#"<&
*+,-.&+0,121,3&4+56>&
1?1,1+8&
*+,-.&+0,121,3&4+56>&
@1?+8&
)*+'&(./+"0"+1(89:34(5676(
=(#'B&C;D;>&GH&
=(#'B&C;D;>&E<!F&
Page 68
59
Figure 22: Water activity of various 35% hydrogen peroxide solutions. The 35% hydrogen
peroxide solution of 3.3 g (+/- 1.2 g) started with aw=0.75 (+/- .04) and ended after five
minutes with aw=1.00 (+/- 0.2) with a temperature of 20.7°C (+/- 1.3°C). The 35% hydrogen
peroxide + 10% NaCl solution of 2.9 g (+/-.1 g) started with aw=0.87 (+/- .01) and ended
after five minutes with aw=0.98 )+/- .02) with a temperature of 20.8°C (+/-.6°C). The 35%
hydrogen peroxide + 10% glucose solution of 3.0 g (+/-.1 g) started with aw=0.89 (+/- .02)
and ended after five minutes with aw=0.99 )+/- .02) with a temperature of 21.0°C (+/-.9°C).
The 35% hydrogen peroxide + 10% perchloric acid solution of 3.0 g (+/-.1 g) started with
aw=0.89 (+/- .02) and ended after five minutes with aw=0.99 (+/- .02) with a temperature of
20.6°C (+/-.7°C). Measurements averaged over ten samples each treatment.
The Trinidad lake samples (Figure 25) showed water activity levels that were
constant between the initial reading and final reading after five minutes. The water activity
"&
"#;&
"#<&
"#%&
"#)&
=&
=#;&
A'B&C;D;& A'B&C;D;&E&
="B&I+F8&
A'B&C;D;&E&
="B&J8:0KL-&
A'B&C;D;&E&
="B&
M-.0N8K.10&
/01O&
)*+'&(./+"0"+1(234(5676(;<#%+"<=>(
*+,-.&+0,121,3&4+56>&1?1,1+8&
*+,-.&+0,121,3&4+56>&@1?+8&
Page 69
60
measurement was 0.78 (+/- .04) with a temperature of 26.2°C (+/- .3°C) and a weight of 2.7
g (+/- .6 g). The Trinidad samples were compared with the Millipore water samples for
graphical purposes.
Figure 23: Water activity of Trinidad asphalt lake samples and Millipore water. Water
activity for Millipore water was 0.98 (+/- 0.01), weight = 2.9 g (+/- 0.2 g), temperature =
21.5°C (+/- 1.5°C). Trinidad asphalt lake samples had aw=0.78 (+/- .04) with a temperature
of 26.2°C (+/- .3°C) and a weight of 2.7 g (+/- .6g). Measurements were averaged over ten
samples in each treatment.
"&
"#;&
"#<&
"#%&
"#)&
=&
=#;&
H.1?1O+O&P+Q-& 718819K.-&*+,-.&
)*+'&(*/+"0"+1(?*-@(A&"="B*B(C*D'(
.>$E*#+(*=B()*+'&(
*+,-.&+0,121,3&4+56&
Page 70
61
DISCUSSION
Overall the water activity measurements yielded values not out of the expected
ranges for bacterial growth, aw= >0.6 (Duckworth, 1975). The millipore water values (Fig.
21) were all significantly close to the theoretical value of aw= 1.0. The water activity of
17.5% hydrogen peroxide at either room temperature or a cooler temperature showed no
significant increase in value (Fig. 23). This could be due to the fact that the hydrogen
peroxide content was not high enough to reveal the scavenging effects of the solution.
However, when we consider the 35% hydrogen peroxide solution at both room temperature
and 4°C, the initial water activity values were all significantly lower than the final values
(Fig. 22). At room temperature, 20.7°C (+/- 1.3°C), the aw began at .75 (+/- .04) and
increased to 1.00 (+/- .02) after five minutes with a sample weight of 3.31 g (+/- 1.2 g). At
cooler temperatures, 4.6°C (+/- .3°C), the aw began at .75 (+/- .04) and increased to .99 (+/-
.02) after five minutes with a sample size of 2.96 g (+/- .5 g). This increase demonstrated the
tendency of the 35% hydrogen peroxide solutions to scavenge water from their
surroundings.
The scavenging effect was also seen in the 35% hydrogen peroxide solutions
containing 10% NaCl, 10% glucose and 10% perchloric acid. The 35% hydrogen peroxide +
10% NaCl solution of 2.9 g (+/-.1 g) started with aw=0.87 (+/- .01) and ended after five
minutes with aw=0.98 )+/- .02) with a temperature of 20.8°C (+/-.6°C). The 35% hydrogen
peroxide + 10% glucose solution of 3.0 g (+/-.1 g) started with aw=0.89 (+/- .02) and ended
after five minutes with aw=0.99 )+/- .02) with a temperature of 21.0°C (+/-.9°C). The 35%
hydrogen peroxide + 10% perchloric acid solution of 3.0 g (+/-.1 g) started with aw=0.89
(+/- .02) and ended after five minutes with aw=0.99 (+/- .02) with a temperature of 20.6°C
Page 71
62
(+/-.7°C). The salt and glucose solutions mimic the osmotic balance solutions of bacteria
here on Earth and could offer a possible alternative for putative martiam microorganisms.
The perchloric acid water activity results are particularly interesting due recent
finding by the Mars Phoenix mission. Perchlorates are strong oxidants and used in many
industrial processes here on Earth from dry cleaning agents to rocket fuel additives (Sellers
et al., 2006). Perchlorates, even though they are chiefly man-made, can be utilized by
several anaerobic bacteria (Shewanella spp., Acetobacterium spp and Pseudomonas spp.) as
an energy source, thus showing the ability of microorganisms to adapt to their environment
and the metabolites available (Denis et al., 2003). Recently, the Mars Phoenix lander found
evidence of perchlorates on the surface of Mars along with abundant subsurface water ice
(NASA Phoenix, 2009). A perchlorate-hydrogen peroxide mixture might allow potential
martian microorganisms to both scavenge water and create energy for the cell.
In conclusion, when considering the possible refuges for life on other planets and
satellites, we must first consider the energetic and environmental requirements of such
life. While it has been challenging to even agree upon a definition of life here on out own
planet, most would agree that life needs, at the least, an energy source and a solvent
(Schulze-Makuch and Irwin, 2006). Here on Earth water is, of course, the solvent but
organisms also obtain energy through a variety of mechanisms including aerobic
respiration, iron reduction, sulfate reduction and even methanogenesis (Konhauser,
2007). Environmental factors are also important when considering the constraints of life.
The study of life in extreme environments gives us some basic constraints for thinking
about life on other worlds. For example, the study of psycrophiles yielded evidence of
bacteria surviving temperatures of -2°C (Junge, Eicken, & Deming, 2004) and
Page 72
63
thermophiles have been found living at 121°C (Kashefi & Lovley, 2003). Thus it should
be evident that life adapts to its environment and when considering life on other worlds
we should keep this principle in mind when looking for potential energy sources and
solvents.
Page 73
64
APPENDIX A: COPY OF THE PUBLISHED PAPER
BASED ON THE DSC RESULTS
Reference: Schulze-Makuch, D., Turse, C., Houtkooper, J.P. and McKay, C.P. Testing
the H2O2-H2O Hypothesis of Life on Mars with the TEGA Instrument on the
Phoenix Lander. Astrobiology. 2008 April 8 (2):205-14.
Testing the H2O2-H2O Hypothesis of Life on Mars with the TEGA Instrument on
the Phoenix Lander.
Schulze-Makuch, D., Turse, C., Houtkooper, J.P. and McKay, C.P.
INTRODUCTION
The Viking mission left open many questions; particularly the nature of the
oxidant in the martian soil remains enigmatic (Zent and McKay, 1994; Quinn and Zent,
1999; Yen et al., 2000; Mancinelli, 1989; Klein, 1999; Benner et al., 2000; Hurowitz et
al., 2007; Houtkooper and Schulze-Makuch, 2007). The common explanation is that all
the organic material near the surface was oxidized by H2O2 and other strong oxidizing
compounds. Based on the reactivity of the surface measured by the Viking Gas Exchange
experiment (GEx), the amount of H2O2 on the martian surface was estimated to be between
1 ppm (Zent and McKay, 1994) and 250 ppm (Mancinelli, 1989). Yet, photochemical
processes generate H2O2 in the atmosphere at a much lower rate in the parts per billion
range. Atmospheric H2O2 abundances vary between 20 and 40 ppb by volume over the
planet (Encrenaz et al. 2004), which appears to be a maximum concentration that occurs
during favorable weather conditions (Atreya and Gu, 1994). Nussinov et al. (1978) argued
Page 74
65
that, instead of H2O2, oxygen gas physically trapped in soil micropores may have been
responsible for the Viking observations. Plumb et al. (1989) pointed out that a large
number of diverse features of the GEx and Labeled Release experiment can be
reproduced with ultraviolet-irradiated potassium nitrate. Possible oxidant reactions and
their environmental problems on Mars were summarized by Zent and McKay (1994),
who concluded that none of the hypotheses presented in the literature was free of serious
objections, many of which have to do with the instability of putative oxidants in the
presence of heat, light, or atmospheric carbon dioxide. Or the suggested hypotheses
would require elaborate formation mechanisms for which there is no evidence. Instead,
Zent and McKay suggested that the results obtained by Viking could be best explained by
some kind of heterogeneous surface chemistry that yields one or more types of oxidizing
surfaces on the martian regolith particles. Quinn and Zent (1994) proposed that hydrogen
peroxide chemisorbed on titanium dioxide may have been responsible for the chemical
reactivity seen in the Viking life detection experiments. Yen et al. (2000) suggested
superoxide ions instead of H2O2.
Alternatively, Levin and Straat (1981) and Levin (2007) argued for a biological
explanation but struggled to explain (1) the evolution of O2 upon wetting the soil, (2) the
apparent absence of organic molecules in the soil, and (3) the weakly positive results of
the single control test in the Pyrolytic Release experiment. Using a different approach,
Houtkooper and Schulze-Makuch (2007) suggested that putative martian organisms might
employ a novel biochemistry; in particular, they could utilize a water-hydrogen peroxide
(H2O-H2O2) mixture rather than water as an intracellular liquid. This adaptation would have
the particular advantages of providing a low freezing point, a source of oxygen, and
Page 75
66
hygroscopicity in the martian environment, which would allow organisms to scavenge water
molecules directly from the atmosphere, and address many of the puzzling Viking findings.
H2O2-H2O solutions are mostly known as disinfectants and sterilizing agents on Earth, but
some microbial organisms produce hydrogen peroxide (e.g., certain Streptococcus and
Lactobacillus sp.; Eschenbach et al., 1989), while other microbes utilize H2O2 (e.g.,
Neisseria sicca, Haemophilus segnis; Ryan and Kleinberg, 1995). Sensitivity to H2O2
varies drastically (Anders et al., 1970; Alcorn et al., 1994; Stewart et al., 2000). Reported
microbial survival rates range from greater than 80 % to less than 0.001 % after exposure to
30 mM hydrogen peroxide (Alcorn et al., 1994), and at least one organism, the microbe
Acetobacter peroxidans, uses H2O2 in its metabolism (overall reaction H2O2(aq) + H2(aq) "
2H2O; Tanenbaum, 1956).
Mixtures of H2O2 and H2O freeze at temperatures significantly below the freezing
point of water. The lower eutectic point lies at -56.5oC for a mixture with 61.2 weight %
H2O2 (Foley and Giguère, 1951). Also, mixtures with a high H2O2 concentration tend to
super cool, which sometimes results in the formation of glasses, down to liquid-air
temperatures (Giguère, and Secco, 1954). On Earth, microorganisms commonly use salts
as antifreeze. Salts are common and readily available as they are highly soluble in
abundant water present on Earth. Thus, organisms on Earth learned to adapt to higher salt
concentrations and use salts as antifreeze in cold environments such as in high mountain
regions and the Arctic. On Mars, however, liquid water was never as abundant as on
Earth. Even during the wetter early martian history, liquid water bodies may not have
remained permanently on the surface. Hydrogen peroxide, however, is naturally present
on Mars at much higher concentrations than on Earth, today and probably in the past.
Page 76
67
These inorganic concentrations are still low, much too low to explain the Viking results,
but its presence should have been sufficient to warrant biochemical adaptations. Putative
martian microorganisms might have learned to use the properties of hydrogen peroxide to
their advantage, especially as the planet dried up and became colder during its history. A
comparable process occurred on Earth more than 2 billions years ago, when microbes
developed the ability to live with free oxygen and then thrive by using it in their favour
(Brocks et al., 1999, Raymond and Segre, 2006; Catling and Buick, 2006). Thus, the
antifreeze properties of hydrogen peroxide and its hygroscopic properties would become
a great advantage for making a living on the dry and cold Mars. Also, adaptation to H2O2
would require adaptation to oxidation stress (e.g., protection from protein oxidation),
which would have likely conveyed microbial radioresistance as well (Daly et al. 2007),
another trait useful to have in the martian near-surface environment.
The NASA Mars Phoenix Mission, which is currently on its way to Mars,
provides the unique possibility to test various hypotheses to explain the Viking results.
The Phoenix lander includes the TEGA instrument, which is a combination of a high-
temperature furnace and a mass spectrometer that will be used to analyze martian ice and
soil samples. Once a sample is successfully received and sealed in the TEGA oven,
temperature is slowly increased at a constant rate up to 1000°C, and the power required
for heating is carefully and continuously monitored. This process, called scanning
calorimetry, shows the transitions from solid to liquid to gas of the different materials in
the sample.
Page 77
68
MATERIALS AND METHODS
We used differential scanning calorimetry to analyze phase transitions and
thermodynamic properties of the oxidant compounds investigated. Two thermal cells
were employed, one cell holding the reference capsule, the other the sample. A computer
control system measured the amount of heat required to increase the temperature of each
cell. If the temperature in one cell was not rising as fast as the temperature in the other
cell, the instrument sent more energy (heat) to the heating coils in that cell to maintain the
same temperature in each cell. The computer then recorded the difference between the
energy requirements for each cell. The resulting graph (thermogram) of temperature
versus energy difference between the two cells displays a peak whenever a phase
transition occurred. The area under a positive peak (peak area) represents the energy
required for the transition (enthalpy of the reaction, !H), thus any positive peaks are
representative of endothermic reactions, while negative peaks are representative of
exothermic reactions. The onset of a peak usually corresponds to the melting or
evaporation temperature of a tested substance. If the weight of the sample is known, then
the Differential Scanning Calorimeter (DSC) can calculate the energy required per gram
of sample (J/g) for the transition. In an exothermic process, less heat would be required
by the sample than by the reference cell to keep a steady change in temperature. In this
case, the resulting peak on the thermogram is a negative peak. The heat of the phase
change can be adsorbed or released depending on the change in specific heat
characteristics of each phase.
Page 78
69
Sample compounds investigated included millipure water, 17.5% and 35 %
hydrogen peroxide solution, 99.9% pure Fe2O3, 99.9% pure TiO2, tetrasodium
pyrophosphate (Na4P2O7), phenacetin (C10H13NO2), quartz sand, JSC-1 martian regolith
simulant soil, and combinations thereof. Na4P2O7 and phenacetin are stabilizers of H2O2
(Fig. 1) and were included in the test set because, if the martian H2O2 is mostly of
biological nature, a chemical stabilizer has to be invoked to control the reactivity of the
hydrogen peroxide. Other potential chemical stabilizers for H2O2 solutions include
sodium silicate (Na2SiO3), poly(#)hydroxyacrylic acid, phytate, citrate, and malonate
(Charron et al., 2006; Watts et al., 2007). Tetrasodium pyrophosphate was chosen here
due to its simplicity, efficacy (e.g., common use in commercial applications), and its
similarity to ATP. Phenacetin was chosen due to its demonstrated long-term (> 3 months)
effectiveness to keep hydrogen peroxide stable (Madanská et al., 2004). The martian
regolith simulant is the <1mm fraction of weathered volcanic ash from Pu’u Nene, a
cinder cone on the island of Hawaii, and was provided by the Johnson Space Center. We
also tested two bacterial cultures: Lactococcus lactis subsp. lactis, which has been shown
to produce hydrogen peroxide concentrations up to a level of about 350 ppm (Ito et al.,
2003), and Pseudomonas sp., a non-hydrogen peroxide producing bacterium.
Lactococcus lactis subsp. lactis bacteria were obtained from the American Type Culture
Collection (ATCC #11454, Manassas, VA) and were propagated according to standard
procedures. Briefly, the freeze-dried pellet was rehydrated in 1.0mL of ATCC#17 broth
and then added to 5.0mL of ATCC#17 broth in a 50mL conical tube. The resulting
mixture was incubated at 37°C with shaking for 24 hours. Pseudomonas sp., cultured
from a single colony from an agar plate, was resuspended in 5mL of sterile Tryptic Soy
Page 79
70
Broth (TSB, Difco #211825) in a sterile 50mL conical tube and incubated at 37°C with
shaking for 24 hours.
The scanning rate of the DSC was set at 10oC per minute, and the sample amount
used was 10 to 20 mg to simulate the thermograms that will be obtained by the TEGA
instrument on Mars. Samples were put in standard 20 µl aluminum sample pans with
covers and sealed with the standard sample pan crimper press. Each pan was fully loaded
and weighted before and after the addition of the sample. The sample preparation was
completed in less than 5 minutes, since it was observed that the hydrogen peroxide
started to decompose under atmospheric conditions within 40 min, which affected some
of the thermograms (Figs. not shown). An indium standard was used to calibrate the DSC
and a baseline run with the use of an empty aluminum pan was conducted prior to each
sample run. The DSC was programmed to subtract automatically each baseline run from
the sample run.
Page 80
71
RESULTS
The thermograms of the various compounds and solutions are shown in Fig. 2.
The millipure water revealed a behavior characteristic of the phase transition from liquid
water to water vapor with a peak at about 110oC. Any differences observed in peaks,
ranges, and energies in duplicate runs (Fig. 2a-f) were a function of the total amount of
solutes used in the DSC and due to instrument variation. The 17.5 % hydrogen peroxide
solution revealed a very similar behavior to pure water, but also exhibited a small
negative peak at 123°C (Fig. 2b). The negative peak appeared when almost all of the
water had evaporated and represents the heat given off by the H2O2 as it decomposed
exothermally. This negative peak was more pronounced when using a 35 % hydrogen
peroxide solution (Fig. 2c). The area under the large positive (endothermic) peak of the
35 % hydrogen peroxide solution is 1.096 kJ/g +/- 0.31 kJ/g. The characteristic
thermogram of a 35 % H2O2 solution was clearly identifiable at concentrations down to
about 450 ppm or about 9 ng (not shown). A solution of 35% hydrogen peroxide with
tetra sodium pyrophosphate at a ratio of 9:1 revealed a very different pattern (Fig. 2d). It
produced a strong exothermic response at about 80oC, which was likely due to the
hydrolysis of the pyrophosphate ion, and a large endothermic peak close to 100oC. The
stabilizing effect of the pyrophosphate must have ceased after all the pyrophosphate ions
had been hydrolyzed. It should be noted that the overall energy required for the phase
transition greatly increased compared to millipure water and the hydrogen peroxide
solutions (scale on y-axis of Fig. 2d). The thermogram of the chemical stabilizer
phenacetin reveals a characteristic single peak at about 132°C (Fig. 2e), which is revealed
as well in the thermogram of the 35 % hydrogen peroxide solution when phenacetin was
Page 81
72
added at a 9:1 mass ratio of 35% H2O2 to phenacetin (Fig. 2f). The phenacetin peak
appears at a value of 131°C for the hydrogen peroxide solution, while the main peak
correlates to 108°C. The thermogram displays again a small negative peak at 118°C,
which is characteristic for the exothermic decomposition of hydrogen peroxide.
In the next set of sampling runs, various soil media and metal oxides were
exposed to the previously tested solutions (Fig. 3a-d). Thermograms of quartz sand
display a characteristic peak at about 44oC, which, for thermograms of JSC-1 Mars
simulant soil, appears more pronounced. The second, larger peak reflects the evaporation
of water. The addition of the chemical stabilizers Na4P2O7 and phenacetin resulted in a
shift of the peaks toward higher temperatures. In addition, the phenacetin peak is clearly
identifiable for all media when phenacetin was used at a mass fraction of 3 % (Fig 3a-d).
However, when the mass ratio of the phenacetin spiked hydrogen peroxide solution was
lowered to 10 % of the mass fraction of the soil (phenacetin ~ 1 % of the total mass of the
soil), the signature of the phenacetin was too small to be unambiguously identified in the
JSC-1 soil and the metal oxides tested (Fig. not shown). The negative peak of the
decomposition of hydrogen peroxide is not discernable when using soil media and metal
oxides. When using the JSC-1 martian simulant soil, which contains many metal oxides,
a larger amount of endothermic energy was needed to evaporate the water. The peak
energy was reached at significantly higher temperatures compared to quartz sand (Fig.
3a,b). The same pattern is revealed when using titanium- and iron oxides as a medium
(Fig. 3c and 3d, respectively). However, the second, larger peak varies much more for the
different solutions within metal oxides as a medium. For example, when using TiO2 as a
medium, a plateau is displayed for water and most hydrogen peroxide solutions between
Page 82
73
the two peaks. A prominent peak, however, appears if phenacetin was added to the
solutions and if the tested medium contained metal oxides (JSC-1 soil and metal oxides).
In the metal-oxide containing media, the phenacetin peak at about 132oC is not as strong
as in quartz sand, but still discernable at the concentrations tested.
The two bacterial cultures tested generated two distinctly different thermograms
(Fig. 4). The hydrogen peroxide producing Lactococcus strain thermogram displays a
larger peak area with a peak that is significantly shifted toward a higher temperature,
which indicates the possible presence of a chemical stabilizer. However, hydrogen
peroxide concentrations within the Lactococcus strain were not high enough to display its
characteristic negative peak and neither phenacetin nor tetrasodium pyrophosphate were
identified.
Page 83
74
CONCLUSIONS
The thermograms for the JSC-1 simulant soil and the metal oxides are very
similar, which indicates that the thermogram of JSC-1 soil is dominated by the response
of its metal oxide composition. The thermograms are very sensitive to moisture and allow
an easy detection of water. The exothermic decomposition of H2O2 is detectable down to
concentrations of at least 450 ppm, but more difficult to detect within soil media. Further
compounding the difficulty of H2O2 detection was that laboratory runs under atmospheric
conditions indicated that H2O2 and its characteristic signature decay. This will also be the
case under martian atmospheric conditions, because light, especially UV irradiation,
destabilizes hydrogen peroxide. The average life time of H2O2 is on the order of only 2
days (Atreya et al. 2006). The Phoenix lander is equipped with a soil sampler, however,
which will ensure that the tested samples will not be exposed for too long a time to
martian atmospheric conditions. We can infer from our testing that H2O2 would be easier
to detect by TEGA within liquid water rather than within a soil matrix. Thus, if an ice
sample can be obtained from the Phoenix landing site, H2O2 is more likely to be detected,
if present.
The addition of a chemical stabilizer to a hydrogen peroxide solution can be
identified in the thermogram. More endothermic energy is required during the heating
process, which shifts the peak energy toward higher temperatures. In addition, phenacetin
generates a characteristic peak at about 132oC. The detection of the chemical stabilizer is
more challenging at lower concentrations within a soil matrix. The phenacetin was
Page 84
75
clearly identifiable in all four tested media at a tested mass fraction of about 3 % (Fig 3a-
d), but the peak generated at a tested mass fraction of about 1 % is not significant.
Concentrations of Na4P2O7 have to be even higher in concentration to be clearly
discernable in the thermograms. A chemical stabilizer was not detected in Lactococcus
lactis subsp. lactis, but the presence of a chemical stabilizer can be inferred from its
characteristic shift toward higher peak temperatures (Fig. 4). Lactic acid bacteria exhibit
an inducible oxidative stress response when exposed to sublethal levels of H2O2 (Condon,
1987), which can be at least as high as 350 ppm (Ito et al., 2003), and would also be
expected to employ a chemical stabilizer to control the reactivity of H2O2.
If the H2O2-H2O hypothesis of martian life (Houtkooper and Schulze-Makuch,
2007) is considered, then an organic stabilizer such as phenacetin could be understood as
a more sophisticated evolutionary adaptation of life to martian conditions than an
inorganic stabilizer such as Na4P2O7. Both, however, would serve as a biomarker for
possible life on Mars. The advantage of phenacetin is that its biosignature can be more
easily detected in thermograms and there is no plausible way of an inorganic production
of this organic compound. Alternatively, the H2O2 in the martian soil may be due to
inorganic processes (Hurowitz et al., 2007), in which case no stabilizer and no evidence
for a stabilizer would be present.
Thus, the detection of a sufficient amount of H2O2 by itself would not provide
evidence for the H2O2-H2O hypothesis. However, the H2O2-H2O hypothesis for life on
Mars would be supported by the following observations: The detection of hydrogen
peroxide plus (1) the detection of fragments of organic molecules by the mass
spectrometer (MS) of TEGA (the TEGA MS cannot detect compounds above 140 daltons
Page 85
76
and, for example, would not be able to detect phenacetin directly, given its molecular
weight of about 195 daltons), (2) the production of excess heat (exothermic signature)
and the detection of the gaseous decomposition products of organic molecules such as
CO2, H2O, O2, and N2 (the decomposition product of H2O2 would only be H2O and O2),
and (3) a measured distinct change in isotope fractionation ratios of 13
C/12
C and 18
O/16
O
toward lighter isotopes at temperatures at which organic molecules decompose. In
addition, the identification of the characteristic signatures of the chemical stabilizers
phenacetin or tetrasodium pyrophosphate, or the characteristic shift produced by a
chemical stabilizer in the thermograms, would add another line of evidence.
Obviously, the idea that the Viking lander observations, which implied a strong
oxidizing agent for the observed reactions (Klein, 1999), were a result of biology are
highly speculative, but so is nearly any conjecture in astrobiology. The main distinction
here is that the biological and the chemical hypotheses presented are testable, which is
rare in this field of study. The experiments reported here were conducted to simulate the
analyses of the TEGA instrument on Mars. Thus, a heating rate of 10oC per minute and
the same sampling volume was used. However, even if the Phoenix mission scientists in
some later meeting would decide to reduce the agreed upon heating rate (which is
technically possible), our work suggests that the thermograms would only be
smoothened, but the general trends and shapes of the thermograms would remain the
same. The results obtained from the TEGA instrument of the Phoenix lander will thus
provide an unbiased test of the nature of the oxidant on Mars and aid in the interpretation
of the results of the Sample Analysis at Mars Instrument Suite (SAM) of the Mars
Science Laboratory (MSL) mission.
Page 86
77
FIGURES
Figure 1 (Thesis Fig. 24 ): Structural formula of chemical stabilizers of hydrogen peroxide,
a. sodium pyrophosphate, b. phenacetin
Page 87
78
Figure 2 (Thesis Fig. 25): Thermograms of various solutions. A. Millipure water with a
peak value of 114°C (+/- 3°C). The peak ranged from 80°C (+/- 1°C) to 117°C (+/- 3°C)
and the peak area was 1403 J/g (+/- 105 J/g). B. 17.5% hydrogen peroxide solution with a
peak value of 117°C (+/- 3°C). The peak area was 1270 J/g (+/- 0.2 J/g) with the peak
ranging from 68°C (+/- 4) to 123°C (+/- 2°C). The solution also exhibited a small
negative peak at 123°C (+/- 1°C) with an area of –7 J/g (+/- 0.3°C). C. 35% H2O2
solution with a peak value of 101oC (+/-1°C). The peak ranged from 52
oC (+/-1) to 117
oC
+/-1). The negative peak is at 117oC (+/-1°C) with an area of -27J/g (+/- 5J/g). D. 35%
hydrogen peroxide solution with sodium pyrophosphate at a ratio of 9 to 1. The
thermogram revealed a large exothermic peak at about 86oC with an area of –103 J/g (+/-
Page 88
79
71 J/g). The main peak had a value of 97°C (+/- 3°C), a range from 87°C (+/- 0.5°C) to
107°C (+/- 6°C) and an area of 874 J/g (+/- 570 J/g). E. Phenacetin revealed a single peak
at 133°C (+/- 1°C) with an area under the curve of 173 J/g (+/- 8 J/g). F. 35 % hydrogen
peroxide solution with 10 % phenacetin. The peak was at 108°C (+/- 1°C) with a range of
61°C (+/- 3°C) to 118°C (+/- 1°C) and an area under the curve of 785 J/g (+/- 37 J/g).
The phenacetin peak appears as a minor peak at a value of 131°C (+/- 1°C) with an area
of 4 J/g (+/- 1 J/g). The solution also displayed again a small negative peak at 118°C (+/-
1°C) characteristic for the exothermic reaction of H2O2 with an area under the curve of –8
J/g (+/- 1 J/g).
Page 89
80
Figure 3 (Thesis Fig. 26): Thermograms with various media and solutions. A. Quartz sand.
The first peaks appear at a value of 44!C (+/- 4!C) with a range of 35!C (+/- 6!C) to 50!C
(+/- 9!C) and a peak area of 8 J/g (+/- 1 J/g). The second, larger peaks have a value of 77!C
(+/- 5!C) with a range from 45!C (+/- 1!C) to 91!C (+/- 6!C) and a peak area of 117 J/g (+/-
21 J/g). A sharp phenacetin peak is observed at 132!C for the hydrogen peroxide solution
with 10 % phenacetin. B. JSC-1 Mars stimulant soil. The first peaks appear at a value of
41!C (+/- 1!C) with a range from 35!C (+/- 1!C) to 46!C (+/- 1!C) and a peak area of 9 J/g
(+/- 2 J/g). The second, larger peaks average at a value of 92!C (+/- 2!C) with a range from
55!C (+/- 6!C) to 120!C (+/- 8!C) and a peak area of 224 J/g (+/- 47 J/g). The phenacetin
peak is again observed at a value of 132!C, but smaller in magnitude. C. Titanium (IV)
Page 90
81
oxide. The first peaks have a value of 42!C (+/- 1!C) with a range from 35!C (+/- 4!C) to
46!C (+/- 1!C) and a peak area of 6 J/g (+/- 3 J/g). The second, larger peaks show much
variation with a range from 62!C (+/- 16!C) to 90!C (+/- 9!C) and an average peak area of
69 J/g (+/- 41 J/g). The phenacetin peak is observed again at a value of 127!C. D. Iron (III)
oxide. The first peaks have a value of 41!C (+/- 3!C) with a range from 37!C (+/- 4!C) to
47!C (+/- 3!C) and a peak area of 7 J/g (+/- 4 J/g). The second, larger peaks vary largely
with a range from 49!C (+/- 6!C) to 85!C (+/- 11!C) and an average peak area of 146 J/g
(+/- 49 J/g). The phenacetin peak is observed at a value of 130!C.
Page 91
82
Figure 27: Thermograms of hydrogen peroxide producing Lactococcus lactis subsp.
lactis and Pseudomonas sp. (non-hydrogen peroxide producing). The thermograms
shown are the result of four independent DSC runs for each culture. The average peak
area is 1,871 J/g (+/-61 J/g) for Lactococcus lactis and 1,488 J/g (+/-169 J/g) for
Pseudomonas sp. The Lactococcus lactis subsp. lactis peak has an average peak
temperature of 93°C (+/- 3°C), while the Pseudomonas sp. peak has an average peak
temperature of 85°C (+/- 3°C).
Page 92
83
APPENDIX B: SUPPLEMENTARY THERMOGRAMS
Figure 28: A) Millipore water, peak = 113.63°C (average), B) 17.5% hydrogen peroxide,
peak = 116.63°C (average), C) 35% hydrogen peroxide, peak = 100.49°C (average), D)
35% hydrogen peroxide with 10% sodium pyrophosphate, peak = 98.40°C (average)
Page 93
84
Figure 29: A) 35% hydrogen peroxide. Fresh, peak = 100.49°C (average), B) 35%
hydrogen peroxide, 20 minute reaction with the atmosphere, peak = 106.60°C (average),
C) 35% hydrogen peroxide, 40 minute reaction with the atmosphere, peak = 105.66 °C
Page 94
85
Figure 30: : A) 35% hydrogen peroxide, fresh, peak = 100.49°C (average), B) 35%
hydrogen peroxide + 10% (w.v) sodium pyrophosphate, fresh, peak = 98.40°C (average),
C) 35% hydrogen peroxide + 10% (w/v) sodium pyrophosphate, 20 minute reaction with
the atmosphere, peak = 99.68°C (average), D) 35% hydrogen peroxide + 10% (w/v)
sodium pyrophosphate, 40 minute reaction with the atmosphere, peak = 97.29°C
(average).
Page 95
86
Figure 31: All the JSC-1 Martian analog soil sample mixtures had a small first peak at
41.92°C (average). A) JSC-1 soil + 10% Millipure water, peak = 92.53°C (average), B)
JSC-1 soil + 10%, 17.5% hydrogen peroxide, peak = 92.78°C (average), C) JSC-1 soil +
10%, 35% hydrogen peroxide, peak = 90.31 (average), D) JSC-1 soil + 10% (35%
hydrogen peroxide +10% sodium pyrophosphate), peak = 93.13°C (average).
Page 96
87
Figure 32: Quartz mixture sample series. A) Quartz + 10% millipure water, peak =
76.42°C (average), B) Quartz + 10%, 17.5% hydrogen peroxide, peak = 84.33°C
(average), C) Quartz + 10%, 35% hydrogen peroxide, peak = 69.81°C (average), D)
Quartz + 10% (35% hydrogen peroxide + 10% sodium pyrophosphate), peak = 76.39°C
(average).
Page 97
88
Figure 33: Iron (III) oxide sample mixture series. A) Iron oxide + 10% Millipure water,
peak = 74.38°C (average), B) Iron oxide + 10%, 17.5% hydrogen peroxide, peak =
84.33°C (average), C) Iron oxide + 10%, 35% hydrogen peroxide, peak = 69.81 °C
(average), D) Iron oxide + 10% (35% hydrogen peroxide + 10% sodium pyrophosphate),
peak = 77.37°C (average).
Page 98
89
Figure 34: Titanium (IV) oxide sample mixture series. A) Titanium oxide + 10%
Millipure water, peak = 75.04°C (average), B) Titanium oxide +10%, 17.5% hydrogen
peroxide, peak = 74.95°C (average), C) Titanium oxide + 10%, 35% hydrogen peroxide,
peak = 84.33°C (average), D) Titanium oxide + 10% (35% hydrogen peroxide + 10%
sodium pyrophosphate), peak = 80.58°C (average).
Page 99
90
Figure 35: Hydrogen peroxide and Phenacetin sample mixture series. A) Phenacetin
alone, peak = 133.02°C, B) 35% hydrogen peroxide + 10% phenacetin, peak = 108.24°C
(average), B) 35% hydrogen peroxide + 10% phenacetin, 20 minute reaction with
atmosphere, peak = 107.37°C (average), D) 35% hydrogen peroxide + 10% phenacetin,
40 minute reaction with the atmosphere, peak = 114.11°C (average).
Page 100
91
Figure 36: Phenacetin sample mixture combined series, including phenacetin alone. All
phenacetin samples show a peak between 130°C - 134°C, near the flash point of .pure
phenacetin (134°C).
Page 101
92
REFERENCES
Alcorn, T.M., Zheng, H.-Y., Gunther, M.R., Hassett, D.J., and Cohen, M.S. (1994)
Variation in hydrogen peroxide sensitivity between different strains of Neisseria
gonorrhoeae is dependent on factors in addition to catalase activity. Infection and
Immunity 62, 2138-2140.
Anders, R.F., Hogg, D.M., and Jago, G.R. (1970) Formation of hydrogen peroxide by
group N streptococci and its effect on their growth and metabolism. Applied
Microbiology 19, 608-612.
Atreya, S.K. and Gu, Z. (1994) Stability of the Martian atmosphere: Is heterogeneous
catalysis essential? J. Geophys. Res. 99, 13133-13145.
Atreya, S.K., Mahaffy, P.R. and Wong, A.S. (2006) Methane and related trace species on
Mars: origin, loss, implications for life and habitability. Planetary and Space Sci. 55(3)
358-369.
Atreya, S.K., Wong, A.-S., Renno, N.O., Farrell, W.M., Delory, G.T., Sentman, D.D.,
Cummer, S.A., Marshall, J.R., Rafkin, S.C.R., and Catling, D.C. (2006) Oxidant
enhancement in Martian dust devils and storms: implications for life and habitability.
Astrobiology 6, 429-450.
Benner, S.A., Devine, K.G., Matveeva, L.N., and Powell, D.H. (2000) The missing
organic molecules on Mars. Proc. Natl. Acad. Sci. USA, 97, 2425-2430.
Biemann, K, Oro, J., Orgel, L.E., Nier, A.O., Anderson, D.M., Simmonds, P.G., Flory,
D., Diaz, A.V., Rushneck, D.R., Biller, J.A. (1976) Search for Organic and Volatile
Inorganic Compounds in Two Surface Samples from the Chryse Planitia Region of Mars.
Science 194:72-76.
Boynton, W.V., Ming, D.W., Kounaves, S.P., Young, S.M.M., Arvidson, R.E., Hecht,
M.H., Hoffman, J., Niles, P.B., Hamara, D.K., Quinn, R.C., Smith, P.H., Sutter, B.,
Catling, D.C. and Morris, R.V. Evidence for Calcium Carbonate at the Mars Phoenix
Landing Site. Science. 3 July 2009:58-61.
Brocks, J.J., Logan, G.A., Buick, R., and Summons, R.E. (1999) Archaean molecular
fossils and the early rise of eukaryotes. Science 285, 1033-1036.
Brown, F.S., Adelson, H.E., Chapman, M.C., Clausen, O.W., Cole, A.J., Cragin, J.T.,
Day, R.J., Debenham, C.H., Fortney, R.E., Gilje, R.I., Harvey, D.W., Kroop, J.L., Loer,
S.J., Logan, J.L., Potter, W.D. Rosiak, G.T. (1978) The biology instrument for the Viking
Mars mission. Rev. Sci. Instrum. 49:139-182.
Page 102
93
Catling, D.C. and Buick, R. (2006) Oxygen and life in the Precambrian. Geobiology 4,
225-226.
Charron, I., Couvert, A., Laplanche, A., Renner, C., Patria, L., and Requieme, B. (2006)
Treatment of odorous sulphur compounds by chemical scrubbing with hydrogen
peroxide--stabilisation of the scrubbing solution. Environmental Science and Technology
40, 7881-7885.
Condon, S. (1987) Responses of lactic acid bacteria to oxygen. FEMS Microbiology
Letters 46, 269-280.
Daly, M.J., Gaidamakova, E.K., Matrosova, V.Y., Vasilenko, A., Zhai, M., Leapman,
R.D., Lai, B., Ravel, B., Li, S.-M.W., Kemmer, K.M., and Fredrickson, J.K. (2007)
Protein oxidation implicated as the primary determinant of bacterial radioresistance. PloS
Biology 5, 769-779.
Dennis, P.C., Sleep, B.E., Fulthorpe, R.R., Liss, S.N. (2003) Phylogenetic analysis of
bacterial population in an anerobic microbial consortium capable of degrading saturation
concentrations of tetrachloroethylene. Can. J. Microbiol. 49:15-27.
Duckworth, R. (1975). Water Relations of Foods. Academic Press, New York.
Encrenaz, Th., Bézard, B, Greathouse, T.K., Richter, M.J., Lacy, J.H., Atreya, S.K.,
Wong, A.S., Lebonnois, S., Lefèvre, F., and Forget, F. (2004) Hydrogen peroxide on
Mars: evidence for spatial and seasonal variations. Icarus 170, 424-429.
Eschenbach, D.A., Davick, P.R., Williams, B.L., Klebanoff, S.J., Young-Smith, K.,
Critchlow, S.M., and Holmes, K.K. (1989) Prevalence of hydrogen peroxide-producing
Lactobacillus species in normal women and women with bacterial vaginosis. J. Clin.
Microbiol. 27, 251-256.
Foley, W.T., Giguère, P.A. (1951) Hydrogen peroxide and its analogues: II. Phase
equilibrium in the system hydrogen-peroxidewater. Can. J. Chemistry, 29, 123-132.
Giguère, P.A., Secco, E.A. (1954) Hydrogen peroxide and its analogues: V. Phase
equilibria in the system D2O-D2O2 Can. J. Chemistry, 32, 550-556.
Ha, Z. and Chan, C.K. (1999). The water activities of MgCl2, Mg(NO3)2, MgSO4 and
their mixtures. Aerosol Science and Technology. 31:154-169.
Hecht, M.H., Kounaves, S.P., Quinn, R.C., West, S.J., Young, S.M.M., Ming, D.W.,
Catling, D.C., Clark, B.C., Boynton, W.V., Hoffman, J., DeFlores, L.P., Gospodinova,
K., Kapit, J. and Smith, P.H. Detection of Perchlorate and the Soluble Chemistry of the
Martian Soil at the Phoenix Landing Site. Science. 3 July 2009:64-67.
Page 103
94
Hurowitz, J.A., Tosca, N.J., McLennan, S.M., and Schoonen, M.A.A. (2007) Production
of hydrogen peroxide in Martian and lunar soils. Earth and Planetary Science Letters
255, 41-52.
Horowitz, N.H., Hobby, G.L., Hubbard, J.S. (1977) Viking on Mars- the carbon
assimilation experiments. J. Geophys. Res. 82:4659-4662.
Houtkooper, J.M. and Schulze-Makuch, D. (2007) A possible biogenic origin for
hydrogen peroxide on Mars: the Viking results reinterpreted. Int. J. of Astrobiology 6,
147-152.
Ito, A., Sato, Y., Kudo, S., Sato, S., Nakajima, H., and Toba, T. (2003) The screening of
hydrogen peroxide-producing lactic acid bacteria and their application to inactivating
psychrotrophic food-borne pathogens. Current Microbiology 47, 231-236.
Junge, K., Eicken, H., & Deming, J. W. (2004). Bacterial Activity at -2 to -20°C in Artic
Wintertime Sea Ice. Applied and Environmental Microbiology, 70(1), 550-557.
Kashefi, K. & Lovley, D. R. (2003). Extending the upper temperature limit for life.
Science, 301, 934.
Klein, H.P. (1978) The Viking biological experiments on Mars. Icarus 34:666-674.
Klein, H.P. (1999) Did Viking discover life on Mars? Orig. Life Evol. Biosph. 29, 625-
631.
Klein,H.P., Horowitz, NH; Levin, GV; Oyama, VI; Lederberg, J; Rich, A; Hubbard, JS;
Hobby, GL; Straat, PA; Berdahl, BJ; Carle, GC; Brown, FS; Johnson, RD. (1976) The
Viking Biological Investigation: Preliminary Results. Science 194(4260):99-105.
Konhauser, K. (2007). Introduction to Geomicrobiology. Blackwell Science Ltd.
Levin, G.V. (1963) Rapid Microbiological Determinations with Radioisotopes. Adv.
Appl. Microbiol. 5:95-133.
Levin, G.V. (2007) Possible evidence for panspermia: the labeled release experiment.
Int. J. of Astrobiology 6, 95-108.
Levin, G.V. and Straat, P.A. (1979a) Completion of the Viking Labeled Release
Experiment on Mars. J. Mol. Evol. 14:167-183.
Levin, G.V. and Straat, P.A. (1979b) Laboratiry Simulations of the Viking Labeled
Release Experiment: Kinetics following second nutrient injection and the nature of the
gaseous end product. J. Mol. Evol. 14:185-197.
Page 104
95
Levin, G.V. and Straat, P.A. (1981) A search for a nonbiological explanation of the
Viking Labeled Release Life Detection Experiment. Icarus 45, 494-516.
Levin, G.V.; Heim, A.H.; Thompson, M.F.; Beem, D.R. (1964) “Gulliver”, an
experiment for extraterrestrial life detection and analysis. Life Sci. Space Res. 2:124-132
Madanská, J., Vitková, Z., and Capková, Z. (2004) Examination of the stability of
hydrogen peroxide solutions. Ceska Slov Farm. 53, 261-263.
Mahaffy, P.R. (2007) Exploration of the Habitability of Mars: Development of Analytical
Protocols for Measurement of Organic Carbon on the 2009 Mars Science Laboratory.
Space Sci. Rev. 135:255-268.
Mancinelli, R.L. (1989) Peroxides and the survivability of microorganisms on the surface
of Mars. Adv. Space Res. 9, 191-195.
McFadden Adams L.A.; Weisman P.R.; Johnson, T.V. (2007) Encyclopedia of the Solar
System, Edition 2. Academic Press.
Mugnier, J. and Jung, G. (1985). Survival of bacteria and fungi in relation to waer
activity and the solvent properties of water in biopolymer gels. Appl. Env. Microbiol.
50(1):108-114.
NASA JPL Mars Science Laboratory Homepage
http://marsprogram.jpl.nasa.gov/msl/index.html downloaded July 21, 2009.
NASA Mars fact sheet: http://www.nasa.gov/worldbook/mars_worldbook.html,
downloaded June 15, 2009.
NASA Mars Phoenix home page: http://phoenix.lpl.arizona.edu/. Downloaded July 1,
2009.
NASA Viking fact sheet: http://www.nasa.gov/mission_pages/viking/viking30_fs.html,
downloaded June 10, 2009.
Nussinov, M.D., Chernyak, Y.B., and Ettinger, J.L. (1978) Model of the fine-grain
component of martian soil based on Viking lander data. Nature 274, 859-861.
Oyama, V.I., Berdahl, B.J., Carle, G.C., Lehwalt, M.E., Ginoza, H.S. (1976) The search
for life on Mars: Viking 1976 gas changes as indicators of biological activity. Orig. Life
7:313-333.
Oyama, V.I. and Berdhal, B.J. (1977) The Viking gas exchange experiment results from
Chryse and Utopia surface samples. J. Geophys. Res. 82:4669-4676.
Page 105
96
Pawkit Water Activity Meter Manual. (2008). Version 4, Decagon Devices, Pullman,
WA.
Plum, R.C., Tantayanon, R., Libby, M., and W.W. Xu (1989) Chemical model for Viking
biology experiments : implications for the composition of the martian regolith. Nature
338, 633-635.
Prior, B.A. (1979). Measurement of water activity in foods: A review. Journal of Food
Protection. 42(8):668-674.
Quinn, R.C. and Zent, A.P. (1999) Peroxide-modified titanium dioxide: a chemical
analog of putative Martian soil oxidants. Orig. Life Evol. Biosph. 29, 59-72.
Raymond, J. and Segre, D. (2006) The effect of oxygen on biochemical networks and the
evolution of complex life. Science 311, 1764-1767.
Rivkina, E. M., Friedmann, E. I., McKay, C. P., & Gilichinsky, D. A. (2000). Metabolic
activity of permafrost bacteria below the freezing point. Applied and Environmental
Microbiology, 66, 3230-3233.
Rothschild, L. J. & Mancinelli, R. L. (2001). Life in Extreme Environments. Nature, 409,
1092-1101.
Ryan, C.S. and Kleinberg, I. (1995) Bacteria in human mouths involved in the production
and utilization of hydrogen peroxide. Arch. Oral. Biol. 40, 753-763.
Schulze-Makuch, D. & Irwin, L. N. (2006). Life in the Universe, Expectations and
Contraints. Springer.
Schuerger, AC and Benton, CC. (2008) Viking Biology Experiments: Lessons learned
and the role of ecology in future Mars life-detection experiments. Space Sci Rev.
135:233-243.
Sellers, K, Weeks, K., Alsop, W., Clough, S.R., Hoyt, M., Pugh, B., Robb, J. (2006)
Perchlorate: Environmental Problems and Solutions. CRC Press, New York.
Shapiro, R.L., Hatheway, C.,Swerdflow, D. (1998). Botulism in the United States: A
Clinical and Epidemiologic Review. Annals of Internal Medicine 129 (3): 221.
P. H. Smith, L. K. Tamppari, R. E. Arvidson, D. Bass, D. Blaney, W. V. Boynton, A.
Carswell, D. C. Catling, B. C. Clark, T. Duck, E. DeJong, D. Fisher, W. Goetz, H. P.
Gunnlaugsson, M. H. Hecht, V. Hipkin, J. Hoffman, S. F. Hviid, H. U. Keller, S. P.
Kounaves, C. F. Lange, M. T. Lemmon, M. B. Madsen, M. Malin, W. J. Markiewicz, J.
Marshall, C. P. McKay, M. T. Mellon, D. W. Ming, R. V. Morris, W. T. Pike, N. Renno,
U. Staufer, C. Stoker, P. Taylor, J. A. Whiteway, A. P. Zent. H2O at the Phoenix Landing
Site. Science. 3 July 2009: 58-61.
Page 106
97
Stewart, P.S. Roe, F., Rayner, J., Elkins, J.G., Lewandowski, Z., Ochsner, U.A., and
Hassett, D.J. (2000) Effect of catalase on hydrogen peroxide penetration into
Pseudomonas aeruginosa biofilms. Applied Environmental Microbiology 66, 836-838.
Tanenbaum, S.W. (1956) The metabolism of Acetobacter peroxidans. I. Oxidative
enzymes. Biochim. Biophys. Acta 21, 335-342.
Troller, J.A. and Christian, J.H.B. (1978). Water Activity and Food. Academic Press,
New York.
Watts, R.J., Finn, D.D., Cutler, L.M., Schmidt, J.T., and Teel, A.L. (2007). Enhanced
stability of hydrogen peroxide in the presence of subsurface solids. J Contam Hydrol. 91,
312-326.
Yen, A.S., Kim, S.S., Hecht, M.H., Frant, M.S., and Murray, B. (2000) Evidence that the
reactivity of the Martian soil is due to superoxide ions. Science 289, 1909-1912.
Zent, A.P. and McKay, C.P. (1994) The chemical reactivity of the Martian soil and
implications for future missions. Icarus 108, 146-157.