The Distribution and Habitat Preference of the North Atlantic Minke Whale (Balaenoptera acutorostrata acutorostrata) in the Southern Outer Moray Firth, NE Scotland By Michael J Tetley University of Wales Bangor Master of Science Thesis Marine Mammal Science 2004
Transcript
The Distribution and Habitat Preference of the
North Atlantic Minke Whale (Balaenoptera acutorostrata acutorostrata)
in the Southern Outer Moray Firth, NE Scotland
By
Michael J Tetley
University of Wales Bangor
Master of Science Thesis
Marine Mammal Science
2004
2
DECLARATION This work has not previously been accepted in substance for any degree and is not being concurrently submitted in candidature for any degree. Signed …………………………………………… (candidate) Date …………………………………………… STATEMENT 1 This dissertation is being submitted in partial fulfilment of the requirements for the degree of ……………………………………….. (insert MA, MSc, MBA etc., as appropriate) Signed …………………………………………… (candidate) Date …………………………………………… STATEMENT 2 This dissertation is the result of my own independent work/investigation,
except where otherwise stated. Other sources are acknowledged by
footnotes giving explicit references. A bibliography is appended.
Signed …………………………………………… (candidate) Date …………………………………………… STATEMENT 3 I hereby give consent for my dissertation, if accepted, to be available for photocopying and for inter-library loan, and for the title and summary to be made available to outside organisations. Signed …………………………………………… (candidate) Date ……………………………………………
3
- The Great Wave
Katsushika Hokusai
"Would'st thou," so the helmsman answered, "learn the
secret of the sea? Only those who brave its
dangers comprehend its mystery!"
- The Secret of the Sea
Henry Wadsworth Longfellow
4
Abstract
Many studies have attempted to show correlations between the distribution of marine
mammals and the surrounding environment. Sightings have been reported of minke
whales (Balaenoptera acutorostrata, Lacepede 1804) occurring in the Moray Firth, a
large embayment in the north east of Scotland. No detailed studies have been
published on the presence of these animals in this region, nor has any research on
their distribution in these coastal waters during the summer and autumnal months
been conducted. A study was carried out to investigate if any significant patterns were
observed between the distributions of minke whales and environmental variables in
the southern outer Moray Firth. The study used a range of techniques and methods
including behavioural observations, geographical information systems and remote
sensing to determine environmental effects on the species spatio-temporal
distribution. Results showed that the strongest correlations between whale distribution
and encounter frequency were with fixed variables such as bathymetry and sediment
type. A number of interesting observations were made between the distribution of
whales and two important oceanographic features, a cold water current and a warm
water plume, which dominate the Moray Firth system. These were thought to affect
non-fixed variables such as temperature and primary productivity within the
embayment, both of which are primarily associated with providing suitable habitat for
the minke whales primary prey species, the sandeel (Ammodytes marinus). Therefore,
these environmental variables promote productivity associated with higher densities
of available prey. Lastly, detailed observations showed that distribution with regard to
age class and behaviour were correlated with significant variations in the surrounding
environment. These findings support the supposition that this area is important to the
whales for foraging and further indicates the possible presence of habitat partitioning
in this species. The information from the study not only adds to our understanding of
minke whale ecology but also raises questions on the possible impacts to the species
from anthropogenic activities such as increasing vessel traffic and demersal fishing
techniques. Finally, the advantages of this method, in relation to uses in ecological
modelling and the formation of new marine protected areas for the conservation and
management of this and other marine mammal species, are also discussed.
Figure 3.6 AVHRR monthly composite images showing the sea surface
temperature for the Moray Firth in June, July, August and
September during 2002 to 2004……………………………………….55
Figure 3.7 SeaWiFS composite images showing the mean monthly chlorophyll-a
concentration for the study area in June, July, August & September
during 2002 - 2004…………………………………….........................58
Figure 3.8 Stacked histograms of minke whale encounter frequency, for adult and
juvenile animals, across the range of environmental variables
associated with their distribution……………………………………...63
Figure 3.9 Stacked histograms of minke whale encounter frequency, for travelling
and foraging animals, across the range of environmental variables
associated with their distribution. …………………………………….67
Figure 3.10 Scatter plots of chlorophyll-a concentration and sea surface
temperature for the distributions of adult and juvenile minke
whales……….……………………………………….………………...71
Figure 3.11 Scatter plots of depth and chlorophyll-a concentration for the
distributions of adult and juvenile minke whales………………….......72
Figure 3.12 Scatter plots of sea surface temperature and slope for the
distributions of travelling and foraging minke whales.…………...…...72
10
List of Tables Page
Table 1.1 Table of cetacean species which have been sighted around the coasts
of the British Isles……………………………………………………...31
Table 2.1 Definitions used to determine the age class (adults & juveniles) and
behavioural activity (travelling & foraging) of minke whales
recorded during encounters………………….…………………………38
Table 3.1 Survey effort by route type for the years 2000 to 2004………………......48
Table 3.2 Number of minke whale encountered during the study for the months
May to September between 2000 and 2004……………….…………...49
Table 3.3 Results of ground truth sampling of chlorophyll-a concentration
during 2004……………………………………………………….……61
Table 3.4 Results of Kolmogorov-Smirnov tests (statistic and probability values)
used to determine if environmental data set associated with minke
whale encounters was normally distributed.…………………………..62
Table 3.5 Results of t-tests (statistic and probability values) used to determine
differences occurring in the distribution of adult and juvenile minke
whales in relation to environmental variables………………………....65
Table 3.6 Results of t-tests (statistic and probability values) used to determine
differences occurring in the distribution of travelling and foraging
minke whales in relation to environmental variables………………….66
Table 3.7 Summary of probability values obtained form Pearson’s correlation
tests used to determine correlations between variables SST,
chlorophyll-a, depth & slope, associated with the distribution
of minke whales………………………..……………………………...70
11
List of Appendices Page
Appendix A Example of minke whale encounter logs used to record
information …………………………………………………..……..109
Appendix B Example of minke whale dive duration logs used to record
information ….………………………………………………….…..109
Appendix C Example of minke whale survey form used as a hard copy for
storage of survey trip and encounter information……………...…...110
Appendix D Example of minke whale survey form used as a hard copy for
storage of encounter information……………………………..…….110
Appendix E CD rom containing encounter and environmental data used during
the study…………….…………………………………………...…111
12
1. Introduction
13
1 Introduction
1.1 The Minke Whale
1.1.1 Taxonomy
The minke whale Balaenoptera acutorostrata Lacepede 1804 is the smallest species
of whale in the family Balaenopteridae, also known as the rorqual whales (Gill,
1994). Other species in this family include the blue whale Balaenoptera musculus,
fin whale Balaenoptera physalus, sei whale Balaenoptera borealis, brydes whale
Balaenoptera edeni and the humpbacked whale Megaptera novaeangliae
(Bannister, 2002). The Balaenopteridae belong to the larger sub order Mysticeti.
This includes all those whales with plates of baleen instead of teeth, incorporating
the families Balaenopteridae (rorqual whales), Eschrichtiidae (gray whale),
Balaenidae (right and bowhead whales) and the Neobalaenidae (pygmy right whale)
(Bannister, 2002). See Figure 1.1 for a diagram of the members of these families.
The Mysticeti are of the order Cetacea which also includes the Odontoceti, those
species which have teeth instead of plates of baleen.
Until recently the minke whale was considered to be only one species Balaenoptera
acutorostrata. However, in recent years, through morphological and genetic studies,
it has been accepted that many geographically distinct subspecies occur
(Christensen et al., 1990; Martinez & Pastene, 1999; Born et al., 2003). Minke
whales which occur in the northern hemisphere, also referred to as the common
minke whale, have been divided into two subspecies. These include the North
Atlantic minke whale Balaenoptera acutorostrata acutorostrata and the North
Pacific minke whale Balaenoptera acutorostrata scammoni (Perrin et al., 2002).
The primary morphological difference between the two subspecies are the extent of
the white pigmentation or ‘spot’ on the pectoral flipper, the ‘spot’ having a greater
coverage in B. a. acutorostrata than in B. a. scammoni (Gill, 1994). Although both
species grow to a similar size (7-9 metres) the morphology of the skull appears to
differ, those animals from the Atlantic having longer rostrums than those from the
Pacific (Gill, 1994; Perrin et al., 2002). Recently within the southern hemisphere
more divisions have been made to minke whale taxonomy. A new species, the
….
14
Figure 1.1 Diagram of the current members of the Mysticete families (adapted from Jefferson et al., 2003).
Southern right whale(Eubalaena australis)
Humpback whale
(Megaptera novaeangliae)
Northern right whale(Eubalaena glacialis)
Bowhead whale(Balaena mysticetus)
Gray whale(Eschrichtius robustus)
Pygmy right whale(Caperea marginata)
Minke whale(Balaenoptera acutorostrata)
Brydes whale (Balaenoptera edeni)
Sei whale (Balaenoptera borealis)
Fin whale(Balaenoptera physalus)
Blue whale (Balaenoptera musculus)
15
Antarctic minke whale Balaenoptera bonaerensis, has been acknowledged (Perrin
et al., 2002). This species usually lacks the pronounced white patch on the pectoral
fin. It is believed that individuals of the species B. acutorostrata, share a
distribution in the southern hemisphere with B. bonaerensis, also considered to be a
subspecies of the common minke, however they have yet to be named. These
animals appear to be similar in appearance to the common species due to a white
patch on the flipper (also extending up and over the shoulder). Also, as evident by
their commonly used name, the dwarf minke whale, attain much smaller sizes, only
reaching approximately 7 metres in length when adult (Perrin et al., 2002).
For the remainder of this thesis any following biological or ecological
characteristics described will be for the common North Atlantic subspecies
Balaenoptera acutorostrata acutorostrata.
1.1.2 Distribution
The minke whale has a large and cosmopolitan distribution, being found in all the
worlds’ oceans (Perrin et al., 2002). A distribution map can be found in Figure 1.2.
However, the species is considered to be more frequently distributed in near-shore
areas than with the open ocean. Minke whales are most commonly associated with
coastal habitats or ice edge areas (Kasamatsu et al., 2002). The occurrence of minke
whales is also variable throughout the year as the species make seasonal migrations
between polar feeding grounds and lower latitude breeding and calving sites (Perrin
et al., 2002). In North Atlantic minke whales, animals are frequently observed
feeding in Baffin Bay in the Canadian arctic, Svalbard in the Greenland Sea, the
Gulf of St Lawrence, Iceland and Norway (Christensen et al., 1990). Minke whales
also migrate into the coastal waters of the British Isles. Previous studies have
documented the presence of minke whales in and around the Hebridean Islands on
the west coast of Scotland (Gill, 1994; Gill et al., 2000; Stockin et al., 2001;
Macleod et al., 2004). In the North Atlantic the lower latitude breeding grounds for
the species are poorly understood but are believed to be within the Caribbean in the
west and around the straits of Gibraltar in the east (Christensen et al., 1990).
16
1.1.3 Morphology
The minke whale, like other members of the family Balaenopteridae, has a fusiform
body shape, two pectoral fins, a caudal fluke and a falcate dorsal fin located two
thirds of the way back along the body (Gill, 1994; Perrin et al., 2002). An
illustration of the morphology of the minke whale can be found in Figure 1.3. The
species also has a particularly pointed rostrum with a single head ridge leading back
towards a pair of blow holes. Approximately 50 to 70 throat grooves are found on
the ventral side of the animal and extend backwards towards the naval (Christensen
et al., 1990). Approximately 230-360 baleen plates, hair-like panels comprised of
keratin, hang from each side of the roof of the mouth. These plates have a length of
around 25 cm with a width of approximately 12 cm at their base (Christensen et al.,
1990; Perrin et al., 2002). The average length of a minke whale has been estimated
as 8.5 – 8.8 metres in females and 7.8 – 8.2 metres in males (Christensen et al.,
1990).
Overlap Antarctic Minke Whale with Dwarf Minke Whale B. acutorostrata subspecies
Figure 1.2 Map of the distribution of the three minke whale species / subspecies. These include the common minke whale Balaenoptera acutorostrata, the Antarctic minke whale Balaenoptera bonaerensis and the dwarf minke whale (unnamed B. acutorostrata subspecies). (ACS online 2004)
Common Minke Whale Balaenoptera acutorostrata Antarctic Minke Whale Balaenoptera bonaerensis
17
Minke whales are predominantly grey in colouration with lighter areas of
pigmentation observed on the lateral sides. These often unique markings are known
as chevrons and have proven useful for purposes of photo identification (Dorsey,
1983; Dorsey, 1990). The most distinctive pattern of pigmentation which
distinguishes the minke whale from the rest of the Balaenopteridae is the white
pigmentation or ‘spot’ found on the pectoral fin (Christensen et al., 1990; Gill,
1994).
1.1.4 Feeding Ecology
The minke whale is a member of the mysticete whales. Their feeding strategies
revolve around the use of baleen, plates constructed from keratin which hang from
the roof of the mouth in place of teeth (Bowen et al., 2002). Mysticete whales are
grouped into three main types on the way in which the baleen plates are utilised.
These are the swallowers which actively engulf compacted aggregations of prey,
skimmers which passively entrap prey whilst swimming through the water column
and swallowers and skimmers which use both strategies (Bowen et al., 2002;
Bannister, 2002). Minke whales are classified as swallowers and skimmers due to
observations confirming the use of both strategies (Hoelzel et al., 1989; Gill, 1994).
Figure 1.3 Illustration of the morphology of the minke whale Balaenoptera acutorostrata i) lateral view ii) dorsal view.
ii)
i)
Throat grooves Pectoral fin ‘spot’
Dorsal fin
Caudal fluke
Blow holes
Head ridge
18
Swallowing strategies are the most frequently observed strategy used by minke
whales within British waters. Like all Balaenopterid whales Balaenoptera
acutorostrata feed by engulfing large quantities of water containing high densities
of prey e.g. fish. Special grooves in the throat allow expansion of the throat to
contain the prey laden water (Perrin et al., 2002; Lambertsen & Hintz, 2004). The
water is expelled from the mouth through the baleen plates, which act like a filter,
and prevent the escape of prey. Once all the water has been removed the prey is
then swallowed (Hoelzel et al., 1989; Bowen et al., 2002).
A number of different feeding techniques have been observed in minke whales.
These include techniques which are used to aggregate prey together to then be
engulfed, such as bubble blowing and lunging (Hoelzel et al., 1989). Minke whales
have been observed feeding in association with a number of other species. These
include other marine mammals such as the harbour porpoise Phocoena phocoena,
and non-prey fish such as the mackerel Scomber scombrus. However, the most well
documented case of interspecific interaction is that between minke whales and
seabirds (Gill et al., 2000). Commonly when minke whales are observed to be
feeding a number of bird species are often present. This has been phrased as ‘bird
associated feeding’. Some of the species which are frequently observed during bird
associated feeding include the gannet Morus bassanus, kittiwake Rissa tridactyla,
herring gull Larus argentatus, guillemot Uria aalge and razor bill Alca torda. It has
also been hypothesised that individual minke whales tend to specialise in one of
these feeding techniques, i.e. bird associated feeding or by aggregating prey
together using lunging and bubble blowing (Hoelzel et al., 1989).
The diet of the minke whale contains a range of different species including fish,
crustaceans and cephalopods. However, due to the minke whales’ cosmopolitan
distribution the composition of an individual minke whales’ diet may vary greatly
between different regions. It is well documented that those whales occurring in the
southern hemisphere feed nearly exclusively on Euphausiids, such as the Antarctic
krill Euphausia superba, whilst those animals in the northern hemisphere feed on a
much wider range of prey (Martensson et al., 1996; Skaug et al., 1997). However, it
has been shown that minke whales only select and feed on single prey species
aggregations (Tamura & Fujise, 2002). In the north east Atlantic and those waters
19
surrounding the British Isles the primary prey species identified were the sandeel
Ammodytes marinus, sprat Sprattus sprattus and the herring Clupea harengus
(Haug et al., 1997; Lindstrom et al., 2002) (see Figure 1.4). Dietary analysis from
the stomach contents of stranded animals found around the north of Scotland found
that sandeels comprised the most significant part of the contents, whilst sprat and
herring comprised the next most important parts (pers.comm. Begoña Santos).
Finally, it has been shown that minke whale distribution also changes with time
during the foraging season. It is believed that this may be due to animals following
the migrations of certain species, such as spawning herring, or changing between
prey species which become more abundant than one another during the time spent
at foraging sites (Macleod et al., 2004).
1.2 Cetaceans and the Environment
In recent years many studies have attempted to show if correlations exist between
the distributions of marine mammals and the surrounding environment. Those
activities which have either utilised these species as a resource (Jaquet et al., 1996),
or more recently those who have studied the animals for management and
conservation (Hooker & Gerber, 2004), have known that marine mammals are not
evenly distributed throughout the world oceans, seas and rivers, and that they
favour and concentrate in certain areas (Yen et al., 2004). These species are
Figure 1.4 Main prey species of minke whale (Balaenoptera acutorostrata) in the British Isles i) sandeel Ammodytes marinus ii) sprat Sprattus sprattus iii) herring Clupea harengus. (Adapted from Fishbase, 2004)
i) ii)
iii)
20
logistically hard to access and as such research is often difficult. Some insights have
been made although further research will be invaluable.
The following sections will review some of the recent research conducted in this
field and what insights have been made.
1.2.1 Bathymetry
The marine environment is often thought by many to be a flat and homogeneous
area (Cox & Moore, 1994). However, it has formed through many of the same
geological processes which have shaped the terrestrial environment, so shares many
similarities. On land there are steep mountain chains, expanses of plains and deep
valleys and gorges. These are also present under the world’s seas and oceans,
concealed under vast quantities of sea water. These include great mid oceanic ridges
which run the lengths of the world’s major ocean basins, chains of sea mounts
pushed up to the surface by volcanic activity and deep canyons and trenches
plunging down to depths of almost 11,000 feet (Nybakken, 2000). These are formed
by large scale geological events and as such are rare and isolated. However, even on
a finer local scale there are differences in the bathymetry or underwater topography
between different areas (Croll et al., 1998). This can not only effect the
oceanography of the area, i.e. mixing of water masses, circulation of nutrients
(Kimura et al., 1997) but also those species which are located within this habitat.
Many species rely on particular conditions of sediment type and bathymetry when
selecting habitats. The distribution of these species is not uniform so aggregations
are often present in particular sites of optimal habitat (Worm et al., 2003). In marine
mammals, especially the cetaceans, the two primary reasons for selecting a certain
habitat are either related to foraging (areas of high prey density) or reproduction
(favourable for courtship and giving birth to young). It has been shown that
correlations exist between cetacean distributions and physiographic features, such
as ocean depth and sea floor slope, as well as hydrographic characteristics which
may affect animals directly (Baumgartner, 1997). However, it is believed that these
environmental factors mostly effect cetacean distribution secondarily, through their
effects on the distribution of cetacean prey (Davis et al., 2002). Complex
21
bathymetries, such as submarine canyons, deep basins, and steep slopes, can
influence the surrounding seawater and produce important oceanographic features
such as fronts and eddies (Kimura et al., 1997; Yen et al., 2004). These features act
to aggregate weakly swimming organisms (e.g. plankton) and bring them closer to
the surface, allowing greater access to diving predators (Croll et al., 1998). This
process of anchoring important oceanographic features in areas with specific
bathymetric characteristics has been important in understanding the persistent
presence of top marine predators within certain areas (Yen et al., 2004).
Examples of studies which have found correlations between the distributions of
marine mammals and bathymetric features, such as ocean depth and sea floor slope,
include the presence of northern bottlenose whales (Hyperoodon ampullatus) in the
Gully, a submarine canyon off Nova Scotia, Canada (Hooker, 1999). This study
highlighted the importance of the Gully to this species, due to the way in which the
canyon acted to aggregate squid, such as Gonatus spp which forms a primary
component of the whale’s diet (Hooker et al., 2002). Baumgartner (1997) found that
the distribution of risso’s dolphins (Grampus griseus) in the Gulf of Mexico was
not uniformly distributed with depth or slope. The species was closely associated
with steep sections of the upper continental slope in the northern regions of the
Gulf. This was also suggested to be the case when cetacean distribution was
secondarily effected by the distribution of particular prey in these areas. Lastly,
Hastie (2004) related the surface behaviours of bottlenose dolphins (Tursiops
truncatus) to areas of certain bathymetry associated with higher abundances of
bottlenose dolphin prey. Due to the use of this behavioural data Hastie was able to
show that the distribution of animals over certain areas does not reveal the
underlying function of that habitat to a species.
1.2.2 Water Temperature
As stated earlier oceanographic variables can have important effects on the
distributions of many species of marine mammal. One feature which can affect the
physical and biological processes occurring in the sea is the temperature of the
water (Selzer & Payne, 1988). Water temperature can effect the distribution of
marine mammals in many ways. Firstly all marine mammals, cetaceans in
22
particular, are greatly affected by heat loss by being immersed in water. Therefore,
in order to survive, cetaceans have developed ways to maintain body heat and
energy expended on thermoregulation to ensure an efficient energy budget (Hind &
Gurney, 1997). Therefore, many species, once adapted to certain temperature
regimes, can only occur in those areas. An example of this is the distribution of the
harbour porpoise (Phocoena phocoena) in European waters (Bjorge & Tolley,
2002). Harbour porpoise are found in the North Atlantic and the Black Sea.
However, no harbour porpoise are found in the Mediterranean Sea. It is currently
hypothesised that the species distribution may have once stretched from the Atlantic
through to the Black sea (Martin & Reeves, 2002). A changing climate was thought
to have made temperatures in the Mediterranean Sea increase. Because of their
adaptations to colder ambient water temperatures some harbour porpoise were
trapped in the Black Sea over time. They now differ genetically from the Atlantic
population (Bjorge & Tolley, 2002).
The primary way that temperature can effect the distribution of marine mammals is
through the influence of physical and biological processes of the area affecting the
abundance of prey (Wakefield, 2001). Water masses with different temperatures
have different salinity and oxygen carrying capacities (Nybakken, 2000). When two
water masses of different water temperatures collide, an area described as a front is
formed (Horsburgh et al., 1998). Many studies have shown these frontal zones to be
sites of enhanced biomass (Franks, 1992). This occurs through a process of
stratification in the water column, ensuring those organisms such as plankton
remain in surface water for longer periods of time (Franks, 1992; Kimura et al.,
1997). Therefore, being able to identify those areas, such as fronts in sea surface
temperature, can indicate those places set to have higher abundances of prey for
marine mammals to forage (Benson et al., 2002). Some larger species which act as
prey for marine mammals can also be affected directly by temperature. The
mackerel (Scomber scombrus) migrates large distances around the coasts of the UK.
In a study by Reid (1997) it was shown that the migrating behaviour of mackerel
was altered at different temperatures. Those animals subjected to colder water
temperature would swim fast and cover large distances. However, if ambient
temperatures were warm, mackerel migration slowed and they remained longer in
areas of warm water (Reid et al., 1997).
23
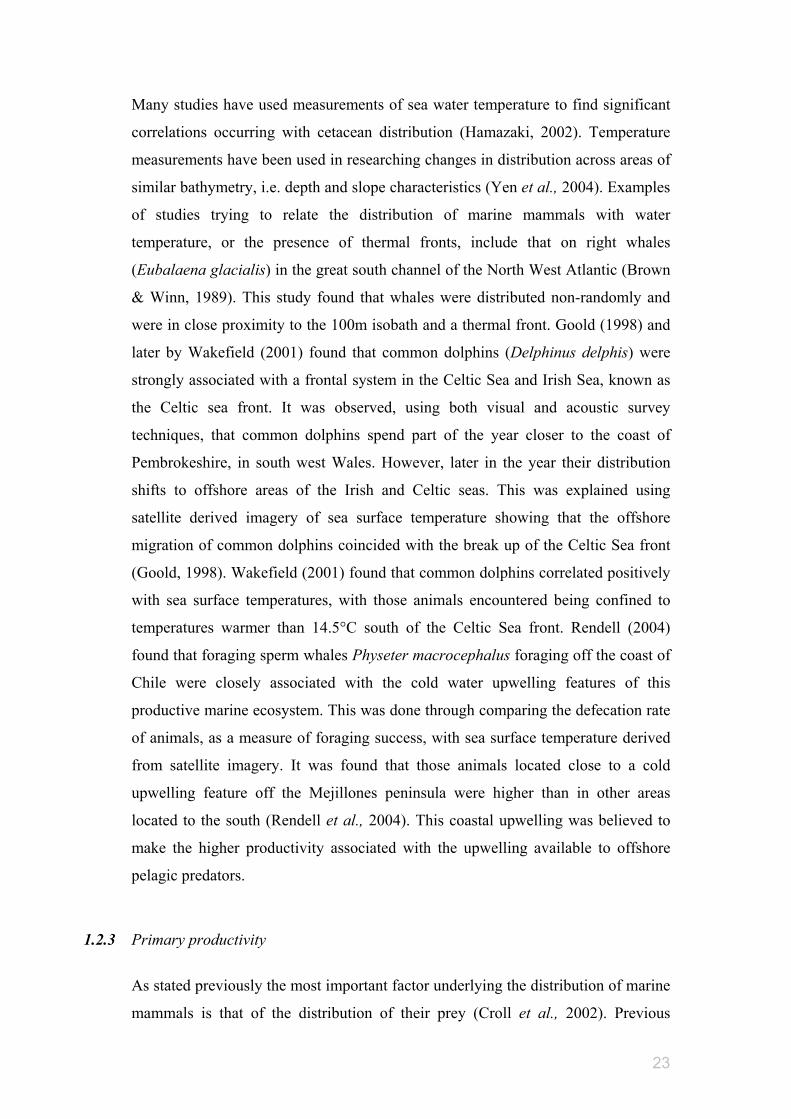
Many studies have used measurements of sea water temperature to find significant
correlations occurring with cetacean distribution (Hamazaki, 2002). Temperature
measurements have been used in researching changes in distribution across areas of
similar bathymetry, i.e. depth and slope characteristics (Yen et al., 2004). Examples
of studies trying to relate the distribution of marine mammals with water
temperature, or the presence of thermal fronts, include that on right whales
(Eubalaena glacialis) in the great south channel of the North West Atlantic (Brown
& Winn, 1989). This study found that whales were distributed non-randomly and
were in close proximity to the 100m isobath and a thermal front. Goold (1998) and
later by Wakefield (2001) found that common dolphins (Delphinus delphis) were
strongly associated with a frontal system in the Celtic Sea and Irish Sea, known as
the Celtic sea front. It was observed, using both visual and acoustic survey
techniques, that common dolphins spend part of the year closer to the coast of
Pembrokeshire, in south west Wales. However, later in the year their distribution
shifts to offshore areas of the Irish and Celtic seas. This was explained using
satellite derived imagery of sea surface temperature showing that the offshore
migration of common dolphins coincided with the break up of the Celtic Sea front
(Goold, 1998). Wakefield (2001) found that common dolphins correlated positively
with sea surface temperatures, with those animals encountered being confined to
temperatures warmer than 14.5°C south of the Celtic Sea front. Rendell (2004)
found that foraging sperm whales Physeter macrocephalus foraging off the coast of
Chile were closely associated with the cold water upwelling features of this
productive marine ecosystem. This was done through comparing the defecation rate
of animals, as a measure of foraging success, with sea surface temperature derived
from satellite imagery. It was found that those animals located close to a cold
upwelling feature off the Mejillones peninsula were higher than in other areas
located to the south (Rendell et al., 2004). This coastal upwelling was believed to
make the higher productivity associated with the upwelling available to offshore
pelagic predators.
1.2.3 Primary productivity
As stated previously the most important factor underlying the distribution of marine
mammals is that of the distribution of their prey (Croll et al., 2002). Previous
24
studies relating marine mammal distribution to the environment have focused on
showing correlations with physiographic or oceanographic features that promote
productivity. As a result these support much higher biomass and organisms further
up trophic chains and webs (Yen et al., 2004). There are a few studies which have
attempted to directly correlate the abundance of cetaceans with measurements of
productivity. In the marine environment all ecosystems which derive energy from
sunlight begin with that part of the plankton, tiny microscopic organisms, which are
capable of photosynthesis. This is the process of using light to generate simple
carbohydrates and sugars (Nybakken, 2000). These plant plankton or phytoplankton
can only do this because of photosynthetic pigments called chlorophylls (Holligan
& Groom, 1986). Phytoplankton abundance can change quickly and is highly
dependable on many environmental factors such as the availability of nutrients,
water temperature and water circulation (Franks, 1997; Joint & Groom, 2000). By
being able to measure the concentration of phytoplankton, or alternatively the
concentration of chlorophyll pigment in the water, it becomes possible to quantify
the amount of primary productivity occurring at the base of the trophic system.
Therefore, it is possible to ascertain the amount of biomass or organisms which can
be supported higher up the food chain (Smith et al., 1986; Littaye et al., 2004).
Recent examples of studies using chlorophyll concentration, as a measure of
primary productivity to understand marine mammal distribution, include the study
of the distribution of sperm whales killed by Yankee whalers during the 18th and
19th century (Jaquet et al., 1996). This study showed that there was a significant
correlation between the distribution of whales caught by whalers and areas
characterised by high concentrations of chlorophyll obtained from modern satellite
imagery. Smith and others (1986) used satellite imagery of the concentrations of
chlorophyll present off the coast of California to understand the distribution of
marine mammals. Study showed that the distribution of animals was not randomly
distributed with respect to chlorophyll concentrations and that cetaceans were more
abundant in the productive coastal areas than in the offshore oceanic waters of the
California current (Smith et al., 1986). Finally, Littaye and others (2004) used
chlorophyll concentration data from satellite images to try to explain the summer
distributions of fin whales (Balaenoptera physalus) in the northwestern
Mediterranean Sea. The study highlighted strong correlations between the
25
distributions of whales and areas of high primary productivity and also made
insights into the variability of fin whale distribution during the summer months.
While food availability at a particular time and place was thought to be a function
of environmental conditions occurring in previous months, the study provided
evidence that the whales adapted their movements and group size directly to food
availability rather than to instantaneous changes in environmental conditions
(Littaye et al., 2004).
Studies which have used chlorophyll concentration as a indication of primary
productivity effects on marine mammal distribution have been useful. They support
the hypothesis that the movement and habitat selection of cetacean species, such as
sperm whales, fin whales and oceanic dolphins, may be related to the mesoscale
features that are manifest in patterns of chlorophyll (Smith et al., 1986; Kimura et
al., 1997). It is also suggested that satellite derived measurements of chlorophyll
may be useful in the future as a habitat descriptor for a number of marine mammal
species, as well as useful in the interpretation of observed distribution patterns and
the estimation of their movements and abundance (Smith et al., 1986; Littaye et al.,
2004).
1.3 The Moray Firth
The following section describes many of the important aspects of the biology,
ecology and geology of the Moray Firth, north east Scotland.
1.3.1 Location and Extent
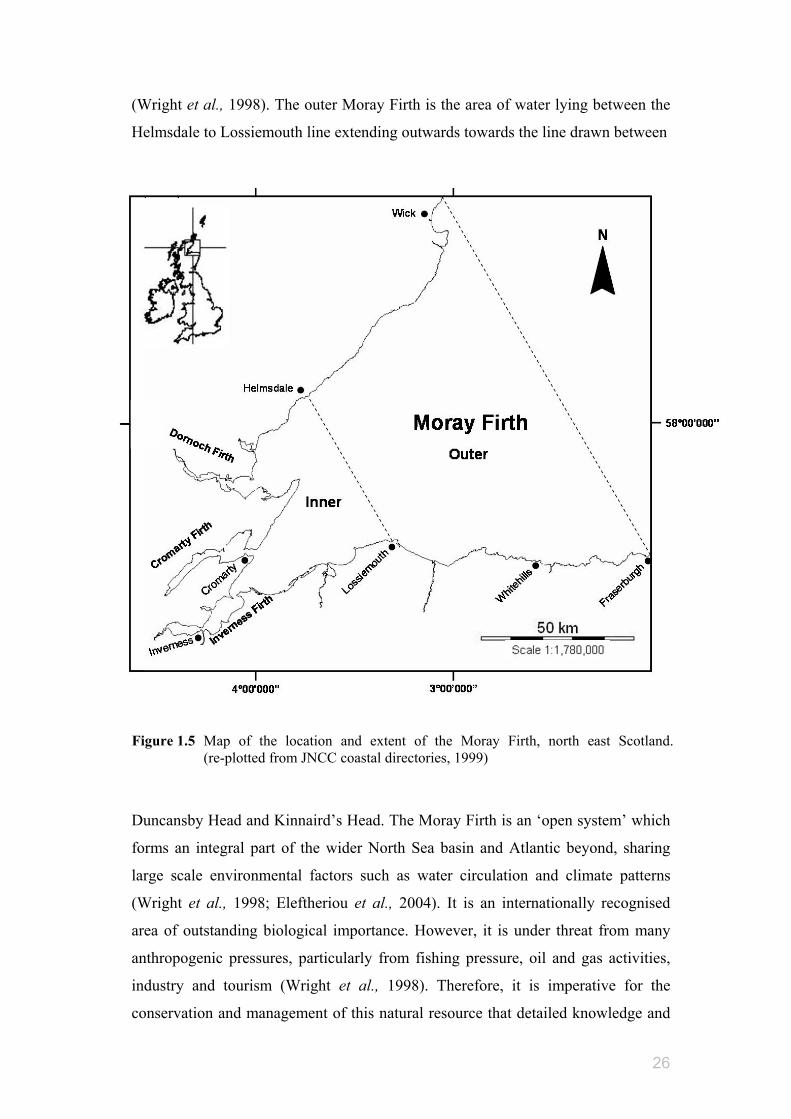
The Moray Firth is a large embayment in the north east of Scotland, bounded on
two sides by land, the outer extremity of which is considered as an arc reaching
from Duncansby Head to Kinnaird’s Head near Fraserburgh (Figure 1.5). This
triangular area of sea covers approximately 5230 km2 (Wilson, 1995). It is the
largest of its kind on the east coast of Scotland and contains within it three smaller
Firths being the Dornoch Firth, Cromarty Firth and Inverness Firth (Eleftheriou et
al., 2004). The Moray Firth is divided into two parts, the first being the inner Moray
Firth defined as a straight line drawn from Helmsdale to Lossiemouth and all water
lying within this area extending back into the Cromarty and Inverness Firths
26
(Wright et al., 1998). The outer Moray Firth is the area of water lying between the
Helmsdale to Lossiemouth line extending outwards towards the line drawn between
Duncansby Head and Kinnaird’s Head. The Moray Firth is an ‘open system’ which
forms an integral part of the wider North Sea basin and Atlantic beyond, sharing
large scale environmental factors such as water circulation and climate patterns
(Wright et al., 1998; Eleftheriou et al., 2004). It is an internationally recognised
area of outstanding biological importance. However, it is under threat from many
anthropogenic pressures, particularly from fishing pressure, oil and gas activities,
industry and tourism (Wright et al., 1998). Therefore, it is imperative for the
conservation and management of this natural resource that detailed knowledge and
Figure 1.5 Map of the location and extent of the Moray Firth, north east Scotland. (re-plotted from JNCC coastal directories, 1999)
27
data concerning its marine and coastal environments, and the species utilising them,
be collected and analysed. Within the Moray Firth approximately 50% of the
coastlines are covered by sites and areas designated for the conservation of the
environment and the many species contained therein. These include 34 sites of
special scientific interest (SSSI), one natural nature reserve (Nigg and Udale Bays),
one national scenic area (Dornoch Firth) and the major area, the candidate special
area of conservation (cSAC) in the inner Moray Firth (Eleftheriou et al., 2004).
1.3.2 Physiography and Oceanography
The bathymetry characteristics of the Moray Firth vary greatly within in its extent.
In the inner Moray Firth the seabed slopes gently from the coast to around 50
metres in depth, approximately 15 km from the coast. In contrast the outer Moray
Firth more closely resembles the open North Sea with the seabed sharply sloping
from the coast with the deepest extent being located within 26 km of its southern
shore (Wilson, 1995). This deep region in the south western part of the outer Moray
Firth is known as the Southern Trench, an enclosed seabed basin at least 250 metres
deep (see Figure 1.6). The trench lies directly off the location of the Banff Fault, 10
km north of the Fraserburgh – Banff coastline (Holmes et al., 2004). Conversely on
the north western Helmsdale – Wick coastline, a large submarine embankment can
be found where depths only reach a shallow 30 – 50 metres (Wright et al., 1998).
Sediment characteristics of the Moray Firth also vary dramatically within this large
embayment, see Figure 1.7 for a map of sediments found in the Moray Firth.
Sediments are predominantly sandy, with a close inverse correlation between depth
and grain size (Wilson, 1995). Those deepest areas within the Southern Trench vary
slightly and are mostly comprised of mud (Holmes et al., 2004). The waters of the
Moray Firth are a combination of coastal and mixed waters. The main marine input
is produced by the Dooley current which brings cold mixed waters down from the
north, the current circulating this water in a clockwise direction within the Firth
(Wilson, 1995). Of the twelve major rivers which discharge freshwater into the
Moray Firth, ten discharge into the inner Firth, substantially reducing salinity
(Wilson 1995; Holmes et al., 2004). Changes in water temperature can be quite
rapid between different regions of the Firth and can change radically. For example
in the inner Moray Firth maximum summer temperature recorded at 12.5 °C, whilst
28
during the winter the minimum temperature recorded was approximately 5.5 °C
(Wilson, 1995).
Figure 1.6 The physiography of the Southern Trench, north east Scotland. Insets show a. colour shaded topography b. seabed terrain c. seabed slope d. image of bedrock & e. image of seabed pebbles, cobbles and boulders (Holmes et al., 2004)
29
1.3.3 Species present
The Moray Firth is recognised internationally as an area of natural outstanding
beauty and of high biological biodiversity and importance (Wright et al., 1998).
Species which can be found in the Moray Firth include fish such as herring (Clupea
harengus) which as juveniles move into areas of the inner firth to over-winter in
substantial quantities (Wilson, 1995). The Moray Firth is also an important site for
over-wintering sprats (Sprattus sprattus) in the North Sea. Mackerel (Scombrus
sombre) pass through the Moray Firth whilst on migration during the summer and
autumn months, their stratified movement into the firth clearly observed (Reid et
al., 1997). This species supports a large portion of the Scottish fishing fleet and is
the most economically important species in Scotland (FRS, 2004c). However, the
most important and abundant species in the Moray Firth is the sandeel (Ammodytes
marinus) and is responsible for the large diversity and abundance of seabirds found
Figure 1.7 Map of seabed sediment types found in the Moray Firth, north east Scotland.(Eleftheriou et al., 2004)
30
there (Hislop et al., 1991, Ollason et al., 1997; Wright & Begg 1997; FRS, 2004b).
Other species present include the cod (Gadus morhua), whiting (Merlangus
merlangius), haddock (Melanogrammus aeglefinus) and the Atlantic salmon (Salmo
salnar) (Greenstreet et al., 1998; Lusseau et al., 2004).
This high abundance of fish species, primarily the sandeel, supports a large
diversity of seabirds. This makes the Moray Firth one of the most important areas
for birds in the UK and contains a significant part of Britain’s seabird population
(Wilson, 1995). Examples of these include the gannet (Morus bassanus), kittiwake
arctica) and shag (Phalacrocorax aristotelis) (Ollason et al., 1997; Wanless et al.,
1997; Wright & Begg 1997; Garthe et al., 2003).
Marine mammals such as pinnipeds and cetaceans play an important part of the
ecology of the Moray Firth (Wilson, 1995). The firth is visited by and has had
recorded sightings of almost all those cetaceans which have been recorded
occurring in the waters surrounding the British Isles (see Table 1.1). However, the
most commonly sighted cetacean species in the Firth include the bottlenose dolphin
(Tursiops truncatus), harbour porpoise (Phocoena phocoena) and the minke whale
(Balaenoptera acutorostrata) (Figure 1.8).
The Moray Firth supports a population of bottlenose dolphins, located at the most
northerly part of the species distribution (Wilson, 1995). The species was found to
be distributed coastally with the population extending from the inner (Hastie, 2004)
and outer (Eisfeld, 2003) parts of the Moray Firth, to the eastern coasts of the UK as
far south as Sunderland, Tyne & Wear. Also, high abundances of harbour porpoise
have been recorded occurring within the coastal waters of the Moray Firth
(Thompson et al., 2004; Whaley, 2004). Finally, reported sightings have been made
of minke whales occurring within the Moray Firth. So far no studies have been
published on the presence of these animals in this region, nor has any in depth
research on the reasons for their distribution in these coastal waters during the
summer and autumnal months been conducted.
Common Name Scientific Name
Mysticetes
Northern right whale Eubalaena glacialis
Humpback whale Megaptera novaeangliae
Blue whale Balaenoptera musculus
Fin whale Balaenoptera physalus
Sei whale Balaenoptera borealis
Minke whale * Balaenoptera acutorostrata
Odontocetes
Sperm whale Physeter macrocephalus
Pygmy sperm whale Kogia breviceps
Cuvier's beaked whale Ziphius cavirostris
Northern bottlenose whale Hyperoodon ampullatus
Sowerby’s beaked whale Mesoplodon bidens
Pilot whale Globicephala melas
Killer whale Orcinus orca
False killer whale Pseudorca crassidens
Beluga whale Delphinapterus leucas
Narwhal Monodon monoceros
Risso’s dolphin Grampus griseus
Bottlenose dolphin * Tursiops truncatus
White-beaked dolphin Lagenorhynchus albirostris
White-sided dolphin Lagenorhynchus acutus
Common dolphin Delphinus delphis
Striped dolphin Stenella coeruleoalba
Fraser’s dolphin Lagenodelphis hosei
Harbour porpoise * Phocoena phocoena
Table 1.1 Table of cetacean species which have been sighted around the coasts of the British Isles (adapted from Reid et al., 2003).
* indicates those species most frequently sighted in the Moray Firth, Scotland.
2. Methods
35
1.4 Aims of the study
The central aim of this project is to investigate and ascertain if any significant
patterns can be seen between the distributions of north Atlantic minke whales
(Balaenoptera acutorostrata acutorostrata) and the surrounding environmental
factors which are present in the southern outer Moray Firth. The present study
intends to use a range of techniques and methods to determine which different
environmental variables may affect a species spatio-temporal distribution, using an
integrated multi-discipline (behavioural observation, GIS and remote sensing)
approach. It is also hoped that the methods used in the study can show how the
application of a multi-discipline approach can provide useful information for the
future construction of spatio-temporal models used in the prediction of the
distribution of cetacean species. Application of the method as an aid to
ii)i)
Figure 1.8 Most frequently encountered cetacean species in the Moray Firth, north east Scotland i) bottlenose dolphin Tursiops truncatus ii) harbour porpoisePhocoena phocoena iii) minke whale Balaenoptera acutorostrata.(all photographs courtesy of Kevin Robinson, CRRU)
iii)
2. Methods
36
conservationists and policy makers, with regards to the conservation and
management of the minke whale, and the establishment of more effective marine
protected areas will be discussed with the use of case studies and contemporary
research.
Summary of aims:
1. To investigate and describe the presence of significant patterns and
correlations between the distribution / behavioural ecology of minke
whales in the Moray Firth and the following environmental variables;
2.2). Each vessel was propelled by a 90 horse power two stroke outboard engine and
fitted with Lowrance GPS unit with sonar and thermistor probe. Surveys were
conducted at a speed of 10-18 km per hour with a crew of between 3 to 7 observers.
Surveys were also carried out at sea states of 3 or less in good light conditions. If the
sea state increased beyond 3 or the weather deteriorated the survey was either halted
temporarily until conditions improved or was terminated. To assist observations a
pair of Compass 7 x 50 122mm waterproof binoculars were used whilst on surveys.
Cues used to locate minke whales whilst surveying included the presence of bird
feeding rafts, often a sign of the presence of marine mammals, or direct observation
of animals from their long dark backs and falcate dorsal fins when surfacing
(Figure 2.3). When animals were sighted, the speed of the vessel was reduced and
the direction maintained in an attempt to make the movements of the boat as
predictable as possible. The boat was never directly driven towards animals but
once in the vicinity of a whale the engine was reduced to an idle speed or shut down
to minimise any disturbance whilst a number of recordings could be made. In
addition to the time and GPS position of the animals encountered, notes on their
age, gender (where possible) and behaviour of the subject were recorded (see Table
2.1). Other information was recorded including the presence or absence of
2. Methods
39
Figure 2.1 Map of line transect route types used to survey the study area. These included dedicated minke whale routes (INNER, MIDDLE
and OUTER) and an additional innermost route typically used during bottlenose dolphin survey work (BND). The division of each route into four sub routes is indicated by the five waypoints labelled (from east to west) A, B, C, D and E.
Figure 2.2 One of CRRU’s Avon Searider RIBs used for surveys in the present study. (Photograph courtesy of Kevin Robinson, CRRU)
Figure 2.3 i) The activity of feeding seabirds, indicating presence of minke whale prey
ii) Minke whale observed during surfacing. (Photographs courtesy of Kevin Robinson, CRRU)
i)
ii)
3. Results
48
associated bird species and bird feeding activity. In addition environmental data was
collected such as the depth, water temperature, weather conditions and sea state.
Where possible the whales’ surfacing intervals were also recorded using a digital
stopwatch.
Whilst on surveys and during encounters with animals all information was recorded
onto A4 laminated survey logs using water resistant chinagraph pencils. On
completion of each survey trip, back on the shore, all the recorded information was
transcribed to a generic hard copy form. Examples of the forms used during surveys
and on shore can be found in Appendices A, B, C & D.
Survey and encounter information was subsequently entered into an inter-relational
database created in Microsoft Access. This could be used to allow the extraction of
information required from simultaneous files using the databases “Queries” mode.
Please see Figure 2.4 for an example of the database design.
Category Definition
Age: Adults Dark colouration, tall falcate fins, many dorsal edge marks
Juveniles Light colouration, small triangular fins, few dorsal edge marks
Behaviour:
Travelling Travelling in straight direction with little alteration in course
Foraging Either observed circling an area or directly feeding
Table 2.1 Definitions used to determine the age class (adults & juveniles) and behavioural activity (travelling & foraging) of minke whales recorded during encounters.
3. Results
49
Figure 2.4 Schematic diagram depicting the data entry forms from the CRRU’s minke whale database created in Microsoft Access (designed by Robinson & Benda). Each of the boxes below shows the fields for the “Trips”, “Encounters”, “Sightings” and “Individuals” tables respectively. The information entered into each table is interrelated by a number of common fields or identities (indicated by arrows) that allow the extraction of information required from simultaneous files using the databases “Queries” mode.
3. Results
50
2.2 Geographical information system (GIS)
Information concerning the physical environment (fixed variables) was obtained to
compare with minke whale distributions as well as to be able to generate additional
environmental data. A geographical information system or GIS was used to process
each parameter used and described in the following sections.
2.2.1 Bathymetry
Data for the depth of the research area was obtained using Admiralty charts of the
Moray Firth, from which depth contours were digitised using a digitising tablet.
Subsequently, the study area (11 x 80 km2) was divided into 1 km blocks, and data
for minimum, maximum and mean depth determined. This information was then
saved into a Dbase* IV file and imported into a GIS.
The program ArcView 3.3 was used to create and manipulate the GIS so that depth
data could be converted from an event theme to a grid theme and finally converted
to a Mercator map projection. A land mask was applied to show the position of the
coastline, extending from Lossiemouth to Fraserburgh.
The slope or gradient between different adjacent cells in the map projection was
generated directly from the depth data using a slope modelling function available in
ArcView 3.3.
Finally the aspect (i.e. direction of the determined slopes) between adjacent grid
cells within the survey area face (North & Southwest) was generated directly from
the slope data using the aspect modelling function within ArcView 3.3.
2.2.2 Sediment type
The distribution of sediment type within the study area was obtained from British
Geological Survey maps of the Moray Firth. Once again, the maps were divided into
1 km2 blocks and the respective sediment type was determined for each block. The
information was then entered into a Dbase* IV file and imported into ArcView 3.3
and converted to a Mercator map projection.
Please see Figure 2.5 for a flow chart of the GIS process used in the study.
3. Results
51
Admiralty depth data
convert to grid theme
convert to grid theme
BGS sediment
data
derivecontour
DEPTH
SLOPE
ASPECT
deriveslope
deriveaspect
SEDIMENT TYPE
Legend
Depth data
Slope data
Aspect data
Sediment type data
Spread sheet
GIS modelling Function
GIS layout
Input into GIS
Output from GIS
Figure 2.5 Flow diagram illustrating the process by which the environmental data set was derived from Admiralty and British Geological Survey charts using GIS and spatial modelling functions available with ArcView 3.3 and the grid and spatial analyst extension packages.
3. Results
52
2.3 Remote Sensing
The sea surface temperature and chlorophyll-a concentration were obtained using
the AVHRR and SeaWiFS satellite sensors respectively for application to the data
set used in the present study. The use of imagery is outlined below.
2.3.1 AVHRR
Sea surface temperatures (SST) used in the study were determined from NOAA
advanced very high resolution radiometer or AVHRR satellite imagery. Images
were downloaded from the Remote Sensing Data Analysis Service (RSDAS)
website for the months of May through to September from 2001 to 2004 inclusive.
The AVHRR data had an image resolution of 1.1 km2 and were converted to a
Mercator map projection using standardised scales for SST.
Due to the nature of the sensor, however, no information could be obtained through
cloud cover. As such, only a small fraction of this time period available for each
month could be used for AVHRR imagery and so composite images for each month
were created thus avoiding the problems of low statistical power due to small
samples sizes as experienced by Macleod (2003) and Wakefield (2001). The images
were geometrically corrected and their colour attributes altered subsequently to
allow accurate representation of SST, using the program ERDAS Imagine.
The images obtained from RSDAS were subsetted to provide two smaller scales of
coverage as shown in Figure 2.6. The first encompassing the whole Moray Firth,
the second detailing the area covered by surveys in the present study.
The composite images for each period were used to determine the corresponding
SST for each minke whale encounter using the following formulas:
( ) ( )( )
−
−×−=
lonlonlonloncolsX
minmaxmin1
X position of whale
3. Results
53
Figure 2.6 AVHRR composite image for SST showing the subsetting applied to the present data set. This example image shows a composite image processed for the month July 2003. Images were processed at three scales of coverage. These include all the area provided by RSDAS [North Sea] (1), all of the Moray Firth area [Moray Firth] (2) and the area in which surveys were conducted [survey area] (3).
3. Results
54
Where
rows = number of rows in image
cols = number of columns in image
min lon / max lon = minimum / maximum longitude of image
(in decimal degress)
min lat / max lat = minimum / maximum latitude of image
(in decimal degress)
DEGtoRAD = conversion from degrees to radians (PI/180.0)
ln = natural log
The SST values (in °C) for each encounter were then obtained using the following
formula provided by RSDAS:
Where
DN = Digital number or the value of each pixel
( ) ( )( )
−−
−×−=minmax
minint0.11YY
YYrowsY
( )( )( )( )0.2min0.45tanlnmin latDEGtoRADY +×=
( )( )( )( )0.2max0.45tanlnmax latDEGtoRADY +×=
( )( )( )( )0.20.45tanlnint latDEGtoRADY +×=
( )3.01.0 −×= DNSST
Y position of whale
3. Results
55
The composite images were also used in visual analysis to ascertain if the presence
of oceanographic feature such as fronts and upwellings had an effect on the
distribution and frequency of minke whale sightings.
2.3.2 SeaWiFS
Concentrations of chlorophyll-a (µg1¯¹) throughout the study area were determined
using NASA satellite imagery from the Sea-viewing Wide Field-of-view ocean
colour sensor or SeaWiFS. Once again images with a resolution of 1.1km2 were
downloaded from the RSDAS website for the months of May through to September
from 2001 to 2004.
To overcome the problem associated with cloud masking as before, composite
images were created for each month surveyed. These images too were geometrically
rectified and had the colour attributes altered to allow an accurate representation of
chlorophyll-a concentration using the program ERDAS Imagine.
The monthly composites were subsequently used to determine the corresponding
chlorophyll-a concentration for each minke whale encounter.
The values of chlorophyll at each position were obtained using the following
formula provided by RSDAS:
Where
CHL = Chlorophyll-a (µg1¯¹)
DN = Digital number or the value of each pixel
Once again, the composite images were used to ascertain visually if the presence of
areas with higher primary productivity (chlorophyll-a) had an effect on the
distribution and frequency of whale sightings.
( )[ ]0.2015.0^10 −×= DNCHL
3. Results
56
Ground truthing and corrections for chlorophyll-a concentration were carried out by
sampling methods. Between May and September 2004 a total of forty 1 litre
samples were taken from an array of set sampling sites. The sample bottles were
simply placed below the surface of the water column to fill and then sealed. These
samples related to specific days and times associated with corresponding SeaWiFS
images. The samples were then returned to the laboratory and filtered using
Whatmann 47mm glass micro fibre filter paper and a Millipore 100 Kilo Pascal
vacuum pump. The resulting filtrate was then stored in darkness in a freezer
compartment.
The subsequent analysis was carried out thanks to the support of the chlorophyll
laboratory at the Fisheries Research Services, Aberdeen. Chlorophyll was extracted
from the filtered samples in a fume cupboard. Filter paper was placed in a
homogeniser tube and packed down using a glass rod. For the 10/15ml extract
approximately 5/10ml of 90% acetone was added to the tube, while another 5ml was
measured to clean the centrifuge tube. The samples were then ground for less than 1
minute and the resulting acetone/filter paper solution was poured into a centrifuge
tube. The volume of the extract was noted prior to spinning the samples in a 1EC
centrifuge at a speed of 1500 rpm for just 1 minute. The samples were then removed
and inverted to mix the contents before spinning again at 3000 rpm for a further 10
minutes. The final measurements of chlorophyll-a concentration were made using a
10 AU fluorometer.
2.4 Statistical analysis
A number of statistical tests were applied to the data to determine the presence of
any significant differences, trends and correlations. These included Kolmogorov-
Smirnov tests for normality, t-tests for use in analysis of variance and Pearson’s
statistic for the detection of correlations.
All statistical tests were conducted using the statistical package MiniTab 13.30.
3. Results
57
3. Results
3. Results
58
3 Results
For a summary table of all the data used during this project see Appendix E.
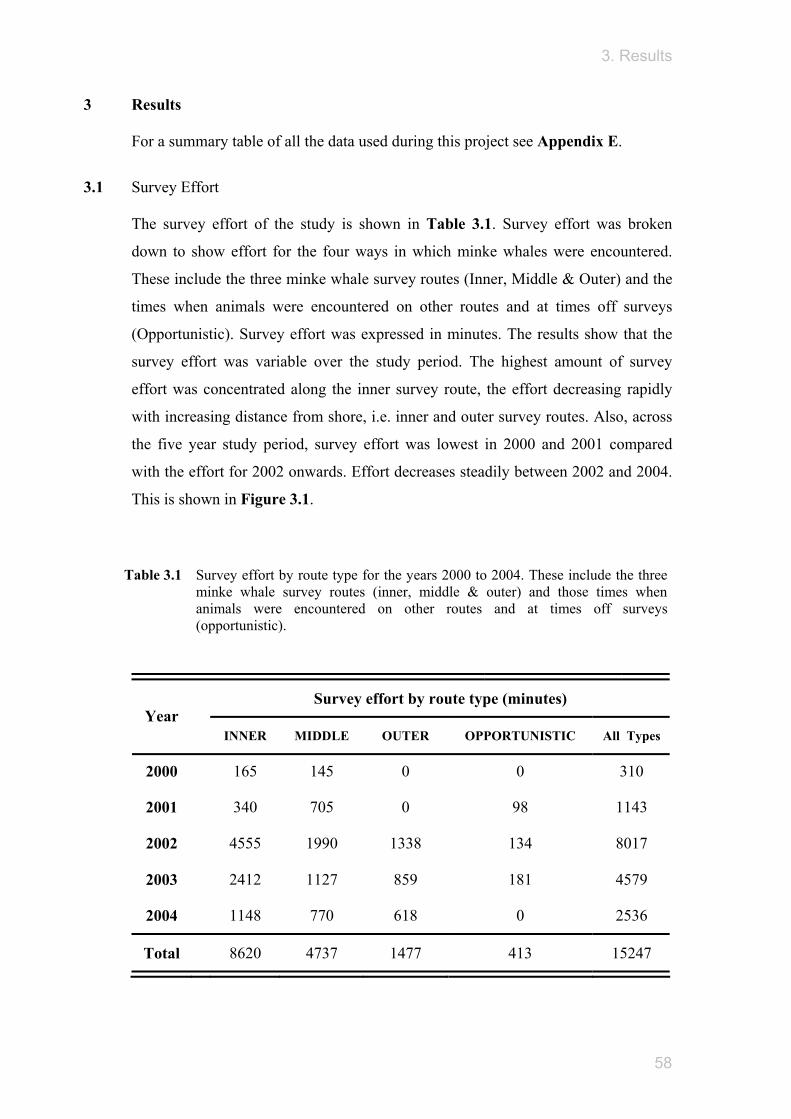
3.1 Survey Effort
The survey effort of the study is shown in Table 3.1. Survey effort was broken
down to show effort for the four ways in which minke whales were encountered.
These include the three minke whale survey routes (Inner, Middle & Outer) and the
times when animals were encountered on other routes and at times off surveys
(Opportunistic). Survey effort was expressed in minutes. The results show that the
survey effort was variable over the study period. The highest amount of survey
effort was concentrated along the inner survey route, the effort decreasing rapidly
with increasing distance from shore, i.e. inner and outer survey routes. Also, across
the five year study period, survey effort was lowest in 2000 and 2001 compared
with the effort for 2002 onwards. Effort decreases steadily between 2002 and 2004.
This is shown in Figure 3.1.
Survey effort by route type (minutes) Year
INNER MIDDLE OUTER OPPORTUNISTIC All Types
2000 165 145 0 0 310
2001 340 705 0 98 1143
2002 4555 1990 1338 134 8017
2003 2412 1127 859 181 4579
2004 1148 770 618 0 2536
Total 8620 4737 1477 413 15247
Table 3.1 Survey effort by route type for the years 2000 to 2004. These include the three minke whale survey routes (inner, middle & outer) and those times when animals were encountered on other routes and at times off surveys (opportunistic).
3. Results
59
3.2 Distribution of encounters
The number of minke whales encountered during the study can be seen in Table
3.2. Results show that whales were encountered within the survey area in the years
2000 to 2003. No minke whales were encountered in 2004. Results also show that
the number of encounters was variable between the different years and months of
the study.
Encounters by month Year
May June July August September
2000 0 0 0 0 4 2001 0 1 7 7 2 2002 0 0 0 9 36
2003 0 1 28 12 14
2004 0 0 0 0 0
0
1000
2000
3000
4000
5000
6000
7000
8000
9000
2000 2001 2002 2003 2004
Years
Effo
rt (m
inut
es)
OPPORTUNISTIC
OUTER
MIDDLE
INNER
Figure 3.1 Stacked column bar chart of survey effort in minutes, for the ways in which minke whales were encountered, during the years 2000 - 2004. These include the three minke whale survey routes (Inner, Middle & Outer) and those times when animals were encountered on other routes and at times off surveys (Opportunistic).
Table 3.2 Number of minke whale encountered during the study for the months May to September between 2000 and 2004.
3. Results
60
In 2000 and 2002 the highest sightings frequency of minke whale encounters
occurred in September. In 2001 most minke whales were seen in the months of July
and August. In the year 2003 minke whale encounters were highest during the
month of July whilst encounters halved during August and September. Encounter
frequency slowly increased during the years 2001 to 2003. No minke whales were
encountered in May during the entire study. This is shown in Figure 3.2.
The distribution of minke whales between Lossiemouth and Fraserburgh is shown in
Figure 3.3. The majority of minke whales were encountered close to the coast with
encounter frequency decreasing with distance from the shore. Two areas in
particular seemed to have high numbers of minke whale encounters. The first was a
strip of the coastline lying between Portknockie and Whitehills. The other area of
high encounter frequency was found in Aberdour Bay, located between
Gardenstown and Rosehearty. No minke whales were encountered in the area west
of Portknockie, a large and shallow embayment named Spey Bay. The frequency of
minke whale encounters, divided up to compare distribution between different
years, can be found in Figure 3.4. The location of these areas can be found in
Figure 2.1 located in the previous Methods section.
Figure 3.2 Frequency histogram of minke whale encounter frequency during the months May to September between 2000-2004.
0
5
10
15
20
25
30
35
40
2000 2001 2002 2003 2004
Year
Enco
unte
r fre
quen
cy
May
June
July
August
September
3. Results
61
200 m
100 m
50 m
20 m
N = 121
Figure 3.3 Map showing the distribution of minke whales along the southern outer Moray Firth recorded between 2000 and 2003. No minke whales were encountered during 2004. 121 minke whales were encountered. Depth contours for 20, 50, 100 and 200 metres are shown.
3. Results
62
Figure 3.4 Maps showing the annual occurrence of minke whales along the southern outer Moray Firth recorded between 2000 and 2003. Note: 2004 not shown as no whales were encountered during this year. Number of encounters are shown for each year. Depth contours for 20, 50, 100 and 200 metres are shown.
N = 4
N = 17
N = 45
N = 55
3. Results
63
Distribution maps showed that minke whale distribution during 2000 – 2003 was
highly variable. Many changes in the distribution of whales were observed along the
coastline as well as with increasing distance from the shore. During the years 2000
and 2001 the number of minke whale encounters was low and those individuals
which were encountered were distributed further offshore, in proximity to the 50
metre depth contour line. In the years 2002 to 2003 minke whale encounter
frequency was higher than in the previous two years and distributed more coastally,
distribution occurring around the 20 metre depth line.
A noticeable shift in distribution of minke whale encounters occurs between the
years 2002 and 2003. In 2002 animals were primarily located on the strip of the
coastline lying between the towns of Portknockie and Whitehills. This changed in
2003 with encounters occurring in two main patches. These two areas were off
Whitehills and the area of Aberdour Bay. A few encounters occurred between these
two areas on the stretch of coastline incorporating Banff, Macduff and
Gardenstown. Therefore, it was observed that though the majority of sightings
occurred along a certain depth, changes in minke whale distribution occurred within
those depths.
3.3 GIS
GIS layouts for minke whale density and the environmental variables associated
with bathymetry (depth, slope & aspect) and sediment type can be found in Figure
3.5. The GIS layout for minke whale density showed that the areas which were most
frequently visited by minke whales were the areas off Cullen Bay, Whitehills and
Aberdour Bay. Through the use of GIS it was possible to say that all these areas
which harbour the highest densities of minke whale distribution were characterised
by very similar categories of environmental variables associated with bathymetry.
All three areas were defined as having shallow depths, high slope values and
northerly facing slopes. Also, the areas of Cullen Bay, Whitehills and Aberdour Bay
were all associated with sandy gravel sediment types.
3. Results
64
Figure 3.5 GIS layouts of minke whale density and environmental variables associated with bathymetry (depth, slope & aspect) and sediment type. Coast line extends from Lossiemouth to Fraserburgh. Contours for depth are shown. (created using ArcView 3.3)
The dynamic changes and variability in SST within the Moray Firth can be seen in
Figure 3.6. Images show that SST within the Moray Firth is highly variable both
spatially and temporally. Composites show that SST increases between June and
September in all years of the study. Also, sea surface temperatures are higher in the
inner firth than the outer part of the embayment and the North Sea. Minke whales
were seen in the outer southern part of the Moray Firth during the months with
warmer SST. Minke whales were not observed until August in 2002 whilst in 2003
animals were encountered in June. The months of highest minke whale encounter
frequency during the study occurred in those months of highest sea surface
temperatures, e.g. September 2002 and July 2003. No minke whales were
encountered during 2004.
In the composite images two oceanographic features can be seen. These include a
current of colder water running across the mouth of the Moray Firth which can be
seen clearest in June 2002 and September 2004. Secondly, a plume of warmer water
can be seen extending out of the inner part of the Moray Firth into the outer
embayment and wider North Sea. This feature can be seen clearest in September
2002. Minke whale sightings frequency was observed to be higher during periods
when the warm water plume was more evident in composites and smaller during
those months when the cold water current is more clearly visible.
Figure 3.6 AVHRR monthly composite images showing the sea surface temperatures (SST °C) for the Moray Firth in June, July, August and September during 2002 to 2004. No data was available for the months of September 2003, June & August 2004. (created using ERDAS Imagine).
See over page for Figure 3.6
3. Results
66
2002
20
03
2004
JUNE JULY AUGUST SEPTEMBER
JUNE JULY AUGUST SEPTEMBER
NO DATA
NO DATA NO DATA
JUNE JULY AUGUST SEPTEMBER
3. Results
67
3.4.2 Chlorophyll-a concentration
Composite images of the changes in chlorophyll-a concentration across the study
area between 2002 and 2004 can be found in Figure 3.7. Images show that
chlorophyll-a concentration was highly variable both in time and across the survey
area. It was observed that concentrations of chlorophyll-a increase between June and
September. Also, it was observed that chlorophyll-a concentration decreases with
distance from the shore, i.e. with increasing depth. The extent to which the higher
chlorophyll-a concentrations extend out from the shore increases between June and
September. Minke whale encounter frequency was highest in both those areas and
times when concentrations of chlorophyll-a were also high. Minke whale encounter
frequencies decreased with distance from the shore with decreasing chlorophyll-a
levels. No minke whales were observed during 2004.
In 2002 animal encounter frequencies were highest during the month of September
whilst in 2003 more minke whale encounters occurred in July. Also, a shift in the
distribution of animals is visible between 2002 and 2003. In 2002 minke whale
encounters occurred to the west within the area between Portknockie and Whitehills.
However, in 2003 encounters occurred more often to the east between Whitehills
and Rosehearty. During 2003 chlorophyll-a concentrations were on average much
lower within the area between Portknockie and Whitehills than in the previous year.
To the east of Whitehills to Rosehearty, concentrations of chlorophyll-a were much
higher than to the west to Portknockie.
During 2003 a shift is observed in the distribution of minke whale encounters
between July and August. In July minke whale encounters were highest in the area
off Whitehills. In August the frequency of minke whale encounters move further
east into the waters of Aberdour Bay. Also, it was observed that in July
concentrations of chlorophyll-a were highest in the area between Whitehills and
MacDuff. Then during August, a change is observed with higher relative
concentrations of chlorophyll-a being found further east in the region of Aberdour
Bay, particulary off Rosehearty.
3. Results
68
A
Figure 3.7 SeaWiFS composite images showing the mean monthly chlorophyll-a concentration (Chl a µg1¯¹) for the study area in June, July, August & September during A 2002 B 2003 and C 2004. Coastline extends from Lossiemouth to Fraserburgh. (created using ERDAS Imagine)
JUNE
JULY
AUGUST
SEPTEMBER
3. Results
69
B
C
SEPTEMBER
JUNE
JULY
AUGUST
Figure 3.7 See previous page.
SEPTEMBER
3. Results
70
Results of ground truth sampling during 2004 can be found in Table 3.3. Results
show that no significant difference was observed between chlorophyll-a
concentrations obtained by direct sampling and those obtained through the use of the
Control 0.03 0.02 0.02 0.03 04/09/2004 n/a n/a n/a n/a
Table 3.3 Results of ground truth sampling of chlorophyll-a concentration (µg1¯¹) during 2004. No significant difference was found between the ground truth samples and the concentrations of chlorophyll-a obtained using the SeaWiFS sensor (t-test t = -0.34 p = 0.736).
3. Results
72
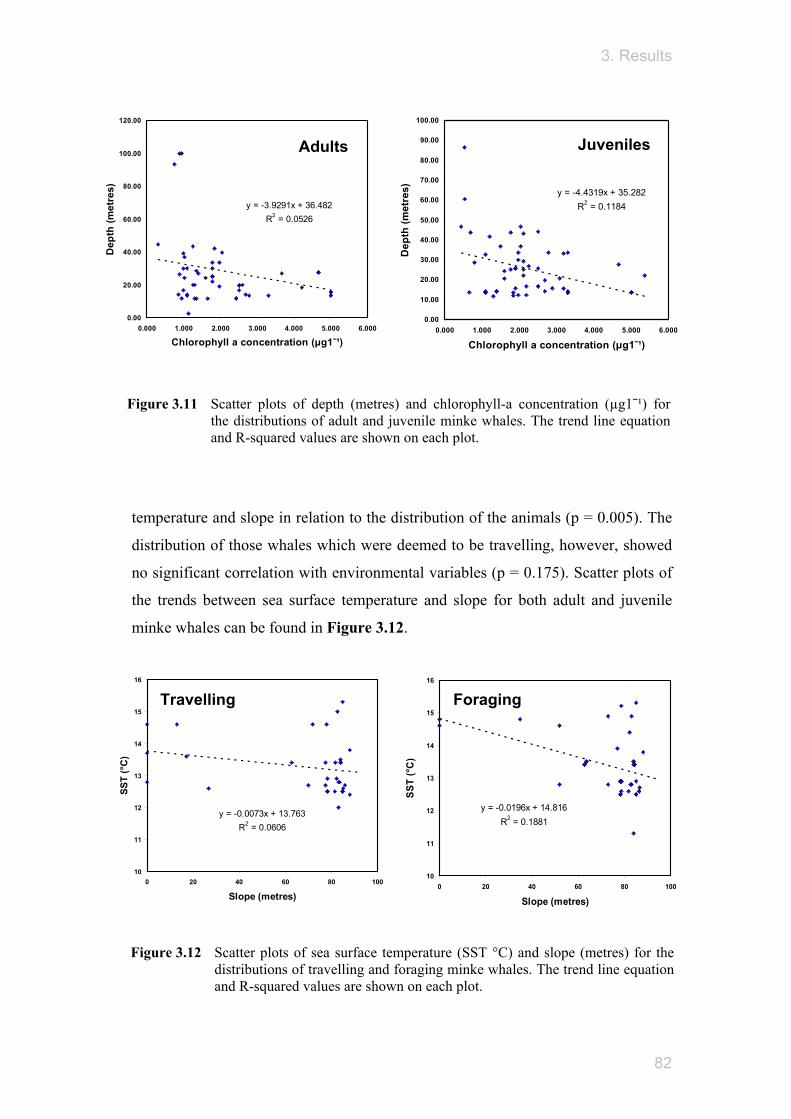
3.5 Adults and juveniles Minke whale encounters were separated to show if any differences were detectable
between animals of different age class (adults and juveniles) and their distribution in
relation to the environment. These distributions with environmental variables can be
seen in Figure 3.8. Results show that both adult and juvenile minke whales were
similar in their distribution with respect to the underlying environment. All whale
encounters were highest with variables of shallow depth, high slope value, northerly
facing aspects, sandy gravel sediment types, warm temperatures and high
chlorophyll-a concentration.
The environmental data set was tested for normality using a Kolmogorov-Smirnov
statistic. A summary of these results can be found in Table 3.4. Tests showed that
the environmental data recorded during minke whale encounters was found to be
normally distributed. Therefore, parametric statistics could be used to determine if
any further trends or patterns occurred between minke whales and the environment.
Environmental variable D p
SST 0.136 <0.01 **
Chlorophyll-a 0.123 <0.01 **
Depth 0.186 <0.01 **
Slope 0.229 <0.01 **
Sediment type 0.084 0.043 *
Aspect 0.259 <0.01 **
* indicates results which are significant (p = <0.05)
** indicates results which are very significant (p = <0.01)
Table 3.4. Results of Kolmogorov-Smirnov tests (statistic and probability values) used to
determine if environmental data set associated with minke whale encounters was normally
distributed.
3. Results
73
0
5
10
15
20
25
30
35
40
0.0
- 4.9
5.0
- 9.9
10.0
- 14
.9
15.0
- 19
.9
20.0
- 24
.9
25.0
- 29
.9
30.0
- 34
.9
35.0
- 39
.9
40.0
- 44
.9
45.0
- 49
.9
50.0
- 54
.9
55.0
- 59
.9
60.0
- 64
.9
65.0
- 69
.9
70.0
- 74
.9
75.0
- 79
.9
80.0
- 84
.9
85.0
- 89
.9
90.0
- 94
.9
95.0
- 99
.9
100.
0 - 1
04.9
105.
0 - 1
09.9
110.
0 - 1
14.9
Depth (metres)
Enco
unte
r fre
quen
cy
Adults Juveniles
0
5
10
15
20
25
30
35
40
45
50
0.0
- 4.9
5.0
- 9.9
10.0
- 14
.9
15.0
- 19
.9
20.0
- 24
.9
25.0
- 29
.9
30.0
- 34
.9
35.0
- 39
.9
40.0
- 44
.9
45.0
- 49
.9
50.0
- 54
.9
55.0
- 59
.9
60.0
- 64
.9
65.0
- 69
.9
70.0
- 74
.9
75.0
- 79
.9
80.0
- 84
.9
85.0
- 89
.9
90.0
- 94
.9
95.0
- 99
.9
Slope (metres)
Enco
unte
r fre
quen
cy
Adults Juveniles
0
10
20
30
40
50
60
70
80
90
NW N NE E SE S SW W Flat
Aspect
Enco
unte
r fr
eque
ncy
Adults Juveniles
Figure 3.8 Stacked histograms of minke whale encounter frequency, for adult and juvenile animals, across the range of environmental variables associated with their distribution. These include i) depth ii) slope iii) aspect iv) sediment type v) SST and vi) chlorophyll-a.
t-tests were used to see if any significant differences occurred between the
distribution of adult and juvenile whales in relation to the surrounding environment.
A summary of these results can be found in Table 3.5.
Variable t p
SST -1.65 0.103
Chlorophyll-a 0.25 0.804
Depth 1.08 0.285
Slope -0.29 0.769
Sediment type -6.98 <0.001 ***
Aspect 0.24 0.810
Results show that adult and juvenile minke whales were significantly different in
their distribution across different sediment types (t = -6.98 p = <0.001). Therefore, it
was assumed that adult and juvenile whales differed in their range of sediment type
selection. No significant difference was observed between adult and juvenile whales
in relation to their distribution across the other environmental variables tested.
Therefore, it was assumed that adult and juvenile animals had the same distribution
across sea surface temperature, chlorophyll-a concentration, depth, slope and aspect.
Dive durations recorded for animals were divided into those sampled from adult and
juvenile animals and examined using a t-test. No significant difference was found
between the dive durations of adult and juvenile animals (t = -1.23 p = 0.218).
Therefore it was assumed that diving behaviour was the same for adult and juvenile
whales.
*** indicates results which are highly significant (p = <0.001)
Table 3.5 Results of t-tests (statistic and probability values) used to determine differences occurring in the distribution of adult and juvenile minke whales in relation to environmental variables.
3. Results
76
3.6 Travelling and foraging In the previous section encounters with minke whales were divided into adult and
juvenile animals. In this section encounters were separated by different behavioural
class, i.e. between those animals which were deemed to be travelling and those
which were foraging. These behaviour classes were then plotted against data
concerning the environment and can be found in Figure 3.9. Results show that both
travelling and foraging minke whales were similar in their distribution with respect
to the underlying environment. As in the previous section on age classes, whale
encounters were highest with variables of shallow depth, high slope value, northerly
facing aspects, sandy gravel sediment types, warm temperatures and high
chlorophyll-a concentration.
Environmental data set was previously tested for normality and found to be
normally distributed. Therefore, please refer to that section for further information.
t-tests were used to see if any significant differences occurred between the
distribution of travelling and foraging whales in relation to the surrounding
environment. A summary of these results can be found in Table 3.6.
Variable t p
SST -0.51 0.610
Chlorophyll-a 2.39 0.020 *
Depth -1.67 0.101
Slope 1.25 0.216
Sediment type 2.30 0.026 *
Aspect 0.89 0.378
* indicates results which are significant (p = <0.05)
Table 3.6 Results of t-tests (statistic and probability values) used to determine differences occurring in the distribution of travelling and foraging minke whales in relation to environmental variables.
3. Results
77
0
5
10
15
20
25
30
35
0.0
- 4.9
5.0
- 9.9
10.0
- 14
.9
15.0
- 19
.9
20.0
- 24
.9
25.0
- 29
.9
30.0
- 34
.9
35.0
- 39
.9
40.0
- 44
.9
45.0
- 49
.9
50.0
- 54
.9
55.0
- 59
.9
60.0
- 64
.9
65.0
- 69
.9
70.0
- 74
.9
75.0
- 79
.9
80.0
- 84
.9
85.0
- 89
.9
90.0
- 94
.9
95.0
- 99
.9
100.
0 - 1
04.9
105.
0 - 1
09.9
110.
0 - 1
14.9
Depth (metres)
Enco
unte
r fre
quen
cy
Travelling Foraging
0
5
10
15
20
25
30
35
40
45
0.0
- 4.9
5.0
- 9.9
10.0
- 14
.9
15.0
- 19
.9
20.0
- 24
.9
25.0
- 29
.9
30.0
- 34
.9
35.0
- 39
.9
40.0
- 44
.9
45.0
- 49
.9
50.0
- 54
.9
55.0
- 59
.9
60.0
- 64
.9
65.0
- 69
.9
70.0
- 74
.9
75.0
- 79
.9
80.0
- 84
.9
85.0
- 89
.9
90.0
- 94
.9
95.0
- 99
.9Slope (metres)
Enco
unte
r fr
eque
ncy
Travelling Foraging
0
10
20
30
40
50
60
70
80
NW N NE E SE S SW W Flat
Aspect
Enco
unte
r fr
eque
ncy
Travelling Foraging
Figure 3.9 Stacked histograms of minke whale encounter frequency, for travelling and foraging animals, across the range of environmental variables associated with their distribution. These include i) depth ii) slope iii) aspect iv) sediment type v)SST and vi) chlorophyll-a.
Results showed that a significant correlation was observed between chlorophyll-a
concentration and sea surface temperature in relation to the distribution of minke
whales (p = 0.029). However, in terms of age classes only the distributions of adult
animals followed this pattern (p = 0.023) whilst no significant correlation was
observed in the distribution of juvenile animals (p = 0.285). Scatter plots of the trend
between chlorophyll-a concentration and sea surface temperature for both adult and
juvenile animals can be found in Figure 3.10.
* indicates results which are significant (P = <0.05)
** indicates results which are very significant (P = <0.01)
Table 3.7 Summary of probability values obtained form Pearson’s correlation tests used to determine correlations between variables SST, Chlorophyll-a, Depth & Slope, associated with the distribution of minke whales.
3. Results
81
It was observed from the Pearson’s correlation statistic that a significant correlation
was found between chlorophyll-a concentration and depth in relation to the
distribution of minke whales (p = 0.005). However, a difference was once again
observed between the distribution of adult and juvenile animals. A significant
correlation was observed between chlorophyll-a concentration and depth in relation
to the distribution of juvenile whales (p = 0.009), whilst no correlation was
observed between variables in the distribution of adult animals (p = 0.099). Scatter
plots of the correlation between chlorophyll-a concentration and depth for both adult
and juvenile minke whales can be found in Figure 3.11.
Results from multivariate analysis showed that a significant correlation was
observed between sea surface temperature and slope with regards to the distribution
of minke whales (p = 0.002). This correlation was also evident in the distributions
of adult (p = 0.015) and juvenile (p = 0.039) whales. However, when animals were
separated by behaviour class a difference was observed. Those animals which were
identified as foraging showed significant correlations between sea surface
…
y = 0.6197x - 5.9686R2 = 0.1172
0.000
1.000
2.000
3.000
4.000
5.000
6.000
9 11 13 15 17 19
SST (°C)
Chl
orop
hyll
a co
ncen
trat
ion
(µg1
¯¹)
y = 0.1717x - 0.1864R2 = 0.0272
0.000
1.000
2.000
3.000
4.000
5.000
6.000
9 11 13 15 17 19
SST (°C)
Chl
orop
hyll
a co
ncen
trat
ion
(µg1
¯¹)Figure 3.10 Scatter plots of chlorophyll-a concentration (µg1¯¹) and sea surface
temperature (SST °C) for the distributions of adult and juvenile minke whales. The trend line equation and R-squared values are shown on each plot.
Adults Juveniles
3. Results
82
temperature and slope in relation to the distribution of the animals (p = 0.005). The
distribution of those whales which were deemed to be travelling, however, showed
no significant correlation with environmental variables (p = 0.175). Scatter plots of
the trends between sea surface temperature and slope for both adult and juvenile
minke whales can be found in Figure 3.12.
y = -3.9291x + 36.482R2 = 0.0526
0.00
20.00
40.00
60.00
80.00
100.00
120.00
0.000 1.000 2.000 3.000 4.000 5.000 6.000
Chlorophyll a concentration (µg1¯¹)
Dep
th (m
etre
s) y = -4.4319x + 35.282R2 = 0.1184
0.00
10.00
20.00
30.00
40.00
50.00
60.00
70.00
80.00
90.00
100.00
0.000 1.000 2.000 3.000 4.000 5.000 6.000
Chlorophyll a concentration (µg1¯¹)
Dep
th (m
etre
s)
Adults Juveniles
Figure 3.11 Scatter plots of depth (metres) and chlorophyll-a concentration (µg1¯¹) for the distributions of adult and juvenile minke whales. The trend line equationand R-squared values are shown on each plot.
y = -0.0073x + 13.763R2 = 0.0606
10
11
12
13
14
15
16
0 20 40 60 80 100
Slope (metres)
SST
(°C
)
y = -0.0196x + 14.816R2 = 0.1881
10
11
12
13
14
15
16
0 20 40 60 80 100
Slope (metres)
SST
(°C
)
Figure 3.12 Scatter plots of sea surface temperature (SST °C) and slope (metres) for the distributions of travelling and foraging minke whales. The trend line equation and R-squared values are shown on each plot.
Travelling Foraging
3. Results
83
3.8 Summary
A number of observations, patterns and correlations were found to be significant
from the results of the study. These have been summarised below:
- Minke whales were encountered in the Moray Firth, north east Scotland.
- Minke whale distribution and encounter frequency were highly variable both
spatially and temporally within the survey area.
- No minke whales were encountered in the year 2004.
- The highest frequencies of whales were encountered during the months of July,
August and September across the years of the study.
- Areas of highest minke whale encounter frequency occurred in regions which
were characterised by shallow depths, steep slopes, northerly facing aspects and
sandy gravel sediment types.
- Significant differences were observed between the distribution of adult and
juvenile minke whales with respect to sediment type.
- Significant differences were observed between the distribution of whales
deemed to be travelling and foraging with respect to sediment type.
- It was observed that minke whale encounter frequencies were highest during the
months with highest values of sea surface temperature.
- Change in minke whale distribution across the survey area may be due to the
influence of changing levels of primary productivity, represented by variations
in the measurements of chlorophyll-a concentration.
3. Results
84
- Significant differences were observed between the distribution of animals
deemed to be travelling and foraging in respect to changes in chlorophyll-a
concentration.
- Significant correlations were found for adult and juvenile minke whale
distribution and the interactions of the environmental variables of depth, sea
surface temperature and chlorophyll-a concentration.
- Significant correlations were found for the distribution of those minke whales
deemed to be foraging and the interactions of the environmental variables of
slope and sea surface temperature.
- The distribution of animals deemed to be travelling showed no correlations with
the interactions of any of the environmental variables associated with their
position.
- A significant difference was observed between the dive durations of those minke
whales deemed to be travelling and those classed as foraging. Therefore, it was
assumed that the diving behaviour was different between those animals which
were travelling and those which were foraging.
3. Results
85
4. Discussion
3. Results
86
4 Discussion
Interpretation of results
From the results of the study the most significant observations made were between
the distributions of encounters associated with the fixed environmental variables.
Primarily it was observed that whales were most frequently encountered in areas of
associations with bathymetric habitats and shallow-water topographies:
implications for trophic transfer and conservation. Journal of Marine
Systems, In Press.
Zaniewski, A.E., Lehmann, A. & Overton, J.M. (2002) Predicting species spatial
distributions using presence-only data: a case study of native New Zealand
ferns. Ecological Modelling, 157: 261-280.
3. Results
118
8. Appendices
Appendix 1
3. Results
119
Appendix A. Example of minke whale encounter log which was laminated and used to record information using a chinagraph pencil.
Appendix B. Example of minke whale dive duration log which was laminated and used to record information using a chinagraph pencil.
3. Results
120
Appendix C. Example of minke whale survey form which was used as a hard copy for storage of survey trip and encounter information.
Appendix D. Example of minke whale survey form which was used as a hard copy for storage of encounter information.
3. Results
121
Appendix E. CD rom containing encounter data used during the study. Includes encounter locations, details (age & behaviour classes) and environmental variables associated with each encounter.