TEXAS TRANSPORTATION INSTITUTE TEXAS A&M RESEARCH FOUNDATION TECHNICAL MEMORANDUM 605-6 SUPPLEMENTARY STUDIES SAFETY PROVISIONS FOR SUPPORT STRUCTURES ON OVERHEAD SIGN BRIDGES By R. M. Olson D. L. Ivey J. E. Martinez E. R. Post R. H. Gunderson Prepared for the Department of Transportation, Federal Highway Administration, Bureau of Public Roads,· under Contract No. FH-11-7032. Financed with 1 1/2 percent HPR funds made available by the several States and administered by the Bureau of Public Roads. Sponsored By The States of Alabama, Arkansas, Connecticut, Florida, Georgia, Hawaii, Kentucky, Louisiana, Maryland, Michigan, Mississippi, Montana, Nebraska, New Hampshire, New Mexico, Rhode Island, South Dakota,.Tennessee, Texas, West Virginia, Wyoming, and the District of Columbia The op1n10ns, findings and conclusions expressed in this publi- cation are those of the authors and not necessarily those of the Bureau of Public roads and/or those of the State Highway Departments. MARCH 1971
Transcript
TEXAS TRANSPORTATION INSTITUTE TEXAS A&M RESEARCH FOUNDATION
TECHNICAL MEMORANDUM 605-6
SUPPLEMENTARY STUDIES
SAFETY PROVISIONS FOR SUPPORT STRUCTURES
ON OVERHEAD SIGN BRIDGES
By
R. M. Olson D. L. Ivey J. E. Martinez E. R. Post R. H. Gunderson
Prepared for the Department of Transportation, Federal Highway Administration, Bureau of Public Roads,· under Contract No. FH-11-7032. Financed with 1 1/2 percent HPR funds made available by the several States and administered by the Bureau of Public Roads.
Sponsored By
The States of Alabama, Arkansas, Connecticut, Florida, Georgia, Hawaii, Kentucky, Louisiana, Maryland, Michigan, Mississippi, Montana, Nebraska, New Hampshire, New Mexico, Rhode Island, South Dakota,.Tennessee, Texas, West Virginia, Wyoming, and the District of Columbia
The op1n10ns, findings and conclusions expressed in this publication are those of the authors and not necessarily those of the Bureau of Public roads and/or those of the State Highway Departments.
MARCH 1971
FOREWORD
This supplementary report contains a brief description of informa-
tion previously published in Volumes 1 through 5 listed in the following
table.
TECHNICAL MEMORANDUM AUTHOR(S) TITLE NUMBER
605-1 E. R. Post DESIGN, ANALYSIS C. P. Garner, Jr. AND CONSTRUCTION
(Volume 1 of 5) R. M. Olson
605-2 J. E. Martinez MATHEMATICAL J. J. Jumper S IMULAT ION AND
(Volume 2 of 5) F. Y. Baskurt CORRELATION
605-3 R. H. Gunderson A STUDY OF BUCK-A. Cetiner LING STRESS
(Volume 3 of 5) FORMULAS
605-4 D. L. Ivey C. E. Buth TESTING PROGRAM R. M. Olson
(Volume 4 of 5) T. J. Hirsch
605-5 A. J. Stocker FABRICATION AND (Volume 5 of 5) CONSTRUCTION
The interested reader can find a more detailed description of the
studies by consulting the five volumes. This supplementary report
(Volume 6) also contains a detailed account of work completed following
the publication of Volumes 1 through 5. The study was conducted under
Research Project HPR-2(107), entitled "Safety Provisions for Support
Structures on Overhead Sign Bridges", which was sponsored jointly by
twenty-two highway departments and the U.S. Department of Transportation,
Vehicular Velocity and Momentum Changes for 5000 1bm Vehicle . . • • . • • . • •
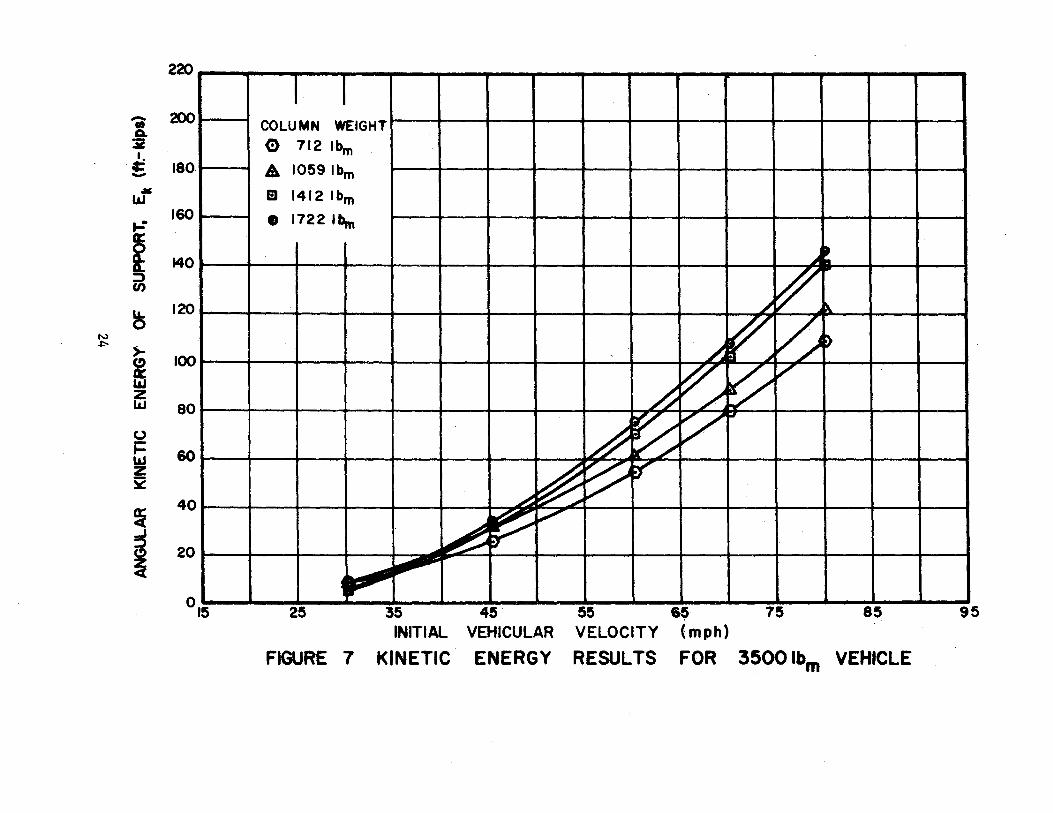
Kinetic Energy Results for 2000 lbm Vehicle · Kinetic Energy Results for 3500 lb Vehicle m
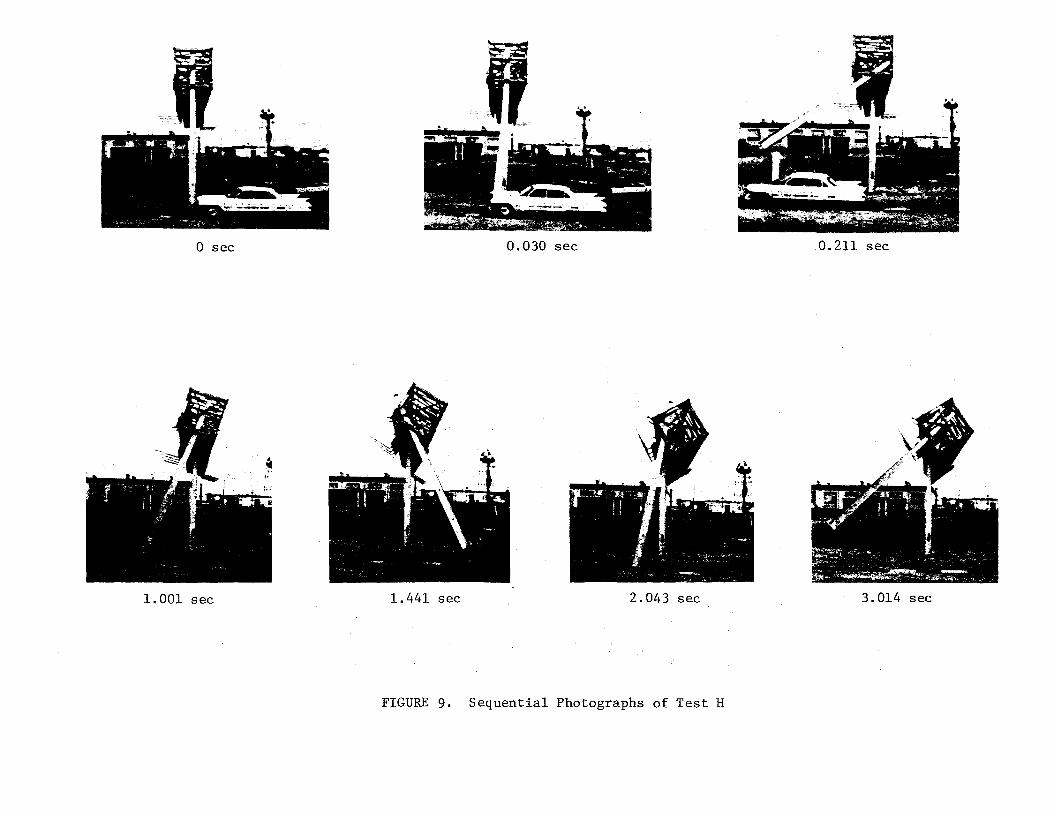
Kinetic Energy Results for 5000 1bm Vehicle · Sequential Photographs of Test H . . . Condition of Structure After Test H . . . . · Crash Vehicle After Test H . .
Sequential Photographs of Test I
Sequential Photographs of Test I •
Breakaway Base Movement at Column C, Test I
Splinter from Guide Angle
Damaged Vehicle, Test I . . . . . . . ... Location of Accelerometers With Respect to
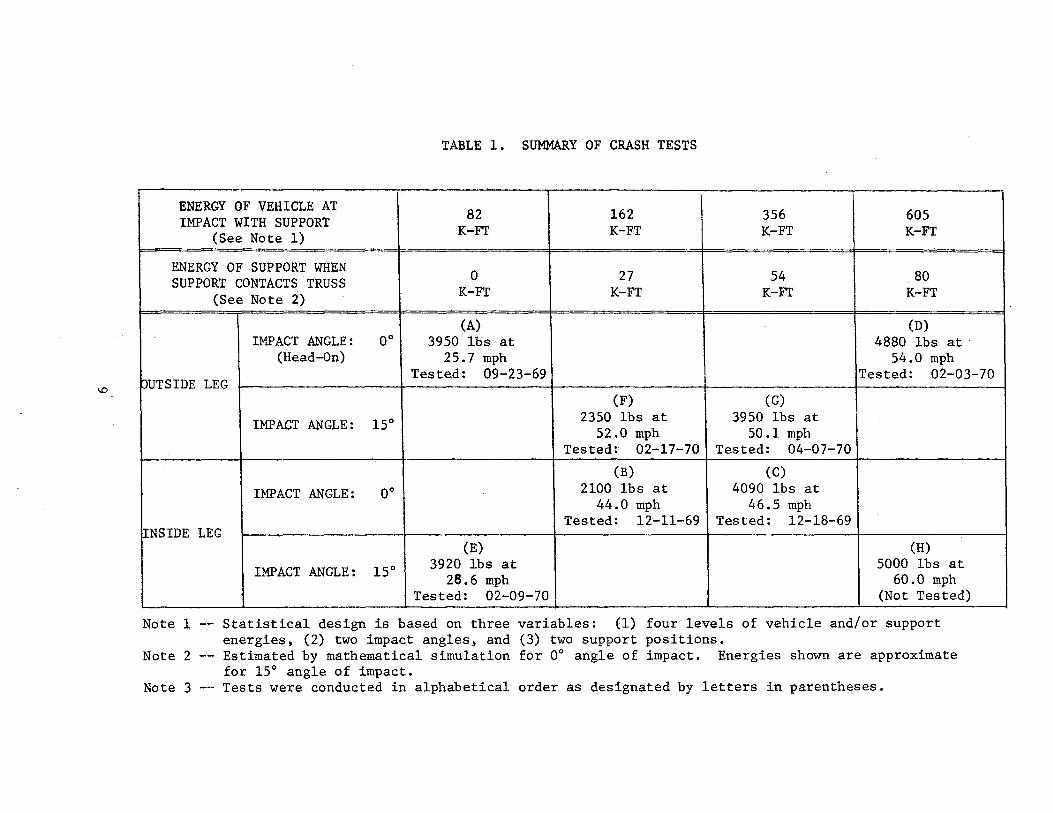
IMPACT ANGLE: 15° 2350 lbs at 3950 lbs at 52.0 mph 50.1 mph
Tested: 02-17-70 Tested: 04-07-70
(B) (C)
IMPACT ANGLE: 0° 2100 lbs at 4090 lbs at 44.0 mph 46.5 mph
Tested: 12-11-69 Tested: 12-18-69 INSIDE LEG
(E) (H)
IMP ACT ANGLE: 15° 3920 lbs at 5000 lbs at 26.6 mph 60.0 mph
Tested: 02-09-70 (Not Tested)
Note 1 Statistical design is based on three variables: (1) four levels of vehicle and/or support energies, (2) two impact angles, and (3) two support positions.
Note 2
Note 3
Estimated by mathematical simulation for 0° angle of impact. Energies shown are approximate for 15° angle of impact. Tests were conducted in alphabetical order as designated by letters in parentheses.
Project Policy Committee at its third and final meeting in September 1970.
These tests, conducted at speeds in excess of 70 mph, were designated
crash tests "H" and "I" and are discussed in detail in the following pages.
The work reported in the following pages was completed under Modifi
cation No. 3 to Contract No. FH-11-7032, which added (a) two additional
tests for verification and evaluation of the breakaway design by fu11-
scale crash testing, (b) static laboratory tests on breakaway bases and
other structural components, (c) full-scale torsion tests of the overhead
sign bridge truss, and (d) parameter studies by mathematical simulation.
10
I
CHAPTER 2. ADDITIONAL PARAMETER STUDIES
The Project Policy Committee (~) recommended that the preliminary
studies conducted by mathematical simulation and validated by full
scale crash tests (~) be extended to include:
(a) parametric studies to predict the behavior of columns smaller
and larger than those supporting the prototype structure and
(b) simulation of two additional full-scale crash tests using a
5,000 pound vehicle traveling 70 mph.
REVIEW OF EARLIER STUDY
Initial findings indicated the feasibility of the application of
the breakaway concept to supports for overhead sign bridges (~). Fur
ther, they showed that for a given vehicle weight and impact speed,
deceleration forces and vehicular damage increase as base plate and
upper plate connection strengths increase. And moreover, vehicle dam
age resulting from a collision with a breakaway overhead sign bridge
support is minor when compared with a similar fixed barrier collision
(see Figure 2).
Furthermore, evaluation of the simulation of collisions with sup
ports possessing various connection resistances revealed that the major
portion of the vehicular deceleration could be attributed to the weight
of the supporting column. However, no studies were made to determine
the precise influence of this effect.
11
a) 1954 Cadillac, weighing 4,800 Ibs., after collision with fixed post at 44.1 mph (10)
b) View showing damage to 1954 Cadillac, maximum post penetration was 4.50 feet (10)
c) 1962 Cadillac weighing 4,880 Ibs., following 54.0 mph collision with prototype breakaway support, maximum post penetration was 1.50 feet, vehicle was driven to garage (~)
FIGURE 2. COMPARISON OF VEHICLE DAMAGE
12
DISCUSSION OF ADDITIONAL PARAMETER STUDIES
Additional parameter studies were conducted to determine (a) behavior
of selected vehicles and (b) structural response when support conditions
are varied. Overhead sign bridge breakaway column dimensions and corres
ponding weights selected for these studies are shown in Table 2. Three
columns selected for these studies and the prototype column are shown
for comparison. The selected columns represent an increase of 22% and
decreases of 25% and 50% in the weight of the prototype column for which
the crash test data and parameter studies were reported earlier (~). The
flange and web tapers of the prototype were maintained in the first two
columns and the dimensions of the tapered column weighing 50% less than
the prototype were arbitrarily selected. For comparison purposes, two
commercially available prismatic rolled shapes were included.
Vehicles weighing 2,000 lbs, 3,500 lbs, and 5,000 lbs having impact
speeds varying from 15 mph to 60 mph were simulated. The resistance at
the upper connection was taken to be 22 kips and the base shear resistance
was taken to be 10 kips.
13
~I WHERE:
Subscript n = 0, Describes Base Connection Dimensions
Subscript n = 1, Describes Pin Connection Dimensions
Subscript n = 2, Describes Upper Connection Dimensions
*Weight of base and upper plates not included. The length was 26.5 ft for each support. **Scr> 100 ksi (steel). Failure predicted to occur by support yielding. (5)
Scr < 100 ksi (steel). Failure predicted to occur by elastic buckling. (~)
TABLE 2. OVERHEAD SIGN BRIDGE COLUMNS USED IN STUDY
Comments
100 mph wind load resisted by two interior columns (9)
100 mph wind load resisted by all four columns (~
These shapes may not be avail-able in 100 ksi steel.
RESULTS OF ADDITIONAL PARAMETER STUDIES
The results of the additional studies are presented in Tables 3
through 6, in which the behavior of selected vehicles in simulated colli
sions with posts weighing 712, 1,059, 1,412, and 1,722 1bs is compared.
Graphical presentations of these results are contained in Figures 3
through 8.
The study in general revealed that, for a given vehicle and velocity,
the lighter supports produced lower vehicle speed and momentum changes,
lower average decelerations, and caused less energy to be imparted to the
truss by the support as it swings following impact. The variation in
vehicular deformation was not as significant. This may be due to the fact
that the spring constant of the vehicle is assumed to be 10 times the
vehicular weight and the vehicle is taken to have a single degree of
freedom, whereas in reality it is a highly complex mu1ti-degree-of-freedom
system. It should be mentioned that the mathematical simulation of the
vehicle may appear to be oversimplified; correlation with numerous crash
tests has shown that this type of representation produces very satisfactory
results (I).
From this study it is apparent that the support weight cannot be
significantly increased if the vehicle velocity and momentum change are
to remain below the currently recommended values of 11 mph (LQ and
1,100 lb-sec~. In fact, even with the prototype support, all collisions
by 2,000 lb vehicles and medium and high-speed collisions by medium weight
vehicles may be interpreted as hazardous if the above mentioned criteria
are used. However, it should be borne in mind that the prototype structure
represents one of the largest OSB structures currently installed (~).
15
Change Maximum """1
Ivehicle Impact in Momentum Average Contact Vehicle Iweight Speed Speed Change Time Deformation Comments
(lbs) (mph) (mph) (lbs-sec) gls
(sec) (in. )
2000 15 13.8 1258. 5.8 0.108 12.1 Post hits top of car
2000 30 11.5 1048 4.4 0.120 19.2 Post hits truss Ek = 3.222 ft-k
2000 60 15.7 1432 6.9 0.104 29.2 Post hits truss Ek = 43.170 ft-k
2000 80 19.0 1734 8.6 0.131 36.0 Post hits truss Ek = 79.5 ft-k
3500 15 6.7 1069 4.0 0.076 9.2 Post clears vehicle Max. post rot =81 0
3500 30 5.9 941 3.3 0.082 13.1 Post hits truss Ek = 7.983 ft-k
3500 60 9.1 1452 5.3 0.078 21.8 Post hits truss Ek = 53.958 ft-k
3500 80 11.9 1892 7.3 0.074 27.6 Post hits truss Ek = 107.1 ft-k
5000 15 3.9 888 2.9 0.061 7.0 Post hits truss Ek =0.456 ft-k
5000 30 4.1 934 2.8 0.064 10.5 Post hits truss Ek = 10.513 ft-k
5000 60 6.8 1549 5.5 0.057 18.2 Post hits truss Ek = 67.003 ft-k
5000 80 8.5 1944 6.5 0.060 22.8 Post hits truss Ek = 117.2 ft-k
TABLE 3. RESULTS FOR POST MASS OF 712 LBS.
Change Maximum Vehicle Impact in Momentum Average Contact Vehicle '~eight Speed Speed Change g's Time Deformation Comments
(lbs) (mph) (mph) (lbs-sec) (sec) (in. )
2000 15 14.3 l304 5.7 0.114 12.3 Post hits hood of car
2000 30 12.7 1158 4.5 0.129 19.7 Post hits truss E = 1.831 ft-k k
2000 60 17.9 1632 6.3 0.129 31.2 Post hits truss Ek = 44.601 ft-k
2000 80 22.6 2061 7.5 0.l38 39.6 Post hits truss Ek = 90.011 ft-k
3500 15 6.9 1100 3.7 0.084 9.6 Post hits top of car
3500 30 6.8 1085 3.3 0.095 14.0 Post hits truss Ek .. 7.268 ft-k
60 10.8 1723 5.1 0.097 23.3 Post hits truss 3500 Ek = 59.082 ft-k
14.1 2253 7.1 0.091 30.0 Post hits truss
3500 80 Ek = 120.041 ft-k
4.1 934 2.7 0.068 7.3 Post hits car
5000 15 Max. rot = 67.6°
4.8 1094 3.0 0.072 11.4 Post hits truss 5000 30 Ek = 10.928 ft-k
5000 60 7.9 1801 4.9 0.073 20.1 Post hits truss Ek = 69.956 ft-k
10.4 2368 6.8 0.070 30.0 Post hits truss
5000 80 Ek = 137.672 ft-k
TABLE 4. RESULTS FOR POST MASS OF 1059 LBS.
I-' 00
Vehicle Weight
(lbs)
2000
2000
2000
2000
3500
3500
3500
3500
5000
5000
5000
5000
Impact Speed (mph)
15
30
60
80
15
30
60
80
15
30
60
80
Change in
Speed (mph)
15.0
14.0
21.1
26.7
7.1
7.8
13.2
17.3
4.5
5.7
9.9
12.6
Maximum Momentum Average Contact Vehicle
Change gls Time Deformation Comments (lbs-sec) (sec) (in. )
1368 8.2 0.084 12.4 Car was stopped
1276 4.4 0.146 20.4 Post clears car Max. rot = 78.4°
* "Mathematical Simulation and Correlation", Technical Memorandum 605-~ (I).
t Time during which breakaway components were activated. Vehicle snagged lower end of support post, was lifted and pulled to a stop, wedged between support post and the ground.
TABLE 12
TEST 605-H
High-Speed Film Data Vehicle Displacement versus Time
Time Displacement Time Displacement (milliseconds) (feet) (milliseconds) (feet)
-38.9 -4.3 (continued)
-31.1 -3.4 77.8 7.7
-23.3 -2.6 85.6 8.4
-15.6 -1. 7 93.4 9.1
-7.8 -0.9 101.2 9.9
0 Impact 0 108.9 10.6
7.8 0.9 116.7 11.3
15.6 1.7 124.5 12.1
23.3 2.5 132.3 12.8
31.1 3.3 140.1 13.5
38.9 4.1 147.9 14.3
46.7 4.8 155.6 15.0
54.5 5.5 163.4 15.8
62.3 Loss of 6.2 171.2 16.5
70.0 Contact 6.9 179.0 17.2
42
Time (milliseconds)
-39.9
-31.9
-24.0
-16.0
-7.9
0 Impact
10.0
20.0
29.9
39.9
49.9
59.9 Loss of
69.9 Contact
TABLE 13
TEST 605-1
High-Speed Film Data Vehicle Displacement versus Time
Displacement Time (feet) (milliseconds)
Displacement (feet)
-4.2 (continued)
-3.4 79.8 7.5
-2.5 89.8 8.4
-1. 7 99.8 9.3
-0.9 109.8 10.2
0 119.8 11.1
1.0 129.7 12.0
-2.0 139.7 12.9
3.0 149.7 13.8
4.0 159.7 14.7
4.9 169.7 15.5
5.8 179.6 16.4
6.6 189.6 17.3
43
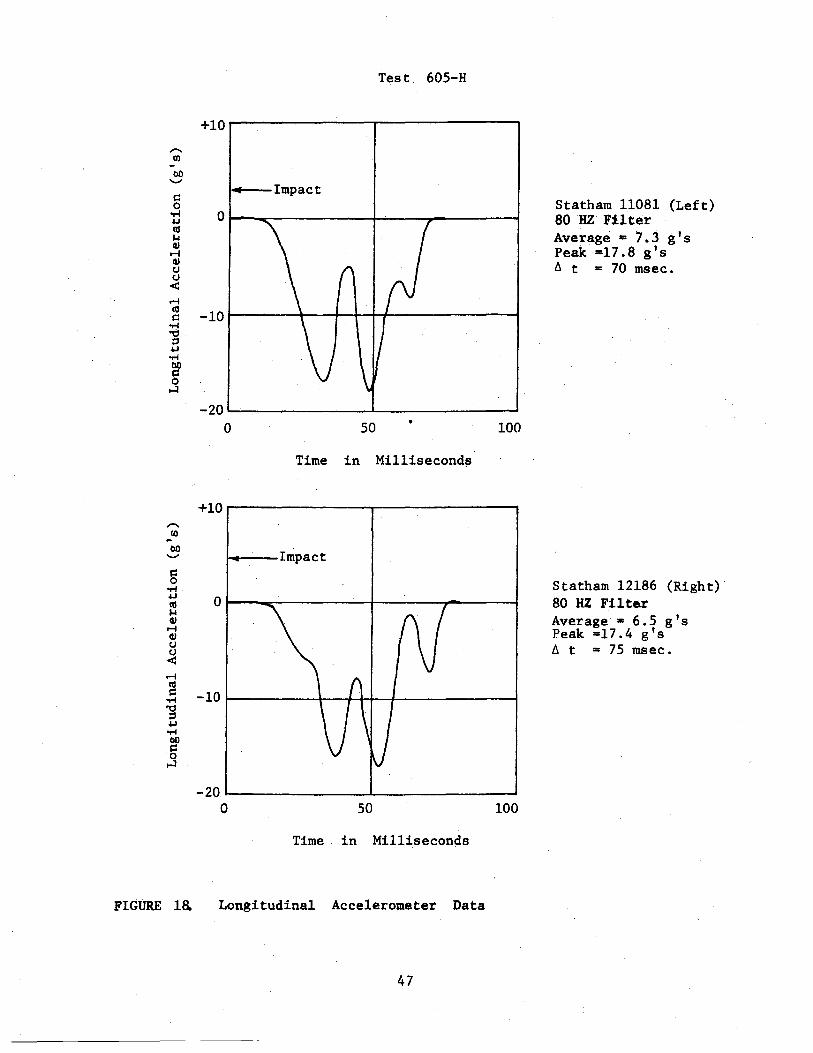
ACCELEROMETER DATA
The locations of the accelerometers with respect to the center of
gravity (CG) of the vehicle are shown in Figure 17. Figures 18, 19,
and 20 contain traces obtained from accelerometers mounted on the
crash vehicles in Tests H and I.
SUMMARY
A summary of crash test results is contained in Table 10, and a
comparison of computer simulation predictions with crash test results
is presented in Table 11. These tables include information for all
tests conducted during the course of the study. Details of Tests A
through G were reported in Technical Memoranda (~.
CONCLUSIONS
At the outset, this study was primarily concerned with the be
havior of an automobile colliding with a breakaway column supporting
an overhead sign bridge at low speed and high speed. Damage to the
colliding vehicle, decelerative forces and change in speed, were of
primary concern. As the study developed, it became clear that behavior
of the prototype structure, truss and supports during a high-speed
collision incident needed careful attention. Consequently, inside and
outside supports were struck at angles of zero and 15 degrees; load
distributors and guide angles were developed and incorporated into the
prototype structure. The following conclusions are drawn from the
study:
44
1. The breakaway safety features of this truss will reduce the
collision forces on a standard size vehicle to a level which
is considered survivable for restrained passengers.
2. The prototype structure remained erect, and suffered only
localized damages during the series of tests reported herein.
3. Computer simulation techniques have been satisfactorily com
pared with crash test data and vehicle and support behavior
are predictable using the computer simulation.
45
"--_---'I ~r ___ ~ O+l
) Accelerometer
! I I
+j>
Plan View
Statham Accelerometers (strain gage type)
80 HZ Low-Pass Filter (active analog)
Accelerometers
Side View
Figure 17. Location of Accelerometers With Respect to Vehicle eG.
46
Test 605-H
+10~--------------T-------------~
...--Impact
O~ __ ~----------~----~------~
,..;
~ -10~------+---~~~r-------------~ o,..j
." ;::I
.j,J o,..j
~ o ...:l
"'" UJ .
FIGURE 18.
-20~------------~--------------~
o 50 100
Time in Mi11isecond~
+10r---------------~------------~
'-----Impact
O~--~----------~------~------~
-10~--------r--+~--~~--------~
-20~-------------L------------~ o 50 100
Time in Milliseconds
Longitudinal Accelerometer Data
47
Statham 11081 (Left) 80HZ Filter Average • 7.3 g's Peak =17.8 g's t:. t = 70 msec.
Statham 12186 (Right) 80 HZ Filtar Average - 6.5 g's Peak =17.4 g's t:. t = 75 msec.
,-... Ul
~ +10
g oM ~ ('(I ~ Q)
r-I Q) (J (J
<
,-... Ul
o
00 +10 ......,
Test 605-1
I ... ..---Impact
50 100
Time in Milliseconds
~Impact
o 50 100
Time in Milliseconds
FIGURE 19. Transverse Accelerometer Data
48
Statham 20 (Left) 80 HZ Filter Average - 0.4 g's Peak = 2.6 g's /). t = 69 msec.
Statham 511 (Right) 80 HZ Filter Average = 0 .• 4 g IS Peak = 6.8 g's /). t = 69 msec.
+10
" en -00 0 '-'
s:: 0
..-I +J tU 1-1 Q)
.-I Q) (J
-10 (J
< .-I tU s::
..-I ~ :l +J ..-I 00
-20 s:: 0
...:I
o
F1GUl$ 20.
Test 605-1
.. Impact
f\ I ,
\ v
v
50 100
Time in Milliseconds
Longitudinal Accelerometer Data
49
Statham 11081 (Left) 80 HZ Filter Average = 8.8 gls Peak"'22.4 g's /). t = 55 msec.
LOWER CONNECTION TESTS
Nine additional laboratory tests were conducted using the pre
viously fabricated column stub and base. Parameters incorporated in
this series of tests were (1) the angle at which the load was applied,
(2) new bolts, nuts, and washers and (3) the condition of bolts, nuts,
and washers. Load and base slip data were recorded.
It was concluded that: (1) variables associated with bolts, nuts,
and washers caused as much as 100% v?riation in the peak force required
to slip the base and (2) the angle at which the load was applied has
a very small influence on the value of peak force.
ADDITIONAL TORSION TEST - STATIC TEST 605-S3
Two cranes were used to return the truss to its original position
fo11owirig crash test 60S-H. Following re-erection of the truss a
50 ton crane was used to apply a torque to the truss as had been done
previously (13). Results of this torsion test of the truss are shown in
Figure 21. During this test the wind was gusting to 25 mph from a
southerly direction.
Examination of the plotted data reveals that fracture of the upper
connection bolts at Column B occurred at a higher load and at a
greater rotation than in the previous test.
A remarkable and unexpected incident occurred when one of the
1-3/4 inch diameter 4130 high strength base bolts at Column B
50
fractured in tension at or about the time the upper connection bolts
fractured. The nut and part of the base bolt were catapulted upward
through the truss and above it about three to five feet. The load
dropped from 16 kips to 9 kips as shown in Figure 21.
After examining the structure, the broken bolt was replaced and
loading continued. It was apparent that the truss was much less stiff
than in the previous test conducted in 1969. The 1970 torsion test was
conducted on the structure after the entire full-scale impact test
program had been completed and the slip in the various bolted joint
connections and plastic working of some of the members would be expected
to influence the torque-rotation behavior of the structure. The prin
cipal investigator decided to discontinue the test before additional
unexpected incidents occurred. The reduction in torsional stiffness is
attributed to movement of the truss section bolted connections which
appeared to have some relative movement. That such movement occurred
was verified when Column A was lowered, and it was observed that the
base plates had approximately one inch clearance.
51
700
600
500
400
300
200
100
o
A B C D
1 1 1
LEGEND
----~--- 1969 Test 605-S2
1970 Test 605-S3
5 10 15
Rotation of Truss at Section A, Degrees
FIGURE 21. Torque-Rotation Relationship
52
20
ALTERNATE CONCEPTS
Several interesting alternate design concepts were suggested during
the course of this study. These alternate concepts were considered at
Project Policy Meetings and Technical Subcommittee Meetings, and are
presented here with brief comments about each concept.
CONCEPT A
An overhead sign bridge support with a lower breakaway base and a
truss roller assembly is shown in Figure A. Subsequent to the actuation
of the breakaway base, the support will clear the colliding vehicle
as it rotates around the outside of the truss. The rollers are attached
to the truss and guide a circular ring attached to the breakaway support.
A lighter truss can be used in this type of design because the
truss does not need to reduce the forces induced by the rotating support
when it strikes the truss as in the case of the present prototype OSB in
this study.
CONCEPT B
An overhead sign bridge with a lower breakaway base and an upper
hinged fuse plate is shown in Figure B. Subsequent to the actuation
of the breakaway base and the fracturing of the bolts on the near side
of the fuse plate, the rotating support will clear the colliding vehicle
as it pivots about the fuse plate on the far side which forms a
plastic hinge. In this type of design, the truss and remaining supports
must expend a portion of the kinetic energy of the rotating column;
however, the support must rotate about 90 degrees in order to strike the
truss as compared to about 60 degrees for the prototype OSB tested in
this study.
53
CONCEPT C
An overhead sign bridge with a lower breakaway base and an upper
frangible plate and arresting cable is shown in Figure C. Subsequent
to the actuation of the breakaway base and the fracturing of the upper
frangible fuse plates the rotating support will clear the colliding
vehicle as the support pivots at the end of a short length of an arresting
cable. As evident in Figure C, the support can rotate about 180 degrees
before striking the truss.
CONCEPT D
An overhead sign bridge with tubular frangible supports and cable
suspension system is shown in Figure D. Subsequent to one frangible
support being temporarily removed by a colliding vehicle, the overhead
sign bridge truss will function as a cantilever beam. Also, the outside
anchor cables are fastened to breakaway supports.
CONCEPT E
An overhead sign bridge with two breakaway supports and two break
away Gable anchors is shown in Figure E. Subsequent to the actuation of
the support breakaway base and the fracturing of the bolts on the near
side of the fuse plate, the rotating support will clear the colliding
vehicle as it pivots about the fuse plate on the far side which forms a
plastic hinge, and, the overhead sign bridge will function as a canti
lever beam. The-fuse plate detail is similar to that of Concept B.
This concept requires less distance between the support breakaway base
and the cable breakaway anchor location than that of Concept D.
54
CONCEPT F
An overhead sign bridge with three breakaway supports and two
breakaway cable anchors is shown in Figure F. Subsequent to the
actuation of a support breakaway base and the fracturing of the bolts
on the near side of the fuse plate, the rotating support will clear
the colliding vehicle as it pivots about the fuse plate on the far side
which forms a plastic hinge and, the overhead sign bridge will function
as a cantilever beam. The fuse plate detail is similar to that of
Concept B. This concept requires less distance between the support
breakaway base and the cable breakaway anchor location than that of
Concept D.
CONCEPT G
An overhead sign bridge with a lower breakaway base and an upper
hinged fuse plate is shown in Figure G. Subsequent to the actuation of
the ~reakaway base and the fracturing of the bolts on the near side of
the fuse plate, the rotating support will clear the colliding vehicle
as it pivots about the fuse plate on the far side which forms a plastic
hinge. In this type of design, the truss and remaining supports must
expend a portion of the kinetic energy of the rotating column; however,
the support must rotate about 180 degrees in order to strike the truss
as compared to about 60 degrees for the prototype OSB tested in this
study. This is a modification of Concept B; making the width of the
column connection (w) the same width as the truss allows the support
significantly greater freedom to rotate. The additional rotation could
be important especially in cases of impact by trucks.
55
TRUSS VERTICAL
RING
SHEAR ...-----,-PIN
.-+-+---....:..:.;ROLLER
ROLLER ASSEMBLY (Detail A)
I , I
"'DETAIL A
BREAK - AWAY BASE -----..
FIGURE A. OVERHEAD SIGN BRIDGE WITH BREAK - AWAY BASE AND CIRCULAR RING UPPER CONNECTION (AFTER HOBRLA)
PLASTIC HINGE
(For Side)
DETAil A
FUSE It
FUSE It (Detail A)
BREAK - AWAY BASE
FIGURE B OVERHEAD SIGN BRIDGE WITH BREAK-AWAY BASE AND PLASTIC HINGE UPPER CONNECTION (AFTER SCHEFFEY)
In 00
FRANGIBLE FUSE PLATE CONNECTION
TRUSS
ARRESTING CABLE
DETAIL A
FIGURE C OVERHEAD SIGN BRIDGE WITH BREAK - AWAY BASE AND FRANGIBLE FUSE PLATE UPPER CONNECTION
FIGURE D
PLAN
CABLES
ELEVATION
r--, I
ANCHOR CABLE WITH BREAK - AWAY BASE
17I .. ~--lIGHTWEIGHT
TUBULAR TRUSS
OVERHEAD SIGN BRIDGE WITH FRANGIBLE TUBULAR SUPPORTS AND CABLE SUSPENSION SYSTEM (AFTER IVEY )
-- --HINGE FUSE PLATE
~ BREAK - AWAY BASES
CABlES
----AL TERNA TE CA BlE LOCATION FOR BETTER FORCE DISTRIBUTION
CABLE (NO TENSILE
FORCE)
FIGURE E OVERHEAD SIGN BRIDGE WITH BREAK - A WAY SUPPORTS AND BREAK- AWAY CABLE ANCHORS (AFTER CHAPMAN)
/
/
CENTER SUPPORT
REMOVED
...... --U.L.&JL.GE FUSE PLATE
SIDE SUPPORT
REMOVED
CABLE
FIGURE F OVERHEAD SIGN BRIDGE WITH BREAK-AWAY SUPPORTS AND BREAK- AWAY CABLE ANCHORS (AFTER CHAPMAN)
PLASTIC HINGE
(For Side)
I---W---I
DETAIL A
BOLTS FRACTURE (Near Side)
FUSE t
NOTE: THIS IS A MODIFICATION OF CONCEPT B; MAKING THE WIDTH Of THE COWMN CONNECTION (W) THE SAME WIDTH AS THE TRUSS ALLOWS THE SUPPORT SIGNIFICANTLY GREATER FREEDOM TO ROTATE
FUSE t (Detail A)
/BREAK-AWAY BASE
~
FIGURE G OVERHEAD SIGN BRIDGE WITH BREAK-AWAY BASE AND PLASTfC HINGE UPPER CONNECTION (AFTER GUNDERSON)
REFERENCES
1. Olson, R. M., Post, E. R., and McFarland, W. F., "Tentative Service Requirements for Bridge Rail Systems," NCHRP 86, 1970, p. 6.
2. Rowan, N. J., Olson, R. M., Edwards, T. C., Gaddis, A. M., Williams, T. G., and Hawkins, D. L., "Impact Behavior of Sign Supports-II," A Staff Report by Texas Transportation Institute, College Station, Texas, 1965, 115 pp.
3. Edwards, T. C., "Breakaway Roadside Sign Support Structures," Summary Report on Project HPR-2(104) , Texas Transportation Institute, College Station, Texas, 1967, 12 pp.
4. AASHO. Specifications for the Design and Construction of Structural Supports for Highway Signs, Adopted by the American Association of State Highway Officials, 1968, 26 pp.
5. Krefeld, W. J., Butler, D. J., and Anderson, G. B.,"Welded Cantilever Wedge Beams." Supplement to the Welding Journal, March, 1959, pages 97s-ll2s.
6. Minutes of Meeting No.3 of the Project Policy Committee on "Safety Provisions for Support Structures on Overhead Sign Bridges," Project HPR-2(107), Dallas, Texas, September 28 and 29, 1970, Minute 81.
7. "Safety Provisions for Support Structures on Overhead Sign Bridges," Final Report on Project HPR-2(107) , Contract No. FH-11-7032, Texas Transportation Institute, Texas A&M University, College Station, Texas, 1970, Volume 2.
8. Q£. cit., Volume 2 and Volume 4.
9. Q£. cit., Volume 1.
10. "Breakaway Roadside Sign Support Structures," Final Report on Project HPR-2(104) , Contract No. CPR-II-3550, Texas Transportation Institute, Texas A&M University, College Station, Texas, 1967, Volume 1, Part III.
11. Patrick, L. M., et. aI., "Knee, Chest, and Head Impact Loads," Proceedings, 11th STAPP Car Crash Conference, Anaheim, California, October 10-11, 1967, p. 116.
12. Federal Highway Administration, Circular Memorandum dated June 5, 1968, "Application of Highway Safety Measures - Breakaway Luminaire Supports."
13. "Safety Provisions for Support Structures on Overhead Sign Bridges," Final Report on Project HPR-2(107) , Contract No. FH-11-7032, Texas Transportation Institute, Texas A&M University, College Station, Texas, 1970, Volume 4, pages 52-59.