Texas Medicaid Data for office of Senator John Cornyn George Leonardo 6/12/2017 ANNE DUNKELBERG , [email protected]ASSOCIATE DIRECTOR CENTER FOR PUBLIC POLICY PRIORITIES 7020 EASY WIND DR., SUITE 200 ● AUSTIN, TX 78752 T 512 823-2864 DESK | C 512-627-5528 1
Transcript
Texas Medicaid Datafor office of Senator John CornynGeorge Leonardo 6/12/2017
ANNE DUNKELBERG, [email protected] S S O C I AT E D I R E C TO RC E N T E R F O R P U B L I C P O L I C Y P R I O R I T I E S7 0 2 0 E A S Y W I N D D R . , S U I T E 2 0 0 ● AU S T I N , T X 7 8 7 5 2T 5 1 2 8 2 3 - 2 8 6 4 D E S K | C 5 1 2 - 6 2 7 - 5 5 2 8
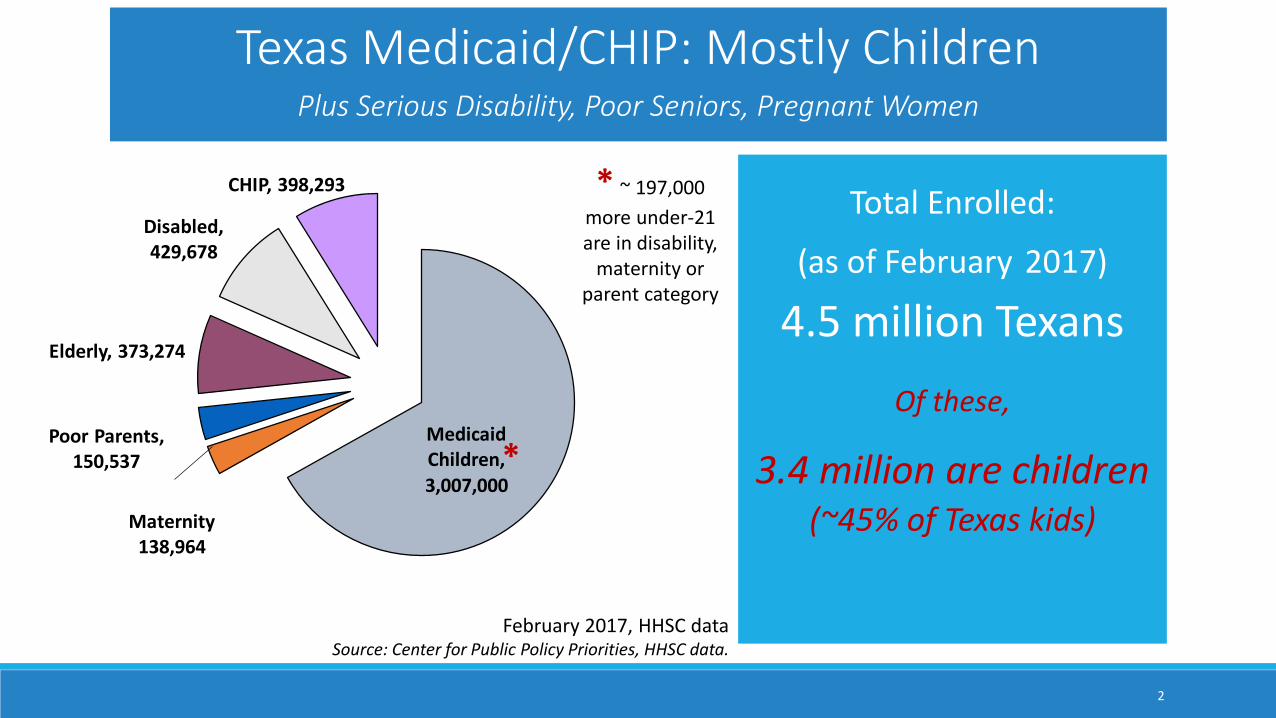
February 2017, HHSC dataSource: Center for Public Policy Priorities, HHSC data.
Texas Medicaid/CHIP: Mostly ChildrenPlus Serious Disability, Poor Seniors, Pregnant Women
2
Medicaid Children, 3,007,000
Maternity 138,964
Poor Parents, 150,537
Elderly, 373,274
Disabled, 429,678
CHIP, 398,293 * ~ 197,000 more under-21 are in disability,
maternity or parent category
*
Medicaid Children, 3,007,000
Maternity 138,964
Poor Parents, 150,537
Elderly, 373,274
Disabled, 429,678
CHIP, 398,293
Texas Medicaid and CHIP cover many Texas Children, but Texas Medicaid coverage for adults
is much more limited. Most low-income uninsured adults will not qualify for Medicaid in Texas today. Here’s who can get Medicaid as an adult in Texas: • Low-income pregnant women• Low-income women with Breast or Cervical
Cancer• VERY-low income adults caring for a child• Former Foster Care Children (ends at age 26)• People age 65+ and people with disabilities,
who are below or near poverty:o Includes people who need long-term careo Includes people who get Supplemental Security Income (SSI)o Medicaid pays some costs for low-income Medicare beneficiaries through the “Medicare Savings Program”o Some working adults with disabilities can “Buy-In” to Medicaid
3
February 2017, HHSC dataSource: Center for Public Policy Priorities, HHSC data.
Texas Medicaid/CHIP: Mostly Children
Why 3 million children, only 150,000 Parents? Income Caps for Texas Medicaid and CHIP, 2017
Note: Annual income cap for a family of 3, except individual incomes shown for SSI and Long Term Care
0%
50%
100%
150%
200%
250%
PregnantWomen
Newborns Age 1-5 Age 6-18 Parent of 2 SSI (aged ordisabled)
Long TermCare
CHIP
$30,433
$41,461 $41,461
203% 203%
149%
$28,189
138%$3,781
19% 74%
$9,060
222%
$27,180$42,073
206%
Income Limit as Percentage of
Federal Poverty Level
Source: Center for Public Policy Priorities.
(ACA Repeal
May ChangeThese!)
4
Analysis by Children’s Hospital Association of TexasNote: Includes children less than 19 years of age.Sources: Medicaid: 8-Month Eligibility Databases, HHSC; CHIP: P10_dob_regular database , HHSC. Prepared by Data Quality & Dissemination, Strategic Decision Support, HHSC. Children <19: Projections of the Population of Texas and Counties in Texas by Age, Sex and Race/Ethnicity for 2010-2050 (2000-2010 Migration (1.0) Scenario), UTSA, November 2014.
Less than 36% (66 counties)
36% to 44% (68 counties)
44% to 50% (57 counties)
50% and over (63 counties)
Nearly half of Texas Children Were Enrolledin Medicaid or CHIP in March 2014,
From a high of 77% to a low of 10%
5
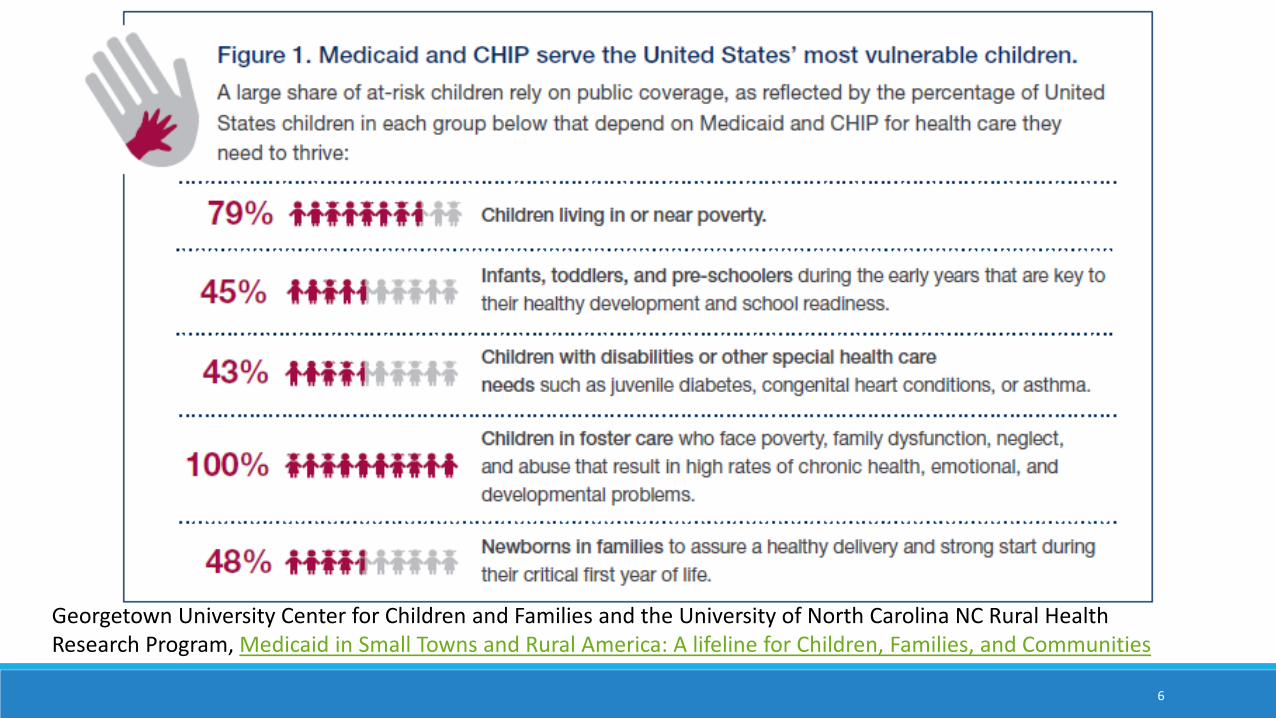
6
Georgetown University Center for Children and Families and the University of North Carolina NC Rural Health Research Program, Medicaid in Small Towns and Rural America: A lifeline for Children, Families, and Communities
Texas Schools depend More on Medicaid for Special Education support than any other State
In 2015, Medicaid paid for nearly $4 billion in school-based health care services, including both special education and EPSDT services provided outside of special education. Texas schools received $444 million, $250 million of it federal.
◦ For students with disabilities, schools provide medical services necessary for them to get an education as part of their special education plans, and Medicaid pays for these services for eligible children.
◦ Medicaid’s role in schools goes beyond special education: it also pays for health services all children need, such as vision and dental screenings, when they are provided in schools to Medicaid-eligible children.
◦ Medicaid helps schools by reducing their special education and other health care-related costs, freeing up funding in state and school budgets to help advance other education initiatives.
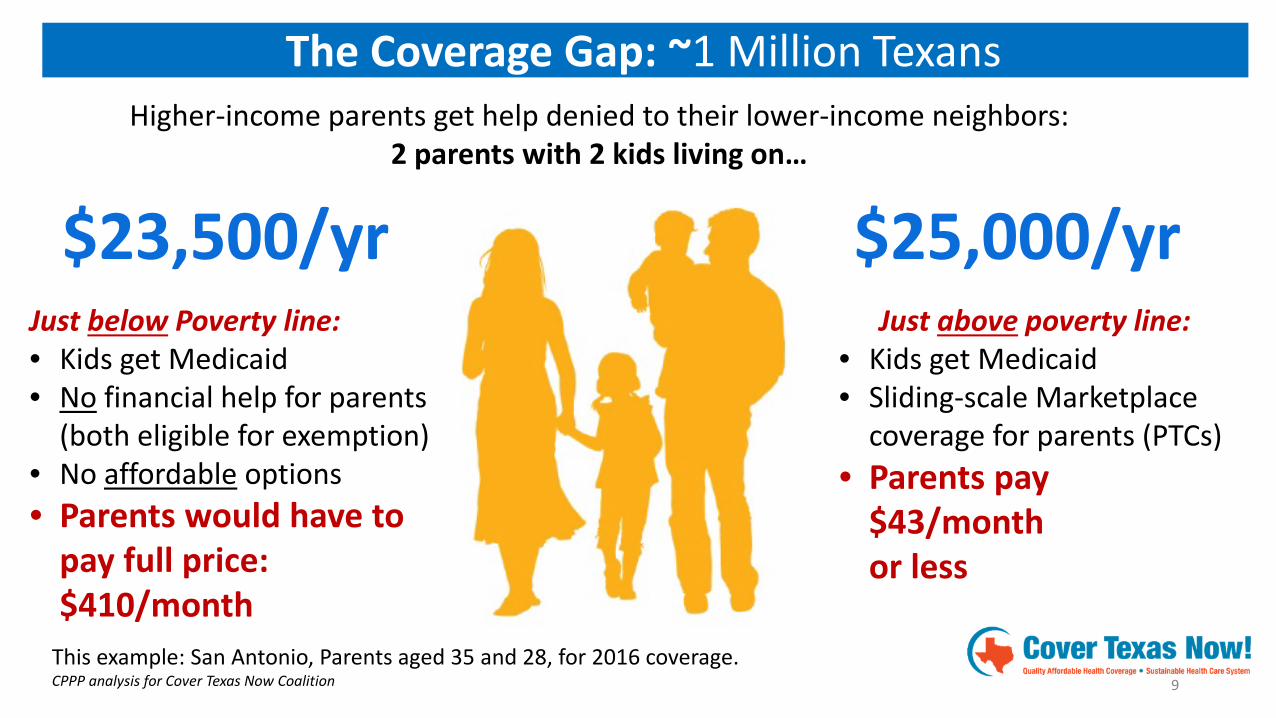
Higher-income parents get help denied to their lower-income neighbors: 2 parents with 2 kids living on…
$23,500/yr
The Coverage Gap: ~1 Million Texans
Just below Poverty line:• Kids get Medicaid• No financial help for parents
(both eligible for exemption)• No affordable options• Parents would have to
pay full price: $410/month
$25,000/yrJust above poverty line:
• Kids get Medicaid• Sliding-scale Marketplace
coverage for parents (PTCs)• Parents pay
$43/month or less
This example: San Antonio, Parents aged 35 and 28, for 2016 coverage.CPPP analysis for Cover Texas Now Coalition
10Texas Enrollee Medicaid Spending Varies by CategoryState Ranking of Medicaid Spending (Federal and State) per Full Benefit Enrollee, FY 2011
…
…
…
Source: Manatt analysis of Kaiser Family Foundation data. Available at: http://kff.org/medicaid/issue-brief/medicaid-per-enrollee-spending-variation-across-states/ New Mexico’s spending per aged enrollee was not available.
* Includes low-income parents and pregnant women.
# Total Children Adults* Disabled Aged1 MA $11,091 VT $5,214 NM $6,928 NY $33,808 WY $32,199 2 NY $10,307 AK $4,682 MT $6,539 CT $31,004 ND $31,155 3 RI $9,541 NM $4,550 AK $6,471 AK $28,790 CT $30,560 4 AK $9,481 RI $4,290 AZ $6,460 ND $28,692 NY $28,336 5 DC $9,083 MA $4,173 VT $6,062 DC $28,604 DE $27,666
36 TX $5,668 IA $2,116 WI $3,765 MT $16,352 TN $15,745
40 HI $5,506 LA $2,082 OK $3,551 LA $15,099 TX $14,739
47 AL $4,976 NV $1,940 FL $2,993 MS $12,960 CA $12,019 48 FL $4,893 MI $1,926 CA $2,855 KY $12,856 UT $11,763 49 IL $4,682 IN $1,858 NV $2,367 SC $12,830 IL $11,431 50 GA $4,245 FL $1,707 ME $2,194 GA $10,639 NC $10,518 51 NV $4,010 WI $1,656 IA $2,056 AL $10,142 NM N/A
U.S. Average $6,502 $2,492 $4,141 $18,518 $17,522
Texas’ spending per enrollee was 36th overall, though spending per enrollee varied by eligibility category
Texas spent more than most states on Children ($3,010 vs. US, $2,492)
Texas spent less than most states on the Aged ($14,739 vs. US, $17,522)
Texas’ Adult and Disabled spending were on par with national averages
11
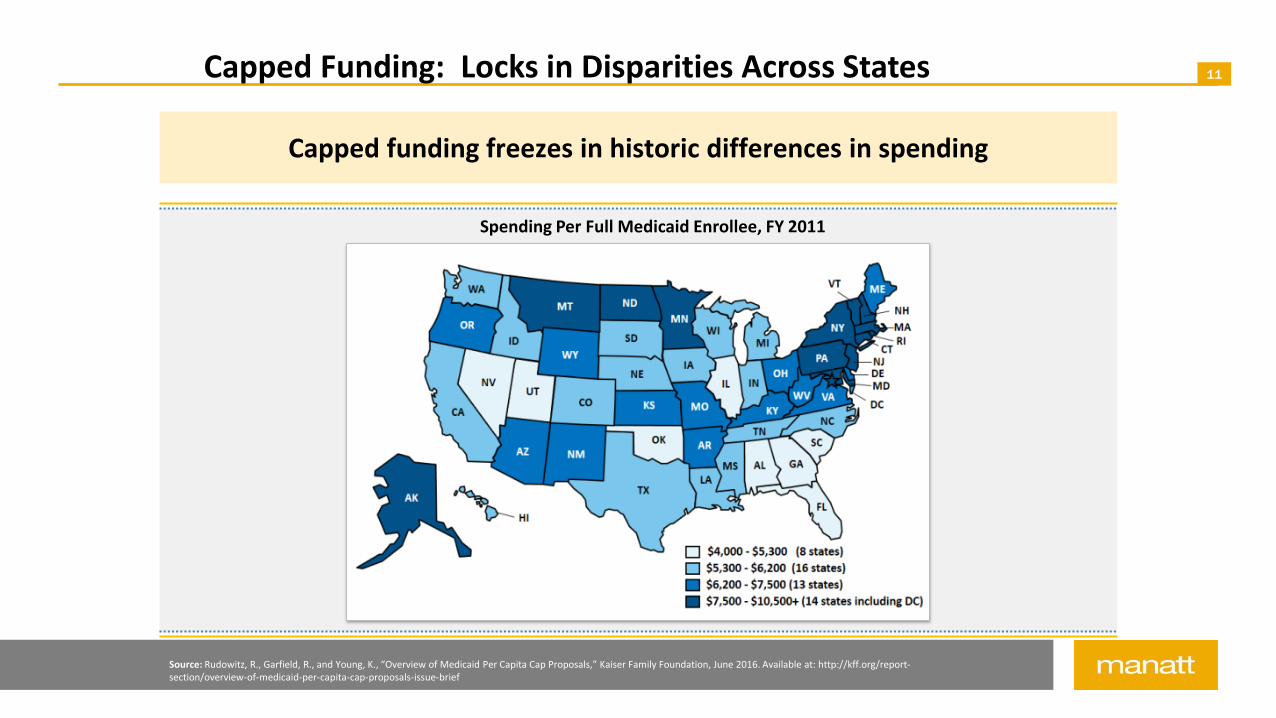
Source: Rudowitz, R., Garfield, R., and Young, K., “Overview of Medicaid Per Capita Cap Proposals,” Kaiser Family Foundation, June 2016. Available at: http://kff.org/report-section/overview-of-medicaid-per-capita-cap-proposals-issue-brief
Capped funding freezes in historic differences in spending
Spending Per Full Medicaid Enrollee, FY 2011
Capped Funding: Locks in Disparities Across States
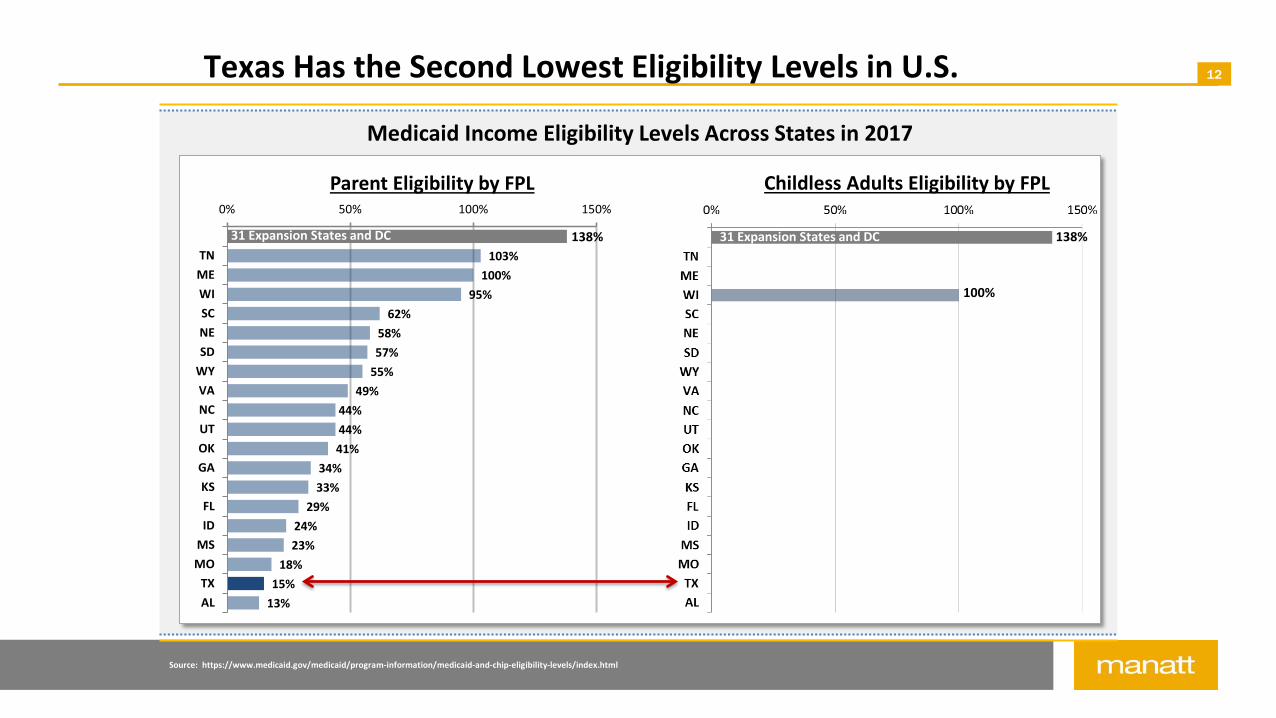
12Texas Has the Second Lowest Eligibility Levels in U.S.
Medicaid Income Eligibility Levels Across States in 2017
Supplemental payments are a major revenue source for Texas hospitals, but treatment of supplemental payments under funding caps is unclear
Capped Funding, Waivers, and Supplemental Payments
Source: Mann, C., Bachrach, B., Lam, A., and Codner, S., “Integrating Medicaid Supplemental Payments into Value-Based Purchasing,” The Commonwealth Fund, November 2016. Available at: http://www.commonwealthfund.org/publications/fund-reports/2016/nov/medicaid-supplemental-payments. MACPAC, 2016, analysis of CMS-64 FMR net expenditure data as of May 24, 2016 and CMS-64 Schedule C waiver report data as of August 2, 2016.
Supplemental Payments Per State as a Share of Total Medicaid Spending, FY 2015
Texas spends the greatest percentage of total Medicaid dollars on supplemental payments and waiver funds of any state.
Supplemental Payments account for:
• 1 in 4 Medicaid dollars spent
• 53% of Medicaid payments to hospitals participating in DSH and waiver programs
0% 10% 20%
NC
AL
CO
CA
IL
US
IN
NJ
TN
MO
ID
AR
MT
OH
UT
HI
WA
MA
NM
KY
VT
NE
WI
MN
SD
ND
Disproportionate Share Hospital (DHS) Payments
Non-DSH Supplemental Payments
1115 Waiver-abased Supplemental Payments
TEXAS
Texas Medicaid Enrollment and Spending
KEY FACTS 4.3 M enrollees $36.1 B total spending
($14.7 B state, $21.4 B federal)
56% federal match rate
Manatt Health Solutions. Sources: Robert Wood Johnson Foundation, “Data Points to Consider When Assessing Proposals to Cap Federal Medicaid Funding: A Toolkit for States”; MACStats ; Texas Health & Human Services Commission, “Texas Medicaid and CHIP in Perspective,” Feb. 2015.
Non-Disabled Children represent more than two-thirds of Texas Medicaid enrollees but less than one-third of spending
Aged and disabled enrollees represent only a quarter of Medicaid enrollees but 60% of costs
51.7%9.
Enrollees Expenditures
9%67%
26%
60%Aged &
Disabled
Non-Disabled
Adults
7%
31%
Non-Disabled Children
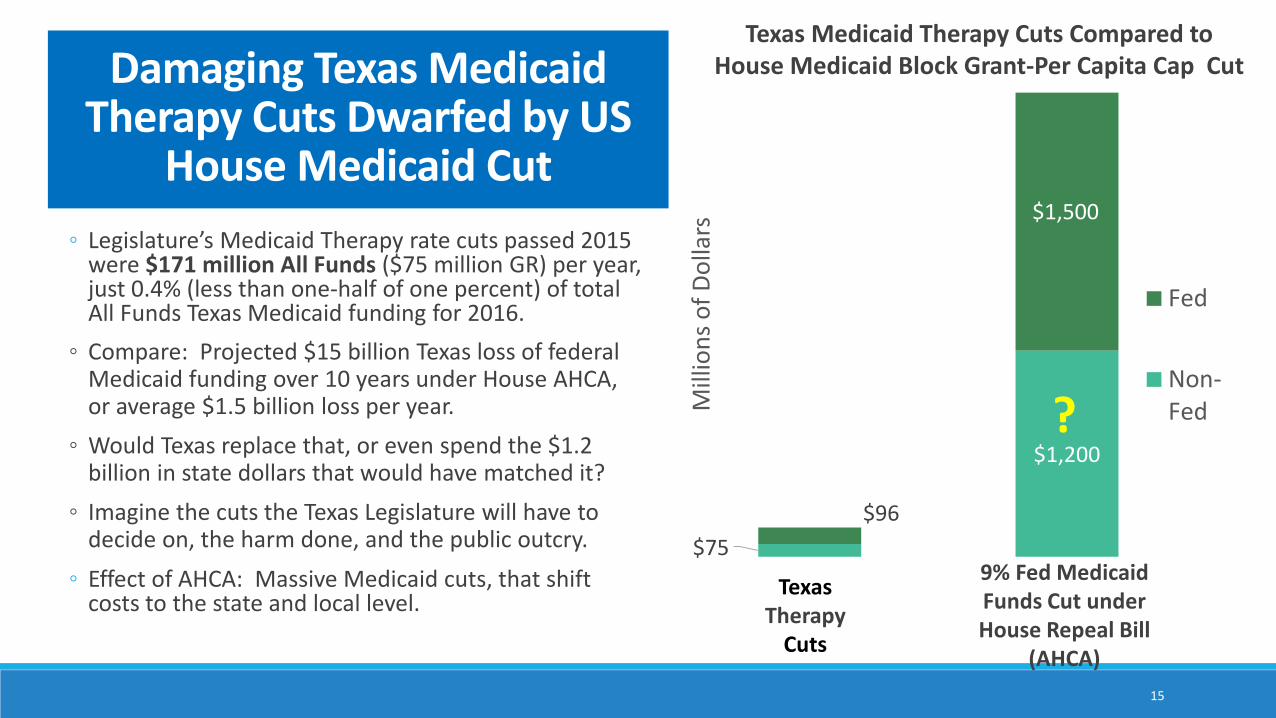
Damaging Texas Medicaid Therapy Cuts Dwarfed by US
House Medicaid Cut◦ Legislature’s Medicaid Therapy rate cuts passed 2015
were $171 million All Funds ($75 million GR) per year, just 0.4% (less than one-half of one percent) of total All Funds Texas Medicaid funding for 2016.
◦ Compare: Projected $15 billion Texas loss of federal Medicaid funding over 10 years under House AHCA, or average $1.5 billion loss per year.
◦ Would Texas replace that, or even spend the $1.2 billion in state dollars that would have matched it?
◦ Imagine the cuts the Texas Legislature will have to decide on, the harm done, and the public outcry.
◦ Effect of AHCA: Massive Medicaid cuts, that shift costs to the state and local level.
$75
$1,200
$96
$1,500
Mill
ions
of D
olla
rs
Fed
Non-Fed
Texas Therapy
Cuts
9% Fed Medicaid Funds Cut under House Repeal Bill
(AHCA)
Texas Medicaid Therapy Cuts Compared to House Medicaid Block Grant-Per Capita Cap Cut
15
?
16
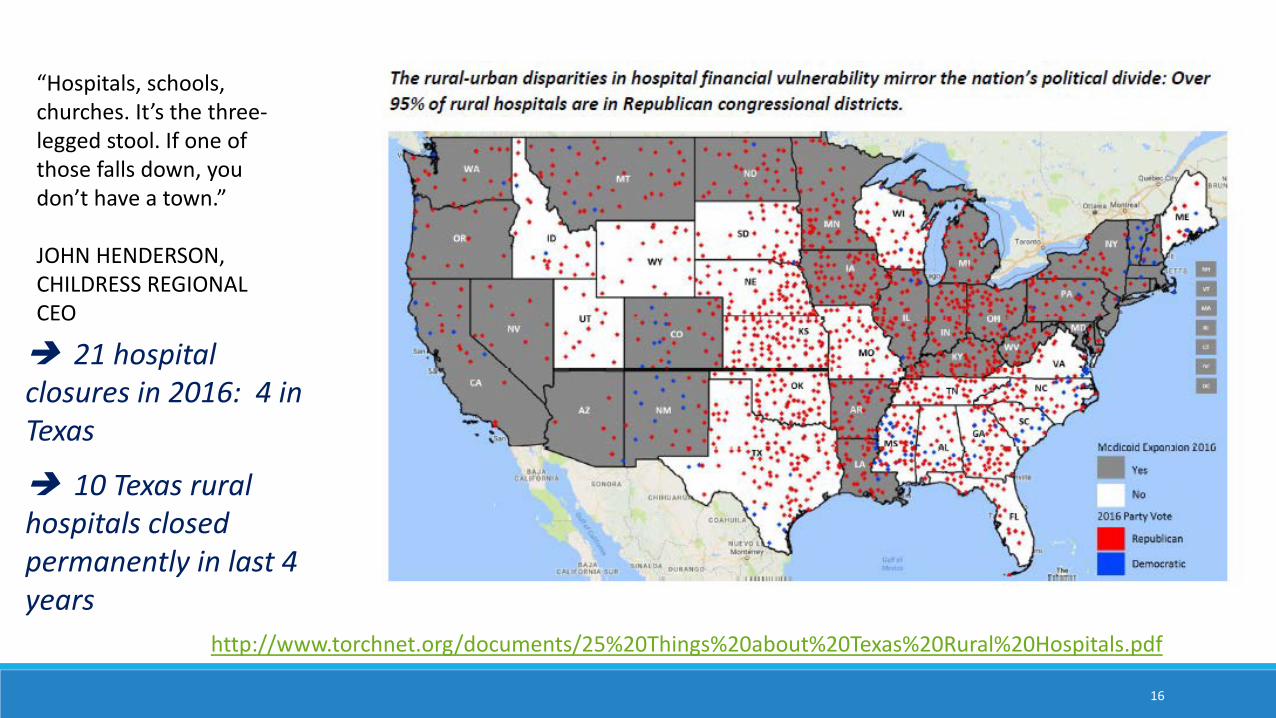
“Hospitals, schools, churches. It’s the three-legged stool. If one of those falls down, you don’t have a town.”
JOHN HENDERSON, CHILDRESS REGIONAL CEO
21 hospital closures in 2016: 4 in Texas
10 Texas rural hospitals closed permanently in last 4 years
◦ Dramatic reduction in affordability programs (tax-credit-based subsidies that reduce premiums and out-of-pocket copays and deductibles)
◦ No longer base subsidy on the actual cost of insurance, AND
◦ No more sliding scale based on income◦ Hikes premiums for age 50-65
◦ AS a result: Affects seniors, rural Texans, lowest income worst
18
County
Guadalupe/Atascosa
60 year-old Dallas county resident, $30,000 annual income ; now pays $2,480 or 8% of her income. Loses 1/3 of ACA tax credit: drop from about $6,000 today under the ACA to a flat $4,000 under the House repeal bill. Rural neighbors take a bigger hit: Same 60-year-old living in Cleburne, Bowie or Wichita Falls, where insurance prices are higher, would lose 2/3 or more of her subsidy (KFF.org, AHCA)
19
County Credit ACA Credit House Bill
Loss
Bexar(San Antonio)
$5,840 $4,000 -$1,840 (32%)
Guadalupe(Seguin)
$12,150 $4,000 -$8,150 (67%)
Dallas $6,000 $4,000 -$2,000 (33%)
Wichita Falls $15,300 $4,000 -$11,300 (74%)
Montague(Nocona)
$11,280 $4,000 -$7,280 (65%)
Travis(Austin)
$6,730 $4,000 -$2,730 (41%)
Brazos(College Station)
$11,870 $4,000 -$7,870 (66%)
Tom Green(San Angelo)
$14,390 $4,000 -$10,390 (72%)
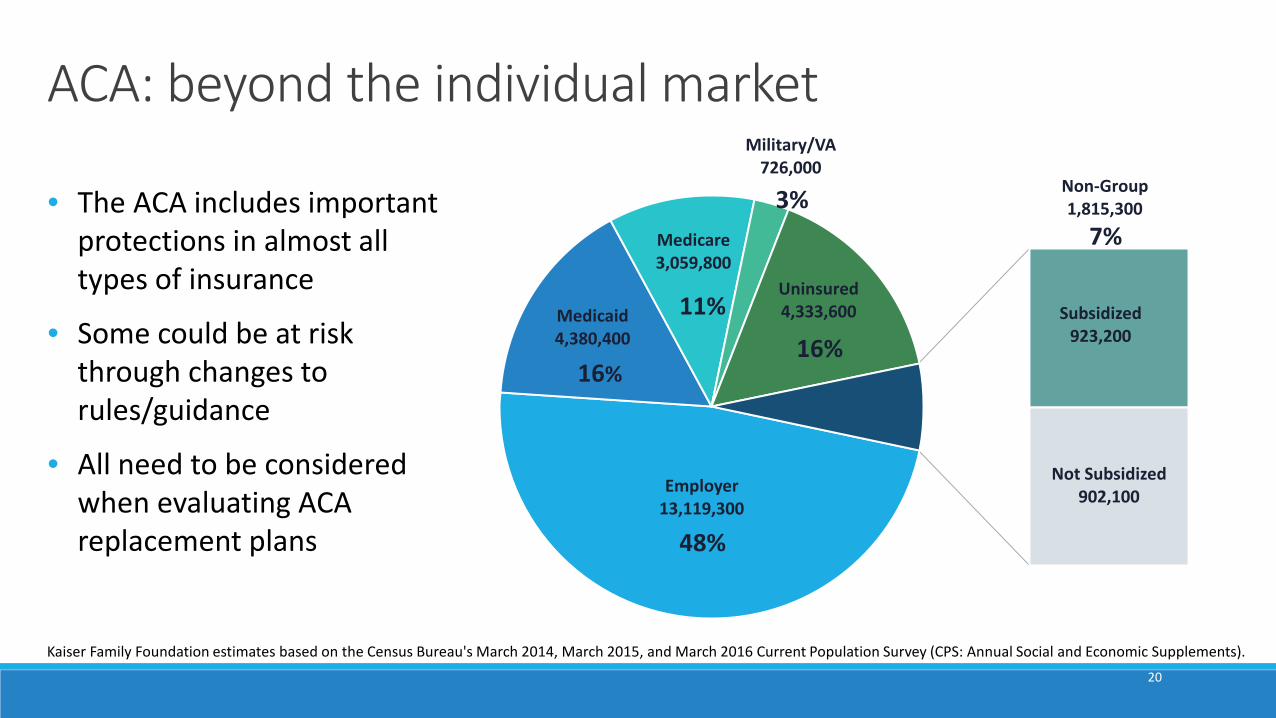
ACA: beyond the individual market
Kaiser Family Foundation estimates based on the Census Bureau's March 2014, March 2015, and March 2016 Current Population Survey (CPS: Annual Social and Economic Supplements).
Employer13,119,300
Medicaid4,380,400
Medicare3,059,800
Military/VA726,000
Uninsured4,333,600 Subsidized
923,200
Not Subsidized902,100
Non-Group1,815,300
48%
7%
16%
3%
11%
16%
• The ACA includes important protections in almost all types of insurance
• Some could be at risk through changes to rules/guidance
• All need to be considered when evaluating ACA replacement plans
20
More information:Two reports on the intersection/potential impact of federal Medicaid funding reductions, state and local government costs, and impact on hospitals.
• Texas Impact report, produced with THA, Texas Association of Business, and Texas Association of Community Health Plans: http://texasimpact.org/Uncompensated-Care
• Manatt report (from which several slides in the deck came) on capped Medicaid funding and Texas: https://www.manatt.com/Insights/White-Papers/2017/Capped-Federal-Medicaid-Funding-Implications-for