All Students
STATE OF TEXAS ASSESSMENTS OF ACADEMIC READINESS Summary Report
ALGEBRA IDate of Testing:
District: FALL 2015Campus:
129-903 KAUFMAN ISD Report Date: 003 GARY W CAMPBELL
FALL 2015
Legend
--- = No Data Reported For Fewer Than Five Students
Administration Summary
Number Percent
Students Tested
Students Not Tested
Other
Total Documents Submitted
Absent
8 100
00
00
8 100
Nu
mb
er o
fS
tud
ents
Tes
ted
Ave
rag
eS
cale
Sco
re
Lev
el II
:S
atis
fact
ory
# %
Lev
el II
I:
Ad
van
ced
# %
PASSED
Lev
el I:
U
nsa
tisf
acto
ry
# %
DID NOT PASS
Fu
nct
ion
alR
elat
ion
ship
s
Number of Items Tested
Pro
per
ties
an
dA
ttri
bu
tes
of
Fu
nct
ion
s
Lin
ear
Fu
nct
ion
s
Lin
ear
Eq
uat
ion
san
d In
equ
alit
ies
Qu
adra
tic
and
Oth
er N
on
linea
rF
un
ctio
ns
# % %# %# %# %#
1 2 3 4 5Results for Each Reporting Category
Avg. # of Items / % Correct8 12 15 10 9
All Students 8 3378 1 13 0 0 7 88 2.6 33 4.0 33 5.9 39 2.4 24 3.0 33Male 4 --- --- --- --- --- --- --- --- --- --- --- --- --- --- --- --- ---Female 4 --- --- --- --- --- --- --- --- --- --- --- --- --- --- --- --- ---No Information Provided 0 --- --- --- --- --- --- --- --- --- --- --- --- --- --- --- --- ---Hispanic/Latino 1 --- --- --- --- --- --- --- --- --- --- --- --- --- --- --- --- ---American Indian or Alaska Native 0 --- --- --- --- --- --- --- --- --- --- --- --- --- --- --- --- ---Asian 0 --- --- --- --- --- --- --- --- --- --- --- --- --- --- --- --- ---Black or African American 0 --- --- --- --- --- --- --- --- --- --- --- --- --- --- --- --- ---Native Hawaiian or Other Pacific Islander 0 --- --- --- --- --- --- --- --- --- --- --- --- --- --- --- --- ---White 7 3420 1 14 0 0 6 86 3.0 38 3.7 31 6.3 42 2.6 26 3.3 37Two or More Races 0 --- --- --- --- --- --- --- --- --- --- --- --- --- --- --- --- ---No Information Provided 0 --- --- --- --- --- --- --- --- --- --- --- --- --- --- --- --- ---Economically 4 --- --- --- --- --- --- --- --- --- --- --- --- --- --- --- --- ---Disadvantaged 4 --- --- --- --- --- --- --- --- --- --- --- --- --- --- --- --- ---
0 --- --- --- --- --- --- --- --- --- --- --- --- --- --- --- --- ---Title I, Part A 1 --- --- --- --- --- --- --- --- --- --- --- --- --- --- --- --- ---
7 3420 1 14 0 0 6 86 3.0 38 3.7 31 6.3 42 2.6 26 3.3 370 --- --- --- --- --- --- --- --- --- --- --- --- --- --- --- --- ---
Migrant 0 --- --- --- --- --- --- --- --- --- --- --- --- --- --- --- --- ---8 3378 1 13 0 0 7 88 2.6 33 4.0 33 5.9 39 2.4 24 3.0 330 --- --- --- --- --- --- --- --- --- --- --- --- --- --- --- --- ---
Limited English 0 --- --- --- --- --- --- --- --- --- --- --- --- --- --- --- --- ---Proficient 0 --- --- --- --- --- --- --- --- --- --- --- --- --- --- --- --- ---
0 --- --- --- --- --- --- --- --- --- --- --- --- --- --- --- --- ---8 3378 1 13 0 0 7 88 2.6 33 4.0 33 5.9 39 2.4 24 3.0 330 --- --- --- --- --- --- --- --- --- --- --- --- --- --- --- --- ---
Bilingual 0 --- --- --- --- --- --- --- --- --- --- --- --- --- --- --- --- ---8 3378 1 13 0 0 7 88 2.6 33 4.0 33 5.9 39 2.4 24 3.0 330 --- --- --- --- --- --- --- --- --- --- --- --- --- --- --- --- ---
ESL 0 --- --- --- --- --- --- --- --- --- --- --- --- --- --- --- --- ---8 3378 1 13 0 0 7 88 2.6 33 4.0 33 5.9 39 2.4 24 3.0 330 --- --- --- --- --- --- --- --- --- --- --- --- --- --- --- --- ---
Special Education 1 --- --- --- --- --- --- --- --- --- --- --- --- --- --- --- --- ---7 3369 1 14 0 0 6 86 3.0 38 3.9 32 5.7 38 2.3 23 2.9 320 --- --- --- --- --- --- --- --- --- --- --- --- --- --- --- --- ---
Gifted/Talented 0 --- --- --- --- --- --- --- --- --- --- --- --- --- --- --- --- ---8 3378 1 13 0 0 7 88 2.6 33 4.0 33 5.9 39 2.4 24 3.0 330 --- --- --- --- --- --- --- --- --- --- --- --- --- --- --- --- ---
At-Risk 8 3378 1 13 0 0 7 88 2.6 33 4.0 33 5.9 39 2.4 24 3.0 330 --- --- --- --- --- --- --- --- --- --- --- --- --- --- --- --- ---0 --- --- --- --- --- --- --- --- --- --- --- --- --- --- --- --- ---
Career/Technical 4 --- --- --- --- --- --- --- --- --- --- --- --- --- --- --- --- ---Education 4 --- --- --- --- --- --- --- --- --- --- --- --- --- --- --- --- ---
0 --- --- --- --- --- --- --- --- --- --- --- --- --- --- --- --- ---
YesNo
No Information ProvidedParticipants
NonparticipantsNo Information Provided
YesNo
No Information ProvidedCurrent LEP
Non-LEP (Monitored 1st Year)Non-LEP (Monitored 2nd Year)
Other Non-LEPNo Information Provided
ParticipantsNonparticipants
No Information ProvidedParticipants
NonparticipantsNo Information Provided
YesNo
No Information ProvidedParticipants
NonparticipantsNo Information Provided
YesNo
No Information ProvidedParticipants
NonparticipantsNo Information Provided
21016-00001577-129903003
First-Time Tested Students
STATE OF TEXAS ASSESSMENTS OF ACADEMIC READINESS Summary Report
ALGEBRA IDate of Testing:
District: FALL 2015Campus:
129-903 KAUFMAN ISD Report Date: 003 GARY W CAMPBELL
FALL 2015
Legend
--- = No Data Reported For Fewer Than Five Students
Administration Summary
Number Percent
Students Tested
Students Not Tested
Other
Total Documents Submitted
Absent
2 100
00
00
2 100
Nu
mb
er o
fS
tud
ents
Tes
ted
Ave
rag
eS
cale
Sco
re
Lev
el II
:S
atis
fact
ory
# %
Lev
el II
I:
Ad
van
ced
# %
PASSED
Lev
el I:
U
nsa
tisf
acto
ry
# %
DID NOT PASS
Fu
nct
ion
alR
elat
ion
ship
s
Number of Items Tested
Pro
per
ties
an
dA
ttri
bu
tes
of
Fu
nct
ion
s
Lin
ear
Fu
nct
ion
s
Lin
ear
Eq
uat
ion
san
d In
equ
alit
ies
Qu
adra
tic
and
Oth
er N
on
linea
rF
un
ctio
ns
# % %# %# %# %#
1 2 3 4 5Results for Each Reporting Category
Avg. # of Items / % Correct8 12 15 10 9
All Students 2 --- --- --- --- --- --- --- --- --- --- --- --- --- --- --- --- ---Male 1 --- --- --- --- --- --- --- --- --- --- --- --- --- --- --- --- ---Female 1 --- --- --- --- --- --- --- --- --- --- --- --- --- --- --- --- ---No Information Provided 0 --- --- --- --- --- --- --- --- --- --- --- --- --- --- --- --- ---Hispanic/Latino 0 --- --- --- --- --- --- --- --- --- --- --- --- --- --- --- --- ---American Indian or Alaska Native 0 --- --- --- --- --- --- --- --- --- --- --- --- --- --- --- --- ---Asian 0 --- --- --- --- --- --- --- --- --- --- --- --- --- --- --- --- ---Black or African American 0 --- --- --- --- --- --- --- --- --- --- --- --- --- --- --- --- ---Native Hawaiian or Other Pacific Islander 0 --- --- --- --- --- --- --- --- --- --- --- --- --- --- --- --- ---White 2 --- --- --- --- --- --- --- --- --- --- --- --- --- --- --- --- ---Two or More Races 0 --- --- --- --- --- --- --- --- --- --- --- --- --- --- --- --- ---No Information Provided 0 --- --- --- --- --- --- --- --- --- --- --- --- --- --- --- --- ---Economically 1 --- --- --- --- --- --- --- --- --- --- --- --- --- --- --- --- ---Disadvantaged 1 --- --- --- --- --- --- --- --- --- --- --- --- --- --- --- --- ---
0 --- --- --- --- --- --- --- --- --- --- --- --- --- --- --- --- ---Title I, Part A 0 --- --- --- --- --- --- --- --- --- --- --- --- --- --- --- --- ---
2 --- --- --- --- --- --- --- --- --- --- --- --- --- --- --- --- ---0 --- --- --- --- --- --- --- --- --- --- --- --- --- --- --- --- ---
Migrant 0 --- --- --- --- --- --- --- --- --- --- --- --- --- --- --- --- ---2 --- --- --- --- --- --- --- --- --- --- --- --- --- --- --- --- ---0 --- --- --- --- --- --- --- --- --- --- --- --- --- --- --- --- ---
Limited English 0 --- --- --- --- --- --- --- --- --- --- --- --- --- --- --- --- ---Proficient 0 --- --- --- --- --- --- --- --- --- --- --- --- --- --- --- --- ---
0 --- --- --- --- --- --- --- --- --- --- --- --- --- --- --- --- ---2 --- --- --- --- --- --- --- --- --- --- --- --- --- --- --- --- ---0 --- --- --- --- --- --- --- --- --- --- --- --- --- --- --- --- ---
Bilingual 0 --- --- --- --- --- --- --- --- --- --- --- --- --- --- --- --- ---2 --- --- --- --- --- --- --- --- --- --- --- --- --- --- --- --- ---0 --- --- --- --- --- --- --- --- --- --- --- --- --- --- --- --- ---
ESL 0 --- --- --- --- --- --- --- --- --- --- --- --- --- --- --- --- ---2 --- --- --- --- --- --- --- --- --- --- --- --- --- --- --- --- ---0 --- --- --- --- --- --- --- --- --- --- --- --- --- --- --- --- ---
Special Education 0 --- --- --- --- --- --- --- --- --- --- --- --- --- --- --- --- ---2 --- --- --- --- --- --- --- --- --- --- --- --- --- --- --- --- ---0 --- --- --- --- --- --- --- --- --- --- --- --- --- --- --- --- ---
Gifted/Talented 0 --- --- --- --- --- --- --- --- --- --- --- --- --- --- --- --- ---2 --- --- --- --- --- --- --- --- --- --- --- --- --- --- --- --- ---0 --- --- --- --- --- --- --- --- --- --- --- --- --- --- --- --- ---
At-Risk 2 --- --- --- --- --- --- --- --- --- --- --- --- --- --- --- --- ---0 --- --- --- --- --- --- --- --- --- --- --- --- --- --- --- --- ---0 --- --- --- --- --- --- --- --- --- --- --- --- --- --- --- --- ---
Career/Technical 0 --- --- --- --- --- --- --- --- --- --- --- --- --- --- --- --- ---Education 2 --- --- --- --- --- --- --- --- --- --- --- --- --- --- --- --- ---
0 --- --- --- --- --- --- --- --- --- --- --- --- --- --- --- --- ---
YesNo
No Information ProvidedParticipants
NonparticipantsNo Information Provided
YesNo
No Information ProvidedCurrent LEP
Non-LEP (Monitored 1st Year)Non-LEP (Monitored 2nd Year)
Other Non-LEPNo Information Provided
ParticipantsNonparticipants
No Information ProvidedParticipants
NonparticipantsNo Information Provided
YesNo
No Information ProvidedParticipants
NonparticipantsNo Information Provided
YesNo
No Information ProvidedParticipants
NonparticipantsNo Information Provided
21016-00001577-129903003
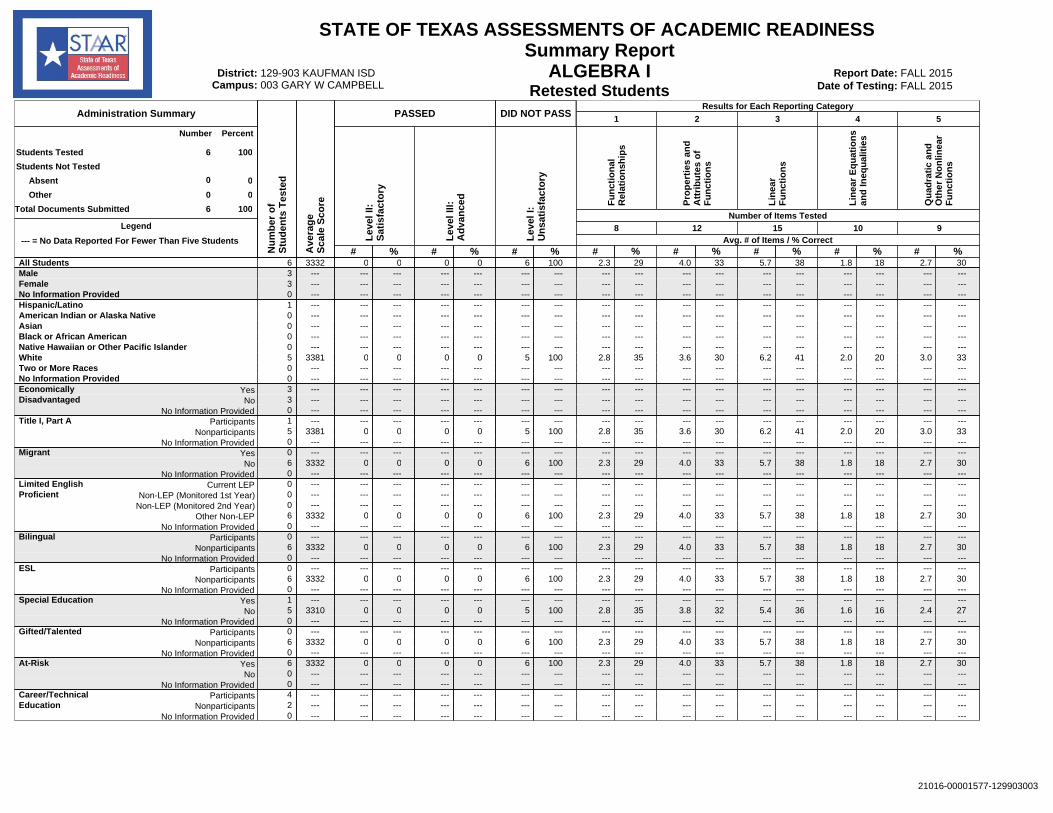
Retested Students
STATE OF TEXAS ASSESSMENTS OF ACADEMIC READINESS Summary Report
ALGEBRA IDate of Testing:
District: FALL 2015Campus:
129-903 KAUFMAN ISD Report Date: 003 GARY W CAMPBELL
FALL 2015
Legend
--- = No Data Reported For Fewer Than Five Students
Administration Summary
Number Percent
Students Tested
Students Not Tested
Other
Total Documents Submitted
Absent
6 100
00
00
6 100
Nu
mb
er o
fS
tud
ents
Tes
ted
Ave
rag
eS
cale
Sco
re
Lev
el II
:S
atis
fact
ory
# %
Lev
el II
I:
Ad
van
ced
# %
PASSED
Lev
el I:
U
nsa
tisf
acto
ry
# %
DID NOT PASS
Fu
nct
ion
alR
elat
ion
ship
s
Number of Items Tested
Pro
per
ties
an
dA
ttri
bu
tes
of
Fu
nct
ion
s
Lin
ear
Fu
nct
ion
s
Lin
ear
Eq
uat
ion
san
d In
equ
alit
ies
Qu
adra
tic
and
Oth
er N
on
linea
rF
un
ctio
ns
# % %# %# %# %#
1 2 3 4 5Results for Each Reporting Category
Avg. # of Items / % Correct8 12 15 10 9
All Students 6 3332 0 0 0 0 6 100 2.3 29 4.0 33 5.7 38 1.8 18 2.7 30Male 3 --- --- --- --- --- --- --- --- --- --- --- --- --- --- --- --- ---Female 3 --- --- --- --- --- --- --- --- --- --- --- --- --- --- --- --- ---No Information Provided 0 --- --- --- --- --- --- --- --- --- --- --- --- --- --- --- --- ---Hispanic/Latino 1 --- --- --- --- --- --- --- --- --- --- --- --- --- --- --- --- ---American Indian or Alaska Native 0 --- --- --- --- --- --- --- --- --- --- --- --- --- --- --- --- ---Asian 0 --- --- --- --- --- --- --- --- --- --- --- --- --- --- --- --- ---Black or African American 0 --- --- --- --- --- --- --- --- --- --- --- --- --- --- --- --- ---Native Hawaiian or Other Pacific Islander 0 --- --- --- --- --- --- --- --- --- --- --- --- --- --- --- --- ---White 5 3381 0 0 0 0 5 100 2.8 35 3.6 30 6.2 41 2.0 20 3.0 33Two or More Races 0 --- --- --- --- --- --- --- --- --- --- --- --- --- --- --- --- ---No Information Provided 0 --- --- --- --- --- --- --- --- --- --- --- --- --- --- --- --- ---Economically 3 --- --- --- --- --- --- --- --- --- --- --- --- --- --- --- --- ---Disadvantaged 3 --- --- --- --- --- --- --- --- --- --- --- --- --- --- --- --- ---
0 --- --- --- --- --- --- --- --- --- --- --- --- --- --- --- --- ---Title I, Part A 1 --- --- --- --- --- --- --- --- --- --- --- --- --- --- --- --- ---
5 3381 0 0 0 0 5 100 2.8 35 3.6 30 6.2 41 2.0 20 3.0 330 --- --- --- --- --- --- --- --- --- --- --- --- --- --- --- --- ---
Migrant 0 --- --- --- --- --- --- --- --- --- --- --- --- --- --- --- --- ---6 3332 0 0 0 0 6 100 2.3 29 4.0 33 5.7 38 1.8 18 2.7 300 --- --- --- --- --- --- --- --- --- --- --- --- --- --- --- --- ---
Limited English 0 --- --- --- --- --- --- --- --- --- --- --- --- --- --- --- --- ---Proficient 0 --- --- --- --- --- --- --- --- --- --- --- --- --- --- --- --- ---
0 --- --- --- --- --- --- --- --- --- --- --- --- --- --- --- --- ---6 3332 0 0 0 0 6 100 2.3 29 4.0 33 5.7 38 1.8 18 2.7 300 --- --- --- --- --- --- --- --- --- --- --- --- --- --- --- --- ---
Bilingual 0 --- --- --- --- --- --- --- --- --- --- --- --- --- --- --- --- ---6 3332 0 0 0 0 6 100 2.3 29 4.0 33 5.7 38 1.8 18 2.7 300 --- --- --- --- --- --- --- --- --- --- --- --- --- --- --- --- ---
ESL 0 --- --- --- --- --- --- --- --- --- --- --- --- --- --- --- --- ---6 3332 0 0 0 0 6 100 2.3 29 4.0 33 5.7 38 1.8 18 2.7 300 --- --- --- --- --- --- --- --- --- --- --- --- --- --- --- --- ---
Special Education 1 --- --- --- --- --- --- --- --- --- --- --- --- --- --- --- --- ---5 3310 0 0 0 0 5 100 2.8 35 3.8 32 5.4 36 1.6 16 2.4 270 --- --- --- --- --- --- --- --- --- --- --- --- --- --- --- --- ---
Gifted/Talented 0 --- --- --- --- --- --- --- --- --- --- --- --- --- --- --- --- ---6 3332 0 0 0 0 6 100 2.3 29 4.0 33 5.7 38 1.8 18 2.7 300 --- --- --- --- --- --- --- --- --- --- --- --- --- --- --- --- ---
At-Risk 6 3332 0 0 0 0 6 100 2.3 29 4.0 33 5.7 38 1.8 18 2.7 300 --- --- --- --- --- --- --- --- --- --- --- --- --- --- --- --- ---0 --- --- --- --- --- --- --- --- --- --- --- --- --- --- --- --- ---
Career/Technical 4 --- --- --- --- --- --- --- --- --- --- --- --- --- --- --- --- ---Education 2 --- --- --- --- --- --- --- --- --- --- --- --- --- --- --- --- ---
0 --- --- --- --- --- --- --- --- --- --- --- --- --- --- --- --- ---
YesNo
No Information ProvidedParticipants
NonparticipantsNo Information Provided
YesNo
No Information ProvidedCurrent LEP
Non-LEP (Monitored 1st Year)Non-LEP (Monitored 2nd Year)
Other Non-LEPNo Information Provided
ParticipantsNonparticipants
No Information ProvidedParticipants
NonparticipantsNo Information Provided
YesNo
No Information ProvidedParticipants
NonparticipantsNo Information Provided
YesNo
No Information ProvidedParticipants
NonparticipantsNo Information Provided
21016-00001577-129903003
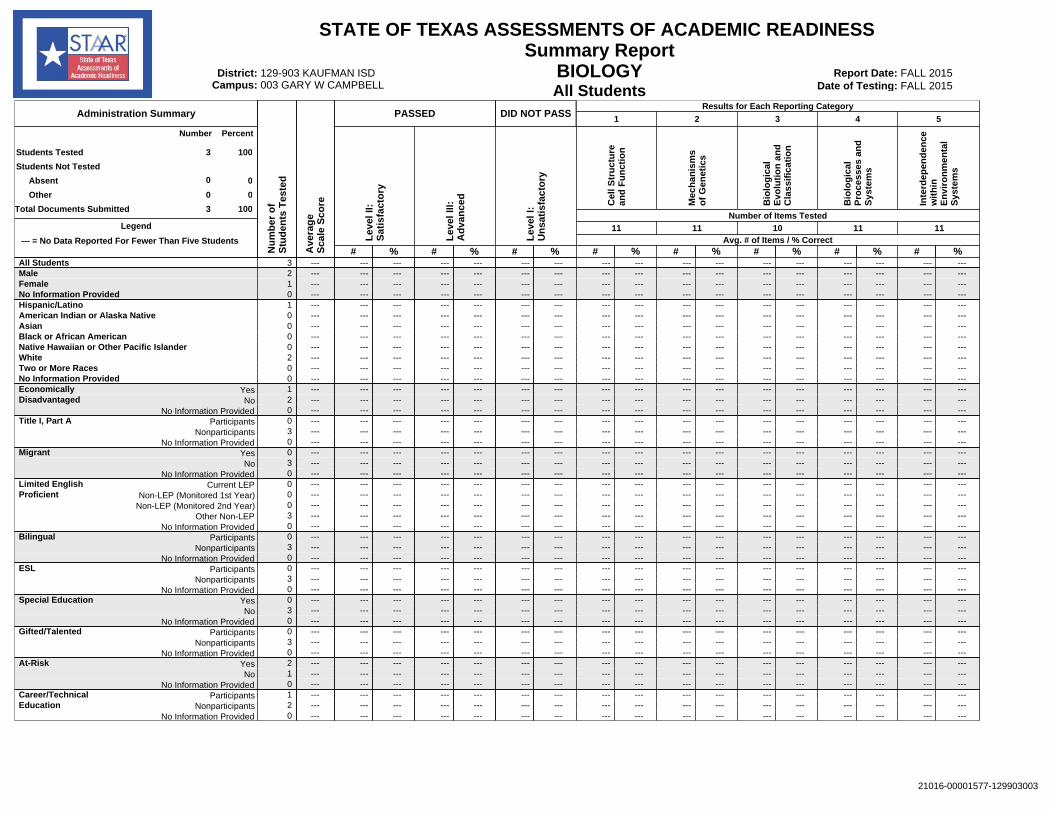
All Students
STATE OF TEXAS ASSESSMENTS OF ACADEMIC READINESS Summary Report
BIOLOGYDate of Testing:
District: FALL 2015Campus:
129-903 KAUFMAN ISD Report Date: 003 GARY W CAMPBELL
FALL 2015
Legend
--- = No Data Reported For Fewer Than Five Students
Administration Summary
Number Percent
Students Tested
Students Not Tested
Other
Total Documents Submitted
Absent
3 100
00
00
3 100
Nu
mb
er o
fS
tud
ents
Tes
ted
Ave
rag
eS
cale
Sco
re
Lev
el II
:S
atis
fact
ory
# %
Lev
el II
I:
Ad
van
ced
# %
PASSED
Lev
el I:
U
nsa
tisf
acto
ry
# %
DID NOT PASS
Cel
l Str
uct
ure
and
Fu
nct
ion
Number of Items Tested
Mec
han
ism
so
f G
enet
ics
Bio
log
ical
Evo
luti
on
an
dC
lass
ific
atio
n
Bio
log
ical
Pro
cess
es a
nd
Sys
tem
s
Inte
rdep
end
ence
wit
hin
En
viro
nm
enta
lS
yste
ms
# % %# %# %# %#
1 2 3 4 5Results for Each Reporting Category
Avg. # of Items / % Correct11 11 10 11 11
All Students 3 --- --- --- --- --- --- --- --- --- --- --- --- --- --- --- --- ---Male 2 --- --- --- --- --- --- --- --- --- --- --- --- --- --- --- --- ---Female 1 --- --- --- --- --- --- --- --- --- --- --- --- --- --- --- --- ---No Information Provided 0 --- --- --- --- --- --- --- --- --- --- --- --- --- --- --- --- ---Hispanic/Latino 1 --- --- --- --- --- --- --- --- --- --- --- --- --- --- --- --- ---American Indian or Alaska Native 0 --- --- --- --- --- --- --- --- --- --- --- --- --- --- --- --- ---Asian 0 --- --- --- --- --- --- --- --- --- --- --- --- --- --- --- --- ---Black or African American 0 --- --- --- --- --- --- --- --- --- --- --- --- --- --- --- --- ---Native Hawaiian or Other Pacific Islander 0 --- --- --- --- --- --- --- --- --- --- --- --- --- --- --- --- ---White 2 --- --- --- --- --- --- --- --- --- --- --- --- --- --- --- --- ---Two or More Races 0 --- --- --- --- --- --- --- --- --- --- --- --- --- --- --- --- ---No Information Provided 0 --- --- --- --- --- --- --- --- --- --- --- --- --- --- --- --- ---Economically 1 --- --- --- --- --- --- --- --- --- --- --- --- --- --- --- --- ---Disadvantaged 2 --- --- --- --- --- --- --- --- --- --- --- --- --- --- --- --- ---
0 --- --- --- --- --- --- --- --- --- --- --- --- --- --- --- --- ---Title I, Part A 0 --- --- --- --- --- --- --- --- --- --- --- --- --- --- --- --- ---
3 --- --- --- --- --- --- --- --- --- --- --- --- --- --- --- --- ---0 --- --- --- --- --- --- --- --- --- --- --- --- --- --- --- --- ---
Migrant 0 --- --- --- --- --- --- --- --- --- --- --- --- --- --- --- --- ---3 --- --- --- --- --- --- --- --- --- --- --- --- --- --- --- --- ---0 --- --- --- --- --- --- --- --- --- --- --- --- --- --- --- --- ---
Limited English 0 --- --- --- --- --- --- --- --- --- --- --- --- --- --- --- --- ---Proficient 0 --- --- --- --- --- --- --- --- --- --- --- --- --- --- --- --- ---
0 --- --- --- --- --- --- --- --- --- --- --- --- --- --- --- --- ---3 --- --- --- --- --- --- --- --- --- --- --- --- --- --- --- --- ---0 --- --- --- --- --- --- --- --- --- --- --- --- --- --- --- --- ---
Bilingual 0 --- --- --- --- --- --- --- --- --- --- --- --- --- --- --- --- ---3 --- --- --- --- --- --- --- --- --- --- --- --- --- --- --- --- ---0 --- --- --- --- --- --- --- --- --- --- --- --- --- --- --- --- ---
ESL 0 --- --- --- --- --- --- --- --- --- --- --- --- --- --- --- --- ---3 --- --- --- --- --- --- --- --- --- --- --- --- --- --- --- --- ---0 --- --- --- --- --- --- --- --- --- --- --- --- --- --- --- --- ---
Special Education 0 --- --- --- --- --- --- --- --- --- --- --- --- --- --- --- --- ---3 --- --- --- --- --- --- --- --- --- --- --- --- --- --- --- --- ---0 --- --- --- --- --- --- --- --- --- --- --- --- --- --- --- --- ---
Gifted/Talented 0 --- --- --- --- --- --- --- --- --- --- --- --- --- --- --- --- ---3 --- --- --- --- --- --- --- --- --- --- --- --- --- --- --- --- ---0 --- --- --- --- --- --- --- --- --- --- --- --- --- --- --- --- ---
At-Risk 2 --- --- --- --- --- --- --- --- --- --- --- --- --- --- --- --- ---1 --- --- --- --- --- --- --- --- --- --- --- --- --- --- --- --- ---0 --- --- --- --- --- --- --- --- --- --- --- --- --- --- --- --- ---
Career/Technical 1 --- --- --- --- --- --- --- --- --- --- --- --- --- --- --- --- ---Education 2 --- --- --- --- --- --- --- --- --- --- --- --- --- --- --- --- ---
0 --- --- --- --- --- --- --- --- --- --- --- --- --- --- --- --- ---
YesNo
No Information ProvidedParticipants
NonparticipantsNo Information Provided
YesNo
No Information ProvidedCurrent LEP
Non-LEP (Monitored 1st Year)Non-LEP (Monitored 2nd Year)
Other Non-LEPNo Information Provided
ParticipantsNonparticipants
No Information ProvidedParticipants
NonparticipantsNo Information Provided
YesNo
No Information ProvidedParticipants
NonparticipantsNo Information Provided
YesNo
No Information ProvidedParticipants
NonparticipantsNo Information Provided
21016-00001577-129903003
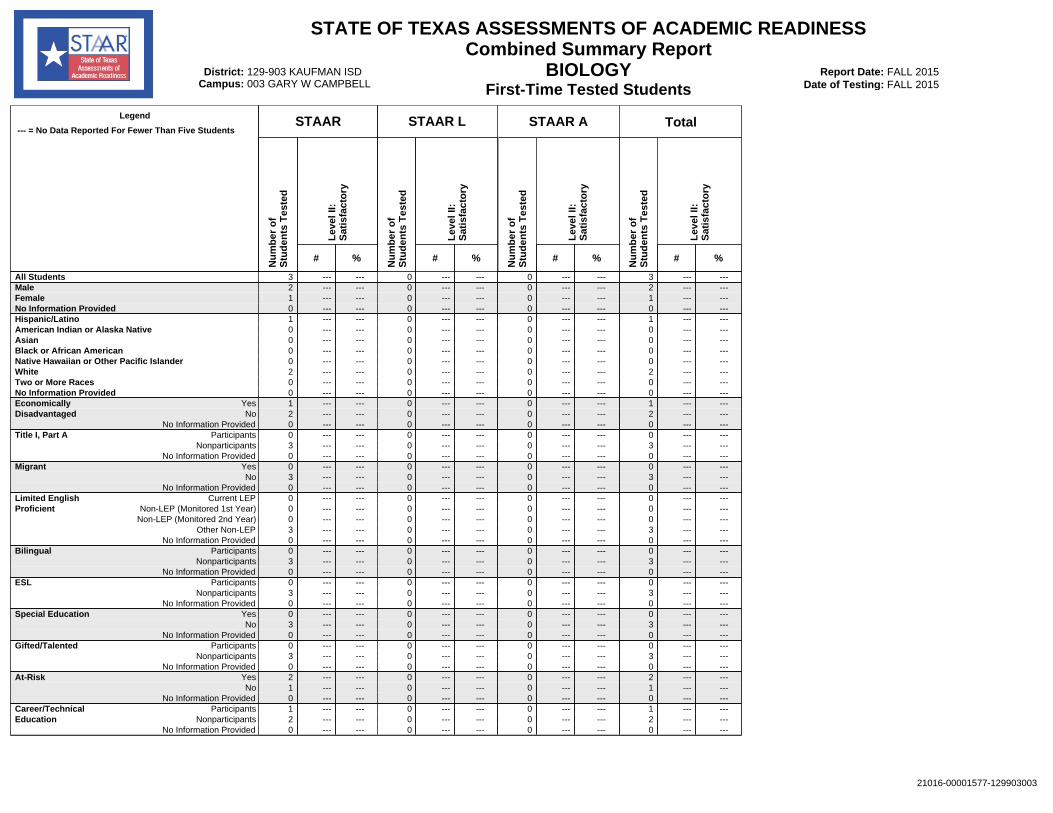
First-Time Tested Students
STATE OF TEXAS ASSESSMENTS OF ACADEMIC READINESS Summary Report
BIOLOGYDate of Testing:
District: FALL 2015Campus:
129-903 KAUFMAN ISD Report Date: 003 GARY W CAMPBELL
FALL 2015
Legend
--- = No Data Reported For Fewer Than Five Students
Administration Summary
Number Percent
Students Tested
Students Not Tested
Other
Total Documents Submitted
Absent
3 100
00
00
3 100
Nu
mb
er o
fS
tud
ents
Tes
ted
Ave
rag
eS
cale
Sco
re
Lev
el II
:S
atis
fact
ory
# %
Lev
el II
I:
Ad
van
ced
# %
PASSED
Lev
el I:
U
nsa
tisf
acto
ry
# %
DID NOT PASS
Cel
l Str
uct
ure
and
Fu
nct
ion
Number of Items Tested
Mec
han
ism
so
f G
enet
ics
Bio
log
ical
Evo
luti
on
an
dC
lass
ific
atio
n
Bio
log
ical
Pro
cess
es a
nd
Sys
tem
s
Inte
rdep
end
ence
wit
hin
En
viro
nm
enta
lS
yste
ms
# % %# %# %# %#
1 2 3 4 5Results for Each Reporting Category
Avg. # of Items / % Correct11 11 10 11 11
All Students 3 --- --- --- --- --- --- --- --- --- --- --- --- --- --- --- --- ---Male 2 --- --- --- --- --- --- --- --- --- --- --- --- --- --- --- --- ---Female 1 --- --- --- --- --- --- --- --- --- --- --- --- --- --- --- --- ---No Information Provided 0 --- --- --- --- --- --- --- --- --- --- --- --- --- --- --- --- ---Hispanic/Latino 1 --- --- --- --- --- --- --- --- --- --- --- --- --- --- --- --- ---American Indian or Alaska Native 0 --- --- --- --- --- --- --- --- --- --- --- --- --- --- --- --- ---Asian 0 --- --- --- --- --- --- --- --- --- --- --- --- --- --- --- --- ---Black or African American 0 --- --- --- --- --- --- --- --- --- --- --- --- --- --- --- --- ---Native Hawaiian or Other Pacific Islander 0 --- --- --- --- --- --- --- --- --- --- --- --- --- --- --- --- ---White 2 --- --- --- --- --- --- --- --- --- --- --- --- --- --- --- --- ---Two or More Races 0 --- --- --- --- --- --- --- --- --- --- --- --- --- --- --- --- ---No Information Provided 0 --- --- --- --- --- --- --- --- --- --- --- --- --- --- --- --- ---Economically 1 --- --- --- --- --- --- --- --- --- --- --- --- --- --- --- --- ---Disadvantaged 2 --- --- --- --- --- --- --- --- --- --- --- --- --- --- --- --- ---
0 --- --- --- --- --- --- --- --- --- --- --- --- --- --- --- --- ---Title I, Part A 0 --- --- --- --- --- --- --- --- --- --- --- --- --- --- --- --- ---
3 --- --- --- --- --- --- --- --- --- --- --- --- --- --- --- --- ---0 --- --- --- --- --- --- --- --- --- --- --- --- --- --- --- --- ---
Migrant 0 --- --- --- --- --- --- --- --- --- --- --- --- --- --- --- --- ---3 --- --- --- --- --- --- --- --- --- --- --- --- --- --- --- --- ---0 --- --- --- --- --- --- --- --- --- --- --- --- --- --- --- --- ---
Limited English 0 --- --- --- --- --- --- --- --- --- --- --- --- --- --- --- --- ---Proficient 0 --- --- --- --- --- --- --- --- --- --- --- --- --- --- --- --- ---
0 --- --- --- --- --- --- --- --- --- --- --- --- --- --- --- --- ---3 --- --- --- --- --- --- --- --- --- --- --- --- --- --- --- --- ---0 --- --- --- --- --- --- --- --- --- --- --- --- --- --- --- --- ---
Bilingual 0 --- --- --- --- --- --- --- --- --- --- --- --- --- --- --- --- ---3 --- --- --- --- --- --- --- --- --- --- --- --- --- --- --- --- ---0 --- --- --- --- --- --- --- --- --- --- --- --- --- --- --- --- ---
ESL 0 --- --- --- --- --- --- --- --- --- --- --- --- --- --- --- --- ---3 --- --- --- --- --- --- --- --- --- --- --- --- --- --- --- --- ---0 --- --- --- --- --- --- --- --- --- --- --- --- --- --- --- --- ---
Special Education 0 --- --- --- --- --- --- --- --- --- --- --- --- --- --- --- --- ---3 --- --- --- --- --- --- --- --- --- --- --- --- --- --- --- --- ---0 --- --- --- --- --- --- --- --- --- --- --- --- --- --- --- --- ---
Gifted/Talented 0 --- --- --- --- --- --- --- --- --- --- --- --- --- --- --- --- ---3 --- --- --- --- --- --- --- --- --- --- --- --- --- --- --- --- ---0 --- --- --- --- --- --- --- --- --- --- --- --- --- --- --- --- ---
At-Risk 2 --- --- --- --- --- --- --- --- --- --- --- --- --- --- --- --- ---1 --- --- --- --- --- --- --- --- --- --- --- --- --- --- --- --- ---0 --- --- --- --- --- --- --- --- --- --- --- --- --- --- --- --- ---
Career/Technical 1 --- --- --- --- --- --- --- --- --- --- --- --- --- --- --- --- ---Education 2 --- --- --- --- --- --- --- --- --- --- --- --- --- --- --- --- ---
0 --- --- --- --- --- --- --- --- --- --- --- --- --- --- --- --- ---
YesNo
No Information ProvidedParticipants
NonparticipantsNo Information Provided
YesNo
No Information ProvidedCurrent LEP
Non-LEP (Monitored 1st Year)Non-LEP (Monitored 2nd Year)
Other Non-LEPNo Information Provided
ParticipantsNonparticipants
No Information ProvidedParticipants
NonparticipantsNo Information Provided
YesNo
No Information ProvidedParticipants
NonparticipantsNo Information Provided
YesNo
No Information ProvidedParticipants
NonparticipantsNo Information Provided
21016-00001577-129903003
21016-00001577-129903003
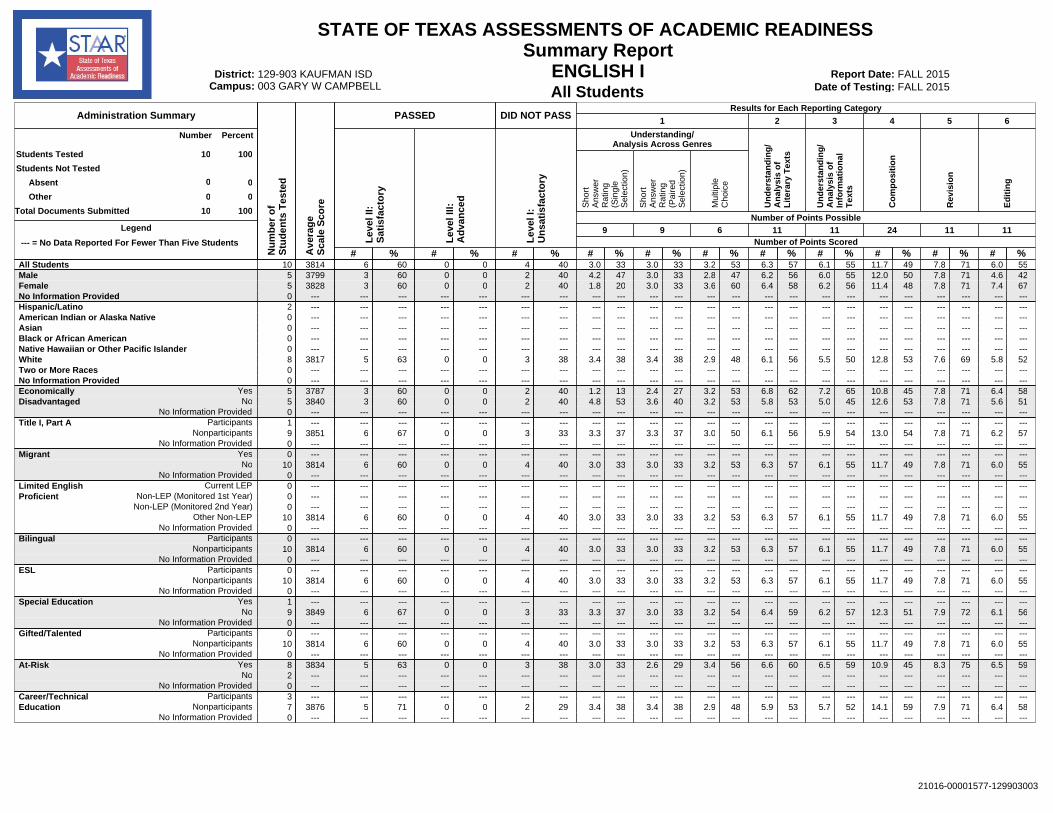
All Students
STATE OF TEXAS ASSESSMENTS OF ACADEMIC READINESS Summary Report
ENGLISH IDate of Testing:
District: FALL 2015Campus:
129-903 KAUFMAN ISD Report Date: 003 GARY W CAMPBELL
FALL 2015
Legend
--- = No Data Reported For Fewer Than Five Students
Administration Summary
Number Percent
Students Tested
Students Not Tested
Other
Total Documents Submitted
Absent
10 100
00
00
10 100
Nu
mb
er o
fS
tud
ents
Tes
ted
Ave
rag
eS
cale
Sco
re
Lev
el II
:S
atis
fact
ory
# %
Lev
el II
I:
Ad
van
ced
# %
PASSED
Lev
el I:
U
nsa
tisf
acto
ry
# %
DID NOT PASS
Number of Points Possible
# % %# %# %# %#
1 2Results for Each Reporting Category
Number of Points Scored9 9 6 11 11
3 4 5 6
# % # % # %
24 11 11
Un
der
stan
din
g/
An
alys
is o
fL
iter
ary
Tex
ts
Un
der
stan
din
g/
An
alys
is o
fIn
form
atio
nal
Tex
ts
Co
mp
osi
tio
n
Rev
isio
n
Ed
itin
g
Understanding/Analysis Across Genres
Sho
rtA
nsw
erR
atin
g(S
ingl
eS
elec
tion)
Sho
rtA
nsw
erR
atin
g(P
aire
dS
elec
tion)
Mul
tiple
Cho
ice
All Students 10 3814 6 60 0 0 4 40 3.0 33 3.0 33 3.2 53 6.3 57 6.1 55 11.7 49 7.8 71 6.0 55Male 5 3799 3 60 0 0 2 40 4.2 47 3.0 33 2.8 47 6.2 56 6.0 55 12.0 50 7.8 71 4.6 42Female 5 3828 3 60 0 0 2 40 1.8 20 3.0 33 3.6 60 6.4 58 6.2 56 11.4 48 7.8 71 7.4 67No Information Provided 0 --- --- --- --- --- --- --- --- --- --- --- --- --- --- --- --- --- --- --- --- --- --- ---Hispanic/Latino 2 --- --- --- --- --- --- --- --- --- --- --- --- --- --- --- --- --- --- --- --- --- --- ---American Indian or Alaska Native 0 --- --- --- --- --- --- --- --- --- --- --- --- --- --- --- --- --- --- --- --- --- --- ---Asian 0 --- --- --- --- --- --- --- --- --- --- --- --- --- --- --- --- --- --- --- --- --- --- ---Black or African American 0 --- --- --- --- --- --- --- --- --- --- --- --- --- --- --- --- --- --- --- --- --- --- ---Native Hawaiian or Other Pacific Islander 0 --- --- --- --- --- --- --- --- --- --- --- --- --- --- --- --- --- --- --- --- --- --- ---White 8 3817 5 63 0 0 3 38 3.4 38 3.4 38 2.9 48 6.1 56 5.5 50 12.8 53 7.6 69 5.8 52Two or More Races 0 --- --- --- --- --- --- --- --- --- --- --- --- --- --- --- --- --- --- --- --- --- --- ---No Information Provided 0 --- --- --- --- --- --- --- --- --- --- --- --- --- --- --- --- --- --- --- --- --- --- ---Economically 5 3787 3 60 0 0 2 40 1.2 13 2.4 27 3.2 53 6.8 62 7.2 65 10.8 45 7.8 71 6.4 58Disadvantaged 5 3840 3 60 0 0 2 40 4.8 53 3.6 40 3.2 53 5.8 53 5.0 45 12.6 53 7.8 71 5.6 51
0 --- --- --- --- --- --- --- --- --- --- --- --- --- --- --- --- --- --- --- --- --- --- ---Title I, Part A 1 --- --- --- --- --- --- --- --- --- --- --- --- --- --- --- --- --- --- --- --- --- --- ---
9 3851 6 67 0 0 3 33 3.3 37 3.3 37 3.0 50 6.1 56 5.9 54 13.0 54 7.8 71 6.2 570 --- --- --- --- --- --- --- --- --- --- --- --- --- --- --- --- --- --- --- --- --- --- ---
Migrant 0 --- --- --- --- --- --- --- --- --- --- --- --- --- --- --- --- --- --- --- --- --- --- ---10 3814 6 60 0 0 4 40 3.0 33 3.0 33 3.2 53 6.3 57 6.1 55 11.7 49 7.8 71 6.0 550 --- --- --- --- --- --- --- --- --- --- --- --- --- --- --- --- --- --- --- --- --- --- ---
Limited English 0 --- --- --- --- --- --- --- --- --- --- --- --- --- --- --- --- --- --- --- --- --- --- ---Proficient 0 --- --- --- --- --- --- --- --- --- --- --- --- --- --- --- --- --- --- --- --- --- --- ---
0 --- --- --- --- --- --- --- --- --- --- --- --- --- --- --- --- --- --- --- --- --- --- ---10 3814 6 60 0 0 4 40 3.0 33 3.0 33 3.2 53 6.3 57 6.1 55 11.7 49 7.8 71 6.0 550 --- --- --- --- --- --- --- --- --- --- --- --- --- --- --- --- --- --- --- --- --- --- ---
Bilingual 0 --- --- --- --- --- --- --- --- --- --- --- --- --- --- --- --- --- --- --- --- --- --- ---10 3814 6 60 0 0 4 40 3.0 33 3.0 33 3.2 53 6.3 57 6.1 55 11.7 49 7.8 71 6.0 550 --- --- --- --- --- --- --- --- --- --- --- --- --- --- --- --- --- --- --- --- --- --- ---
ESL 0 --- --- --- --- --- --- --- --- --- --- --- --- --- --- --- --- --- --- --- --- --- --- ---10 3814 6 60 0 0 4 40 3.0 33 3.0 33 3.2 53 6.3 57 6.1 55 11.7 49 7.8 71 6.0 550 --- --- --- --- --- --- --- --- --- --- --- --- --- --- --- --- --- --- --- --- --- --- ---
Special Education 1 --- --- --- --- --- --- --- --- --- --- --- --- --- --- --- --- --- --- --- --- --- --- ---9 3849 6 67 0 0 3 33 3.3 37 3.0 33 3.2 54 6.4 59 6.2 57 12.3 51 7.9 72 6.1 560 --- --- --- --- --- --- --- --- --- --- --- --- --- --- --- --- --- --- --- --- --- --- ---
Gifted/Talented 0 --- --- --- --- --- --- --- --- --- --- --- --- --- --- --- --- --- --- --- --- --- --- ---10 3814 6 60 0 0 4 40 3.0 33 3.0 33 3.2 53 6.3 57 6.1 55 11.7 49 7.8 71 6.0 550 --- --- --- --- --- --- --- --- --- --- --- --- --- --- --- --- --- --- --- --- --- --- ---
At-Risk 8 3834 5 63 0 0 3 38 3.0 33 2.6 29 3.4 56 6.6 60 6.5 59 10.9 45 8.3 75 6.5 592 --- --- --- --- --- --- --- --- --- --- --- --- --- --- --- --- --- --- --- --- --- --- ---0 --- --- --- --- --- --- --- --- --- --- --- --- --- --- --- --- --- --- --- --- --- --- ---
Career/Technical 3 --- --- --- --- --- --- --- --- --- --- --- --- --- --- --- --- --- --- --- --- --- --- ---Education 7 3876 5 71 0 0 2 29 3.4 38 3.4 38 2.9 48 5.9 53 5.7 52 14.1 59 7.9 71 6.4 58
0 --- --- --- --- --- --- --- --- --- --- --- --- --- --- --- --- --- --- --- --- --- --- ---
YesNo
No Information ProvidedParticipants
NonparticipantsNo Information Provided
YesNo
No Information ProvidedCurrent LEP
Non-LEP (Monitored 1st Year)Non-LEP (Monitored 2nd Year)
Other Non-LEPNo Information Provided
ParticipantsNonparticipants
No Information ProvidedParticipants
NonparticipantsNo Information Provided
YesNo
No Information ProvidedParticipants
NonparticipantsNo Information Provided
YesNo
No Information ProvidedParticipants
NonparticipantsNo Information Provided
Written Composition Rating SummaryShort Answer Rating Summary
Single Selection Paired Selections Expository Composition
Each Composition has been scored independently by two readers. The written composition rating of 0-8 represents the summation of these scores.
--- = No Data Reported For Fewer Than Five Students
Rating # %
0 4 40
1 2 20
2 4 40
3 0 0
Total 10 100
Rating # %
0 3 30
1 4 40
2 3 30
3 0 0
Total 10 100
Rating # %
0 1 10
2 1 10
3 1 10
4 4 40
5 1 10
6 1 10
7 1 10
8 0 0
Total 10 100
21016-00001577-129903003
PE
RC
EN
T
PE
RC
EN
T
PE
RC
EN
T
All Students
STATE OF TEXAS ASSESSMENTS OF ACADEMIC READINESS Constructed Responses Summary Report
ENGLISH IDate of Testing:
District: FALL 2015Campus:
129-903 KAUFMAN ISD Report Date: 003 GARY W CAMPBELL
FALL 2015
21016-00001577-129903003
First-Time Tested Students
STATE OF TEXAS ASSESSMENTS OF ACADEMIC READINESS Summary Report
ENGLISH IDate of Testing:
District: FALL 2015Campus:
129-903 KAUFMAN ISD Report Date: 003 GARY W CAMPBELL
FALL 2015
Legend
--- = No Data Reported For Fewer Than Five Students
Administration Summary
Number Percent
Students Tested
Students Not Tested
Other
Total Documents Submitted
Absent
1 100
00
00
1 100
Nu
mb
er o
fS
tud
ents
Tes
ted
Ave
rag
eS
cale
Sco
re
Lev
el II
:S
atis
fact
ory
# %
Lev
el II
I:
Ad
van
ced
# %
PASSED
Lev
el I:
U
nsa
tisf
acto
ry
# %
DID NOT PASS
Number of Points Possible
# % %# %# %# %#
1 2Results for Each Reporting Category
Number of Points Scored9 9 6 11 11
3 4 5 6
# % # % # %
24 11 11
Un
der
stan
din
g/
An
alys
is o
fL
iter
ary
Tex
ts
Un
der
stan
din
g/
An
alys
is o
fIn
form
atio
nal
Tex
ts
Co
mp
osi
tio
n
Rev
isio
n
Ed
itin
g
Understanding/Analysis Across Genres
Sho
rtA
nsw
erR
atin
g(S
ingl
eS
elec
tion)
Sho
rtA
nsw
erR
atin
g(P
aire
dS
elec
tion)
Mul
tiple
Cho
ice
All Students 1 --- --- --- --- --- --- --- --- --- --- --- --- --- --- --- --- --- --- --- --- --- --- ---Male 0 --- --- --- --- --- --- --- --- --- --- --- --- --- --- --- --- --- --- --- --- --- --- ---Female 1 --- --- --- --- --- --- --- --- --- --- --- --- --- --- --- --- --- --- --- --- --- --- ---No Information Provided 0 --- --- --- --- --- --- --- --- --- --- --- --- --- --- --- --- --- --- --- --- --- --- ---Hispanic/Latino 0 --- --- --- --- --- --- --- --- --- --- --- --- --- --- --- --- --- --- --- --- --- --- ---American Indian or Alaska Native 0 --- --- --- --- --- --- --- --- --- --- --- --- --- --- --- --- --- --- --- --- --- --- ---Asian 0 --- --- --- --- --- --- --- --- --- --- --- --- --- --- --- --- --- --- --- --- --- --- ---Black or African American 0 --- --- --- --- --- --- --- --- --- --- --- --- --- --- --- --- --- --- --- --- --- --- ---Native Hawaiian or Other Pacific Islander 0 --- --- --- --- --- --- --- --- --- --- --- --- --- --- --- --- --- --- --- --- --- --- ---White 1 --- --- --- --- --- --- --- --- --- --- --- --- --- --- --- --- --- --- --- --- --- --- ---Two or More Races 0 --- --- --- --- --- --- --- --- --- --- --- --- --- --- --- --- --- --- --- --- --- --- ---No Information Provided 0 --- --- --- --- --- --- --- --- --- --- --- --- --- --- --- --- --- --- --- --- --- --- ---Economically 0 --- --- --- --- --- --- --- --- --- --- --- --- --- --- --- --- --- --- --- --- --- --- ---Disadvantaged 1 --- --- --- --- --- --- --- --- --- --- --- --- --- --- --- --- --- --- --- --- --- --- ---
0 --- --- --- --- --- --- --- --- --- --- --- --- --- --- --- --- --- --- --- --- --- --- ---Title I, Part A 0 --- --- --- --- --- --- --- --- --- --- --- --- --- --- --- --- --- --- --- --- --- --- ---
1 --- --- --- --- --- --- --- --- --- --- --- --- --- --- --- --- --- --- --- --- --- --- ---0 --- --- --- --- --- --- --- --- --- --- --- --- --- --- --- --- --- --- --- --- --- --- ---
Migrant 0 --- --- --- --- --- --- --- --- --- --- --- --- --- --- --- --- --- --- --- --- --- --- ---1 --- --- --- --- --- --- --- --- --- --- --- --- --- --- --- --- --- --- --- --- --- --- ---0 --- --- --- --- --- --- --- --- --- --- --- --- --- --- --- --- --- --- --- --- --- --- ---
Limited English 0 --- --- --- --- --- --- --- --- --- --- --- --- --- --- --- --- --- --- --- --- --- --- ---Proficient 0 --- --- --- --- --- --- --- --- --- --- --- --- --- --- --- --- --- --- --- --- --- --- ---
0 --- --- --- --- --- --- --- --- --- --- --- --- --- --- --- --- --- --- --- --- --- --- ---1 --- --- --- --- --- --- --- --- --- --- --- --- --- --- --- --- --- --- --- --- --- --- ---0 --- --- --- --- --- --- --- --- --- --- --- --- --- --- --- --- --- --- --- --- --- --- ---
Bilingual 0 --- --- --- --- --- --- --- --- --- --- --- --- --- --- --- --- --- --- --- --- --- --- ---1 --- --- --- --- --- --- --- --- --- --- --- --- --- --- --- --- --- --- --- --- --- --- ---0 --- --- --- --- --- --- --- --- --- --- --- --- --- --- --- --- --- --- --- --- --- --- ---
ESL 0 --- --- --- --- --- --- --- --- --- --- --- --- --- --- --- --- --- --- --- --- --- --- ---1 --- --- --- --- --- --- --- --- --- --- --- --- --- --- --- --- --- --- --- --- --- --- ---0 --- --- --- --- --- --- --- --- --- --- --- --- --- --- --- --- --- --- --- --- --- --- ---
Special Education 0 --- --- --- --- --- --- --- --- --- --- --- --- --- --- --- --- --- --- --- --- --- --- ---1 --- --- --- --- --- --- --- --- --- --- --- --- --- --- --- --- --- --- --- --- --- --- ---0 --- --- --- --- --- --- --- --- --- --- --- --- --- --- --- --- --- --- --- --- --- --- ---
Gifted/Talented 0 --- --- --- --- --- --- --- --- --- --- --- --- --- --- --- --- --- --- --- --- --- --- ---1 --- --- --- --- --- --- --- --- --- --- --- --- --- --- --- --- --- --- --- --- --- --- ---0 --- --- --- --- --- --- --- --- --- --- --- --- --- --- --- --- --- --- --- --- --- --- ---
At-Risk 1 --- --- --- --- --- --- --- --- --- --- --- --- --- --- --- --- --- --- --- --- --- --- ---0 --- --- --- --- --- --- --- --- --- --- --- --- --- --- --- --- --- --- --- --- --- --- ---0 --- --- --- --- --- --- --- --- --- --- --- --- --- --- --- --- --- --- --- --- --- --- ---
Career/Technical 0 --- --- --- --- --- --- --- --- --- --- --- --- --- --- --- --- --- --- --- --- --- --- ---Education 1 --- --- --- --- --- --- --- --- --- --- --- --- --- --- --- --- --- --- --- --- --- --- ---
0 --- --- --- --- --- --- --- --- --- --- --- --- --- --- --- --- --- --- --- --- --- --- ---
YesNo
No Information ProvidedParticipants
NonparticipantsNo Information Provided
YesNo
No Information ProvidedCurrent LEP
Non-LEP (Monitored 1st Year)Non-LEP (Monitored 2nd Year)
Other Non-LEPNo Information Provided
ParticipantsNonparticipants
No Information ProvidedParticipants
NonparticipantsNo Information Provided
YesNo
No Information ProvidedParticipants
NonparticipantsNo Information Provided
YesNo
No Information ProvidedParticipants
NonparticipantsNo Information Provided
Written Composition Rating SummaryShort Answer Rating Summary
Single Selection Paired Selections Expository Composition
Each Composition has been scored independently by two readers. The written composition rating of 0-8 represents the summation of these scores.
--- = No Data Reported For Fewer Than Five Students
Rating # %
0 --- ---
1 --- ---
2 --- ---
3 --- ---
Total 1 100
Rating # %
0 --- ---
1 --- ---
2 --- ---
3 --- ---
Total 1 100
Rating # %
0 --- ---
2 --- ---
3 --- ---
4 --- ---
5 --- ---
6 --- ---
7 --- ---
8 --- ---
Total 1 100
21016-00001577-129903003
PE
RC
EN
T
PE
RC
EN
T
PE
RC
EN
T
First-Time Tested Students
STATE OF TEXAS ASSESSMENTS OF ACADEMIC READINESS Constructed Responses Summary Report
ENGLISH IDate of Testing:
District: FALL 2015Campus:
129-903 KAUFMAN ISD Report Date: 003 GARY W CAMPBELL
FALL 2015
21016-00001577-129903003
Retested Students
STATE OF TEXAS ASSESSMENTS OF ACADEMIC READINESS Summary Report
ENGLISH IDate of Testing:
District: FALL 2015Campus:
129-903 KAUFMAN ISD Report Date: 003 GARY W CAMPBELL
FALL 2015
Legend
--- = No Data Reported For Fewer Than Five Students
Administration Summary
Number Percent
Students Tested
Students Not Tested
Other
Total Documents Submitted
Absent
9 100
00
00
9 100
Nu
mb
er o
fS
tud
ents
Tes
ted
Ave
rag
eS
cale
Sco
re
Lev
el II
:S
atis
fact
ory
# %
Lev
el II
I:
Ad
van
ced
# %
PASSED
Lev
el I:
U
nsa
tisf
acto
ry
# %
DID NOT PASS
Number of Points Possible
# % %# %# %# %#
1 2Results for Each Reporting Category
Number of Points Scored9 9 6 11 11
3 4 5 6
# % # % # %
24 11 11
Un
der
stan
din
g/
An
alys
is o
fL
iter
ary
Tex
ts
Un
der
stan
din
g/
An
alys
is o
fIn
form
atio
nal
Tex
ts
Co
mp
osi
tio
n
Rev
isio
n
Ed
itin
g
Understanding/Analysis Across Genres
Sho
rtA
nsw
erR
atin
g(S
ingl
eS
elec
tion)
Sho
rtA
nsw
erR
atin
g(P
aire
dS
elec
tion)
Mul
tiple
Cho
ice
All Students 9 3780 5 56 0 0 4 44 2.7 30 2.7 30 3.0 50 6.1 56 6.2 57 11.7 49 7.7 70 5.8 53Male 5 3799 3 60 0 0 2 40 4.2 47 3.0 33 2.8 47 6.2 56 6.0 55 12.0 50 7.8 71 4.6 42Female 4 --- --- --- --- --- --- --- --- --- --- --- --- --- --- --- --- --- --- --- --- --- --- ---No Information Provided 0 --- --- --- --- --- --- --- --- --- --- --- --- --- --- --- --- --- --- --- --- --- --- ---Hispanic/Latino 2 --- --- --- --- --- --- --- --- --- --- --- --- --- --- --- --- --- --- --- --- --- --- ---American Indian or Alaska Native 0 --- --- --- --- --- --- --- --- --- --- --- --- --- --- --- --- --- --- --- --- --- --- ---Asian 0 --- --- --- --- --- --- --- --- --- --- --- --- --- --- --- --- --- --- --- --- --- --- ---Black or African American 0 --- --- --- --- --- --- --- --- --- --- --- --- --- --- --- --- --- --- --- --- --- --- ---Native Hawaiian or Other Pacific Islander 0 --- --- --- --- --- --- --- --- --- --- --- --- --- --- --- --- --- --- --- --- --- --- ---White 7 3774 4 57 0 0 3 43 3.0 33 3.0 33 2.6 43 5.9 53 5.6 51 12.9 54 7.4 68 5.4 49Two or More Races 0 --- --- --- --- --- --- --- --- --- --- --- --- --- --- --- --- --- --- --- --- --- --- ---No Information Provided 0 --- --- --- --- --- --- --- --- --- --- --- --- --- --- --- --- --- --- --- --- --- --- ---Economically 5 3787 3 60 0 0 2 40 1.2 13 2.4 27 3.2 53 6.8 62 7.2 65 10.8 45 7.8 71 6.4 58Disadvantaged 4 --- --- --- --- --- --- --- --- --- --- --- --- --- --- --- --- --- --- --- --- --- --- ---
0 --- --- --- --- --- --- --- --- --- --- --- --- --- --- --- --- --- --- --- --- --- --- ---Title I, Part A 1 --- --- --- --- --- --- --- --- --- --- --- --- --- --- --- --- --- --- --- --- --- --- ---
8 3817 5 63 0 0 3 38 3.0 33 3.0 33 2.8 46 5.9 53 6.0 55 13.1 55 7.6 69 6.0 550 --- --- --- --- --- --- --- --- --- --- --- --- --- --- --- --- --- --- --- --- --- --- ---
Migrant 0 --- --- --- --- --- --- --- --- --- --- --- --- --- --- --- --- --- --- --- --- --- --- ---9 3780 5 56 0 0 4 44 2.7 30 2.7 30 3.0 50 6.1 56 6.2 57 11.7 49 7.7 70 5.8 530 --- --- --- --- --- --- --- --- --- --- --- --- --- --- --- --- --- --- --- --- --- --- ---
Limited English 0 --- --- --- --- --- --- --- --- --- --- --- --- --- --- --- --- --- --- --- --- --- --- ---Proficient 0 --- --- --- --- --- --- --- --- --- --- --- --- --- --- --- --- --- --- --- --- --- --- ---
0 --- --- --- --- --- --- --- --- --- --- --- --- --- --- --- --- --- --- --- --- --- --- ---9 3780 5 56 0 0 4 44 2.7 30 2.7 30 3.0 50 6.1 56 6.2 57 11.7 49 7.7 70 5.8 530 --- --- --- --- --- --- --- --- --- --- --- --- --- --- --- --- --- --- --- --- --- --- ---
Bilingual 0 --- --- --- --- --- --- --- --- --- --- --- --- --- --- --- --- --- --- --- --- --- --- ---9 3780 5 56 0 0 4 44 2.7 30 2.7 30 3.0 50 6.1 56 6.2 57 11.7 49 7.7 70 5.8 530 --- --- --- --- --- --- --- --- --- --- --- --- --- --- --- --- --- --- --- --- --- --- ---
ESL 0 --- --- --- --- --- --- --- --- --- --- --- --- --- --- --- --- --- --- --- --- --- --- ---9 3780 5 56 0 0 4 44 2.7 30 2.7 30 3.0 50 6.1 56 6.2 57 11.7 49 7.7 70 5.8 530 --- --- --- --- --- --- --- --- --- --- --- --- --- --- --- --- --- --- --- --- --- --- ---
Special Education 1 --- --- --- --- --- --- --- --- --- --- --- --- --- --- --- --- --- --- --- --- --- --- ---8 3815 5 63 0 0 3 38 3.0 33 2.6 29 3.0 50 6.3 57 6.4 58 12.4 52 7.8 70 5.9 530 --- --- --- --- --- --- --- --- --- --- --- --- --- --- --- --- --- --- --- --- --- --- ---
Gifted/Talented 0 --- --- --- --- --- --- --- --- --- --- --- --- --- --- --- --- --- --- --- --- --- --- ---9 3780 5 56 0 0 4 44 2.7 30 2.7 30 3.0 50 6.1 56 6.2 57 11.7 49 7.7 70 5.8 530 --- --- --- --- --- --- --- --- --- --- --- --- --- --- --- --- --- --- --- --- --- --- ---
At-Risk 7 3793 4 57 0 0 3 43 2.6 29 2.1 24 3.1 52 6.4 58 6.7 61 10.7 45 8.1 74 6.3 572 --- --- --- --- --- --- --- --- --- --- --- --- --- --- --- --- --- --- --- --- --- --- ---0 --- --- --- --- --- --- --- --- --- --- --- --- --- --- --- --- --- --- --- --- --- --- ---
Career/Technical 3 --- --- --- --- --- --- --- --- --- --- --- --- --- --- --- --- --- --- --- --- --- --- ---Education 6 3835 4 67 0 0 2 33 3.0 33 3.0 33 2.5 42 5.5 50 5.8 53 14.5 60 7.7 70 6.2 56
0 --- --- --- --- --- --- --- --- --- --- --- --- --- --- --- --- --- --- --- --- --- --- ---
YesNo
No Information ProvidedParticipants
NonparticipantsNo Information Provided
YesNo
No Information ProvidedCurrent LEP
Non-LEP (Monitored 1st Year)Non-LEP (Monitored 2nd Year)
Other Non-LEPNo Information Provided
ParticipantsNonparticipants
No Information ProvidedParticipants
NonparticipantsNo Information Provided
YesNo
No Information ProvidedParticipants
NonparticipantsNo Information Provided
YesNo
No Information ProvidedParticipants
NonparticipantsNo Information Provided
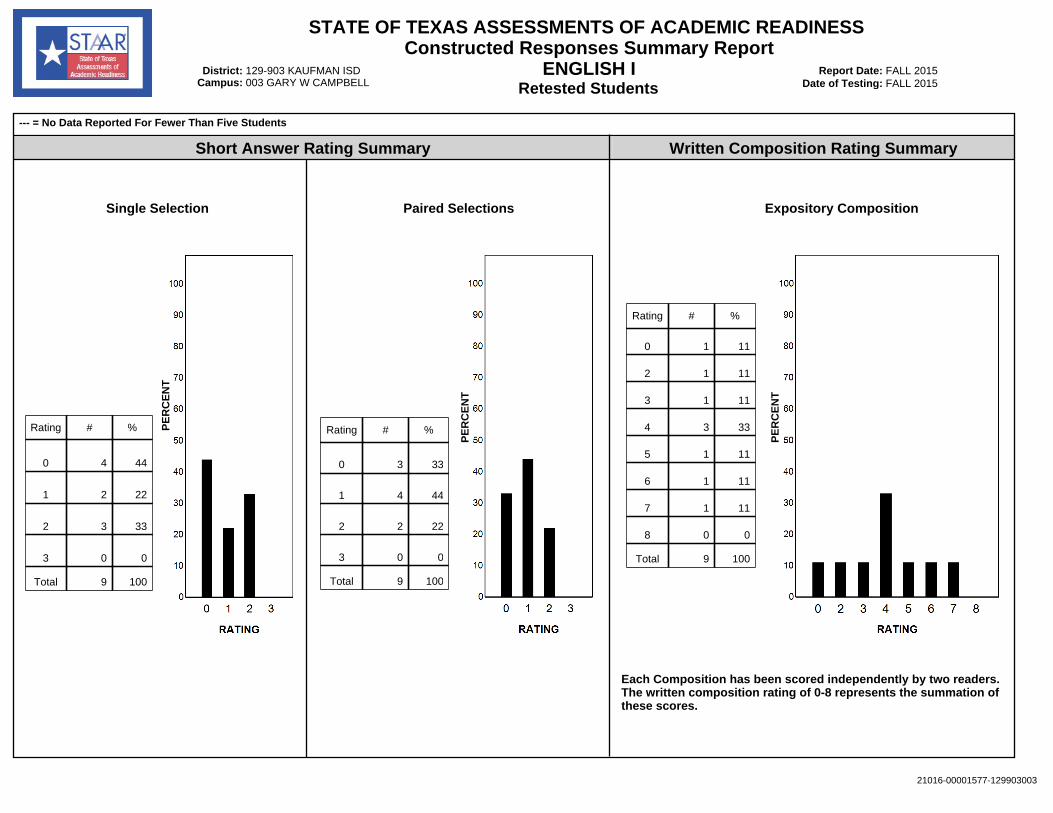
Written Composition Rating SummaryShort Answer Rating Summary
Single Selection Paired Selections Expository Composition
Each Composition has been scored independently by two readers. The written composition rating of 0-8 represents the summation of these scores.
--- = No Data Reported For Fewer Than Five Students
Rating # %
0 4 44
1 2 22
2 3 33
3 0 0
Total 9 100
Rating # %
0 3 33
1 4 44
2 2 22
3 0 0
Total 9 100
Rating # %
0 1 11
2 1 11
3 1 11
4 3 33
5 1 11
6 1 11
7 1 11
8 0 0
Total 9 100
21016-00001577-129903003
PE
RC
EN
T
PE
RC
EN
T
PE
RC
EN
T
Retested Students
STATE OF TEXAS ASSESSMENTS OF ACADEMIC READINESS Constructed Responses Summary Report
ENGLISH IDate of Testing:
District: FALL 2015Campus:
129-903 KAUFMAN ISD Report Date: 003 GARY W CAMPBELL
FALL 2015
21016-00001577-129903003
All Students
STATE OF TEXAS ASSESSMENTS OF ACADEMIC READINESS Summary Report
ENGLISH IIDate of Testing:
District: FALL 2015Campus:
129-903 KAUFMAN ISD Report Date: 003 GARY W CAMPBELL
FALL 2015
Legend
--- = No Data Reported For Fewer Than Five Students
Administration Summary
Number Percent
Students Tested
Students Not Tested
Other
Total Documents Submitted
Absent
10 100
00
00
10 100
Nu
mb
er o
fS
tud
ents
Tes
ted
Ave
rag
eS
cale
Sco
re
Lev
el II
:S
atis
fact
ory
# %
Lev
el II
I:
Ad
van
ced
# %
PASSED
Lev
el I:
U
nsa
tisf
acto
ry
# %
DID NOT PASS
Number of Points Possible
# % %# %# %# %#
1 2Results for Each Reporting Category
Number of Points Scored9 9 6 11 11
3 4 5 6
# % # % # %
24 11 11
Un
der
stan
din
g/
An
alys
is o
fL
iter
ary
Tex
ts
Un
der
stan
din
g/
An
alys
is o
fIn
form
atio
nal
Tex
ts
Co
mp
osi
tio
n
Rev
isio
n
Ed
itin
g
Understanding/Analysis Across Genres
Sho
rtA
nsw
erR
atin
g(S
ingl
eS
elec
tion)
Sho
rtA
nsw
erR
atin
g(P
aire
dS
elec
tion)
Mul
tiple
Cho
ice
All Students 10 3629 4 40 0 0 6 60 3.6 40 0.9 10 3.0 50 5.0 45 5.8 53 11.7 49 6.0 55 6.5 59Male 5 3475 1 20 0 0 4 80 1.8 20 1.2 13 1.8 30 3.8 35 4.8 44 12.0 50 5.0 45 5.6 51Female 5 3783 3 60 0 0 2 40 5.4 60 0.6 7 4.2 70 6.2 56 6.8 62 11.4 48 7.0 64 7.4 67No Information Provided 0 --- --- --- --- --- --- --- --- --- --- --- --- --- --- --- --- --- --- --- --- --- --- ---Hispanic/Latino 3 --- --- --- --- --- --- --- --- --- --- --- --- --- --- --- --- --- --- --- --- --- --- ---American Indian or Alaska Native 0 --- --- --- --- --- --- --- --- --- --- --- --- --- --- --- --- --- --- --- --- --- --- ---Asian 0 --- --- --- --- --- --- --- --- --- --- --- --- --- --- --- --- --- --- --- --- --- --- ---Black or African American 0 --- --- --- --- --- --- --- --- --- --- --- --- --- --- --- --- --- --- --- --- --- --- ---Native Hawaiian or Other Pacific Islander 0 --- --- --- --- --- --- --- --- --- --- --- --- --- --- --- --- --- --- --- --- --- --- ---White 7 3595 2 29 0 0 5 71 3.4 38 1.3 14 2.7 45 4.6 42 5.3 48 11.6 48 6.0 55 6.4 58Two or More Races 0 --- --- --- --- --- --- --- --- --- --- --- --- --- --- --- --- --- --- --- --- --- --- ---No Information Provided 0 --- --- --- --- --- --- --- --- --- --- --- --- --- --- --- --- --- --- --- --- --- --- ---Economically 5 3800 3 60 0 0 2 40 4.2 47 1.8 20 3.8 63 5.2 47 6.8 62 12.6 53 7.6 69 7.8 71Disadvantaged 5 3458 1 20 0 0 4 80 3.0 33 0.0 0 2.2 37 4.8 44 4.8 44 10.8 45 4.4 40 5.2 47
0 --- --- --- --- --- --- --- --- --- --- --- --- --- --- --- --- --- --- --- --- --- --- ---Title I, Part A 0 --- --- --- --- --- --- --- --- --- --- --- --- --- --- --- --- --- --- --- --- --- --- ---
10 3629 4 40 0 0 6 60 3.6 40 0.9 10 3.0 50 5.0 45 5.8 53 11.7 49 6.0 55 6.5 590 --- --- --- --- --- --- --- --- --- --- --- --- --- --- --- --- --- --- --- --- --- --- ---
Migrant 0 --- --- --- --- --- --- --- --- --- --- --- --- --- --- --- --- --- --- --- --- --- --- ---10 3629 4 40 0 0 6 60 3.6 40 0.9 10 3.0 50 5.0 45 5.8 53 11.7 49 6.0 55 6.5 590 --- --- --- --- --- --- --- --- --- --- --- --- --- --- --- --- --- --- --- --- --- --- ---
Limited English 0 --- --- --- --- --- --- --- --- --- --- --- --- --- --- --- --- --- --- --- --- --- --- ---Proficient 0 --- --- --- --- --- --- --- --- --- --- --- --- --- --- --- --- --- --- --- --- --- --- ---
0 --- --- --- --- --- --- --- --- --- --- --- --- --- --- --- --- --- --- --- --- --- --- ---10 3629 4 40 0 0 6 60 3.6 40 0.9 10 3.0 50 5.0 45 5.8 53 11.7 49 6.0 55 6.5 590 --- --- --- --- --- --- --- --- --- --- --- --- --- --- --- --- --- --- --- --- --- --- ---
Bilingual 0 --- --- --- --- --- --- --- --- --- --- --- --- --- --- --- --- --- --- --- --- --- --- ---10 3629 4 40 0 0 6 60 3.6 40 0.9 10 3.0 50 5.0 45 5.8 53 11.7 49 6.0 55 6.5 590 --- --- --- --- --- --- --- --- --- --- --- --- --- --- --- --- --- --- --- --- --- --- ---
ESL 0 --- --- --- --- --- --- --- --- --- --- --- --- --- --- --- --- --- --- --- --- --- --- ---10 3629 4 40 0 0 6 60 3.6 40 0.9 10 3.0 50 5.0 45 5.8 53 11.7 49 6.0 55 6.5 590 --- --- --- --- --- --- --- --- --- --- --- --- --- --- --- --- --- --- --- --- --- --- ---
Special Education 0 --- --- --- --- --- --- --- --- --- --- --- --- --- --- --- --- --- --- --- --- --- --- ---10 3629 4 40 0 0 6 60 3.6 40 0.9 10 3.0 50 5.0 45 5.8 53 11.7 49 6.0 55 6.5 590 --- --- --- --- --- --- --- --- --- --- --- --- --- --- --- --- --- --- --- --- --- --- ---
Gifted/Talented 0 --- --- --- --- --- --- --- --- --- --- --- --- --- --- --- --- --- --- --- --- --- --- ---10 3629 4 40 0 0 6 60 3.6 40 0.9 10 3.0 50 5.0 45 5.8 53 11.7 49 6.0 55 6.5 590 --- --- --- --- --- --- --- --- --- --- --- --- --- --- --- --- --- --- --- --- --- --- ---
At-Risk 4 --- --- --- --- --- --- --- --- --- --- --- --- --- --- --- --- --- --- --- --- --- --- ---6 3599 3 50 0 0 3 50 3.5 39 0.5 6 2.7 44 5.2 47 5.3 48 12.0 50 5.3 48 6.8 620 --- --- --- --- --- --- --- --- --- --- --- --- --- --- --- --- --- --- --- --- --- --- ---
Career/Technical 3 --- --- --- --- --- --- --- --- --- --- --- --- --- --- --- --- --- --- --- --- --- --- ---Education 7 3639 3 43 0 0 4 57 3.4 38 0.9 10 3.0 50 4.9 44 6.0 55 12.0 50 6.0 55 6.7 61
0 --- --- --- --- --- --- --- --- --- --- --- --- --- --- --- --- --- --- --- --- --- --- ---
YesNo
No Information ProvidedParticipants
NonparticipantsNo Information Provided
YesNo
No Information ProvidedCurrent LEP
Non-LEP (Monitored 1st Year)Non-LEP (Monitored 2nd Year)
Other Non-LEPNo Information Provided
ParticipantsNonparticipants
No Information ProvidedParticipants
NonparticipantsNo Information Provided
YesNo
No Information ProvidedParticipants
NonparticipantsNo Information Provided
YesNo
No Information ProvidedParticipants
NonparticipantsNo Information Provided
Written Composition Rating SummaryShort Answer Rating Summary
Single Selection Paired Selections Persuasive Composition
Each Composition has been scored independently by two readers. The written composition rating of 0-8 represents the summation of these scores.
--- = No Data Reported For Fewer Than Five Students
Rating # %
0 3 30
1 2 20
2 5 50
3 0 0
Total 10 100
Rating # %
0 7 70
1 3 30
2 0 0
3 0 0
Total 10 100
Rating # %
0 0 0
2 0 0
3 4 40
4 4 40
5 1 10
6 1 10
7 0 0
8 0 0
Total 10 100
21016-00001577-129903003
PE
RC
EN
T
PE
RC
EN
T
PE
RC
EN
T
All Students
STATE OF TEXAS ASSESSMENTS OF ACADEMIC READINESS Constructed Responses Summary Report
ENGLISH IIDate of Testing:
District: FALL 2015Campus:
129-903 KAUFMAN ISD Report Date: 003 GARY W CAMPBELL
FALL 2015
21016-00001577-129903003
First-Time Tested Students
STATE OF TEXAS ASSESSMENTS OF ACADEMIC READINESS Summary Report
ENGLISH IIDate of Testing:
District: FALL 2015Campus:
129-903 KAUFMAN ISD Report Date: 003 GARY W CAMPBELL
FALL 2015
Legend
--- = No Data Reported For Fewer Than Five Students
Administration Summary
Number Percent
Students Tested
Students Not Tested
Other
Total Documents Submitted
Absent
5 100
00
00
5 100
Nu
mb
er o
fS
tud
ents
Tes
ted
Ave
rag
eS
cale
Sco
re
Lev
el II
:S
atis
fact
ory
# %
Lev
el II
I:
Ad
van
ced
# %
PASSED
Lev
el I:
U
nsa
tisf
acto
ry
# %
DID NOT PASS
Number of Points Possible
# % %# %# %# %#
1 2Results for Each Reporting Category
Number of Points Scored9 9 6 11 11
3 4 5 6
# % # % # %
24 11 11
Un
der
stan
din
g/
An
alys
is o
fL
iter
ary
Tex
ts
Un
der
stan
din
g/
An
alys
is o
fIn
form
atio
nal
Tex
ts
Co
mp
osi
tio
n
Rev
isio
n
Ed
itin
g
Understanding/Analysis Across Genres
Sho
rtA
nsw
erR
atin
g(S
ingl
eS
elec
tion)
Sho
rtA
nsw
erR
atin
g(P
aire
dS
elec
tion)
Mul
tiple
Cho
ice
All Students 5 3569 1 20 0 0 4 80 3.0 33 0.6 7 3.0 50 4.8 44 5.8 53 12.0 50 5.6 51 5.0 45Male 2 --- --- --- --- --- --- --- --- --- --- --- --- --- --- --- --- --- --- --- --- --- --- ---Female 3 --- --- --- --- --- --- --- --- --- --- --- --- --- --- --- --- --- --- --- --- --- --- ---No Information Provided 0 --- --- --- --- --- --- --- --- --- --- --- --- --- --- --- --- --- --- --- --- --- --- ---Hispanic/Latino 2 --- --- --- --- --- --- --- --- --- --- --- --- --- --- --- --- --- --- --- --- --- --- ---American Indian or Alaska Native 0 --- --- --- --- --- --- --- --- --- --- --- --- --- --- --- --- --- --- --- --- --- --- ---Asian 0 --- --- --- --- --- --- --- --- --- --- --- --- --- --- --- --- --- --- --- --- --- --- ---Black or African American 0 --- --- --- --- --- --- --- --- --- --- --- --- --- --- --- --- --- --- --- --- --- --- ---Native Hawaiian or Other Pacific Islander 0 --- --- --- --- --- --- --- --- --- --- --- --- --- --- --- --- --- --- --- --- --- --- ---White 3 --- --- --- --- --- --- --- --- --- --- --- --- --- --- --- --- --- --- --- --- --- --- ---Two or More Races 0 --- --- --- --- --- --- --- --- --- --- --- --- --- --- --- --- --- --- --- --- --- --- ---No Information Provided 0 --- --- --- --- --- --- --- --- --- --- --- --- --- --- --- --- --- --- --- --- --- --- ---Economically 2 --- --- --- --- --- --- --- --- --- --- --- --- --- --- --- --- --- --- --- --- --- --- ---Disadvantaged 3 --- --- --- --- --- --- --- --- --- --- --- --- --- --- --- --- --- --- --- --- --- --- ---
0 --- --- --- --- --- --- --- --- --- --- --- --- --- --- --- --- --- --- --- --- --- --- ---Title I, Part A 0 --- --- --- --- --- --- --- --- --- --- --- --- --- --- --- --- --- --- --- --- --- --- ---
5 3569 1 20 0 0 4 80 3.0 33 0.6 7 3.0 50 4.8 44 5.8 53 12.0 50 5.6 51 5.0 450 --- --- --- --- --- --- --- --- --- --- --- --- --- --- --- --- --- --- --- --- --- --- ---
Migrant 0 --- --- --- --- --- --- --- --- --- --- --- --- --- --- --- --- --- --- --- --- --- --- ---5 3569 1 20 0 0 4 80 3.0 33 0.6 7 3.0 50 4.8 44 5.8 53 12.0 50 5.6 51 5.0 450 --- --- --- --- --- --- --- --- --- --- --- --- --- --- --- --- --- --- --- --- --- --- ---
Limited English 0 --- --- --- --- --- --- --- --- --- --- --- --- --- --- --- --- --- --- --- --- --- --- ---Proficient 0 --- --- --- --- --- --- --- --- --- --- --- --- --- --- --- --- --- --- --- --- --- --- ---
0 --- --- --- --- --- --- --- --- --- --- --- --- --- --- --- --- --- --- --- --- --- --- ---5 3569 1 20 0 0 4 80 3.0 33 0.6 7 3.0 50 4.8 44 5.8 53 12.0 50 5.6 51 5.0 450 --- --- --- --- --- --- --- --- --- --- --- --- --- --- --- --- --- --- --- --- --- --- ---
Bilingual 0 --- --- --- --- --- --- --- --- --- --- --- --- --- --- --- --- --- --- --- --- --- --- ---5 3569 1 20 0 0 4 80 3.0 33 0.6 7 3.0 50 4.8 44 5.8 53 12.0 50 5.6 51 5.0 450 --- --- --- --- --- --- --- --- --- --- --- --- --- --- --- --- --- --- --- --- --- --- ---
ESL 0 --- --- --- --- --- --- --- --- --- --- --- --- --- --- --- --- --- --- --- --- --- --- ---5 3569 1 20 0 0 4 80 3.0 33 0.6 7 3.0 50 4.8 44 5.8 53 12.0 50 5.6 51 5.0 450 --- --- --- --- --- --- --- --- --- --- --- --- --- --- --- --- --- --- --- --- --- --- ---
Special Education 0 --- --- --- --- --- --- --- --- --- --- --- --- --- --- --- --- --- --- --- --- --- --- ---5 3569 1 20 0 0 4 80 3.0 33 0.6 7 3.0 50 4.8 44 5.8 53 12.0 50 5.6 51 5.0 450 --- --- --- --- --- --- --- --- --- --- --- --- --- --- --- --- --- --- --- --- --- --- ---
Gifted/Talented 0 --- --- --- --- --- --- --- --- --- --- --- --- --- --- --- --- --- --- --- --- --- --- ---5 3569 1 20 0 0 4 80 3.0 33 0.6 7 3.0 50 4.8 44 5.8 53 12.0 50 5.6 51 5.0 450 --- --- --- --- --- --- --- --- --- --- --- --- --- --- --- --- --- --- --- --- --- --- ---
At-Risk 3 --- --- --- --- --- --- --- --- --- --- --- --- --- --- --- --- --- --- --- --- --- --- ---2 --- --- --- --- --- --- --- --- --- --- --- --- --- --- --- --- --- --- --- --- --- --- ---0 --- --- --- --- --- --- --- --- --- --- --- --- --- --- --- --- --- --- --- --- --- --- ---
Career/Technical 2 --- --- --- --- --- --- --- --- --- --- --- --- --- --- --- --- --- --- --- --- --- --- ---Education 3 --- --- --- --- --- --- --- --- --- --- --- --- --- --- --- --- --- --- --- --- --- --- ---
0 --- --- --- --- --- --- --- --- --- --- --- --- --- --- --- --- --- --- --- --- --- --- ---
YesNo
No Information ProvidedParticipants
NonparticipantsNo Information Provided
YesNo
No Information ProvidedCurrent LEP
Non-LEP (Monitored 1st Year)Non-LEP (Monitored 2nd Year)
Other Non-LEPNo Information Provided
ParticipantsNonparticipants
No Information ProvidedParticipants
NonparticipantsNo Information Provided
YesNo
No Information ProvidedParticipants
NonparticipantsNo Information Provided
YesNo
No Information ProvidedParticipants
NonparticipantsNo Information Provided
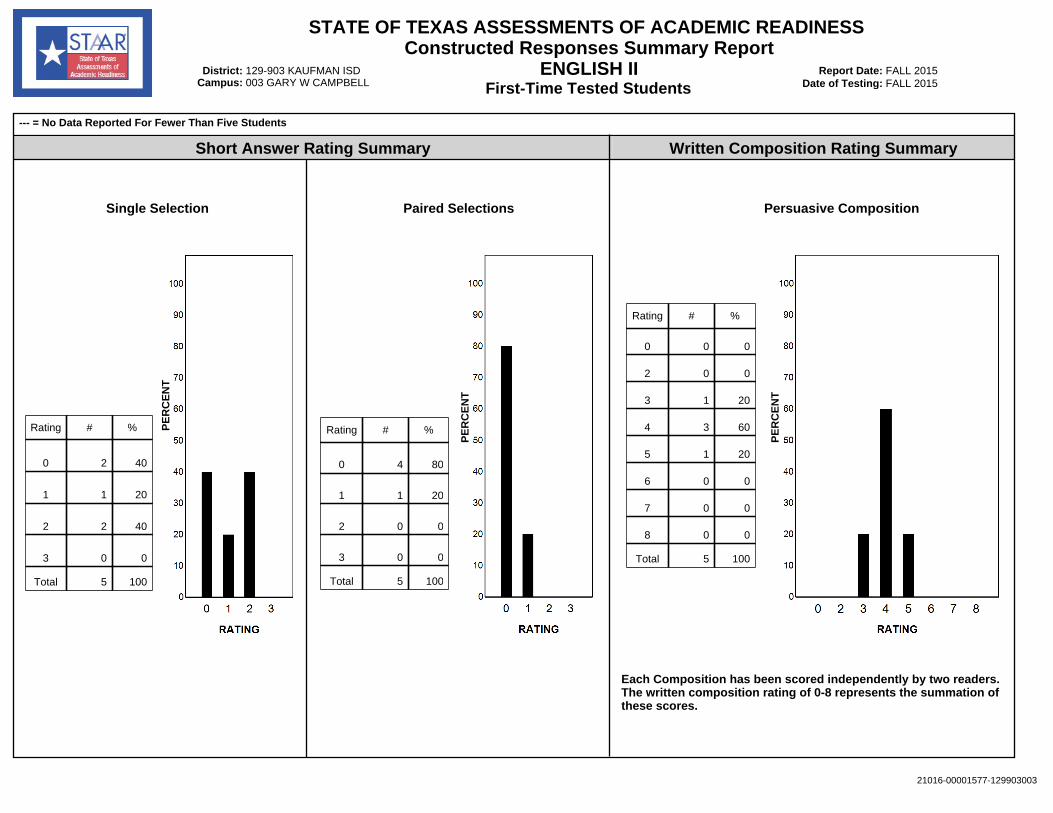
Written Composition Rating SummaryShort Answer Rating Summary
Single Selection Paired Selections Persuasive Composition
Each Composition has been scored independently by two readers. The written composition rating of 0-8 represents the summation of these scores.
--- = No Data Reported For Fewer Than Five Students
Rating # %
0 2 40
1 1 20
2 2 40
3 0 0
Total 5 100
Rating # %
0 4 80
1 1 20
2 0 0
3 0 0
Total 5 100
Rating # %
0 0 0
2 0 0
3 1 20
4 3 60
5 1 20
6 0 0
7 0 0
8 0 0
Total 5 100
21016-00001577-129903003
PE
RC
EN
T
PE
RC
EN
T
PE
RC
EN
T
First-Time Tested Students
STATE OF TEXAS ASSESSMENTS OF ACADEMIC READINESS Constructed Responses Summary Report
ENGLISH IIDate of Testing:
District: FALL 2015Campus:
129-903 KAUFMAN ISD Report Date: 003 GARY W CAMPBELL
FALL 2015
21016-00001577-129903003
Retested Students
STATE OF TEXAS ASSESSMENTS OF ACADEMIC READINESS Summary Report
ENGLISH IIDate of Testing:
District: FALL 2015Campus:
129-903 KAUFMAN ISD Report Date: 003 GARY W CAMPBELL
FALL 2015
Legend
--- = No Data Reported For Fewer Than Five Students
Administration Summary
Number Percent
Students Tested
Students Not Tested
Other
Total Documents Submitted
Absent
5 100
00
00
5 100
Nu
mb
er o
fS
tud
ents
Tes
ted
Ave
rag
eS
cale
Sco
re
Lev
el II
:S
atis
fact
ory
# %
Lev
el II
I:
Ad
van
ced
# %
PASSED
Lev
el I:
U
nsa
tisf
acto
ry
# %
DID NOT PASS
Number of Points Possible
# % %# %# %# %#
1 2Results for Each Reporting Category
Number of Points Scored9 9 6 11 11
3 4 5 6
# % # % # %
24 11 11
Un
der
stan
din
g/
An
alys
is o
fL
iter
ary
Tex
ts
Un
der
stan
din
g/
An
alys
is o
fIn
form
atio
nal
Tex
ts
Co
mp
osi
tio
n
Rev
isio
n
Ed
itin
g
Understanding/Analysis Across Genres
Sho
rtA
nsw
erR
atin
g(S
ingl
eS
elec
tion)
Sho
rtA
nsw
erR
atin
g(P
aire
dS
elec
tion)
Mul
tiple
Cho
ice
All Students 5 3689 3 60 0 0 2 40 4.2 47 1.2 13 3.0 50 5.2 47 5.8 53 11.4 48 6.4 58 8.0 73Male 3 --- --- --- --- --- --- --- --- --- --- --- --- --- --- --- --- --- --- --- --- --- --- ---Female 2 --- --- --- --- --- --- --- --- --- --- --- --- --- --- --- --- --- --- --- --- --- --- ---No Information Provided 0 --- --- --- --- --- --- --- --- --- --- --- --- --- --- --- --- --- --- --- --- --- --- ---Hispanic/Latino 1 --- --- --- --- --- --- --- --- --- --- --- --- --- --- --- --- --- --- --- --- --- --- ---American Indian or Alaska Native 0 --- --- --- --- --- --- --- --- --- --- --- --- --- --- --- --- --- --- --- --- --- --- ---Asian 0 --- --- --- --- --- --- --- --- --- --- --- --- --- --- --- --- --- --- --- --- --- --- ---Black or African American 0 --- --- --- --- --- --- --- --- --- --- --- --- --- --- --- --- --- --- --- --- --- --- ---Native Hawaiian or Other Pacific Islander 0 --- --- --- --- --- --- --- --- --- --- --- --- --- --- --- --- --- --- --- --- --- --- ---White 4 --- --- --- --- --- --- --- --- --- --- --- --- --- --- --- --- --- --- --- --- --- --- ---Two or More Races 0 --- --- --- --- --- --- --- --- --- --- --- --- --- --- --- --- --- --- --- --- --- --- ---No Information Provided 0 --- --- --- --- --- --- --- --- --- --- --- --- --- --- --- --- --- --- --- --- --- --- ---Economically 3 --- --- --- --- --- --- --- --- --- --- --- --- --- --- --- --- --- --- --- --- --- --- ---Disadvantaged 2 --- --- --- --- --- --- --- --- --- --- --- --- --- --- --- --- --- --- --- --- --- --- ---
0 --- --- --- --- --- --- --- --- --- --- --- --- --- --- --- --- --- --- --- --- --- --- ---Title I, Part A 0 --- --- --- --- --- --- --- --- --- --- --- --- --- --- --- --- --- --- --- --- --- --- ---
5 3689 3 60 0 0 2 40 4.2 47 1.2 13 3.0 50 5.2 47 5.8 53 11.4 48 6.4 58 8.0 730 --- --- --- --- --- --- --- --- --- --- --- --- --- --- --- --- --- --- --- --- --- --- ---
Migrant 0 --- --- --- --- --- --- --- --- --- --- --- --- --- --- --- --- --- --- --- --- --- --- ---5 3689 3 60 0 0 2 40 4.2 47 1.2 13 3.0 50 5.2 47 5.8 53 11.4 48 6.4 58 8.0 730 --- --- --- --- --- --- --- --- --- --- --- --- --- --- --- --- --- --- --- --- --- --- ---
Limited English 0 --- --- --- --- --- --- --- --- --- --- --- --- --- --- --- --- --- --- --- --- --- --- ---Proficient 0 --- --- --- --- --- --- --- --- --- --- --- --- --- --- --- --- --- --- --- --- --- --- ---
0 --- --- --- --- --- --- --- --- --- --- --- --- --- --- --- --- --- --- --- --- --- --- ---5 3689 3 60 0 0 2 40 4.2 47 1.2 13 3.0 50 5.2 47 5.8 53 11.4 48 6.4 58 8.0 730 --- --- --- --- --- --- --- --- --- --- --- --- --- --- --- --- --- --- --- --- --- --- ---
Bilingual 0 --- --- --- --- --- --- --- --- --- --- --- --- --- --- --- --- --- --- --- --- --- --- ---5 3689 3 60 0 0 2 40 4.2 47 1.2 13 3.0 50 5.2 47 5.8 53 11.4 48 6.4 58 8.0 730 --- --- --- --- --- --- --- --- --- --- --- --- --- --- --- --- --- --- --- --- --- --- ---
ESL 0 --- --- --- --- --- --- --- --- --- --- --- --- --- --- --- --- --- --- --- --- --- --- ---5 3689 3 60 0 0 2 40 4.2 47 1.2 13 3.0 50 5.2 47 5.8 53 11.4 48 6.4 58 8.0 730 --- --- --- --- --- --- --- --- --- --- --- --- --- --- --- --- --- --- --- --- --- --- ---
Special Education 0 --- --- --- --- --- --- --- --- --- --- --- --- --- --- --- --- --- --- --- --- --- --- ---5 3689 3 60 0 0 2 40 4.2 47 1.2 13 3.0 50 5.2 47 5.8 53 11.4 48 6.4 58 8.0 730 --- --- --- --- --- --- --- --- --- --- --- --- --- --- --- --- --- --- --- --- --- --- ---
Gifted/Talented 0 --- --- --- --- --- --- --- --- --- --- --- --- --- --- --- --- --- --- --- --- --- --- ---5 3689 3 60 0 0 2 40 4.2 47 1.2 13 3.0 50 5.2 47 5.8 53 11.4 48 6.4 58 8.0 730 --- --- --- --- --- --- --- --- --- --- --- --- --- --- --- --- --- --- --- --- --- --- ---
At-Risk 1 --- --- --- --- --- --- --- --- --- --- --- --- --- --- --- --- --- --- --- --- --- --- ---4 --- --- --- --- --- --- --- --- --- --- --- --- --- --- --- --- --- --- --- --- --- --- ---0 --- --- --- --- --- --- --- --- --- --- --- --- --- --- --- --- --- --- --- --- --- --- ---
Career/Technical 1 --- --- --- --- --- --- --- --- --- --- --- --- --- --- --- --- --- --- --- --- --- --- ---Education 4 --- --- --- --- --- --- --- --- --- --- --- --- --- --- --- --- --- --- --- --- --- --- ---
0 --- --- --- --- --- --- --- --- --- --- --- --- --- --- --- --- --- --- --- --- --- --- ---
YesNo
No Information ProvidedParticipants
NonparticipantsNo Information Provided
YesNo
No Information ProvidedCurrent LEP
Non-LEP (Monitored 1st Year)Non-LEP (Monitored 2nd Year)
Other Non-LEPNo Information Provided
ParticipantsNonparticipants
No Information ProvidedParticipants
NonparticipantsNo Information Provided
YesNo
No Information ProvidedParticipants
NonparticipantsNo Information Provided
YesNo
No Information ProvidedParticipants
NonparticipantsNo Information Provided
Written Composition Rating SummaryShort Answer Rating Summary
Single Selection Paired Selections Persuasive Composition
Each Composition has been scored independently by two readers. The written composition rating of 0-8 represents the summation of these scores.
--- = No Data Reported For Fewer Than Five Students
Rating # %
0 1 20
1 1 20
2 3 60
3 0 0
Total 5 100
Rating # %
0 3 60
1 2 40
2 0 0
3 0 0
Total 5 100
Rating # %
0 0 0
2 0 0
3 3 60
4 1 20
5 0 0
6 1 20
7 0 0
8 0 0
Total 5 100
21016-00001577-129903003
PE
RC
EN
T
PE
RC
EN
T
PE
RC
EN
T
Retested Students
STATE OF TEXAS ASSESSMENTS OF ACADEMIC READINESS Constructed Responses Summary Report
ENGLISH IIDate of Testing:
District: FALL 2015Campus:
129-903 KAUFMAN ISD Report Date: 003 GARY W CAMPBELL
FALL 2015
21016-00001577-129903003
All Students
STATE OF TEXAS ASSESSMENTS OF ACADEMIC READINESS Summary Report
U.S.HISTORYDate of Testing:
District: FALL 2015Campus:
129-903 KAUFMAN ISD Report Date: 003 GARY W CAMPBELL
FALL 2015
Legend
--- = No Data Reported For Fewer Than Five Students
Administration Summary
Number Percent
Students Tested
Students Not Tested
Other
Total Documents Submitted
Absent
9 100
00
00
9 100
Nu
mb
er o
fS
tud
ents
Tes
ted
Ave
rag
eS
cale
Sco
re
Lev
el II
:S
atis
fact
ory
# %
Lev
el II
I:
Ad
van
ced
# %
PASSED
Lev
el I:
U
nsa
tisf
acto
ry
# %
DID NOT PASS
His
tory
Number of Items Tested
Geo
gra
ph
y an
dC
ult
ure
Go
vern
men
tan
dC
itiz
ensh
ip
Eco
no
mic
s,S
cien
ce,
Tec
hn
olo
gy,
and
So
ciet
y
# % %# %# %#
1 2 3 4Results for Each Reporting Category
Avg. # of Items / % Correct30 12 10 16
All Students 9 3503 6 67 0 0 3 33 13.2 44 5.7 47 3.2 32 6.6 41Male 1 --- --- --- --- --- --- --- --- --- --- --- --- --- --- ---Female 8 3497 5 63 0 0 3 38 13.1 44 5.8 48 3.3 33 6.4 40No Information Provided 0 --- --- --- --- --- --- --- --- --- --- --- --- --- --- ---Hispanic/Latino 2 --- --- --- --- --- --- --- --- --- --- --- --- --- --- ---American Indian or Alaska Native 0 --- --- --- --- --- --- --- --- --- --- --- --- --- --- ---Asian 0 --- --- --- --- --- --- --- --- --- --- --- --- --- --- ---Black or African American 1 --- --- --- --- --- --- --- --- --- --- --- --- --- --- ---Native Hawaiian or Other Pacific Islander 0 --- --- --- --- --- --- --- --- --- --- --- --- --- --- ---White 6 3534 4 67 0 0 2 33 13.5 45 6.0 50 3.2 32 7.2 45Two or More Races 0 --- --- --- --- --- --- --- --- --- --- --- --- --- --- ---No Information Provided 0 --- --- --- --- --- --- --- --- --- --- --- --- --- --- ---Economically 3 --- --- --- --- --- --- --- --- --- --- --- --- --- --- ---Disadvantaged 6 3564 4 67 0 0 2 33 14.5 48 5.5 46 3.8 38 6.7 42
0 --- --- --- --- --- --- --- --- --- --- --- --- --- --- ---Title I, Part A 0 --- --- --- --- --- --- --- --- --- --- --- --- --- --- ---
9 3503 6 67 0 0 3 33 13.2 44 5.7 47 3.2 32 6.6 410 --- --- --- --- --- --- --- --- --- --- --- --- --- --- ---
Migrant 0 --- --- --- --- --- --- --- --- --- --- --- --- --- --- ---9 3503 6 67 0 0 3 33 13.2 44 5.7 47 3.2 32 6.6 410 --- --- --- --- --- --- --- --- --- --- --- --- --- --- ---
Limited English 0 --- --- --- --- --- --- --- --- --- --- --- --- --- --- ---Proficient 0 --- --- --- --- --- --- --- --- --- --- --- --- --- --- ---
0 --- --- --- --- --- --- --- --- --- --- --- --- --- --- ---9 3503 6 67 0 0 3 33 13.2 44 5.7 47 3.2 32 6.6 410 --- --- --- --- --- --- --- --- --- --- --- --- --- --- ---
Bilingual 0 --- --- --- --- --- --- --- --- --- --- --- --- --- --- ---9 3503 6 67 0 0 3 33 13.2 44 5.7 47 3.2 32 6.6 410 --- --- --- --- --- --- --- --- --- --- --- --- --- --- ---
ESL 0 --- --- --- --- --- --- --- --- --- --- --- --- --- --- ---9 3503 6 67 0 0 3 33 13.2 44 5.7 47 3.2 32 6.6 410 --- --- --- --- --- --- --- --- --- --- --- --- --- --- ---
Special Education 0 --- --- --- --- --- --- --- --- --- --- --- --- --- --- ---9 3503 6 67 0 0 3 33 13.2 44 5.7 47 3.2 32 6.6 410 --- --- --- --- --- --- --- --- --- --- --- --- --- --- ---
Gifted/Talented 0 --- --- --- --- --- --- --- --- --- --- --- --- --- --- ---9 3503 6 67 0 0 3 33 13.2 44 5.7 47 3.2 32 6.6 410 --- --- --- --- --- --- --- --- --- --- --- --- --- --- ---
At-Risk 5 3274 2 40 0 0 3 60 10.0 33 4.4 37 2.4 24 5.2 334 --- --- --- --- --- --- --- --- --- --- --- --- --- --- ---0 --- --- --- --- --- --- --- --- --- --- --- --- --- --- ---
Career/Technical 4 --- --- --- --- --- --- --- --- --- --- --- --- --- --- ---Education 5 3741 5 100 0 0 0 0 16.6 55 6.8 57 4.0 40 8.2 51
0 --- --- --- --- --- --- --- --- --- --- --- --- --- --- ---
YesNo
No Information ProvidedParticipants
NonparticipantsNo Information Provided
YesNo
No Information ProvidedCurrent LEP
Non-LEP (Monitored 1st Year)Non-LEP (Monitored 2nd Year)
Other Non-LEPNo Information Provided
ParticipantsNonparticipants
No Information ProvidedParticipants
NonparticipantsNo Information Provided
YesNo
No Information ProvidedParticipants
NonparticipantsNo Information Provided
YesNo
No Information ProvidedParticipants
NonparticipantsNo Information Provided
21016-00001577-129903003
First-Time Tested Students
STATE OF TEXAS ASSESSMENTS OF ACADEMIC READINESS Summary Report
U.S.HISTORYDate of Testing:
District: FALL 2015Campus:
129-903 KAUFMAN ISD Report Date: 003 GARY W CAMPBELL
FALL 2015
Legend
--- = No Data Reported For Fewer Than Five Students
Administration Summary
Number Percent
Students Tested
Students Not Tested
Other
Total Documents Submitted
Absent
6 100
00
00
6 100
Nu
mb
er o
fS
tud
ents
Tes
ted
Ave
rag
eS
cale
Sco
re
Lev
el II
:S
atis
fact
ory
# %
Lev
el II
I:
Ad
van
ced
# %
PASSED
Lev
el I:
U
nsa
tisf
acto
ry
# %
DID NOT PASS
His
tory
Number of Items Tested
Geo
gra
ph
y an
dC
ult
ure
Go
vern
men
tan
dC
itiz
ensh
ip
Eco
no
mic
s,S
cien
ce,
Tec
hn
olo
gy,
and
So
ciet
y
# % %# %# %#
1 2 3 4Results for Each Reporting Category
Avg. # of Items / % Correct30 12 10 16
All Students 6 3627 5 83 0 0 1 17 14.3 48 7.2 60 3.2 32 7.7 48Male 1 --- --- --- --- --- --- --- --- --- --- --- --- --- --- ---Female 5 3643 4 80 0 0 1 20 14.4 48 7.6 63 3.2 32 7.6 48No Information Provided 0 --- --- --- --- --- --- --- --- --- --- --- --- --- --- ---Hispanic/Latino 0 --- --- --- --- --- --- --- --- --- --- --- --- --- --- ---American Indian or Alaska Native 0 --- --- --- --- --- --- --- --- --- --- --- --- --- --- ---Asian 0 --- --- --- --- --- --- --- --- --- --- --- --- --- --- ---Black or African American 1 --- --- --- --- --- --- --- --- --- --- --- --- --- --- ---Native Hawaiian or Other Pacific Islander 0 --- --- --- --- --- --- --- --- --- --- --- --- --- --- ---White 5 3646 4 80 0 0 1 20 14.8 49 7.2 60 3.2 32 7.8 49Two or More Races 0 --- --- --- --- --- --- --- --- --- --- --- --- --- --- ---No Information Provided 0 --- --- --- --- --- --- --- --- --- --- --- --- --- --- ---Economically 3 --- --- --- --- --- --- --- --- --- --- --- --- --- --- ---Disadvantaged 3 --- --- --- --- --- --- --- --- --- --- --- --- --- --- ---
0 --- --- --- --- --- --- --- --- --- --- --- --- --- --- ---Title I, Part A 0 --- --- --- --- --- --- --- --- --- --- --- --- --- --- ---
6 3627 5 83 0 0 1 17 14.3 48 7.2 60 3.2 32 7.7 480 --- --- --- --- --- --- --- --- --- --- --- --- --- --- ---
Migrant 0 --- --- --- --- --- --- --- --- --- --- --- --- --- --- ---6 3627 5 83 0 0 1 17 14.3 48 7.2 60 3.2 32 7.7 480 --- --- --- --- --- --- --- --- --- --- --- --- --- --- ---
Limited English 0 --- --- --- --- --- --- --- --- --- --- --- --- --- --- ---Proficient 0 --- --- --- --- --- --- --- --- --- --- --- --- --- --- ---
0 --- --- --- --- --- --- --- --- --- --- --- --- --- --- ---6 3627 5 83 0 0 1 17 14.3 48 7.2 60 3.2 32 7.7 480 --- --- --- --- --- --- --- --- --- --- --- --- --- --- ---
Bilingual 0 --- --- --- --- --- --- --- --- --- --- --- --- --- --- ---6 3627 5 83 0 0 1 17 14.3 48 7.2 60 3.2 32 7.7 480 --- --- --- --- --- --- --- --- --- --- --- --- --- --- ---
ESL 0 --- --- --- --- --- --- --- --- --- --- --- --- --- --- ---6 3627 5 83 0 0 1 17 14.3 48 7.2 60 3.2 32 7.7 480 --- --- --- --- --- --- --- --- --- --- --- --- --- --- ---
Special Education 0 --- --- --- --- --- --- --- --- --- --- --- --- --- --- ---6 3627 5 83 0 0 1 17 14.3 48 7.2 60 3.2 32 7.7 480 --- --- --- --- --- --- --- --- --- --- --- --- --- --- ---
Gifted/Talented 0 --- --- --- --- --- --- --- --- --- --- --- --- --- --- ---6 3627 5 83 0 0 1 17 14.3 48 7.2 60 3.2 32 7.7 480 --- --- --- --- --- --- --- --- --- --- --- --- --- --- ---
At-Risk 3 --- --- --- --- --- --- --- --- --- --- --- --- --- --- ---3 --- --- --- --- --- --- --- --- --- --- --- --- --- --- ---0 --- --- --- --- --- --- --- --- --- --- --- --- --- --- ---
Career/Technical 2 --- --- --- --- --- --- --- --- --- --- --- --- --- --- ---Education 4 --- --- --- --- --- --- --- --- --- --- --- --- --- --- ---
0 --- --- --- --- --- --- --- --- --- --- --- --- --- --- ---
YesNo
No Information ProvidedParticipants
NonparticipantsNo Information Provided
YesNo
No Information ProvidedCurrent LEP
Non-LEP (Monitored 1st Year)Non-LEP (Monitored 2nd Year)
Other Non-LEPNo Information Provided
ParticipantsNonparticipants
No Information ProvidedParticipants
NonparticipantsNo Information Provided
YesNo
No Information ProvidedParticipants
NonparticipantsNo Information Provided
YesNo
No Information ProvidedParticipants
NonparticipantsNo Information Provided
21016-00001577-129903003
Retested Students
STATE OF TEXAS ASSESSMENTS OF ACADEMIC READINESS Summary Report
U.S.HISTORYDate of Testing:
District: FALL 2015Campus:
129-903 KAUFMAN ISD Report Date: 003 GARY W CAMPBELL
FALL 2015
Legend
--- = No Data Reported For Fewer Than Five Students
Administration Summary
Number Percent
Students Tested
Students Not Tested
Other
Total Documents Submitted
Absent
3 100
00
00
3 100
Nu
mb
er o
fS
tud
ents
Tes
ted
Ave
rag
eS
cale
Sco
re
Lev
el II
:S
atis
fact
ory
# %
Lev
el II
I:
Ad
van
ced
# %
PASSED
Lev
el I:
U
nsa
tisf
acto
ry
# %
DID NOT PASS
His
tory
Number of Items Tested
Geo
gra
ph
y an
dC
ult
ure
Go
vern
men
tan
dC
itiz
ensh
ip
Eco
no
mic
s,S
cien
ce,
Tec
hn
olo
gy,
and
So
ciet
y
# % %# %# %#
1 2 3 4Results for Each Reporting Category
Avg. # of Items / % Correct30 12 10 16
All Students 3 --- --- --- --- --- --- --- --- --- --- --- --- --- --- ---Male 0 --- --- --- --- --- --- --- --- --- --- --- --- --- --- ---Female 3 --- --- --- --- --- --- --- --- --- --- --- --- --- --- ---No Information Provided 0 --- --- --- --- --- --- --- --- --- --- --- --- --- --- ---Hispanic/Latino 2 --- --- --- --- --- --- --- --- --- --- --- --- --- --- ---American Indian or Alaska Native 0 --- --- --- --- --- --- --- --- --- --- --- --- --- --- ---Asian 0 --- --- --- --- --- --- --- --- --- --- --- --- --- --- ---Black or African American 0 --- --- --- --- --- --- --- --- --- --- --- --- --- --- ---Native Hawaiian or Other Pacific Islander 0 --- --- --- --- --- --- --- --- --- --- --- --- --- --- ---White 1 --- --- --- --- --- --- --- --- --- --- --- --- --- --- ---Two or More Races 0 --- --- --- --- --- --- --- --- --- --- --- --- --- --- ---No Information Provided 0 --- --- --- --- --- --- --- --- --- --- --- --- --- --- ---Economically 0 --- --- --- --- --- --- --- --- --- --- --- --- --- --- ---Disadvantaged 3 --- --- --- --- --- --- --- --- --- --- --- --- --- --- ---
0 --- --- --- --- --- --- --- --- --- --- --- --- --- --- ---Title I, Part A 0 --- --- --- --- --- --- --- --- --- --- --- --- --- --- ---
3 --- --- --- --- --- --- --- --- --- --- --- --- --- --- ---0 --- --- --- --- --- --- --- --- --- --- --- --- --- --- ---
Migrant 0 --- --- --- --- --- --- --- --- --- --- --- --- --- --- ---3 --- --- --- --- --- --- --- --- --- --- --- --- --- --- ---0 --- --- --- --- --- --- --- --- --- --- --- --- --- --- ---
Limited English 0 --- --- --- --- --- --- --- --- --- --- --- --- --- --- ---Proficient 0 --- --- --- --- --- --- --- --- --- --- --- --- --- --- ---
0 --- --- --- --- --- --- --- --- --- --- --- --- --- --- ---3 --- --- --- --- --- --- --- --- --- --- --- --- --- --- ---0 --- --- --- --- --- --- --- --- --- --- --- --- --- --- ---
Bilingual 0 --- --- --- --- --- --- --- --- --- --- --- --- --- --- ---3 --- --- --- --- --- --- --- --- --- --- --- --- --- --- ---0 --- --- --- --- --- --- --- --- --- --- --- --- --- --- ---
ESL 0 --- --- --- --- --- --- --- --- --- --- --- --- --- --- ---3 --- --- --- --- --- --- --- --- --- --- --- --- --- --- ---0 --- --- --- --- --- --- --- --- --- --- --- --- --- --- ---
Special Education 0 --- --- --- --- --- --- --- --- --- --- --- --- --- --- ---3 --- --- --- --- --- --- --- --- --- --- --- --- --- --- ---0 --- --- --- --- --- --- --- --- --- --- --- --- --- --- ---
Gifted/Talented 0 --- --- --- --- --- --- --- --- --- --- --- --- --- --- ---3 --- --- --- --- --- --- --- --- --- --- --- --- --- --- ---0 --- --- --- --- --- --- --- --- --- --- --- --- --- --- ---
At-Risk 2 --- --- --- --- --- --- --- --- --- --- --- --- --- --- ---1 --- --- --- --- --- --- --- --- --- --- --- --- --- --- ---0 --- --- --- --- --- --- --- --- --- --- --- --- --- --- ---
Career/Technical 2 --- --- --- --- --- --- --- --- --- --- --- --- --- --- ---Education 1 --- --- --- --- --- --- --- --- --- --- --- --- --- --- ---
0 --- --- --- --- --- --- --- --- --- --- --- --- --- --- ---
YesNo
No Information ProvidedParticipants
NonparticipantsNo Information Provided
YesNo
No Information ProvidedCurrent LEP
Non-LEP (Monitored 1st Year)Non-LEP (Monitored 2nd Year)
Other Non-LEPNo Information Provided
ParticipantsNonparticipants
No Information ProvidedParticipants
NonparticipantsNo Information Provided
YesNo
No Information ProvidedParticipants
NonparticipantsNo Information Provided
YesNo
No Information ProvidedParticipants
NonparticipantsNo Information Provided
Legend
--- = No Data Reported For Fewer Than Five Students
Nu
mb
er o
f S
tud
ents
Tes
ted
Lev
el II
:S
atis
fact
ory
STAAR
# %
Nu
mb
er o
f S
tud
ents
Tes
ted
Lev
el II
:S
atis
fact
ory
STAAR L
# %
Nu
mb
er o
f S
tud
ents
Tes
ted
Lev
el II
:S
atis
fact
ory
STAAR A
# %
Nu
mb
er o
f S
tud
ents
Tes
ted
Lev
el II
:S
atis
fact
ory
Total
# %
All Students 8 1 13 0 --- --- 0 --- --- 8 1 13Male 4 --- --- 0 --- --- 0 --- --- 4 --- ---Female 4 --- --- 0 --- --- 0 --- --- 4 --- ---No Information Provided 0 --- --- 0 --- --- 0 --- --- 0 --- ---Hispanic/Latino 1 --- --- 0 --- --- 0 --- --- 1 --- ---American Indian or Alaska Native 0 --- --- 0 --- --- 0 --- --- 0 --- ---Asian 0 --- --- 0 --- --- 0 --- --- 0 --- ---Black or African American 0 --- --- 0 --- --- 0 --- --- 0 --- ---Native Hawaiian or Other Pacific Islander 0 --- --- 0 --- --- 0 --- --- 0 --- ---White 7 1 14 0 --- --- 0 --- --- 7 1 14Two or More Races 0 --- --- 0 --- --- 0 --- --- 0 --- ---No Information Provided 0 --- --- 0 --- --- 0 --- --- 0 --- ---Economically 4 --- --- 0 --- --- 0 --- --- 4 --- ---Disadvantaged 4 --- --- 0 --- --- 0 --- --- 4 --- ---
0 --- --- 0 --- --- 0 --- --- 0 --- ---Title I, Part A 1 --- --- 0 --- --- 0 --- --- 1 --- ---
7 1 14 0 --- --- 0 --- --- 7 1 140 --- --- 0 --- --- 0 --- --- 0 --- ---
Migrant 0 --- --- 0 --- --- 0 --- --- 0 --- ---8 1 13 0 --- --- 0 --- --- 8 1 130 --- --- 0 --- --- 0 --- --- 0 --- ---
Limited English 0 --- --- 0 --- --- 0 --- --- 0 --- ---Proficient 0 --- --- 0 --- --- 0 --- --- 0 --- ---
0 --- --- 0 --- --- 0 --- --- 0 --- ---8 1 13 0 --- --- 0 --- --- 8 1 130 --- --- 0 --- --- 0 --- --- 0 --- ---
Bilingual 0 --- --- 0 --- --- 0 --- --- 0 --- ---8 1 13 0 --- --- 0 --- --- 8 1 130 --- --- 0 --- --- 0 --- --- 0 --- ---
ESL 0 --- --- 0 --- --- 0 --- --- 0 --- ---8 1 13 0 --- --- 0 --- --- 8 1 130 --- --- 0 --- --- 0 --- --- 0 --- ---
Special Education 1 --- --- 0 --- --- 0 --- --- 1 --- ---7 1 14 0 --- --- 0 --- --- 7 1 140 --- --- 0 --- --- 0 --- --- 0 --- ---
Gifted/Talented 0 --- --- 0 --- --- 0 --- --- 0 --- ---8 1 13 0 --- --- 0 --- --- 8 1 130 --- --- 0 --- --- 0 --- --- 0 --- ---
At-Risk 8 1 13 0 --- --- 0 --- --- 8 1 130 --- --- 0 --- --- 0 --- --- 0 --- ---0 --- --- 0 --- --- 0 --- --- 0 --- ---
Career/Technical 4 --- --- 0 --- --- 0 --- --- 4 --- ---Education 4 --- --- 0 --- --- 0 --- --- 4 --- ---
0 --- --- 0 --- --- 0 --- --- 0 --- ---
YesNo
No Information ProvidedParticipants
NonparticipantsNo Information Provided
YesNo
No Information ProvidedCurrent LEP
Non-LEP (Monitored 1st Year)Non-LEP (Monitored 2nd Year)
Other Non-LEPNo Information Provided
ParticipantsNonparticipants
No Information ProvidedParticipants
NonparticipantsNo Information Provided
YesNo
No Information ProvidedParticipants
NonparticipantsNo Information Provided
YesNo
No Information ProvidedParticipants
NonparticipantsNo Information Provided
All Students
STATE OF TEXAS ASSESSMENTS OF ACADEMIC READINESSCombined Summary Report
ALGEBRA IDate of Testing:
District: FALL 2015Campus:
129-903 KAUFMAN ISD Report Date: 003 GARY W CAMPBELL
FALL 2015
21016-00001577-129903003
Legend
--- = No Data Reported For Fewer Than Five Students
Nu
mb
er o
f S
tud
ents
Tes
ted
Lev
el II
:S
atis
fact
ory
STAAR
# %
Nu
mb
er o
f S
tud
ents
Tes
ted
Lev
el II
:S
atis
fact
ory
STAAR L
# %
Nu
mb
er o
f S
tud
ents
Tes
ted
Lev
el II
:S
atis
fact
ory
STAAR A
# %
Nu
mb
er o
f S
tud
ents
Tes
ted
Lev
el II
:S
atis
fact
ory
Total
# %
All Students 2 --- --- 0 --- --- 0 --- --- 2 --- ---Male 1 --- --- 0 --- --- 0 --- --- 1 --- ---Female 1 --- --- 0 --- --- 0 --- --- 1 --- ---No Information Provided 0 --- --- 0 --- --- 0 --- --- 0 --- ---Hispanic/Latino 0 --- --- 0 --- --- 0 --- --- 0 --- ---American Indian or Alaska Native 0 --- --- 0 --- --- 0 --- --- 0 --- ---Asian 0 --- --- 0 --- --- 0 --- --- 0 --- ---Black or African American 0 --- --- 0 --- --- 0 --- --- 0 --- ---Native Hawaiian or Other Pacific Islander 0 --- --- 0 --- --- 0 --- --- 0 --- ---White 2 --- --- 0 --- --- 0 --- --- 2 --- ---Two or More Races 0 --- --- 0 --- --- 0 --- --- 0 --- ---No Information Provided 0 --- --- 0 --- --- 0 --- --- 0 --- ---Economically 1 --- --- 0 --- --- 0 --- --- 1 --- ---Disadvantaged 1 --- --- 0 --- --- 0 --- --- 1 --- ---
0 --- --- 0 --- --- 0 --- --- 0 --- ---Title I, Part A 0 --- --- 0 --- --- 0 --- --- 0 --- ---
2 --- --- 0 --- --- 0 --- --- 2 --- ---0 --- --- 0 --- --- 0 --- --- 0 --- ---
Migrant 0 --- --- 0 --- --- 0 --- --- 0 --- ---2 --- --- 0 --- --- 0 --- --- 2 --- ---0 --- --- 0 --- --- 0 --- --- 0 --- ---
Limited English 0 --- --- 0 --- --- 0 --- --- 0 --- ---Proficient 0 --- --- 0 --- --- 0 --- --- 0 --- ---
0 --- --- 0 --- --- 0 --- --- 0 --- ---2 --- --- 0 --- --- 0 --- --- 2 --- ---0 --- --- 0 --- --- 0 --- --- 0 --- ---
Bilingual 0 --- --- 0 --- --- 0 --- --- 0 --- ---2 --- --- 0 --- --- 0 --- --- 2 --- ---0 --- --- 0 --- --- 0 --- --- 0 --- ---
ESL 0 --- --- 0 --- --- 0 --- --- 0 --- ---2 --- --- 0 --- --- 0 --- --- 2 --- ---0 --- --- 0 --- --- 0 --- --- 0 --- ---
Special Education 0 --- --- 0 --- --- 0 --- --- 0 --- ---2 --- --- 0 --- --- 0 --- --- 2 --- ---0 --- --- 0 --- --- 0 --- --- 0 --- ---
Gifted/Talented 0 --- --- 0 --- --- 0 --- --- 0 --- ---2 --- --- 0 --- --- 0 --- --- 2 --- ---0 --- --- 0 --- --- 0 --- --- 0 --- ---
At-Risk 2 --- --- 0 --- --- 0 --- --- 2 --- ---0 --- --- 0 --- --- 0 --- --- 0 --- ---0 --- --- 0 --- --- 0 --- --- 0 --- ---
Career/Technical 0 --- --- 0 --- --- 0 --- --- 0 --- ---Education 2 --- --- 0 --- --- 0 --- --- 2 --- ---
0 --- --- 0 --- --- 0 --- --- 0 --- ---
YesNo
No Information ProvidedParticipants
NonparticipantsNo Information Provided
YesNo
No Information ProvidedCurrent LEP
Non-LEP (Monitored 1st Year)Non-LEP (Monitored 2nd Year)
Other Non-LEPNo Information Provided
ParticipantsNonparticipants
No Information ProvidedParticipants
NonparticipantsNo Information Provided
YesNo
No Information ProvidedParticipants
NonparticipantsNo Information Provided
YesNo
No Information ProvidedParticipants
NonparticipantsNo Information Provided
First-Time Tested Students
STATE OF TEXAS ASSESSMENTS OF ACADEMIC READINESSCombined Summary Report
ALGEBRA IDate of Testing:
District: FALL 2015Campus:
129-903 KAUFMAN ISD Report Date: 003 GARY W CAMPBELL
FALL 2015
21016-00001577-129903003
Legend
--- = No Data Reported For Fewer Than Five Students
Nu
mb
er o
f S
tud
ents
Tes
ted
Lev
el II
:S
atis
fact
ory
STAAR
# %
Nu
mb
er o
f S
tud
ents
Tes
ted
Lev
el II
:S
atis
fact
ory
STAAR L
# %
Nu
mb
er o
f S
tud
ents
Tes
ted
Lev
el II
:S
atis
fact
ory
STAAR A
# %
Nu
mb
er o
f S
tud
ents
Tes
ted
Lev
el II
:S
atis
fact
ory
Total
# %
All Students 6 0 0 0 --- --- 0 --- --- 6 0 0Male 3 --- --- 0 --- --- 0 --- --- 3 --- ---Female 3 --- --- 0 --- --- 0 --- --- 3 --- ---No Information Provided 0 --- --- 0 --- --- 0 --- --- 0 --- ---Hispanic/Latino 1 --- --- 0 --- --- 0 --- --- 1 --- ---American Indian or Alaska Native 0 --- --- 0 --- --- 0 --- --- 0 --- ---Asian 0 --- --- 0 --- --- 0 --- --- 0 --- ---Black or African American 0 --- --- 0 --- --- 0 --- --- 0 --- ---Native Hawaiian or Other Pacific Islander 0 --- --- 0 --- --- 0 --- --- 0 --- ---White 5 0 0 0 --- --- 0 --- --- 5 0 0Two or More Races 0 --- --- 0 --- --- 0 --- --- 0 --- ---No Information Provided 0 --- --- 0 --- --- 0 --- --- 0 --- ---Economically 3 --- --- 0 --- --- 0 --- --- 3 --- ---Disadvantaged 3 --- --- 0 --- --- 0 --- --- 3 --- ---
0 --- --- 0 --- --- 0 --- --- 0 --- ---Title I, Part A 1 --- --- 0 --- --- 0 --- --- 1 --- ---
5 0 0 0 --- --- 0 --- --- 5 0 00 --- --- 0 --- --- 0 --- --- 0 --- ---
Migrant 0 --- --- 0 --- --- 0 --- --- 0 --- ---6 0 0 0 --- --- 0 --- --- 6 0 00 --- --- 0 --- --- 0 --- --- 0 --- ---
Limited English 0 --- --- 0 --- --- 0 --- --- 0 --- ---Proficient 0 --- --- 0 --- --- 0 --- --- 0 --- ---
0 --- --- 0 --- --- 0 --- --- 0 --- ---6 0 0 0 --- --- 0 --- --- 6 0 00 --- --- 0 --- --- 0 --- --- 0 --- ---
Bilingual 0 --- --- 0 --- --- 0 --- --- 0 --- ---6 0 0 0 --- --- 0 --- --- 6 0 00 --- --- 0 --- --- 0 --- --- 0 --- ---
ESL 0 --- --- 0 --- --- 0 --- --- 0 --- ---6 0 0 0 --- --- 0 --- --- 6 0 00 --- --- 0 --- --- 0 --- --- 0 --- ---
Special Education 1 --- --- 0 --- --- 0 --- --- 1 --- ---5 0 0 0 --- --- 0 --- --- 5 0 00 --- --- 0 --- --- 0 --- --- 0 --- ---
Gifted/Talented 0 --- --- 0 --- --- 0 --- --- 0 --- ---6 0 0 0 --- --- 0 --- --- 6 0 00 --- --- 0 --- --- 0 --- --- 0 --- ---
At-Risk 6 0 0 0 --- --- 0 --- --- 6 0 00 --- --- 0 --- --- 0 --- --- 0 --- ---0 --- --- 0 --- --- 0 --- --- 0 --- ---
Career/Technical 4 --- --- 0 --- --- 0 --- --- 4 --- ---Education 2 --- --- 0 --- --- 0 --- --- 2 --- ---
0 --- --- 0 --- --- 0 --- --- 0 --- ---
YesNo
No Information ProvidedParticipants
NonparticipantsNo Information Provided
YesNo
No Information ProvidedCurrent LEP
Non-LEP (Monitored 1st Year)Non-LEP (Monitored 2nd Year)
Other Non-LEPNo Information Provided
ParticipantsNonparticipants
No Information ProvidedParticipants
NonparticipantsNo Information Provided
YesNo
No Information ProvidedParticipants
NonparticipantsNo Information Provided
YesNo
No Information ProvidedParticipants
NonparticipantsNo Information Provided
Retested Students
STATE OF TEXAS ASSESSMENTS OF ACADEMIC READINESSCombined Summary Report
ALGEBRA IDate of Testing:
District: FALL 2015Campus:
129-903 KAUFMAN ISD Report Date: 003 GARY W CAMPBELL
FALL 2015
21016-00001577-129903003
Legend
--- = No Data Reported For Fewer Than Five Students
Nu
mb
er o
f S
tud
ents
Tes
ted
Lev
el II
:S
atis
fact
ory
STAAR
# %
Nu
mb
er o
f S
tud
ents
Tes
ted
Lev
el II
:S
atis
fact
ory
STAAR L
# %
Nu
mb
er o
f S
tud
ents
Tes
ted
Lev
el II
:S
atis
fact
ory
STAAR A
# %
Nu
mb
er o
f S
tud
ents
Tes
ted
Lev
el II
:S
atis
fact
ory
Total
# %
All Students 3 --- --- 0 --- --- 0 --- --- 3 --- ---Male 2 --- --- 0 --- --- 0 --- --- 2 --- ---Female 1 --- --- 0 --- --- 0 --- --- 1 --- ---No Information Provided 0 --- --- 0 --- --- 0 --- --- 0 --- ---Hispanic/Latino 1 --- --- 0 --- --- 0 --- --- 1 --- ---American Indian or Alaska Native 0 --- --- 0 --- --- 0 --- --- 0 --- ---Asian 0 --- --- 0 --- --- 0 --- --- 0 --- ---Black or African American 0 --- --- 0 --- --- 0 --- --- 0 --- ---Native Hawaiian or Other Pacific Islander 0 --- --- 0 --- --- 0 --- --- 0 --- ---White 2 --- --- 0 --- --- 0 --- --- 2 --- ---Two or More Races 0 --- --- 0 --- --- 0 --- --- 0 --- ---No Information Provided 0 --- --- 0 --- --- 0 --- --- 0 --- ---Economically 1 --- --- 0 --- --- 0 --- --- 1 --- ---Disadvantaged 2 --- --- 0 --- --- 0 --- --- 2 --- ---
0 --- --- 0 --- --- 0 --- --- 0 --- ---Title I, Part A 0 --- --- 0 --- --- 0 --- --- 0 --- ---
3 --- --- 0 --- --- 0 --- --- 3 --- ---0 --- --- 0 --- --- 0 --- --- 0 --- ---
Migrant 0 --- --- 0 --- --- 0 --- --- 0 --- ---3 --- --- 0 --- --- 0 --- --- 3 --- ---0 --- --- 0 --- --- 0 --- --- 0 --- ---
Limited English 0 --- --- 0 --- --- 0 --- --- 0 --- ---Proficient 0 --- --- 0 --- --- 0 --- --- 0 --- ---
0 --- --- 0 --- --- 0 --- --- 0 --- ---3 --- --- 0 --- --- 0 --- --- 3 --- ---0 --- --- 0 --- --- 0 --- --- 0 --- ---
Bilingual 0 --- --- 0 --- --- 0 --- --- 0 --- ---3 --- --- 0 --- --- 0 --- --- 3 --- ---0 --- --- 0 --- --- 0 --- --- 0 --- ---
ESL 0 --- --- 0 --- --- 0 --- --- 0 --- ---3 --- --- 0 --- --- 0 --- --- 3 --- ---0 --- --- 0 --- --- 0 --- --- 0 --- ---
Special Education 0 --- --- 0 --- --- 0 --- --- 0 --- ---3 --- --- 0 --- --- 0 --- --- 3 --- ---0 --- --- 0 --- --- 0 --- --- 0 --- ---
Gifted/Talented 0 --- --- 0 --- --- 0 --- --- 0 --- ---3 --- --- 0 --- --- 0 --- --- 3 --- ---0 --- --- 0 --- --- 0 --- --- 0 --- ---
At-Risk 2 --- --- 0 --- --- 0 --- --- 2 --- ---1 --- --- 0 --- --- 0 --- --- 1 --- ---0 --- --- 0 --- --- 0 --- --- 0 --- ---
Career/Technical 1 --- --- 0 --- --- 0 --- --- 1 --- ---Education 2 --- --- 0 --- --- 0 --- --- 2 --- ---
0 --- --- 0 --- --- 0 --- --- 0 --- ---
YesNo
No Information ProvidedParticipants
NonparticipantsNo Information Provided
YesNo
No Information ProvidedCurrent LEP
Non-LEP (Monitored 1st Year)Non-LEP (Monitored 2nd Year)
Other Non-LEPNo Information Provided
ParticipantsNonparticipants
No Information ProvidedParticipants
NonparticipantsNo Information Provided
YesNo
No Information ProvidedParticipants
NonparticipantsNo Information Provided
YesNo
No Information ProvidedParticipants
NonparticipantsNo Information Provided
All Students
STATE OF TEXAS ASSESSMENTS OF ACADEMIC READINESSCombined Summary Report
BIOLOGYDate of Testing:
District: FALL 2015Campus:
129-903 KAUFMAN ISD Report Date: 003 GARY W CAMPBELL
FALL 2015
21016-00001577-129903003
Legend
--- = No Data Reported For Fewer Than Five Students
Nu
mb
er o
f S
tud
ents
Tes
ted
Lev
el II
:S
atis
fact
ory
STAAR
# %
Nu
mb
er o
f S
tud
ents
Tes
ted
Lev
el II
:S
atis
fact
ory
STAAR L
# %
Nu
mb
er o
f S
tud
ents
Tes
ted
Lev
el II
:S
atis
fact
ory
STAAR A
# %
Nu
mb
er o
f S
tud
ents
Tes
ted
Lev
el II
:S
atis
fact
ory
Total
# %
All Students 3 --- --- 0 --- --- 0 --- --- 3 --- ---Male 2 --- --- 0 --- --- 0 --- --- 2 --- ---Female 1 --- --- 0 --- --- 0 --- --- 1 --- ---No Information Provided 0 --- --- 0 --- --- 0 --- --- 0 --- ---Hispanic/Latino 1 --- --- 0 --- --- 0 --- --- 1 --- ---American Indian or Alaska Native 0 --- --- 0 --- --- 0 --- --- 0 --- ---Asian 0 --- --- 0 --- --- 0 --- --- 0 --- ---Black or African American 0 --- --- 0 --- --- 0 --- --- 0 --- ---Native Hawaiian or Other Pacific Islander 0 --- --- 0 --- --- 0 --- --- 0 --- ---White 2 --- --- 0 --- --- 0 --- --- 2 --- ---Two or More Races 0 --- --- 0 --- --- 0 --- --- 0 --- ---No Information Provided 0 --- --- 0 --- --- 0 --- --- 0 --- ---Economically 1 --- --- 0 --- --- 0 --- --- 1 --- ---Disadvantaged 2 --- --- 0 --- --- 0 --- --- 2 --- ---
0 --- --- 0 --- --- 0 --- --- 0 --- ---Title I, Part A 0 --- --- 0 --- --- 0 --- --- 0 --- ---
3 --- --- 0 --- --- 0 --- --- 3 --- ---0 --- --- 0 --- --- 0 --- --- 0 --- ---
Migrant 0 --- --- 0 --- --- 0 --- --- 0 --- ---3 --- --- 0 --- --- 0 --- --- 3 --- ---0 --- --- 0 --- --- 0 --- --- 0 --- ---
Limited English 0 --- --- 0 --- --- 0 --- --- 0 --- ---Proficient 0 --- --- 0 --- --- 0 --- --- 0 --- ---
0 --- --- 0 --- --- 0 --- --- 0 --- ---3 --- --- 0 --- --- 0 --- --- 3 --- ---0 --- --- 0 --- --- 0 --- --- 0 --- ---
Bilingual 0 --- --- 0 --- --- 0 --- --- 0 --- ---3 --- --- 0 --- --- 0 --- --- 3 --- ---0 --- --- 0 --- --- 0 --- --- 0 --- ---
ESL 0 --- --- 0 --- --- 0 --- --- 0 --- ---3 --- --- 0 --- --- 0 --- --- 3 --- ---0 --- --- 0 --- --- 0 --- --- 0 --- ---
Special Education 0 --- --- 0 --- --- 0 --- --- 0 --- ---3 --- --- 0 --- --- 0 --- --- 3 --- ---0 --- --- 0 --- --- 0 --- --- 0 --- ---
Gifted/Talented 0 --- --- 0 --- --- 0 --- --- 0 --- ---3 --- --- 0 --- --- 0 --- --- 3 --- ---0 --- --- 0 --- --- 0 --- --- 0 --- ---
At-Risk 2 --- --- 0 --- --- 0 --- --- 2 --- ---1 --- --- 0 --- --- 0 --- --- 1 --- ---0 --- --- 0 --- --- 0 --- --- 0 --- ---
Career/Technical 1 --- --- 0 --- --- 0 --- --- 1 --- ---Education 2 --- --- 0 --- --- 0 --- --- 2 --- ---
0 --- --- 0 --- --- 0 --- --- 0 --- ---
YesNo
No Information ProvidedParticipants
NonparticipantsNo Information Provided
YesNo
No Information ProvidedCurrent LEP
Non-LEP (Monitored 1st Year)Non-LEP (Monitored 2nd Year)
Other Non-LEPNo Information Provided
ParticipantsNonparticipants
No Information ProvidedParticipants
NonparticipantsNo Information Provided
YesNo
No Information ProvidedParticipants
NonparticipantsNo Information Provided
YesNo
No Information ProvidedParticipants
NonparticipantsNo Information Provided
First-Time Tested Students
STATE OF TEXAS ASSESSMENTS OF ACADEMIC READINESSCombined Summary Report
BIOLOGYDate of Testing:
District: FALL 2015Campus:
129-903 KAUFMAN ISD Report Date: 003 GARY W CAMPBELL
FALL 2015
21016-00001577-129903003
Legend
--- = No Data Reported For Fewer Than Five Students
Nu
mb
er o
f S
tud
ents
Tes
ted
Lev
el II
:S
atis
fact
ory
STAAR
# %
Nu
mb
er o
f S
tud
ents
Tes
ted
Lev
el II
:S
atis
fact
ory
STAAR A
# %
Nu
mb
er o
f S
tud
ents
Tes
ted
Lev
el II
:S
atis
fact
ory
Total
# %
All Students 10 6 60 0 --- --- 10 6 60Male 5 3 60 0 --- --- 5 3 60Female 5 3 60 0 --- --- 5 3 60No Information Provided 0 --- --- 0 --- --- 0 --- ---Hispanic/Latino 2 --- --- 0 --- --- 2 --- ---American Indian or Alaska Native 0 --- --- 0 --- --- 0 --- ---Asian 0 --- --- 0 --- --- 0 --- ---Black or African American 0 --- --- 0 --- --- 0 --- ---Native Hawaiian or Other Pacific Islander 0 --- --- 0 --- --- 0 --- ---White 8 5 63 0 --- --- 8 5 63Two or More Races 0 --- --- 0 --- --- 0 --- ---No Information Provided 0 --- --- 0 --- --- 0 --- ---Economically 5 3 60 0 --- --- 5 3 60Disadvantaged 5 3 60 0 --- --- 5 3 60
0 --- --- 0 --- --- 0 --- ---Title I, Part A 1 --- --- 0 --- --- 1 --- ---
9 6 67 0 --- --- 9 6 670 --- --- 0 --- --- 0 --- ---
Migrant 0 --- --- 0 --- --- 0 --- ---10 6 60 0 --- --- 10 6 600 --- --- 0 --- --- 0 --- ---
Limited English 0 --- --- 0 --- --- 0 --- ---Proficient 0 --- --- 0 --- --- 0 --- ---
0 --- --- 0 --- --- 0 --- ---10 6 60 0 --- --- 10 6 600 --- --- 0 --- --- 0 --- ---
Bilingual 0 --- --- 0 --- --- 0 --- ---10 6 60 0 --- --- 10 6 600 --- --- 0 --- --- 0 --- ---
ESL 0 --- --- 0 --- --- 0 --- ---10 6 60 0 --- --- 10 6 600 --- --- 0 --- --- 0 --- ---
Special Education 1 --- --- 0 --- --- 1 --- ---9 6 67 0 --- --- 9 6 670 --- --- 0 --- --- 0 --- ---
Gifted/Talented 0 --- --- 0 --- --- 0 --- ---10 6 60 0 --- --- 10 6 600 --- --- 0 --- --- 0 --- ---
At-Risk 8 5 63 0 --- --- 8 5 632 --- --- 0 --- --- 2 --- ---0 --- --- 0 --- --- 0 --- ---
Career/Technical 3 --- --- 0 --- --- 3 --- ---Education 7 5 71 0 --- --- 7 5 71
0 --- --- 0 --- --- 0 --- ---
YesNo
No Information ProvidedParticipants
NonparticipantsNo Information Provided
YesNo
No Information ProvidedCurrent LEP
Non-LEP (Monitored 1st Year)Non-LEP (Monitored 2nd Year)
Other Non-LEPNo Information Provided
ParticipantsNonparticipants
No Information ProvidedParticipants
NonparticipantsNo Information Provided
YesNo
No Information ProvidedParticipants
NonparticipantsNo Information Provided
YesNo
No Information ProvidedParticipants
NonparticipantsNo Information Provided
All Students
STATE OF TEXAS ASSESSMENTS OF ACADEMIC READINESSCombined Summary Report
ENGLISH IDate of Testing:
District: FALL 2015Campus:
129-903 KAUFMAN ISD Report Date: 003 GARY W CAMPBELL
FALL 2015
21016-00001577-129903003
Legend
--- = No Data Reported For Fewer Than Five Students
Nu
mb
er o
f S
tud
ents
Tes
ted
Lev
el II
:S
atis
fact
ory
STAAR
# %
Nu
mb
er o
f S
tud
ents
Tes
ted
Lev
el II
:S
atis
fact
ory
STAAR A
# %
Nu
mb
er o
f S
tud
ents
Tes
ted
Lev
el II
:S
atis
fact
ory
Total
# %
All Students 1 --- --- 0 --- --- 1 --- ---Male 0 --- --- 0 --- --- 0 --- ---Female 1 --- --- 0 --- --- 1 --- ---No Information Provided 0 --- --- 0 --- --- 0 --- ---Hispanic/Latino 0 --- --- 0 --- --- 0 --- ---American Indian or Alaska Native 0 --- --- 0 --- --- 0 --- ---Asian 0 --- --- 0 --- --- 0 --- ---Black or African American 0 --- --- 0 --- --- 0 --- ---Native Hawaiian or Other Pacific Islander 0 --- --- 0 --- --- 0 --- ---White 1 --- --- 0 --- --- 1 --- ---Two or More Races 0 --- --- 0 --- --- 0 --- ---No Information Provided 0 --- --- 0 --- --- 0 --- ---Economically 0 --- --- 0 --- --- 0 --- ---Disadvantaged 1 --- --- 0 --- --- 1 --- ---
0 --- --- 0 --- --- 0 --- ---Title I, Part A 0 --- --- 0 --- --- 0 --- ---
1 --- --- 0 --- --- 1 --- ---0 --- --- 0 --- --- 0 --- ---
Migrant 0 --- --- 0 --- --- 0 --- ---1 --- --- 0 --- --- 1 --- ---0 --- --- 0 --- --- 0 --- ---
Limited English 0 --- --- 0 --- --- 0 --- ---Proficient 0 --- --- 0 --- --- 0 --- ---
0 --- --- 0 --- --- 0 --- ---1 --- --- 0 --- --- 1 --- ---0 --- --- 0 --- --- 0 --- ---
Bilingual 0 --- --- 0 --- --- 0 --- ---1 --- --- 0 --- --- 1 --- ---0 --- --- 0 --- --- 0 --- ---
ESL 0 --- --- 0 --- --- 0 --- ---1 --- --- 0 --- --- 1 --- ---0 --- --- 0 --- --- 0 --- ---
Special Education 0 --- --- 0 --- --- 0 --- ---1 --- --- 0 --- --- 1 --- ---0 --- --- 0 --- --- 0 --- ---
Gifted/Talented 0 --- --- 0 --- --- 0 --- ---1 --- --- 0 --- --- 1 --- ---0 --- --- 0 --- --- 0 --- ---
At-Risk 1 --- --- 0 --- --- 1 --- ---0 --- --- 0 --- --- 0 --- ---0 --- --- 0 --- --- 0 --- ---
Career/Technical 0 --- --- 0 --- --- 0 --- ---Education 1 --- --- 0 --- --- 1 --- ---
0 --- --- 0 --- --- 0 --- ---
YesNo
No Information ProvidedParticipants
NonparticipantsNo Information Provided
YesNo
No Information ProvidedCurrent LEP
Non-LEP (Monitored 1st Year)Non-LEP (Monitored 2nd Year)
Other Non-LEPNo Information Provided
ParticipantsNonparticipants
No Information ProvidedParticipants
NonparticipantsNo Information Provided
YesNo
No Information ProvidedParticipants
NonparticipantsNo Information Provided
YesNo
No Information ProvidedParticipants
NonparticipantsNo Information Provided
First-Time Tested Students
STATE OF TEXAS ASSESSMENTS OF ACADEMIC READINESSCombined Summary Report
ENGLISH IDate of Testing:
District: FALL 2015Campus:
129-903 KAUFMAN ISD Report Date: 003 GARY W CAMPBELL
FALL 2015
21016-00001577-129903003
Legend
--- = No Data Reported For Fewer Than Five Students
Nu
mb
er o
f S
tud
ents
Tes
ted
Lev
el II
:S
atis
fact
ory
STAAR
# %
Nu
mb
er o
f S
tud
ents
Tes
ted
Lev
el II
:S
atis
fact
ory
STAAR A
# %
Nu
mb
er o
f S
tud
ents
Tes
ted
Lev
el II
:S
atis
fact
ory
Total
# %
All Students 9 5 56 0 --- --- 9 5 56Male 5 3 60 0 --- --- 5 3 60Female 4 --- --- 0 --- --- 4 --- ---No Information Provided 0 --- --- 0 --- --- 0 --- ---Hispanic/Latino 2 --- --- 0 --- --- 2 --- ---American Indian or Alaska Native 0 --- --- 0 --- --- 0 --- ---Asian 0 --- --- 0 --- --- 0 --- ---Black or African American 0 --- --- 0 --- --- 0 --- ---Native Hawaiian or Other Pacific Islander 0 --- --- 0 --- --- 0 --- ---White 7 4 57 0 --- --- 7 4 57Two or More Races 0 --- --- 0 --- --- 0 --- ---No Information Provided 0 --- --- 0 --- --- 0 --- ---Economically 5 3 60 0 --- --- 5 3 60Disadvantaged 4 --- --- 0 --- --- 4 --- ---
0 --- --- 0 --- --- 0 --- ---Title I, Part A 1 --- --- 0 --- --- 1 --- ---
8 5 63 0 --- --- 8 5 630 --- --- 0 --- --- 0 --- ---
Migrant 0 --- --- 0 --- --- 0 --- ---9 5 56 0 --- --- 9 5 560 --- --- 0 --- --- 0 --- ---
Limited English 0 --- --- 0 --- --- 0 --- ---Proficient 0 --- --- 0 --- --- 0 --- ---
0 --- --- 0 --- --- 0 --- ---9 5 56 0 --- --- 9 5 560 --- --- 0 --- --- 0 --- ---
Bilingual 0 --- --- 0 --- --- 0 --- ---9 5 56 0 --- --- 9 5 560 --- --- 0 --- --- 0 --- ---
ESL 0 --- --- 0 --- --- 0 --- ---9 5 56 0 --- --- 9 5 560 --- --- 0 --- --- 0 --- ---
Special Education 1 --- --- 0 --- --- 1 --- ---8 5 63 0 --- --- 8 5 630 --- --- 0 --- --- 0 --- ---
Gifted/Talented 0 --- --- 0 --- --- 0 --- ---9 5 56 0 --- --- 9 5 560 --- --- 0 --- --- 0 --- ---
At-Risk 7 4 57 0 --- --- 7 4 572 --- --- 0 --- --- 2 --- ---0 --- --- 0 --- --- 0 --- ---
Career/Technical 3 --- --- 0 --- --- 3 --- ---Education 6 4 67 0 --- --- 6 4 67
0 --- --- 0 --- --- 0 --- ---
YesNo
No Information ProvidedParticipants
NonparticipantsNo Information Provided
YesNo
No Information ProvidedCurrent LEP
Non-LEP (Monitored 1st Year)Non-LEP (Monitored 2nd Year)
Other Non-LEPNo Information Provided
ParticipantsNonparticipants
No Information ProvidedParticipants
NonparticipantsNo Information Provided
YesNo
No Information ProvidedParticipants
NonparticipantsNo Information Provided
YesNo
No Information ProvidedParticipants
NonparticipantsNo Information Provided
Retested Students
STATE OF TEXAS ASSESSMENTS OF ACADEMIC READINESSCombined Summary Report
ENGLISH IDate of Testing:
District: FALL 2015Campus:
129-903 KAUFMAN ISD Report Date: 003 GARY W CAMPBELL
FALL 2015
21016-00001577-129903003
Legend
--- = No Data Reported For Fewer Than Five Students
Nu
mb
er o
f S
tud
ents
Tes
ted
Lev
el II
:S
atis
fact
ory
STAAR
# %
Nu
mb
er o
f S
tud
ents
Tes
ted
Lev
el II
:S
atis
fact
ory
STAAR A
# %
Nu
mb
er o
f S
tud
ents
Tes
ted
Lev
el II
:S
atis
fact
ory
Total
# %
All Students 10 4 40 0 --- --- 10 4 40Male 5 1 20 0 --- --- 5 1 20Female 5 3 60 0 --- --- 5 3 60No Information Provided 0 --- --- 0 --- --- 0 --- ---Hispanic/Latino 3 --- --- 0 --- --- 3 --- ---American Indian or Alaska Native 0 --- --- 0 --- --- 0 --- ---Asian 0 --- --- 0 --- --- 0 --- ---Black or African American 0 --- --- 0 --- --- 0 --- ---Native Hawaiian or Other Pacific Islander 0 --- --- 0 --- --- 0 --- ---White 7 2 29 0 --- --- 7 2 29Two or More Races 0 --- --- 0 --- --- 0 --- ---No Information Provided 0 --- --- 0 --- --- 0 --- ---Economically 5 3 60 0 --- --- 5 3 60Disadvantaged 5 1 20 0 --- --- 5 1 20
0 --- --- 0 --- --- 0 --- ---Title I, Part A 0 --- --- 0 --- --- 0 --- ---
10 4 40 0 --- --- 10 4 400 --- --- 0 --- --- 0 --- ---
Migrant 0 --- --- 0 --- --- 0 --- ---10 4 40 0 --- --- 10 4 400 --- --- 0 --- --- 0 --- ---
Limited English 0 --- --- 0 --- --- 0 --- ---Proficient 0 --- --- 0 --- --- 0 --- ---
0 --- --- 0 --- --- 0 --- ---10 4 40 0 --- --- 10 4 400 --- --- 0 --- --- 0 --- ---
Bilingual 0 --- --- 0 --- --- 0 --- ---10 4 40 0 --- --- 10 4 400 --- --- 0 --- --- 0 --- ---
ESL 0 --- --- 0 --- --- 0 --- ---10 4 40 0 --- --- 10 4 400 --- --- 0 --- --- 0 --- ---
Special Education 0 --- --- 0 --- --- 0 --- ---10 4 40 0 --- --- 10 4 400 --- --- 0 --- --- 0 --- ---
Gifted/Talented 0 --- --- 0 --- --- 0 --- ---10 4 40 0 --- --- 10 4 400 --- --- 0 --- --- 0 --- ---
At-Risk 4 --- --- 0 --- --- 4 --- ---6 3 50 0 --- --- 6 3 500 --- --- 0 --- --- 0 --- ---
Career/Technical 3 --- --- 0 --- --- 3 --- ---Education 7 3 43 0 --- --- 7 3 43
0 --- --- 0 --- --- 0 --- ---
YesNo
No Information ProvidedParticipants
NonparticipantsNo Information Provided
YesNo
No Information ProvidedCurrent LEP
Non-LEP (Monitored 1st Year)Non-LEP (Monitored 2nd Year)
Other Non-LEPNo Information Provided
ParticipantsNonparticipants
No Information ProvidedParticipants
NonparticipantsNo Information Provided
YesNo
No Information ProvidedParticipants
NonparticipantsNo Information Provided
YesNo
No Information ProvidedParticipants
NonparticipantsNo Information Provided
All Students
STATE OF TEXAS ASSESSMENTS OF ACADEMIC READINESSCombined Summary Report
ENGLISH IIDate of Testing:
District: FALL 2015Campus:
129-903 KAUFMAN ISD Report Date: 003 GARY W CAMPBELL
FALL 2015
21016-00001577-129903003
Legend
--- = No Data Reported For Fewer Than Five Students
Nu
mb
er o
f S
tud
ents
Tes
ted
Lev
el II
:S
atis
fact
ory
STAAR
# %
Nu
mb
er o
f S
tud
ents
Tes
ted
Lev
el II
:S
atis
fact
ory
STAAR A
# %
Nu
mb
er o
f S
tud
ents
Tes
ted
Lev
el II
:S
atis
fact
ory
Total
# %
All Students 5 1 20 0 --- --- 5 1 20Male 2 --- --- 0 --- --- 2 --- ---Female 3 --- --- 0 --- --- 3 --- ---No Information Provided 0 --- --- 0 --- --- 0 --- ---Hispanic/Latino 2 --- --- 0 --- --- 2 --- ---American Indian or Alaska Native 0 --- --- 0 --- --- 0 --- ---Asian 0 --- --- 0 --- --- 0 --- ---Black or African American 0 --- --- 0 --- --- 0 --- ---Native Hawaiian or Other Pacific Islander 0 --- --- 0 --- --- 0 --- ---White 3 --- --- 0 --- --- 3 --- ---Two or More Races 0 --- --- 0 --- --- 0 --- ---No Information Provided 0 --- --- 0 --- --- 0 --- ---Economically 2 --- --- 0 --- --- 2 --- ---Disadvantaged 3 --- --- 0 --- --- 3 --- ---
0 --- --- 0 --- --- 0 --- ---Title I, Part A 0 --- --- 0 --- --- 0 --- ---
5 1 20 0 --- --- 5 1 200 --- --- 0 --- --- 0 --- ---
Migrant 0 --- --- 0 --- --- 0 --- ---5 1 20 0 --- --- 5 1 200 --- --- 0 --- --- 0 --- ---
Limited English 0 --- --- 0 --- --- 0 --- ---Proficient 0 --- --- 0 --- --- 0 --- ---
0 --- --- 0 --- --- 0 --- ---5 1 20 0 --- --- 5 1 200 --- --- 0 --- --- 0 --- ---
Bilingual 0 --- --- 0 --- --- 0 --- ---5 1 20 0 --- --- 5 1 200 --- --- 0 --- --- 0 --- ---
ESL 0 --- --- 0 --- --- 0 --- ---5 1 20 0 --- --- 5 1 200 --- --- 0 --- --- 0 --- ---
Special Education 0 --- --- 0 --- --- 0 --- ---5 1 20 0 --- --- 5 1 200 --- --- 0 --- --- 0 --- ---
Gifted/Talented 0 --- --- 0 --- --- 0 --- ---5 1 20 0 --- --- 5 1 200 --- --- 0 --- --- 0 --- ---
At-Risk 3 --- --- 0 --- --- 3 --- ---2 --- --- 0 --- --- 2 --- ---0 --- --- 0 --- --- 0 --- ---
Career/Technical 2 --- --- 0 --- --- 2 --- ---Education 3 --- --- 0 --- --- 3 --- ---
0 --- --- 0 --- --- 0 --- ---
YesNo
No Information ProvidedParticipants
NonparticipantsNo Information Provided
YesNo
No Information ProvidedCurrent LEP
Non-LEP (Monitored 1st Year)Non-LEP (Monitored 2nd Year)
Other Non-LEPNo Information Provided
ParticipantsNonparticipants
No Information ProvidedParticipants
NonparticipantsNo Information Provided
YesNo
No Information ProvidedParticipants
NonparticipantsNo Information Provided
YesNo
No Information ProvidedParticipants
NonparticipantsNo Information Provided
First-Time Tested Students
STATE OF TEXAS ASSESSMENTS OF ACADEMIC READINESSCombined Summary Report
ENGLISH IIDate of Testing:
District: FALL 2015Campus:
129-903 KAUFMAN ISD Report Date: 003 GARY W CAMPBELL
FALL 2015
21016-00001577-129903003
Legend
--- = No Data Reported For Fewer Than Five Students
Nu
mb
er o
f S
tud
ents
Tes
ted
Lev
el II
:S
atis
fact
ory
STAAR
# %
Nu
mb
er o
f S
tud
ents
Tes
ted
Lev
el II
:S
atis
fact
ory
STAAR A
# %
Nu
mb
er o
f S
tud
ents
Tes
ted
Lev
el II
:S
atis
fact
ory
Total
# %
All Students 5 3 60 0 --- --- 5 3 60Male 3 --- --- 0 --- --- 3 --- ---Female 2 --- --- 0 --- --- 2 --- ---No Information Provided 0 --- --- 0 --- --- 0 --- ---Hispanic/Latino 1 --- --- 0 --- --- 1 --- ---American Indian or Alaska Native 0 --- --- 0 --- --- 0 --- ---Asian 0 --- --- 0 --- --- 0 --- ---Black or African American 0 --- --- 0 --- --- 0 --- ---Native Hawaiian or Other Pacific Islander 0 --- --- 0 --- --- 0 --- ---White 4 --- --- 0 --- --- 4 --- ---Two or More Races 0 --- --- 0 --- --- 0 --- ---No Information Provided 0 --- --- 0 --- --- 0 --- ---Economically 3 --- --- 0 --- --- 3 --- ---Disadvantaged 2 --- --- 0 --- --- 2 --- ---
0 --- --- 0 --- --- 0 --- ---Title I, Part A 0 --- --- 0 --- --- 0 --- ---
5 3 60 0 --- --- 5 3 600 --- --- 0 --- --- 0 --- ---
Migrant 0 --- --- 0 --- --- 0 --- ---5 3 60 0 --- --- 5 3 600 --- --- 0 --- --- 0 --- ---
Limited English 0 --- --- 0 --- --- 0 --- ---Proficient 0 --- --- 0 --- --- 0 --- ---
0 --- --- 0 --- --- 0 --- ---5 3 60 0 --- --- 5 3 600 --- --- 0 --- --- 0 --- ---
Bilingual 0 --- --- 0 --- --- 0 --- ---5 3 60 0 --- --- 5 3 600 --- --- 0 --- --- 0 --- ---
ESL 0 --- --- 0 --- --- 0 --- ---5 3 60 0 --- --- 5 3 600 --- --- 0 --- --- 0 --- ---
Special Education 0 --- --- 0 --- --- 0 --- ---5 3 60 0 --- --- 5 3 600 --- --- 0 --- --- 0 --- ---
Gifted/Talented 0 --- --- 0 --- --- 0 --- ---5 3 60 0 --- --- 5 3 600 --- --- 0 --- --- 0 --- ---
At-Risk 1 --- --- 0 --- --- 1 --- ---4 --- --- 0 --- --- 4 --- ---0 --- --- 0 --- --- 0 --- ---
Career/Technical 1 --- --- 0 --- --- 1 --- ---Education 4 --- --- 0 --- --- 4 --- ---
0 --- --- 0 --- --- 0 --- ---
YesNo
No Information ProvidedParticipants
NonparticipantsNo Information Provided
YesNo
No Information ProvidedCurrent LEP
Non-LEP (Monitored 1st Year)Non-LEP (Monitored 2nd Year)
Other Non-LEPNo Information Provided
ParticipantsNonparticipants
No Information ProvidedParticipants
NonparticipantsNo Information Provided
YesNo
No Information ProvidedParticipants
NonparticipantsNo Information Provided
YesNo
No Information ProvidedParticipants
NonparticipantsNo Information Provided
Retested Students
STATE OF TEXAS ASSESSMENTS OF ACADEMIC READINESSCombined Summary Report
ENGLISH IIDate of Testing:
District: FALL 2015Campus:
129-903 KAUFMAN ISD Report Date: 003 GARY W CAMPBELL
FALL 2015
21016-00001577-129903003
Legend
--- = No Data Reported For Fewer Than Five Students
Nu
mb
er o
f S
tud
ents
Tes
ted
Lev
el II
:S
atis
fact
ory
STAAR
# %
Nu
mb
er o
f S
tud
ents
Tes
ted
Lev
el II
:S
atis
fact
ory
STAAR L
# %
Nu
mb
er o
f S
tud
ents
Tes
ted
Lev
el II
:S
atis
fact
ory
STAAR A
# %
Nu
mb
er o
f S
tud
ents
Tes
ted
Lev
el II
:S
atis
fact
ory
Total
# %
All Students 9 6 67 0 --- --- 0 --- --- 9 6 67Male 1 --- --- 0 --- --- 0 --- --- 1 --- ---Female 8 5 63 0 --- --- 0 --- --- 8 5 63No Information Provided 0 --- --- 0 --- --- 0 --- --- 0 --- ---Hispanic/Latino 2 --- --- 0 --- --- 0 --- --- 2 --- ---American Indian or Alaska Native 0 --- --- 0 --- --- 0 --- --- 0 --- ---Asian 0 --- --- 0 --- --- 0 --- --- 0 --- ---Black or African American 1 --- --- 0 --- --- 0 --- --- 1 --- ---Native Hawaiian or Other Pacific Islander 0 --- --- 0 --- --- 0 --- --- 0 --- ---White 6 4 67 0 --- --- 0 --- --- 6 4 67Two or More Races 0 --- --- 0 --- --- 0 --- --- 0 --- ---No Information Provided 0 --- --- 0 --- --- 0 --- --- 0 --- ---Economically 3 --- --- 0 --- --- 0 --- --- 3 --- ---Disadvantaged 6 4 67 0 --- --- 0 --- --- 6 4 67
0 --- --- 0 --- --- 0 --- --- 0 --- ---Title I, Part A 0 --- --- 0 --- --- 0 --- --- 0 --- ---
9 6 67 0 --- --- 0 --- --- 9 6 670 --- --- 0 --- --- 0 --- --- 0 --- ---
Migrant 0 --- --- 0 --- --- 0 --- --- 0 --- ---9 6 67 0 --- --- 0 --- --- 9 6 670 --- --- 0 --- --- 0 --- --- 0 --- ---
Limited English 0 --- --- 0 --- --- 0 --- --- 0 --- ---Proficient 0 --- --- 0 --- --- 0 --- --- 0 --- ---
0 --- --- 0 --- --- 0 --- --- 0 --- ---9 6 67 0 --- --- 0 --- --- 9 6 670 --- --- 0 --- --- 0 --- --- 0 --- ---
Bilingual 0 --- --- 0 --- --- 0 --- --- 0 --- ---9 6 67 0 --- --- 0 --- --- 9 6 670 --- --- 0 --- --- 0 --- --- 0 --- ---
ESL 0 --- --- 0 --- --- 0 --- --- 0 --- ---9 6 67 0 --- --- 0 --- --- 9 6 670 --- --- 0 --- --- 0 --- --- 0 --- ---
Special Education 0 --- --- 0 --- --- 0 --- --- 0 --- ---9 6 67 0 --- --- 0 --- --- 9 6 670 --- --- 0 --- --- 0 --- --- 0 --- ---
Gifted/Talented 0 --- --- 0 --- --- 0 --- --- 0 --- ---9 6 67 0 --- --- 0 --- --- 9 6 670 --- --- 0 --- --- 0 --- --- 0 --- ---
At-Risk 5 2 40 0 --- --- 0 --- --- 5 2 404 --- --- 0 --- --- 0 --- --- 4 --- ---0 --- --- 0 --- --- 0 --- --- 0 --- ---
Career/Technical 4 --- --- 0 --- --- 0 --- --- 4 --- ---Education 5 5 100 0 --- --- 0 --- --- 5 5 100
0 --- --- 0 --- --- 0 --- --- 0 --- ---
YesNo
No Information ProvidedParticipants
NonparticipantsNo Information Provided
YesNo
No Information ProvidedCurrent LEP
Non-LEP (Monitored 1st Year)Non-LEP (Monitored 2nd Year)
Other Non-LEPNo Information Provided
ParticipantsNonparticipants
No Information ProvidedParticipants
NonparticipantsNo Information Provided
YesNo
No Information ProvidedParticipants
NonparticipantsNo Information Provided
YesNo
No Information ProvidedParticipants
NonparticipantsNo Information Provided
All Students
STATE OF TEXAS ASSESSMENTS OF ACADEMIC READINESSCombined Summary Report
U.S.HISTORYDate of Testing:
District: FALL 2015Campus:
129-903 KAUFMAN ISD Report Date: 003 GARY W CAMPBELL
FALL 2015
21016-00001577-129903003
Legend
--- = No Data Reported For Fewer Than Five Students
Nu
mb
er o
f S
tud
ents
Tes
ted
Lev
el II
:S
atis
fact
ory
STAAR
# %
Nu
mb
er o
f S
tud
ents
Tes
ted
Lev
el II
:S
atis
fact
ory
STAAR L
# %
Nu
mb
er o
f S
tud
ents
Tes
ted
Lev
el II
:S
atis
fact
ory
STAAR A
# %
Nu
mb
er o
f S
tud
ents
Tes
ted
Lev
el II
:S
atis
fact
ory
Total
# %
All Students 6 5 83 0 --- --- 0 --- --- 6 5 83Male 1 --- --- 0 --- --- 0 --- --- 1 --- ---Female 5 4 80 0 --- --- 0 --- --- 5 4 80No Information Provided 0 --- --- 0 --- --- 0 --- --- 0 --- ---Hispanic/Latino 0 --- --- 0 --- --- 0 --- --- 0 --- ---American Indian or Alaska Native 0 --- --- 0 --- --- 0 --- --- 0 --- ---Asian 0 --- --- 0 --- --- 0 --- --- 0 --- ---Black or African American 1 --- --- 0 --- --- 0 --- --- 1 --- ---Native Hawaiian or Other Pacific Islander 0 --- --- 0 --- --- 0 --- --- 0 --- ---White 5 4 80 0 --- --- 0 --- --- 5 4 80Two or More Races 0 --- --- 0 --- --- 0 --- --- 0 --- ---No Information Provided 0 --- --- 0 --- --- 0 --- --- 0 --- ---Economically 3 --- --- 0 --- --- 0 --- --- 3 --- ---Disadvantaged 3 --- --- 0 --- --- 0 --- --- 3 --- ---
0 --- --- 0 --- --- 0 --- --- 0 --- ---Title I, Part A 0 --- --- 0 --- --- 0 --- --- 0 --- ---
6 5 83 0 --- --- 0 --- --- 6 5 830 --- --- 0 --- --- 0 --- --- 0 --- ---
Migrant 0 --- --- 0 --- --- 0 --- --- 0 --- ---6 5 83 0 --- --- 0 --- --- 6 5 830 --- --- 0 --- --- 0 --- --- 0 --- ---
Limited English 0 --- --- 0 --- --- 0 --- --- 0 --- ---Proficient 0 --- --- 0 --- --- 0 --- --- 0 --- ---
0 --- --- 0 --- --- 0 --- --- 0 --- ---6 5 83 0 --- --- 0 --- --- 6 5 830 --- --- 0 --- --- 0 --- --- 0 --- ---
Bilingual 0 --- --- 0 --- --- 0 --- --- 0 --- ---6 5 83 0 --- --- 0 --- --- 6 5 830 --- --- 0 --- --- 0 --- --- 0 --- ---
ESL 0 --- --- 0 --- --- 0 --- --- 0 --- ---6 5 83 0 --- --- 0 --- --- 6 5 830 --- --- 0 --- --- 0 --- --- 0 --- ---
Special Education 0 --- --- 0 --- --- 0 --- --- 0 --- ---6 5 83 0 --- --- 0 --- --- 6 5 830 --- --- 0 --- --- 0 --- --- 0 --- ---
Gifted/Talented 0 --- --- 0 --- --- 0 --- --- 0 --- ---6 5 83 0 --- --- 0 --- --- 6 5 830 --- --- 0 --- --- 0 --- --- 0 --- ---
At-Risk 3 --- --- 0 --- --- 0 --- --- 3 --- ---3 --- --- 0 --- --- 0 --- --- 3 --- ---0 --- --- 0 --- --- 0 --- --- 0 --- ---
Career/Technical 2 --- --- 0 --- --- 0 --- --- 2 --- ---Education 4 --- --- 0 --- --- 0 --- --- 4 --- ---
0 --- --- 0 --- --- 0 --- --- 0 --- ---
YesNo
No Information ProvidedParticipants
NonparticipantsNo Information Provided
YesNo
No Information ProvidedCurrent LEP
Non-LEP (Monitored 1st Year)Non-LEP (Monitored 2nd Year)
Other Non-LEPNo Information Provided
ParticipantsNonparticipants
No Information ProvidedParticipants
NonparticipantsNo Information Provided
YesNo
No Information ProvidedParticipants
NonparticipantsNo Information Provided
YesNo
No Information ProvidedParticipants
NonparticipantsNo Information Provided
First-Time Tested Students
STATE OF TEXAS ASSESSMENTS OF ACADEMIC READINESSCombined Summary Report
U.S.HISTORYDate of Testing:
District: FALL 2015Campus:
129-903 KAUFMAN ISD Report Date: 003 GARY W CAMPBELL
FALL 2015
21016-00001577-129903003
Legend
--- = No Data Reported For Fewer Than Five Students
Nu
mb
er o
f S
tud
ents
Tes
ted
Lev
el II
:S
atis
fact
ory
STAAR
# %
Nu
mb
er o
f S
tud
ents
Tes
ted
Lev
el II
:S
atis
fact
ory
STAAR L
# %
Nu
mb
er o
f S
tud
ents
Tes
ted
Lev
el II
:S
atis
fact
ory
STAAR A
# %
Nu
mb
er o
f S
tud
ents
Tes
ted
Lev
el II
:S
atis
fact
ory
Total
# %
All Students 3 --- --- 0 --- --- 0 --- --- 3 --- ---Male 0 --- --- 0 --- --- 0 --- --- 0 --- ---Female 3 --- --- 0 --- --- 0 --- --- 3 --- ---No Information Provided 0 --- --- 0 --- --- 0 --- --- 0 --- ---Hispanic/Latino 2 --- --- 0 --- --- 0 --- --- 2 --- ---American Indian or Alaska Native 0 --- --- 0 --- --- 0 --- --- 0 --- ---Asian 0 --- --- 0 --- --- 0 --- --- 0 --- ---Black or African American 0 --- --- 0 --- --- 0 --- --- 0 --- ---Native Hawaiian or Other Pacific Islander 0 --- --- 0 --- --- 0 --- --- 0 --- ---White 1 --- --- 0 --- --- 0 --- --- 1 --- ---Two or More Races 0 --- --- 0 --- --- 0 --- --- 0 --- ---No Information Provided 0 --- --- 0 --- --- 0 --- --- 0 --- ---Economically 0 --- --- 0 --- --- 0 --- --- 0 --- ---Disadvantaged 3 --- --- 0 --- --- 0 --- --- 3 --- ---
0 --- --- 0 --- --- 0 --- --- 0 --- ---Title I, Part A 0 --- --- 0 --- --- 0 --- --- 0 --- ---
3 --- --- 0 --- --- 0 --- --- 3 --- ---0 --- --- 0 --- --- 0 --- --- 0 --- ---
Migrant 0 --- --- 0 --- --- 0 --- --- 0 --- ---3 --- --- 0 --- --- 0 --- --- 3 --- ---0 --- --- 0 --- --- 0 --- --- 0 --- ---
Limited English 0 --- --- 0 --- --- 0 --- --- 0 --- ---Proficient 0 --- --- 0 --- --- 0 --- --- 0 --- ---
0 --- --- 0 --- --- 0 --- --- 0 --- ---3 --- --- 0 --- --- 0 --- --- 3 --- ---0 --- --- 0 --- --- 0 --- --- 0 --- ---
Bilingual 0 --- --- 0 --- --- 0 --- --- 0 --- ---3 --- --- 0 --- --- 0 --- --- 3 --- ---0 --- --- 0 --- --- 0 --- --- 0 --- ---
ESL 0 --- --- 0 --- --- 0 --- --- 0 --- ---3 --- --- 0 --- --- 0 --- --- 3 --- ---0 --- --- 0 --- --- 0 --- --- 0 --- ---
Special Education 0 --- --- 0 --- --- 0 --- --- 0 --- ---3 --- --- 0 --- --- 0 --- --- 3 --- ---0 --- --- 0 --- --- 0 --- --- 0 --- ---
Gifted/Talented 0 --- --- 0 --- --- 0 --- --- 0 --- ---3 --- --- 0 --- --- 0 --- --- 3 --- ---0 --- --- 0 --- --- 0 --- --- 0 --- ---
At-Risk 2 --- --- 0 --- --- 0 --- --- 2 --- ---1 --- --- 0 --- --- 0 --- --- 1 --- ---0 --- --- 0 --- --- 0 --- --- 0 --- ---
Career/Technical 2 --- --- 0 --- --- 0 --- --- 2 --- ---Education 1 --- --- 0 --- --- 0 --- --- 1 --- ---
0 --- --- 0 --- --- 0 --- --- 0 --- ---
YesNo
No Information ProvidedParticipants
NonparticipantsNo Information Provided
YesNo
No Information ProvidedCurrent LEP
Non-LEP (Monitored 1st Year)Non-LEP (Monitored 2nd Year)
Other Non-LEPNo Information Provided
ParticipantsNonparticipants
No Information ProvidedParticipants
NonparticipantsNo Information Provided
YesNo
No Information ProvidedParticipants
NonparticipantsNo Information Provided
YesNo
No Information ProvidedParticipants
NonparticipantsNo Information Provided
Retested Students
STATE OF TEXAS ASSESSMENTS OF ACADEMIC READINESSCombined Summary Report
U.S.HISTORYDate of Testing:
District: FALL 2015Campus:
129-903 KAUFMAN ISD Report Date: 003 GARY W CAMPBELL
FALL 2015
21016-00001577-129903003