15
Board of Regents Report for February 2018 Texas Tech University System Endowment
Board of Regents Report
for February 2018
Texas Tech University System Endowment
Contents
Endowment Data
Endowment Liquidity
Market Data
Asset Class Allocation: Actual vs. Target
Asset Class Performance: Actual vs. Policy
Long Term Risk/Return of Endowment vs. 60/40 Portfolio and Policy Returns
Risk Profile
Appendix I – Sub-Asset Detail
Appendix II – Private Market Reports
Appendix III – Glossary
Page
3
5
6
8
9
10
11
12
13
15
28th February 2018

Endowment Data
3
HISTORICAL MARKET VALUE (Fiscal Year)
HISTORICAL SPENDING (Fiscal Year)
The 4.5% distribution rate has been realized every year since inception.
$0.77
$52.23
$0.0
$10.0
$20.0
$30.0
$40.0
$50.0
$60.0
1997 1998 1999 2000 2001 2002 2003 2004 2005 2006 2007 2008 2009 2010 2011 2012 2013 2014 2015 2016 2017
Mil
lio
ns
Fiscal Year Ending August 31
Texas Tech University SystemGrowth of Spending (FY 1997-2017)
$469
$1,312
$0.0
$200.0
$400.0
$600.0
$800.0
$1,000.0
$1,200.0
$1,400.0
2005 2006 2007 2008 2009 2010 2011 2012 2013 2014 2015 2016 2017 Q1 2018
Mil
lio
ns
Fiscal Year Ending August 31
Texas Tech University SystemGrowth of Consolidated Endowment (FY 2005-2018)
28th February 2018

Endowment Data (cont.)
4
TOTAL ENDOWMENT (Q1 Fiscal Year 2018)
Summary of Endowment
TTU Foundation TTU System TTU HSC TTU HSC EP Carr Foundation ASU ASU Foundation Total
LTIF $709,524,712 $23,750,930 $161,479,709 $99,794,201 $130,596,762 $17,718,658 $20,236,631 $1,163,101,604
STIF $2,797,439 $99 $2,599,715 $795 $0 $393,469 $0 $5,791,517
Non-Cash $4,320,795 $0 $1,534,309 $0 $8,663,166 $0 $0 $14,518,270
Funds Held in Trust $32,210,633 $0 $63,638,816 $32,873,916 $0 $0 $0 $128,723,364
Other $0 $0 $0 $0 $0 $158 $0 $158
Total $748,853,579 $23,751,029 $229,252,550 $132,668,911 $139,259,928 $18,112,285 $20,236,631 $1,312,134,913
TTU Foundation$748,853,579
TTU System$23,751,029TTU HSC
$229,252,550
TTU HSC EP$132,668,911
Carr Foundation$139,259,928
ASU$18,112,285
ASU Foundation$20,236,631
Texas Tech University SystemEndowment Breakout
by Institution
LTIF88.64%
STIF0.44%
Non-Cash1.11%
Funds Held in Trust
9.81%
Other0.00%
Texas Tech University SystemEndowment Breakout
by Pool
28th February 2018

5
LTIF Liquidity
Unfunded Commitments - Sensitivity Analysis25% Called Most Likely
50% Called75% Called 100% Called
Maximum Remaining Annual Cash Needed $104,587,479 $155,574,957 $206,562,436 $257,549,914Percentage of Daily & Monthly Liquidity 22% 33% 44% 54%
Commitment Capital Called Distributions Account Balance
Remaining Commitment
Private Equity $254,500,000 $150,529,484 $62,170,378 $118,610,174 $103,970,516
Private Credit $195,702,805 $121,933,845 $41,017,841 $116,122,452 $73,768,960
Private Real Assets $262,663,450 $236,453,012 $202,516,170 $127,650,486 $26,210,438
Total Illiquid Assets $712,866,255 $508,916,341 $305,704,389 $362,383,112 $203,949,914
Annual Spending $53,600,000
Total Committed Funds $257,549,914
LTIF Liquidity
Daily $319,573,567 26.8%
Monthly $153,824,590 12.9%
Quarterly $39,350,477 3.3%
Annual $512,748,634 43.0%
2-Year $0 0.0%
Non-Liquid $168,133,854 14.1%
Total LTIF $1,192,438,683 100%
28th February 2018
Daily, 27%
Monthly , 13%
Quarterly, 3%
Annual, 43%
2-Year, 0%Non-Liquid, 14%
LTIF Liquidity
$0
$50
$100
$150
$200
$250
$300
$350
$400
$450
$500
25% Most Likely 50% 75% 100%Percentage Commitments Called
Liquidity Sensitivity
Maximum Remaining Annual Cash Needed Total Daily & Monthly Liquidity
Market Data
6
CIO NOTES:
Benchmarks Underlying Weight MTD Perf. QTD Perf. Calendar YTD Fiscal YTD Nacubo YTD 1 Year Perf. 3 Year Perf. 5 Year Perf.
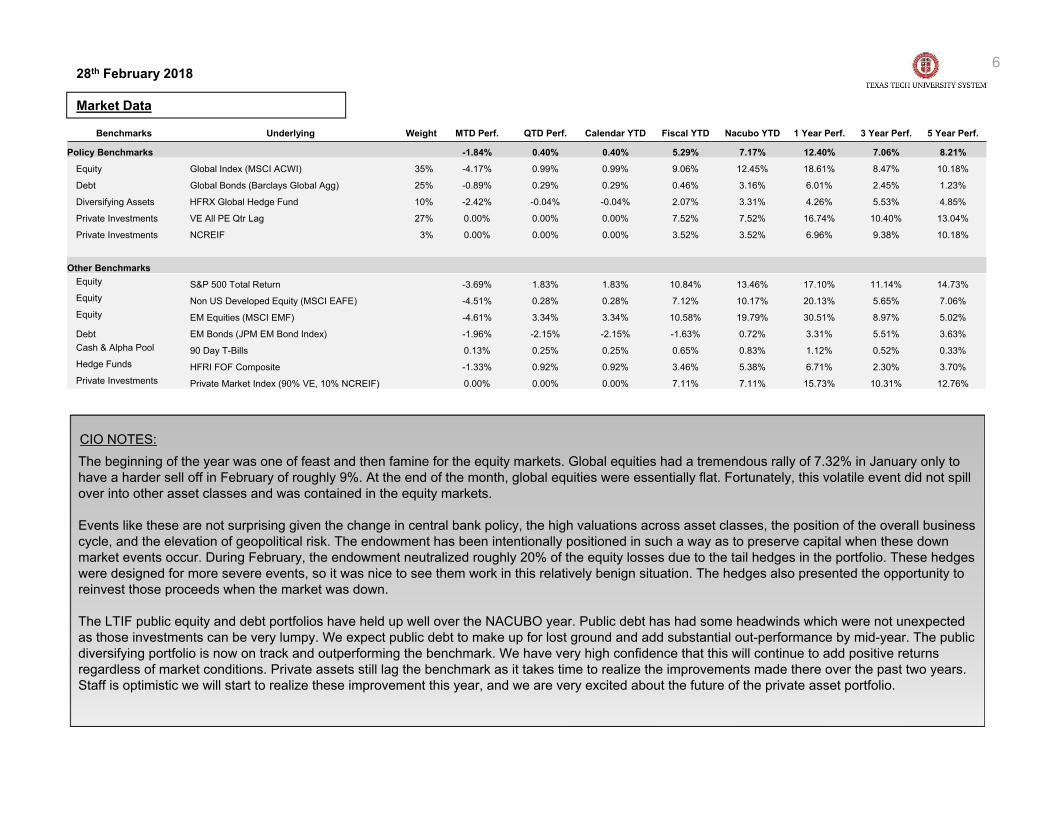
Policy Benchmarks -1.84% 0.40% 0.40% 5.29% 7.17% 12.40% 7.06% 8.21%
Equity Global Index (MSCI ACWI) 35% -4.17% 0.99% 0.99% 9.06% 12.45% 18.61% 8.47% 10.18%
Debt Global Bonds (Barclays Global Agg) 25% -0.89% 0.29% 0.29% 0.46% 3.16% 6.01% 2.45% 1.23%
Diversifying Assets HFRX Global Hedge Fund 10% -2.42% -0.04% -0.04% 2.07% 3.31% 4.26% 5.53% 4.85%
Private Investments VE All PE Qtr Lag 27% 0.00% 0.00% 0.00% 7.52% 7.52% 16.74% 10.40% 13.04%
Private Investments NCREIF 3% 0.00% 0.00% 0.00% 3.52% 3.52% 6.96% 9.38% 10.18%
Other BenchmarksEquity S&P 500 Total Return -3.69% 1.83% 1.83% 10.84% 13.46% 17.10% 11.14% 14.73%Equity Non US Developed Equity (MSCI EAFE) -4.51% 0.28% 0.28% 7.12% 10.17% 20.13% 5.65% 7.06%Equity EM Equities (MSCI EMF) -4.61% 3.34% 3.34% 10.58% 19.79% 30.51% 8.97% 5.02%
Debt EM Bonds (JPM EM Bond Index) -1.96% -2.15% -2.15% -1.63% 0.72% 3.31% 5.51% 3.63%Cash & Alpha Pool 90 Day T-Bills 0.13% 0.25% 0.25% 0.65% 0.83% 1.12% 0.52% 0.33%Hedge Funds HFRI FOF Composite -1.33% 0.92% 0.92% 3.46% 5.38% 6.71% 2.30% 3.70%Private Investments Private Market Index (90% VE, 10% NCREIF) 0.00% 0.00% 0.00% 7.11% 7.11% 15.73% 10.31% 12.76%
28th February 2018
The beginning of the year was one of feast and then famine for the equity markets. Global equities had a tremendous rally of 7.32% in January only to have a harder sell off in February of roughly 9%. At the end of the month, global equities were essentially flat. Fortunately, this volatile event did not spill over into other asset classes and was contained in the equity markets.
Events like these are not surprising given the change in central bank policy, the high valuations across asset classes, the position of the overall business cycle, and the elevation of geopolitical risk. The endowment has been intentionally positioned in such a way as to preserve capital when these down market events occur. During February, the endowment neutralized roughly 20% of the equity losses due to the tail hedges in the portfolio. These hedges were designed for more severe events, so it was nice to see them work in this relatively benign situation. The hedges also presented the opportunity to reinvest those proceeds when the market was down.
The LTIF public equity and debt portfolios have held up well over the NACUBO year. Public debt has had some headwinds which were not unexpected as those investments can be very lumpy. We expect public debt to make up for lost ground and add substantial out-performance by mid-year. The public diversifying portfolio is now on track and outperforming the benchmark. We have very high confidence that this will continue to add positive returns regardless of market conditions. Private assets still lag the benchmark as it takes time to realize the improvements made there over the past two years. Staff is optimistic we will start to realize these improvement this year, and we are very excited about the future of the private asset portfolio.
Market Data (cont.)
728th February 2018
0%
5%
10%
15%
20%
25%
30%
35%
40%
02/28/2017 03/31/2017 04/30/2017 05/31/2017 06/30/2017 07/31/2017 08/31/2017 09/30/2017 10/31/2017 11/30/2017 12/31/2017 01/31/2018 02/28/2018
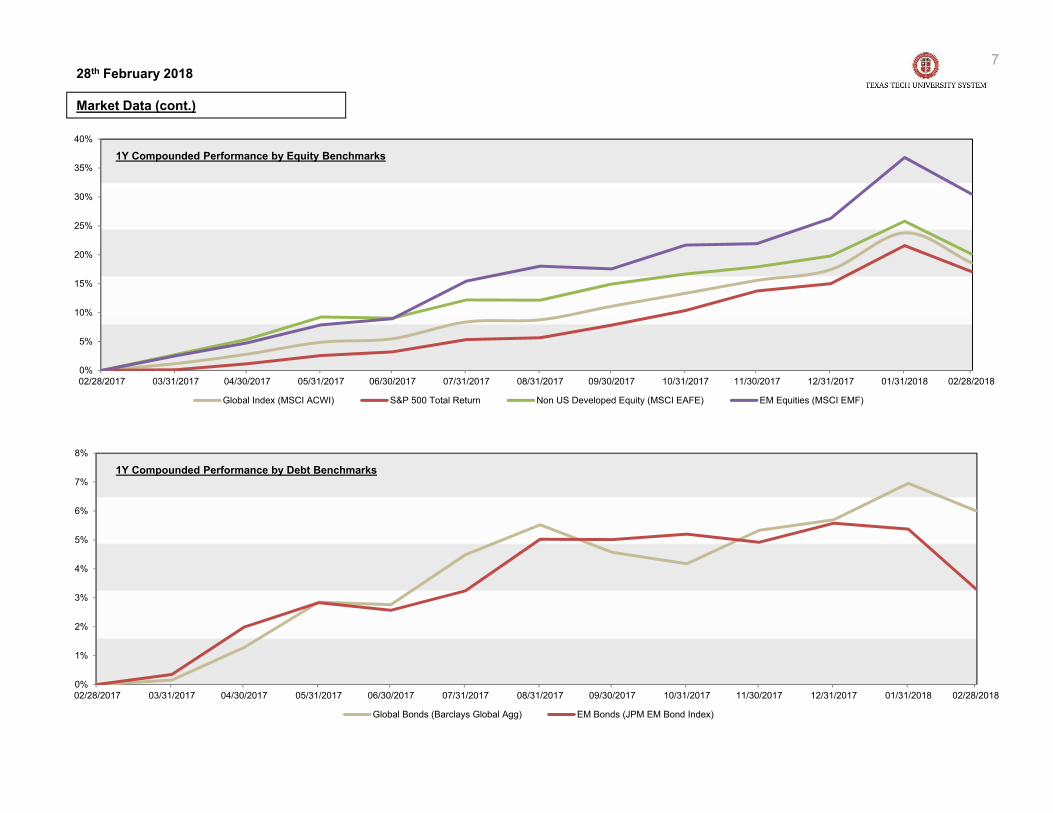
1Y Compounded Performance by Equity Benchmarks
Global Index (MSCI ACWI) S&P 500 Total Return Non US Developed Equity (MSCI EAFE) EM Equities (MSCI EMF)
0%
1%
2%
3%
4%
5%
6%
7%
8%
02/28/2017 03/31/2017 04/30/2017 05/31/2017 06/30/2017 07/31/2017 08/31/2017 09/30/2017 10/31/2017 11/30/2017 12/31/2017 01/31/2018 02/28/2018
1Y Compounded Performance by Debt Benchmarks
Global Bonds (Barclays Global Agg) EM Bonds (JPM EM Bond Index)

30.00%
25.00%
15.00%
30.00%
Target Allocation
Actual Allocation
Asset Class Allocation: Actual vs. Target
8
Asset ClassActual $ Allocation Total %
AllocationTarget %
Allocation Target RangePhysical Synthetic Total
Equity 135,191,980 250,617,950 385,809,930 32.35% 30% 30% - 40%
Debt 246,764,054 0 246,764,054 20.69% 25% 20% - 30%
Diversifying Assets 91,255,671 49,248,307 140,503,978 11.78% 15% 5% - 15%
Cash & Alpha Pool 344,058,083 -306,649,852 37,408,231 3.14% 0% 0% - 10%
Private Investments 362,383,112 0 362,383,112 30.39% 30% 10% - 55%
Liquidating 7,002,437 0 7,002,437 0.59% 0%
Portfolio Hedge 5,783,345 6,783,596 12,566,941 1.05% 0%
Total 1,192,438,683 0 1,192,438,683 100% 100%
35%
25%
10%
30% Portfolio Hedge
Liquidating
Private Investments
Cash & Alpha Pool
Diversifying Assets
Debt
Equity
28th February 2018
32.35%
20.69%11.78%
3.14%
30.39%
0.59%1.05%
10.13%
3.73%
7.53%
4.95%
6.02%
15.55%
5.15%11.78%
4.21%-0.93%
9.95%
9.74%
10.70%
-10%
0%
10%
20%
30%
40%
50%
60%
70%
80%
90%
100%
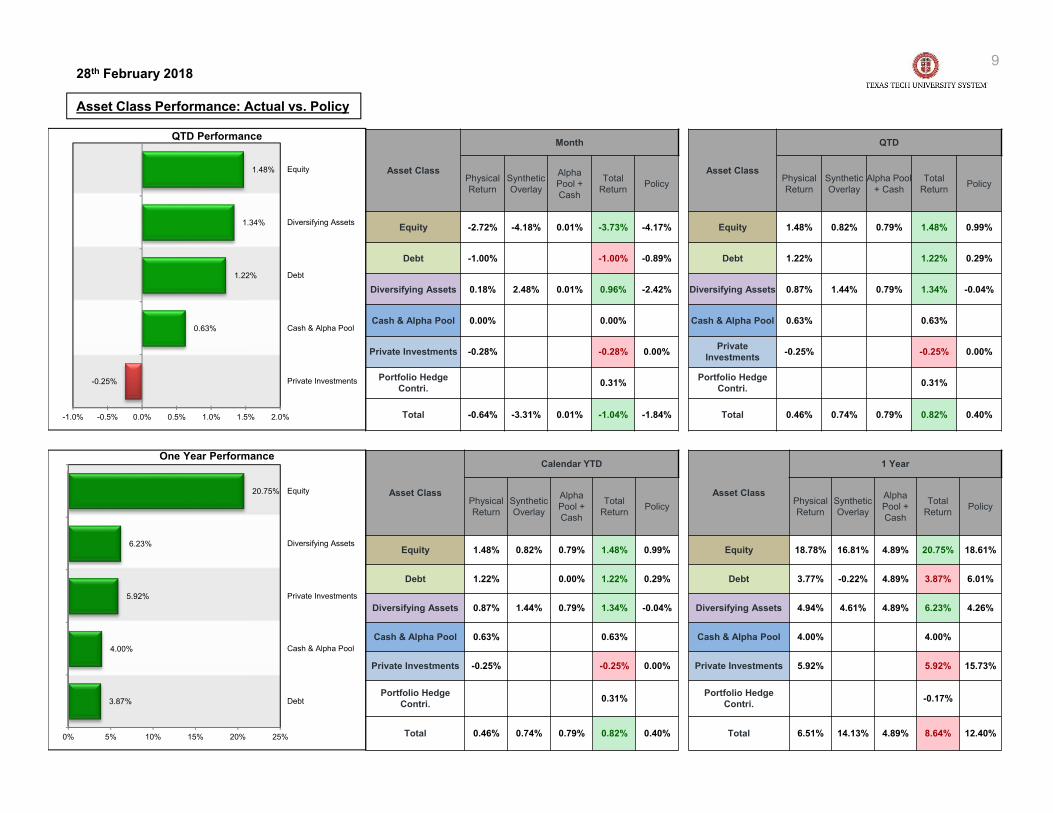
Asset Class Performance: Actual vs. Policy
9
QTD Performance
One Year Performance
Asset Class
Month
Physical Return
Synthetic Overlay
Alpha Pool + Cash
Total Return Policy
Equity -2.72% -4.18% 0.01% -3.73% -4.17%
Debt -1.00% -1.00% -0.89%
Diversifying Assets 0.18% 2.48% 0.01% 0.96% -2.42%
Cash & Alpha Pool 0.00% 0.00%
Private Investments -0.28% -0.28% 0.00%
Portfolio Hedge Contri. 0.31%
Total -0.64% -3.31% 0.01% -1.04% -1.84%
Asset Class
QTD
Physical Return
Synthetic Overlay
Alpha Pool + Cash
Total Return Policy
Equity 1.48% 0.82% 0.79% 1.48% 0.99%
Debt 1.22% 1.22% 0.29%
Diversifying Assets 0.87% 1.44% 0.79% 1.34% -0.04%
Cash & Alpha Pool 0.63% 0.63%
Private Investments -0.25% -0.25% 0.00%
Portfolio Hedge Contri. 0.31%
Total 0.46% 0.74% 0.79% 0.82% 0.40%
Asset Class
Calendar YTD
Physical Return
Synthetic Overlay
Alpha Pool + Cash
Total Return Policy
Equity 1.48% 0.82% 0.79% 1.48% 0.99%
Debt 1.22% 0.00% 1.22% 0.29%
Diversifying Assets 0.87% 1.44% 0.79% 1.34% -0.04%
Cash & Alpha Pool 0.63% 0.63%
Private Investments -0.25% -0.25% 0.00%
Portfolio Hedge Contri. 0.31%
Total 0.46% 0.74% 0.79% 0.82% 0.40%
Asset Class
1 Year
Physical Return
Synthetic Overlay
Alpha Pool + Cash
Total Return Policy
Equity 18.78% 16.81% 4.89% 20.75% 18.61%
Debt 3.77% -0.22% 4.89% 3.87% 6.01%
Diversifying Assets 4.94% 4.61% 4.89% 6.23% 4.26%
Cash & Alpha Pool 4.00% 4.00%
Private Investments 5.92% 5.92% 15.73%
Portfolio Hedge Contri. -0.17%
Total 6.51% 14.13% 4.89% 8.64% 12.40%
28th February 2018
0.63%
1.22%
1.34%
1.48%
-0.25%
-1.0% -0.5% 0.0% 0.5% 1.0% 1.5% 2.0%
Private Investments
Cash & Alpha Pool
Debt
Diversifying Assets
Equity
3.87%
4.00%
5.92%
6.23%
20.75%
0% 5% 10% 15% 20% 25%
Debt
Cash & Alpha Pool
Private Investments
Diversifying Assets
Equity

Return: 8.21%SD: 4.31%
Return: 6.63%SD: 6.97%
Return: 7.11%SD: 4.50%
Return: 6.93%SD: 5.55%
Return: 7.69%SD: 5.10%
0%
1%
2%
3%
4%
5%
6%
7%
8%
9%
0.00% 1.00% 2.00% 3.00% 4.00% 5.00% 6.00% 7.00% 8.00%
5 Ye
ar A
nnua
lized
Ret
urn
Annualized Standard Deviation
Policy 60/40 Texas Tech Liquid Assets Private Investments
Long Term Risk/Return of Endowment vs. 60/40 Portfolio & Policy Returns1 Year
3 Years 5 Years
Commentary
• The Texas Tech portfolio is less volatile than the 60/40 portfolio over all time horizons.
• The Texas Tech portfolio outperforms the 60/40 portfolio over all time horizons.
• Volatility (measured by standard deviation) on the Texas Tech portfolio has decreased over the past 12 months compared with the annualized 5 year volatility.
1028th February 2018
Return: 12.40%SD: 3.43%
Return: 13.47%SD: 5.08%
Return: 8.64%SD: 2.48% Return: 11.10%
SD: 3.95%
Return: 5.92%SD: 3.17%
0%
2%
4%
6%
8%
10%
12%
14%
16%
0.00% 1.00% 2.00% 3.00% 4.00% 5.00% 6.00%
1 Ye
ar R
etur
n
Annualized Standard Deviation
Policy 60/40 Texas Tech Liquid Assets Private Investments
Return: 6.16%SD: 4.30%
Return: 6.16%SD: 7.12%
Return: 7.06%SD: 4.42%
Return:5.82%SD: 5.43%
Return: 5.62%SD: 4.27%
0%
1%
2%
3%
4%
5%
6%
7%
8%
0.00% 1.00% 2.00% 3.00% 4.00% 5.00% 6.00% 7.00% 8.00%
3 Ye
ar A
nnua
lized
Ret
urn
Annualized Standard Deviation
Policy 60/40 Texas Tech Liquid Assets Private Investments

*Excluding Liquidating investments.
Risk Profile*
Commentary
• Private Credit, Non-US EM Equity, and Private Real Assets have provided the highestrisk adjusted returns over the last 12 months
• Diversifying Assets, Private Equity and Alternative Equity have generated the lowestrisk adjusted returns over the last 12 months.
11
Annualized Standard Deviation
12 M
onth
Ret
urn
1 Year
3 Year
12 M
onth
Ret
urn
12 M
onth
Ret
urn
Annualized Standard Deviation Annualized Standard Deviation
5 Year
28th February 2018
Equity
DebtDiversifying
Assets
Cash & Alpha Pool
Private Investments
PolicyTexas Tech
60/40
0%
5%
10%
15%
20%
25%
0% 1% 2% 3% 4% 5% 6% 7% 8%
Equity
Debt
Diversifying Assets
Cash & Alpha Pool
Private Investments
Policy
Texas Tech 60/40
-2%
0%
2%
4%
6%
8%
10%
0% 2% 4% 6% 8% 10% 12%
Equity
Debt
Diversifying Assets
Cash & Alpha Pool
Private InvestmentsPolicy
Texas Tech60/40
-2%
0%
2%
4%
6%
8%
10%
12%
0% 2% 4% 6% 8% 10% 12%
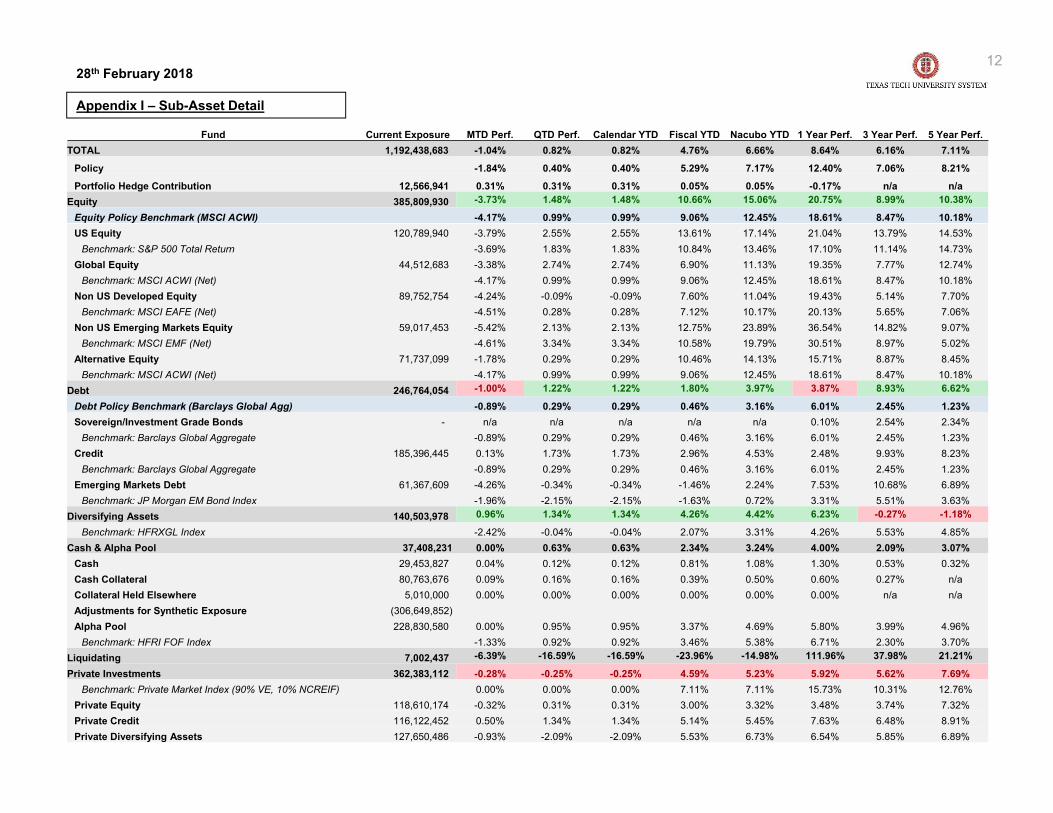
Appendix I – Sub-Asset Detail
1228th February 2018
Fund Current Exposure MTD Perf. QTD Perf. Calendar YTD Fiscal YTD Nacubo YTD 1 Year Perf. 3 Year Perf. 5 Year Perf.TOTAL 1,192,438,683 -1.04% 0.82% 0.82% 4.76% 6.66% 8.64% 6.16% 7.11%
Policy -1.84% 0.40% 0.40% 5.29% 7.17% 12.40% 7.06% 8.21%
Portfolio Hedge Contribution 12,566,941 0.31% 0.31% 0.31% 0.05% 0.05% -0.17% n/a n/aEquity 385,809,930 -3.73% 1.48% 1.48% 10.66% 15.06% 20.75% 8.99% 10.38%
Equity Policy Benchmark (MSCI ACWI) -4.17% 0.99% 0.99% 9.06% 12.45% 18.61% 8.47% 10.18%US Equity 120,789,940 -3.79% 2.55% 2.55% 13.61% 17.14% 21.04% 13.79% 14.53%
Benchmark: S&P 500 Total Return -3.69% 1.83% 1.83% 10.84% 13.46% 17.10% 11.14% 14.73%Global Equity 44,512,683 -3.38% 2.74% 2.74% 6.90% 11.13% 19.35% 7.77% 12.74%
Benchmark: MSCI ACWI (Net) -4.17% 0.99% 0.99% 9.06% 12.45% 18.61% 8.47% 10.18%Non US Developed Equity 89,752,754 -4.24% -0.09% -0.09% 7.60% 11.04% 19.43% 5.14% 7.70%
Benchmark: MSCI EAFE (Net) -4.51% 0.28% 0.28% 7.12% 10.17% 20.13% 5.65% 7.06%Non US Emerging Markets Equity 59,017,453 -5.42% 2.13% 2.13% 12.75% 23.89% 36.54% 14.82% 9.07%
Benchmark: MSCI EMF (Net) -4.61% 3.34% 3.34% 10.58% 19.79% 30.51% 8.97% 5.02%Alternative Equity 71,737,099 -1.78% 0.29% 0.29% 10.46% 14.13% 15.71% 8.87% 8.45%
Benchmark: MSCI ACWI (Net) -4.17% 0.99% 0.99% 9.06% 12.45% 18.61% 8.47% 10.18%Debt 246,764,054 -1.00% 1.22% 1.22% 1.80% 3.97% 3.87% 8.93% 6.62%
Debt Policy Benchmark (Barclays Global Agg) -0.89% 0.29% 0.29% 0.46% 3.16% 6.01% 2.45% 1.23%Sovereign/Investment Grade Bonds - n/a n/a n/a n/a n/a 0.10% 2.54% 2.34%
Benchmark: Barclays Global Aggregate -0.89% 0.29% 0.29% 0.46% 3.16% 6.01% 2.45% 1.23%Credit 185,396,445 0.13% 1.73% 1.73% 2.96% 4.53% 2.48% 9.93% 8.23%
Benchmark: Barclays Global Aggregate -0.89% 0.29% 0.29% 0.46% 3.16% 6.01% 2.45% 1.23%Emerging Markets Debt 61,367,609 -4.26% -0.34% -0.34% -1.46% 2.24% 7.53% 10.68% 6.89%
Benchmark: JP Morgan EM Bond Index -1.96% -2.15% -2.15% -1.63% 0.72% 3.31% 5.51% 3.63%Diversifying Assets 140,503,978 0.96% 1.34% 1.34% 4.26% 4.42% 6.23% -0.27% -1.18%
Benchmark: HFRXGL Index -2.42% -0.04% -0.04% 2.07% 3.31% 4.26% 5.53% 4.85%Cash & Alpha Pool 37,408,231 0.00% 0.63% 0.63% 2.34% 3.24% 4.00% 2.09% 3.07%
Cash 29,453,827 0.04% 0.12% 0.12% 0.81% 1.08% 1.30% 0.53% 0.32%Cash Collateral 80,763,676 0.09% 0.16% 0.16% 0.39% 0.50% 0.60% 0.27% n/aCollateral Held Elsewhere 5,010,000 0.00% 0.00% 0.00% 0.00% 0.00% 0.00% n/a n/aAdjustments for Synthetic Exposure (306,649,852)Alpha Pool 228,830,580 0.00% 0.95% 0.95% 3.37% 4.69% 5.80% 3.99% 4.96%
Benchmark: HFRI FOF Index -1.33% 0.92% 0.92% 3.46% 5.38% 6.71% 2.30% 3.70%Liquidating 7,002,437 -6.39% -16.59% -16.59% -23.96% -14.98% 111.96% 37.98% 21.21%
Private Investments 362,383,112 -0.28% -0.25% -0.25% 4.59% 5.23% 5.92% 5.62% 7.69%Benchmark: Private Market Index (90% VE, 10% NCREIF) 0.00% 0.00% 0.00% 7.11% 7.11% 15.73% 10.31% 12.76%
Private Equity 118,610,174 -0.32% 0.31% 0.31% 3.00% 3.32% 3.48% 3.74% 7.32%Private Credit 116,122,452 0.50% 1.34% 1.34% 5.14% 5.45% 7.63% 6.48% 8.91%Private Diversifying Assets 127,650,486 -0.93% -2.09% -2.09% 5.53% 6.73% 6.54% 5.85% 6.89%

Appendix VII - Private Markets Report (as of February 2018) - Total Commitment
Total Commitment Total Unfunded
Commitment by Vintage Year
Data provided by Texas Tech University SystemReported valuations use latest available statements ranging from September 2017 to February 2018Adjusted Valuations include all cashflows through February 2018
195,702,805
254,500,000
204,000,000
58,663,450
Private Credit
Private Equity
Private Real Assets
Private Real Estate
73,768,960
103,970,516
26,749,554 3,350,183
Private Credit
Private Equity
Private Real Assets
Private Real Estate
-
20
40
60
80
100
120
2004 2005 2006 2007 2008 2009 2010 2011 2012 2013 2014 2015 2016 2017 2018
Mill
ions
Distressed Credit
Venture Capital
Value-Add
Opportunistic Real Estate
Direct Investment
Infrastructure
Power
Energy
Loans
Opportunistic Credit
Distressed Equity
Secondaries
Opportunistic Equity
Growth Equity
Buyout
1328th February 2018

Appendix VII - Private Markets Report (as of February 2018) - Performance Analysis by Asset Class & Strategy Type
Performance by Strategy Type
Performance by Asset Class
Asset Class Strategy # of Funds Commitment Funded Paid-In Capital Distributions % Drawn Reported Valuation Adjusted Valuation IRR TVPI
Private Equity
Buyout 3 $30,500,000 $25,429,809 $26,675,195 $9,124,020 87% $20,251,884 $20,251,884 5.78% 1.10
Distressed Equity 1 $25,000,000 $5,149,992 $5,149,992 $1,162,372 21% $6,095,776 $6,095,776 24.22% 1.41
Growth Equity 3 $37,500,000 $24,677,072 $28,010,174 $6,823,182 75% $27,426,826 $26,914,369 6.87% 1.20
Opportunistic Equity 7 $94,000,000 $64,526,129 $65,044,438 $31,014,051 69% $45,954,393 $43,748,713 3.93% 1.15
Secondaries 2 $17,500,000 $16,406,432 $17,102,042 $13,944,445 98% $5,388,947 $5,312,731 2.68% 1.13
Venture Capital 3 $50,000,000 $14,340,050 $14,730,675 $102,308 29% $13,828,805 $15,801,493 10.67% 1.08
Total 19 $254,500,000 $150,529,484 $156,712,516 $62,170,378 62% $118,946,631 $118,124,966 4.80% 1.15
Private Credit
Distressed Credit 3 $42,750,000 $40,119,345 $40,248,413 $20,598,106 94% $28,111,054 $28,111,054 5.85% 1.21
Loans 6 $81,452,805 $43,228,492 $43,787,221 $9,832,332 54% $33,382,675 $42,809,374 9.72% 1.20
Opportunistic Credit 6 $71,500,000 $38,586,008 $42,389,690 $10,587,403 59% $33,938,926 $37,999,065 6.63% 1.15
Total 15 $195,702,805 $121,933,845 $126,425,324 $41,017,841 65% $95,432,655 $108,919,493 7.11% 1.19
Private Real Assets
Energy 8 $112,000,000 $107,498,737 $113,850,389 $116,676,416 102% $36,268,723 $34,748,548 13.87% 1.34
Infrastructure 4 $48,500,000 $41,144,621 $49,957,486 $56,018,796 103% $20,971,481 $21,616,370 29.38% 1.55
Power 3 $28,500,000 $25,362,399 $26,223,289 $10,228,287 92% $11,092,903 $14,592,903 -1.79% 0.95
Opportunistic Real Assets 1 $15,000,000 $5,182,764 $5,182,764 $0 35% $5,172,651 $5,172,651 0.00% 0.00
Total 16 $204,000,000 $179,188,521 $195,213,928 $182,923,499 96% $73,505,758 $76,130,472 14.05% 1.33
Private Real Estate
Direct Investment 2 $38,663,450 $39,709,817 $41,101,630 $12,571,399 106% $40,795,042 $37,382,991 9.10% 1.22
Opportunistic Real Estate 1 $10,000,000 $10,000,000 $10,000,000 $0 100% $3,618,165 $3,618,165 -11.68% 0.36
Value-Add 1 $10,000,000 $7,554,674 $7,611,174 $7,021,272 76% $7,256,463 $6,751,463 12.45% 1.81
Total 4 $58,663,450 $57,264,491 $58,712,804 $19,592,671 100% $51,669,670 $47,752,619 3.80% 1.15
Asset Class # of Funds Commitment Funded Paid-In Capital Distributions % Drawn Reported Valuation Adjusted Valuation IRR TVPI
Private Equity 19 $254,500,000 $150,529,484 $156,712,516 $62,170,378 62% $118,946,631 $118,124,966 4.80% 1.15
Private Credit 15 $195,702,805 $121,933,845 $126,425,324 $41,017,841 65% $95,432,655 $108,919,493 7.11% 1.19
Private Real Assets 16 $204,000,000 $179,188,521 $195,213,928 $182,923,499 96% $73,505,758 $76,130,472 14.05% 1.33
Private Real Estate 4 $58,663,450 $57,264,491 $58,712,804 $19,592,671 100% $51,669,670 $47,752,619 3.80% 1.15
Total 54 $712,866,255 $508,916,341 $537,064,572 $305,704,389 75% $339,554,714 $350,927,550 8.20% 1.23
1428th February 2018

Appendix III – Glossary
15
Alpha Pool: Investments that tend to be uncorrelated with “traditional” stock and bond investments. Not technically an asset class, but rather an investment construct within a *portable alpha framework
Cash & Equivalents: Cash and short term investments held in lieu of cash and readily converted into cash within a short time span (i.e., CDs, commercial paper, Treasury bills, etc.)
Global Debt: Investments in debt instruments located in developed markets, may include various credit, mortgage-backed and emerging markets debt securities
Global Equity: Investments in companies domiciled in developed market countries and may include opportunistic investments in emerging market countries
Liquidating: The residual investment in terminated managers
Liquid Real Assets: Liquid investments in strategies whose values are sensitive to inflation
Private Equity: Investments in equity securities and debt in operating companies that are not publicly traded on a stock exchange
Private Real Assets: Investments in equity securities and debt in operating companies that are not publicly traded on a stock exchange and whose strategies are sensitive to inflation
Alternative Equity: Investments in companies globally through both long and short positions and may include non-equity instruments such as fixed income, commodities, CDS, options, etc.
Credit: Investments in companies, often stressed or distressed, principally through the debt portion of capital structure
Emerging Market Debt: Investments in debt securities in emerging market countries, primarily in three categories - external sovereign, local sovereign, and corporate debt
Emerging Market Equity: Investments in companies located in emerging market countries
Investment Grade Bonds: Investments in investment grade rated debt securities
Non-US Developed Equity: Investments in companies domiciled in developed market countries
US Equity: Investments in companies domiciled in the US
Major Asset Classes
Sub-Asset Classes
28th February 2018


