27
Results Presentation Financial Year 2016 • Text Steve Gostlow, Managing Director 23 August 2016 For personal use only

Results PresentationFinancial Year 2016
• Text
Steve Gostlow, Managing Director
23 August 2016
For
per
sona
l use
onl
y

Agenda
Contents
1 Toxfree overview
2 Corporate Strategy
3 FY16 Key Highlights
4 Safety and our people
5 FY16 Group Results
6 Outlook
2
For
per
sona
l use
onl
y

Toxfree overview
3
• Diverse range of industrial & waste services to all market sectors
• One of the largest industrial services & waste management businesses in Australia
• Employer of over 1350 people nationally
• National network of strategically located waste treatment facilities throughout Australia
For
per
sona
l use
onl
y

Corporate strategyToxfree is a waste specialist
• Targeting industrial, hazardous and difficult to treat waste materials
• Focus on innovation, best practice, low operating cost technologies, resource recovery solutions and landfill avoidance
• Unique and Strategic Licences throughout Australia
• High barriers to entry
• Servicing all industry sectors, households and government
Technical and Environmental Services
A Leader in Hazardous and Industrial Waste Management
• Total waste management solutions to industrial clients
• Total waste management in regional resource hubs – primarily in WA, QLD, Tas, SA and NT
• Municipal, Commercial and Industrial services in regional areas
• One stop shop
Waste Services
Providing waste services in all industrial markets in Australia
• Producing assets
• Long term contracts
• Blue chip clients
• Ideally integrated with waste services
• Mining, Oil and Gas, Heavy Industry
Industrial services
A Leader in provision of industrial services throughout Australia
‘Based on our strategy Toxfree have estimated a target
market of approximately $4Bn to 5Bn pa*’
4
*Source: insidewaste, Industry Report 2014-15 , IBIS – Waste Disposal Services in Australia 2012 and Toxfree estimates.
For
per
sona
l use
onl
y

Corporate strategy – execution over the last 10 years
5
2005 2 Hazardous Waste Sites in WA, Revenue of $6M, 20 employees Further focus on treatment
of additional waste streams2005- 2013 Expanded network of licensed
hazardous and industrial waste facilities throughout Australia particularly with the acquisition of DMX in 2012
2007 Complementary addition of waste services and focus on total waste management solutions to our clients
2008 Expanded capability with complementary expansion into industrial services market nationally
2009 Tailored total waste solutions for our clients – one stop shop, all wastes, anytime, complementary industrial cleaning – large long term contracts
2013 Significant expansion in QLD and further diversification into commercial waste sector through acquisition of Wanless
Then Today
Over 55 strategic operations throughout
Australia
20,000 clients
1350 employees
Total Waste Management in
Australia to industrial customers
Unique technologies
Strategic licenses
Significant IP
Strong safety culture & performance
2016 & Beyond
New markets and geographies
Increased market share –Large, long term contracts
Targeted acquisitions that support our strategy
‘Can Do’ Culture safe.reliable.sustainable
2016 Significant expansion in NSW into industrial bulk liquid waste and chemical fixation through acquisition of Worth
Toxfree – An industrial and problematic waste
specialist
For
per
sona
l use
onl
y

Diversification by sector - FY13 to FY17* (forecast)
6
• Further diversification occurs in FY17 through addition of Worth Recycling, BHPB Olympic Dam contract and expected growth in east coast markets
• FY13 resource construction included Iron Ore, Coal, LNG upstream and downstream construction including CSG and related activities in the Pilbara, Broome, Darwin, Surat, Gladstone and Mackay regions
• Resource production clients grow as LNG and Iron Ore production increases in Australia
*FY17 forecasts are based on management estimates at time of publication of this report.
For
per
sona
l use
onl
y

Diversification by region - FY13 to FY17* (forecast)
7
• Regional diversification continues in FY17 through addition of Worth Recycling (NSW), BHPB Olympic Dam (SA) and expected growth in east coast markets
• WA continues to be an important region for Toxfree through growth in NW LNG and Iron Ore production.
*FY17 forecasts are based on management estimates at time of publication of this report.
For
per
sona
l use
onl
y

FY16 Key Highlights
• Zero Lost Time Injuries
• Reduction in Total Recordable Injury Frequency Rate of 18%
Safety
• Revenue down 3% on FY15 to $393.4M
• Underlying EBITDA* up 1% on FY15 to $72.9M
• Underlying NPAT* up 1% on FY15 to $23.3M
• Statutory NPAT down 41% on FY15 to $13.1M
• Dividend increased by 6% to 9.0 cents per share
• Net debt to equity of 37%
• Strong cash conversion - 99% of EBITDA*
Financial
• East Coast Waste Services EBIT up over 40% through growth in commercial waste volumes
• Industrial Services – strong performance in civil infrastructure and utilities on the east coast
• Technical and Environmental Services – Victoria and NSW regions perform solidly
Operations
* Non-IFRS financial information (refer slide 12 for further detail)
8
For
per
sona
l use
onl
y

Safety And Our People
• No lost time injuries, maintaining our Lost Time Injury Rate of zero.
• Total Recordable Injury Frequency Rate (TRIFR) of 6.7, an 18% reduction on our FY15 result.
• All Injury Frequency Rate (AIFR) of 24.5, a 43% reduction on our FY15 result.
• Our safety lead indicators continue to strengthen and have improved by 90% on our FY15 result.
• Recognised by Rio Tinto Iron Ore for our contribution with the Core Services Division who were the recipient of the Global CEO Award for Safety for the second year running.
• Achievement of 6 years lost time injury free on Gorgon Barrow Island.
• Implementation of a standardised asset maintenance system and commencement of in vehicle monitoring system using our ERP.
• Winner of the Diversity Award in the Australian Business Awards 2016.
9
For
per
sona
l use
onl
y

FY16 – Group Result
• Strong earnings performance achieved - Underlying EBITDA* of $72.9 M.
• Underlying group EBITDA* margin of 18.5% improved on FY15 by 86 bps through improvement in operating efficiencies and cost reductions across the business.
• Strong cash flow – 99% of EBITDA*.
• Healthy balance sheet – net debt to equity of 37%.
• The Company’s strategy, developed over 10 years ago, to continually diversify our services across all industry sectors continues to demonstrate success with growth in east coast operations offsetting decline in resource based construction volumes.
• Result supported by increased commercial waste volumes in Queensland, consistent performance from major production contracts, increased volumes of household hazardous wastes and industrial services to the civil infrastructure and municipal sector in Victoria.
• Strategic expansion into the NSW industrial services and hazardous waste treatment market through acquisition of Worth Recycling on 1 April 2016.
• Expansion of services into E-waste management and chemical cleaning broadening Toxfree’s service offering.
• Award of 5 year BHPB Olympic Dam contract for both industrial services and waste management which commenced on 1 July 2016.
10
* Non-IFRS financial information (refer slide 12 for further detail)
For
per
sona
l use
onl
y

FY16 – Group Result
Group Results FY16 ($’000) FY15 ($’000) % Change
Revenue 393,380 407,278 (3)%
EBITDA* 72,875 71,876 1%
Depreciation (31,594) (29,655) 7%
Amortisation (1,914) (2,073) (8)%
EBIT* 39,367 40,148 (2)%
Finance expenses (6,154) (6,505) (5)%
Profit before tax* 33,213 33,643 (1)%
Income tax expense* (9,957) (10,673) (7)%
Underlying net profit after tax* 23,256 22,970 1%
Statutory net profit after tax 13,054 21,994 (41)%
Earnings per share (cents)* 16.70 17.00 (2)%
Dividend per share (cents) 9.0 8.5 6%
Weighted average number of shares (million) 136.6 133.8 2%
* Non-IFRS financial information (refer slide 12 for further detail) 11
For
per
sona
l use
onl
y

FY16 Normalisations
Improved efficiency and cost reduction
• Major organisational restructure was completed during FY16.• Successful implementation of Toxfree’s ERP enabled the set up of
centralised shared services model.• Organisational structure was flattened and consolidated under three
service lines. • This resulted in one off restructuring and redundancy costs of $4.4M.
Acquisitions and rebranding costs
• Costs associated with the acquisition of Worth and PGM including advisory, legal, consulting, regulatory and rebranding costs.
Centres of excellence
• A complete review of all operating sites enabled the consolidation of a number of sites in similar locations. This resulted in some site closures in Qld and Victoria. The costs associated with the site closures of $1.4M have been normalised as well as a $1M asset write off of a non-relocatable site improvements.
Port Hedland specific impairment
• In an effort to reduce costs and increase competitiveness some of Port Hedland’s services have been directed to our Karrathasite and the Port Hedland facility was downsized. Subdued revenue in the near term resulted in a one off specific impairment of $2.6M being booked.
12
For Statutory purposes the above costs are allocated to the following segments; Technical and Environmental $4,964k; Waste Services $3,231k; Industrial Services $132k and Corporate $4,843 (FY15: $1,395).
Exclusions
FY16
$‘000
Acquisition, integration and rebranding costs 4,728
Impairment losses – Port Hedland 2,639
Asset write-offs – vacated sites 1,019
Redundancy and restructuring costs 4,425
Site closure costs 1,426
Reduction in contingent consideration (1,067)
Income tax expense (2,968)
Total costs after tax 10,202
For
per
sona
l use
onl
y

FY16 – Technical & Environmental Services
13
• 3 month contribution from Worth Recycling achieving $3.4M EBITDA.• Change in business mix effects divisional margins through Worth contribution (Worth EBITDA margin of 21%). • Implementation of NSW EPA Community Recycling Centres continues with 60 sites now in place with another 40
to be rolled out over the next 12 months.• Redevelopment of Narangba facility to enable relocation and closure of Coopers Plains site.• Earnings from east coast facilities increased by 28% on FY15 offsetting reduction in earnings from west coast
facilities.• Award of contract with WA Dept. of Premier and Cabinet for the cleanup of fire effected properties in Yarloop
WA.• Expansion into the rapidly growing e-waste sector in Victoria through acquisition of PGM refineries.• Karratha Waste to Energy continues through approvals process – tracking approximately 6 months behind
schedule.
FY16 FY15 Variance
Revenue ($M) 67.8 53.4 27%
EBITDA* ($M) 21.2 19.9 7%
EBITDA* margin 31% 37% (600)bps
EBIT* ($M) 14.6 14.6 0%
EBIT* margin 22% 27% (500) Bps
* Non-IFRS financial information (refer slide 12 for further detail)
For
per
sona
l use
onl
y

Acquisition of Worth Recycling
• $70M acquisition of Worth Recycling completed on 1 April 2016.
• Worth operates in the NSW liquid and solid waste and industrial services markets
• Collects, transports, processes and recycles liquid, sludge and contaminated soil.• Provides confined space services, industrial cleaning and non destructive digging.• Operates EPA licensed liquid waste treatment facilities in Windsor and Pt Kembla and soil
remediation and immobilisation treatment facilities in St Marys.• Fleet of liquid and vacuum tankers including heavy vacs with average fleet age of 5.3 years.• Operations in metropolitan Sydney, the Illawarra and the Hunter Valley.• Established 1976 and grown through investment in treatment facilities and fleet over time.
• Operational integration with Toxfree is complete and rebranding has commenced.
• Systems integration onto Toxfree’s ERP is underway with completion expected 1 October 2016.
• Realisation of synergies continues to be a focus through use of Toxfree’s centralized shared services and consolidation of operating sites within the same regions to improve efficiency and reduce costs.
• Earnings in the first three months under Toxfree’s ownership have met expectations achieving $16m revenue and $3.4m EBITDA.
• Worth are tendering on a number of significant contaminated soil remediation projects with the NSW market.
14
For
per
sona
l use
onl
y

TES diversification - FY13 to FY17* (forecast)
15
*FY17 forecasts are based on management estimates at time of publication of this report.
• Worth contribution to TES division in east coast markets
• Upstream oil and gas development declined significantly at the commencement of FY16
• LNG downstream volumes of hazardous and industrial waste increase in FY17 and beyond
• Household Hazardous and consumer based industrial wastes continue their growth in FY17F
or p
erso
nal u
se o
nly
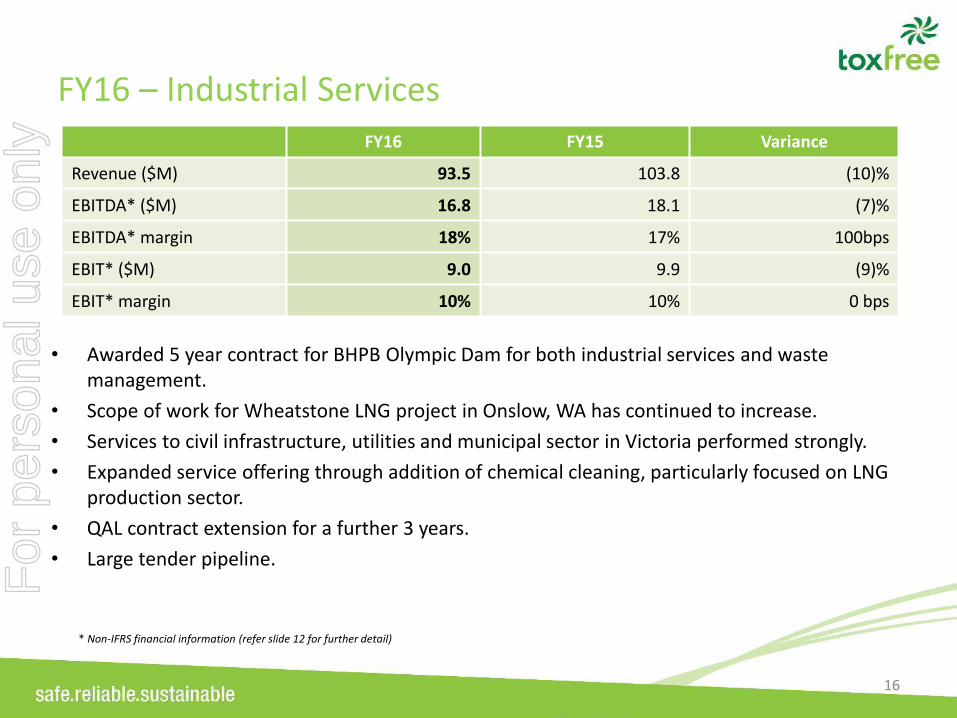
FY16 – Industrial Services
16
• Awarded 5 year contract for BHPB Olympic Dam for both industrial services and waste management.
• Scope of work for Wheatstone LNG project in Onslow, WA has continued to increase.
• Services to civil infrastructure, utilities and municipal sector in Victoria performed strongly.
• Expanded service offering through addition of chemical cleaning, particularly focused on LNG production sector.
• QAL contract extension for a further 3 years.
• Large tender pipeline.
FY16 FY15 Variance
Revenue ($M) 93.5 103.8 (10)%
EBITDA* ($M) 16.8 18.1 (7)%
EBITDA* margin 18% 17% 100bps
EBIT* ($M) 9.0 9.9 (9)%
EBIT* margin 10% 10% 0 bps
* Non-IFRS financial information (refer slide 12 for further detail)
For
per
sona
l use
onl
y

IS diversification - FY13 to FY17* (forecast)
17
*FY17 forecasts are based on management estimates at time of publication of this report.
• Full year Worth contribution to IS division in east coast markets
• Industrial services main services are to production assets, civil infrastructure and utilities
• BHPB Olympic Dam contract commenced 1 July 2016
For
per
sona
l use
onl
y

FY16 – Waste Services
18
FY16 FY15 Variance
Revenue ($M) 232.1 250.1 (7)%
EBITDA* ($M) 59.2 62.1 (5)%
EBITDA* margin 26% 25% 100 bps
EBIT* ($M) 41.9 45.0 (7)%
EBIT* margin 18% 18% 0 bps
• Waste Services East Coast performing well through growth in Queensland commercial waste volumes.
• Pilbara - Services to Iron Ore production remain stable.
• Volumes of waste from Barrow Island declined as LNG production commenced in FY16 – Safety performance continues strongly with zero LTIs and zero TRIFR in the region.
• Depreciation increased through investment in new fleet to manage safety, improve service delivery and reduce R&M – Toxfree’s average fleet age is 6 years.
• Consolidation of Mackay, Rockhampton, Roma, Toowoomba and Chinchilla operations to reduce costs and improve efficiencies.
* Non-IFRS financial information (refer slide 12 for further detail)
For
per
sona
l use
onl
y

Waste Services diversification - FY13 to FY17* (forecast)
19
*FY17 forecasts are based on management estimates at time of publication of this report.
• Growth in east coast commercial and industrial sectors continue
• Resource based construction waste volumes from Iron Ore, LNG and related regions have declined significantly over recent years.
• LNG and Iron Ore move to production and remain a target sector for Toxfree
• Wanless was acquired 1 May 2013 – 2 month contribution to FY13F
or p
erso
nal u
se o
nly

Corporate
20
• Strong cash conversion - 99% of EBITDA*.
• Increased dividend of 9.0 cents per share reflects the strong balance sheet position of the Company.
• Reduction in corporate costs by 13% through major restructuring, leveraging ERP and reducing costs across the organization.
• Planned implementation of time and attendance, optical scanning software and in vehicle monitoring systems (IVMS) to further improve efficiencies in FY17.
• Net cash capital expenditure of $23.4M (excludes acquisitions).
• New banking facilities established to support growth strategy.
FY16 FY15 Variance
EBITDA* ($M) (24.4) (28.1) (13)%
EBIT* ($M) (26.1) (29.4) (11)%
% EBITDA * to revenue 6.2% 6.9% (700) bps
* Non-IFRS financial information (refer slide 12 for further detail)
For
per
sona
l use
onl
y

Group Cash Flow
FY16 ($’000) FY15 ($’000) % Change
Gross operating cash flow 72,459 72,111 0.5%
Other revenue 561 370 52%
Net interest paid (4,655) (4,869) (4)%
Income taxes paid (8,985) (6,329) 42%
Net operating cash flows 59,380 61,283 (3)%
Net purchases of PP&E (23,382) (39,278) (40)%
Payments for acquisitions – net of cash acquired (68,554) (5,328) 1,186%
Net investing cash flows (91,936) (44,606) 106%
Net proceeds from borrowings/(repayment of borrowings) 33,048 (1,333) 2,579%
Payments for shares acquired by Employee Share Trust (165) (775) (79)%
Dividends paid (10,784) (8,788) 23%
Dividends paid to non-controlling interests (503) (2,240) (78)%
Net proceeds from the issue of share capital 23,203 - 100%
Net financing cash flows 44,799 (13,136) 441%
Net increase in cash 12,243 3,541 246%
Cash at the beginning of the half year 19,709 16,168 22%
Cash at the end of the half year 31,952 19,709 62%
For
per
sona
l use
onl
y

Balance Sheet
FY16 ($’000) FY15 ($’000) % Change
Cash 31,952 19,709 62%
Trade and other receivables 90,908 88,586 3%
Inventories 584 241 142%
Tax assets 11,414 7,954 44%
Property, plant and equipment 175,943 153,486 15%
Intangibles 180,173 151,388 19%
Total assets 490,974 421,364 17%
Trade and other payables 54,129 46,451 17%
Loans and borrowings 133,853 100,517 33%
Employee benefits 10,346 8,487 22%
Tax liabilities 8,143 6,908 18%
Provisions 6,477 6,402 1%
Derivatives 1,663 1,864 (11)%
Total liabilities 214,611 170,629 26%
Total equity 276,363 250,735 10%
NET DEBT TO EQUITY 37% 32% 500bps
For
per
sona
l use
onl
y

Key drivers and barriers to entry
• Increasing government landfill levies and disposal costs will divert waste from landfill and continue to drive recycling and treatmentCommercial
• Government regulation through product stewardship and regulatory initiatives is also driving the transition from landfill to recycling and recovery
Regulation
• There is a global trend for more sustainable waste practices driven by public and corporate social responsibilitySustainability
• Large clients are aggregating procurement and increasing numbers seek a “One Stop Shop” solutionConsolidation
• IP, technologies, licenses, regulation and compliance, capex, talented and experienced workforceBarriers
23
For
per
sona
l use
onl
y

Strategic Initiatives – FY17
24
For
per
sona
l use
onl
y

Outlook• Improved conditions in east coast markets are expected to drive further growth from our east coast
operations.
• Worth Recycling will contribute a full year of revenue and earnings in FY17 (3 months in FY16) further diversifying the business.
• BHPB Olympic Dam contract commenced on 1 July 2016.
• Contracts to production based clients within the iron ore and alumina sector are expected to remain stable.
• Strategic initiatives aimed at further diversifying our service by geography and waste type remain a focus.
• Further business development opportunities exist across Australia – large tender book.
• Volumes of waste from Barrow Island and other construction related projects are expected to decline over the near term as the facilities complete construction, however new LNG production facilities coming on line in the medium term provide opportunities for growth.
• Household hazardous waste volumes and e-waste volumes are expected to increase supported by regulatory framework and community sustainability.
• Currently Toxfree is forecasting underlying EBITDA* growth in a range from 5% to 10% on FY16.
• The available waste market is large and Toxfree is confident on continuing to build its market share through organic growth, contract award and strategic acquisition.
* Non-IFRS financial information (refer slide 12 for further detail)
25
For
per
sona
l use
onl
y

QuestionsSteve GostlowManaging DirectorEmail: [email protected]: +61 8 6216 7000
safe.reliable.sustainable
For
per
sona
l use
onl
y

DisclaimerSummary information
This presentation contains summary information of TOX Solutions Limited (“TOX”) and is dated August 2016. The information is this presentation does not purport to be complete or comprehensive, and does not purport to summarise all information that an investor should consider when making an investment decision. It should be read in conjunction with TOX’s other periodic and continuous disclosure announcements lodged with the Australian Securities Exchange (“ASX”), which are available at www.asx.com.au
Not investment advice
This presentation is not a prospectus or a product disclosure statement under the Corporations Act 2001 (Cth) and has not been lodged with the Australian Securities and Investment Commission (“ASIC). The information provided in this presentation is not intended to be relied upon as advice to investors or potential investors and has been prepared without taking into account the recipient’s investment objectives, financial circumstances or particular needs. Those individual objectives, circumstances and needs should be considered, with professional advice, when deciding if an investment is appropriate.
Financial data
All dollar values are in Australian dollars (A$) and financial data is presented within the financial period end of 30 June 2016 unless otherwise stated.Risks of investment
An investment in TOX shares is subject to investment and other known and unknown risks, some of which are beyond the control of TOX. Tox does not guarantee any particular rate of return or the performance of TOX nor does it guarantee the repayment of capital from TOX or any particular tax treatment. You should have regard to (among other things) the risks outlined in this presentation.
Forward looking statements
This presentation contains certain forward – looking statements. The words ‘anticipate’, ‘believe’, ‘expect’, ‘project’, ‘forecast,’ ‘estimate’, ‘likely’,’ intend’, ‘should’, ‘could’, ‘may’, ‘target’, ‘plan’, and other similar expressions are intended to identify forward-looking statements. Indication of, and guidance on, future earnings and financial position and performance are also forward – looking statements. Such forward-looking statements are not guarantees of future performance and involve known and unknown risks, uncertainties and other factors, many of which are beyond the control of TOX, that may cause actual results to differ materially from those expressed or implied in such statement. There can be no assurance that actual outcomes will both differ materially from these statements. You should not place undue reliance on forward-looking statements and neither TOX nor any of its directors, employees, servants, advisers or amend assume any obligation to update such information.
Not for distribution or release in the United States
This presentation has been prepared for publication in Australian and may not be distributed or released on United States. This presentation does not constitute an offer or shares for sale in the United States or in any other jurisdiction in which such an offer would be illegal.
27
For
per
sona
l use
onl
y


