TEXT MINING ON TWITTER DATA TO EVALUATE SENTIMENT BY SRIJANEE NIYOGI Presented to the Faculty of the Graduate School of The University of Texas at Arlington in Partial Fulfillment of the Requirements for the Degree of MASTER OF SCIENCE IN COMPUTER SCIENCE THE UNIVERSITY OF TEXAS AT ARLINGTON December 2018
Transcript
TEXT MINING ON TWITTER DATA TO EVALUATE SENTIMENT
BY
SRIJANEE NIYOGI
Presented to the Faculty of the Graduate School of
The University of Texas at Arlington in Partial Fulfillment
of the Requirements
for the Degree of
MASTER OF SCIENCE IN COMPUTER SCIENCE
THE UNIVERSITY OF TEXAS AT ARLINGTON
December 2018
ii
Acknowledgements
I would like to express my sincere gratitude to Mr. David Levine, my thesis supervisor who has
guided and motivated me in the course of this thesis. His continuous support with patience and
enthusiasm has helped me in contributing my research work in this thesis. He has always been a
major support system in any problems that I faced academically and personal
I would like to acknowledge and thank my committee member for their co-operation, feedback
and support. They added some extra value to my thesis
My heartfelt thanks to my family without whose support and motivation, this would not have
been possible.
October 23, 2018
iii
Abstract
TWITTER DATA ANALYSIS ACCORDING TO SENTIMENT
BY
SRIJANEE NIYOGI
The University of Texas at Arlington, 2018
Supervising Professor: David Levine
Committee Members: Christoph Csallner
Farhad Kamangar
Social media platforms have been a major part of our daily lives. But with the freedom of
expression there is no way one can check whether the posts/tweets/expressions are classified on
which polarity. Since Twitter is one of the biggest social platforms for microblogging, hence the
experiment was done on this platform. There are several topics that are popular over the internet
like sports, politics, finance, technology are chosen as the source of the experiment. These tweets
were collected over a span of time for more than 2 months via a cron job.
Every tweet can be divided into three categories based on sentiment analysis, positive, negative
or neutral. In the process of analyzing the sentiment, Natural Language Processing is widely used
for data processing like removing stopwords, lemmatization, tokenization and POS tagging. In
this work, focus is on the detection and prediction of sentiments based on tweets, associated with
different topics. There are several ways to carry out the analysis using libraries, APIs, classifiers
and tools. The use of data mining techniques namely data extraction, data cleaning, data storage,
comparison with other reliable sources and finally sentiment analysis is followed for this thesis.
In this experiments and analysis, a comparative study of sentiment analysis of various tweets
collected over a span of time, by using many data mining techniques is presented. The
techniques used are mainly lexicon-based, machine learning based using Random Forest
Classifier, API based Stanford NLP Sentiment analyzer and a tool called SentiStrength. The fifth
way of analysis is an expert, i.e. a human carrying out the analysis. In this approach, the polarity
of a particular tweet is found, analyzed and a confusion matrix is prepared. From that matrix
tweets are broadly classified into 4 classes, namely False Positive, False Negative, True Positive
and True Negative, which are used to calculate parameters like accuracy, precision and recall.
iv
This entire task is transformed to a cloud-based web interface hosted on Amazon Web Services
to carry out the operations without human intervention on live data.
LIST OF FIGURES
2.1 The different steps of data mining
4.1 Crontab file
5.1 Different functionalities of NLTK
5.2 A list of stopwords
5.3 A pie chart representing the tweets extracted on the topic of politics and the names of
politicians used
5.4 A bar graph on number of tweets that are extracted over a week on each day
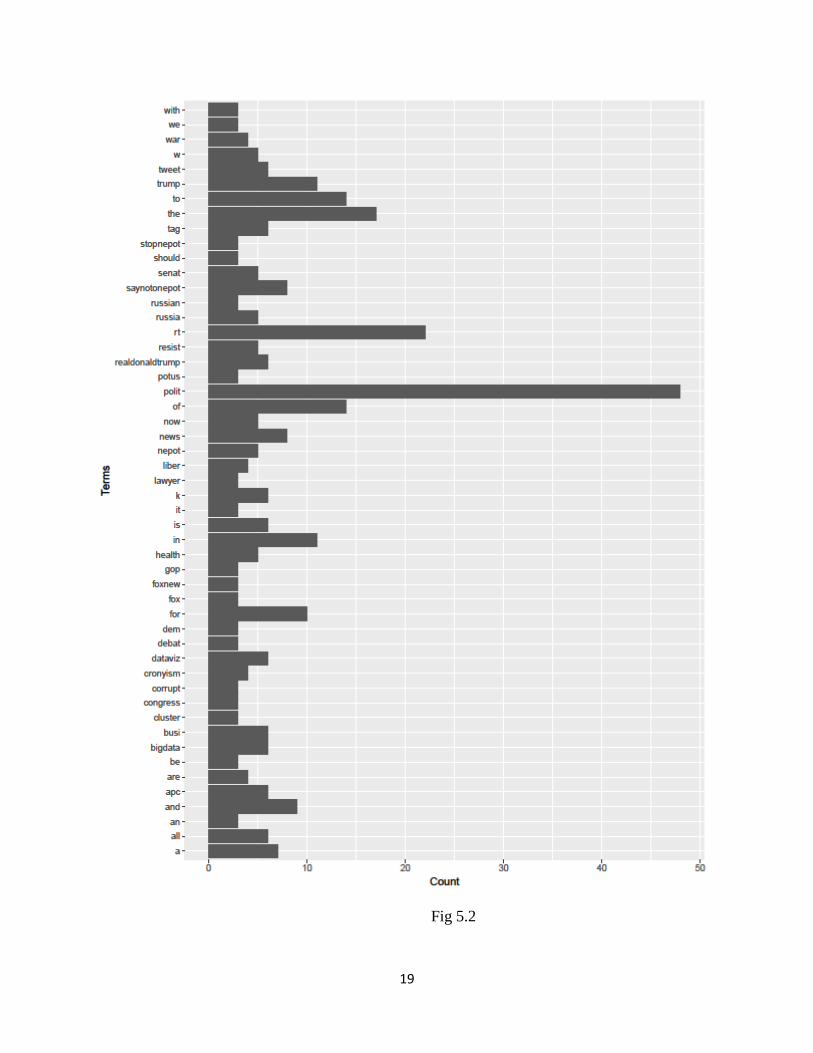
5.5 A bar graph to denote the frequency of every word used
6.1 Python code and result to show different functionalities with TextBlob
6.2 A % pie chart to determine the polarity of tweets using TextBlob
6.3 How the Random classifier works
6.4 Figure denotes the pie chart denoting polarity derived from applying Random Forest
Classifier
6.5 denotes the model constructed by both the training and the test data set.
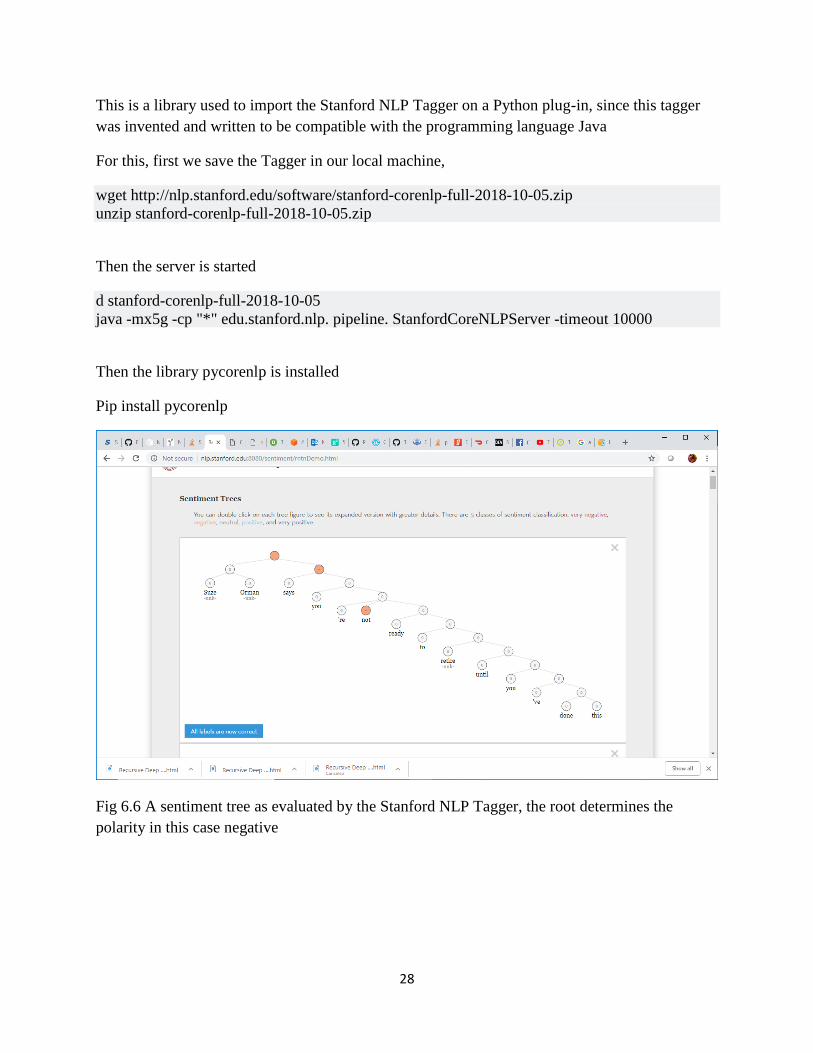
6.6 A sentiment tree as evaluated by the Stanford NLP Tagger, the root determines the polarity in
this case negative
6.7 A positive analyzed tweet by Stanford NLP Tagger
6.8 Graph showing the plotting of the polarity of tweets over a time period of 15 days.
7.1 EC2 instance launched on AWS
7.2 Database instance launched on AWS
7.3 The input html page for the cloud application
7.4 The output html page of a pie chart for every separate tool doing sentiment analysis.
7.5 Choosing AMI server on configuring EC2
v
7.6 Choosing inbound nad outbound security rules on configuring EC2
7.7 Using Putty terminal to connect to AWS EC2 from a Windows 10 local machine
7.8 Using WinSCP to upload and download files to and from AWS EC2
8.1 CNN RSS Feeds page
8.2 The NLP analyzer shows every text in the form of binary trees and the red root denotes
negative polarity, blue=positive and white denotes neutral sentiments.
8.3 The comparison in performance for the 2 tools in the different natural language processing
activities.
8.4 Figure denotes a pie chart to find the percentage on negative and positive sentiments using
Naive Bayesian classifier
8.5 Customer reviews as available on the website of amazon.com
8.6 Mechanism of web scrapping
vi
LIST OF TABLES
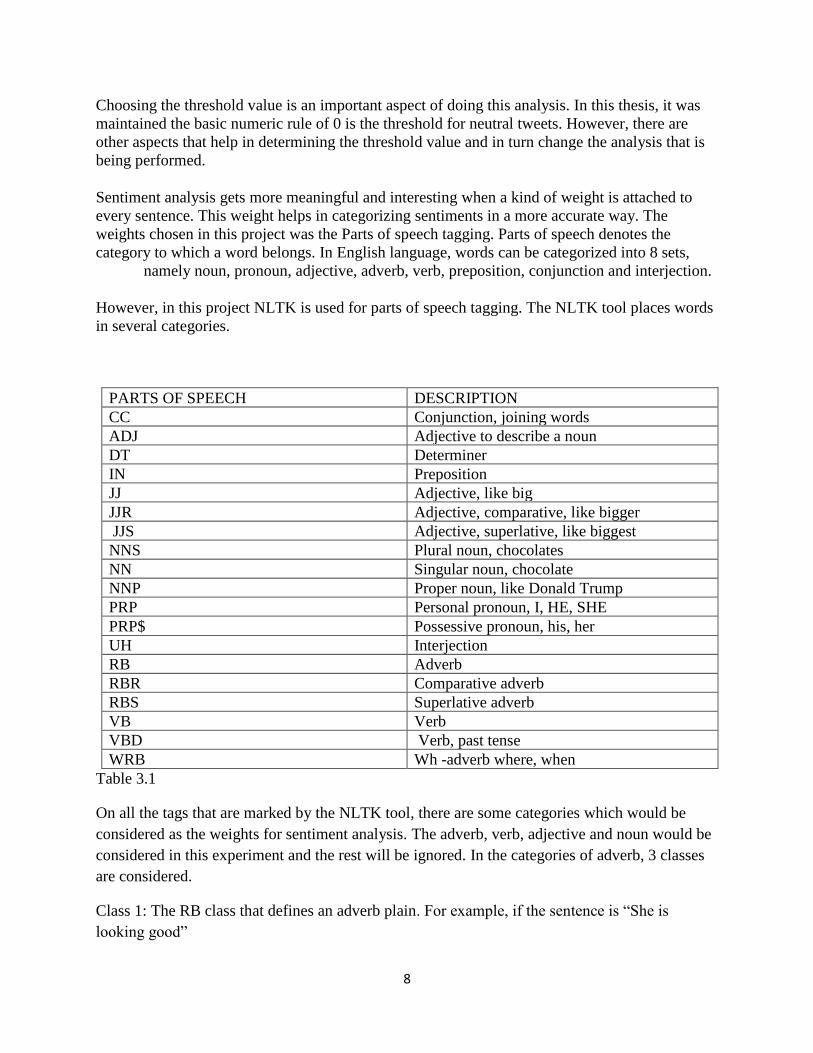
3.1 Tags to different parts of speech as used by NLTK
4.1 Columns derived from every tweet extracted
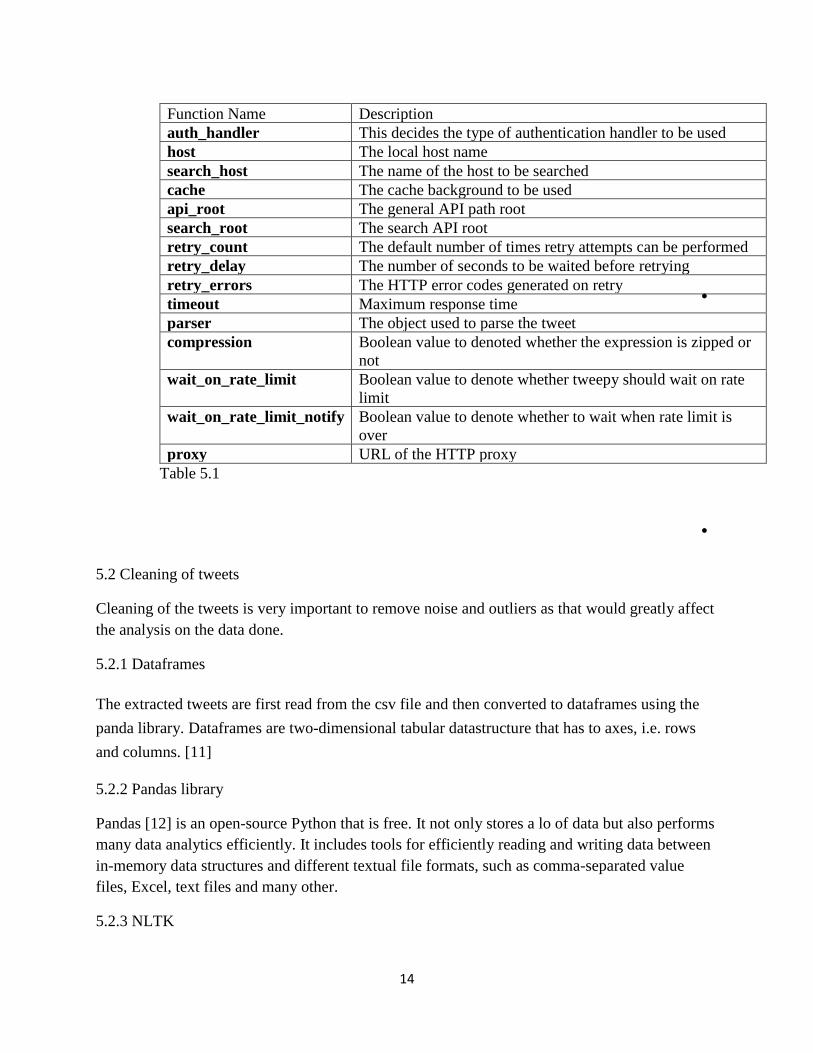
5.1 Functions provided by Tweepy library
5.2 Timeline parameters for Tweepy API
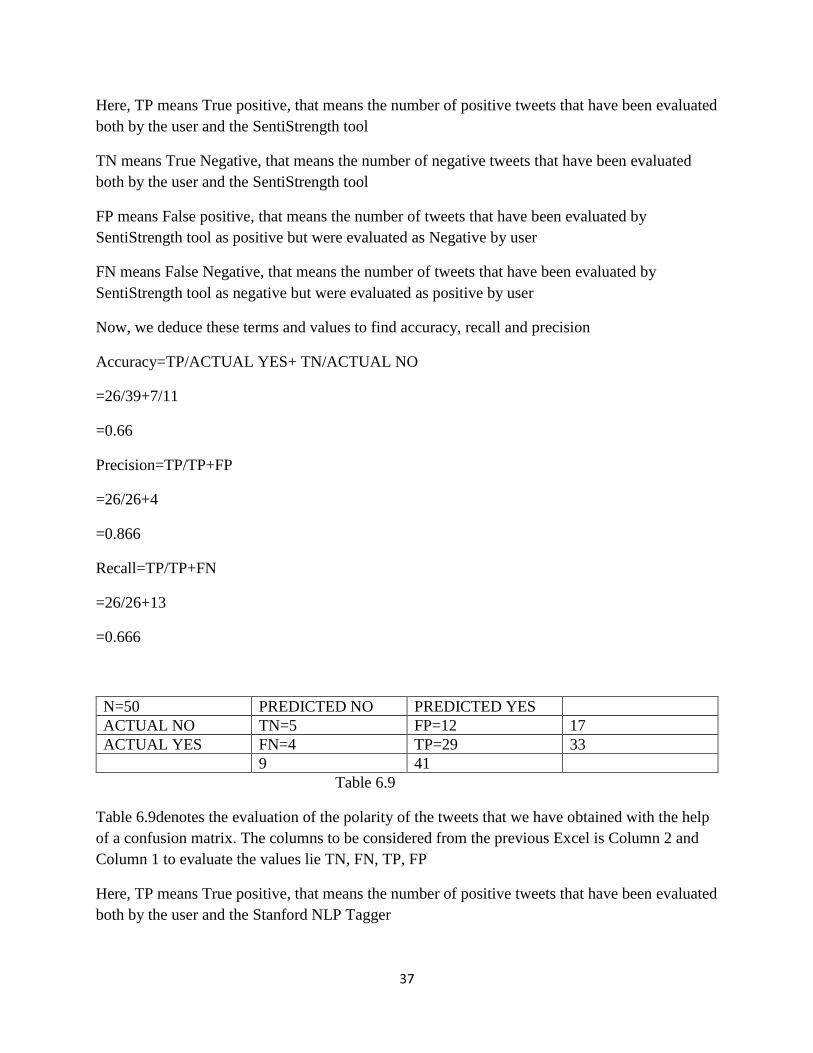
6.0 A sample confusion matrix
6.1 denotes the evaluation of the polarity of the tweets that we have obtained with the help of a
confusion matrix with TextBlob
6.2 denotes the evaluation of the polarity of the tweets that we have obtained with the help of a
confusion matrix with Classifier
6.3 denotes the evaluation of the polarity of the tweets that we have obtained with the help of a
confusion matrix with SentiStrength
6.4 Denotes the evaluation of the polarity of the tweets that we have obtained with the help of a
confusion matrix with NLP tagger
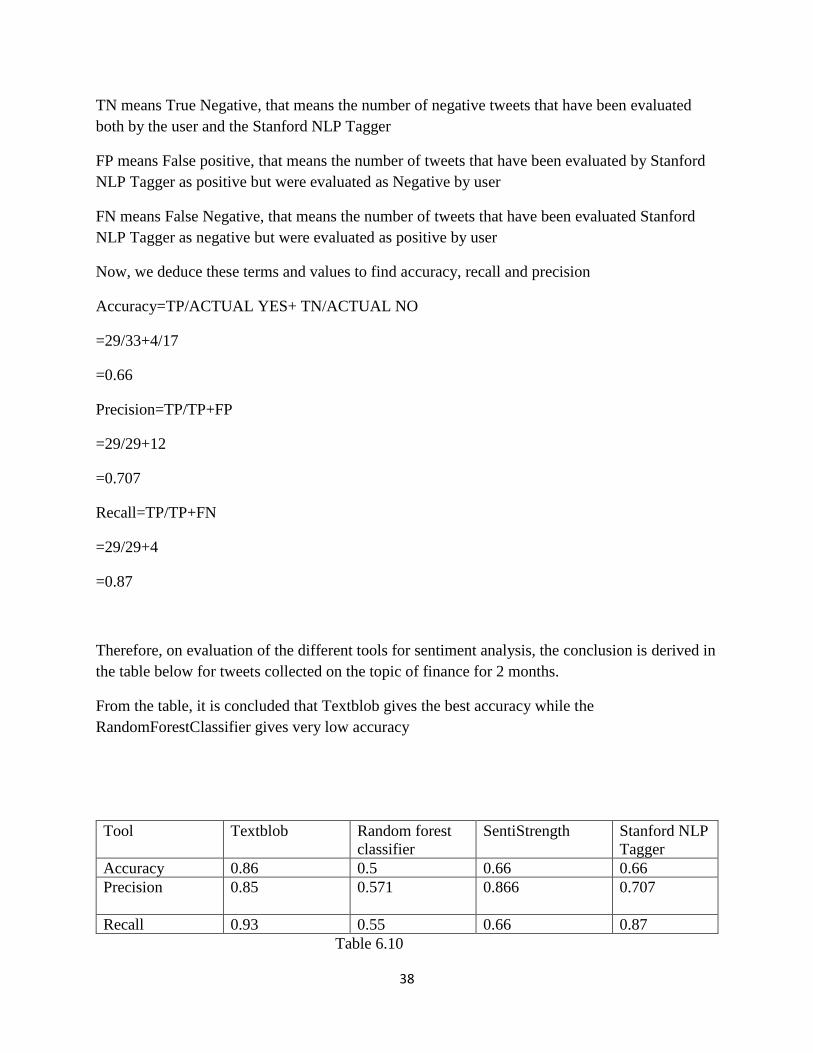
6.5 Table denoting recall, precision and accuracy for four different tools on the topic of Finance
6.6 denotes the evaluation of the polarity of the tweets that we have obtained with the help of a
confusion matrix with TextBlob
6.7 denotes the evaluation of the polarity of the tweets that we have obtained with the help of a
confusion matrix with Classifier
6.8 denotes the evaluation of the polarity of the tweets that we have obtained with the help of a
confusion matrix with SentiStrength
6.9 Denotes the evaluation of the polarity of the tweets that we have obtained with the help of a
confusion matrix with NLP tagger
6.10 Table denoting recall, precision and accuracy for four different tools on the topic of Politics
vii
6.11 denotes the evaluation of the polarity of the tweets that we have obtained with the help of a
confusion matrix with TextBlob
6.12 denotes the evaluation of the polarity of the tweets that we have obtained with the help of a
confusion matrix with Classifier
6.13 denotes the evaluation of the polarity of the tweets that we have obtained with the help of a
confusion matrix with SentiStrength
6.14 Denotes the evaluation of the polarity of the tweets that we have obtained with the help of a
confusion matrix with NLP tagger
6.15 Table denoting recall, precision and accuracy for four different tools on the topic of Sports
6.16 Accuracy measurement for the 4 different tools on the 3 different topics
6.17 Precision measurement for the 4 different tools on the 3 different topics
6.18 Recall measurement for the 4 different tools on the 3 different topics
8.1 Sentiment analysis on RSS feeds by 4 tools and an expert.
8.2 Sentiment analysis on an excerpt of a fiction by 4 tools and an expert.
8.3 Sentiment analysis on customer reviews from a website by
viii
PROBLEM STATEMENT
Twitter is one of the biggest platforms of expressing a person’s feeling on a social media. These
set of information can be used in several ways as data to analyze or deduce something. There is a
lot of things happening around the world in the field of politics. This is affecting the common
people in mass. For example, if a new amendment law has been passed it can have its own pros
or cons depending on the set of people and how they are affected. I wanted to therefore analyze
the sentiment of each tweets and find out whether they are inclined more towards positive or
negative polarity. This in future would help in determining whether the political situation is
getting better or worse. This kind of analysis would set an alarm in the world and politicians
would get a feedback of whether their practices are creating a negative or positive impact to the
world.
Plus, the data sources are vast and vivid, that it is difficult to analyze it and access it. Had it been
a single source of data, checking the authenticity or polarity would have been easier. However,
Twitter seems to be a good source to predict the polarity of several topics like politics, finance,
The second analysis is carried out by a Random Forest Classifier, using training and test data.
fictionClassifier.csv
The other analysis was performed using the API SentiStrength
text SentiStrengthtexblob classifier expert
The studio was filled with the rich odor of roses, and when the light summer wind stirred amidst the trees of the garden there came through the open door the heavy scent of the lilac, or the more delicate perfume of the pink-flowering thorn.-4 0.167857 0 0
From the corner of the divan of Persian saddle-bags on which he was lying, smoking, as usual, innumerable cigarettes, Lord Henry Wotton could just catch the gleam of the honey-sweet and honey-colored blossoms of the laburnum, whose tremulous branches seemed hardly able to bear the burden of a beauty so flame-like as theirs; and now and then the fantastic shadows of birds in flight flitted across the long tussore-silk curtains that were stretched in front of the huge window, producing a kind of momentary Japanese effect, and making him think of those pallid jade-faced painters who, in an art that is necessarily immobile, seek to convey the sense of swiftness and motion.-3 0.172222 1 0
The sullen murmur of the bees shouldering their way through the long unmown grass, or circling with monotonous insistence round the black-crocketed spires of the early June hollyhocks, seemed to make the stillness more oppressive, and the dim roar of London was like the bourdon note of a distant organ.2 0.058333 1 0
In the centre of the room, clamped to an upright easel, stood the full-length portrait of a young man of extraordinary personal beauty, and in front of it, some little distance away, was sitting the artist himself, Basil Hallward, whose sudden disappearance some years ago caused, at the time, such public excitement, and gave rise to so many strange conjectures.0 0.072917 0 0
As he looked at the gracious and comely form he had so skilfully mirrored in his art, a smile of pleasure passed across his face, and seemed about to linger there. But he suddenly started up, and, closing [4] his eyes, placed his fingers upon the lids, as though he sought to imprison within his brain some curious dream from which he feared he might awake.0 0.066667 0 0
"It is your best work, Basil, the best thing you have ever done," said Lord Henry, languidly. "You must certainly send it next year to the Grosvenor. The Academy is too large and too vulgar. The Grosvenor is the only place."1 0.246939 1 0
"I don't think I will send it anywhere," he answered, tossing his head back in that odd way that used to make his friends laugh at him at Oxford. "No: I won't send it anywhere."1 0.044444 1 0
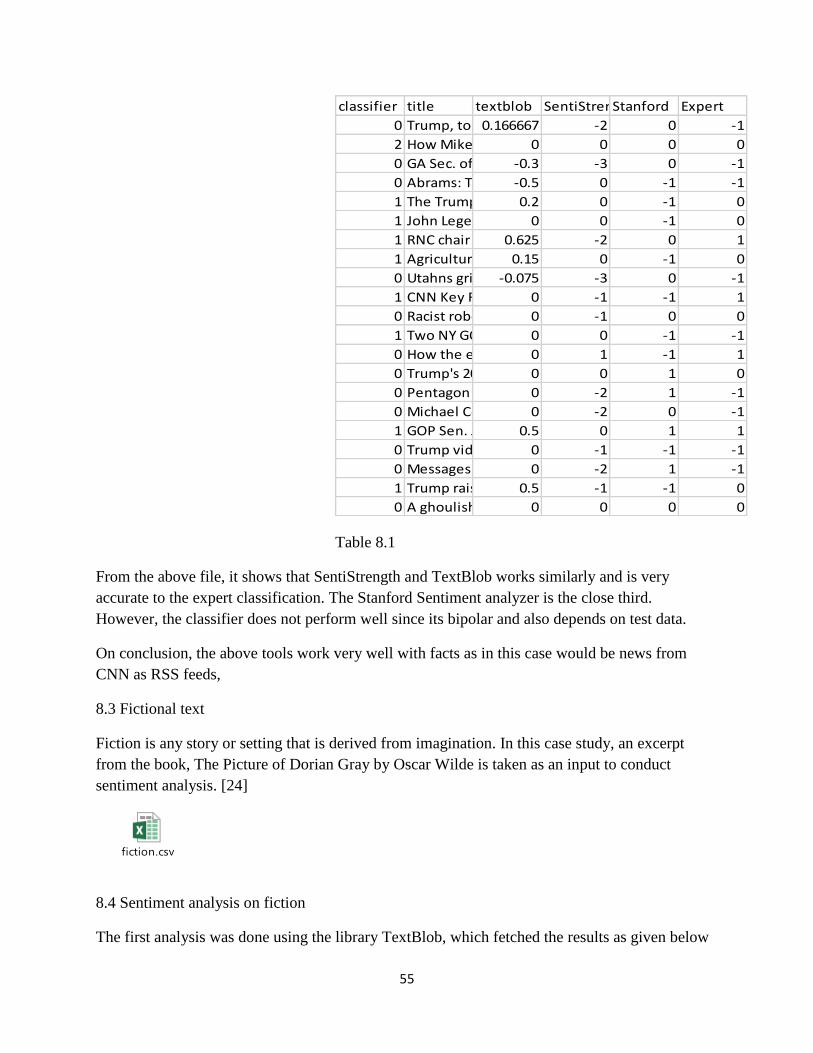
Table 8.2
From the above file, it shows that SentiStrength and TextBlob works similarly and is very
accurate to the expert classification. However, the classifier does perform well since its bipolar
and also depends on test data. The problem is since these are fictional statements, its difficult for
the expert to assign any polarity to them, hence all of them are treated as neutral polarity.
On conclusion, the above tools work not well with fiction as in this case would be parts of a story
by Oscar Wilde.
8.5 Use of spacy for Natural language processing
57
SpaCy is an open source software library used for Natural language processing in a Python
framework. Along with the basic NLP tasks, this library also supports deep learning algorithms
and trains models using TensorFlow or Keras for forming neural networks. [29]
SpaCy performs tasks like word tokenizing and POS tagging better than NTLK. However, for
sentence tokenization, NLTK works better. This is because NLTK just tokenizes the text.
However, spaCy constructs syntactic trees for every sentence and deduces much more
information than required. NLTK supports various languages, but spaCy has statistical models in
7 different languages, namely English, German, Spanish, French, Portuguese, Italian, and Dutch.
NLTK gives an option of many algorithms to be used, however spaCy uses the best algorithm at
runtime which is suited best for the given problem.
Fig 8.3[34]
The above figure shows the comparison in performance for the 2 tools in the different natural
language processing activities.
8.6 Using Naïve Bayesian Classifier for classifying sentiments for tweets
58
The classifier is based on the Bayesian theorem for conditional probability. The theorem is based
on the formula,
P(A/B) =P(A) P(B/A) P(B) [25]
Which tells us: how often A happens given that B happens, written P(A|B),
When we know: how often B happens given that A happens, written P(B|A)
and how likely A is on its own, written P(A)
and how likely B is on its own, written P(B)
For example, let us say P(Rain) means how often there is rain, and P(Cloudy) means how often
we see cloudy days, then:
P(Rain|Cloud) means how often there is rain when we can see clouds
P (Cloud | Rain) means how often we can it be cloudy as well as rain
So, this can be used in the form of Bayesian Theorem,
P (Rain| Cloud) = P(Rain) P(Cloud) P(Cloud/Rain)
The Naïve Bayesian classifier is an extension of the Bayesian classifier that is responsible for
creating a model using some test data and based on which the model can correctly classify any
train data to the correct sentiment. This classifier uses the concept of creating word bags from the
test data and training the model. On input of new data to the model, the model searches for
similar words which has already been classified and evaluates the test data. This classifier is
known as Naïve because it assumes the features to be unconditionally independent of each other.
For this experiment, data is divided into test and train data. Train data is a comma separated file
that comprises of tweets that are collected over a large amount of time whose sentiment is
already determined
The sentences in the test dataset is tokenized into a bag of words and an NLTK Naïve Bayesian
classifier is applied on the data. Then every data is classified according to sentiment and saved to
a CSV file.
The output is given as
NBeval.csv
59
The values are divided in sentiments of either 0 or 1 where 0 determines the negative polarity
and 1 is labelled as positive.
Fig 8.4
The above figure denotes a pie chart to find the percentage on negative and positive sentiments
from the total number of tweets that are present in the test dataset.
On evaluation of the results it is found that the Naïve Bayesian Classifier gives a better accuracy
than other classifier results. This is solely because the training set in this case is a separate
document that already had previously grouped data. Much different from the kind of results
deduced by the experiment with another type of classifier namely, Random forest Classifier. In
the second type, a single data set was divided into test and training data and fit and transform
functionalities were used on these.
So, we can conclude Naïve Bayesian proved to be accurate only by 1-2% which can be treated as
negligible. This also depends on the nature of selection of choosing the training and test data as
discussed above. Another factor which is greatly determining is the length of the datasets, the
more the data is, it will fetch better results. Since a wider variety of data means a wider variety of
words added to the corpus and hence fetches better results through classification.
60
8.7 Sentiment analysis on Customer reviews
Today products need, and choices are changing very fast. Customers have preferences that are
easy to change. Product based companies need to stay at par with these needs and choices.
Companies also need to compete with their rival companies that build similar products. For
example, in the field of technology laptops and phones are never constant. Reviews from
customers on websites or feedback from customers via customer support calls are important for
companies to understand the growing needs of customers. Sentiment of the reviews and calls
also help in determining whether products are liked by customers or there have to be made any
changes. In this experiment, Amazon.com was chosen to extract customer reviews.[30]
Fig 8.5
8.7.1 Web Scrapping and sentiment analysis
This is the process of extraction of data from a website and saved to a user-friendly format like
saving to a file in a location or converting to json or dataframes that can be used for further
analysis. Websites generally provide a lot of information that are ideal only to be viewed in the
web browser. The only way to access it is to copy and paste it manually. This is a very tedious
task and is not efficient at all. In such cases, web scrapping is used. This can be done by using
many software or using libraries and accessing the reviews. this experiment, two Python libraries
are used. Urllib is used to extract and access the data from the websites and BeautifulSoup is
used to extract the data and convert them into JSON files.
61
Fig 8.6[31]
amazonReviews.txt
The above attachment shows the extracted reviews from the Amazon website for the particular
product
Column1 polarity subjectivity
Ordered new unused "2018 Newest Acer 14-inch HD Chromebook" 6/23/18. Upon arrival noted manufacture date to be 7/29/2016. 23 MONTHS PRIOR.While this may not be outright fraud or false advertising according to some, it certainly seems misleading and disingenuous. Makes one wonder about the laptop and components 2 year storage environment conditions. Surely nothing that would effect product performance and life. You decide.BUYER BEWARE0.112662 0.628716
NOT a 2018 Chromebook as stated in the title. I was expecting a Chromebook manufactured in late 2017 or 2018. This particular Chromebook was manufactured in August of 2016. Very misleading title......definitely not the "2018 Newest". The Chromebook does seem to be pretty decent though.0.096667 0.58
nice 0.6 1
Like: weighs about 2.5lbs, easy to carry in backpack without need of additional case/sleeve, runs cool, long battery, matte screen so no reflections of people in lecture hall/class0.244444 0.627778
What I use laptop for: primarily taking pictures of my textbooks and notes. Most of what i do are on the web so this laptop fits my current needs.0.3 0.466667
Chrome OS: it took the laptop about 30mins to update but it updated to the current Chrome OS 69.0.3497.95. I did not encounter any issues with web store apps as stated by others.0 0.4
CPU: the cpu is faster than Celeron N3350 which are found on current chromebooks in this price range.0 0.4
Dislike: 1366x768 screen resolution & non back-lit keyboard. Since im reading my textbooks so it is okay. This laptop not for entertainment.0.5 0.5
Overall: the laptop looks great, feels sturdy. I'm happy with my purchase.0.533333 0.583333
i like its great thank you0.8 0.75
What a great value. I do all the basics plus some. Google has it down! Thanks0.268519 0.412963
Table 8.3
AmazonReviewsAna
lysis.xlsm
62
Chapter 9
Summary and Conclusion
This research started with a goal to classify tweets according to polarity. Identifying
polarity on tweets is analogous to finding a needle in a haystack. Challenges involved in
collecting effective data and preprocessing them so that all the text could be used. A proper
method was used to extract tweets was used with the help of a cron job that ran on a daily basis
and collected tweets over a time period of 2 months. Then the data was preprocessed using many
methods to make the data devoid of noise and outliers. The clean data was then further
preprocessed to avoid any piece of any information to be removed that was not helping in the
text analysis. Amazon Web service framework was used, EC2 to host the application. This
framework is also cost-effective and elastic to the needs of analysis. All these are achieved by
leveraging the benefits of cloud computing.
Experiments and analyses were conducted on real datasets to find the polarity of the tweets. The
different parameters chosen to measure the polarity were, TextBlob that was a library derived
from Natural Language Processing. The Random Forest Classifier was used to divide the entire
data set to train and test data. The third way used was using a very popular tool called
SentiStrength to evaluate the polarity. Various patterns were discovered and
described in the experiment These patterns aided in understanding and comparing the accuracy
of every method used. The case studies demonstrated the identification of performance evaluated
from different tools and how efficient they were to determine the polarity of tweets.
Opinion mining on tweets will continue to be an important area of research
with the growing market on machine learning and Social media. This thesis presented a
comparative analysis on sentiment analysis in a cloud based, scalable, and cost-effective data
mining framework.
63
Chapter 10
Challenges faced on carrying the experiment
On carrying out the experiment there were many barriers met and a lot of challenges that had to
be overcome.
The tone of the tweets
If two statements are considered[28]
The dress is nice
The dress is pink in color.
Most people would say that sentiment is positive for the first one and neutral for the second one,
right? All predicates (adjectives, verbs, and some nouns) should not be treated the same with
respect to how they create sentiment. In the examples above, nice is more subjective than pink.
This means nice will have more weight than pink, however both are simple adjectives
Context and Polarity
All the tweets and statements that are generated on the basis of a context. It is uttered by
someone at a particular time and space. But Twitter being a microblogging site allows only 140
characters to be written at a time. So, the context seems to be lost in some way. For example,
I support this motion.
I am not interested!
These two statements seem like an answer to a question .So the problem here is what is the
question, for the first one can answer to the question Did you like the topic of the debate or one
can ask did you dislike the topic .To both the above questions , the answers are valid .But the
tone and opinion of the statement completely changes to a negative or positive respectively.
Irony and Sarcasm
Differences between literal and intended meaning, irony and the deeper degree of irony which is
known as sarcasm usually changes positive sentiment into negative whereas negative or neutral
sentiment might be changed to positive. However, detecting irony or sarcasm takes a lot of extra
steps of analysis and cannot be done easily. In this experiment, this has been a drawback of not
able to analyze sarcasm and irony especially in texts/tweets dealing with politics
For example, look at some possible answers to the question Have you had a nice customer
experience with us? below.
Yes. Sure.
Assigning sentiments to any of the above statements is difficult. It sounds that an attached
positive tweet is added but one can be sarcastic.
64
Comparisons
How to treat comparisons in sentiment analysis is another challenge worth tackling. Look at the
texts below:
This book is second to none.
This is better than old choices.
This is better than nothing.
There are some comparisons like the first one above that do not need any contextual clues in
order to be classified correctly.
The second and third texts are a little more difficult to classify, though seeing the word better one
would immediately associate to a positive sentiment. But the question here is for the second
statement, the choices that are referred to can be good or bad choices. These both statements will
again create a problem to carry out a correct analysis
Emojis
There are two types of emojis according to Guibon et al.. Western emojis (e.g. :D) are encoded in
only one character or in a combination of a couple of them whereas Eastern emojis (e.g. ¯ \ _ (ツ) _ / ¯) are a longer combination of characters of a vertical nature. Particularly in tweets, emojis
play a role in the sentiment of texts.
The first step of preprocessing is to remove unnecessary punctuation marks that may be difficult
to analyze a given text.
Defining Neutral
Categorizing statements to neutral sentiment is another challenge to tackle in order to perform
accurate sentiment analysis. There are many statements that is best categorized as neutral,
however some classifiers do not allow texts to be classified as a neutral category. This leads to