99
KENYA TEXTILE AND CLOTHING VALUE CHAIN ROADMAP 2016-2020
KENYATEXTILE AND CLOTHING VALUE CHAIN ROADMAP2016-2020


TEXTILE & CLOTHING VALUE CHAIN ROADMAP OF KENYA


TEXTILE & CLOTHING VALUE CHAIN ROADMAP OF KENYA
This value chain roadmap was developed on the basis of the process, methodology and technical assistance of the International Trade Centre ( ITC ). The views expressed herein do not reflect the official opinion of ITC. Mention of firms, products and product brands does not imply the endorsement of ITC. This document has not been formally edited by ITC.
The value chain roadmap was elaborated within the framework of ITC’s SITA project, a South-South trade and investment initiative that aims to improve the competitiveness of select value chains through the provisions of partnerships from institutions and business from India. SITA is funded by the U.K. Department of International Development ( DFID ).
ITC is the joint agency of the World Trade Organization and the United Nations. As part of ITC’s mandate of fostering sustainable development through increased trade opportunities, the Export Strategy section offers a suite of trade-related strategy solutions to maximize the development payoffs from trade. ITC-facilitated trade development strategies and roadmaps are oriented to the trade objectives of a country or region and can be tailored to high-level economic goals, specific development targets or particular sectors, allowing policymakers to choose their preferred level of engagement.
The International Trade Centre ( ITC )
Street address : ITC, 54-56, rue de Montbrillant, 1202 Geneva, SwitzerlandPostal address : ITC Palais des Nations 1211 Geneva, SwitzerlandTelephone : + 41- 22 730 0111Postal address : ITC, Palais des Nations, 1211 Geneva, SwitzerlandEmail : [email protected] : http :// www.intracen.org
Layout: Jesús Alés – www.sputnix.es
v
ACKNOWLEDGMENTS
This value chain roadmap was elaborated as a component of the ITC Supporting Indian Trade and Investment in Africa ( SITA ) project, a south-south trade and in-vestment initiative that aims to improve the competitiveness of select value chains through the provision of partnerships by institutions and businesses from India. SITA is funded by the United Kingdom Department for International Development ( DFID ).
The formulation of the value chain roadmap was led by the Ministry of Industrialization and Enterprise Development ( MoIED ) with the technical assistance of ITC. This document represents the ambitions of the private and public sector stakeholders for the development of the sector. Stakeholders’ commitment and comprehensive collaboration have helped build consensus around a common vision that reflects the realities and limitations of the private sector, as well as of policymakers and trade-related institutions.
The document benefited particularly from the inputs and guidance provided by the members of the sector team.
Name Organization
� Mr. Rajeev Arora Ministry of Industrialisation and Enterprise Development
� Mr. Joseph Nyagari African Cotton & Textile Industries Federation
� Prof. Githiri Mwangi Jomo Kenyatta University of Agriculture & Technology
� Ms. Alice Waithaka Kenya Industrial Research and Development Institute
� Mr. Thomas Puthoor Kapric Apparels EPZ Ltd � Prof. Dorothy McCormick University of Nairobi � Ms. Lucie Njoroge Association of Fashion Designers ( AFAD ) � Mr. Joseph Wairiuko Kenya Association of Manufacturers � Ms. Mary Nyayieka Technical University of Kenya � Ms. Lucy Wambugu Technology Development Centre � Mr. Sargar Alpha Knits Limited � Ms. Margaret Waithaka Export Processing Zones Authority � Mr. Herman Bigham Tosheka Textiles � Mr. Thomas Puthoor ( Mombasa ) Kapric Apparels Ltd � Amb. Dr. Joseph K. Kiplagat Ministry of Industrialization and Enterprise
Development � Ms. Rose Mwathi Handloom Weavers Marketing Cooperative
Society � Prof Josphat Igadwa Mwasiagi
( Eldoret ) Moi University
Technical support and guidance from ITC was rendered through Eric Buchot, Alexandra Golovko, Olivier Marty, Hanna Bucher, Varun Vaid, Robert Kafafian, Carla Vaca and Carlos Griffin. Nzuki Waita provided valuable support as the national SITA coordinator.
vi
CONTENTS
Acknowledgments v
CONTENTS vi
EXECUTIVE SUMMARY XII
VALUE CHAIN ROADMAP ILLUSTRATION XIV
GLOBAL TRENDS 2025– LIVING THROUGH A TRANSFORMATIVE PERIOD 1
KENYA’S T&C SECTOR IS AT A CROSSROADS 7
THE VALUE CHAIN IS STUNTED BY LIMITED INTEGRATION AND SUBOPTIMAL VALUE ADDITION 11
STRATEGIC ISSUES AND COMPETITIVE CONSTRAINTS 21
Supply side issues 23
Business environment issues 28
Market entry issues 32
Socio-economic and environment issues 33
STRATEGIC IMPLICATIONS FOR THE VALUE CHAIN ROADMAP 34
THE WAY FORWARD 35
THE STRATEGIC OBJECTIVES 35
LEVERAGING MARKET OPPORTUNITIES 39
FDI IS THE KEY TO USHERING IN A NEW ERA OF GROWTH 40
FUTURE VALUE CHAIN 43
I. Development of the textile production segment 45
II. Further development of EPZs and establishment of textile cities to facilitate access to utilities 45
III. Development of the garment production segment and integration with the textile segment 46
IV. Enhanced support services, particularly in the areas of TVET, sector coordination, finance, Customs and logistics� 46
MOVING TO ACTION 47
VALUE CHAIN ROADMAP PLAN OF ACTION 49
APPENDICES 69
REFERENCES 79
vii
FIGURES
Figure 1 : Trend towards greater value addition 2
Figure 2 : Production trends in the garment sector 9
Figure 3 : Kenya’s T&C value chain 10
Figure 4 : Kenyan cotton production 1940 / 41-2010 / 11 11
Figure 5 : Investment and exports in the EPZ garment sector ( 2008-2014 ) ( US $ millions ) 16
Figure 6 : Kenya’s T&C export trends, by segment, 2004-2013 ( US $ thousands ) 18
Figure 7 : Kenyan exports of clothing to selected markets, 2003-2013 ( US $ thousands ) 19
Figure 8 : Kenyan textiles exports by region 2004-2013 ( US $ thousands ) 19
Figure 9 : Kenya’s apparel export growth ambitions 38
Figure 10 : Kenya’s T&C future value chain diagram 44
APPENDICESFigure 1: Decomposition of Kenya’s T&C export growth, 2004–2013 71
Figure 2 : Kenya T&C, Normalized Revealed Comparative Advantage ( NRCA ) ANNEX 72
viii
TABLES
Table 1 : Top exporters of clothing, 2003-2013 4
Table 2 : Top exporters of textiles, 2003-2013 4
Table 3 : Comparison of costs and competitive factors between Kenya and major T&C competitors 8
APPENDICESTable 1: International business rankings of Kenya and its competitors 70
Table 2 : Kenya’s exported garments with value equal to or above US $ 10 million in 2013 ( US $ thousands ) 72
Table 3 : Kenya’s textiles exports >= US $ 0.1 million in at least two years between 2004 and 2013 73
Table 4: Time and cost to trade across borders in Kenya, Ethiopia and the United Republic of Tanzania 74

ix
ACRONYMS
The following abbreviations are used :
ACTIF African Cotton and Textiles Industries Federation
AGOA African Growth and Opportunity ActCAGR Compound Annual Growth RateCMT Cut, Make & TrimCOMESA Common Market for Eastern and Southern
AfricaCSR Corporate Social ResponsibilityEAC East African CommunityEBAP Export Business Accelerator ProgrammeEPC Export Promotion CouncilEPZ Export Processing ZoneEPZA Export Processing Zones AuthorityEU European UnionFDI Foreign Direct InvestmentFOB Free on BoardGDS Global Development SolutionsHS Harmonized SystemICAC International Cotton Advisory CommitteeIIHT Indian Institute of Hardware TechnologyIL&FS Infrastructure Leasing and Financial
Services ( India )ISO International Organization for
StandardizationITC International Trade CentreKAM Kenya Association of ManufacturersKAMEA Kenya Apparel Manufacturers and
Exporters AssociationKEBS Kenya Bureau of StandardsKenInvest Kenya Investment AuthorityKNCCI Kenya National Chamber of Commerce
and IndustryKRA Kenya Revenue AuthorityKTTI Kenya Textile Training InstitutekWh Kilowatt-hourMFA Multi-Fibre Arrangement
MLS-SCM Modular Learning System – Supply Chain Management
MoEST Ministry of Education, Science and Technology
MoIED Ministry of Industrialization and Enterprise Development
MoU Memorandum of UnderstandingMSEA Micro and Small Enterprise AuthorityMSME Micro, Small and Medium-Sized EnterpriseNRCA Normalized Revealed Comparative
AdvantageNID National Institute of Design ( India )NIFT National Institute of Fashion Technology
( India )NITA National Industrial Training AuthorityPoA Plan of ActionREACH Registration, Evaluation, Authorization
and Restriction of ChemicalsSADC Southern African Development CommunitySITA Supporting Indian Trade and Investment
in AfricaSME Small and Medium-Sized EnterpriseT&C Textile & ClothingTISI Trade and Investment Support InstitutionTMEA TradeMark East AfricaTNC Transnational CorporationTVET Technical and Vocational Education
and TrainingTVETA Technical and Vocational Education
and Training AuthorityUAE United Arab EmiratesUNIDO United Nations Industrial Development
OrganizationVAT Value Added TaxWEAMACO Handloom Weavers’ Marketing Cooperative
SocietyWTO World Trade Organization
x
FOREWORDS
HON. ADAN MOHAMED CABINET SECRETARY
– MINISTRY OF INDUSTRY INVESTMENT & TRADE ( MOIIT)
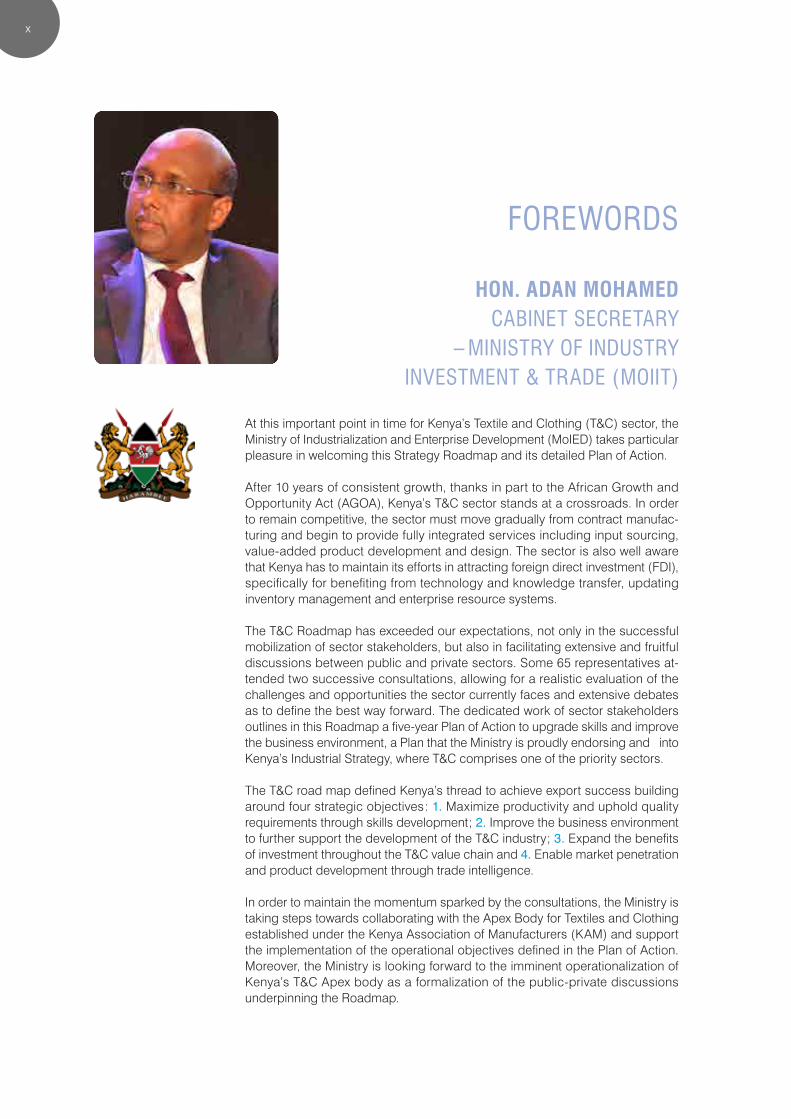
At this important point in time for Kenya’s Textile and Clothing ( T&C ) sector, the Ministry of Industrialization and Enterprise Development ( MoIED ) takes particular pleasure in welcoming this Strategy Roadmap and its detailed Plan of Action.
After 10 years of consistent growth, thanks in part to the African Growth and Opportunity Act ( AGOA ), Kenya’s T&C sector stands at a crossroads. In order to remain competitive, the sector must move gradually from contract manufac-turing and begin to provide fully integrated services including input sourcing, value-added product development and design. The sector is also well aware that Kenya has to maintain its efforts in attracting foreign direct investment ( FDI ), specifically for benefiting from technology and knowledge transfer, updating inventory management and enterprise resource systems.
The T&C Roadmap has exceeded our expectations, not only in the successful mobilization of sector stakeholders, but also in facilitating extensive and fruitful discussions between public and private sectors. Some 65 representatives at-tended two successive consultations, allowing for a realistic evaluation of the challenges and opportunities the sector currently faces and extensive debates as to define the best way forward. The dedicated work of sector stakeholders outlines in this Roadmap a five-year Plan of Action to upgrade skills and improve the business environment, a Plan that the Ministry is proudly endorsing and into Kenya’s Industrial Strategy, where T&C comprises one of the priority sectors.
The T&C road map defined Kenya’s thread to achieve export success building around four strategic objectives : 1. Maximize productivity and uphold quality requirements through skills development ; 2. Improve the business environment to further support the development of the T&C industry ; 3. Expand the benefits of investment throughout the T&C value chain and 4. Enable market penetration and product development through trade intelligence.
In order to maintain the momentum sparked by the consultations, the Ministry is taking steps towards collaborating with the Apex Body for Textiles and Clothing established under the Kenya Association of Manufacturers ( KAM ) and support the implementation of the operational objectives defined in the Plan of Action. Moreover, the Ministry is looking forward to the imminent operationalization of Kenya’s T&C Apex body as a formalization of the public-private discussions underpinning the Roadmap.

xi
FOREWORDS
MR. JASWINDER BEDI CHAIRMAN, AFRICAN COTTON & TEXTILE
INDUSTRIES FEDERATION ( ACTIF ) VICE PRESIDENT, INTERNATIONAL TEXTILE
MANUFACTURERS FEDERATION ( ITMF )
A Great Oppor tunity for the Textile & Clothing Sectors in EAC
The African Cotton and Textile Industries Federation ( ACTIF’s ) mission is to pro-mote and facilitate both international and inter-regional trade and investment of the cotton value chain in Africa.
South-south trade and investment opportunities have been expanding rapidly in recent years. South-south trade constituted just 10 % of world trade 20 years ago and rising to almost 1 / 3 today. India is one major player driving this trend, and is creating new opportunities in East African countries for trade and investment-led economic growth and job creation.
With global FDI in the Textile & Clothing market estimated to be worth US $ 24 billion in 2013, a 100 % increase from 2012 and with rising costs and growing do-mestic consumption in emerging Asia, Indian businesses are increasingly looking at new destinations like East Africa for investment and trade opportunities.
The Kenya textile and clothing value chain roadmap, complete with a detailed 5 year action plan is the product of extensive public-private sector stakeholders’ consultations. Along with the technical guidance of ITC, the roadmap offers the best chance to facilitate business transactions, technology transfer and knowl-edge exchange between India and East Africa.
In addition to Kenya, similar endeavours were conducted across the East African region covering Ethiopia, Uganda, and Tanzania. There is no doubt that the East African region can only grow its textile and clothing industries by strengthening its competitive advantage on all fronts including product, quality, productivity and competitiveness.
ACTIF will continue to work closely with ITC along with all key stakeholders in the region to ensure seamless implementation of the roadmap, cross sharing of information and leverage on strategic linkages with India – a great power house in the textile and clothing business.
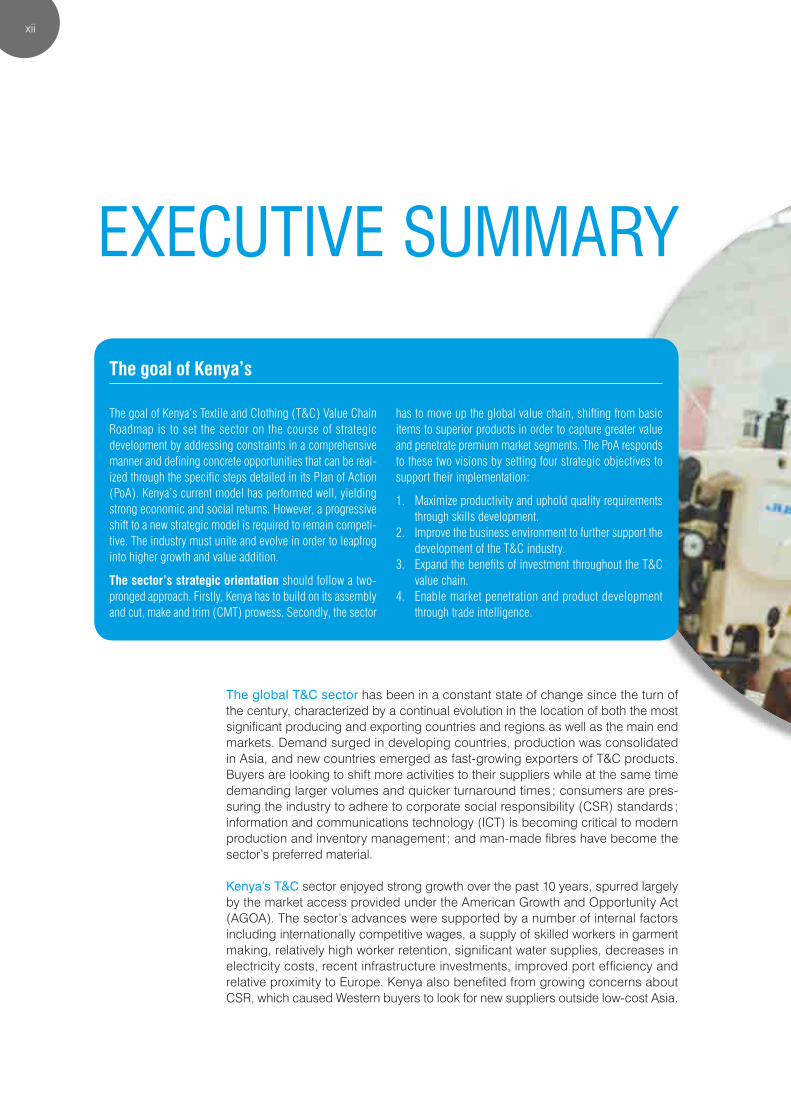
Photo: Carmina Campus Production Kenya (c) Louis Nderi & ITC Ethical Fashion Initiative (11).jpg
xii
EXECUTIVE SUMMARY
The goal of Kenya’s
The goal of Kenya’s Textile and Clothing ( T&C ) Value Chain Roadmap is to set the sector on the course of strategic development by addressing constraints in a comprehensive manner and defining concrete opportunities that can be real-ized through the specific steps detailed in its Plan of Action ( PoA ). Kenya’s current model has performed well, yielding strong economic and social returns. However, a progressive shift to a new strategic model is required to remain competi-tive. The industry must unite and evolve in order to leapfrog into higher growth and value addition.
The sector’s strategic orientation should follow a two-pronged approach. Firstly, Kenya has to build on its assembly and cut, make and trim ( CMT ) prowess. Secondly, the sector
has to move up the global value chain, shifting from basic items to superior products in order to capture greater value and penetrate premium market segments. The PoA responds to these two visions by setting four strategic objectives to support their implementation :
1. Maximize productivity and uphold quality requirements through skills development.
2. Improve the business environment to further support the development of the T&C industry.
3. Expand the benefits of investment throughout the T&C value chain.
4. Enable market penetration and product development through trade intelligence.
The global T&C sector has been in a constant state of change since the turn of the century, characterized by a continual evolution in the location of both the most significant producing and exporting countries and regions as well as the main end markets. Demand surged in developing countries, production was consolidated in Asia, and new countries emerged as fast-growing exporters of T&C products. Buyers are looking to shift more activities to their suppliers while at the same time demanding larger volumes and quicker turnaround times ; consumers are pres-suring the industry to adhere to corporate social responsibility ( CSR ) standards ; information and communications technology ( ICT ) is becoming critical to modern production and inventory management ; and man-made fibres have become the sector’s preferred material.
Kenya’s T&C sector enjoyed strong growth over the past 10 years, spurred largely by the market access provided under the American Growth and Opportunity Act ( AGOA ). The sector’s advances were supported by a number of internal factors including internationally competitive wages, a supply of skilled workers in garment making, relatively high worker retention, significant water supplies, decreases in electricity costs, recent infrastructure investments, improved port efficiency and relative proximity to Europe. Kenya also benefited from growing concerns about CSR, which caused Western buyers to look for new suppliers outside low-cost Asia.
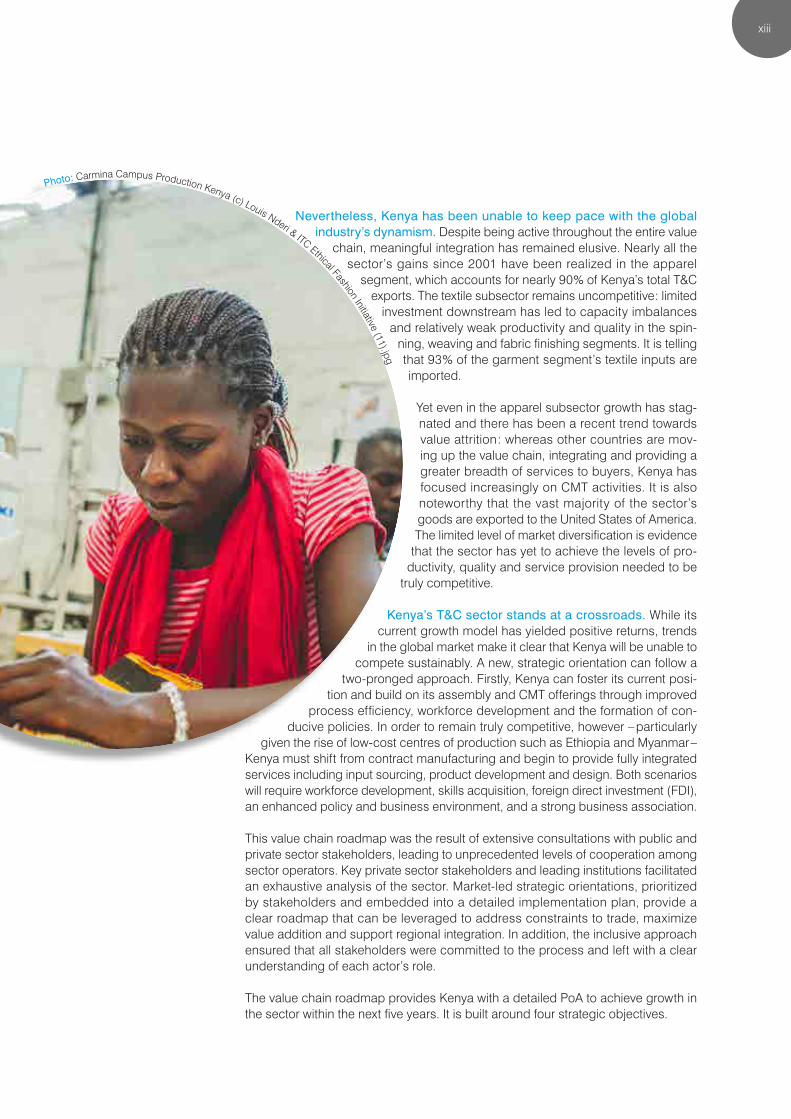
Photo: Carmina Campus Production Kenya (c) Louis Nderi & ITC Ethical Fashion Initiative (11).jpg
xiii
Nevertheless, Kenya has been unable to keep pace with the global industry’s dynamism. Despite being active throughout the entire value
chain, meaningful integration has remained elusive. Nearly all the sector’s gains since 2001 have been realized in the apparel
segment, which accounts for nearly 90 % of Kenya’s total T&C exports. The textile subsector remains uncompetitive : limited
investment downstream has led to capacity imbalances and relatively weak productivity and quality in the spin-
ning, weaving and fabric finishing segments. It is telling that 93 % of the garment segment’s textile inputs are imported.
Yet even in the apparel subsector growth has stag-nated and there has been a recent trend towards value attrition : whereas other countries are mov-ing up the value chain, integrating and providing a greater breadth of services to buyers, Kenya has focused increasingly on CMT activities. It is also noteworthy that the vast majority of the sector’s goods are exported to the United States of America. The limited level of market diversification is evidence
that the sector has yet to achieve the levels of pro-ductivity, quality and service provision needed to be
truly competitive.
Kenya’s T&C sector stands at a crossroads. While its current growth model has yielded positive returns, trends
in the global market make it clear that Kenya will be unable to compete sustainably. A new, strategic orientation can follow a
two-pronged approach. Firstly, Kenya can foster its current posi-tion and build on its assembly and CMT offerings through improved
process efficiency, workforce development and the formation of con-ducive policies. In order to remain truly competitive, however – particularly
given the rise of low-cost centres of production such as Ethiopia and Myanmar – Kenya must shift from contract manufacturing and begin to provide fully integrated services including input sourcing, product development and design. Both scenarios will require workforce development, skills acquisition, foreign direct investment ( FDI ), an enhanced policy and business environment, and a strong business association.
This value chain roadmap was the result of extensive consultations with public and private sector stakeholders, leading to unprecedented levels of cooperation among sector operators. Key private sector stakeholders and leading institutions facilitated an exhaustive analysis of the sector. Market-led strategic orientations, prioritized by stakeholders and embedded into a detailed implementation plan, provide a clear roadmap that can be leveraged to address constraints to trade, maximize value addition and support regional integration. In addition, the inclusive approach ensured that all stakeholders were committed to the process and left with a clear understanding of each actor’s role.
The value chain roadmap provides Kenya with a detailed PoA to achieve growth in the sector within the next five years. It is built around four strategic objectives.
xiv
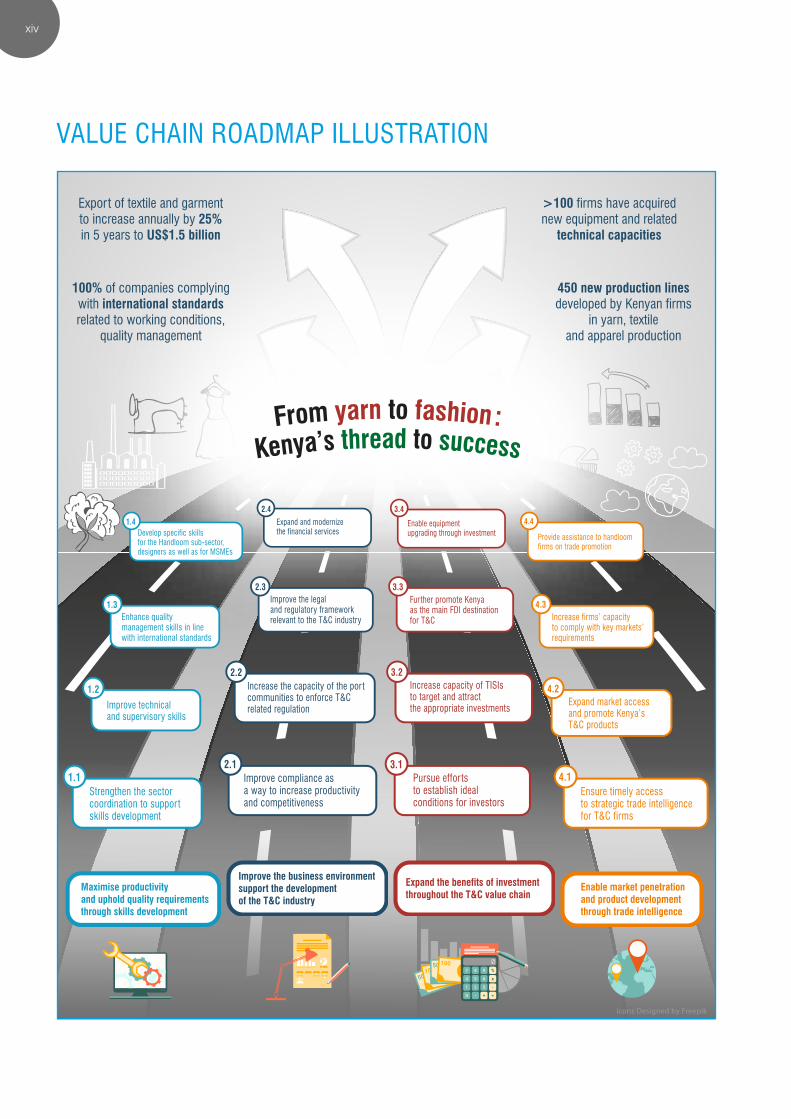
VALUE CHAIN ROADMAP ILLUSTRATION
Export of textile and garmentto increase annually by 25%in 5 years to US$1.5 billion
>100 firms have acquirednew equipment and related
technical capacities
100% of companies complyingwith international standardsrelated to working conditions,
quality management
450 new production linesdeveloped by Kenyan firms
in yarn, textile and apparel production
Improve the business environment support the developmentof the T&C industry
Expand the benefits of investment throughout the T&C value chain
Enable market penetrationand product developmentthrough trade intelligence
Develop specific skillsfor the Handloom sub-sector,designers as well as for MSMEs
1.4
Enhance quality management skills in linewith international standards
1.3
Improve technical and supervisory skills
1.2
Strengthen the sectorcoordination to supportskills development
1.1
Expand and modernizethe financial services
2.4
Improve the legaland regulatory frameworkrelevant to the T&C industry
2.3
Increase the capacity of the por tcommunities to enforce T&Crelated regulation
2.2
Improve compliance asa way to increase productivityand competitiveness
2.1
Enable equipmentupgrading through investment
3.4
Fur ther promote Kenyaas the main FDI destinationfor T&C
3.3
Increase capacity of TISIsto target and attractthe appropriate investments
3.2
Pursue effor tsto establish idealconditions for investors
3.1
Provide assistance to handloomfirms on trade promotion
4.4
Increase firms’ capacityto comply with key markets’requirements
4.3
Expand market accessand promote Kenya’sT&C products
4.2
Ensure timely accessto strategic trade intelligencefor T&C firms
4.1
50 100100
100
50
100
100
100
icons Designed by Freepik

Photo: MIMCO x EFI 2nd collection © Louis Nderi & ITC Ethical Fashion Initiative (59).jpg
[ GLOBAL TRENDS 2025 – LIVING THROUGH A TRANSFORMATIVE PERIOD ]
1
GLOBAL TRENDS 2025 – LIVING THROUGH
A TRANSFORMATIVE PERIOD
THE ONLY CONSTANT IS CHANGE
While the global T&C industry has always been a fast-evolv-ing sector, over the past 15 years the structure of sector has been constantly redefined by significant changes. These changes have been characterized by a continual evolution in the location of both the most significant producing and exporting countries and regions as well as the main end markets. While disjointed production was consolidated in Asia and China grew to dominate the market, new players including Viet Nam, Myanmar and Cambodia have emerged as some of the fastest-growing exporters of T&C products. Changing demographics and economic performance, meanwhile, have resulted in a proliferation of demand in new and fast-progressing markets such as South Africa, the Russian Federation, the United Arab Emirates ( UAE ), China and India.
One of the key drivers behind these transformations is the ever-changing policy environment : while the dismantling of the Multi-Fibre Arrangement ( MFA ) facilitated a consolida-tion of production in Asia, the introduction of AGOA catalysed renewed competitiveness in Africa. In turn, the Trans-Pacific Partnership ( should it come to fruition ) will surely redefine the competitive landscape once again and therefore requires continued advocacy with the United States Government by the Ministry of Industrialization and Enterprise Development ( MoIED ) to ensure some safeguards are established within the Trans-Pacific Partnership mechanism. Changes in the policy environment have been complemented by techno-logical evolutions that have stimulated remarkable gains in productivity, product diversity and quality, thereby allowing polyester and blended fabrics to become preferred materials. Together with advancements in logistics and supply chain management that allow for greater and more flexible speed to market, these technical improvements have contributed to the increasingly rapid rotation of collections.
For now, Western countries have retained much of the higher value added portions of the value chain, including research, design, marketing and financial services. More tangible ac-tivities, which are frequently labour intensive, continue to be
concentrated in developing markets. Yet even this has been subject to the pressures of change in recent years. Given the low profit margins in the manufacturing segment of the value chain, one of the few ways for retailers to reduce costs, and for producers to add more value, is to shift more of the design and development work to the manufacturing country. This has stimulated a shift in developing countries, where suppliers who were once engaged only in CMT activities are being entrusted with larger portions of the value chain and increased responsibility in delivering Landed Duty Paid orders, which may include form development of styles to final delivery in the buyers’ stores.

[ KENYA TEXTILE AND CLOTHING VALUE CHAIN ROADMAP ]
2
Figure 1 : Trend towards greater value addition
Cut, Makeand Trim (CMT)
Assembly, payment base on a processing fee and fabric sourced and owned by the buyer.
The contractor is trusted with the whole manufacturing process (from sourcing fabric to delivering to the retail outlet (FOB).
Includes design and whole production of a garment and may include distribution to the final customer.
Coordinate supply chain, contract manufacturing or invest in production in foreign markets.
Post production capabilities, product dev., the focus is on branding, marketing, retailing and consumer research.
OriginalEquipmentManufacturing(OEM)
Original DesignManufacturing(ODM)
Full PackegeService Provider
Original BrandManufacturing(OBM)
Source : Based on Gereffi, G. and Frederick, S. ( 2010 ) ; and Staritz, Cornelia ( 2012 ).
Large international retailers ( transnational corporations ( TNCs ) ) have grown to dominate the T&C value chain. They have gained significant influence over the choice of pro-duction locations and enjoy considerable bargaining power. These companies, which are generally based in the United States, European Union ( EU ) and Japan, purchase large quantities of goods. Following the elimination of the MFA, they have been consolidating production in fewer and fewer countries. Where they exist, foreign affiliates of TNCs often account for the majority of T&C exports from developing countries.
While acceptable price levels are a condition that poten-tial suppliers must meet, the world’s leading buyers consider a number of fast-evolving criteria to be key success factors, including :
� Quality production and assurance ( product testing ) � Timely delivery � Competitive pricing � Product development capacities � Social compliance ( health and safety, workers’ rights,
environment ) � Adequate distribution capacities � Vendor-managed inventory capacities.1
From a macro perspective, buyers often take care to miti-gate the following risks :
� Inflation � Poor energy and water provision � Wage increases � Unstable currency exchange rates � Weak rule of law � Barriers to trade � Political instability � Weak intellectual property protection � Difficult physical access to markets and unattractive
credit environments.
1.– Price Waterhouse Coopers ( 2008 ). Global Sourcing : Shifting Strategies.
This highlights the role of the Government in ensuring a stable and attractive overall business environment. More specific to the T&C sector, suppliers such as Kenya wishing to secure their place in the global value chain must be able to adapt to the following trends and market requirements.2
Volumes
Another important trend is the increased volumes required by retailers. Retailers are growing in size and they require significant quantities of product. While these volumes used to be sourced from a variety of locations during the MFA era, retailers want to streamline their production by reduc-ing the number of countries / suppliers that they source from. Suppliers must therefore be able to meet buyer volume requirements, either alone or in partnership through con-solidation, if they are to enter some of the most attractive supply chains.
Speed to market
Fast fashion brands such as Zara have revolutionized sup-ply chain management. Point-of-sale technologies now al-low retailers to analyse trends. This analysis is then used to quickly produce and stock goods according to the latest market dynamics. This has resulted in fast turnover where products have short life spans and suppliers need the ca-pacity to respond to variable orders. Upstream and down-stream service providers ( and material suppliers ) must also support clothing manufactures in their efforts to turn around and deliver finished products in such a short time frame.
Consumer pressures
Consumers have become increasingly concerned about the treatment of workers in the T&C sector. This has put pressure
2.– Information for Development Programme ( 2008 ). The Global Textile and Garments Industry : The Role of Information and Communication Technologies ( ICTs ) in Exploiting the Value Chain.

[ GLOBAL TRENDS 2025– LIVING THROUGH A TRANSFORMATIVE PERIOD ]
3
on the industry to begin adhering to CSR programmes and Codes of Conduct. These schemes, which also cover sup-pliers and subcontractors, require that firms be audited in order to ensure compliance with various health, safety and environmental issues. While this can result in higher costs, better social and working conditions may also lead to in-creases in productivity, thereby fostering increased profit-ability. Some buyers based in the United States and the EU have begun excluding suppliers that do not meet such criteria.
Man-made materials
The past decade has seen a marked shift away from natu-ral fibres towards man-made materials. In 2013 man-made fibres accounted for 70 % of fibre production worldwide, compared with just 55.5 %3 in 2007.4 Spurred in part by technological advancements that allowed for enhanced productivity, increased quality, lower costs and greater diversity, a turning point came with the financial crisis of 2008. At this time, retailers turned to synthetic materials as a means of cutting costs in an effort to survive.5 The trend was reinforced when cotton prices spiked considerably in 2011. Consumers have also developed a preference for syn-thetic or blended materials. In light of these trends, it is of the utmost importance that Kenya expands its multi-fibre expertise, particularly given that Kenya enjoys a higher pref-
3.– Food and Agriculture Organization of the United Nations and International Cotton Advisory Committee ( 2013 ). World Apparel Fiber Consumption Survey. Washington D.C. : ICAC. 4.– Leonie Barrie ( 2015 ). Man-made fibres climb to 70 % of total production. Just-Style, 14 January. Available from http : / / www.just-style.com / news / man- made-fibres-climb-to-70-of-total-production_id124084.aspx.5.– Alexandra Wexler ( 2014 ). Cotton’s crown threatened by man-made fibers. The Wall Street Journal, 25 April. Available from http : / / www.wsj.com / articles / SB10001424052702304049904579516282130809074.
erential margin for man-made fibres under AGOA. This will require improved sourcing practices or the development of a parallel chemical industry for the production of synthetic materials.
Lean retailing
Retailers increasingly want to focus on sales while trans-ferring all other supply chain activities to their suppliers. Retailers are also beginning to engage more directly with producers, removing the middlemen of the past. As a result, they are requiring suppliers to act as ‘full package’ service providers. Suppliers are expected to provide more services than before, from the sourcing of materials to logistics and delivery. While the ability to provide such full package ser-vices requires integration and significant management skills, it does present an opportunity for low-cost manufacturers to capture greater value.
ICT
The growing role of ICT is a direct response to some of the other trends. Disaggregated production and fast fashion both require efficient and timely information sharing. ICT also allows suppliers to vertically integrate and provide full package services to lean retailers. Technologies such as computer-aided design are required for modern produc-tion. ICT can aid the communication between supplier and buyer, allowing for the automated checking of orders, stocks and prices, while enterprise resource planning integrates orders, sourcing, manufacturing, account handling and lo-gistics, thereby helping companies optimize operations. In addition, modern ICT tools can allow manufacturers to track units throughout the production line in real time, facilitating more effective monitoring.
Box 1 : Key takeaways for the Kenyan T&C sector
In light of these trends, Kenyan stakeholders must build capacities in a strategic manner so that their enterprises are enabled to meet the rig-orous demands of today’s buyers. Growth must be consumer-oriented and ICT integration will be crucial. To this end, efforts must be made to attract FDI to specific domains that require investment, technology and knowledge transfer, including online inventory management and enterprise resource planning. While technical skills must be enhanced in order to allow for greater productivity, improved managerial skills will be required to engage in complex, full package service delivery.
In addition, stakeholders must increase coordination so that they can supply adequate volume through consolidation and advocate for necessary policy support. It is particularly important that enterprises improve compliance with CSR principles and standards throughout the value chain so as to improve productivity and meet the requirements of an increasingly large portion of buyers. The Government meanwhile must address policy constraints ( particularly on CSR issues and electricity provision ), facilitate the upgrading of infrastructure and remove other trade hurdles.

[ KENYA TEXTILE AND CLOTHING VALUE CHAIN ROADMAP ]
4
RESILIENT TRADE IN THE FACE OF GLOBAL UNCERTAINTY
Global T&C exports have grown by 6 % annually since the turn of the century, despite the 2008 financial crisis. Indeed, exports of clothing fell by only 12 % in 2009, whereas total exports declined by 23 %. This resilience is one of the rea-sons that the sector continues to attract investment. The steady demand for T&C products makes it a relatively stable source of foreign exchange earnings for many countries.
Valued at US $ 781 billion in 2013, sectoral exports cur-rently account for 4 % of international trade. The most im-portant product categories include knitted apparel ( US $ 192 billion ), woven apparel ( US $ 187 billion ), cotton fibre and tex-tiles ( US $ 55 billion ), made-ups ( US $ 50 billion ), man-made filaments and textiles ( US $ 38 billion ), and man-made staple fibre and textiles ( US $ 36 billion ).
Apparel accounts for 57 % of the global T&C sector. The largest markets for clothing imports are the United States ( 21.2 % ), Germany ( 9 % ), Japan ( 8 % ) and the United Kingdom of Great Britain and Northern Ireland ( 6.3 % ). A number of markets, including the Russian Federation, the UAE, Viet Nam, Korea, Australia and China, have been growing at a very fast pace. The top 10 markets account for 65.5 % of total imports today, down from 77.3 % in 2003, highlighting the growing consumer base in developing and frontier markets.
Clothing exports have concentrated significantly over the past decade : whereas the top 10 exporters accounted for 59 % of global exports in 2003, that share had grown to 73 % in 2013. This period saw China solidify its position as
a market leader, its share of exports having nearly doubled from 20 % in 2003 to 38.8 % today. In addition to China, ex-port growth in Bangladesh, Viet Nam and India has been notable : the former two have gained relative market share with respect to China.
Production has shifted steadily towards Asia. The region now accounts for 65 % of world exports, compared with 32 % in 2004. This shift was stimulated by the dismantling of the MFA, after which producers sought to consolidate production in low-cost locations throughout Asia. In addi-tion, international buyers have been steadily shifting greater responsibility to their suppliers. By moving away from simple CMT, larger portions of the value chain are now concentrat-ed in supplier countries. It should be noted that despite the shift to Asia, a variety of countries still maintain competitive advantages based on factors such as proximity to markets ( for example Turkey to the EU ) or access to specific markets under preferential trade agreements.
Textiles account for the remaining 43 % of sectoral trade. The structure of textile imports has remained fairly static over the last 10 years and the United States and China have continued to be the top two importers. Even so, a number of new markets have begun to grow in importance. These include Viet Nam, whose imports had a CAGR of 18.1 %, Bangladesh ( 15.9 % ), Indonesia ( 22.9 % ), the Russian Federation ( 15.9 % ) and the UAE. Markets meanwhile have become slightly less concentrated : the top 10 importers now account for 46.7 % of the market, down from 53.5 % in 2003.
Table 1 : Top exporters of clothing, 2003-2013 Table 2 : Top exporters of textiles, 2003-2013
No. ExportersExported
value in 2003 ( US $ )
Exported value in 2013 ( US $ )
CAGR * Share ExportersExported
value in 2003 ( US $ )
Exported value in
2013 ( US $ )CAGR Share
1 China 45 757 114 165 044 601 13.7 % 38.8 % China 27 454 487 108 898 007 14.8 % 33.4 %
2 Bangladesh 5 040 792 26 258 818 17.9 % 6.2 % India 6 521 615 19 854 948 11.8 % 6.1 %
3 Italy 15 449 056 21 625 743 3.4 % 5.1 % Germany 13 973 846 16 493 995 1.7 % 5.1 %
4 Viet Nam 3 386 376 18 496 564 18.5 % 4.3 %United States 11 888 902 16 080 252 3.1 % 4.9 %
5 Germany 9 127 940 18 320 287 7.2 % 4.3 % Italy 14 008 743 13 926 994 -0.1 % 4.3 %
6 India 5 916 206 15 702 657 10.3 % 3.7 %Republic of Korea 11 579 132 13 782 165 1.8 % 4.2 %
7 Turkey 9 546 445 14 961 774 4.6 % 3.5 % Turkey 5 430 513 12 560 332 8.7 % 3.9 %
8 Spain 3 384 396 11 065 848 12.6 % 2.6 %Chinese Taipei 10 052 788 10 920 608 0.8 % 3.3 %
9 France 6 580 732 10 079 791 4.4 % 2.4 % Pakistan 5 862 994 9 398 146 4.8 % 2.9 %
10 Belgium 5 167 839 8 678 581 5.3 % 2.0 % Japan 7 139 211 8 209 987 1.4 % 2.5 %
Source : International Trade Centre ( 2015 ). *Compound Annual Growth Rate.

[ GLOBAL TRENDS 2025– LIVING THROUGH A TRANSFORMATIVE PERIOD ]
5
As with apparel, the largest exporter is China, which en-joys a 33.4 % market share. The textile supplier base has also grown more concentrated : the top 10 exporters now account for 70.6 % of total exports, compared with 63 % in 2003. As textile production requires more technology and skill than apparel production, it is generally less flexible. It
requires significant financial resources as well as time, and most developing countries are only engaged in textile pro-duction to a limited extent. Nevertheless a number of such countries, including China, India, Turkey and Viet Nam, have registered considerable growth over the past 10 years.
Box 2 : Room for emerging producers
Trade statistics highlight the fact that the sector continues to favour developing countries with competitive cost structures. It should also be noted that while a significant portion of the market is dominated by the largest exporters, smaller countries have recently succeeded in capturing greater market share. This, in conjunction with the sector’s continued growth even in times of crisis, indicates that there is ample
space for exporters with attractive cost structures, such as Kenya, to expand their participation.
Today, Africa contributes only 2.3 % to global apparel exports, down from 3.7 % at the turn of the century. Even so, renewed interest in Africa may present Kenya with an opportunity to capitalize on its competitors’ diminishing advantages.
THE DECADE AHEAD
Experts indicate that these market trends are likely to con-tinue, helping to shape the sector throughout the next dec-ade. The apparel market is expected to grow to US $ 2.1 trillion in 2025, up from US $ 1.1 trillion today. This will be driven largely by the growing consumption of T&C products in developing countries. Per capita spending on clothing will likely grow at the fastest pace in India ( 11 % ), China ( 10 % ), the Russian Federation ( 8 % ) and Brazil ( 4 % ). It should be noted that despite slower growth in developed countries, per capita spending on clothing will still be higher in the West. Nevertheless, the quicker per capita expansion, together with strong population growth, will help the developing world overtake the West as the main market for T&C products.6
6.– Wazir Management Consultants. Investment Opportunity for Textile Machinery Manufacturing in India : Tapping a US $ 75 billion textile machinery market by 2020.
The two fastest-growing markets will be China and India. This growth will be supported by the following trends in the two countries :
� Economic expansion and growth of disposable income � Population growth � Growing preference among Chinese consumers to buy
for fashion rather than utility � Increased exposure to organized retail and branded
clothing in India � Expansion of domestic brands � Growth of online retail.
Box 3 : Changing dynamics in China will lead to a US $ 100 billion trade gap
While China currently accounts for nearly 35 % of the sector’s total exports, its economy is at a crossroads in which private consumption will begin to overtake investment as the main driver of economic growth. This shift will likely result in structural changes to export-oriented sectors such as T&C.
As domestic demand for apparel grows, Chinese firms will become more oriented towards the local market, thereby reducing their ex-ports. In addition, supply-side shifts are expected to reduce garment
production. As a result of increasing costs and a greater focus on service providers, T&C output growth is expected to drop from 7 % to a more moderated 5 %–6 % per year. The combination of these demand-and supply-side shifts will result in a global trade gap : worldwide clothing exports are expected to grow to US $ 1,700 billion by 2025 ( CAGR of 6.5 % ), whereas China’s T&C exports will only grow by a CAGR of 6 %. The net result of this lag will be a US $ 108 billion market gap that represents an opportunity for other countries wishing to increase their share of the global market.
Source : Wazir Management Consultants ( 2013 )

[ KENYA TEXTILE AND CLOTHING VALUE CHAIN ROADMAP ]
6
By 2025, China will account for 27 % of the total market for apparel products and the combined market size of China and India will surpass that of the EU and the United States.
Experts also note that the sector will require significant investment in the coming years. The T&C sector is relatively capital intensive : the investment to turnover ratio is 1 :1 for spinning, 1 :1.5 for fabric production and 1 :4 for clothing production. As such, an investment of US $ 85 million ( land, building, equipment and other fixed assets ) is required to produce a US $ 100 million value of production at the gar-ment stage of the value chain. Enterprises must make in-vestments in order to both increase capacity and replace existing machinery. Experts calculate that the growth in
global apparel demand will require an additional US $ 165 billion of value of production by 2025.7 Given the investment turnover ratios, this will require US $ 142 billion of investments throughout the value chain. The replacement / upgrading cost of current equipment is expected to be roughly US $ 210 billion during the same period. The total required investment in the sector is therefore expected to be US $ 350 billion.
7.– Apparel demand is expected to grow by a value of US $ 1 trillion ( from US $ 1.1 trillion toUS $ 2.1 trillion ). Given that this increase will be due to both price and volume growth, and assuming an average of 3 % price inflation, demand will grow by US $ 410 billion ( retail ) or US $ 165 billion ( value of production ). ( Wazir Management Consultants ( 2013 ). The Road to 2025 : 5 Market, Trade, and Investment Trends That Will Define the Course of Textile and Apparel Industry, p. 22. )
Box 4 : Implications for Kenya
The developments in the sector have a number of implications for Kenya as it seeks to secure its place in the global value chain.
• Consumers are putting increased pressure on the T&C sector to improve social responsibility : suppliers are required to comply with CSR.
• The demand for full package services from lean retailers requires suppliers to expand their service offerings and create strategic partnerships with vendors rather than purely transaction-based relationships ; this presents an opportunity for low-cost manu-factures to capture greater value.
• Firms must increase volume capacity, either internally or through consolidation / partnership agreements, to meet large and often unpredictable buyer requirements.
• Firms must increase their ability to quickly supply the market in response to fast fashion demands.
• Companies are highly encouraged to invest in quality, increase their product development competency and develop their multi-fibre expertise.
• Increased management and ICT capacities will be required to satisfy buyer demands.
• So far, Asian countries have emerged as winners in global trade. In the next few years some of them will become important markets as well. China’s increasing focus on the domestic market and value added production will result in multibillion dollar trade op-portunities for suppliers in competing nations. Trade intelligence will be essential to tap into these opportunities.

Photo: Mimco Kenya Visit - (c) Louis Nderi & ITC Ethical Fashion Initiative (5).jpg
[ KENYA’S T&C SECTOR IS AT A CROSSROADS ]
7
KENYA’S T&C SECTOR IS AT A CROSSROADS
A rich history
The historical roots of Kenya’s T&C sector date back to the early 1900s, when cotton cultivation was introduced to the country. It was not until the 1960s, however, that concerted efforts were made to develop the sec-tor. The newly independent Government quick-ly recognized the potential offered by cotton and its affiliated industries and significant measures were introduced through the adoption of the Import Substitution Policy. The goal of this policy was to encourage integration of textile mills with cotton producers. In addition, the Government invested in textile mills. Other interventions included controlling margins throughout the value chain. Moreover, the Government protected the do-mestic textile sector through the application of onerous tariffs. The policy served its intended purpose and the textile industry expanded. By the 1980s it was the most impor-tant manufacturing sector in Kenya: it accounted for roughly 30 % of employ-ment in the manufacturing sector and relied on over 200,000 household farms.
The sector began to decline in the late 1980s with the large-scale introduction of second-hand clothing, or ‘mitumba’. This cloth-ing was sold at low prices and severely undercut those of domestic goods. The decline was further complicated by an influx of cheap imports spurred by the sector’s liberalization in the 1990s. As a result, the average capacity utilization at textile mills throughout the country fell to only 50 %.
Prospects for Kenya’s T&C sector changed dramati-cally, however, at the turn of the century. The catalyst for this change in fortune was the adoption of two trade agree-ments: AGOA and the African, Caribbean and Pacific–EU Cotonou Agreement in 2000. The new market access con-ditions spurred an interest in the Kenyan T&C sector and in the years following the adoption of AGOA both investment and employment jumped significantly.
The past 10 years have witnessed a marked expansion in demand for Kenya’s T&C products : T&C exports now account for 7 % of Kenya’s total exports ( 2013 ), compared with only 2 % in 2003, having grown by a CAGR of 48 % between 2003 and 2013. This growth has been driven entirely by an expan-sion in apparel exports through the performance of Export Processing Zone ( EPZ ) firms. Textile exports were flat, while home textile exports have been declining by 5 % per year.

[ KENYA TEXTILE AND CLOTHING VALUE CHAIN ROADMAP ]
8
The need for a new paradigm?
Despite significant growth over recent years, Kenya’s T&C industry is still relatively small. Valued at US $ 330 million, it represents only 0.6 % of gross domestic product and 6 % of the total manufacturing sector.8 In addition, there is a sig-nificant disconnect between the progress achieved in the textile and clothing subsectors. The garment subsector has outperformed in recent years, due largely to the preferential market access granted under AGOA and, in particular, the third-country fabric provision which allows Kenya to produce apparel with fabric imported from Asia.9 Today the United States market buys the vast majority of Kenya’s T&C exports. The textiles segment meanwhile continues to underperform : because the American-led growth of apparel production used imported materials, the textile sector participated little in this expansion.
According to the Kenya National Bureau of Statistics ( 2015 ), the growth in textile production in 2014 was driven by increased production of knitting wool ( 25.5 % ), woven fabric ( 16.4 % ) and blankets ( 4.3 % ). In contrast, the production of goods such as twine, cordage and rope declined by more than 25 %. For apparel, the leading products in 2014 were cardigans ( increase of 13.4 % ), T-shirts ( increase of 5.2 % ) and shirts ( increase of 1.4 % ).10
8.– Katrina Manson ( 2014 ). Investing in Kenya : textiles sector in Kenya gears up to take a larger share of world market. Financial Times, 2 December. Available from http : / / www.ft.com / cms / s / 0 / 75b7273e-6040-11e4-88d1-00144feabdc0.html#axzz3ZBq7tNDC.9.– African Cotton and Textile Industries Federation ( 2013 ). Policy Research on the Kenyan Textile Industry : Findings and Recommendations, p. vi. Nairobi : ACTIF. 10.– Kenya National Bureau of Statistics ( 2015 ). Economic Survey 2015. Nairobi : KNBS.
The sector’s recent advances have been driven by a number of factors. Firstly, Kenya benefits from preferential market access to the United States and Europe, and regionally has a Free Trade Agreement with the East African Community ( EAC ) and the Common Market for Eastern and Southern Africa ( COMESA ). In addition, wages in Asia have been rising : whereas salaries in Kenya’s T&C sector range from US $ 120 to US $ 150 per month, they are US $ 500 per month along China’s coast and US $ 250 per month in China’s inte-rior.11 While regional neighbours including Ethiopia certainly offer competition, Kenya’s workforce has an advantage : workers are quite skilled in garment making and worker re-tention tends to be higher in Kenya than in neighbouring Ethiopia, which suffers from greater turnover. In addition to the labour supply, Kenya’s water supply, decreases in elec-tricity cost, recent infrastructure investments, port efficiency, relative proximity to Europe and green energy potential have made it attractive for greenfield investment.
Western buyers are also re-evaluating their sourcing strategies in light of ethical concerns such as the unsafe working conditions in many low-cost production centres. For example, although wages in Bangladesh are quite low at US $ 67 per month, growing concerns over CSR have left Western buyers looking elsewhere for new suppliers.
11.– Katrina Manson ( 2014 ). Investing in Kenya : textiles sector in Kenya gears up to take a larger share of world market. Financial Times, 2 December. Available from http : / / www.ft.com / cms / s / 0 / 75b7273e-6040-11e4-88d1-00144feabdc0.html#axzz3ZBq7tNDC.
Table 3 : Comparison of costs and competitive factors between Kenya and major T&C competitors
Estimated values Kenya EthiopiaUnited Republic
of TanzaniaIndia China Viet Nam
T&C export value ( US $ millions, 2013 ) 377 94 248 40 192 273 959 21 534
Cotton production ( thousands of 480 lb. bales ) 32 175 375 30 000 30 000 17
Cost of labour ( US $ per month ) 110 -150 50 -60 70 175 550 180 -200
Labour skills Low–medium Low Low High Very high High
Cost of electricity ( US¢ / kilowatt-hour [ kWh ] ), estimated average 16 -18 2 -5 12 7 -12 9–15 8
Percentage of annual sales lost to electrical outages 5.6 2.6 5.5 2.0 0.1 1.1
Cost of construction ( US $ per ft2 ) 21 40 34 18 -20 15 -20 20 -25
Lending rates ( Annual Percentage Rates, estimated ) 14 -18 8.5 19 7 -13 7 6 -7
Time to clear Customs, inputs + exports ( days ) 31 37 44 12 17 15

[ KENYA’S T&C SECTOR IS AT A CROSSROADS ]
9
Box 5 : Growing concerns over CSR
In April 2013, an eight-storey building collapsed in Dhaka, Bangladesh, resulting in the deaths of 1,129 people and the injury of an additional 2,500. As the building was being used for the manu-facture of ready-made garments, the tragedy brought new focus onto the dangerous working conditions in the T&C sector. In the years following the collapse, the sector has been subject to increasing
consumer pressures for social responsibility and both the Government and international retailers have pledged to improve working conditions. Other multinational buyers have stopped dealing with factories in Bangladesh due to the lack of CSR standards, while some countries are paying off the damaged reputation of Bangladesh in their efforts to attract socially aware buyers.
Despite the significant potential offered by Kenya’s compar-ative advantages, there are signs that these factors may not be enough to ensure long-term success unless the sector takes a more strategic approach to its development.
A major concern is the worrisome trend in Kenya towards lesser value addition.12 Many competitors in Asia and Africa are increasing their efforts to integrate local inputs through farm-to-fashion production models. While Kenya made simi-lar efforts to increase the availability of local materials, they were relatively unsuccessful and the sector was forced to continue relying on imported materials. Not only this but many factories in Kenya, particularly subsidiaries of foreign companies, are moving away from value addition : they have stopped sourcing their own materials and are moving to-wards a CMT model, serving as simple contractors for buy-ers who supply all necessary designs and materials. This
12.– Global Development Solutions ( 2014 ). Value Chain Analysis of Priority Industrial Sub-Sectors in Kenya, Part I : Textiles and Garments, p 6.
reduces the value created within the country and diminishes pressures for input production.
Recent trends indicate that Kenya’s T&C sector has not achieved a level of competitiveness and value addition that can stand the tests of time. While competitors are moving up the value chain, integrating and providing a greater breadth of services to buyers, Kenyan producers have been reduc-ing the value content of their services. This not only reduces the income and employment generated but it also diminish-es spillover effects. In addition, although leveraging a CMT niche has worked so far, it is unlikely to be a sustainable business model given the global trends in production and buyer requirements. Another concern is the sector’s concen-trated reliance on AGOA. While market access under AGOA has been a key driver for Kenya’s T&C export success, many producers have come to believe that their goods are more competitive than they truly are. Indeed there are signs that, in the absence of AGOA, the garment sector might not be able to survive regional and global competition.
Figure 2 : Production trends in the garment sector
Current Production Trend in Asia and Africa (Incl. Ethiopia and Uganda)
Current Production Trend in Kenya’s Garment
• Labor (low skill)
• Electricity
• Imported fabric supply
by buyer
CM• Labor (low-semi skill)
• Electricity
• Imported / Local fabricFOB
• Labor (low-semi-
specialized skill)
• Electricity
• Imported / Local fabric
OriginalDesign
• Labor (low-semi-
specialized skill)
• Electricity
• Imported / Local fabric
• Local yarn / thread
Farm-to-Fashion
Source : Global Development Solutions ( 2014 ), p. 6.

[ KENYA TEXTILE AND CLOTHING VALUE CHAIN ROADMAP ]
10
Figure 3 : Kenya’s T&C value chain

[ KENYA’S T&C SECTOR IS AT A CROSSROADS ]
11
THE VALUE CHAIN IS STUNTED BY LIMITED INTEGRATION AND SUBOPTIMAL VALUE ADDITION
Enterprises in Kenya cover the entire T&C value chain, from input production to textile manufacturing and cloth-ing assembly. In general, the garment section is the most advanced part of the value chain and limited investment downstream has led to capacity imbalances and relatively weak performance in the cotton, ginning, spinning, weaving and fabric finishing segments.13
The sector is characterized by a general lack of coor-dination between segments, which leads to inefficiencies and gaps in quality. In addition, international buyers and procurement agents control the value chain. They dictate factors such as price, quality and delivery time. This has put pressure on the sector to shift towards high volume, low margin production.
Inputs
One of the T&C sector’s main inputs is cotton. It should be noted that despite domestic cultivation, Kenya is a net im-porter of cotton ; only 7,000 tons of domestically produced cotton fibre is used in the T&C value chain and this figure is in decline. These levels are not enough to meet the de-mand from spinning mills. Most of Kenya’s imported cotton is purchased from Uganda. Cotton is currently cultivated in every province of the country with the exception of Nairobi.
13.– Regional Agricultural Trade Expansion Support Programme ( 2003 ). Cotton-Textile and Apparel Value Chain Report for Kenya. Nairobi.
Production is dominated by between 30,000 and 45,000 smallholder farmers who grow under rain-fed conditions on areas averaging below one hectare and with minimal use of inputs. All of the cotton, of which two varieties are grown ( HART 89 M and KSA 81 M 14 ), is handpicked and roller-ginned. Most farmers have remained unorganized following the sector’s liberalization. As such, access to extension ser-vices, inputs and credit is difficult. In addition, there is little collective bargaining or marketing. In total, Kenya contains 385,000 hectares of land that is suitable for cotton ( 350,000 rain-fed and 35,000 irrigated ). Total production potential exceeds 300,000 tons of cotton seed. Nevertheless, only 40,000 hectares are currently being used for cotton.
Production has been volatile, reaching a peak of 39,300 tons of lint in 1984 / 85. Most recently, the International Cotton Advisory Committee ( ICAC ) estimates that production was 6,000 tons of lint in 2013 / 14. As such, Kenya ranks 21 among cotton-producing countries in Africa.
Yields are 185 kg / hectare ( 2013 / 14, ICAC ), making them among the lowest in both Africa and the world. This is due to a variety of factors including limited farming skills, inad-equate extension services, limited access to credit, variable rainfall, limited uptake of fertilizers, inadequate pest control and crop management techniques, and unstable market prices for cotton seed.
14.– African Cotton & Textile Industries Federation ( 2011 ). Competitive Supply-Side Analysis of Cotton, Textile & Apparel Sectors in East Africa : Kenya, Sudan, United Republic of Tanzania and Uganda.
Figure 4 : Kenyan cotton production 1940 / 41-2010 / 11
Source : ICAC.

[ KENYA TEXTILE AND CLOTHING VALUE CHAIN ROADMAP ]
12
The ginning segment operates significantly below its capac-ity, which is estimated to be roughly 200,000 bales ( ~37,000 tons ) of lint. In comparison, the maximum historic output was only a third of this amount. Only eight of the 20 ginner-ies in Kenya are operational and most are using outdated equipment. Kenya’s ginning outturn of 33.3 % is the lowest in Africa ( 21 % lower than the levels achieved in West and Central African countries of the franc zone ). The low utiliza-tion rate leads to significantly reduced productivity, thereby inflating processing costs. Ginning overcapacity also harms the quality of Kenyan lint by fostering competition for in-puts between ginners : although Kenyan cotton seeds are of good quality, the dearth of supply when compared to ginning capacity leads buyers to purchase any seed they can, without giving due consideration to quality. This results in high levels of contamination and limited value addition. Increasing profitability in the cotton segment will therefore require increased productivity at both the production and ginning levels.
Other inputs, including agrichemicals, man-made fi-bres, machinery, dyes for yarn and a large portion of fab-rics, are imported from abroad. Although labour is sourced domestically, the sector suffers from a lack of appropriately qualified human resources including managers, operators and designers. Expensive electricity is another detriment to profitability, particularly in the more capital-intensive textiles segment.
Yarn spinning
Kenya’s spinning mills tend to be large and characterized by low levels of productivity, and they all operate well below capacity. Production costs vary significantly, depending on such factors as the quality and origin of cotton. It should be noted that, despite limited production in the spinning seg-ment, the cotton sector does not produce enough lint to meet mill demand. Kenya continues to import cotton lint in order to meet this deficit. It should also be noted that export-oriented enterprises tend to use imported materials.
Enterprises in Kenya’s yarn spinning segment have a capacity of roughly 140,000 spindles, of which they utilize 40 %–50 %. The main product for domestic and regional markets is acrylic yarn, whereas exports are dominated by organic cotton yarn, blended yarns and sewing thread.15
There is just one stand-alone spinning mill ( Rupa Mills ) in Kenya’s T&C value chain. This mill produces cotton yarns, blended yarn and 100 % polyester and acrylic sew-ing threads. The remainder of spinning activity is undertaken by integrated and semi-integrated mills with the following specialties :
15.– Ibid. : p. 32.
� One blanket production company : Spinners & Spinners. This company produces blankets, and yarn and fabrics for Maasai clothing.
� Two semi-integrated mills oriented towards knitting : Midco EA and Fine Spinners.
� Four semi-integrated mills oriented towards weaving : Rivatex, Thika Cloth Mils, TSS Mills, UTI.
� One semi-integrated mill with no orientation : Sunflag Kenya.
Of the yarn produced, 10 %–20 % is exported, mainly to Uganda, Rwanda, the United Republic of Tanzania and Nigeria. The remaining 80 %–90 % continues along the do-mestic value chain to the weaving and knitting segment.
Weaving, knitting, dyeing and finishing
As with the spinning segment, enterprises in this segment of the value chain tend to be quite large and operate well below capacity. They suffer from poor levels of productivity, high input costs ( both labour and electricity ), outdated technol-ogy, limited transport, limited access to finance, low quality, limited market outlets, and price unpredictability. Enterprises producing fabrics for export tend to rely on imported materi-als. The main product for the domestic and regional markets is woven fabric, while organic cotton knit fabric and fabric of cotton / man-made-fibre blends are exported.
The segment is operating at roughly 40 %–50 % of to-tal capacity and it relies on imported yarns from India, Indonesia, China and Chinese Taipei. In total there are 15 enterprises engaged in the weaving, knitting, dyeing and finishing space. In addition to the eight semi-integrated mills detailed under the yarn overview, there is one stand-alone textile company ( Alpha Knits ). Kenya also has four stand-alone knitting companies ( Ken Knit, Kayn, Spin Knit and Bubco ) that produce T-shirts, undergarments and jersey. The sector’s two stand-alone weaving companies ( Bedi and Supra Textiles ) produce suiting fabric, kikoyi, school uni-forms, corporate uniforms, African printing, bed sheets and covers, home textiles and shirting. It should be noted that there are no stand-alone dyeing / finishing plants and that all such activities, to the extent that they are present in Kenya, are performed in textile mills.
Fabrics are then exported to Uganda, the United Republic of Tanzania, Zimbabwe, Rwanda and Nigeria. While a portion is purchased by local garment producers, it is only 7 % of the fabric demanded by the sector.
Design and sewing
With the opening up of the American market through AGOA, Kenyan apparel firms have shifted production away from the manufacture of African print garments meant for the

[ KENYA’S T&C SECTOR IS AT A CROSSROADS ]
13
domestic and regional markets.16 Instead, enterprises are now producing a wide range of apparel for export includ-ing jeans, trousers, shorts, shirts, nightwear, blouses and dresses. However, they do continue to produce trousers, uniforms, overalls, vests and inner garments for local and regional markets.17
Enterprises are currently operating at 100 % of capac-ity, and capacity is continuously being expanded through investment. Kenya imports roughly 93 % of its fabric supply, mainly from China, Hong Kong, Chinese Taipei, Pakistan and India. The necessary trims, machinery and spare parts are also imported. It should also be noted that despite the existence of some accessories producers in EPZs, the ma-jority of accessories are imported.
The design and sewing segment includes 170 medium and large garment companies as well as nearly 75,000 small
16.– Mangierie, Tina ( 2006 ). African Cloth, Export Production, and Secondhand Clothing in Kenya, p. 10. Chapel Hill, N.C. : University of North Carolina at Chapel Hill.17.– African Cotton & Textile Industries Federation ( 2011 ). Competitive Supply-Side Analysis of Cotton, Textile & Apparel Sectors in East Africa : Kenya, Sudan, United Republic of Tanzania and Uganda, p. 32.
and micro enterprises. These companies produce a wide range of goods for both the domestic and foreign markets. Products include shirts, trousers, uniforms, overalls, vests, inner garments, décor, rugs / carpets and handloom goods. Many of these companies ( including KikoRomeo, Loulou Creations, Sandstorm, Panah Project, Mefa Creations and Kimila Afrika ) add significant value by designing their own products.
The sector also includes roughly 22 foreign-owned companies in the EPZs. Owned mainly by Asian TNCs, they engage largely in CMT activities, producing towels, T-shirts, fleece jackets and trousers, woven pants, jeans, tops, shorts, cardigans, pullovers, 100 % polyester sports-wear, and children’s’ wear. Nine foreign-owned accessories producers also operate out of the EPZs. Lastly, a small num-ber of locally-owned micro garment companies are being incubated through Kenya’s Export Business Accelerator Programme ( EBAP ) within the Athi River EPZ in order to facilitate transfer of capacities from lead firms. The initia-tive has yielded good results, improving local ownership of EPZ companies, and is in the process of being replicated in other EPZs. Kenya’s garment enterprises are supported by domestic packaging companies.
Box 6 : Kenya’s EBAP
The majority of companies benefiting from EPZs tend to be both large and foreign-owned. A feasibility study performed in 2003 noted that the following challenges have historically hindered greater micro, small and medium-sized enterprise (MSME) participation in EPZs: lack of export market information, lack of suitable business premises, high rental costs of EPZ facilities, lack of credit facilitation, lack of suitable export facilitation for SME exporters and lack of provision of business development services.1
1.– Kenya Export Processing Zones Authority (2013). The Export Business Accelerator Programme. Available from http://www.epzakenya.com/index.php/investment-information/ epz-business-incubator.html.
EBAP was launched in an attempt to help MSMEs overcome these constraints and benefit from Kenya’s EPZ initiative. To this end, EBAP serves as an incubator that helps to accelerate growth of MSMEs wishing to operate within EPZs so that they can grow into medium- and large-scale exporters.
Source : Export Processing Zones Authority ( 2013 ).
Distribution
Most local garment manufacturers sell their products on the domestic market to consumers, tourists and hotels. Domestic sales include home textiles, conference materials and various types of clothing, including trousers, uniforms, overalls, vests and inner garments.
About 15 local companies engage in export. The compa-nies operating out of EPZs meanwhile export 100 % of their products. Almost all ( 95.4 % ( 2013 ) ) goods are exported to the United States under AGOA, where they are sold through
mass merchandizing chains, department stores, specialty stores, factory outlets, and off-price or mail order outlets. Canada is the second-largest market, receiving 1.1 % of Kenya’s garment exports. Other important markets include the United Republic of Tanzania ( 0.5 % ), Uganda ( 0.5 % ) and the Netherlands ( 0.3 % ), where Kenyan goods are sold through local retail markets.

[ KENYA TEXTILE AND CLOTHING VALUE CHAIN ROADMAP ]
14
Primary suppor t services
Overall policy support is provided by the MoIED, which is tasked with leading Kenya’s economic development efforts. In addition, it oversees the Export Processing Zones Authority ( EPZA ), whose role is to promote export-oriented investment through its management of the EPZs. Various services are provided by both governmental and private sector organizations including the Kenya National Chamber of Commerce and Industry ( KNCCI ), the Kenya Bureau of Standards ( KEBS ), EPZA, the Kenya Investment Authority ( KenInvest ) and the Kenya Revenue Authority ( KRA ). The Export Promotion Council ( EPC ) is Kenya’s trade promotion organization and it provides trade infor-mation services, technical assistance, policy advice, and
marketing and sales services. The T&C sector meanwhile is represented by a number of associations : the Kenya Association of Manufacturers ( KAM ), covering textile manufacturing activity ; the Kenya Apparel Manufacturers and Exporters Association ( KAMEA ) ; the Association of Fashion Designers ; and the Handloom Weavers’ Marketing Cooperative Society ( WEAMACO ). The East Africa Trade Hub and African Cotton and Textiles Industries Federation ( ACTIF ) also provide support to the sector.
Education and training is provided by a range of univer-sities and technical and vocational education and training (TVET) institutions (such as the Evelyn College of Design or, Vera Beauty and Fashion College) and are complemented by the various training institutions (such as the Technology Development Centre or Kenya Textile Training Institute).
Box 7 : Salient issues of the current value chain
Given the state of the cotton and textile segment, it is unlikely that the value chain will achieve full integration in the short-to-medium term. Indeed, the quantity of cotton produced is so low that it is unrealistic to expect a significant revival in the provision of domestic raw materials. Similarly, there are only a few yarn and fabric producers, and none of them are located in EPZs. The goods that these enterprises do produce are of low quality and only a small portion is used by the garment segment. Improvements in the textile segment will require significant investment in both equipment and skills upgrading. Furthermore, foreign investors are discouraged by the very high electricity costs
that make textile production uncompetitive. As such, the Government must make concerted efforts to lower these costs.
The garment segment has experienced greater success, as evidenced by the proliferation of local enterprises. Nevertheless, foreign invest-ment has been targeted towards CMT activities. Increasing value addi-tion will require the targeted attraction of more ‘productive’ investment. As a prerequisite, technical, design and management skills must be enhanced so that investors are confident in Kenya’s ability to provide a wider range of services to modern buyers, including lean retailers.
BUSINESS-ORIENTED POLICIES HAVE BEEN WELCOMED BY THE PRIVATE SECTORIndustrial policy
Kenya has been implementing strategies to promote private sector-led growth since the early 2000s. In this framework, it has been actively reviewing and amending its industrial poli-cies to reflect the fast-changing landscape of international competition. The country’s overall economic strategy has been formulated in the Government’s Vision 2030, a ‘long-term development blueprint to create a globally competitive and prosperous nation with a high quality of life by 2030’.18 The economic pillar of the vision seeks to foster a 10 % an-nual growth rate by focusing on intermediate objectives. The current intermediate objectives include improvements in the areas of tourism, agriculture, wholesale and retail trade, manufacturing, information technology, financial services, and infrastructure.
18.– Kenya Vision 2030 ( 2015 ). Website. Available from: http : / / www.vision2030.go.ke / .
Twenty-five flagship projects are currently being imple-mented to address constraints in these focus areas, some of which may impact the T&C sector, directly or indirectly. These include projects that seek to establish small and me-dium-sized enterprise ( SME ) parks and Special Economic Zones ; improve infrastructure through the construction of the Dongo Kundu port ; stimulate the creation of producer business groups ; and develop wholesale market hubs. The Government has also extended a number of incentives to investors in its efforts to stimulate export growth ( detailed further in the following section ).
The Government will soon be launching the Industrial Transformation Programme in support of Vision 2030’s eco-nomic pillar. With the overall goal of making Kenya an indus-trial hub, it seeks to increase manufacturing to more than 15 % of gross domestic product, create 1 million jobs, increase FDI by a factor of five, improve the ease of doing business and support the development of Kenyan SMEs. The T&C sector has been identified as a priority industry and it will be the focus of the following sector-specific flagship projects :19
19.– Kenya Ministry of Industrialization and Enterprise Development ( 2015 ). Kenya’s Industrial Transformation Programme, pp. 44–45.

[ KENYA’S T&C SECTOR IS AT A CROSSROADS ]
15
1. Construction of a green industrial park and textile city in Naivasha
2. Attract one to two large, integrated anchor deals3. Encourage textile manufacturers to create fabric distribu-
tion hubs4. Increase support to existing textile and apparel players
through performance contracts5. Attract three to five sourcing companies to establish a
local presence6. Increase local cotton growth through attracting an an-
chor investor.
Trade policy
A member of the WTO since 1995, Kenya has participated in all major WTO trade talks and it maintains a negotiat-ing team in Geneva. The country is an active member of the organization and it has presented position papers on a number of issues. Kenya does, however, continue to face a number of challenges with regards to its participation.20 The goal of Kenya’s current trade policy is to enhance regional integration, notably through the EAC, as a step towards becoming a more globally competitive country. Kenya is a founding member of the EAC and it is implementing the EAC Development Strategy, which aims to consolidate the Customs union, move towards a common market, estab-lish a monetary union and lay the foundations for a political federation. The strategy also promotes the development of economic infrastructure ( including energy ) that would sup-port and spur economic growth in the member states, while it calls for the monitoring and elimination of non-tariff barri-ers that hamper intra-EAC trade.21
Kenya is also a member of COMESA. As such, it receives and applies preferential tariffs to 19 countries, 14 of which ( including Kenya ) have entered into a Free Trade Area. The country is currently undertaking negotiations to conclude the tripartite agreement between COMESA–EAC–Southern African Development Community ( SADC ) ( which will grant Kenya preferential access to the fast-growing South African market ) and finalize the Economic Partnership Agreement with the EU as part of the EAC region.
It should be noted that India recently offered free mar-ket access for African least developed countries. However, Kenya was recently reclassified as a developing country so it will not benefit from this duty-free, quota-free agreement. Nevertheless, EAC countries are preparing a white paper to advocate for the agreement to be extended to the en-tire EAC region. The white paper also seeks to expand the scope of the agreement so that it includes non-accumulated products : at the moment, the agreement only applies to
20.– Odhiambo, W., Kamau, P. and McCormick, D. ( 2015 ). Managing the challenges of WTO participation : case study 20 : Kenya’s participation in the WTO : lessons learned. Available from https : / / www.wto.org / english / res_e / booksp_e / casestudies_e / case20_e.htm.21.– World Trade Organization ( 2012 ). Trade Policy Review Report by the Secretariat, East African Community, WT / TPR / S / 271.
products that are 100 % made within the beneficiary country, from fibre to garment.
While not a trade policy per se, particular mention should be made of Kenya’s trade relations with the United States. AGOA was recently extended for 10 years, to 30 September 2025. As this extension includes the continuation of the third-country fabric programme for the same period, it will ensure that Kenyan apparel products continue to have duty-free ac-cess to the American market. The renewal is of great impor-tance, as the previous series of short-term extensions had deterred investors by compounding the risks already inherent in investing in Africa. Indeed, most investors require at least a 10 year horizon to amortize a major investment, such as those necessary to build a new textile factory. The fact that Congress had never extended AGOA for 10 years or more is one of the main reasons that the upstream textile production originally envisioned by the creators of AGOA has yet to materialize.
Kenya has also taken a number of unilateral steps to-wards improving its trade environment. The Tax Remission for Export Office, for example, remits duty and value added tax ( VAT ) on raw materials used in the manufacture of goods for export. This is applicable as long as the commodity is transformed in some way through assembling, packag-ing, bottling, repacking, mixing, blending, grinding, cut-ting, bending, twisting, joining or any other similar activity. However, the remission is not granted for the importation of plant, machinery, equipment, fuels or lubricants. Various modernization projects and reforms are also being imple-mented in an effort to facilitate trade through enhancement of Customs, Road Transportation, Business Automation and other relevant services .
The Government has made great strides in improving the business environment through its industrial and policy re-forms. The sector now enjoys enviable market access and a supportive policy framework. Nevertheless, the capacities of Government officials to formulate effective trade policies must be improved and mechanisms for stakeholder coor-dination and consultation when pursuing trade objectives need reinforcing. This will allow for trade policies to be modi-fied in line with the dynamic needs of the T&C sector.

[ KENYA TEXTILE AND CLOTHING VALUE CHAIN ROADMAP ]
16
Box 8 : Non-reciprocal preferential market access
In addition to the United States ( through AGOA ), Kenya receives non-reciprocal preferential tariffs from most other developed markets, including : Australia, Canada, the EU, Japan, New Zealand, Norway and Switzerland. It receives similar concessions from some emerging and frontier markets such as Turkey and some Commonwealth of Independent States countries ( namely Belarus, Kazakhstan and the
Russian Federation ). It would be important that such information is dis-seminated in a more efficient manner in order to stimulate T&C market diversification. Indeed, several studies on non-reciprocal preferential arrangements find that limited awareness among the private sector, and sometimes even among the public sector, is one of the main reasons that preferential duties are not leveraged to their full extent.
Figure 5 : Investment and exports in the EPZ garment sector ( 2008-2014 ) ( US $ millions )22
-
5
10
15
20
25
30
35
40
-
50
100
150
200
250
300
350
400
2008 2009 2010 2011 2012 2013 2014 Employment
Thou
sand
s
Mill
ions
Investment (USD million) Exports (USD million) Employment
Source : Kenya Export Processing Zones Authority ( 2012 ).
22.– Kenya National Bureau of Statistics ( 2015 ). Economic Survey 2015, p. 202. Nairobi : KNBS. Direct data ( reported by Kenya ) and mirror data ( reported by trading partners, in this case the United States ) differ significantly between 2001 and 2004 ; mirror data shows that garment exports increased from 2001 onwards, whereas the increase is evidenced from 2005 onward in direct data. In this graph, the data reported by the United States provides greater clarity on the impact of AGOA.
FDI HAS CARRIED THE GARMENT SEGMENT BUT LEFT THE TEXTILE SEGMENT BEHIND
Kenya is a promising investment destination for garment manufacturing in East Africa. It is one of the few countries that have successfully capitalized on the United States mar-ket access advantage provided by AGOA. In 2014, Kenya replaced Lesotho as the largest garment exporter to the United States under AGOA. Indeed, AGOA has been an im-portant driver of growth for Kenya’s garment manufacturing industry. Prior to 2000, the year that AGOA came into force, Kenya’s T&C exports were negligible. However, exports started to grow steadily following the initiation of preferential market access.
Kenya FDI attractiveness
Kenya fares well in various international business rankings compared with regional competitors (see Appendice sec-tion A). Its rankings, however, are significantly lower than those of large Asian T&C producing nations. Despite hav-ing a low-cost manufacturing country (Ethiopia) and a large cotton-fibre-producing nation (United Republic of Tanzania) as neighbours, Kenya has been able to continuously attract FDI in the garment sector. In 2013, the Government licensed 46 new garment factories, a historic high. Over the years, Kenya has developed a garment manufacturing industry which is far more evolved than that of its neighbours, hav-ing fostered effective market linkages and raw material and garment trade networks. Large buyers have established footholds that they use to capitalize on Kenya’s advantages. Meanwhile in competing countries the sector is at the begin-ning of its growth cycle.

[ KENYA’S T&C SECTOR IS AT A CROSSROADS ]
17
It should be noted that input costs (power, wages, etc.) in Kenya are high when compared with other global T&C producing nations. While the Government is taking steps to make them more competitive, Kenya’s strategy is not to make itself the cheapest manufacturing destination. In one of the SITA consultations, Jas Bedi, Chair of KAM said, ‘We do not want to be the Bangladesh of Africa’, referencing that country’s low-cost manufacturing model. ‘We want to be the Sri Lanka of Africa’, implying the need to produce value added garments and improve productivity in order to compensate for higher costs.
Government support
The Kenyan Government is keen to promote the T&C sector’s development, having recognized that it has the potential to contribute substantially to employment and in-come generation. It has thus begun a series of initiatives aimed at attracting foreign investors. Kenya’s EPZ and Manufacturing under Bond frameworks are well-established (see Appendice section A). More than 80% of T&C goods produced in Kenya come from enterprises located in EPZs and the sector represents a third of all economic activity within these zones, employing over 37,000 people. Much of the investment in EPZs is coming from Asia. In 2012, half of all EPZ enterprises were foreign-owned, one-fourth were joint ventures and the rest were wholly Kenyan.
Kenya meets the fundamental needs of FDI projects in that FDI is given national treatment. There are standard guarantees against expropriation, no foreign exchange con-trols and profits may be remitted freely. Although foreigners and foreign-controlled companies may not own land, 99-year leases are available. Bilateral investment treaties with 14 countries (five in force with EU countries; nine ratified but not yet in force, such as with China) and Kenya’s membership in the International Centre for the Settlement of Investment
Disputes provide investors with additional confidence that they will be treated fairly by the Kenyan Government.
FDI concentrated in CMT activities located in EPZA major challenge that remains, however, is the lack of up-stream capacities in the garment manufacturing portion of the value chain. The garment industry works mostly with im-ported fabrics and other inputs. Foreign investors in Kenya take a hands-off approach to investing in the country. They generally perform simple and stand-alone CMT activities and their interaction with the wider sector (and economy) is negligible. This limits spillover effects and has diminished the stimulation of value added production. This might also be due to the fact that investment promotion intermediaries (IPIs) relationships with investors have tended to be devel-oped very little beyond the provision of EPZ space and ser-vices; or the issuance of permits, certificates and licences; or the provision of industrial park space and services. A priority in the future will be to ensure more integrated in-volvement of existing domestic and foreign investors. The construction of ‘textile cities’, such as the Naivasha project in Athi River, could contribute to solving this problem and attracting investment in the textile segment, thereby ensur-ing constant input supply to local garment manufacturers.
Moving forward, the Government must make efforts to direct investment towards areas of the value chain where it is most needed. To this end, investment should be targeted at non-CMT garment activities as well as the textile segment. One of the key reasons for the lack of FDI in textiles is the high cost of electricity, which makes the segment uncom-petitive. Given the current state of the textile segment, this need is urgent: if the Government does not act now to make the necessary reforms and improve the business environ-ment, the segment may perish for good.
Box 9: Textile cities as a solution to spur vertical integration
Textile cities are industrial zones dedicated to textile processing and related input supply, ensuring common water treatment, Effluent Treatment Plants ( ETPs ), dormitories, sheds, uninterrupted power
and water supply, expressway connectivity to ports and main cities, etc. Various leading countries in the sector have used such industrial arrangements to facilitate vertical integration of the T&C value chain.

[ KENYA TEXTILE AND CLOTHING VALUE CHAIN ROADMAP ]
18
Figure 6 : Kenya’s T&C export trends, by segment, 2004-2013 ( US $ thousands )
-
50.000
100.000
150.000
200.000
250.000
300.000
350.000
400.000
2004
2005
2006
2007
2008
2009
2010
2011
2012
2013
Fiber / Filament
Yarn
Others
Fabric
Home Textiles
Headgear
Woven Apparel
Knitted Apparel
Total Exports
Source : International Trade Centre ( 2015 ).
STAGNATING TRADE REFLECTS DIMINISHED COMPETITIVENESS 23
Following sustained growth since the turn of the century, Kenyan exports of T&C goods levelled off from 2006 to 2008 in the face of increasing competition from Asia, only to fall by 25 % in 2009 in the aftermath of the 2008 finan-cial crisis. Exports began to rebound in 2010 in line with the global economy, reaching US $ 384 million in 2013. The best-performing segment over the past decade was woven bottoms and knitted apparel. Its share in the country’s sec-toral exports rose from 30 % in 2009 to 48 % in 2013, and its CAGR over the past five years was 8 %. Despite the quick rebound from the lows of 2009, it should be noted that an-nual growth of Kenyan T&C exports since 2006 has been a meagre 2.7 %. This is well below the 5 % global growth in T&C exports during the same period.
Data suggests that growth over the past 10 years has been driven by the continued penetration of existing prod-ucts to old markets (116 % of growth). This is in stark con-trast to regional competition. In Ethiopia, for example, 53 % of growth was due to market expansion, in which Ethiopia introduced existing products to new markets.24
23.– Note on data sources : There is a divergence between trade statistics reported by Kenya ( direct data ) and the statistics reported by trade partners ( mirror data ) from 2001 through 2004. Mirror data shows that the biggest gains in clothing exports occurred between 2001 and 2004, whereas direct data show that such gains were realized between 2004 and 2005. Despite these temporal differences, the overall trends within the sector are evidenced in both sets of data. Where possible, the analysis in this Roadmap uses direct data as reported by Kenya. Kenya has not yet reported its trade statistics for the full period under review and trade figures for 2012 and 2013 are based on mirror statistics.24.– As illustrated in Appendice section B, such expansion has been non-existent in the case of Kenya.
Clothing
Clothing exports ( including Harmonized System ( HS ) cat-egories 61, 62, and 63 ) reached a record high of US $ 318 million in 2013 following annual growth of 10.9 % between 2009 and 2013. The subsector has become an increasingly important source of foreign currency and a number of key segments, notably woven apparel and knitted apparel, are escalating their share in world exports. The share of Kenyan garment exports as a proportion of total world garment ex-ports rose to 0.07 % in 2013, after remaining flat at 0.06 % from 2006 to 2012.
Clothing exports as a share of Kenya’s total exports have been increasing as well, growing from 4.7 % in 2009 to reach 5.7 % in 2013. However, it should be noted that the trade balance over the past two years is negative ; the most imported product is ‘worn clothing and other worn articles – HS 630900’, which in 2013 accounted for 50 % of total gar-ment imports. Indeed, imports of used clothing have been a persistent challenge that the Government has battled for many years. The data make clear that both international and domestic demand is adequate. Kenya’s challenges lie on the supply side. Addressing the trade deficit through devel-oping local segments and capacities of the value chain will help the sector reach the necessary scale and capacities to meet international requirements.
While Kenya exports clothing ( valued at over US $ 100,000 ) to 22 countries, 81 % of exports are destined for the United States. Whereas exports to the United States accounted for only 11 % of the sector’s exports in 2004, they surged in 2005 ( the United States market received 70 % of total garment ex-ports between 2005 and 2008 ). This uptick was largely the result of preferential access granted under AGOA, and in
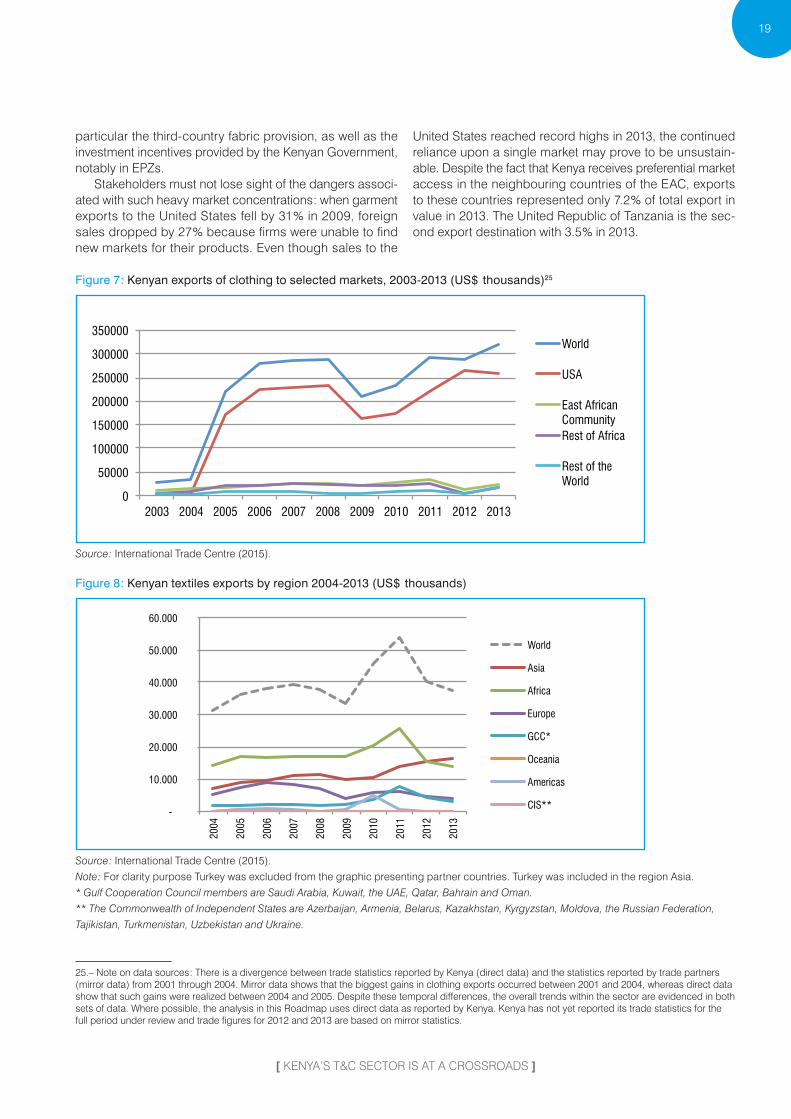
[ KENYA’S T&C SECTOR IS AT A CROSSROADS ]
19
particular the third-country fabric provision, as well as the investment incentives provided by the Kenyan Government, notably in EPZs.
Stakeholders must not lose sight of the dangers associ-ated with such heavy market concentrations : when garment exports to the United States fell by 31 % in 2009, foreign sales dropped by 27 % because firms were unable to find new markets for their products. Even though sales to the
United States reached record highs in 2013, the continued reliance upon a single market may prove to be unsustain-able. Despite the fact that Kenya receives preferential market access in the neighbouring countries of the EAC, exports to these countries represented only 7.2 % of total export in value in 2013. The United Republic of Tanzania is the sec-ond export destination with 3.5 % in 2013.
Figure 7 : Kenyan exports of clothing to selected markets, 2003-2013 ( US $ thousands )25
0
50000
100000
150000
200000
250000
300000
350000
2003 2004 2005 2006 2007 2008 2009 2010 2011 2012 2013
World
USA
East African Community Rest of Africa
Rest of the World
Source : International Trade Centre ( 2015 ).
Figure 8 : Kenyan textiles exports by region 2004-2013 ( US $ thousands )
-
10.000
20.000
30.000
40.000
50.000
60.000
2004
2005
2006
2007
2008
2009
2010
2011
2012
2013
World
Asia
Africa
Europe
GCC*
Oceania
Americas
CIS**
Source : International Trade Centre ( 2015 ).
Note : For clarity purpose Turkey was excluded from the graphic presenting partner countries. Turkey was included in the region Asia.
* Gulf Cooperation Council members are Saudi Arabia, Kuwait, the UAE, Qatar, Bahrain and Oman.
** The Commonwealth of Independent States are Azerbaijan, Armenia, Belarus, Kazakhstan, Kyrgyzstan, Moldova, the Russian Federation,
Tajikistan, Turkmenistan, Uzbekistan and Ukraine.
25.– Note on data sources : There is a divergence between trade statistics reported by Kenya ( direct data ) and the statistics reported by trade partners ( mirror data ) from 2001 through 2004. Mirror data shows that the biggest gains in clothing exports occurred between 2001 and 2004, whereas direct data show that such gains were realized between 2004 and 2005. Despite these temporal differences, the overall trends within the sector are evidenced in both sets of data. Where possible, the analysis in this Roadmap uses direct data as reported by Kenya. Kenya has not yet reported its trade statistics for the full period under review and trade figures for 2012 and 2013 are based on mirror statistics.

Photo: MIMCO x EFI 2nd collection © Louis Nderi & ITC Ethical Fashion Initiative (35).jpg
[ KENYA TEXTILE AND CLOTHING VALUE CHAIN ROADMAP ]
20
Textiles
The needs in textile supplies for the ex-panding apparel sector have been met by growing imports. The textile sector’s trade deficit has been worsening since 2009, doubling to a record high of US $ 181 million in 2014. The deficit is most notable vis-à-vis China ( the average deficit for the period from 2011 to 2013 was US $ 254 million ) and India ( US $ 57 million ), Kenya’s two most impor-tant trade partners in the textile space. The sector reached its peak export value of US $ 54 million in 2011 following two years of significant gains ( 37 % in 2010 and 18 % in 2011 ). Even so, exports declined by an average of -17 % be-tween 2011 and 2013. One of the chief reasons behind these mixed results is the limited ex-port survival rate and the inability of firms to maintain market share.
A worrisome trend over recent years has been the increased concen-tration of exports. Between 2009 and 2011 there were 40 markets to which Kenyan firms exported at least US $ 100,000 of textile products. By 2013, it had dropped to just 28 markets. The past five years saw a significant shift in concentration towards China and India, which accounted for 21 % and 13 % of Kenyan textile exports respectively in 2012-2013. The shift towards China and India has been stimulated by the rise of FDI originating from these countries. Several Chinese and Indian firms have relocated their plants or invested in Kenyan textiles as they look to reduce production costs by benefit-ing from the preferential tariffs granted to least developed countries. While concentrations have shifted towards Asia, exports to Gulf Cooperation Council members and Africa have been volatile, falling dramatically from their peaks over the past few years.
Though there has been a reshuffling of dominant prod-ucts, the sector continues to be characterized by signifi-cant product concentration and signs of diversification are slim. Between 2009 and 2013 three product groups ac-counted, respectively, for 78.2 % ( in 2009 ) and 64 % ( in 2013 ) of the country’s textiles exports. The best-performing product group between 2009 and 2013 has been ‘Coconut fibres, abacá, Manila hemp and other vegetable textile fi-bre ( HS 530500 ), accounting for 43.9 % of sectoral exports.
Its exports grew by a CAGR of 412 % between 2009 and 2013, reaching US $ 22.1 million. This highlights the fact that the sector finds it difficult to export fabrics (Appendice section B).
Trade data sheds light on a number of worrisome trends. The gap between the textile and clothing segments of the value chain continues to widen as the garment segment pushes forward with imported materials. Textile exports have fallen significantly and the segment’s limited competitive-ness raises concerns for its continued survival. The over-whelming concentration of clothing exports to the United States is also cause for concern, as the reliance on a single market is likely to prove unsustainable over the long run. The limited level of market diversification, indicating that en-terprises have been unable to capitalize on the preferential market access provided to Kenya by many of the world’s major markets, is evidence that the sector requires increas-es in productivity, quality and service provision in order to be truly competitive.

Photo: MIMCO x EFI 2nd collection © Louis Nderi & ITC Ethical Fashion Initiative (35).jpg
[ KENYA’S T&C SECTOR IS AT A CROSSROADS ]
21
STRATEGIC ISSUES AND COMPETITIVE CONSTRAINTS
The sectoral analysis sheds light on a number of issues that seem to be inhibiting greater competitiveness and stronger growth. Skills are often unaligned to the demands of the industry, value addition and integration are lacking, and institutional support is limited. With regards to policy, the Government has made positive strides. Even so, a number of issues, particularly related to electricity provision, contin-ue to constrain the business environment. It is necessary to analyse these competitive issues in more depth, using evi-dence from the field. A greater analysis of these challenges will allow stakeholders to develop an effective roadmap that can adequately tackle the key constraints.
Traditionally, the scope of export strategies has been de-fined in terms of market entry, such as market access, trade promotion and export development. This ignores several important factors in a country’s competitiveness. For a roadmap to be effective it must address a wider set of constraints, including any factor that limits the ability of firms to supply export goods and services, the quality of the business environment, and the development impact of the country’s trade, which is important to its sustainability. This integrated approach is illustrated by the four gears frame-work schematic above.
To increase the specificity of constraint analysis for the T&C sector, a detailed constraint overview is provided for each subsector of the industry, namely : textiles and clothing. In cases where constraints are shared, they will be detailed under the subheading ‘across the value chain’.
Supply-side issues affect production capacity and include challenges in areas such as availability of appropriate skills and competencies, diversification capacity, technology and low value addition in the sector’s products.
Business environment constraints are those that influence transaction costs, such as regulatory environment, admin-istrative procedures and documentation, infrastructure bot-tlenecks, certification costs, Internet access and cost of support services.
Market entry constraints are essentially external to the coun-try ( but may also be manifested internally ), such as market access, market development, market diversification and export promotion.
Social and economic concerns include poverty reduction, gender equity, youth development, environmental sustain-ability and regional integration.
Border IssuesBorder-In Issues
Border-Out IssuesDevelopment Issues
CapacityDevelopment
Cost ofDoing Business
Developinig skills
and Entrepreneurship
Capac
ity
Diversi
ficati
on
Infrastructure and
Regulatory Reform
Trad
eFa
cilita
tion
Market Accessand Policy Reform
National Promotion
and Branding Trad
e Su
ppor
t
Serv
ices
Poverty Alleviationand Gender Issues
Regional Development
and Integration
Envir
onm
enta
l
Sust
aina
bilit
y and
Clim
ate
Chan
ge
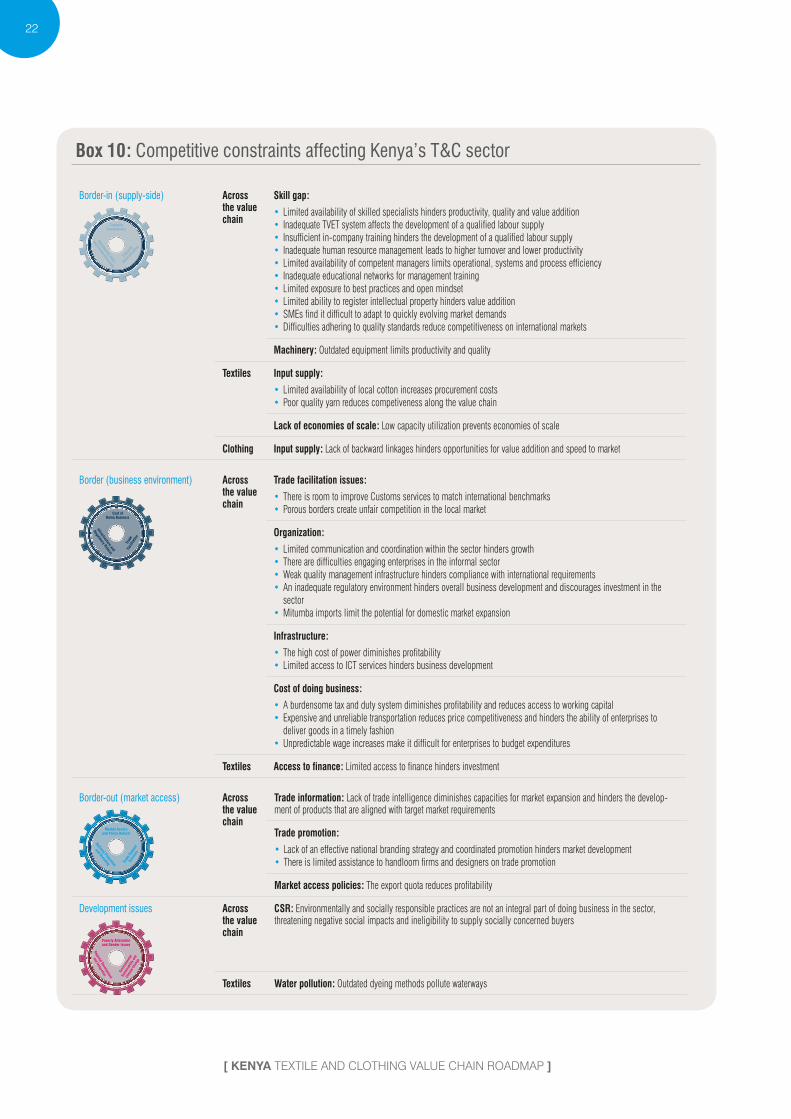
[ KENYA TEXTILE AND CLOTHING VALUE CHAIN ROADMAP ]
22
Box 10 : Competitive constraints affecting Kenya’s T&C sector
Border-in ( supply-side )
CapacityDevelopment
Developinig skills
and Entrepreneurship
Capac
ity
Diversi
ficati
on
Across the value chain
Skill gap :
• Limited availability of skilled specialists hinders productivity, quality and value addition• Inadequate TVET system affects the development of a qualified labour supply• Insufficient in-company training hinders the development of a qualified labour supply• Inadequate human resource management leads to higher turnover and lower productivity• Limited availability of competent managers limits operational, systems and process efficiency• Inadequate educational networks for management training• Limited exposure to best practices and open mindset• Limited ability to register intellectual property hinders value addition• SMEs find it difficult to adapt to quickly evolving market demands• Difficulties adhering to quality standards reduce competitiveness on international markets
Machinery : Outdated equipment limits productivity and quality
Textiles Input supply :
• Limited availability of local cotton increases procurement costs• Poor quality yarn reduces competiveness along the value chain
Lack of economies of scale : Low capacity utilization prevents economies of scale
Clothing Input supply : Lack of backward linkages hinders opportunities for value addition and speed to market
Border ( business environment )
Cost ofDoing Business
Infrastructure and
Regulatory Reform
Trad
eFa
cilita
tion
Across the value chain
Trade facilitation issues :
• There is room to improve Customs services to match international benchmarks• Porous borders create unfair competition in the local market
Organization :
• Limited communication and coordination within the sector hinders growth• There are difficulties engaging enterprises in the informal sector• Weak quality management infrastructure hinders compliance with international requirements• An inadequate regulatory environment hinders overall business development and discourages investment in the
sector• Mitumba imports limit the potential for domestic market expansion
Infrastructure :
• The high cost of power diminishes profitability• Limited access to ICT services hinders business development
Cost of doing business :
• A burdensome tax and duty system diminishes profitability and reduces access to working capital• Expensive and unreliable transportation reduces price competitiveness and hinders the ability of enterprises to
deliver goods in a timely fashion• Unpredictable wage increases make it difficult for enterprises to budget expenditures
Textiles Access to finance : Limited access to finance hinders investment
Border-out ( market access )
Market Accessand Policy Reform
National Promotion
and Branding Trad
e Su
ppor
t
Serv
ices
Across the value chain
Trade information : Lack of trade intelligence diminishes capacities for market expansion and hinders the develop-ment of products that are aligned with target market requirements
Trade promotion :
• Lack of an effective national branding strategy and coordinated promotion hinders market development• There is limited assistance to handloom firms and designers on trade promotion
Market access policies : The export quota reduces profitability
Development issues
Poverty Alleviationand Gender Issues
Regional Development
and Integration
Envir
onm
enta
l
Sust
aina
bilit
y and
Clim
ate
Chan
ge
Across the value chain
CSR : Environmentally and socially responsible practices are not an integral part of doing business in the sector, threatening negative social impacts and ineligibility to supply socially concerned buyers
Textiles Water pollution : Outdated dyeing methods pollute waterways

[ KENYA’S T&C SECTOR IS AT A CROSSROADS ]
23
SUPPLY SIDE ISSUES
Box 11 : Supply-side constraints in Kenya’s T&C sector
Border-in ( supply-side )
CapacityDevelopment
Developinig skills
and Entrepreneurship
Capac
ity
Diversi
ficati
on
Across the value chain
Skill gap :
• Limited availability of skilled specialists hinders productivity, quality and value addition• Inadequate TVET system affects the development of a qualified labour supply• Insufficient in-company training hinders the development of a qualified labour supply• Inadequate human resource management leads to higher turnover and lower productivity• Limited availability of competent managers limits operational, systems and process efficiency• Inadequate educational networks for management training• Limited exposure to best practices and open mindset• Limited ability to register intellectual property hinders value addition• SMEs find it difficult to adapt to quickly evolving market demands• Difficulties adhering to quality standards reduce competitiveness on international marketsMachinery : Outdated equipment limits productivity and quality
Textiles Input supply :
• Limited availability of local cotton increases procurement costs• Poor quality yarn reduces competiveness along the value chainLack of economies of scale : Low capacity utilization prevents economies of scale
Clothing Input supply : Lack of backward linkages hinders opportunities for value addition and speed to market
Across the value chain
Skill gap
Limited availability of skilled specialists hinders productivity, quality and value addition
Kenya’s T&C sector lacks an adequate supply of sufficiently trained workers, leading directly to lower productivity and quality. One of the key deficits is the lack of workers spe-cialized in operating and maintaining machinery. Although some companies within the sector have modernized their plants and invested in new machinery, workers are not able to adequately operate and maintain the new equipment. As a result, productivity suffers and the new, expensive ma-chinery is not being used to its full capacity. Employees are also unable to operate multiple types of machinery. Other deficits include a lack of floor supervisors and administra-tive workers.
The lack of adequate skill sets is particularly concerning given that wages for Kenyan workers are relatively high com-pared with neighbouring countries. The average wage for a sewing operator in Kenya ( US $ 165 per month, although three structures exist – urban, municipal and rural ) is 3.7 times higher than it is in Ethiopia ( US $ 48 per month ). While in general higher wages would be disbursed to compen-sate for higher productivity, this is not the case in Kenya ( although Kenya’s production is higher by 45 % - 50 % com-pared with Ethiopia, this doesn’t justify the wage difference ). Unless skill sets can be improved, enterprises are at risk of spending more money to hire less qualified workers vis-à-vis their competition. This results in lower productivity and reduced competitiveness.
Inadequate TVET system affects the development of a quali-fied labour supply
Kenya’s TVET system is constrained by a lack of quality staff, inadequate access to training equipment and materi-als, the misalignment of curricula with industry needs, and inadequate funding for both programmes and students.26 It should also be noted that few TNCs and foreign investors collaborate with local training institutions to enhance skills at SMEs.
‘As I hire new workers for my textile firm, I know that they have some basic knowledge regarding machin-ery usage as they most likely were trained at Rivatex. However, I already know that I will need to retrain them, because Rivatex does not provide an overview of the latest machinery.’
Industry opinion
The sector relies on a number of technical training institu-tions under the Government’s technical training programme, as well as a number of middle-level colleges. However, the programmes offered do not provide a sufficient level of tech-nical specialization. Most graduates have to be retrained by the factories in order to achieve the necessary level of
26.– Global Development Solutions ( 2014 ). Value Chain Analysis of Priority Industrial Sub-Sectors in Kenya, Part I : Textiles and Garments, p. 23.

[ KENYA TEXTILE AND CLOTHING VALUE CHAIN ROADMAP ]
24
productivity, adding to the cost of production. Even where courses may have been adequate, the fast pace of change within the industry means that once trainees graduate, their skills may soon be obsolete. This highlights the need for better post-graduation follow-up. Short, targeted courses and continuing education classes might help alleviate this problem.
First and foremost, training staff must be better prepared and given greater exposure to international best practices and industry needs. Universities and TVET institutions are not synchronized with the needs of the industry. The private sector is not involved in the definition of curricula (which are outdated) and there are no mechanisms to monitor the alignment of curricula to industry needs. Most universities and TVET institutions place a particular emphasis on fashion and design within their curricula due to the popularity of the subject among students. The industry, however, requires skills associated with production technology and processes, equipment maintenance and multi-skilling. This is particu-larly so considering that buyers, not Kenyan garment pro-ducers, are responsible for providing the designs.
The situation is such that many companies do not acknowledge universities as a relevant source of skills. Research efforts, like curricula, are also misaligned with the industry. A lack of interaction between students and industry, through internships for example, also contributes to the lack of preparedness among graduates ; there are some intern-ships but they remain largely academic. Other problems include the lack of a handloom weaving school in Kenya.
It should also be noted that training institutions lack access to adequate machinery on which to train their stu-dents.27 Asian institutions, by comparison, replace training equipment at most every four years. Adequate upgrading is constrained largely by a lack of financing.
In the PoA, activities 1.5.3, 1.5.5 and 1.5.6 respond to this issue.
Insufficient in-company training hinders the development of a qualified labour supply
In the absence of an adequate TVET system, it is essential that enterprises are able to adequately train their own em-ployees. Nevertheless, only a few mills ( the largest ) have an internal training school / human resource development facilities, due mainly to the high cost of providing such tech-nical training. Moreover, enterprises lack appropriate facili-ties to train workers. Most companies are simply trying to survive and training is not a priority in terms of investment. Increasing awareness of the costs and benefits of providing adequate training could go a long way towards improving skill sets within the sector.
In the PoA, activities 1.2.1 to 1.2.3 respond to this issue.
27.– Ibid. : p. 21.
Inadequate human resource management leads to higher turnover and lower productivity
‘People are being trained at our factories when they start to work, but there is a high turnover rate because of seasonal contracts and other reasons. Nobody can guarantee that the employee will stay after training and contribute to the productivity of the enterprise’.
Industry opinion
Poor management of human resources also contributes to the lack of adequately skilled workers. First and foremost, the use of seasonal contracts leads to high levels of labour turnover. This constant brain drain makes it difficult for firms to capitalize on acquired skill sets after providing the neces-sary in-house training. Productivity is also constrained by weak incentives systems that do little to stimulate and re-ward performance. Lastly, some companies hire foreigners to work as machinery specialists in the absence of quali-fied locals. However, the expense of this is extravagant. Processing an expat work permit costs roughly US $ 2,200 in Kenya ( while it is only US $ 68 in Ethiopia ). A longer-term approach that incorporates better in-house training for lo-cals would likely prove to be more cost-effective.
In the PoA, activity 1.2.6 responds to this issue.
Limited availability of competent managers limits opera-tional, systems and process efficiency
‘The best way to bridge the management knowledge gap in my company is to use international exper-tise. I cannot wait for the educational system to be improved to hire the required line managers. But I struggle to get the appropriate work permits for em-ployees from abroad. The system should be facili-tated and streamlined.’
Industry opinion
Middle and high-level management lack appropriate mana-gerial skills with regards to various areas of sourcing and production, including supply chain management, planning, cost optimization and floor management. As a result, man-agers are unable to organize their production processes in the most cost-efficient and productive manner, hindering overall productivity and profitability.

[ KENYA’S T&C SECTOR IS AT A CROSSROADS ]
25
Another area of concern is human resource management ; managers may not appreciate the qualifications that are re-quired for different positions. Indeed, they frequently hire people with the wrong set of qualifications to operate ma-chinery or manage various aspects of the business. In ad-dition, they do little to provide adequate incentives to their workers : replacing flat wages with piecemeal rates to reward fast adaptability, for example, would help workers to become more efficient and productive.
The decision not to expand in-company training often leaves companies needing to import skilled labour at quite a high cost. The reliance on foreign workers results in both higher wages and high-cost visas. A better human resource and skills development policy overall would go a long way, not only to improving access to adequately skilled labour but also to reducing employment costs in the long term.
‘Our manager at the factory is a very kind person but he lacks some managerial competencies and has little experience with new technology. When new equipment was installed, he didn’t know how to use it. So when we have a technical problem, he cannot advise us on it.’
Industry opinion
Furthermore, there is a lack of familiarity with the newest technology. As managers are generally unaware of the lat-est machinery due to a lack of exposure, they are slow to make technical upgrades that would improve productivity and quality in line with international best practices. In a simi-lar vein, management generally lacks competencies with regards to information technology. This hinders the develop-ment of more integrated systems that would allow Kenyan SMEs to provide integrated services, as required by modern lean retailer and fast fashion TNCs.
As a result of inadequate skills among local managers, manufacturers have come to rely on high-cost foreign work-ers to fill their managerial positions. Not only are salaries well above what would be demanded by local managers, the necessary work permits are also very expensive.
Inadequate educational networks for management training
One of the key factors behind the lack of adequate manage-ment capacities is the limited sector-specific management training provided by universities and other educational in-stitutions. Even where such training does exist, disconnects between academic curricula and the needs of the industry result in suboptimal skill development. Greater collaboration between academia and industry, as well as the development
of short, targeted training courses, could go a long way to improving management skill sets.
In the PoA, activities 1.5.3, 1.5.7 and 1.5.8 respond to this issue.
Limited exposure to best management practices and latest modern production processes and technologies
The lack of adequate exposure to international markets re-sults in limited awareness of best management practices and trends in modern technology. Participation in foreign events, including trade fairs ( both T&C and machinery ), sourcing missions and visits to successful companies abroad, would help managers stay abreast of the lat-est developments and gain a better understanding of the factors that result in a successfully managed company. Furthermore, companies that hire foreign managers could make efforts to ensure knowledge transfer between the manager and his or her subordinates. In some cases, a strong resistance to change among managers reinforces the status quo in production and technology levels.
In the PoA, activities 1.2.4 to 1.2.6, 1.2.8, 1.3.2 to 1.3.4, 1.4.5 to 1.4.7, 1.5.2, 3.3.2 to 3.3.5 and 4.3.2 respond to this issue.
Limited ability to register intellectual property hinders value addition
‘I am a designer from Kenya. I have some original designs that my workshop produces. But I have seen a number of times copies of my products in the mitu-mba markets. This is very harmful for my small busi-ness since I do not have an intention to export in the short term and my main focus is to sell locally. I would like to learn more about intellectual property and how to protect my original designs.’
Industry opinion
Although many exporters have been shifting towards lower value added CMT activities, the ability of the sector to add value through design may lie at the core of its long-term suc-cess. Students take great interest in design and there are already a number of very capable designers adding value within the sector. Fashion designers must be able to register the intellectual property of their designs in order to protect themselves. Even so, most designers do not know how to do so, nor are they aware of the costs involved. Efforts will be required to promote awareness of the intellectual prop-erty registration process.
In the PoA, activity 1.4.8 responds to this issue.

[ KENYA TEXTILE AND CLOTHING VALUE CHAIN ROADMAP ]
26
SMEs find it difficult to adapt to quickly evolving market demands
The global T&C sector is characterized by fast-paced changes with regards to market demand, buyers’ needs, design and quality requirements. Enterprises that wish to partake in the global value chain successfully must be able to understand and respond to these changes in a timely manner but Kenyan SMEs find such adaptations difficult. One of the key constraints is weak linkages with the value chain, which make it difficult for the sector’s stakeholders to work together in order to respond to evolving market de-mands. The prevalence of outdated machinery also makes it difficult for companies to adjust production according to the latest trends, while expansion is hindered by difficult access to industrial land and limited access to finance.
Of particular concern is the lack of strategies for SMEs to reduce costs so as to meet foreign market demands. The disconnect between SME capacities (and knowledge) and market demands contributes greatly to the inability of com-panies to adequately adapt to the market.
In the PoA, activities 1.1.1, 4.3.2 and 4.3.3 respond to this issue.
Difficulties adhering to quality standards reduce competi-tiveness in international markets
Firms find it difficult to meet the certification requirements of international buyers. This is due to both a lack of knowledge and a lack of capacities. In general, firms are unfamiliar with international quality standards and are unaware of the ben-efits of compliance for exports. There is poor understanding among businesses of the importance of establishing control systems within their production structures. This is particu-larly problematic in the spinning and weaving subsegments of the chain.
Due to the experience gained in exporting under AGOA, medium-sized and large firms have developed a better un-derstanding of standardization issues. However, a very large number of MSMEs evolve in the informal sector. As such, they have not been sensitized to quality management sys-tems as they mostly trade at the national and regional level, generally selling through informal channels. The lack of un-derstanding about international standards and certification prevents them from reaching larger players in the industry and creates a disconnect between them and faster-growing, FDI-backed garment companies operating out of EPZs.
In the PoA, activities 1.3.1 to 1.3.5 respond to this issue.
Machinery
Outdated equipment limits productivity and quality
The T&C sector, and in particular the textile segment, relies on complex machinery that can provide a significant cost advantage. Such equipment should be retooled every 10
to 15 years given the rapid pace of technological advance-ments. Nevertheless, many companies do not regularly retool their facilities. In addition, the purchasing practices of companies within the sector are driven mainly by price, as opposed to long-term strategic considerations. As such, companies often buy models one or two generations old because of the large discounts. This results in equipment that is less productive than that of international competitors.
Moreover, the older equipment may not be able to pro-duce the product varieties or quality demanded by modern markets. Upgrading is hindered by the difficult procure-ment procedures for importing equipment, the high cost of modern equipment and credit. With rates reaching 18%, it can be difficult for enterprises to purchase new machinery. Replacing spare parts of old equipment is also expensive and sometimes unfeasible. It should also be noted that the purchase of new equipment is not accompanied by the ap-propriate training of staff. Thus the new equipment often operates under capacity.
In the PoA, activities 3.4.1 to 3.4.3 respond to this issue.
Textiles
Input supply
Limited availability of local cotton increases procurement costs
Cotton production in Kenya has been declining and is con-strained by a number of factors. Yields have been suffering because of a lack of extension services, which hinders the uptake of best practices and new technologies. In addition, irrigation facilities are inadequate. High input costs that discourage best practices, the limited availability of quality seeds and the presence of substandard agrichemicals have also contributed to lower output. Lower yields, in turn, have encouraged farmers to switch to more profitable food crops. The sector also lacks an updated quality assurance protocol and adequate testing equipment. As a result, cotton that is produced is often of questionable quality. Lastly, the internal market is disorganized and lacks an efficient mechanism for price definition. As a result of declining output, Kenya’s textile sector has come to rely on Uganda and the United Republic of Tanzania for almost all of its cotton fibre require-ments. The reliance on imports leads directly to higher costs and lower competitiveness.
In the PoA, activities 1.2.3 and 1.2.5 respond to this issue.
Poor quality yarn reduces competiveness along the value chain
The spinning segment of Kenya’s T&C value chain gene-rally produces low-quality yarn. The reasons for this are numerous and include inadequate machinery, weak skills and know-how, poor materials and limited awareness of quality requirements and international quality standards. In

[ KENYA’S T&C SECTOR IS AT A CROSSROADS ]
27
addition, some spinning companies do not have the labora-tory instruments needed to measure their yarn quality.
The prevalence of lower quality yarn makes it difficult for fabric producers to produce higher value-added products with local inputs. Downstream manufacturers are required to either produce lower quality goods with less value addition or import better materials at a higher cost, thereby reduc-ing profitability and / or price competitiveness. Reliance on imported materials can also reduce the flexibility with which producers can respond, significantly hindering their ability to engage with modern value chains where the ability to fill orders with a quick turnaround is a key component for success.
In the PoA, activities 1.2.3, 1.2.5 and 3.3.1 respond to this issue.
Lack of economies of scale
Low capacity utilization prevents economies of scale
Kenya’s textile sector is characterized by a level of ca-pacity utilization that hovers between 40% and 50%. Underutilization of capacity perpetuates production of goods at non-competitive prices. The inability of textile pro-ducers to lower their prices is particularly worrisome given
that the segment produces goods for the low end of the market. It also makes it difficult for enterprises to realize the benefits of machinery upgrades and it may even threaten the financial viability of loans taken out to acquire such equipment. Higher rates of utilization, therefore, could go a long way towards ensuring that producers can afford capital upgrades.
While problems such as the lack of qualified specialists, outdated equipment and poor management practices all play a part in keeping capacity utilization low, the lack of suf-ficient orders also plays a role. Kenya’s electricity costs and wages are high and its lead times are long. These issues reduce competitiveness and prevent Kenya from attracting a greater amount of orders. In addition, power outages are common, leading to frequent interruptions. It should be not-ed that companies located within EPZs have fewer problems with electricity provision because EPZs are equipped with their own generators.
In the PoA, activities 1.2.1 to 1.2.5, 1.4.6, 3.4.1, 4.3.2 and 4.3.3 respond to this issue.
Clothing
Input supply
Lack of backward linkages hinders opportunities for value addition and speed to market
‘Almost all large competing countries have local yarn and fabric production, sometimes integrated in apparel firms. They are able to minimize their costs that way, since they are not required to import as we do. We are hoping that the upcoming reforms will attract investment in this segment so that we are able to source domestically.’
Industry opinion
There are few backward linkages in the T&C sector and it is estimated that Kenya’s garment segment imports 93 % of its fabric and yarn requirements. This is one of the reasons why the textile segment has not shared in the overall success of the sector over the last few years.
As the cost of production for local materials is very high, it is often cheaper to import inputs.The quality of yarn is generally not adequate for companies looking to produce clothing for export. Even so, importing materials comes with its own set of disadvantages: taking delivery of inputs from Asia is time-consuming and the reliance on imports puts Kenyan garments at a price disadvantage compared with most Asian competitors.
Photo: Make it Kenya, 2015

[ KENYA TEXTILE AND CLOTHING VALUE CHAIN ROADMAP ]
28
Increasing integration throughout the value chain was one of the priorities of Kenya’s T&C sector, as it is for many of its competitors in the region. Nevertheless, these efforts have met with little success. In fact, many producers are moving back towards a CMT model with very little value addition. Efforts must be made not only to improve the qual-ity and price competitiveness of domestic textiles, but also
to ensure that the textile segment is producing goods in accordance with the demands of the clothing segment. To this end, greater collaboration, networking and knowledge-sharing between textile companies and clothing companies could go a long way towards setting the sector back on a path towards integration and value addition.
In the PoA, activities 1.2.3 and 1.2.5 respond to this issue.
BUSINESS ENVIRONMENT ISSUES
Box 12: Business environment constraints in Kenya’s T&C sector
Border ( business environment )
Cost ofDoing Business
Infrastructure and
Regulatory Reform
Trad
eFa
cilita
tion
Across the value chain
Trade facilitation issues :
• There is room to improve Customs services to match international benchmarks• Porous borders create unfair competition in the local marketOrganization :
• Limited communication and coordination within the sector hinders growth• There are difficulties engaging enterprises in the informal sector• Weak quality management infrastructure hinders compliance with international requirements• An inadequate regulatory environment hinders overall business development and discourages investment in the sector• Mitumba imports limit the potential for domestic market expansionInfrastructure :
• The high cost of power diminishes profitability• Limited access to ICT services hinders business developmentCost of doing business :
• A burdensome tax and duty system diminishes profitability and reduces access to working capital• Expensive and unreliable transportation reduces price competitiveness and hinders the ability of enterprises to deliver
goods in a timely fashion• Unpredictable wage increases make it difficult for enterprises to budget expenditures
Textiles Access to finance : Limited access to finance hinders investment
Across the value chain
Trade facilitation issues
There is room to improve Customs services to match inter-national benchmarks
Although much progress has been achieved over recent years, the Customs system continues to operate at subop-timal efficiency.
While administrative reforms are being implement-ed, including the creation of the National Single Window Community-Based Project, trading across borders is still a time-consuming process (see Appendice section C). Of particular concern to the T&C sector is the fact that Less Container Load containers (which are shared by several owners) take much more time to clear through Customs. As a result, these containers can take up to 10 days to clear, as opposed to three days for normal containers. While Customs must clear each owner, this does not fully explain the differ-ence in clearance times. This is a particular problem for the
T&C sector because companies are often too small to justify using their own containers.
A key problem is also the limited capacities of Customs agents; although efforts have been made lately to improve the situation, they are still not sufficiently trained on textile products and classifications, leading to frequent delays at the point of verification. In addition, there is limited inter-action between firms and Customs for handling common complaints. There is also no streamlined process (fast track for reputable exporters with long track records).
The introduction of improved information technology systems would greatly enhance Customs efficiency, as bar-codes could contain all information about a product and significantly cut down on verification and clearing times. While the Tradex system is currently used to process import and export documentation online, the capacities of the sys-tem are limited in scope and it frequently breaks down. It is noteworthy that Kenya is taking an active role in integrating the upcoming Trade Facilitation Agreement, as it has sub-mitted a Category A notification, which states that provisions of the Agreement will be implemented by the time it enters into force.

[ KENYA’S T&C SECTOR IS AT A CROSSROADS ]
29
Moreover, Kenyan Customs works with four-digit Harmonized System (HS) codes. The industry would be better-served if six-digit HS codes were used instead, as it would ensure a more appropriate classification for import-ed products that compete with local goods in the domestic market.
In the PoA, activities 2.2.1, 2.2.2, 2.3.1 and 2.3.2 respond to this issue.
Porous borders create unfair competition in the local market
Kenyan clothing producers must compete with both coun-terfeit products and smuggled goods. Black markets, particularly in Eldoret, are a huge problem due to the im-portation of counterfeit goods. After being produced in China and Turkey, counterfeits are outfitted with Kenyan labels and sold at discounts of 20 % – 30 % of the price of the real product. In addition, second-hand clothing is often imported disguised as new clothing. It is another source of unfair competition for local producers because it reaches the market without being subject to the regular duties ap-plied to second-hand clothing ( Most Favoured Nation tar-iff is 35 % or US $ 200 / ton, whichever is greater ). Similarly, undervalued goods are imported into the country without paying the appropriate duties, as Customs agents do not set floor prices for containers.
Improvements will require enhancing the capacities of Customs officials to recognize counterfeit clothing and dis-tinguish between new and used clothing. They must also be trained to identify a floor price for containers so that mini-mum duties can be applied. Lastly, efforts must be made to minimize corruption with the border agencies so as to minimize smuggling activity.
In the PoA, activities 2.2.1, 2.2.2 and 2.3.1 respond to this issue.
Organization
Limited coordination and communication within the sector hinders growth
The sector is characterized by a lack of communication and coordination throughout the entire value chain. While today all subsegments of the industry are working mainly in isolation, value-chain-wide cooperation could play a role in helping stakeholders be better organized. Such a sys-tem would ensure adequate linkages throughout the value chain, though it would require an association of associations that could coordinate the cooperation. A common fund that could engage in simplified bulk input purchases would also be a welcome development.
Another issue is dispute resolution: while the indus-try is self-regulated, there are currently no dispute reso-lution mechanisms. Stakeholders have no other option than to take their disputes to the courts of law, which are much more time-consuming and expensive. The
delays caused by relying on the courts are especially troublesome during periods of high price fluctuation.
The lack of better coordination has a number of effects on the sector. First and foremost, the disconnect between different segments of the value chain leads to the failure of textile companies to produce inputs in accordance with gar-ment producers’ demands. As a result, the clothing segment largely relies on imported materials. In addition, limited coor-dination makes it difficult for stakeholders to purchase inputs in bulk or coordinate production in order to fill larger orders.
In the PoA, activities 1.1.1 to 1.1.4 respond to this issue.
There are difficulties engaging enterprises in the informal sector
An important part of Kenya’s T&C sector is composed of micro enterprises (nearly 75,000) that are comprised of two to three people. As these enterprises tend to operate in the informal economy, they do not benefit from various Government services and capacity-building initiatives. There is no association that represents these enterprises. The Micro and Small Enterprise Authority (MSEA) was re-cently formed to provide trainings but its capacity to reach the large population of T&C micro and small enterprises is limited. Given the role that micro and small enterprises can play in poverty reduction, it is essential that greater efforts are made to extend appropriate opportunities to the micro and small enterprises working in the T&C sector.
In the PoA, activities 3.5.1 to 3.5.3 respond to this issue.
Weak quality management infrastructure hinders compli-ance with international requirements
Kenya’s laboratories lack the necessary capacity to test in-puts ( fabrics, accessories ) to ensure their compliance with the quality requirements of international markets. In addi-tion, more laboratories must be created as the textile sec-tor develops. It should also be noted that there is a lack of consulting services for quality issues.
In the PoA, activities 1.6.1 to 1.6.3 respond to this issue.
An inadequate regulatory environment hinders overall busi-ness development and discourages investment in the sector
Kenya’s regulatory framework is complex and burdensome. Regulations often overlap and business owners find them-selves governed by competing sets of rules. This leads to cases where, for example, multiple and redundant business-related licences are required. This affects both the ease and cost of doing business, thereby reducing profitability for business owners, creating headaches and discourag-ing investment. The complex operating environment is one reason that investment has been predominately targeting low-risk projects such as CMT operations.
Another challenge is the weak enforcement of standards and tax laws. This has led to the dumping of substandard

Photo: Pashminu.
[ KENYA TEXTILE AND CLOTHING VALUE CHAIN ROADMAP ]
30
imports and counterfeit goods into the domestic market, creating unfair competition for local manufacturers. While many countries use the domestic market as a springboard from which industry can build capacities until it is ready to enter foreign markets, Kenyan firms have thus far been de-prived of such opportunities.
In the PoA, activities 2.1.1 to 2.1.10, 2.3.1 and 2.3.2 re-spond to this issue.
Mitumba imports limit the potential for domestic market expansion
The decline of the T&C sector in the 1980s and 1990s was due in part to the influx of mitumba, which undercut domestically produced clothing in retail markets. Today, the import of mitumba is a huge business and it is growing : second-hand clothes are distributed through-out the region, entering the country mainly through Nairobi. In addition, many major industries dump their rejects on the local market and call them second-hand. Kenya has no regulations in place that seek to control im-ports of second-hand clothing and duties on such clothing are very low. More recently, there have even been instances of second-hand fabric imports, a development that could threaten textile producers. As a result, mitumba continues to limit the size of the internal market for SMEs in the garment segment. This not only makes it difficult for firms to achieve financial viability, it also deprives them of a market that they can use as a springboard for export.
It should be noted that despite the threats posed to the T&C sector, the mitumba sector is a major source of income in the country. Some stakeholders argue that the problem is not so much the unfair competition from mitumba but the lack of competition from unproductive domestic producers.28
In the PoA, activity 2.3.1 ( 1 ) responds to this issue.
Infrastructure
The high cost of power diminishes profitability
‘A very big part of input costs is due to energy. If we compare ourselves to our neighbours, they probably have lower prices; but we have to spend much more for electricity.’
Industry opinion
Although power supply in Kenya is relatively reliable, energy costs are quite high : power costs US $ 0.15 / kWh in Kenya,
28.– Portia Crowe ( 2014 ). The global business of second-hand clothes thrives in Kenya. Reuters, 15 October. Available from http : / / www.reuters.com / article / 2014 / 10 / 15 / us-kenya-textiles-idUSKCN0I41DS20141015.
as opposed to US $ 0.07 / kWh in China, US $ 0.04 / kWh in South Africa, and US $ 0.04 / kWh in Ethiopia. These costs significantly reduce the price competitiveness of Kenya’s T&C products, particularly in the capital-intensive spinning and textiles segments of the value chain. It is estimated that energy accounts for 40 % of the total production cost when manufacturing textiles in Kenya.
However, the Government is making efforts to relieve these price pressures through an incentive programme that began in 2014 : firms that increase their production capac-ity by 20 % will see their energy costs drop to US $ 0.09 / kWh through a subsidy.29 Generation capacity is also being up-graded ; the Government hopes that capacity will be ex-panded by 5,000 megawatts by 2016. While an ambitious goal, progress is being made, as illustrated by the recent addition of 500 megawatts in geothermal energy capacity.30
29.– Yarns and Fibres News Bureau ( 2014 ). Kenyan textiles industry set to grab bigger share of global market. Available from http : / / www.yarnsandfibers.com / news / textile-news / kenyan-textiles-industry-set-grab-bigger-share-global-market#.VXe-KPlViko.30.– CNBC Africa ( 2015 ). KENGEN to boost Kenya’s power output. Available from http : / / www.cnbcafrica.com / news / east-africa / 2014 / 10 / 15 / kengen-increase-power / .

Photo: Pashminu.
[ KENYA’S T&C SECTOR IS AT A CROSSROADS ]
31
In addition, authorities hope to spend US $ 2 billion in the coming years to upgrade power distribution systems.
In the PoA, activities 2.5.1 to 2.5.3 will contribute to re-sponding to this issue.
Limited access to ICT services hinders business development
Access to high speed Internet and mobile communications networks is poor in some of the regions where textile mills are located. Effective ICT infrastructure is needed for T&C companies to cater to the demands of modern TNC buy-ers. Suppliers must be able to seamlessly integrate their production chain with a variety of other services, neces-sitating adequate connectivity, and enterprises wishing to engage in fast fashion must be connected so that they can partake in the rapid information exchange and analysis that lies at the root of the new fashion cycle.
In the PoA, activities 2.6.1 and 4.3.2 will contribute to responding to this issue.
Cost of doing business
A burdensome tax and duty system diminishes profitability and reduces access to working capital 31
Heavy taxes are levied on imports, including excise taxes, general sales taxes, and taxes and charges for sensitive product categories. This reduces the profitability and price competitiveness of the majority of exporters, who rely upon imported materials. In addition, exporting firms are required to pay VAT upfront. It can take up to a year for companies to receive these VAT refunds. In the meantime, enterprises suf-fering from cash shortages may be unable to access ade-quate working capital to fund their operations. It should also be noted that the KRA often disputes the value of goods declared by importers. As such, it often demands the pay-ment of higher tariffs. In addition to increasing costs, this also causes significant delays as firms attempt to negotiate with the KRA.
In the PoA, activity 2.2.3 will contribute to responding to this issue.
Expensive and unreliable transportation reduces price com-petitiveness and hinders the ability of enterprises to deliver goods in a timely fashion
Kenya’s logistics are characterized by both long delays and high prices. The tariff for transport along Kenyan roads is KES 4/kg/km, well above the KES 1/kg/km rate that is considered to be competitive throughout the world. One of the factors behind high trucking costs is the frequency with which trucks return empty. In order to alleviate this problem,
31.– International Trade Centre ( 2011 ). Non-Tariff Measures Business Survey in Kenya.
a campaign called GS1 is currently being designed. The project will help to coordinate truck loads so that trucks do not return empty. As they will be able to charge for both the outgoing and return legs of a journey, this project should help to reduce costs by up to 20%. The project will also work to improve traceability of goods throughout the transport network.
In the PoA, activity 2.6.1 responds to this issue.
Unpredictable wage increases make it difficult for enter-prises to budget expenditures
The Government increases the minimum wage during its yearly Labour Day celebrations. While beneficial for work-ers, the value of these increases is unpredictable. In 2015, the minimum wage was increased by 12 %, while in 2014 no increase was announced. In 2013, the minimum wage was increased by 14 %. Not knowing the expected increase, firms are forced to make guesses when estimating their expenses for the year. It is essential that the sector is able to accurately estimate its cost structure throughout the year in order to engage in effective planning and pursue responsible busi-ness development.
In the PoA, activities 2.1.1 to 2.1.10 will contribute to re-sponding to this issue.
Textiles
Limited access to finance hinders investment
‘It is extremely expensive and also very difficult to get credit from a bank to buy new equipment. Banks do not trust us and we do not trust them. It is hard to do business in such conditions.’
Industry opinion
Improvements in productivity are currently being hampered by continued reliance on outdated or poorly maintained machinery. Limited access to finance is one of the key chal-lenges for SMEs wishing to purchase spare parts or up-grade their equipment. Credit is very expensive and lending conditions can be onerous. Interest rates can range from 16 % to 18 %. In addition, banks require collateral that firms often cannot provide. Compounding these problems, com-mercial banks are generally not interested in engaging with the spinning and textile subsectors. Having remembered the losses that were incurred by lending to the sector during the downturn of the 1990s, banks are reluctant to extend credit. When finance is provided, borrowing costs tend to be set even higher.
In the PoA, activities 2.4.1 and 2.4.2 respond to this issue.

[ KENYA TEXTILE AND CLOTHING VALUE CHAIN ROADMAP ]
32
MARKET ENTRY ISSUES
Box 13 : Market entry constraints in Kenya’s T&C sector
Border-out ( market access )
Market Accessand Policy Reform
National Promotion
and Branding Trad
e Su
ppor
t
Serv
ices
Across the value chain
Trade information : Lack of trade intelligence diminishes capacities for market expansion and hinders the development of products that are aligned with target market requirementsTrade promotion :
• Lack of an effective national branding strategy and coordinated promotion hinders market development• There is limited assistance to handloom firms and designers on trade promotionMarket access policies : The export quota reduces profitability
Across the value chain
Trade information
Lack of trade intelligence diminishes capacities for market expansion and hinders the development of products that are aligned with target market requirements
Kenyan firms lack access to reliable and timely sources of trade intelligence on market characteristics and buyer requirements on preferred distribution channels, etc. Of particular concern, exporters lack information about com-pulsory market access requirements in new markets (such as technical regulations, product standards and conformity assessment). Furthermore, some trade agreements remain underexploited due to the lack of understanding of rules of origin and the necessary verification of value added in-puts in order to determine preferential treatment. Building awareness of the opportunities offered by such agreements, together with specific trade intelligence on market require-ments, would go a long way towards increasing export op-portunities, especially as CMT firms progressively build their service base and move up the value added ladder.
The primary source of market intelligence for non-CMT T&C companies is personal contacts. Specific trade infor-mation and market intelligence is unavailable, outdated or too general. While some good information exists, it is very costly. The lack of market intelligence is compounded by poor research capacities within firms as well as limited ex-posure to target markets. Companies have little interaction in their target markets, while trade representatives do little to assist enterprises in understanding market dynamics. Greater exposure to events such as trade fairs and buyer–seller meetings would help firms gain a better understanding of market requirements.
The lack of trade intelligence is a key factor behind the continued reliance on AGOA and third-country fabric provi-sion. Without a better understanding of market dynamics, firms are unable to produce goods that meet market re-quirements. As noted by a representative of the Handloom
Weavers Association, ‘we can produce, but we do not know the market’.
In the PoA, activities 4.1.1 to 4.1.5, and 4.2.1 respond to this issue.
Trade promotion
‘We must capitalize on the renewal of AGOA and the upcoming Tripartite Agreement. In order to do this, reinforcing the image of Kenyan products will be key! We must work on a common brand to make ourselves visible and attractive to foreign markets.’
Industry opinion
Lack of an effective national branding strategy and coordi-nated promotion hinders market development
Kenya suffers from limited name recognition. Although the Government has tasked the Brand Kenya Board with cre-ating and promoting an integrated national brand, its ca-pacities are weak and it has been relatively ineffective in achieving its mandate. Indeed, T&C stakeholders seem to be unaware of its existence. Moreover, there is no national brand for T&C products. In the absence of an effective na-tional branding strategy, both generic and sector-specific, the country’s reputation is sometimes overshadowed by its historical challenges. If Kenya is to overcome its constraints and become a chief competitor among its regional peers, it must develop a unique country image. This is especially true considering the lack of capacities for branding among individual enterprises.
Furthermore, the sector must engage in more persistent trade promotion efforts through regular participation in in-ternational trade fairs and buyer–seller events. In addition to

[ KENYA’S T&C SECTOR IS AT A CROSSROADS ]
33
helping enterprises gain exposure to international markets and offering them opportunities to pursue new commercial opportunities, consistent participation will provide a venue through which stakeholders can reinforce the new national brand.
In the PoA, activities 4.2.1 to 4.2.7 respond to this issue.
There is limited assistance to handloom firms and designers on trade promotion
The needs of handloom firms and designers are often dif-ferent from those of the sector’s larger companies. This segment of the value chain finds it difficult to access trade support services that are targeted to their specific needs. This is a concern because internal human and financial re-sources are often insufficient to undertake the necessary trade promotion activities. Trade promotion assistance must be extended to these enterprises in order to ensure that they
participate in the sector’s export growth and value chain integration.
In the PoA, activities 1.4.1, 4.3.1, 4.4.1, 4.4.1 and 4.4.2 respond to this issue.
Market access policies
The export quota reduces profitability
The Kenyan Government places an export quota of 80 % of production on clothing companies. This rule was created in order to ensure that the local market had access to an adequate supply of clothing. However, there is insufficient demand for new, Kenyan clothing in the local market. As such, it cannot absorb 20 % of the sector’s production. As they are not able to export the excess supply, enterprises therefore end up losing out on significant revenues.
In the PoA, activities 2.3.1 and 2.3.2 respond to this issue.
SOCIO-ECONOMIC AND ENVIRONMENT ISSUES
Box 14 : Social and economic constraints in Kenya’s T&C sector
Development issues
Poverty Alleviationand Gender Issues
Regional Development
and Integration
Envir
onm
enta
l
Sust
aina
bilit
y and
Clim
ate
Chan
ge
Across the value chain
CSR : Environmentally and socially responsible practices are not an integral part of doing business in the sector, threat-ening negative social impacts and ineligibility to supply socially concerned buyers
Textiles Water pollution : Outdated dyeing methods pollute waterways
Across the value chain
CSR
Environmentally and socially responsible practices are not an integral part of doing business in the sector, threatening negative social impacts and ineligibility to supply socially concerned buyers
Few Kenyan factories are certified under ( or aware of ) the EU’s Business Social Compliance Initiative or the United States’ Worldwide Responsible Accredited Production. Factory workers frequently exceed the maximum number of working hours allowed per week and are sometimes subjected to unhealthy breathing environments. Machinery used is often technologically outmoded and environmentally
dirty. Obtaining Business Social Compliance Initiative and Worldwide Responsible Accredited Production certifications can be useful in accessing European and North American markets, which are increasingly conscious of the negative environmental and social spillovers of textile and garment production. Certification would also help ensure a healthy and happy workforce. Moreover, as garments represent one of the country’s most important industries, the sector’s envi-ronmental and social practices will set important precedents for the country as its economy grows.
In the PoA, activities 2.1.1 to 2.1.10 respond to this issue.

Photo: Marc
Samso
m, D
jose
r jun
ior t
rip to
Ken
ya
[ KENYA TEXTILE AND CLOTHING VALUE CHAIN ROADMAP ]
34
Textiles
Water pollution
Outdated dyeing methods pollute waterways
As a water-scarce country, Kenya’s demand for water surpasses its re-serves of renewable fresh water.32 It is therefore important that its water resources are neither polluted nor wasted. The textile industry con-sumes a considerable amount of wa-ter in dyeing and finishing processes. In addition, outdated dyeing methods re-lease chemical waste, including persistent organic pollutants, into the water.
New methods exist that would allow textile companies to use less water and minimize pollu-tion. Such methods include optimization of the dye-ing process itself ( i.e. using air dyeing techniques ) and improved wastewater treatment. However, stakeholders do not consider the issue to be a major concern and they lack awareness of the benefits that might result from transitioning to a more sustainable process. Not only would improve-ments lead to environmental preservation, they could also be leveraged as marketing tools in order to add value to final products. As an example, the EU market restricts the use of azo dyes for any imported T&C product. In order to penetrate this market, Kenyan firms must gradually replace these dyes with alternatives.
In the PoA, activity 2.3.1 ( 4 ) responds to this issue.
32.– Encyclopaedia of the Earth ( 2008 ). Water profile of Kenya. Available from http : / / www.eoearth.org / view / article / 156956.
The need for coordinated action
The analysis of the competitive constraints makes it clear that the sector’s sustainable development will require an integrated set of interventions that holistically address chal-lenges across the entire value chain. Roadblocks are not limited simply to enterprise capacities or government policy, and many challenges are the result of a combination of fac-tors that require wide-ranging remediation. It is for this rea-son that a comprehensive roadmap becomes all the more necessary ; individual stakeholders, and even small groups of stakeholders, will not be able to deal with the constraints on their own. It is only through strategic cooperation that the most effective results will be achieved.
STRATEGIC IMPLICATIONS FOR THE VALUE CHAIN ROADMAP
Having been granted preferential access to the world’s ma-jor markets, Kenya’s T&C sector has grown considerably since the turn of the century. Its comparative advantages, in-cluding an affordable labour supply and proximity to impor-tant markets, allowed the sector to thrive with the support of a conducive policy environment. Nevertheless, the sector’s expansion has stagnated in recent years and a divergence has been noted between the growing clothing segment and the struggling textile segment.
In addition, and unlike its global competitors, Kenyan clothing companies have been moving away from value
added activities and returning to a simple CMT model. These worrisome trends are compounded by significant market concentrations that are characterized by a near-total reliance on the American market and AGOA. Not only do these concentrations make the sector quite vulnerable to shifts in demand as well as black swan events, but the fact that Kenya has found it difficult to sustain its growth and en-ter other markets is evidence that it lacks competitiveness. Failure to maintain market share and penetrate new markets is especially worrisome given the relative age of the sector in Kenya when compared to its regional competitors.

[ THE WAY FORWARD ]
35
THE WAY FORWARD
The sector’s current model has performed well, yielding strong economic and social returns. Despite signs of low productivity and an excessive concentration on a narrow set of products and markets, the overall approach remains relevant. Even so, a new strategic model driven by com-petitiveness is needed : the industry must unite and evolve in order to leapfrog into higher growth and value addition. Kenya cannot compete with other low-cost manufacturers.
The sector’s strategic orientation should follow a two-pronged approach. Firstly, Kenya can foster its current posi-tion and build on its assembly and CMT offerings through improved process efficiency, workforce development and the formation of conducive policies. This will lead to enhanced productivity and quality, which will serve to balance out higher lead costs. In the meantime, efforts can be made to increase exports through AGOA while looking to target new markets.
In order to remain truly competitive, however – particularly given the rise of low-cost centres of production such as Ethiopia and Myanmar – Kenya must shift from contract manufacturing and begin to provide fully integrated services including input sourcing, product development and design. By moving up the global value chain and shifting from basic items to superior products, this second strategic orientation will allow Kenya to capture greater value and penetrate pre-mium market segments.
To realize these goals, structural deficiencies along the four gears ( supply side, business environment, market entry and development ) will be addressed and identified opportu-nities will be leveraged. The following is a delineation of the proposed vision and strategic approach.
THE STRATEGIC OBJECTIVES
This value chain road map’s PoA will respond to these two key visions as both scenarios will require workforce de-velopment, skills acquisition, increased FDI attraction, an enhanced policy and business environment, and strong business associations.
Strategic objective 1: Maximize productivity and uphold quality requirements through skills development.
Based on the constraints analysis, the remaining skill gap is an essential break for sector development, limiting pro-ductivity and quality increase, preventing the integration of service provision beyond CMT and preventing further value addition throughout the value chain. The issue is therefore of utmost priority and will require immediate action on a variety of fronts, including the Government, institutions and enter-prises themselves. The first strategic objective is therefore: maximize productivity and uphold quality requirements through skills development.
Skills development will be a priority, particularly for increas-ing productivity, quality, service provision and the capacity for value addition throughout the value chain. At the insti-tutional level, efforts must be made to improve trade and
investment support institution (TISI) coordination and align training and educational offerings with the industry’s needs. At the enterprise level, improvements are required in key technical, supervisory and quality assurance skills, as well as MSME-specific skills related to weaving and design.
The following operational objectives have been defined to achieve the first strategic objective:
1.1. Strengthen sector coordination to support skills development.
1.2. Improve technical and supervisory skills as well as supply chain performance.
1.3. Enhance quality management skills in line with inter-national standards.
1.4. Develop specific skills for the handloom subsector, for designers as well as for MSMEs.
1.5. Improve existing training and educational offerings in line with industry needs.
1.6. Ensure that national quality management infrastruc-ture responds to the industry’s needs and interna-tional ambitions.

[ KENYA TEXTILE AND CLOTHING VALUE CHAIN ROADMAP ]
36
Strategic objective 2: Improve the business environment to fur ther support the development of the T&C industry.
The current lack of sector coordination is another aspect currently preventing integrated development of the value chain. Advocacy and policy support for the sector are un-coordinated. The remaining constraints in the business en-vironment, such as trade facilitation issues, the cost of doing business, lack of access to finance, and infrastructure, pre-vent the leap towards greater competitiveness (particularly in the textile segment). These issues constitute the second strategic objective which is to improve the business envi-ronment to further support the development of the T&C industry.
Policy support will also constitute an important pillar of reform, particularly with regards to CSR issues, as modern buyers will require that the sector complies with ethical prac-tices. Similarly, the Government must work to remove the re-maining constraints in the business environment in order to allow for greater competitiveness and attract foreign capital (particularly in the textile segment). This includes increasing the capacities of Customs officers to clear T&C products in a more efficient and effective manner, modernizing financial services, improving the overall legal framework, decreasing electricity pricing and fostering change within the transporta-tion system.
The following operational objectives have been defined to achieve the second strategic objective:
2.1. Improve compliance as a way to increase productiv-ity and competitiveness.
2.2. Increase the capacity of port communities to enforce T&C-related regulations.
2.3. Improve the legal and regulatory framework relevant to the T&C industry.
2.4. Expand and modernize the financial services avail-able to the industry.
2.5. Support competitiveness through improved electric-ity pricing and quality.
2.6. Improve the efficiency and cost competitiveness of transportation and logistics.
Strategic objective 3: Expand the benefits of investment throughout the T&C value chain.The benefits of FDI and south–south cooperation have not yet reached the most capital-intensive segments of the value chain, namely spinning and textiles. Also, Kenyan firms’ in-tegration in global value chains remains very limited due to the lack of a coordinated and targeted approach by the Government. To ensure capital, technology and know-how inflows in the sector, while also helping to open up new markets for Kenyan producers, a better approach towards investment is required for the sector. Thus the third strategic
objective of the road map is to expand the benefits of in-vestment throughout the T&C value chain.
FDI and south–south cooperation will serve as enablers, directing capital, technology and know-how to the under-served sections of the value chain, while also helping to open up new markets for Kenyan producers. For this to be achieved, the Government needs to continue improving the conditions for investment. TISI capacities will also need to be strengthened in order to identify and attract investors. In parallel, the investment promotion strategy needs to be updated and aligned with the goals of the country, with a particular view towards consolidating the missing links in the T&C value chain. In this regard, targeted investment into equipment upgrades will be of foremost importance. Finally, to ensure that investment creates synergies in the sector and fills its role as an enabler for smaller firms, collaboration schemes need to be systematically enforced within EPZs and the upcoming industrial zones.
The following operational objectives have been defined to achieve the third strategic objective.
3.1. Pursue efforts to establish ideal conditions for investors.
3.2. Increase capacity of TISIs to target and attract ap-propriate investments.
3.3. Further promote Kenya as the main FDI destination for T&C.
3.4. Enable equipment upgrading through investment.3.5. Increase collaboration between local SMEs and
foreign direct investors to ensure synergies.
Strategic objective 4: Enable market penetration and product development through trade intelligence.
Large Kenyan exporting firms focus primarily on produc-tion and do not manage export-related matters or promo-tional activities themselves. They mostly rely on information and a branding strategy provided directly by their business partners and parent companies. Another important part of the Kenyan T&C sector is MSMEs, including handloom and small designers, which may not be export-ready yet and focus mainly on the local and informal markets. As the sec-tor evolves and Kenyan firms build in additional services beyond CMT, they will increasingly need to receive and use relevant trade intelligence. Trade intelligence will also contribute to filling the gap of knowledge about preferential trade agreements, particularly among institutions that are as yet unable to initiate a proactive approach to promot-ing Kenyan T&C products within markets where Kenya has preferential access. The fourth strategic objective of this road map is therefore to enable market penetration and product development through trade intelligence.
All of these efforts must be market-led, taken with a view towards leveraging commercial opportunities through in-creased competitiveness. As such, the utilization of effective

[ THE WAY FORWARD ]
37
trade intelligence will play a vital role in the sector’s transfor-mation. The first step is to ensure that information is prop-erly generated and available to key stakeholders. A second aspect is to reinforce the capacity of Kenyan firms to use it in order to expand their market access beyond AGOA and to promote their products and savoir faire. In addition, prod-uct development must be in line with target markets’ needs. To this end, firms must build the capacity to identify these requirements and update their product designs according to the latest techniques and trends. Lastly, since MSMEs in Kenya do not target the same markets as larger firms, specific capacity reinforcement needs to be undertaken at their scale of operation to ensure that they are competitive in national and regional markets.
The following operational objectives have been defined to achieve the fourth strategic objective.
4.1. Improve access to strategic trade intelligence for T&C firms.
4.2. Expand market access and promote Kenya’s T&C products.
4.3. Increase firms’ capacity to align product develop-ment with key markets’ requirements.
4.4. Provide targeted assistance to handloom firms and designers on trade promotion.
Photo: Jai79@pixabay.

[ KENYA TEXTILE AND CLOTHING VALUE CHAIN ROADMAP ]
38
Sector development targets
Figure 9 : Kenya’s apparel export growth ambitions
One of the main focus areas of this roadmap will be to build on the current conjuncture and benefit from the growing interest of international investors in T&C in the East Africa region. This potential investment in the region is estimated to reach US $ 1 billion according to MoIED.
The investment could come from multiple sources, such as the expansion of existing entrepreneurs, the entry of new local entrepreneurs, or FDI. However, of these options, FDI represents the most attractive source of investment capital. FDI not only brings capital, it also brings technical know-how, spreads good human resource management practices, and introduces new systems and procedures. In addition, foreign investors bring access to new markets while also facilitating moves into higher value added activities.
If all strategic steps outlined by this roadmap are taken and the conditions required for attracting investment are put in place, the country’s objective of reaching US $ 1 billion in exports of T&C by 2017, up from the current US $ 400 million, appears to be in reach. By continuing on this path over the next three years, the sector could reach export values up to US $ 1.5 billion by 2020.
An addition of US $ 1.1 billion export value through 2020 will have an impact on the entire value chain.
� Clothing : It will call for the production and export of another 220 to 250 million pieces of clothing. This will require an investment of US $ 300 million in garment pro-duction facilities alone : 50,000 sewing machines, 5 mil-lion square feet of built-up area and 100,000 workers.
� Textiles : On the textile front, it will mean an additional de-mand of approximately 500 million metres of fabric and 80 million to 90 million kg of yarn.
Based on this logic, the roadmap will aim to deliver the fol-lowing production, ex port-related and developmental targets by 2020 :
� More than 100 firms have acquired new equipment and related technical capacities
� Four hundred and fifty new production lines developed by Kenyan firms in yarn, textile and apparel production
� Exports of textiles and garments to increase by 25 % an-nually over the next five years to US $ 1.5 billion
� More than 100,000 new jobs in the T&C sector � All companies comply with international standards related
to working conditions, quality management and sustain-ability.

[ THE WAY FORWARD ]
39
LEVERAGING MARKET OPPORTUNITIES
Kenya’s T&C exports are highly concentrated in one import-ing market, the United States. Continued reliance on a single destination market may prove to be unsustainable. Kenya’s T&C export growth can be based initially on market penetra-tion, focusing its efforts on expanding apparel exports, and at the same time in market development, reaching new mar-kets by leveraging preferential market access conditions. At the same time enterprises can build capacities for more value added clothing products. At a later stage, upstream capacities should be developed in order to reduce import dependency.
Gaining market share in traditional markets
Kenya should focus its initial efforts on expanding apparel exports to its main importer and biggest world importer, the United States. Kenya has constantly gained market share in the American market over the last decade and could build on its success to increase its exports even further by broad-ening its product portfolio.
Leverage existing market linkages to build capacities for more value added garmentsWhen looking to sell new products, enterprises can lever-age existing market linkages and enter product categories that can be distributed either to existing buyers or along the same distribution network. At the same time, enterprises can build capacities for more value added clothing products. However, Kenya should take steps to develop upstream ca-pacities in order to reduce import dependency, generate more employment and drive domestic value addition.
Taking advantage of preferential market access to penetrate new large marketsThe sector can leverage the duty-free advantage that Kenya has been granted for garments in many larger markets, in par-ticular EU markets such as the United Kingdom, where Kenya is already exporting, or Spain. Stakeholders should focus on market segments that value cost competitiveness across the markets. To do this, enterprises must be able to provide larger orders. The recent signature of the tripartite agreement between COMESA–EAC–SADC is also an opportunity to en-ter the largest African importer of garments, South Africa.
Diversifying in intermediate products in regional markets and local supply of accessories and embellishments
With regards to its product basket, the sector could develop its exports of intermediate products ( yarn and fabrics ) in the regional market. The development of the textile industry in the region will increasingly require the provision of inputs. However, the main focus of developing intermediate prod-ucts should be indigenizing the entire value chain. These new fibre bases could be exported to new markets, in par-ticular EU markets.
As the Kenya T&C sector moves gradually from CMT to original design and manufacturing with its current buyers, valued added garments will integrate locally produced ac-cessories and embellishments. The following matrix sum-marizes the product and market opportunities available to Kenya’s T&C sector based on consultations with experts and feedback from leaders of the industry in the country.
Box 15 : Product and market opportunities
Existing products New productsExisting markets
Market penetration
• Garments in the United States• For textile mills, garment factories in Kenya and Ethiopia
Product development
• United States – Fibre diversity and value added garments requiring higher skill• Categories where United States imports exceed $1 billion, while Kenya’s exports to the United
States are < US $ 1 million• HS 621210 – intimate wear• HS 620443 – dresses of synthetic fibres• HS 620193 – men’s synthetic outerwear• HS 611596 – specialty hosiery of synthetics
New markets Market development
• Major EU markets e.g. United Kingdom or Spain• COMESA markets, especially South Africa• India
Diversification
• Yarn and fabrics ( shirting, bottom weight and denim ) – regional markets• Value added garments, diverse fibre base – other EU markets• Manufacturing of accessories and embellishments for garment factories in Kenya and regional
markets• Manufacturing of home textiles• Green markets for brand apparel companies in EU

[ KENYA TEXTILE AND CLOTHING VALUE CHAIN ROADMAP ]
40
FDI IS THE KEY TO USHERING IN A NEW ERA OF GROWTH
FDI has long been a driver of growth in the T&C sector as in-vestors look to capture the comparative advantages offered by new destinations. Global greenfield FDI in the T&C sector reached US $ 24 billion in 2013, an all-time high and more than double the level achieved in 2012. Moreover, Africa is receiving a greater share of this investment as rising wages in China, compliance issues in Bangladesh and labour un-rest in Cambodia, together with other factors, have accel-erated a shift to new locations. Total FDI inflow to Africa in 2013 was valued at US $ 57 billion, of which US $ 1.75 billion was in the T&C sector.
Government measures to strengthen the garment and textile sectors and the infrastructure on which they rely ( including the standard gauge railway to Mombasa ), if completed on schedule in the next one to two years, will sig-nificantly boost Kenya’s investment attractiveness. Kenya’s manufacturers will be able to reduce inland transportation costs by about 80 %, making them cost competitive in a wider range of additional products.
As the Government nears completion of the Naivasha Textile City and electricity projects, attractive opportunities to mass produce fabrics for the regional garment industry will also emerge. With the ability to capitalize on low power and steam costs as well as the availability of well-planned infrastructure, Kenyan mass production of textiles should become internationally cost competitive for the first time in recent history. In the interim, companies experienced in sell-ing smaller, premium lots of ‘green’ or sustainable textiles may still be interested in investing in Kenya.
TARGET FDI SOURCE COUNTRIES
FDI in Kenya’s T&C sector has historically arrived from inves-tors in China, India, the UAE and South-East Asia. These countries and regions will continue to be future sources of FDI. In addition, FDI could be attracted from Germany, France, the Republic of Korea, the United States, Italy, Bangladesh and Israel. While attracting FDI from Japan may also be possible, it will require more time given the stringent quality, technical and product development orientation of Japanese companies. It should therefore be only a medium-to-long-term objective.
Special attention needs to be paid to attracting FDI from India. India is not only one of the largest T&C producing and exporting nations, it is also a large market that is growing in double digits. Right now, India’s T&C exports stand at ap-proximately US $ 40 billion, whereas its domestic consumption is estimated to be US $ 75 billion ( including apparel, home tex-tiles and technical textiles ). Continuous growth of con sumers’ disposable income has ensured high demand growth.
For Indian T&C investors, existing market linkages, duty-free access status and Kenya’s well-developed infrastruc-ture will be the biggest attractions. There are several large T&C companies in India willing to invest overseas in order to cater to their traditional buyer base while benefiting from duty advantages. It will be important and fruitful for Kenya’s investment promotion authorities to invest time and effort to identify and reach out to potential Indian investors and showcase the advantages of investing in Kenya. In addition, the Government must continue its negotiations as part of the EAC with India in order to ensure that Kenyan exporters are granted adequate market access.
Box 16 : Trade as a precursor to investment
Trade initiation is the first step towards investment. Consider an example of an Indian company buying certain inputs from East Africa for its production in India. If imports remain profitable, then with growth of its business, the company will weigh imports ( using trade intermediaries such as agents ) vis-à-vis establishing an East African affiliate to procure the material. Having its own office can reduce the bulk sourcing cost and give better supply chain control to the company. Over time, successful procurement operations in East Africa might evolve into a manufacturing facility and continue to add
other higher value functions over time, such as design, research and development, or regional sales and distribution.
In short, trade and FDI are very often part of the same continuum. As more and more Indian businesses evolve farther down that continuum, trade and investment linkages between India and East Africa will strengthen and there will be greater spillovers of technology and skill in East Africa. This will help East African businesses become more efficient, improve the marketability of their products and services, and deepen their participation in global value chains.

[ THE WAY FORWARD ]
41
Target part of T&C value chain Target products Target investors
Garment manufacturing – Free on Board ( FOB ) ( and, in the medium term, original design manufacturers )
Basic products with little design variation and / or demonstrated success in the United States market ( T-shirts, shirts, cardigans, trousers, skirts and blouses ) and slightly more complex garments ( suits, denims, women’s underwear )
Companies that are qualified suppliers to low- and mid-range retailers and brand apparel companies from the United States, EU, UAE and Japan
Textile mills and integrated textile / clothing factories ( once the Naivasha Textile City and electricity projects are completed )
Yarn and fabrics to feed into export-oriented garment production
Pool of existing investors, India, China, domestic firms, government ( public–private joint ventures )
T&C production branded for niche markets such as green, ethical or sustainable Garments, including ethnic ones Pool of existing investors and domestic firms
Manufacturing of accessoriesThread, labels, hangtags, buttons, zippers and elastics Domestic entrepreneurs, Chinese companies
Manufacturing of home textiles Bed and bath linen Mainly domestic textile firms
POTENTIAL VALUE CHAIN SEGMENTS
Kenya has already positioned itself as one of the leading garment exporters in Africa. Not only is Kenya in a position to increase its market penetration, it can also work towards gradually shifting to more value added garments. There is also an urgent need to indigenize the textile part of value chain – yarn and fabrics. While power cost has thus far been a major deterrent, investment will become viable as a result of new initiatives on the horizon that will address this chal-lenge. A similar scenario will play out for investment in the manufacturing of accessories and embellishments, such as thread, labels, hangtags, buttons, zippers and elastics. Export-quality set-ups to manufacture such items will find a ready market by offering the benefits of lower cost and shorter delivery time.
The most promising short- and medium-term opportuni-ties for private investment are listed below and are directly linked to T&C’s export growth strategy for products and markets. They are promising because cost data and the experiences of existing investors suggest that investment projects with similar products could operate not only profit-ably and securely, but more so than if the project were in a competing location.
ATTRACTING INVESTORS
Beyond creating a favourable business environment for the T&C sector, the Government of Kenya must broadcast the advantages of doing business in Kenya to those companies considering international expansion. Some companies will invest without any government information or assistance ; some will not invest under any circumstances ; and some are in between those two extremes, where they might be persuaded to choose Kenya over other locations if the right information and assistance is provided to them at the right time.
Identifying investors in this last group, securing meet-ings with them and persuasively making the case for one’s
country over others is known as investor targeting, and it is arguably the most difficult function for the typical investment promoter to perform. One of the main reasons for this is the difficulty in identifying high-potential investors. Before each investor is approached, the investment promoter should take the time to ‘qualify’ the investor. This means researching the company to see that its products and markets correspond to Kenya’s strengths and that it is at a strategic and financial point where international expansion is likely.
Existing investors
In developed economies, reinvestment from existing in-vestors is recognized as the largest source of new FDI. Moreover, significant reinvestment is the only path to large-scale sectoral development and economic diversification. Reinvestments represent growing commitments from foreign investors to doing business in a country, often increasing production volume or moving the company into new value chain segments. This can bring levels of local sourcing, ex-ports, technology, worker skills and general value added, which first-time investors might not. Also, from the perspec-tive of an investment-promoting body, it is much less expen-sive to court the community of existing investors than to find new investors among the scattered global pool of compa-nies with no demonstrated interest in the promoter’s country.
In Kenya, Government relationships with investors have tended to be developed very little beyond the provision of EPZ space and the issuance of permits and certificates. The Kenyan Government, KenInvest and EPZA should commit themselves to implementing a coordinated programme of in-vestor aftercare to maximize benefits from existing investors. This programme of investor aftercare could involve a range of investor services and business environment advocacy.
Kenya’s long-established base of existing investors will be at the core of any growth. Many of these investors are from India, China, Chinese Taipei and the UAE, which will be good candidate countries from which to seek additional investors. It should also be noted that, while they are not

[ KENYA TEXTILE AND CLOTHING VALUE CHAIN ROADMAP ]
42
exactly existing investors, T&C companies in Ethiopia and the United Republic of Tanzania have demonstrated both the willingness and the ability to invest in the region. In ad-dition, they are cheaper to approach than others. Kenyan officials could therefore consider approaching them as they approach other existing investors.
Investors having expressed interest in the sector
This category of investor is the low-hanging fruit ; compa-nies that have been in contact with the Kenyan Government or business associations at their own initiative. KenInvest, EPZA, KAM, ACTIF and KNCCI are among the stakehold-ers that have likely received many inquiries from interested investors. These should be consolidated by this strategy’s implementing team for direct follow-up or for tracking the stakeholder’s follow-up, as appropriate.
Potential investors
Before potential investors can be ‘qualified,’ investment pro-moters need a ‘long list’ of investors in each of the countries where they think they might have success in targeting inves-tors. The following is an example from India (see Appendice Section D).
Similar lists can be obtained for each target country from their respective sector associations or independent sector research. As an example, the following list offers the names of three of the top clothing brands and retailers in some of Kenya’s most likely sources for T&C FDI. Investment promot-ers would investigate the top garment factories supplying such firms and target them for investment in Kenya.
ENHANCING THE BUSINESS ENVIRONMENT FOR INVESTMENTInvestment opportunities vary in the immediacy of their feasibility. New projects in ready-made garment manufac-turing, for example, continue to register with the Kenyan Government almost weekly, with little official intervention, while large-scale textile manufacturing will not occur without the Government effecting significant enhancements to the business environment. The following activities and reforms will help Kenya optimize the country’s competitiveness for sector-strengthening FDI and empower domestic investors to participate in global value chains at a high level of value added.1. Kenya has some advantage over its regional T&C compet-
itors in terms of established market channels, labour pro-ductivity and the skills to produce slightly more advanced
Photo: Make it Kenya, 2015

Photo: Make it
Kenya, 2
015/
09/2
2 M
iK N
airo
bi L
aunc
h
[ THE WAY FORWARD ]
43
products ( e.g. skirts and denim products ) than, say, Ethiopia ( e.g. uniforms, polo shirts ). Kenya should seek to widen this technical gap, considering its existing technical advantage, its relatively high labour costs and the growth trajectory of Ethiopia as a competitor. This requires :a. Upgrading machinery, much of which is 30 -40 years
old ;b. Making medium- and higher-skilled garment
manufacturing a Government priority ( garments are now relatively low on its long list of manufactur-ing sector priorities ) ;
c. Moving from industry-led workforce development to Government-led workforce development and tailor-ing TVET programmes to produce managers and workers for higher-skilled products, such as ladies fashion, sportswear and intimate apparel.
2. Ensure timely completion, in the next one to two years, of four key Government initiatives targeted at finally linking Kenya’s domestic textile producers with its foreign garment producers and fundamentally altering their collective competitiveness :a. The broad-gauge railway to Mombasab. The Naivasha electricity projectc. A textile city with the same infrastructure and incen-
tives enjoyed by EPZsd. The low-interest industrialization fund.
3. With an established production base for export-oriented garments, KenInvest and EPZA should encourage maximum reinvestment through a well-coordinated
programme of investor aftercare that supports smooth operations for the life of an investment project and that collaborates with existing garment manufacturers to identify and handle obstacles and opportunities for growth, linkages and sector development.
4. With a 10-year extension of AGOA, Kenya’s garment exports are likely to continue flowing overwhelmingly to the United States. However, this is being discussed as the last AGOA extension. If Kenya’s export markets are not diversified in the next 10 years the sector could wither. As part of a renewed Government commitment to higher-skilled garment production, KenInvest, KNCCI and EPZA should be given sector diversification targets and explicitly tasked by their boards to collaborate on investor-targeting campaigns in Asia.
5. If the Government and sector stakeholders are successful at growing the volume of textiles feeding into Kenya’s ex-port-oriented garment production, domestic production of export-quality cotton lint and yarn may be able to replace some of the cotton supply, most of which would presum-ably come from the United Republic of Tanzania and Ethiopia. Filling out this part of the value chain will require :a. Greater allocation of Government land to cotton
productionb. Deeper penetration of extension servicesc. A fund similar to the industrialization fund above but
dedicated to providing favourable financing terms for farm modernization, including machinery, irriga-tion, quality seeds, etc.
FUTURE VALUE CHAIN
Unlocking the potential of the T&C sector will require transformations throughout the value chain. These adjustments, as reflected in the future value chain schematic, are the result of targeted efforts to ad-dress the competitive constraints identified and capitalize on opportunities to add value. The fu-ture value chain will be characterized by :
I. Development of the textile production segment
II. Further development of EPZs and estab-lishment of textile cities to facilitate access to utilities
III. Development of the garment production seg-ment and integration with the textile produc-tion segment
IV. Enhanced support services, particularly in the ar-eas of TVET, sector coordination, finance, Customs and logistics.
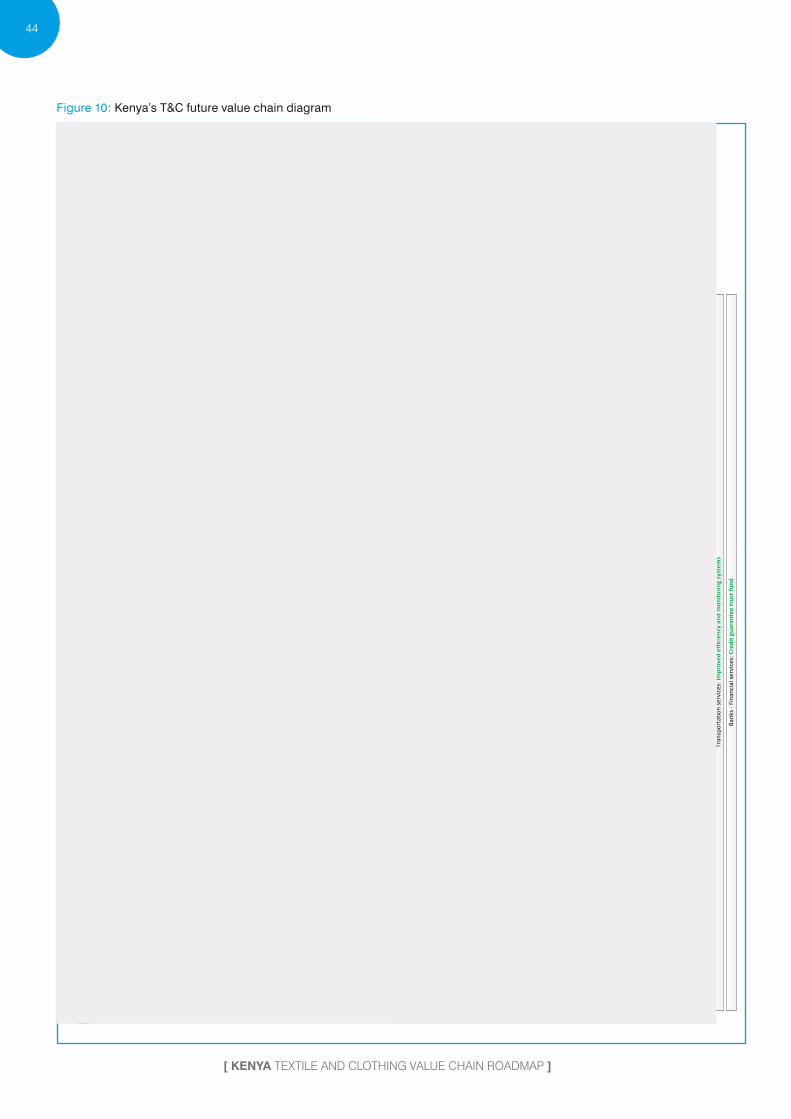
[ KENYA TEXTILE AND CLOTHING VALUE CHAIN ROADMAP ]
44
Figure 10 : Kenya’s T&C future value chain diagram
Impo
rts
Fabr
ics:
(~
70%
of
fabr
ic su
pply
is
impo
rted
)Tr
ims
Mac
hine
ry
Spar
e pa
rts
Garm
ents
ex
port
s
Lege
nd:
Prim
ary
supp
ort s
ervi
ces
Cana
da
Net
herla
nds
Mos
t of t
he li
ntIs
impo
rted
Yarn
s
Expo
rts
30%
of l
ocal
dem
and
for
clot
hing
Expo
rts
Impo
rts
Fini
shed
cl
othi
ng fo
r lo
cal m
arke
t,se
cond
-han
d,sm
uggl
ed
Fabr
ics
Uni
ted
Stat
es o
f Am
eric
a
Depa
rtm
ent
stor
es
Impo
rts
Yarn
s
Inpu
ts
Mac
hine
ry
Dyes
for y
arn
and
fabr
ic
Wat
er,
elec
tric
ity, f
uel
Labo
ur fo
rce
Man
-mad
e fib
re
Cott
on fi
bre
Dyei
ng &
fini
shin
gDe
sign
and
sew
ing
Wea
ving
and
kni
ttin
gYa
rn sp
inni
ng
Expo
rt P
roce
ssin
g Zo
nes (
EPZs
)
(Nai
robi
, Alth
i Riv
er, M
omba
sa, n
ear K
ilifi,
Rift
Val
ey re
gion
)
UTI
LIZA
TIO
N: 9
0%U
TILI
ZATI
ON
: 90%
UTI
LIZA
TIO
N: 1
00%
(and
inve
stm
ent i
n ex
pans
ions
of c
apac
ity)
Keny
a In
vest
men
t Aut
horit
y, C
usto
ms a
nd R
even
ue A
utho
rity
: cap
acity
impr
oved
Min
istry
of I
ndus
tria
lizat
ion
and
Ente
rpris
e De
velo
pmen
t
Tech
nica
l cou
rses
: Eve
lyn
Colle
ge o
f Des
ign,
Ver
a Be
auty
and
Fas
hion
Col
lege
, Bur
u Bu
ru In
stitu
te o
f Fin
e Ar
t (BI
FA),
Mce
nsal
Sch
ool o
f Fas
hion
Des
ign
and
Nai
robi
Art
Aca
dem
y
Eger
ton
Uni
vers
ity, N
airo
bi U
nive
rsity
, Ken
yatt
a U
nive
rsity
, Mas
eno
Tech
nica
l U
nive
rsity
of K
enya
, Sou
th E
aste
rn U
nive
rsity
Col
lege
, Mac
hako
s Uni
vers
ity C
olle
ge
Tran
spor
tatio
n se
rvic
es: I
mpr
oved
effi
cien
cy a
nd m
onito
ring
syst
ems
Keny
a Bu
reau
of S
tand
ards
(KEB
S)Co
tton
Dev
elop
men
t Au
thor
ity (C
ODA
)
East
Afr
ica
Trad
e Hu
b (E
ATH)
, Afr
ican
Cot
ton
and
Text
ile In
dust
ries F
eder
atio
n (A
CTIF
)Expo
rt P
roce
ssin
g Zo
nes A
utho
rity
(EPZ
A)
Bank
s - F
inan
cial
serv
ices
: Cre
dit g
uara
ntee
trus
t fun
d
Asso
ciat
ions
: Ass
ocia
tion
of F
ashi
on D
esig
ners
, Afr
ican
Wom
en's
Entr
epre
neur
ship
Pro
gram
, Han
dloo
m W
eave
rs M
arke
ting
Coop
erat
ive
Soci
ety
Mas
s mer
chan
dize
ch
ains
Spec
ialty
st
ores
Fact
ory
outle
ts, o
ff-pr
ice
or m
ail o
rder
s
Rest
of t
he w
orld
Stan
dalo
ne sp
inni
ng m
ills
Blan
kets
pro
duct
ion
Stan
dalo
ne w
eavi
ng c
ompa
nies
Stan
dalo
ne k
nitt
ing
com
pani
es
Stan
dalo
ne te
xtile
com
pani
es
Stan
dalo
ne d
yein
g/fin
ishi
ng
plan
ts/s
ervi
ces
Loca
l/ret
ail
mar
kets
Moi
Uni
vers
ity
Nat
iona
l Cot
ton
Stak
ehol
ders
For
um
(NCS
F)
Keny
a Co
tton
Gro
wer
s As
soci
atio
n
Keny
a A
ppar
el M
anuf
actu
rers
and
Exp
orte
rs A
ssoc
iatio
n (K
AMEA
) Ke
nya
Asso
ciat
ion
of M
anuf
actu
rers
(KAM
) cov
erin
g te
xtile
man
ufac
turin
g ac
tivity
Keny
a Co
tton
Gin
ners
As
soci
atio
n
Keny
a Ag
ricul
tura
l Re
sear
ch In
stitu
te (K
ARI)
Smal
l/m
icro
ga
rmen
t co
mpa
nies
Garm
ent m
anuf
actu
ring–
FOB
(and
, in
the
med
ium
term
, or
igin
al d
esig
n m
anuf
actu
res)
. Ta
rget
inve
stor
s: C
ompa
nies
that
are
qua
lifie
d su
pplie
rs to
low
- an
d m
id-r
ange
reta
ilers
and
bra
nd a
ppar
el c
ompa
nies
from
U
nite
d St
ates
, EU
, Chi
na, I
ndia
, Ban
glad
esh,
UAE
, Jap
an, a
nd
Repu
blic
of K
orea
Pack
agin
g co
mpa
nies
Acce
ssor
ies p
rodu
cers
AGO
A (2
015-
2025
)
Fore
ign
inve
stm
ent c
ompa
nies
Loca
lde
sign
ers
Uni
ted
Repu
blic
of T
anza
nia
Loca
l/ret
ail
mar
kets
Uga
nda
Loca
l/ret
ail
mar
kets
Depa
rtm
ent
stor
esM
ass m
erch
andi
ze
chai
nsSp
ecia
lty
stor
esFa
ctor
y ou
tlets
, off-
pric
e or
mai
l ord
ers
Cott
on F
ibre
Dire
ctor
ate
Expo
rt P
rom
otio
n Co
unci
l, Vi
sion
2030
Sec
reta
riat
Oth
er tr
aini
ng in
stitu
tions
: Tec
hnol
ogy
Deve
lopm
ent C
entr
e, K
enya
Indu
stria
l Res
earc
h an
d De
velo
pmen
t Ins
titut
e (K
IRDI
), Ke
nya
Poly
tech
nic
Uni
vers
ity, r
eviv
ed K
enya
Tex
tile
Trai
ning
Inst
itute
Keny
a N
atio
nal C
ham
ber o
f Com
mer
ce a
nd In
dust
ry (K
NCC
I)
Sem
i-int
egra
ted
mill
sSp
inni
ngKn
ittin
g an
d w
eavi
ngDy
eing
Fini
shin
g
Text
ile m
ills a
nd in
tegr
ated
text
ile/c
loth
ing
fact
orie
s (on
ce th
e N
aiva
sha
elec
tric
ity a
nd T
extil
e Ci
ty p
roje
cts a
re c
ompl
eted
)Pr
oduc
ts: F
abric
s to
feed
into
exp
ort-
orie
nted
gar
men
t pro
duct
ion
Targ
et c
ompa
nies
: Poo
l of e
xist
ing
inve
stor
s, In
dia,
Chi
na, d
omes
tic fi
rms
Spec
ializ
ed tr
aini
ng
inst
itutio
ns fo
r T&
C m
achi
ne
oper
ator
s and
floo
r man
ager
s.Ta
rget
inve
stor
s: C
hine
se fi
rms
prov
idin
g te
chni
cal t
rain
ing
and
engi
neer
ing
serv
ices
Hom
e te
xtile
sTa
rget
inve
stor
s: M
ainl
y do
mes
tic te
xtile
firm
s
Yarn
-spi
nnin
g fa
ctor
ies (
once
the
Nai
vash
a el
ectr
icity
and
Tex
tile
City
pr
ojec
ts a
re c
ompl
eted
and
cot
ton
qual
ity is
impr
oved
. T
arge
t inv
esto
rs: M
ostly
dom
estic
fir
ms;
fore
ign
inve
stor
s and
the
Gove
rnm
ent f
or p
ublic
-priv
ate
join
t ve
ntur
es
A se
ctor
-spe
cific
ape
x bo
dy a
nd it
s sub
sidi
ary
orga
n
Impr
oved
soci
al a
nd e
nviro
nmen
tal c
ompl
ianc
e as
wel
l as H
R m
anag
emen
t in
firm
s Supp
ortin
g O
rgan
izat
ions
: (N
IFT,
NID
, IIH
T)
Esta
blis
h a
trai
ning
ce
ntre
in e
ach
Indu
stria
l zon
e
TVET
(str
uctu
re w
ith th
e re
quire
d tr
aini
ng e
quip
men
t)
Men
’s sy
nthe
tic
oute
rwea
r
Spec
ialty
hos
iery
of
synt
hetic
s
Nai
vash
a Te
xtile
City
Fina
lize
the
Nai
vash
a ge
othe
rmal
ele
ctric
ity p
roje
ct to
redu
ce e
lect
ricity
cos
ts fr
om U
S$0.
14-U
S$0.
15 p
er k
Wh
dow
n to
US$
0.05
;Bu
ild a
Tex
tile
City
at N
aiva
sha
with
the
sam
e in
fras
truc
ture
and
ince
ntiv
es e
njoy
ed b
y th
e EP
Zs
Esta
blis
h a
trai
ning
ce
ntre
Busi
ness
Acc
eler
ator
Impr
oved
con
trol
at
bord
ers,
spec
ifica
lly in
El
dore
t
Deni
m
Men
's an
d w
omen
's ca
sual
wea
r with
hi
gher
val
ue a
dded
(T-s
hirt
s, sk
irts,
ca
rdig
ans,
etc
.)
Gree
n fa
bric
s pro
duct
ion
Mar
kets
: EU
cou
ntrie
s whe
re n
iche
mar
kets
alre
ady
exist
, oth
er E
U c
ount
ries
Gree
n ap
pare
l pro
duct
ion
Mar
kets
: EU
cou
ntrie
s whe
re n
iche
mar
kets
alre
ady
exist
(PaC
T, D
ISHA
, The
Su
stai
nabl
e Cl
othi
ng A
ctio
n Pl
an, G
uilt
Free
Gar
men
ts, H
&M
Con
scio
us C
olle
ctio
n, e
tc.)
Expo
rt B
usin
ess
Acce
lera
tor (
EBA)
T&C-
spec
ific
and
spre
ad to
all
EPZs
Intim
ate
wea
r
Dres
ses o
f sy
nthe
tic fi
bres
Loca
l mar
ket
(loca
l hot
els,
co
nfer
ence
m
ater
ials,
ho
me
deco
r, to
urism
)
Nat
iona
l com
pone
ntIm
port
sEx
port
s

[ THE WAY FORWARD ]
45
I. DEVELOPMENT OF THE TEXTILE PRODUCTION SEGMENT1. Development of yarn spinning activities through domes-
tic investment.2. Overall compliance to CSR through, inter alia, improved
human resource management practices and implemen-tation of environmental standards.
3. Creation of stand-alone dyeing and finishing plants, act-ing as service providers to fabric producers.
4. Development of the home textile segment through local investment.
5. Development of a ‘green production line’, starting with green fabrics production and handing over to green national garment producers.
6. Thirty per cent of domestic fabric demand for the cloth-ing industry is provided by local textile firms.
II. FURTHER DEVELOPMENT OF EPZS AND ESTABLISHMENT OF TEXTILE CITIES TO FACILITATE ACCESS TO UTILITIES1. EPZ foreign investors to enter the textile segment and
spur development of integrated companies in EPZs.2. Each EPZ to be complemented by an EBAP specific to
the T&C sector.3. A training centre of excellence is established in each EPZ
and in each new textile city.
4. After the finalization of the Naivasha Textile City ( and in other textile cities that will be established ), attract local and foreign investors in the textile subsector, in line with local garment exporters’ yarn / fabric needs.
5. A scheme similar to EBAP, bringing in SMEs but not nec-essarily export-oriented, established in each textile city.
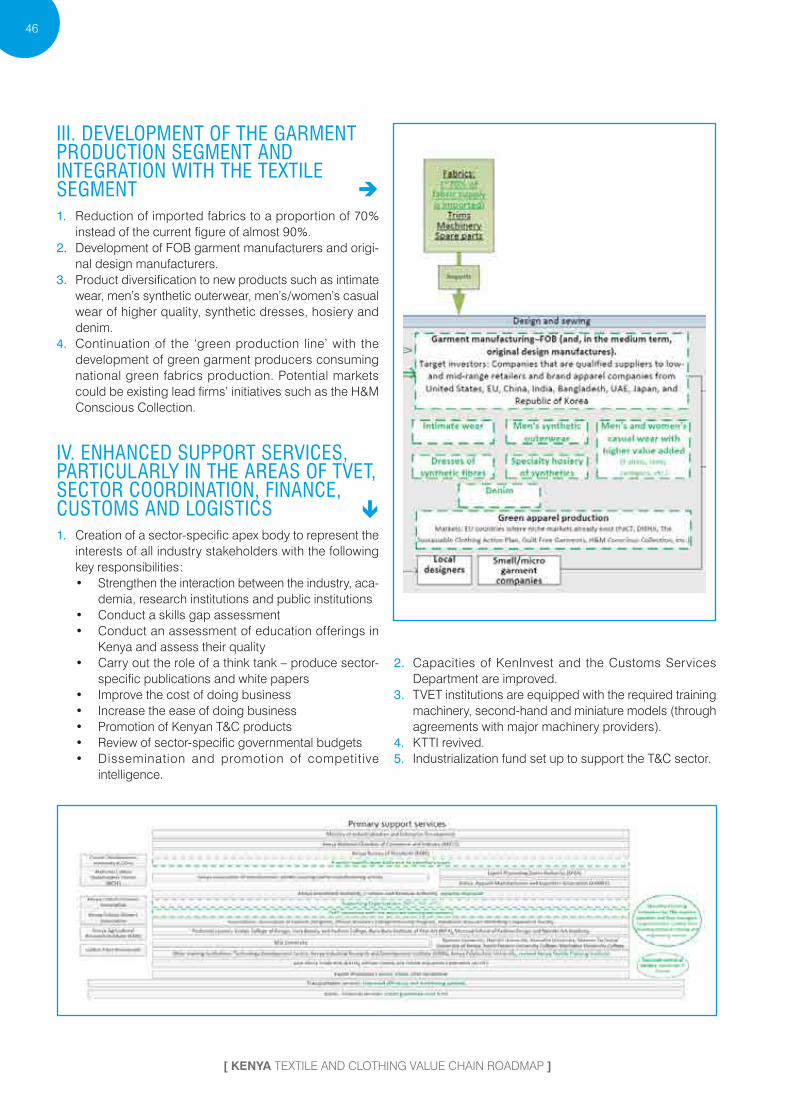
[ KENYA TEXTILE AND CLOTHING VALUE CHAIN ROADMAP ]
46
III. DEVELOPMENT OF THE GARMENT PRODUCTION SEGMENT AND INTEGRATION WITH THE TEXTILE SEGMENT 1. Reduction of imported fabrics to a proportion of 70 %
instead of the current figure of almost 90 %.2. Development of FOB garment manufacturers and origi-
nal design manufacturers.3. Product diversification to new products such as intimate
wear, men’s synthetic outerwear, men’s / women’s casual wear of higher quality, synthetic dresses, hosiery and denim.
4. Continuation of the ‘green production line’ with the development of green garment producers consuming national green fabrics production. Potential markets could be existing lead firms’ initiatives such as the H&M Conscious Collection.
IV. ENHANCED SUPPORT SERVICES, PARTICULARLY IN THE AREAS OF TVET, SECTOR COORDINATION, FINANCE, CUSTOMS AND LOGISTICS 1. Creation of a sector-specific apex body to represent the
interests of all industry stakeholders with the following key responsibilities :• Strengthen the interaction between the industry, aca-
demia, research institutions and public institutions• Conduct a skills gap assessment• Conduct an assessment of education offerings in
Kenya and assess their quality• Carry out the role of a think tank – produce sector-
specific publications and white papers• Improve the cost of doing business• Increase the ease of doing business• Promotion of Kenyan T&C products• Review of sector-specific governmental budgets• Dissemination and promotion of competitive
intelligence.
2. Capacities of KenInvest and the Customs Services Department are improved.
3. TVET institutions are equipped with the required training machinery, second-hand and miniature models ( through agreements with major machinery providers ).
4. KTTI revived.5. Industrialization fund set up to support the T&C sector.

[ THE WAY FORWARD ]
47
MOVING TO ACTION
The development of the future value chain for the T&C sector is a 5 year project defined through a consultative process between public and private sector stakeholders in Kenya.
Achieving the strategic objectives and realizing the future value chain of the T&C sector in Kenya depends heavily on the ability of sector stakeholders to start implementing and coordinating the activities defined in the Value Chain Roadmap’s Plan of Action. For this reason, a list of key pri-ority activities has been identified in order to kick-start the implementation of T&C Value Chain Roadmap.
The plan of priority actions to kick start implementation
Activity Target measures Leading national institution and possible implementing partners
Strategic objective 1: Maximise productivity and uphold quality requirements through skills development1.1. Strengthen the sector coordination to support skills development1.1.1. Set up a sector-specific Apex body to represent the interest of all industry’s stakeholders. Apex body is created
- Governance, rules of procedure and ToRs definedKAM/IFAD, EITH, support from MoIED, Regional Sup-port from ACTIF
1.1.2. The Apex body coordinates the development of a prioritized capacity-building pro-gramme curriculum based on the primary needs of the entire value chain, from workers up to managers, and define the training standards and infrastructure requirements. The capacity building programmes must be done in line with international standards and through bench-marking.
- Prioritized capacity-building programme curriculum is de-veloped - 1 Course curriculum for each area, assessment standards for certification agency and identification of ways to train (on-job, theory, mix)
Apex body
1.4. Develop specific skills for the Handloom sub-sector, designers as well as for MSMEs1.4.1. Strengthen Handloom Weavers’ Marketing Cooperative Society (WEAMACO) capacities to provide adequate support to its members and develop partnership agreements with MoIED, ACTIF and KAM. Provide guidance to improve the effectiveness and efficiency of the internal processes and results measurement of the support services provided by WEAMACO.
- 1 Handloom association strengthened and registered. - Governance, rules of procedure and ToRs defined
APEX body, MoIED, WEA-MACO, Regional Support from ACTIF
1.4.7. Establish and equip a pilot shared production facility regrouping small designers for them to share costs and benefit from common equipment. Connect with local partners and for-eign clothing manufacturers where possible (e.g. Rivatex and others).
- At least 1 production facility established over the 5 year period, grouping 100 designers. - At least 100 designers trained per year - At least 3 exchange programmes carried out.
New Handloom Association ,AFAD-K, MSEA , Regional Support from ACTIF, Equity Bank
1.6. Ensure that national quality management infrastructure responds to industry’s needs and international ambitions1.6.1. Support KEBS to bring up to date existing standards, establish which others are required, and publish national quality standards for garments and promote the use of those standards to members through circulars and seminars.
- Advisory service to KEBS on code of practices for the de-velopment of standards; 5 standards adopted; 2 sensitisation seminars conducted
KEBS, Regional Support from ACTIF
Strategic Objective 2: Improve the business environment to further support the development of the T&C industry2.1 Improve compliance as a way to increase productivity and competitiveness 2.1.1 Develop a reference book on existing social and environmental guidelines applied to the T&C sector in Kenya and their industry-wide applications, including the monitoring and report-ing mechanisms in place.
- Reference book on existing social and environmental guide-lines created
NEMA (National Environ-mental Management Au-thority), KEBS, Ministry of Labour, KIRDI
2.3. Improve the legal and regulatory framework relevant to the T&C industry to target export markets. 2.3.2. Kenya Revenue Authority to adjust (review) their regulations to improve ease of business especially in the T&C sector.
- 3 new regulations designed and submitted for approval MoEID, Trade Mark East Africa EPZA Mombasa KAM, KNCCI
Strategic objective 3: Expand the benefits of investment throughout the T&C value chain 3.3. Further promote Kenya as the main FDI destination for T&C3.3.4. Carry out investment promotion activities in target countries (particularly in India) - roadshows, facilitating direct interactions between Kenyan firms and targeted investors, helping foreign representatives to promote the sector.
- 1 roadshow each in 6 major textile cities - Ludhiana, Delhi, Ahmedabad, Mumbai, Bangalore and Tirupur - Meeting with 8-10 investors in each location. - Visits of interested investors (total 8 to 10) to Kenya
MOIED, KENIVEST, EPZA, KAM, Apex body Regional Support from ACTIF Indian Embassy
3.4. Enable equipment upgrading through investment3.4.1. Conduct audits and diagnostics of individual textile units and provide support first to a list of identified companies and then to a wider group of beneficiaries with the strategic tech-nology plan.
- At least 10 firms advised per year and technology plans developed
KAM, Apex body, Regional Support from ACTIF, Moi University
Strategic Objective 4: Enable market penetration and product development through trade intelligence 4.1. Improve access to strategic trade intelligence for T&C firms4.1.2. Improve the website of the Chamber of Commerce/KAM through web-based solutions for effective trade intelligence gathering and dissemination, and insure constant supply in timely market intelligence. Convert websites into mobile friendly formats. Keep track of the usage of websites with Google analytics.
- 2 websites revamped Chamber of Commerce, KAM

Photo: Carmina Campus Production Kenya (c) Louis Nderi & ITC Ethical Fashion Initiative (4).jpg
VALUE CHAIN ROADMAP PLAN OF ACTION

[ KENYA TEXTILE AND CLOTHING VALUE CHAIN ROADMAP ]
50
Stra
tegi
c ob
ject
ive
1 : M
axim
ize p
rodu
ctiv
ity a
nd u
phol
d qu
ality
requ
irem
ents
thro
ugh
skill
s de
velo
pmen
t.Op
erat
iona
l obj
ectiv
eAc
tivitie
sPr
iorit
y1=
high
3=
low
Impl
emen
tatio
n pe
riod
Targ
et m
easu
res
Lead
ing
natio
nal in
stitu
tion
and
poss
ible
impl
emen
ting
partn
ers
Ongo
ing /
futu
re d
evelo
pmen
t pr
ogra
mm
es +
inte
rnat
iona
l par
tner
s15
1617
1819
1.1
Stren
gthe
n se
ctor
coor
dina
tion
to su
ppor
t sk
ills d
evelo
pmen
t.
1.1.
1 Se
t up
a sec
tor-s
pecif
ic ap
ex b
ody t
o rep
resen
t the
inter
ests
of al
l ind
ustry
stak
ehol
ders.
The b
ody s
houl
d co
mpr
ise re
pres
entat
ives f
rom
:
• M
oIED
and
Mini
stry o
f Edu
catio
n, S
cienc
e and
Tech
nolo
gy (M
oEST
)
• EP
C, K
enInv
est,E
PZA,
Fibre
Crop
s Dire
ctorat
e (Ag
ricul
ture,
Fish
eries
an
d Fo
od A
utho
rity)
• KA
M, K
AMEA
, KNC
CI, A
ssoc
iatio
n of
Fas
hion
Desig
ners
– Ke
nya
(AFA
D (K
), W
EAM
ACO,
Keny
an N
ation
al Fa
rmer
s’ Fe
derat
ion
• Re
pres
entat
ives o
f lea
d fir
ms /
forei
gn b
uyer
s
• KT
TI, N
ation
al Ind
ustri
al Tra
ining
Aut
horit
y (NI
TA),
Tech
nical
and
Voca
tiona
l Edu
catio
n an
d Tra
ining
Aut
horit
y (TV
ETA)
, Tec
hnica
l sc
hool
s, Un
iversi
ties (
relev
ant t
echn
ical s
ectio
ns)K
enya
Indu
strial
Es
tates
Ltd
• Lo
gisti
cs co
mpa
nies
• Fin
ancia
l ins
titut
ions
• Tra
de &
priv
ate se
ctor d
onor
gro
ups
The f
ollo
wing
Gov
ernm
ent b
odies
can
be cl
ubbe
d to
geth
er : E
PZA,
EPC
, Fib
re Cr
ops D
irecto
rate,
MoE
ST, K
TT, N
ITA, K
eninv
es, M
oIED,
Ken
ya
Indus
trial
Estat
es Lt
d, TV
ETA.
A co
mm
ittee
form
ed fo
r im
plem
entat
ion
of th
e Cen
tre o
f Exc
ellen
ce
is a s
imila
r bod
y whic
h ca
n be
use
d as
a Im
plem
entat
ion
point
for t
he
apex
bod
y. Th
e ape
x bod
y will
be a
pub
lic–p
rivate
par
tner
ship
chair
ed
by M
oIED
and
co-c
haire
d by
the p
rivate
secto
r, an
d it
will
work
with
the
proj
ect i
mpl
emen
tatio
n tea
m u
nder
the C
hair.
The a
pex b
ody w
ill b
e star
ted as
a pu
blic-
priva
te pa
rtner
ship
, with
the
secr
etaria
t und
er th
e priv
ate se
ctor (
KAM
) and
the c
hair
publ
ic / c
o-ch
air p
rivate
. The
re wi
ll be
two
peop
le fro
m ea
ch in
dustr
y lev
el / s
ub-
secto
r – no
t mor
e tha
n 11
-13
mem
bers.
1X Q4
• Ap
ex b
ody i
s crea
ted•
Gove
rnan
ce, r
ules
of p
roce
dure
and
term
s of r
eferen
ce d
efine
d
KAM
/ Int
erna
tiona
l Fun
d fo
r Agr
i-cu
ltural
Dev
elopm
ent,
with
supp
ort
from
MoIE
D, re
gion
al su
ppor
t fro
m
ACTIF

[ VALUE CHAIN ROADMAP PLAN OF ACTION ]
51
Stra
tegi
c ob
ject
ive
1 : M
axim
ize p
rodu
ctiv
ity a
nd u
phol
d qu
ality
requ
irem
ents
thro
ugh
skill
s de
velo
pmen
t.Op
erat
iona
l obj
ectiv
eAc
tivitie
sPr
iorit
y1=
high
3=
low
Impl
emen
tatio
n pe
riod
Targ
et m
easu
res
Lead
ing
natio
nal in
stitu
tion
and
poss
ible
impl
emen
ting
partn
ers
Ongo
ing /
futu
re d
evelo
pmen
t pr
ogra
mm
es +
inte
rnat
iona
l par
tner
s15
1617
1819
1.1
Stren
gthe
n se
ctor
coor
dina
tion
to su
ppor
t sk
ills d
evelo
pmen
t.
The i
nstit
utio
ns fr
om w
hich
the p
artic
ipan
ts or
igina
te m
ust b
e will
ing to
sh
are th
e cos
ts.Fu
nding
requ
ired
for m
eetin
g fac
ilitie
s, su
ppor
ted b
y mem
bers.
Resp
onsib
ilitie
s of t
he ap
ex b
ody w
ill th
e fol
lowi
ng :
1. S
treng
then
inter
actio
n be
twee
n th
e ind
ustry
, aca
dem
ia, re
searc
h ins
titut
ions
and
publ
ic ins
titut
ions
.2.
Fac
ilitat
e the
iden
tifica
tion
of sk
ills g
ap u
sing
Traini
ng N
eeds
An
alysis
(TNA
)3.
3Su
ppor
t the
restr
uctu
ring
and
align
men
t of a
ll th
e trai
ning
instit
utes
/ u
niver
sity c
urric
ula a
nd re
porti
ng to
a sin
gle m
inistr
y :a.
Restr
uctu
ring
and
align
men
t of a
ll th
e trai
ning
instit
utes
/ univ
ersit
y cur
ricul
a for
them
to re
port
to a
singl
e m
inistr
y sho
uld
then
be a
dvoc
ated
base
d on
the r
esul
ts of
the
study
.4.
Esta
blish
a se
ctor t
hink t
ank w
hose
role
will
inclu
de se
ctor-s
pecif
ic pu
blica
tions
and
prod
uctio
n of
whit
e pap
ers.
5. C
ost o
f doi
ng b
usine
ss :
a. Tra
ining
levy
b. W
ork p
erm
itsc.
Elec
tricit
y pric
ingd.
Crea
tion
of a
secto
r-spe
cific
fund
.6.
Eas
e of d
oing
bus
iness
:a.
Influ
encin
g po
licies
that
affec
t the
secto
rb.
Tran
spor
tatio
n se
rvice
sc.
Restr
uctu
ring
of tr
aining
insti
tutio
ns.
7. P
rom
otio
n of
Ken
yan
T&C
prod
ucts :
a. Pu
blic
proc
urem
ent
b. ‘B
uy K
enya
, Buil
d Ke
nya’.
8. R
eview
of s
ecto
r-spe
cific
gove
rnm
ental
bud
gets.
9. D
issem
inatio
n an
d pr
omot
ion
of co
mpe
titive
intel
ligen
ce.
Build
the a
pex b
ody’s
capa
cities
:
• To
ensu
re eff
ectiv
e set
up an
d op
erati
on•
To ac
quire
the r
equir
ed co
nven
ing an
d ad
voca
cy p
ower
to in
fluen
ce
secto
r-rela
ted p
olici
es•
To ra
ise an
d m
obili
ze d
irect
publ
ic an
d do
nor a
ssist
ance
towa
rds t
he
secto
r’s p
riorit
ies.

[ KENYA TEXTILE AND CLOTHING VALUE CHAIN ROADMAP ]
52
Stra
tegi
c ob
ject
ive
1 : M
axim
ize p
rodu
ctiv
ity a
nd u
phol
d qu
ality
requ
irem
ents
thro
ugh
skill
s de
velo
pmen
t.Op
erat
iona
l obj
ectiv
eAc
tivitie
sPr
iorit
y1=
high
3=
low
Impl
emen
tatio
n pe
riod
Targ
et m
easu
res
Lead
ing
natio
nal in
stitu
tion
and
poss
ible
impl
emen
ting
partn
ers
Ongo
ing /
futu
re d
evelo
pmen
t pr
ogra
mm
es +
inte
rnat
iona
l par
tner
s15
1617
1819
1.1
Stren
gthe
n se
ctor
coor
dina
tion
to su
ppor
t sk
ills d
evelo
pmen
t.
1.1.
2 Th
e ape
x bod
y coo
rdina
tes a
skill
gap
and
need
s ass
essm
ent
study
cove
ring
the e
ntire
valu
e cha
in, fr
om w
orke
rs up
to m
anag
ers,
and
deve
lops
cour
se cu
rricu
la, as
sess
men
t stan
dard
s and
infra
struc
ture
requir
emen
ts fo
r trai
ning
prog
ramm
es, c
oord
inated
by M
oIED.
The s
kill g
ap as
sess
men
t mus
t be c
ondu
cted
with
cons
ider
ation
of i
n-ter
natio
nal s
tanda
rds a
nd th
roug
h be
nchm
arking
.
1X Q4
• Sk
ill g
ap as
sess
men
t stu
dy re
ports
ind
icatin
g sp
ecifi
c num
bers
to b
e tra
ined
for v
ariou
s acti
vities
• On
e cou
rse cu
rricu
lum
for e
ach
area,
asse
ssm
ent s
tanda
rds
for c
ertif
icatio
n ag
ency
and
iden
tifica
tion
of w
ays t
o tra
in ( o
n-jo
b, th
eory,
mixe
d )
Apex
bod
yInt
erna
tiona
l trai
ning
agen
cies s
uch
as
Waz
ir an
d Inf
rastru
cture
Leas
ing an
d Fin
ancia
l Ser
vices
( IL&
FS ) f
rom
Indi
a, reg
iona
l sup
port
from
ACT
IF, ad
ditio
nal
supp
ort f
rom
loca
l trai
ning
instit
utio
ns,
e.g. u
niver
sities
1.1.
3 W
ith th
e help
of r
esul
ts un
der 1
.1.2
, the
apex
bod
y play
s a le
ad-
ersh
ip ro
le in
the d
esig
n of
a fac
tory-
base
d pr
oduc
tivity
and
quali
ty en
hanc
emen
t pro
gram
me t
o im
prov
e pro
ducti
vity w
ithin
the e
xistin
g m
anuf
actu
ring
syste
m. T
he p
rogr
amm
e will
help
com
panie
s to
impl
e-m
ent l
ean
man
ufac
turin
g an
d ot
her t
echn
ique
s for
pro
ducti
vity a
nd
quali
ty im
prov
emen
t.Un
der t
he le
ader
ship
of M
oIED,
the a
pex b
ody m
obili
zes a
nd se
cures
res
ourc
es fo
r pro
gram
me i
mpl
emen
tatio
n an
d pu
ts in
plac
e the
pro
per
mec
hanis
m to
mon
itor a
nd au
dit i
ts ex
ecut
ion.
1X Q4
• Pr
oduc
tivity
and
quali
ty en
hanc
emen
t pro
gram
me r
eview
ed
and
valid
ated
• Re
sour
ces m
obili
zed
for t
he
prog
ramm
e•
Impl
emen
tatio
n m
anag
emen
t m
echa
nism
in p
lace
Apex
bod
yM
oIED
supp
orts
the i
nitiat
ive, r
e-gi
onal
supp
ort f
rom
ACT
IF
1.1.
4 Th
e ape
x bod
y buil
ds a
com
mon
pos
ition
on
key i
ssue
s affe
ct-ing
the s
ecto
r and
buil
ds th
e nec
essa
ry ad
voca
cy to
supp
ort r
equir
ed
polic
y or r
egul
ation
chan
ges,
e.g. :
• On
the
train
ing
levy :
Dev
elop
a pro
posa
l / wh
ite p
aper
on
how
to im
prov
e effi
cienc
y of t
he tr
aining
levy
, par
ticul
arly t
o red
efine
co
nditi
ons f
or ap
prov
al an
d tim
ing o
f reb
ates ;
defi
ne a
range
of
spec
ific t
rainin
g to
be c
overe
d by
the t
rainin
g lev
y ; an
d pr
epare
rec
omm
enda
tions
to N
ITA th
roug
h M
oIED.
• On
wor
k pe
rmits
: The
apex
bod
y : ( 1
) ide
ntifi
es a
range
of s
pecif
ic sk
ills n
ot av
ailab
le th
roug
h th
e Ken
ya la
bour
mark
et an
d pr
ovid
es
evid
ence
of t
he la
ck o
r abs
ence
of t
he sk
ill b
ase i
n Ke
nya ;
( 2 )
prep
ares a
reco
mm
ende
d lis
t of l
abou
r skil
ls th
at req
uire r
ecru
itmen
t of
expa
triate
s for
the s
ecto
rs ; (
3 ) th
roug
h M
oIED
nego
tiates
with
th
e Dep
artm
ent o
f Im
mig
ratio
n Se
rvice
s to
reduc
e the
cost
and
time
requir
ed to
issu
e wor
k per
mits
for t
he id
entif
ied sk
ills c
atego
ries.
• On
pub
lic p
rocu
rem
ent :
The a
pex b
ody,
toge
ther
with
MoIE
D an
d th
e Trea
sury,
draf
ts a p
ositi
on p
aper
on
the m
odali
ties o
f a p
ossib
le ‘B
uy K
enya
n’ pr
ogram
me.
• On
elec
tricit
y pr
icing
: The
apex
bod
y con
tribu
tes to
the
deve
lopm
ent o
f a su
itabl
e exit
strat
egy f
or th
e tem
porar
y elec
tricit
y su
bsid
y pro
gram
me.
1X Q4
• On
e whit
e pap
er o
n th
e trai
ning
levy
• Co
mm
on p
ositi
on o
n wo
rk pe
rmit
issue
pres
ented
to th
e Dep
artm
ent
of Im
mig
ratio
n Se
rvice
s•
One p
ositi
on p
aper
on
a ‘Bu
y Ke
nyan
’ pro
gram
me
• Ex
it str
ategy
for t
he te
mpo
rary
electr
icity
subs
idy p
rogr
amm
e dr
afted
Apex
bod
y, M
oIED
Wor
ld B
ank /
Glo
bal D
evelo
pmen
t Sol
u-tio
ns ( G
DS )
Trade
Mark
Eas
t Afri
ca ( T
MEA
), Ea
st Af
rica T
rade H
ub

[ VALUE CHAIN ROADMAP PLAN OF ACTION ]
53
Stra
tegi
c ob
ject
ive
1 : M
axim
ize p
rodu
ctiv
ity a
nd u
phol
d qu
ality
requ
irem
ents
thro
ugh
skill
s de
velo
pmen
t.Op
erat
iona
l obj
ectiv
eAc
tivitie
sPr
iorit
y1=
high
3=
low
Impl
emen
tatio
n pe
riod
Targ
et m
easu
res
Lead
ing
natio
nal in
stitu
tion
and
poss
ible
impl
emen
ting
partn
ers
Ongo
ing /
futu
re d
evelo
pmen
t pr
ogra
mm
es +
inte
rnat
iona
l par
tner
s15
1617
1819
1.2
Impr
ove t
echn
ical a
nd
supe
rviso
ry sk
ills a
s well
as
supp
ly ch
ain p
erfo
rman
ce.
1.2.
1 Ca
rry o
ut fa
ctory-
base
d tra
ining
s acr
oss t
he va
lue c
hain
to in
-cr
ease
tech
nical
and
supe
rviso
ry sk
ills o
f :
• Sh
ift w
orke
rs / m
achin
e ope
rator
s, fro
m sp
inning
up
to g
armen
ting
• Lin
e lea
ders
and
prod
uctio
n flo
w su
pervi
sors
• M
iddl
e man
ager
s•
Patte
rn m
aker
s and
com
puter
-aid
ed d
esig
n op
erato
rs•
Quali
ty ins
pecto
rs•
Lab
techn
ician
s•
Fash
ion
desig
ners
• M
ercha
ndize
rs•
Indus
trial
engi
neer
s.In
addi
tion,
for e
ach
of th
ese f
ields
, trai
n tra
iners
at co
mpa
ny an
d tra
in-ing
insti
tutio
n lev
el.
1X Q2
• Fiv
e tho
usan
d wo
rkers
traine
d pe
r yea
r•
At le
ast 3
00 em
ploy
ees t
raine
d pe
r yea
r und
er o
ther
categ
ories
( to
be re
fined
bas
ed o
n th
e skil
l gap
as
sess
men
t und
er ac
tivity
1.1
.2 )
• Ei
ghty
to o
ne h
undr
ed m
anag
ers
traine
d pe
r yea
r•
At le
ast t
wo tr
ainer
s trai
ned
per
categ
ory
KAM
, ape
x bod
y in
the l
ong
term
wi
th su
ppor
t fro
m N
ITA &
EPZ
AInt
erna
tiona
l trai
ning
agen
cies s
uch
as
Waz
ir an
d IL&
FS fr
om In
dia,
regio
nal
supp
ort f
rom
ACT
IF, U
NIDO
, The
Pro
-du
ctivit
y Cen
tre
1.2.
2 Su
ppor
t firm
s to
prov
ide a
syste
mati
c trai
ning /
indu
ction
pro
cess
fo
r new
ope
rator
s and
dev
elop
traini
ng m
anua
ls on
man
ufac
turin
g op
erati
ons –
pro
ducti
on, q
ualit
y, m
ainten
ance
and
hous
ekee
ping
– fo
r op
erato
rs.
1X Q2
• Tra
in 20
com
panie
s per
year
to
deve
lop
proc
ess a
nd tr
aining
m
anua
ls•
Traini
ng o
f trai
ners
unde
r an
exch
ange
pro
gram
me i
n on
e yea
r
Apex
bod
y in
the l
ong
term
, sup
-po
rt fro
m A
CTIF
Supp
ortin
g Ind
ian Tr
ade a
nd In
vestm
ent
in Af
rica (
SITA
) ( tb
c ), l
ocal
instit
utio
ns,
inclu
ding
BCa
D Co
nsul
ting
( Ken
ya
Mod
ular
Learn
ing S
ystem
– S
up-
ply C
hain
Man
agem
ent (
MLS
–SCM
) pa
rtner
) 1.
2.3
Prov
ide o
veral
l trai
ning
to fi
rms o
n so
urcin
g, fi
nanc
ial m
anag
e-m
ent a
nd su
pply
chain
opt
imiza
tion.
1X Q2
• Ei
ghty
to o
ne h
undr
ed co
mpa
ny
man
ager
s trai
ned
per y
ear
• At
leas
t 20
SMEs
advis
ed p
er ye
ar
Apex
bod
y in
the l
ong
term
, re-
gion
al su
ppor
t fro
m A
CTIF
SITA
( tbc
), Lo
cal i
nstit
utio
ns, i
nclu
ding
BC
aD C
onsu
lting
( Ken
ya M
LS–S
CM
partn
er )
1.2.
4 Co
ach
com
panie
s on
how
to p
ut in
to p
ractic
e the
mos
t suit
able
syste
ms a
nd p
roce
sses
for m
anag
ing o
perat
ions
and
inven
tory
( e.g
. so
urcin
g an
d pl
annin
g fo
r con
stant
avail
abili
ty of
inpu
ts us
ed in
pro
-du
ction
such
as ra
w m
ateria
ls, sp
are p
arts,
dye
s and
chem
icals )
.
1X Q3
• At
leas
t 30
com
panie
s and
20
SM
Es tr
ained
on
inven
tory
man
agem
ent p
er ye
ar :
• Fo
ur m
onth
s per
com
pany
, 10 %
red
uctio
n in
rejec
tions
/ rew
orks
an
d co
mpl
iance
with
buy
er’s
requir
emen
ts
KAM
, ape
x bod
y in
the l
ong
term
SITA
( tbc
), W
azir
Cons
ultan
ts, lo
cal
instit
utio
ns in
cludi
ng B
CaD
Cons
ultin
g ( K
enya
MLS
–SCM
par
tner
)
1.2.
5 Co
ach
com
panie
s to
impl
emen
t cos
t-effi
cient
and
buye
r-orie
nted
so
urcin
g str
ategi
es an
d tec
hniq
ues (
also
ensu
ring
that
respo
nsib
le sta
ff ha
ve fi
nanc
ial sk
ills r
elated
to p
urch
asing
inpu
ts an
d co
ordi
natin
g pr
oduc
tion
sche
dules
).
1X Q4
• At
leas
t 30
com
panie
s and
20
SMEs
train
ed in
sour
cing
strate
gy
impl
emen
tatio
n pe
r yea
r
KAM
, ape
x bod
y in
the l
ong
term
, reg
iona
l sup
port
from
ACT
IFSI
TA
1.2.
6 Tra
in m
anag
ers o
n th
e dev
elopm
ent o
f a co
mpa
ny su
bcul
ture
in th
eir fi
rms t
o ret
ain w
orke
rs’ in
teres
t in
caree
r dev
elopm
ent a
nd
impr
ove w
orkin
g co
nditi
ons.
Traini
ng to
mid
-leve
l man
ager
s will
also
fo
cus o
n pr
oper
floo
r man
agem
ent t
echn
ique
s and
requ
ired
soft
skill
s.De
velo
p a t
rainin
g au
dit m
odul
e to
help
secto
r stak
ehol
ders
iden
tify
spec
ific t
rainin
g ne
eds.
Intro
duce
a vo
lunt
ary tr
aining
audi
t sch
eme t
o he
lp m
anag
ers o
f tex
tile
and
garm
ent c
ompa
nies i
dent
ify an
d de
velo
p in-
hous
e trai
ning
pro-
gram
mes
.
1X Q3
• Ei
ghty
to o
ne h
undr
ed co
mpa
ny
man
ager
s trai
ned
per y
ear
• At
leas
t 20
SMEs
advis
ed p
er ye
ar
KAM
, ape
x bod
y in
the l
ong
term
, reg
iona
l sup
port
from
ACT
IF, M
oi
Unive
rsity
( up
to d
yeing
stag
e )

[ KENYA TEXTILE AND CLOTHING VALUE CHAIN ROADMAP ]
54
Stra
tegi
c ob
ject
ive
1 : M
axim
ize p
rodu
ctiv
ity a
nd u
phol
d qu
ality
requ
irem
ents
thro
ugh
skill
s de
velo
pmen
t.Op
erat
iona
l obj
ectiv
eAc
tivitie
sPr
iorit
y1=
high
3=
low
Impl
emen
tatio
n pe
riod
Targ
et m
easu
res
Lead
ing
natio
nal in
stitu
tion
and
poss
ible
impl
emen
ting
partn
ers
Ongo
ing /
futu
re d
evelo
pmen
t pr
ogra
mm
es +
inte
rnat
iona
l par
tner
s15
1617
1819
1.2
Impr
ove t
echn
ical a
nd
supe
rviso
ry sk
ills a
s well
as
supp
ly ch
ain p
erfo
rman
ce.
1.2.
7 Su
ppor
t SM
Es / l
ocal
firm
s’ int
egrat
ion
thro
ugh
lead
firm
en-
gage
men
ts : M
oIED
and
EPZA
wor
k with
forei
gn in
vesto
rs to
estab
lish
small
-sca
le tra
ining
/ men
torin
g pr
ogram
mes
for s
electe
d lo
cal f
irms t
o en
ter E
PZs t
hrou
gh th
eir C
SR b
udge
ts ( a
t bot
h th
e ope
rator
and
mid
-m
anag
emen
t lev
els ).
2X Q4
• At
leas
t fou
r men
torin
g pr
ogram
mes
per
year
( relat
ed to
1.
5.1 )
• At
leas
t 20
SMEs
advis
ed p
er ye
ar
KAM
, EPZ
A, ap
ex b
ody i
n th
e lon
g ter
m, r
egio
nal s
uppo
rt fro
m A
CTIF
1.2.
8 Th
e ape
x bod
y, in
colla
borat
ion
with
EPZ
A, w
orks
with
lead
fir
ms /
forei
gn b
uyer
s to
estab
lish
polic
ies an
d pr
oced
ures
for s
electe
d lo
cal f
irms t
o fo
llow.
Lead
firm
s dire
ctly e
ngag
e with
loca
l firm
s in
their
im
plem
entat
ion
thro
ugh
the e
xcha
nge o
f per
sonn
el be
twee
n fir
ms a
nd
thro
ugh
the d
evelo
pmen
t of n
etwor
k acti
vities
.Lin
ked
to ac
tivity
1.5
.2 re
lated
to E
BAP.
2X Q4
• At
leas
t five
exch
ange
s betw
een
loca
l firm
s and
lead
firm
s per
year
Apex
bod
y, in
colla
borat
ion
with
EP
ZA
1.3
Enha
nce q
ualit
y man
-ag
emen
t skil
ls in
line w
ith
inter
natio
nal s
tanda
rds.
1.3.
1 Or
ganis
e wor
ksho
ps an
d di
ssem
inate
guid
e boo
ks to
pro
mot
e th
e ado
ptio
n of
instr
umen
ts rel
ated
to q
ualit
y man
agem
ent s
ystem
s an
d sta
ndard
s (su
ch as
ECO
TEC,
Kaiz
en, I
nter
natio
nal O
rgan
izatio
n fo
r St
anda
rdiza
tion
(ISO)
, and
socia
l res
pons
ibili
ty an
d en
viron
men
tal /
energ
y stan
dard
s) an
d se
rvice
s in
supp
ort o
f ent
erpr
ises.
• Gu
ide:
‘Exp
ortin
g clo
thing
and
textil
es to
targ
et m
arkets
’•
Guid
e: ‘M
anag
ing q
ualit
y in
Keny
a: a d
irecto
ry of
servi
ces’
2X Q4
• Gu
ide :
‘Exp
ortin
g clo
thing
and
textil
es to
targ
et m
arkets
’ mad
e av
ailab
le•
Guid
e : ‘M
anag
ing q
ualit
y in
Keny
a : a
direc
tory
of se
rvice
s’ m
ade a
vaila
ble
KEBS
Keny
a Acc
redita
tion
Servi
ce, I
nsca
p Co
nsul
ting,
Ver
itas,
China
Cer
tifi-
catio
n an
d Ins
pecti
on G
roup
Afri
caRe
gion
al su
ppor
t fro
m A
CTIF
SITA
( tbc
)
1.3.
2 Co
nduc
t sen
sitiza
tion
works
hops
on
man
dato
ry an
d vo
lunt
ary re
-qu
irem
ents
in tar
geted
mark
ets ( I
ndia,
regi
on, E
U ) fo
r SM
Es an
d TIS
Is.
This
woul
d co
ver i
nter
natio
nal a
nd o
ther
requ
irem
ents,
buy
ers’
requir
e-m
ents,
labe
lling
, pac
kagi
ng, c
loth
ing si
ze, a
nd th
e Reg
istrat
ion,
Eva
lua-
tion,
Aut
horiz
ation
and
Restr
ictio
n of
Che
mica
ls ( R
EACH
) reg
ulati
on :
• Br
eako
ut se
ssio
ns to
iden
tify t
he q
ualit
y-rel
ated
need
s of
parti
cipati
ng S
MEs
( and
TISI
s ) ;
• Ide
ntifi
catio
n of
a wa
y for
ward
for a
poo
l of e
nter
prise
s ( IS
O 90
01,
ISO
1400
1, IS
O 50
001,
pro
ducti
vity i
mpr
ovem
ent,
5S, b
asic
quali
ty to
ols,
lean
man
ufac
turin
g, p
acka
ging
, lab
elling
) ;•
Ident
ifica
tion
of a
way f
orwa
rd fo
r TIS
Is ( la
bs, c
ertif
icatio
n bo
dies
, ins
pecti
on b
odies
, con
sulta
ncy c
ompa
nies )
.
2X Q2
• Tw
enty
SMEs
sens
itize
d on
m
anda
tory
and
volu
ntary
req
uirem
ents
in tar
geted
mark
ets•
Ten
TISIs
sens
itize
d on
man
dato
ry an
d vo
lunt
ary re
quire
men
ts in
targe
ted m
arkets
KEBS
, reg
iona
l sup
port
from
AC-
TIF, E
PZA
SITA
1.3.
3 Co
nduc
t cap
acity
-buil
ding
for a
poo
l of s
electe
d SM
Es to
com
ply
with
man
dato
ry an
d vo
lunt
ary re
quire
men
ts an
d im
plem
ent r
equir
ed
certi
ficati
on sc
hem
es ( I
SO 9
001,
ISO
1400
1, IS
O 50
001,
pro
ducti
vity
impr
ovem
ent,
5S, b
asic
quali
ty to
ols,
lean
man
ufac
turin
g, p
acka
ging
, lab
elling
).
2X Q2
• Tw
enty
SMEs
coac
hed
to
impl
emen
t app
ropr
iate c
ertif
icatio
n sc
hem
es an
d m
anag
emen
t too
ls•
Traini
ng m
ateria
ls av
ailab
le
KEBS
, KAM
1.3.
4 Tra
ining
on
unde
rstan
ding
, and
guid
ance
on
impl
emen
tatio
n of,
th
e REA
CH re
gulat
ion.
2X Q2
• Ei
ghty
to o
ne h
undr
ed co
mpa
ny
man
ager
s trai
ned
per y
ear
• At
leas
t 20
SMEs
advis
ed p
er ye
ar an
d 10
relev
ant r
egul
atory
bodi
es•
Road
map
to im
plem
ent R
EACH
reg
ulati
on
EPZA
, UNI
DO, K
EBS

[ VALUE CHAIN ROADMAP PLAN OF ACTION ]
55
Stra
tegi
c ob
ject
ive
1 : M
axim
ize p
rodu
ctiv
ity a
nd u
phol
d qu
ality
requ
irem
ents
thro
ugh
skill
s de
velo
pmen
t.Op
erat
iona
l obj
ectiv
eAc
tivitie
sPr
iorit
y1=
high
3=
low
Impl
emen
tatio
n pe
riod
Targ
et m
easu
res
Lead
ing
natio
nal in
stitu
tion
and
poss
ible
impl
emen
ting
partn
ers
Ongo
ing /
futu
re d
evelo
pmen
t pr
ogra
mm
es +
inte
rnat
iona
l par
tner
s15
1617
1819
1.3
Enha
nce q
ualit
y man
-ag
emen
t skil
ls in
line w
ith
inter
natio
nal s
tanda
rds.
1.3.
5 Pr
omot
e and
facil
itate
the c
reatio
n of
loca
l con
sulti
ng fi
rms a
nd
busin
ess s
ervic
es o
f int
erna
tiona
l con
sulti
ng fi
rms t
o pr
ovid
e ass
is-tan
ce an
d eff
ectiv
e bus
iness
supp
ort t
o T&
C co
mpa
nies.
This
can
be
done
thro
ugh
the f
ollo
wing
:
• Re
ach
out t
o th
e key
play
ers i
n th
e con
sulti
ng in
dustr
y to
bring
them
int
o Ke
nya
• Bu
ild ca
pacit
y of i
dent
ified
relev
ant e
xistin
g co
nsul
ting
firm
s in
Keny
a•
Help
KEB
S to
exten
d th
eir re
ach
of ce
rtific
ation
amon
g Ke
nyan
firm
s an
d pr
omot
e the
adva
ntag
es o
f cer
tifica
tion.
2X Q4
• Bu
sines
s ser
vices
and
a poo
l of
loca
l adv
isers
in th
e area
of
quali
ty ( IS
O 90
01, I
SO 1
4001
, ISO
50
001,
5S,
qua
lity t
ools )
• Su
ppor
t pro
vided
to tw
o co
nsul
ting
firm
s
KAM
1.4
Deve
lop
spec
ific s
kills
for t
he h
andl
oom
subs
ecto
r, fo
r des
igne
rs as
well
as fo
r M
SMEs
.
1.4.
1 St
rengt
hen
selec
ted H
andl
oom
Wea
vers’
Mark
eting
Coo
pera-
tive S
ociet
y ( W
EAM
ACO )
capa
cities
to p
rovid
e ade
quate
supp
ort t
o its
mem
bers
and
tie th
e ass
ociat
ion
to M
oIED,
ACT
IF an
d KA
M. C
arry
out a
n ins
titut
iona
l ass
essm
ent t
o im
prov
e WEA
MAC
O pe
rform
ance
by
mea
surin
g th
e effe
ctive
ness
and
effici
ency
of t
heir
busin
ess p
ractic
es.
The a
sses
smen
t sho
uld
surve
y all
activ
ity ar
eas i
nclu
ding
strat
egy a
nd
gove
rnan
ce, r
esou
rces
and
proc
esse
s, pr
oduc
ts an
d se
rvice
s, an
d re-
sults
mea
surem
ent.
Supp
ort W
EAM
ACO
and
the n
ewly
crea
ted h
andl
oom
asso
ciatio
n to
de
mon
strate
the p
oten
tial o
f the
han
dloo
m se
ctor f
or jo
b cr
eatio
n an
d inc
ome g
ener
ation
:
• Or
ganiz
e a st
udy t
our t
o Ind
ia fo
r WEA
MAC
O an
d th
e new
ly cr
eated
ha
ndlo
om as
socia
tion
to u
nder
stand
the v
ast p
oten
tial o
f han
dloo
m
weav
ing an
d th
e pos
sibili
ty to
ope
rate a
s a la
rge m
anuf
actu
ring
unit ;
• Lin
k MSM
Es in
WEA
MAC
O an
d th
e han
dloo
m as
socia
tion
with
ed
ucati
onal
instit
utio
ns an
d TIS
Is, et
c. to
allo
w th
em to
ben
efit f
rom
sim
ilar o
ppor
tunit
ies an
d ac
cess
as th
e T&C
secto
rs in
areas
such
as
resea
rch,
mark
et int
ellig
ence
, fina
ncial
supp
ort,
traini
ng et
c. ;
• Fa
cilita
te inf
orm
ation
exch
ange
betw
een
key a
ctors
in th
e T&C
se
ctor a
nd W
EAM
ACO
and
the n
ewly
crea
ted h
andl
oom
asso
ciatio
n to
share
skill
s and
know
-how
ben
eficia
l to
both
;•
Stren
gthe
n W
EAM
ACO
and
the n
ewly
crea
ted h
andl
oom
asso
ciatio
n in
sour
cing
prac
tices
, mark
et id
entif
icatio
n an
d m
arket
acce
ss ;
• Ad
voca
te fo
r pol
icy su
ppor
t / inc
entiv
es, e
.g. s
uppo
rt in
sour
cing
of
input
s .En
sure
the n
eeds
of t
he h
andl
oom
secto
r are
duly
cons
idere
d an
d re-
flecte
d in
T&C
deve
lopm
ent s
trateg
ies.
2X Q3
• M
embe
rs su
rveye
d an
d rep
ort o
n im
prov
emen
t in
quali
ty of
supp
ort
prov
ided
• Be
nchm
arking
repo
rt pr
oduc
ed
and
valid
ated
by TI
SIs
• Ins
titut
ion
repor
t on
perfo
rman
ce
impr
ovem
ent t
hrou
gh su
rvey
ques
tionn
aires
• A
20 %
impr
ovem
ent i
n be
nchm
arking
scor
e by t
he en
d of
th
e pro
ject
• On
e stu
dy to
ur to
Indi
a of b
oth
TISIs’
key r
epres
entat
ives
• Bo
th TI
SIs c
ollab
orate
clos
ely w
ith
traini
ng in
stitu
tions
• At
leas
t two
train
ings t
o bo
th TI
SIs’
perso
nnel
on so
urcin
g
Apex
bod
y WEA
MAC
O, n
ewly
crea
ted h
andl
oom
asso
ciatio
n, re
-gi
onal
supp
ort f
rom
ACT
IF
SITA
+ an
Indi
an co
nsul
ting
firm
such
as
Waz
ir ( c
oord
inatio
n wi
th In
dian
par
t-ne
rs ),
NIFT
, NID
, IIH
T

[ KENYA TEXTILE AND CLOTHING VALUE CHAIN ROADMAP ]
56
Stra
tegi
c ob
ject
ive
1 : M
axim
ize p
rodu
ctiv
ity a
nd u
phol
d qu
ality
requ
irem
ents
thro
ugh
skill
s de
velo
pmen
t.Op
erat
iona
l obj
ectiv
eAc
tivitie
sPr
iorit
y1=
high
3=
low
Impl
emen
tatio
n pe
riod
Targ
et m
easu
res
Lead
ing
natio
nal in
stitu
tion
and
poss
ible
impl
emen
ting
partn
ers
Ongo
ing /
futu
re d
evelo
pmen
t pr
ogra
mm
es +
inte
rnat
iona
l par
tner
s15
1617
1819
1.4
Deve
lop
spec
ific s
kills
for t
he h
andl
oom
subs
ecto
r, fo
r des
igne
rs as
well
as fo
r M
SMEs
.
1.4.
2 Or
ganiz
e skil
ls up
grad
ing tr
aining
in In
dia f
or se
lected
Ken
yan
weav
ers :
• Es
tablis
h a l
ink b
etwee
n ha
ndlo
om p
rodu
cers
and
Indian
train
ing
instit
utio
ns ( p
ossib
ly wi
th th
e Nati
onal
Instit
ute o
f Fas
hion
Tech
nolo
gy ( N
IFT ),
Natio
nal I
nstit
ute o
f Des
ign
( NID
), Ind
ian
Instit
ute o
f Hard
ware
Tech
nolo
gy ( I
IHT )
, etc.
) for
wea
vers
to le
arn
vario
us w
eavin
g tec
hniq
ues,
ing ( s
cree
n / bl
ock p
rintin
g ),
jacqu
ard / d
obby
wea
ving,
prep
aratio
n an
d us
e of n
atural
dye
s etc.
;•
Repl
icate
/ ado
pt th
e Ind
ian in
terns
hip p
rogr
amm
e, be
aring
in m
ind
the l
ocal
scen
ario.
Cond
uct t
rainin
g in
the f
ollo
wing
addi
tiona
l area
s :
• Sa
les an
d m
arketi
ng ;
• Tre
nd re
searc
h –
colo
urs,
shap
es, e
tc. ;
• Tra
in th
e trai
ners
prog
ramm
e : tr
aining
pro
duce
rs fro
m th
e co
mm
unity
leve
l on
spinn
ing, w
eavin
g an
d dy
eing
techn
ique
s ;•
Trans
late t
rends
into
uniq
ue / m
arketa
ble p
rodu
ct ite
ms.
2X Q4
• At
leas
t 20
hand
loom
firm
s ad
vised
per
year
• At
leas
t thr
ee li
nkag
es es
tablis
hed
with
Indi
an p
artn
er tr
aining
ins
titut
ions
• Int
erns
hip sy
stem
put
in p
lace a
nd
func
tionin
g
Apex
bod
y, ne
wly f
orm
ed h
an-
dloo
m as
socia
tion,
WEA
MAC
O,
regio
nal s
uppo
rt fro
m A
CTIF
India
base
d co
nsul
tants,
SC–
Waz
ir ( c
oord
inatio
n wi
th In
dian
par
tner
s ),
NIFT
, NID
, IIH
T
1.4.
3 De
velo
p co
oper
ation
with
the O
ffice
of t
he D
evelo
pmen
t Com
-m
issio
ner f
or H
andl
oom
s at t
he In
dian
Mini
stry o
f Tex
tiles
to d
evelo
p a n
ation
al ha
ndlo
om d
evelo
pmen
t pro
gram
me f
or K
enya
. Sim
ilarly
to
the I
ndian
Nati
onal
Hand
loom
Pro
gram
me,
the K
enya
n sc
hem
e sho
uld
merg
e all
majo
r com
pone
nts,
nam
ely: t
he In
tegrat
ed H
andl
oom
s Dev
el-op
men
t Sch
eme,
Mark
eting
and
Expo
rt Pr
omot
ion
Sche
me a
nd D
iversi
-fie
d Ha
ndlo
om D
evelo
pmen
t Sch
eme.
1X Q4
• Na
tiona
l han
dloo
m d
evelo
pmen
t pr
ogram
me d
evelo
ped
Apex
bod
y WEA
MAC
O, n
ewly
cre-
ated
hand
loom
asso
ciatio
nInd
ia ba
sed
cons
ultan
ts, S
C–W
azir
( coo
rdina
tion
with
Indi
an p
artn
ers )
, reg
iona
l sup
port
from
ACT
IF
1.4.
4 De
velo
p tai
lor-m
ade o
n-sit
e trai
nings
to in
crea
se th
e cap
acity
an
d pr
oduc
tivity
of t
he M
SMEs
in th
e han
dloo
m se
ctor.
Traini
ngs w
ill
inclu
de en
terpr
ises i
n th
e inf
orm
al se
ctor t
o d
rive t
he tr
ansit
ion
to th
e fo
rmal
econ
omy.
1X Q2
• In
line w
ith ac
tivity
1.1
.2, M
SME
skill
gap
asse
ssm
ent c
arried
out
• At
leas
t 20
SMEs
advis
ed p
er ye
ar
AFAD
( K )
MSE
A, re
gion
al su
ppor
t fro
m A
CTIF
India
base
d co
nsul
tants,
SC–
Waz
ir ( c
o-or
dina
tion
with
Indi
an p
artn
ers )
1.4.
5 Tra
in M
SMEs
own
ers a
nd m
anag
ers o
n m
anag
emen
t skil
ls th
at ca
n be
of i
mm
ediat
e use
and
are re
levan
t to
their
scale
of o
perat
ions
.1
X Q2•
At le
ast 2
0 SM
Es ad
vised
per
year
MSE
A, re
gion
al su
ppor
t fro
m A
CTIF
1.4.
6 Up
grad
e pro
ducti
on te
chno
logy
and
equip
men
t for
selec
ted
MSM
Es th
roug
h th
e ado
ptio
n of
spec
ific t
echn
olog
y stra
tegic
plan
s, co
nsid
ering
the s
pecif
icitie
s of t
he p
rodu
ction
unit
s and
their
resp
ectiv
e pr
oduc
t ran
ge an
d pr
oduc
t dive
rsific
ation
pot
entia
l.Pr
ovid
e sup
port
to th
ese s
electe
d en
terpr
ises t
o ge
t qua
lity a
nd m
an-
agem
ent c
ertif
icatio
ns (I
SO).
1X Q4
• At
leas
t sev
en S
MEs
advis
ed
per y
ear a
nd te
chno
logy
plan
s de
velo
ped
• At
leas
t sev
en S
MEs
supp
orted
th
roug
h ce
rtific
ation
pro
cess
New
hand
loom
asso
ciatio
n, M
SEA,
reg
iona
l sup
port
from
ACT
IF

[ VALUE CHAIN ROADMAP PLAN OF ACTION ]
57
Stra
tegi
c ob
ject
ive
1 : M
axim
ize p
rodu
ctiv
ity a
nd u
phol
d qu
ality
requ
irem
ents
thro
ugh
skill
s de
velo
pmen
t.Op
erat
iona
l obj
ectiv
eAc
tivitie
sPr
iorit
y1=
high
3=
low
Impl
emen
tatio
n pe
riod
Targ
et m
easu
res
Lead
ing
natio
nal in
stitu
tion
and
poss
ible
impl
emen
ting
partn
ers
Ongo
ing /
futu
re d
evelo
pmen
t pr
ogra
mm
es +
inte
rnat
iona
l par
tner
s15
1617
1819
1.4
Deve
lop
spec
ific s
kills
for t
he h
andl
oom
subs
ecto
r, fo
r des
igne
rs as
well
as fo
r M
SMEs
.
1.4.
7 Es
tablis
h an
d eq
uip a
pilo
t sha
red p
rodu
ction
facil
ity g
roup
ing
small
des
igne
rs fo
r the
m to
share
costs
and
bene
fit fr
om co
mm
on
equip
men
t. Co
nnec
t and
par
tner
with
loca
l and
forei
gn cl
othin
g m
anu-
factu
rers w
here
poss
ible
( e.g
. Riva
tex an
d ot
hers
).Es
tablis
h co
nnec
tions
with
the l
ocal
and
regio
nal m
arkets
.Pr
ovid
e cap
acity
-buil
ding
to d
esig
ners
relate
d to
clot
hing
desig
n, ta
i-lo
ring
and
cutti
ng, i
dent
ifica
tion
of in
puts,
and
prod
uct m
arketi
ng. E
s-tab
lish
linka
ges,
exch
ange
pro
gram
mes
and
expo
sure
studi
es b
etwee
n Ke
nyan
and
Indian
des
igne
rs.On
succ
essfu
l rol
l out
of t
he p
ilot,
sprea
d to
regi
ons w
here
there
is a
conc
entra
tion
of sm
all d
esig
ners’
wor
ksho
ps.
1X Q1
• At
leas
t one
pro
ducti
on fa
cility
es
tablis
hed
over
the f
ive-y
ear
perio
d, g
roup
ing 1
00 d
esig
ners
• At
leas
t 100
des
igne
rs tra
ined
per y
ear
• At
leas
t thr
ee ex
chan
ge
prog
ramm
es ca
rried
out
New
hand
loom
asso
ciatio
n, A
FAD
( K ),
MSE
A, re
gion
al su
ppor
t fro
m A
C-TIF
, Equ
ity B
ank
1.4.
8 Le
ad a
sens
itiza
tion
cam
paig
n an
d tra
ining
to h
andl
oom
pro
duc-
ers a
nd d
esig
ners
on in
tellec
tual
prop
erty.
Pub
lic se
ctor o
ffice
rs are
als
o to
atten
d th
ese t
rainin
gs.
1X Q4
• At
leas
t 20
hand
loom
firm
s and
10
0 de
signe
rs ad
vised
per
year
New
hand
loom
asso
ciatio
n, A
FAD
( K )
MSE
A, re
gion
al su
ppor
t fro
m
ACTIF
, Ken
ya In
dustr
ial P
rope
rty
Instit
ute,
Moi
Univ
ersit
y1.
5 Im
prov
e exis
ting
train-
ing an
d ed
ucati
onal
offer
-ing
s in
line w
ith in
dustr
y ne
eds.
1.5.
1 Se
t up
a reg
iona
l trai
ning
cent
re of
exce
llenc
e for
T&C
in th
e EP
Zs, w
here
loca
l tex
tile p
rodu
cers
coul
d tra
in m
iddl
e & u
pper
leve
l m
anag
emen
t on
new
techn
olog
y, fac
tor p
ricing
, qua
lity c
ontro
l and
lab
our p
rodu
ctivit
y.Inc
lude
the f
ull c
hain.
Led
by an
d lin
ked
with
the a
pex b
ody.
Conn
ec-
tion
with
NIFT
on
the c
apac
itatio
n of
the c
entre
of e
xcell
ence
.
1X Q1
• At
leas
t fou
r cen
tres o
f exc
ellen
ce
estab
lishe
d•
At le
ast t
wo M
oUs s
igne
d wi
th
NIFT
Apex
bod
y, EP
ZA, r
egio
nal s
uppo
rt fro
m A
CTIF
EPZA
has
star
ted o
n es
tablis
hing
a re-
gion
al ce
ntre
( Ath
i Rive
r ) of
exce
llenc
e
1.5.
2 Re
view
and
enha
nce E
BAP
to ac
celer
ate th
e gro
wth
of o
perat
iona
l SM
E ex
porte
rs de
siring
to se
t up
unde
r the
EPZ
pro
gram
me:
• Re
view
and
clarif
y the
selec
tion
of fi
rms t
o be
nefit
from
EBA
P•
Stren
gthe
n co
mm
unica
tion
of E
BAP
to en
sure
good
out
reach
and
appl
icatio
ns b
y SM
Es fo
r the
pro
gram
me.
1X Q1
• At
leas
t fou
r new
EBA
Ps
estab
lishe
dEP
ZA, r
egio
nal s
uppo
rt fro
m A
CTIF
1.5.
3 Re
infor
ce ex
isting
TVET
( rela
ted to
stud
y in
1.1.
2. ) o
fferin
g an
d rev
ive th
e offe
r of t
he K
TTI a
s well
as o
ther
relev
ant i
nstit
utio
ns,
targe
ting
both
texti
le an
d clo
thing
com
panie
s. Sp
ecifi
c tec
hnica
l area
s req
uiring
skill
reinf
orce
men
t are
:
• Sp
inning
ope
ratio
ns fo
r ring
spinn
ing, o
pen
end
and
airjet
• W
eavin
g an
d we
aving
prep
arato
ry op
erati
ons f
or m
ajor s
huttl
eless
tec
hnol
ogies
– ai
rjet a
nd ra
pier
• Kn
itting
ope
ratio
ns•
Fibre
/ yarn
/ fab
ric d
yeing
, prin
ting
and
finish
ing p
roce
sses
• Ga
rmen
t man
ufac
turin
g op
erati
ons
• 3G
Tailo
r Trai
ning
Syste
m an
d ot
her m
oder
n int
erna
l trai
ning
techn
ique
s•
Fash
ion
desig
n•
List o
f skil
ls to
be c
ompl
eted
base
d on
the a
sses
smen
t stu
dy.
1X Q4
• At
leas
t one
new
cour
se cr
eated
an
d av
ailab
le in
each
field
with
in th
e five
-yea
r per
iod
• Si
gned
MoU
with
one
Indi
an
instit
ute
• Th
ree to
four
mon
ths f
or
coor
dina
tion
with
Indi
an in
stitu
tes•
At le
ast t
wo TV
ET in
stitu
tions
tra
ined
on la
test p
edag
ogica
l tec
hniq
ues p
er ye
ar•
At le
ast t
wo TV
ET in
stitu
tions
tra
ined
on la
test t
echn
ical
deve
lopm
ents
in th
e sec
tor
Apex
bod
y, KT
TI, E
PZA
SITA
( tbc
) , In
dian
texti
le res
earc
h as
socia
tions
( Nor
ther
n Ind
ia Te
xtile
Rese
arch
Asso
ciatio
n, S
outh
Indi
a Tex
-til
e Res
earc
h As
socia
tion,
Ahm
edab
ad
Texti
le Ind
ustry
’s Re
searc
h As
socia
-tio
n, et
c. )
Inter
natio
nal t
rainin
g ag
encie
s suc
h as
W
azir
and
IL&FS
from
Indi
a

[ KENYA TEXTILE AND CLOTHING VALUE CHAIN ROADMAP ]
58
Stra
tegi
c ob
ject
ive
1 : M
axim
ize p
rodu
ctiv
ity a
nd u
phol
d qu
ality
requ
irem
ents
thro
ugh
skill
s de
velo
pmen
t.Op
erat
iona
l obj
ectiv
eAc
tivitie
sPr
iorit
y1=
high
3=
low
Impl
emen
tatio
n pe
riod
Targ
et m
easu
res
Lead
ing
natio
nal in
stitu
tion
and
poss
ible
impl
emen
ting
partn
ers
Ongo
ing /
futu
re d
evelo
pmen
t pr
ogra
mm
es +
inte
rnat
iona
l par
tner
s15
1617
1819
1.5
Impr
ove e
xistin
g tra
in-ing
and
educ
ation
al of
fer-
ings i
n lin
e with
indu
stry
need
s.
(1.5
.3) I
n ea
ch o
f the
se ar
eas,
reinf
orce
train
ing in
stitu
tions
’ cap
acity
an
d cr
eate
highl
y spe
cific
and
shor
t-ter
m co
urse
s ( on
e to
three
wee
ks ),
adap
ted to
tim
e con
strain
ts of
empl
oyee
s. Fo
r mor
e spe
cializ
ed tr
ain-
ing, a
hig
her p
erio
d of
four
to si
x wee
ks m
ay b
e req
uired
. The
tim
eline
sh
ould
be d
ecid
ed w
hile d
evelo
ping
the c
ourse
s. Th
is ac
tivity
is li
nked
wi
th ac
tivity
1.1
.3 as
capa
city-
build
ing an
d co
urse
s will
be d
esig
ned
base
d on
the r
esul
ts of
the s
kill g
ap st
udy a
nd re
lated
curri
cula.
Reinf
orce
KTT
I’s ca
pacit
ies :
1. In
the l
atest
inter
natio
nal b
est p
ractic
e and
tech
nolo
gy av
ailab
le to
th
e sec
tor t
o en
sure
up-to
-date
capa
city-
build
ing p
rovis
ions
;2.
In th
e late
st tra
ining
prac
tices
and
tool
s ;3.
To
estab
lish
prof
essio
nal s
tanda
rds,
job
prof
iles,
quali
ficati
ons a
nd
certi
ficati
ons ;
4. T
o fac
ilitat
e tran
sfer o
f kno
w-ho
w fro
m In
dian
insti
tutio
ns to
dev
elop
voca
tiona
l trai
ning
prog
ramm
es.
1X Q4
• At
leas
t one
new
cour
se cr
eated
an
d av
ailab
le in
each
field
with
in th
e five
-yea
r per
iod
• Si
gned
MoU
with
one
Indi
an
instit
ute
• Th
ree to
four
mon
ths f
or
coor
dina
tion
with
Indi
an in
stitu
tes•
At le
ast t
wo TV
ET in
stitu
tions
tra
ined
on la
test p
edag
ogica
l tec
hniq
ues p
er ye
ar•
At le
ast t
wo TV
ET in
stitu
tions
tra
ined
on la
test t
echn
ical
deve
lopm
ents
in th
e sec
tor
Apex
bod
y, KT
TI, E
PZA
SITA
( tbc
) , In
dian
texti
le res
earc
h as
socia
tions
( Nor
ther
n Ind
ia Te
xtile
Rese
arch
Asso
ciatio
n, S
outh
Indi
a Tex
-til
e Res
earc
h As
socia
tion,
Ahm
edab
ad
Texti
le Ind
ustry
’s Re
searc
h As
socia
-tio
n, et
c. )
Inter
natio
nal t
rainin
g ag
encie
s suc
h as
W
azir
and
IL&FS
from
Indi
a
1.5.
4 Se
t-up
colla
borat
ion
betw
een
loca
l and
Indi
an tr
aining
insti
tu-
tions
to d
evelo
p or
upd
ate a
hand
loom
wea
ving
traini
ng cu
rricu
lum
inc
ludi
ng ad
vanc
ed te
chniq
ues.
• Tra
in sta
ff an
d m
anag
emen
t to
estab
lish
and
man
age q
ualit
y sy
stem
atica
lly to
mee
t clie
nt n
eeds
.•
Estab
lish
a fee
dbac
k mec
hanis
m b
etwee
n M
SMEs
and
buye
rs fo
r co
ntinu
ous i
mpr
ovem
ent t
o sa
tisfy
buye
rs’ n
eeds
and
expe
ctatio
ns.
1X Q3
• Si
gned
MoU
with
one
Indi
an
instit
ute
• Ge
tting
two
expe
rts o
r an
agen
cy
on b
oard
( can
be i
ncrea
sed
if req
uired
)•
Deve
lop
four
exch
ange
pr
ogram
mes
MoE
ST, h
andl
oom
asso
ciatio
n,
apex
bod
y / KA
M, K
TTI,
EPZA
Indian
insti
tutes
, age
ncies
and
expe
rts
1.5.
5 Sy
stem
atize
the u
se o
f TVE
T by c
reatin
g a r
equir
emen
t for
each
ne
w op
erato
r in
Keny
an co
mpa
nies t
o un
derg
o a r
eleva
nt th
ree-w
eek
cour
se ( b
ased
on
the s
pecif
icatio
n ). F
or so
me t
rainin
gs, a
hig
her
perio
d of
four
to si
x wee
ks m
ay b
e req
uired
. The
tim
eline
shou
ld b
e de
cided
whil
e dev
elopi
ng th
e cou
rses.
Estab
lish
a Mem
oran
dum
of U
nder
stand
ing ( M
oU ) b
etwee
n T&
C co
m-
panie
s and
TVET
insti
tutio
ns to
share
costs
for t
he tr
aining
.
2X Q2
• At
leas
t 10
firm
s im
plem
ent
a man
dato
ry tra
ining
for n
ew
oper
ators
each
year
• M
oU is
sign
ed b
etwee
n TV
ET
and
firm
s
Apex
bod
y / KA
M, K
TTI,
EPZA
1.5.
6 Ca
pacit
ate th
e TVE
T stru
cture
with
the r
equir
ed eq
uipm
ent t
o tea
ch tr
ainee
s the
pro
per h
andl
ing o
f new
equip
men
t use
d in
the i
ndus
-try
. Sec
ond-
hand
/ sm
all sc
ale m
odels
of m
achin
ery c
an b
e im
porte
d fro
m cu
rrent
indu
stry l
eade
rs ( In
dia,
for i
nstan
ce ).
Mac
hiner
y sup
plier
s ca
n als
o be
appr
oach
ed to
don
ate so
me o
f the
mac
hiner
y for
train
ing
purp
oses
.
2X Q1
• Le
tter o
f sup
port
obtai
ned
from
two
to th
ree co
mpa
nies o
r mac
hiner
y su
pplie
rs
Apex
bod
y / KA
M, K
TTI,
EPZA
, TV
ETA
Larg
e Ind
ian te
xtile
com
panie
s - A
rvind
, Va
rdhm
an, A
lok,
Raym
ond,
mac
hiner
y su
pplie
rs - L
MW
, Riet
er, D
ornie
r, etc
.
1.5.
7 St
rengt
hen
linka
ges a
nd co
llabo
ratio
n m
echa
nism
betw
een
Ken-
yan
unive
rsitie
s and
enter
prise
s.
• Ba
sed
on ag
reem
ents
reach
ed b
etwee
n un
iversi
ties a
nd th
e T&
C ap
ex b
ody,
supp
ort t
he u
pdati
ng o
f cur
ricul
a and
train
ing
prog
ramm
es o
f univ
ersit
ies ( i
nclu
ding
stud
ent a
ppren
tices
and
inter
nship
pro
gram
mes
).
2X Q4
• Ne
w cu
rricu
la de
velo
ped
• Si
gned
MoU
with
three
to fo
ur
expe
rts o
r ins
titut
es•
Requ
irem
ent o
f one
inter
nship
pr
ogram
me p
er d
iplo
ma
estab
lishe
d
Apex
bod
y / KA
M, u
niver
sities
, EP
ZA, K
AMEA
SITA
( tbc
) ( co
ordi
natio
n wi
th In
dian
ins
titut
es an
d ex
perts
), Ind
ian In
stitu
tes
of Te
chno
logy
, DKT
E, Te
chno
logi
cal I
n-sti
tute
of Te
xtile
and
Scien
ces,
Gove
rn-
men
t Cen
tral T
extil
e Ins
titut
e, reg
iona
l su
ppor
t fro
m A
CTIF

[ VALUE CHAIN ROADMAP PLAN OF ACTION ]
59
Stra
tegi
c ob
ject
ive
1 : M
axim
ize p
rodu
ctiv
ity a
nd u
phol
d qu
ality
requ
irem
ents
thro
ugh
skill
s de
velo
pmen
t.Op
erat
iona
l obj
ectiv
eAc
tivitie
sPr
iorit
y1=
high
3=
low
Impl
emen
tatio
n pe
riod
Targ
et m
easu
res
Lead
ing
natio
nal in
stitu
tion
and
poss
ible
impl
emen
ting
partn
ers
Ongo
ing /
futu
re d
evelo
pmen
t pr
ogra
mm
es +
inte
rnat
iona
l par
tner
s15
1617
1819
1.5
Impr
ove e
xistin
g tra
in-ing
and
educ
ation
al of
fer-
ings i
n lin
e with
indu
stry
need
s.
• Es
tablis
h un
iversi
ty co
oper
ation
with
selec
ted le
ading
T&C
coun
tries
’ univ
ersit
ies. L
ink M
cens
al Sc
hool
of F
ashio
n De
sign
with
Indi
an tr
aining
insti
tutio
ns. L
ink N
ITA w
ith In
dian
mac
hiner
y pr
ovid
ers.
• Fo
rmul
ate in
terns
hip p
rogr
amm
es b
etwee
n pr
ivate
secto
r and
un
iversi
ties /
TVET
insti
tutio
ns. T
his n
eeds
to b
e joi
ntly
prog
ramm
ed.
• Su
ppor
t sele
cted
unive
rsitie
s to
upgr
ade t
he ex
isting
indu
strial
tra
ining
pro
gram
me :
‘Garm
ent T
echn
olog
y & Le
an M
anuf
actu
ring’
.•
Integ
rate w
ithin
unive
rsitie
s’ co
urse
s visi
ts fro
m g
uest
spea
kers
from
th
e ind
ustry
to d
elive
r spe
cial t
rainin
g se
ssio
ns to
Ken
yan
stude
nts.
Sim
ilarly
, inv
ite su
cces
sful K
enya
n T&
C co
mpa
nies t
o gi
ve sp
eech
es
at un
iversi
ties.
• Se
nd te
ache
rs on
nati
onal
and
inter
natio
nal i
ndus
try vi
sits t
o pr
ovid
e th
em w
ith fi
rst-h
and
learn
ing ex
perie
nces
and
to h
elp b
uild
indus
try
linka
ges.
• Th
e ape
x bod
y will
initi
ate, t
ogeth
er w
ith se
lected
univ
ersit
ies,
resea
rch
studi
es co
verin
g sp
ecifi
c cha
lleng
es fa
ced
by th
e ind
ustry
to
gen
erate
thou
ght l
eade
rship
and
find
appr
opria
te so
lutio
ns
( diss
emina
te res
ults
thro
ugh
their
netw
ork a
nd th
roug
h un
iversi
ties )
.•
Invite
inter
natio
nal p
rofes
sors
in or
der t
o sh
are b
est p
ractic
es o
n TV
ET an
d im
prov
e int
er-un
iversi
ty pa
rtner
ship
s.Cr
eatin
g lin
kage
s with
indu
stry n
eeds
to st
art i
n ye
ar on
e of a
stud
ent’s
ex
perie
nce (
and
be sy
stem
ized
thro
ugho
ut ) t
o en
sure
the k
nowl
edge
is
prop
erly
built
.
• De
velo
pmen
t of c
urric
ulum
for
‘Garm
ent T
echn
olog
y & Le
an
Man
ufac
turin
g’ co
urse
• At
leas
t one
indu
stry r
epres
entat
ive
visits
univ
ersit
ies p
er cu
rricu
lum
• Re
quire
men
t put
in p
lace t
o ha
ve
a nati
onal
or in
terna
tiona
l ind
ustry
vis
it pe
r yea
r•
At le
ast f
ive n
ew st
udies
initi
ated
• At
leas
t five
pro
fesso
rs inv
ited
per y
ear
MoE
ST ( c
omm
ittee
on
inter
nship
pr
ogram
me )
, ape
x bod
y / KA
M,
unive
rsitie
s, EP
ZA
Inter
natio
nal t
rainin
g ag
encie
s suc
h as
W
azir
and
IL&FS
from
Indi
a, reg
iona
l su
ppor
t fro
m A
CTIF
1.5.
8 Ba
sed
on a
gap
asse
ssm
ent s
tudy
and
cour
se cu
rricu
lum
dev
el-op
men
t in
line w
ith in
dustr
ial re
quire
men
ts an
d int
erna
tiona
l stan
dard
s, he
lp in
stitu
tes to
:
• Lin
k with
inter
natio
nal i
nstit
utes
for s
tude
nt an
d fac
ulty
exch
ange
/ kno
wled
ge ex
chan
ge p
rogr
amm
es ;
• De
velo
p a s
trong
indu
stry i
nter
face –
gue
st lec
tures
, sch
olars
hips,
spon
sorsh
ips,
traini
ng, p
lacem
ents,
etc.
2X Q1
• At
leas
t five
exch
ange
pro
gram
mes
de
velo
ped
• At
leas
t thr
ee in
terfac
es d
evelo
ped
MoE
ST, a
pex b
ody /
KAM
, univ
ersi-
ties,
EPZA
1.6
Ensu
re th
at na
tiona
l qu
ality
man
agem
ent i
nfra-
struc
ture
respo
nds t
o th
e ind
ustry
’s ne
eds a
nd in
ter-
natio
nal a
mbi
tions
.
1.6.
1 Su
ppor
t KEB
S to
brin
g ex
isting
stan
dard
s up
to d
ate, e
stabl
ish
which
oth
ers a
re req
uired
, and
pub
lish
natio
nal q
ualit
y stan
dard
s for
ga
rmen
ts an
d pr
omot
e the
use
of t
hose
stan
dard
s to
mem
bers
thro
ugh
circu
lars a
nd se
mina
rs.
1X Q4
• Ad
visor
y ser
vice t
o KE
BS o
n co
des
of p
ractic
e for
the d
evelo
pmen
t of
stand
ards ;
five
stan
dard
s ado
pted
; tw
o se
nsiti
zatio
n se
mina
rs co
nduc
ted
KEBS
, reg
iona
l sup
port
from
ACT
IFSI
TA ( t
bc )
1.6.
2 Bu
ild th
e cap
acity
of t
estin
g an
d ce
rtifyi
ng b
odies
for g
armen
t qu
ality.
Estab
lish
colla
borat
ion
with
inter
natio
nal l
eade
rs in
this
area a
nd en
sure
the e
xcha
nge o
f bes
t prac
tices
.
1X Q4
• At
leas
t two
testi
ng an
d ce
rtifyi
ng
bodi
es tr
ained
KEBS
SITA
( tbc
)
1.6.
3 Inv
olve
secto
r ins
titut
ions
in se
nsiti
zing
and
supp
ortin
g th
e pri-
vate
secto
r on
quali
ty m
anag
emen
t and
conf
orm
ity as
sess
men
t ( te
st-ing
, cer
tifica
tion,
insp
ectio
n ).
KAM
to co
nduc
t awa
renes
s-rai
sing
cour
ses f
or ( M
)SM
Es ab
out i
nter
na-
tiona
l man
dato
ry an
d vo
lunt
ary st
anda
rds r
elated
to T&
C.
1X Q2
• KA
M an
d ap
ex b
ody t
o de
velo
p se
nsiti
zatio
n ca
mpa
igns
for t
heir
mem
bers
KEBS
, reg
iona
l sup
port
from
ACT
IF

[ KENYA TEXTILE AND CLOTHING VALUE CHAIN ROADMAP ]
60
Stra
tegi
c ob
ject
ive
2 : Im
prov
e th
e bu
sine
ss e
nviro
nmen
t to
furth
er s
uppo
rt th
e de
velo
pmen
t of t
he T
&C in
dust
ry.
Oper
atio
nal o
bjec
tive
Activ
ities
Prio
rity
1=hi
gh,
3=lo
w
Star
ting
perio
dTa
rget
mea
sure
sLe
adin
g na
tiona
l inst
itutio
n an
d po
ssib
le im
plem
entin
g pa
rtner
s
Ongo
ing /
futu
re d
evelo
pmen
t pr
ogra
mm
es +
inte
rnat
iona
l par
tner
s15
1617
1819
2.1
Impr
ove c
ompl
i-an
ce as
a wa
y to
in-cr
ease
pro
ducti
vity a
nd
com
petit
ive-n
ess.
2.1.
1 De
velo
p a r
eferen
ce b
ook o
n ex
isting
socia
l and
envir
onm
ental
gu
ideli
nes a
pplie
d in
the T
&C se
ctor i
n Ke
nya,
inclu
ding
the m
oni-
torin
g an
d rep
ortin
g m
echa
nism
s in
plac
e.
1X Q4
• As
sess
men
t carr
ied o
utNa
tiona
l Env
ironm
ental
Man
-ag
emen
t Aut
horit
y, KE
BS,
Keny
a Ind
ustri
al Re
searc
h an
d De
velo
pmen
t Ins
titut
e, M
inistr
y of
Labo
ur, S
ocial
Sec
urity
and
Servi
ces
Inter
natio
nal L
abou
r Org
aniza
tion,
W
orld
Ban
k, reg
iona
l sup
port
from
AC
TIF o
n ac
tiviti
es 1
, 2 an
d 6.
In 20
12 : A
CTIF
and
Danis
h Int
erna
-tio
nal D
evelo
pmen
t Age
ncy,
KAM
pr
ovid
ed tr
aining
on
CSR
for t
extil
e &
appa
rel m
embe
rs, In
terna
tiona
l Lab
our
Orga
nizati
on2.
1.2
Estab
lish
an ad
visor
y com
mitt
ee co
mpo
sed
of K
AM, b
uy-
ers,
empl
oyer
s, th
e Tail
ors a
nd Te
xtiles
Wor
kers
Unio
n ( m
embe
r of
Cent
ral O
rgan
izatio
n of
Trad
e Unio
ns ),
TISIs
and
othe
r rele
vant
stak
e-ho
lder
s. Ag
ree o
n im
plem
entat
ion
of g
loba
l com
plian
ce st
anda
rds
and
mod
alitie
s in
the c
ount
ry an
d fo
r the
T&C
secto
rs, in
cludi
ng
mon
itorin
g an
d rep
ortin
g.
1X Q4
• Co
mm
ittee
on
com
plian
ce p
rogr
amm
e se
t up
Tailo
rs an
d Te
xtiles
Wor
kers
Unio
n
2.1.
3 Es
tablis
h m
odali
ties f
or b
uyer
and
enter
prise
enga
gem
ent i
n im
plem
entat
ion,
mon
itorin
g, re
porti
ng an
d tak
ing co
rrecti
ve ac
tions
rel
ated
to co
mpl
iance
.
2X Q2
• Inv
olve
men
t of b
uyer
s defi
ned
thro
ugh
respe
ctive
term
s of r
eferen
ce ( a
t lea
st tw
o )
KAM
, ape
x bod
y, Na
tiona
l Env
i-ro
nmen
tal M
anag
emen
t Aut
hor-
ity, K
EBS,
Mini
stry o
f Lab
our,
Socia
l Sec
urity
and
Servi
ces
2.1.
4 Ag
ree u
pon
and
sign
a cou
ntryw
ide c
ompl
iance
fram
ewor
k for
th
e T&C
indu
stry i
n Ke
nya.
2X Q2
• Co
untry
wide
com
plian
ce fr
amew
ork
signe
d
2.1.
5 W
ork w
ith b
uyer
s to
build
com
plian
ce b
uy-in
thro
ugh
build
-ing
trus
t and
own
ersh
ip w
ith m
anag
emen
t and
wor
kers.
Esta
blish
a wo
rking
team
( man
agem
ent a
nd w
orke
rs ) a
t the
enter
prise
leve
l to
prom
ote c
ompl
iance
.
2X Q2
• At
leas
t 20
worki
ng te
ams e
stabl
ished
in
Keny
an co
mpa
nies
2.1.
6 Tra
in wo
rkers,
empl
oyer
s and
oth
er st
akeh
olde
rs on
the
agree
d-up
on co
mpl
iance
fram
ewor
k for
the T
&C in
dustr
y in
Keny
a, inc
ludi
ng so
cial a
nd en
viron
men
tal st
anda
rds,
and
their
impl
icatio
ns
for a
ttrac
ting
FDI a
nd g
loba
l buy
ers.
2X Q2
• At
leas
t 500
wor
kers
traine
d pe
r yea
r ( fr
om p
artic
ipati
ng co
mpa
nies )
2.1.
7 Tra
in em
ploy
ers a
nd w
orke
rs on
the l
ink b
etwee
n co
mpl
iance
an
d im
prov
ed w
orkin
g co
nditi
ons f
or q
ualit
y, pr
oduc
tivity
, clea
ner
prod
uctio
n an
d hu
man
reso
urce
man
agem
ent.
2X Q2
• At
leas
t 500
wor
kers
and
50 m
anag
ers
traine
d pe
r yea
r ( fro
m p
artic
ipati
ng
com
panie
s )2.
1.8
Agree
with
buy
ers o
n an
appr
opria
te ve
rifica
tion
syste
m fo
r the
co
untry
, inc
ludi
ng th
e use
of a
ccred
ited
Keny
an se
rvice
pro
vider
s. Se
lect a
nd tr
ain ad
visor
y ser
vice p
rovid
ers t
o ca
rry o
ut fa
ctory-
level
asse
ssm
ent,
mon
itorin
g an
d rep
ortin
g ( s
ervic
e cou
ld b
e int
egrat
ed
with
in TIS
I or e
stabl
ished
usin
g th
e Int
erna
tiona
l Lab
our O
rgan
izatio
n Be
tter W
ork p
rogr
amm
e app
roac
h ).
2X Q2
X•
Verif
icatio
n sy
stem
dev
elope
d
2.1.
9 Tra
in ad
visor
y ser
vice p
rovid
ers o
n ho
w to
follo
w up
and
work
with
com
panie
s to
impr
ove o
n co
mpl
iance
gap
s.2
X Q2•
At le
ast f
ive co
nsul
tancy
firm
s trai
ned
per y
ear
2.1.
10 E
stabl
ish a
syste
m to
regu
larly
publ
ish h
ighl
ight
s abo
ut ef
-fo
rts to
adhe
re to
glo
bal s
ocial
and
envir
onm
ental
prin
ciples
bein
g un
derta
ken,
via v
ariou
s out
lets a
nd in
colla
borat
ion
with
buy
ers a
nd
inves
tmen
t pro
mot
ion
agen
cies,
to b
uild
glob
al tra
nspa
rency
abou
t th
e cou
ntry’
s effo
rt.
2X Q2
• Ce
ntral
ized
com
mun
icatio
n sy
stem
on
com
plian
ce es
tablis
hed
2.2
Increa
se th
e cap
ac-
ity o
f the
por
t com
mu-
nities
to en
forc
e T&C
-rel
ated
regul
ation
.
2.2.
1 Cr
eate
a ded
icated
T&C
Custo
ms o
ffice
rs di
visio
n / po
ol
that
will
spec
ifica
lly b
e allo
cated
to w
ork w
ith T&
C pr
oduc
tion
to
increa
se sp
ecial
izatio
n of
staff
( cur
rently
there
is a
shift
of o
ffice
rs be
twee
n va
rious
secto
rs of
the e
cono
my )
.
1X Q2
• Sp
ecial
ized
T&C
Custo
ms’
offic
ers’
pool
estab
lishe
d, E
PZA
KRA,
apex
bod
y, tex
tile e
xper
ts

[ VALUE CHAIN ROADMAP PLAN OF ACTION ]
61
Stra
tegi
c ob
ject
ive
2 : Im
prov
e th
e bu
sine
ss e
nviro
nmen
t to
furth
er s
uppo
rt th
e de
velo
pmen
t of t
he T
&C in
dust
ry.
Oper
atio
nal o
bjec
tive
Activ
ities
Prio
rity
1=hi
gh,
3=lo
w
Star
ting
perio
dTa
rget
mea
sure
sLe
adin
g na
tiona
l inst
itutio
n an
d po
ssib
le im
plem
entin
g pa
rtner
s
Ongo
ing /
futu
re d
evelo
pmen
t pr
ogra
mm
es +
inte
rnat
iona
l par
tner
s15
1617
1819
2.2
Increa
se th
e cap
ac-
ity o
f the
por
t com
mu-
nities
to en
forc
e T&C
-rel
ated
regul
ation
.
2.2.
2 Pr
ovid
e trai
ning
to C
usto
ms o
ffice
rs in
KRA
to : c
lassif
y ( ta
r-iff
s ) im
port
item
s cor
rectly
; rec
ogniz
e pro
duct
coun
try o
f orig
in ba
sed
on th
e orig
in ce
rtific
ate ; c
ompl
y with
new
impo
rt reg
ulati
on
norm
s ; an
d ge
t the
m fa
mili
arize
d wi
th te
xtile
prod
ucts,
their
uniq
ue-
ness
and
need
ed fl
exib
ility.
• At
leas
t 20
offic
ers o
f KRA
train
edKR
A, ap
ex b
ody,
textil
e exp
erts
2.2.
3 Inc
rease
effic
iency
of c
learan
ce p
roce
dures
, spe
cifica
lly
thro
ugh
the f
ollo
wing
mea
sures
.
• Ch
eckin
g an
d ap
prov
ing sh
ould
be r
educ
ed to
less
than
24
hour
s.•
Good
s sho
uld
be ve
rified
onc
e the
y get
to C
usto
ms o
ffice
s to
avoi
d de
lays.
They
shou
ld co
nsid
er in
crea
sing
the i
nspe
ction
staff
at
exit
point
s.•
Com
panie
s with
goo
d rec
ords
get
a ‘gr
een
chan
nel’.
• En
sure
a mor
e care
ful s
electi
on o
f Int
erne
t ser
vice p
rovid
ers f
or
Custo
ms o
ffice
s.•
The C
omm
issio
ner G
ener
al an
d Co
mm
issio
ner o
f Cus
tom
s sh
ould
com
e up
with
an al
terna
tive f
or w
hen
the S
imba
syste
m is
do
wn, t
o red
uce i
ncon
venie
nces
caus
ed b
y the
auth
oriti
es.
• KE
BS to
spee
d up
pro
cess
ing o
f exp
ort d
ocum
ents.
• Ca
pacit
y-bu
ilding
of C
usto
ms e
mpl
oyee
s on
inter
natio
nal
stand
ards a
nd co
st co
mpa
rison
s.•
Impr
ove t
he Le
ss C
ontai
ner L
oad
carg
o sy
stem
thro
ugh
a tran
sfer
to C
ontai
ner F
reigh
t Stat
ion
( exte
nsio
n of
the p
ort b
ut p
rivate
ly ru
n ). E
stabl
ish a
feedb
ack l
oop
mec
hanis
m w
ith th
e priv
ate se
ctor
and
Custo
ms t
o co
nstan
tly en
sure
that
the p
roce
ss ru
ns in
an
optim
al m
anne
r.
2X Q2
• Tim
e tak
en fo
r clea
rance
pro
cedu
res
reduc
ed to
24
hour
sKR
A, ap
ex b
ody,
textil
e exp
erts
2.3
Impr
ove t
he le
gal
and
regul
atory
fram
e-wo
rk rel
evan
t to
the
T&C
indus
try.
2.3.
1 Int
rodu
ce T&
C-sp
ecifi
c reg
ulati
ons a
nd ap
ply r
ecom
men
da-
tions
from
the r
ecen
t non
-tarif
f mea
sure
surve
y :
• St
rong
ly reg
ulate
and
cont
rol i
mpo
rts o
f sec
ond-
hand
clot
hing
and
new
cloth
ing im
porte
d un
der t
he ‘s
econ
d-ha
nd’ c
atego
ry,
and
increa
se d
uty l
evels
on
impo
rts ( a
nd es
pecia
lly re
infor
ce
cont
rol o
n ne
w pr
oduc
ts be
ing im
porte
d as
seco
nd-h
and )
;•
Impr
ove e
nfor
cem
ent o
f the
requ
irem
ent f
or p
rodu
ct or
igin
labell
ing ;
• Inc
rease
aware
ness
of i
ntell
ectu
al pr
oper
ty rig
hts f
or K
enya
n de
signs
( kiko
yi, et
c. ),
e.g. a
dver
tising
free
Wor
ld In
tellec
tual
Prop
erty
Orga
nizati
on o
nline
aware
ness
-raisi
ng co
urse
s ;•
Intro
duce
regu
latio
ns o
n wa
stewa
ter an
d pe
nalti
es fo
r fail
ure t
o co
mpl
y ;•
Estab
lish
a req
uirem
ent f
or an
orig
in ce
rtific
ate / r
espe
ct of
ph
ytosa
nitary
nor
ms.
1X Q1
• Fo
ur n
ew re
gulat
ions
des
igne
d an
d su
bmitt
ed fo
r app
rova
lM
oEID
, TM
EA, r
egio
nal s
uppo
rt fro
m A
CTIF
Keny
a Ind
ustri
al Pr
oper
ty In-
stitu
teKR
A / KA
M, K
NCCI

[ KENYA TEXTILE AND CLOTHING VALUE CHAIN ROADMAP ]
62
Stra
tegi
c ob
ject
ive
2 : Im
prov
e th
e bu
sine
ss e
nviro
nmen
t to
furth
er s
uppo
rt th
e de
velo
pmen
t of t
he T
&C in
dust
ry.
Oper
atio
nal o
bjec
tive
Activ
ities
Prio
rity
1=hi
gh,
3=lo
w
Star
ting
perio
dTa
rget
mea
sure
sLe
adin
g na
tiona
l inst
itutio
n an
d po
ssib
le im
plem
entin
g pa
rtner
s
Ongo
ing /
futu
re d
evelo
pmen
t pr
ogra
mm
es +
inte
rnat
iona
l par
tner
s15
1617
1819
2.3
Impr
ove t
he le
gal
and
regul
atory
fram
e-wo
rk rel
evan
t to
the
T&C
indus
try.
2.3.
2 KR
A to
adju
st ( re
view )
their
regu
latio
ns to
impr
ove e
ase o
f do
ing b
usine
ss, e
spec
ially
in th
e T&C
secto
r.
• Ca
ncel
bond
s pro
mpt
ly so
as n
ot sl
ow d
own
busin
ess.
• Ca
ncel
impo
rt de
clarat
ion
fee.
• St
ream
line K
RA’s
oper
ation
s at t
he p
ort t
o en
able
mor
e tra
nsac
tions
. Clea
rance
of g
oods
shou
ld b
e don
e im
med
iately
on
arriva
l onc
e the
y com
ply w
ith th
e req
uirem
ents.
1X Q4
• Th
ree n
ew re
gulat
ions
des
igne
d an
d su
bmitt
ed fo
r app
rova
lM
oEID
, TM
EAEP
ZA M
omba
saKA
M, K
NCCI
2.4
Expa
nd an
d m
od-
erniz
e the
fina
ncial
se
rvice
s ava
ilabl
e to
the
indus
try.
2.4.
1 Pr
ovid
e cap
acity
-buil
ding
on
mod
ern
risk a
nd fi
nanc
ial an
aly-
sis to
staff
at le
ading
fina
ncial
insti
tutio
ns an
d rai
se aw
arene
ss o
f m
oder
n fin
ancia
l sup
port
mec
hanis
ms a
nd in
strum
ents.
1X Q4
• At
leas
t 50
empl
oyee
s of f
inanc
ial
instit
utio
ns tr
ained
per
year
MoIE
D, M
inistr
y of F
inanc
e, Ke
nya B
anke
rs As
socia
tion
2.4.
2 Ad
voca
te fo
r the
crea
tion
of a
secto
r-spe
cific
indus
triali
zatio
n fu
nd an
d rec
omm
end
areas
for i
ts ut
iliza
tion
in lin
e with
indu
stry
requir
emen
ts.
1X Q3
• T&
C se
ctor i
ndus
triali
zatio
n fu
nd
crea
tedM
oIED,
apex
bod
y to
advo
cate
Wor
ld B
ank
2.5
Supp
ort c
om-
petit
ive-n
ess t
hrou
gh
impr
oved
elec
tricit
y pr
icing
and
quali
ty.
2.5.
1 Ini
tiate
a viab
le tem
porar
y tari
ff red
uctio
n sc
hem
e as s
oon
as
poss
ible
and
exten
d tar
iff su
bsid
y to
non-
EPZ c
ompa
nies.
2X Q4
• Al
l-Ken
ya el
ectri
city r
educ
tion
finan
cial
sche
me d
evelo
ped
Apex
bod
y, M
oIED,
Mini
stry o
f En
ergy,
Mini
stry o
f Fina
nce
Keny
a Pow
er an
d Lig
hting
Com
-pa
ny / K
enya
Ene
rgy R
egul
atory
Com
miss
ion,
KAM
Wor
ld B
ank /
GDS
2.5.
2 Lo
ad re
distr
ibut
ion
plan
requ
ired
to en
sure
cont
inuou
s sup
ply
of el
ectri
city t
o EP
Zs.
1X Q4
• Re
distr
ibut
ion
plan
prep
ared
Apex
bod
y, M
oIED,
Mini
stry o
f En
ergy,
KAM
, Ken
ya P
ower
and
Light
ing C
ompa
ny / K
enya
En-
ergy R
egul
atory
Com
miss
ion
Wor
ld B
ank /
GDS
2.5.
3 Su
ppor
t firm
s to
mod
erniz
e equ
ipm
ent a
nd in
crea
se tr
aining
ac
tiviti
es o
n en
ergy s
aving
and
optim
izatio
n.
1X Q4
• Ei
ghty
to o
ne h
undr
ed co
mpa
ny
man
ager
s trai
ned
per y
ear
• At
leas
t 20
SMEs
advis
ed p
er ye
ar
Apex
bod
y, M
oIED,
Mini
stry o
f En
ergy,
Mini
stry o
f Fina
nce
Keny
a Nati
onal
Clea
ner P
rodu
c-tio
n Ce
ntre,
KAM
Wor
ld B
ank /
GDS
, Cen
tre fo
r Ene
rgy
Effic
iency
and
Cons
erva
tion /
Susta
in-ab
le Us
e of N
atural
Res
ourc
es an
d En
ergy F
inanc
ing / M
oIED
/ Fren
ch
Deve
lopm
ent A
genc
y / TM
EA /
Danis
h Int
erna
tiona
l Dev
elopm
ent
Agen
cy2.
6 Im
prov
e the
ef-
ficien
cy an
d co
st co
mpe
titive
-nes
s of
trans
porta
tion
and
logi
stics
.
2.6.
1 Im
prov
e coo
rdina
tion
and
utili
zatio
n of
truc
king
servi
ces
by es
tablis
hing
an IC
T-ba
sed
mon
itorin
g sy
stem
allo
wing
for f
ull
utili
zatio
n of
truc
ks d
uring
all t
heir
trans
its. E
stabl
ish co
st sh
aring
wh
en th
e tru
ck is
bein
g us
ed b
y one
firm
one
way
and
anot
her o
n th
e way
bac
k.En
sure
know
ledge
tran
sfer f
rom
well
-per
form
ing ca
ses i
n Ind
ia ( p
ar-tic
ularl
y Retu
rn Tr
uck I
ndia
com
pany
) on
this
initia
tive.
2X Q4
• Tru
cking
coor
dina
tion
syste
m
deve
lope
d•
MoU
sign
ed w
ith R
eturn
Truc
k Ind
ia on
kn
owled
ge tr
ansfe
r
Apex
bod
y, GS
1, TM
EA, K
enya
Tra
nspo
rters
Asso
ciatio
n, K
RAW
orld
Ban
k

[ VALUE CHAIN ROADMAP PLAN OF ACTION ]
63
Stra
tegi
c ob
ject
ive
3 : E
xpan
d th
e be
nefit
s of
inve
stm
ent t
hrou
ghou
t the
T&C
val
ue c
hain
.Op
erat
iona
l ob
jectiv
eAc
tivitie
sPr
iorit
y1=
high
, 3=
low
Star
ting
perio
dTa
rget
mea
sure
sLe
adin
g na
tiona
l inst
itutio
n an
d po
ssib
le im
plem
entin
g pa
rtner
sOn
goin
g / fu
ture
dev
elopm
ent
prog
ram
mes
+ in
tern
atio
nal
partn
ers
1516
1718
19
3.1
Pursu
e ef-
forts
to es
tablis
h id
eal c
ondi
tions
fo
r inv
esto
rs.
3.1.
1 M
oIED
seek
s to
conf
er to
p go
vern
men
tal p
riorit
y an
d ex
pedi
te th
e fol
low-
ing o
ngoi
ng p
rojec
ts in
orde
r to
enha
nce c
ondi
tions
for i
nves
tmen
t in
T&C
secti
on
in Ke
nya.
• Re
duce
elec
tricit
y co
sts :
from
US$
0.21
–US$
0.23
per
kWh
down
to U
S$0.
09
thro
ugh
impl
emen
tatio
n of
the o
ngoi
ng p
rojec
t for
the a
dditi
onal
5,00
0 m
egaw
atts o
f elec
tricit
y to
the n
ation
al gr
id.
• Tr
ansp
orta
tion :
impl
emen
t ong
oing
stan
dard
gau
ge ra
ilway
pro
ject (
inclu
ding
co
nnec
tion
betw
een
Nairo
bi an
d M
omba
sa).
• Bu
ild n
ew te
xtile
cities
at N
aivas
ha a
nd A
thi R
iver a
nd n
ew T&
C tex
tile p
arks
(nea
r Mom
basa
or K
isum
u) u
sing
inter
natio
nal e
xper
tise t
o en
sure
highe
st pr
oduc
tion
• Es
tabl
ish a
low
-inte
rest
indu
stria
lizat
ion
fund
that
woul
d pr
ovid
e loa
ns
for s
tart-u
p an
d m
achin
ery u
pgrad
es in
the y
arn an
d fab
ric se
ctor,
offer
ing
inter
natio
nally
com
petit
ive in
teres
t rate
s of 5
%–6
%.
1 1 2 1
X XX X
• At
leas
t 10
majo
r roa
d ax
es
mod
erniz
ed w
ithin
the f
ive-y
ear p
erio
d•
Redu
ction
of e
lectri
city c
ost t
o US
$ 0.0
5 wi
thin
and
outsi
de o
f EPZ
s•
Naiva
sha T
extil
e City
buil
t•
At le
ast t
wo T&
C ind
ustri
al pa
rks b
uilt
with
in fiv
e yea
rs•
Secto
r-spe
cific
indus
triali
zatio
n fu
nd
estab
lishe
d
Apex
bod
y, M
oIED,
Mini
stry o
f Fi-
nanc
e, M
inistr
y of E
nerg
y, M
inistr
y of
Trans
port
and
Infras
tructu
re, E
PZA
3.1.
2 Es
tablis
h a t
rainin
g ce
ntre
in th
e Naiv
asha
Texti
le Ci
ty an
d pr
ovid
e sup
port
in th
e sele
ction
and
purc
hase
of n
eces
sary
traini
ng eq
uipm
ent t
o tea
ch tr
ainee
s ( li
nked
with
activ
ity 1
.5.6
).
2X Q 1
• At
leas
t one
train
ing ce
ntre
estab
lishe
d in
Naiva
sha T
extil
e City
• Le
tter o
f sup
port
obtai
ned
from
one
to
two
com
panie
s or m
achin
ery s
uppl
iers
Apex
bod
y, co
nsul
tancy
servi
ce ap
-po
inted
by M
oIED,
NITA
, KTT
I, EP
ZA
3.2
Increa
se
capa
city o
f TIS
Is to
targ
et an
d at-
tract
appr
opria
te inv
estm
ents.
3.2.
1 Bu
ild ca
pacit
y of i
nves
tmen
t pro
mot
ion
offic
ers t
o eff
ectiv
ely fa
cilita
te an
d tar
get T
&C in
vestm
ent,
and
impr
ove t
heir
inves
tmen
t ana
lysis
and
targe
ting
capa
city /
tech
nique
s to
narro
w do
wn an
d be
st tar
get p
oten
tial i
nves
tors
base
d on
inv
estm
ent r
equir
emen
ts an
d sp
ecs (
this
impl
ies in
vestm
ent i
n da
ta ac
cess
and
man
agem
ent s
ervic
es su
ch D
un an
d Br
adstr
eet,
Finan
cial T
imes
, fDi
Mark
ets ).
1XQ 3
• On
e fab
rics p
rojec
t and
one
garm
ent
acce
ssor
ies p
rojec
t com
e onl
ine
as a
resul
t of K
enInv
est t
argeti
ng
cam
paig
ns
Regi
onal
supp
ort f
rom
ACT
IF, E
PZA,
Ke
nInve
st, co
unty
gove
rnm
ents
3.2.
2 Es
tablis
h co
llabo
ratio
n be
twee
n Ke
nInve
st / E
PZA /
the C
onfed
erati
on o
f Ind
ian In
dustr
ies ( C
II ) / E
xim B
ank i
n or
der t
o im
prov
e the
capa
city o
f the
form
er
instit
utio
ns to
pro
mot
e inv
estm
ents
from
Indi
a in
Keny
a. Ar
eas o
f col
labor
ation
wi
ll inc
lude
:
• De
velo
pmen
t of u
p-to
-date
secto
r–pr
oduc
t com
petit
ivene
ss st
udies
for f
ibre
to
cloth
ing, i
nclu
ding
acce
ssor
ies ;
• Ide
ntifi
catio
n of
the s
ubse
gmen
t and
Indi
an co
mpa
nies f
rom
whic
h to
attra
ct FD
I ;•
Deve
lopm
ent o
f cus
tom
ized
prom
otio
nal m
ateria
l to
attrac
t FDI
;•
Prep
aratio
n of
inve
stmen
t pro
files
for I
ndian
inve
stors.
Activ
ity 3
.3.3
can b
uild
and
align
on th
e ach
ievem
ents
unde
r this
activ
ity.
1X Q2
• De
velo
pmen
t of i
nves
tmen
t guid
e, fea
sibili
ty stu
dies
, bro
chur
es an
d we
bsite
cont
ent (
two
to th
ree m
onth
s fo
r pro
mot
iona
l mate
rial )
Apex
bod
y, M
oIED
KenIn
vest,
EPZ
ASI
TA / i
nter
natio
nal t
rainin
g ag
encie
s suc
h as
Waz
ir an
d IL&
FS fr
om In
dia,
regio
nal s
up-
port
from
ACT
IF, In
dian
Hig
h Co
mm
issio
n
3.2.
3 St
rengt
hen
the a
bilit
y of K
enInv
est /
EPZA
/ Ken
ya P
rivate
Sec
tor A
lli-
ance
/ KAM
to re
spon
d eff
ectiv
ely to
dire
ct inq
uiries
from
inve
stors
thro
ugh
a sys
-tem
atic j
oint
appr
oach
, rely
ing o
n sh
ared
inves
tor d
ata an
d m
ateria
ls.
1X Q2
• Si
gned
MoU
s am
ong
the f
our p
artn
ers
and
share
d ad
optio
n of
tech
nicall
y co
nsist
ent a
nd u
nifor
mly
bran
ded
prom
otio
nal m
ateria
ls fo
r the
secto
r
Regi
onal
supp
ort f
rom
ACT
IFAp
ex b
ody,
MoIE
D, K
enInv
est,
EPZA
3.3
Furth
er
prom
ote K
enya
as
the m
ain F
DI
desti
natio
n fo
r T&
C.
3.3.
1 Ke
nInve
st an
d EP
ZA to
spec
ifica
lly ad
verti
se th
e fol
lowi
ng ta
rget
areas
for
FDI :
• Sh
ort t
erm
: garm
ent m
anuf
actu
ring–
FOB
• M
ediu
m te
rm : t
extil
e mill
s and
integ
rated
texti
le / c
loth
ing fa
ctorie
s•
Med
ium
term
: orig
inal d
esig
n ga
rmen
t man
ufac
turer
s•
Long
term
: T&C
pro
ducti
on b
rande
d as
gree
n or
susta
inabl
e for
nich
e mark
ets•
Long
term
: yarn
spinn
ing fa
ctorie
s.
1X Q1
• Ke
nInve
st an
d EP
ZA ad
verti
se an
d ha
ve p
repare
d a s
trateg
ic ap
proa
ch
towa
rds i
nves
tors
Apex
bod
y, M
oIED,
Ken
Inves
t, EP
ZA

[ KENYA TEXTILE AND CLOTHING VALUE CHAIN ROADMAP ]
64
Stra
tegi
c ob
ject
ive
3 : E
xpan
d th
e be
nefit
s of
inve
stm
ent t
hrou
ghou
t the
T&C
val
ue c
hain
.Op
erat
iona
l ob
jectiv
eAc
tivitie
sPr
iorit
y1=
high
, 3=
low
Star
ting
perio
dTa
rget
mea
sure
sLe
adin
g na
tiona
l inst
itutio
n an
d po
ssib
le im
plem
entin
g pa
rtner
sOn
goin
g / fu
ture
dev
elopm
ent
prog
ram
mes
+ in
tern
atio
nal
partn
ers
1516
1718
19
3.3
Furth
er
prom
ote K
enya
as
the m
ain F
DI
desti
natio
n fo
r T&
C.
3.3.
2 TIS
Is to
estab
lish
a spe
cific
mark
eting
strat
egy f
or te
xtile
cities
( Naiv
asha
an
d ot
her f
acili
ties t
hat w
ill fo
llow )
in o
rder
to at
tract
and
invite
wor
ldwi
de te
xtile
man
ufac
turer
s to
set u
p be
st pr
actic
e man
ufac
turin
g fac
ilitie
s in
the c
ount
ry ( jo
int
vent
ures
or 1
00 %
own
ed ).
2X Q1
• M
arketi
ng st
rateg
y for
texti
le cit
ies
prep
ared,
bas
ed o
n tec
hnica
lly
cons
isten
t, un
iform
ly br
ande
d an
d reg
ularl
y upd
ated
prom
otio
nal m
ateria
l
MoIE
D, K
enInv
est,
EPZA
, KAM
, ape
x bo
dy
3.3.
3 Su
ppor
t the
dev
elopm
ent o
f ( ex
isting
and
new )
custo
mize
d FD
I pro
mot
iona
l m
ateria
l.De
velo
p we
ll-cr
afted
valu
e pro
posit
ions
for p
oten
tial i
nves
tors,
com
prisi
ng fe
a-sib
ility
studi
es o
n th
reads
, den
im m
ill es
tablis
hmen
t, op
en en
d ya
rn, p
roce
ssing
un
its, g
armen
t unit
s, ac
cess
ories
and
pack
aging
, etc.
• De
velo
p co
mpr
ehen
sive a
nd u
p-to
-date
secto
r pro
files
.•
Deve
lop
a cen
traliz
ed d
ataba
se o
f the
criti
cal i
nfor
mati
on &
intel
ligen
ce
requir
ed b
y inv
esto
rs.•
The p
rom
otio
nal m
ateria
l mus
t em
phas
ize th
e ben
efits
of tr
ade a
gree
men
ts av
ailab
le in
Keny
a and
the r
ecen
t ren
ewal
of A
GOA,
secu
ring
Unite
d St
ates
mark
et ac
cess
for t
he n
ext 1
0 ye
ars ( l
inked
with
activ
ity 3
.2.2
).
1X Q1
• Pu
blica
tion
of te
chnic
ally c
onsis
tent,
unifo
rmly
bran
ded,
and
regul
arly
upda
ted p
rom
otio
nal m
ateria
ls fo
r th
e sec
tor,
inclu
ding
web
sites
, Po
werP
oint
s, se
ctor p
rofil
es, s
tart-u
p ro
adm
aps a
nd su
pplie
r data
base
s
MoIE
D, K
enInv
est,
EPZA
, KAM
, ape
x bo
dy, r
egio
nal s
uppo
rt fro
m A
CTIF
SITA
, an
Indian
cons
ultin
g fir
m
such
as W
azir
3.3.
4 Ca
rry o
ut in
vestm
ent p
rom
otio
n ac
tiviti
es in
targ
et co
untri
es ( a
nd p
artic
u-lar
ly Ind
ia ) –
road
show
s, fac
ilitat
ing d
irect
inter
actio
ns b
etwee
n Ke
nyan
firm
s and
tar
geted
inve
stors,
help
ing fo
reign
repr
esen
tative
s to
prom
ote t
he se
ctor,
etc.
Use s
ide e
vent
s to
show
case
inve
stmen
t pro
files
dev
elope
d. E
xam
ple o
f sid
e ev
ents
coul
d be
Afri
ca–I
ndia
Conc
lave o
r Orig
in Af
rica.
Invite
pot
entia
l inv
esto
rs to
strat
egic
loca
tions
to sh
owca
se th
e inf
rastru
cture
and
busin
ess c
limate
.
1X Q1
• On
e roa
dsho
w ea
ch in
six m
ajor t
extil
e cit
ies –
Ludh
iana,
Delh
i, Ah
med
abad
, M
umba
i, Ba
ngalo
re an
d Tir
upur
• M
eetin
g wi
th 8
–10
inves
tors
in ea
ch
loca
tion
• Vi
sits o
f int
ereste
d inv
esto
rs ( to
tal
8–10
) to
Keny
a
MoIE
D, K
enInv
est,
EPZA
, KAM
, ape
x bo
dy, r
egio
nal s
uppo
rt fro
m A
CTIF
Indian
Em
bass
y
SITA
, int
erna
tiona
l trai
ning
agen
cies s
uch
as W
azir
and
IL&FS
from
Indi
a
3.3.
5 St
rengt
hen
the i
nves
tmen
t pro
mot
ion
man
date
/ resp
onsib
ility
role
of d
ip-
lom
ats an
d pr
ovid
e reg
ular
traini
ng to
staff
. Rev
ise an
d en
hanc
e the
inve
stmen
t pr
omot
ion
prog
ramm
e for
emba
ssies
to re
flect
lates
t tren
ds.
Subs
eque
ntly
supp
ort a
nd p
lan en
quiry
and
prom
otio
nal v
isits
to ap
prop
riate
and
targe
ted in
terna
tiona
l inv
esto
rs by
emba
ssy s
taff.
1X Q3
• M
oU an
d sta
ndard
ope
rating
pr
oced
ures
draf
ted an
d ag
reed
betw
een
KenIn
vest
and
the M
inistr
y of
Forei
gn A
ffairs
and
Inter
natio
nal T
rade
• Co
nclu
de in
vestm
ent p
rom
otio
n tra
ining
for e
cono
mic
/ com
merc
ial
coun
sello
rs an
d se
creta
ries a
t em
bass
ies an
d co
nsul
ates i
n tar
get
coun
tries
• Fin
alize
inve
stmen
t pro
mot
ion
man
ual
for n
ew d
iplo
mats
Mini
stry o
f For
eign
Affai
rs an
d Int
er-na
tiona
l Trad
eSI
TA ( t
bc )
3.4
Enab
le eq
uipm
ent u
p-gr
ading
thro
ugh
inves
tmen
t.
3.4.
1 Co
nduc
t aud
its an
d di
agno
stics
of i
ndivi
dual
textil
e unit
s and
pro
vide s
up-
port
– fir
st fo
r a li
st of
iden
tified
com
panie
s, th
en to
a wi
der g
roup
of b
enefi
ciar-
ies –
with
a str
ategi
c tec
hnol
ogy p
lan ( t
o be
link
ed w
ith g
ap an
alysis
of a
ctivit
y 1.
1.2 )
.
1X Q1
• At
leas
t 10
firm
s adv
ised
per y
ear a
nd
techn
olog
y plan
s dev
elope
dKA
M, a
pex b
ody,
regio
nal s
uppo
rt fro
m A
CTIF,
Moi
Univ
ersit
y
3.4.
2 Ad
verti
se an
d su
ppor
t ( th
roug
h bu
sines
s clin
ic co
nsul
tancy
servi
ces )
in-
vestm
ent a
mon
g Ke
nyan
firm
s in
spec
ific m
achin
ery r
equir
ed in
the f
ibre–
cloth
ing
valu
e cha
in, es
pecia
lly sp
inning
, wea
ving,
knitt
ing an
d pr
oces
sing.
2X Q3
• At
leas
t 10
firm
s acc
ompa
nied
thro
ugh
the m
achin
ery u
pgrad
e pro
cess
KAM
, ape
x bod
y, reg
iona
l sup
port
from
ACT
IF, M
oi U
niver
sity
3.4.
3 Fa
cilita
te lin
kage
s with
Indi
a with
insti
tutio
ns w
orkin
g on
prin
ting,
des
ign,
an
d pr
oduc
t and
mark
et de
velo
pmen
t to
spur
inve
stmen
t in
hand
loom
tech
nolo
gy.
Supp
ort t
o up
grad
e to
adva
nced
type
s of h
andl
oom
s, ac
cess
ories
, and
fash
ion
and
desig
n tec
hnol
ogy.
1X
Q 2•
At le
ast t
hree
link
ages
estab
lishe
d wi
th
Indian
par
tner
train
ing in
stitu
tions
KAM
, ape
x bod
y, reg
iona
l sup
port
from
ACT
IF, N
ITA

[ VALUE CHAIN ROADMAP PLAN OF ACTION ]
65
Stra
tegi
c ob
ject
ive
3 : E
xpan
d th
e be
nefit
s of
inve
stm
ent t
hrou
ghou
t the
T&C
val
ue c
hain
.Op
erat
iona
l ob
jectiv
eAc
tivitie
sPr
iorit
y1=
high
, 3=
low
Star
ting
perio
dTa
rget
mea
sure
sLe
adin
g na
tiona
l inst
itutio
n an
d po
ssib
le im
plem
entin
g pa
rtner
sOn
goin
g / fu
ture
dev
elopm
ent
prog
ram
mes
+ in
tern
atio
nal
partn
ers
1516
1718
19
3.5
Increa
se
colla
borat
ion
betw
een
loca
l SM
Es an
d fo
reign
di
rect i
nves
tors
to en
sure
syne
r-gi
es.
3.5.
1 Re
plica
te th
e EBA
P ini
tiativ
e, sp
ecifi
cally
targ
eted
to S
MEs
in th
e T&C
valu
e ch
ain.
2X Q4
• At
leas
t fou
r new
EBA
Ps es
tablis
hed
MSE
A, E
BAP,
EPZA
, cou
nty g
over
n-m
ents
3.5.
2 He
lp es
tablis
h lin
kage
s betw
een
new
inter
natio
nal i
nves
tors
and
loca
l su
pplie
rs m
ore s
ystem
atica
lly, t
aking
into
acco
unt t
he S
MEs
’ per
spec
tive.
For
exam
ple,
ensu
re th
at fo
reign
-own
ed fi
rms b
egin
to p
rovid
e mor
e sys
temati
c and
or
ganiz
ed in
-hou
se tr
aining
, ope
ned
to lo
cal f
irms.
1X Q4
• Ex
chan
ge m
echa
nism
estab
lishe
d wi
thin
four
EPZ
s usin
g th
e trai
ning
cent
res cr
eated
( 1.5
.1 )
MSE
A, re
gion
al su
ppor
t fro
m A
CTIF,
EP
ZA
3.5.
3 Fo
reign
buy
ers t
o es
tablis
h sm
all-s
cale
traini
ng ac
adem
ies an
d tec
hnica
l as
sistan
ce p
rojec
ts fin
ance
d th
roug
h th
eir C
SR b
udge
ts, to
offe
r skil
l for
mati
on
prog
ramm
es o
fferin
g tec
hnica
l edu
catio
n an
d vo
catio
nal t
rainin
g, in
ord
er to
sup-
ply t
he g
armen
t ind
ustry
with
qua
lified
wor
kers
at bo
th o
perat
or an
d m
id-m
anag
e-m
ent l
evels
.
1X Q1
• At
leas
t two
train
ing ac
adem
ies
crea
ted b
y lea
d fir
ms
• At
leas
t fou
r trai
ning
cent
res su
ppor
ted
by le
ad fi
rms (
linke
d wi
th 1
.5.1
)
MSE
A, K
enInv
est,
regio
nal s
uppo
rt fro
m A
CTIF
Terti
ary in
stitu
tions
, EPZ
A, TV
ETA
Stra
tegi
c ob
ject
ive
4 : E
nabl
e m
arke
t pen
etra
tion
and
prod
uct d
evel
opm
ent t
hrou
gh tr
ade
inte
llige
nce.
Oper
atio
nal
objec
tive
Activ
ities
Prio
rity
1=hi
gh,
3=lo
w
Star
ting
perio
dTa
rget
mea
sure
sLe
adin
g na
tiona
l inst
itutio
nan
d po
ssib
le im
plem
entin
g pa
rtner
s
Ongo
ing /
futu
re
deve
lopm
ent
prog
ram
mes
+
inte
rnat
iona
l par
tner
s
1516
1718
19
4.1
Impr
ove a
c-ce
ss to
strat
egic
trade
intel
ligen
ce
for T
&C fi
rms.
4.1.
1 Cr
eate
a stra
tegic
mon
itorin
g ce
ll, h
osted
at A
CTIF,
to g
ather
up-
to-d
ate an
d T&
C-sp
ecifi
c trad
e inf
orm
ation
and
to d
etect
early
sign
als o
n tar
geted
mark
ets an
d pr
oduc
ts.Th
is im
plies
supp
ortin
g KN
CCI /
KAM
/ KAM
EA to
subs
crib
e to
impo
rtant
texti
le jo
urna
ls an
d we
bsite
s to
be ab
le to
upd
ate it
s mem
bers
with
the l
atest
mark
et inf
orm
ation
. The
se
inclu
de : h
ttp : /
/ www
.emerg
ingtex
tiles
.com
/ ; w
ww.fi
breto
fashio
n.co
m ; w
ww.co
tlook
.co
m.
1X Q1
• On
e mon
itorin
g ce
ll se
t up
• Re
com
men
datio
n rep
ort o
n im
plem
entat
ion
of th
e com
petit
ive
intell
igen
ce sy
stem
ACTIF
, EPZ
A, K
AMSI
TA
4.1.
2 Im
prov
e the
web
site o
f KNC
CI / K
AM th
roug
h we
b-ba
sed
solu
tions
for e
ffecti
ve
trade
intel
ligen
ce g
ather
ing an
d di
ssem
inatio
n, an
d en
sure
a con
stant
supp
ly of
tim
ely
mark
et int
ellig
ence
etc.
Conv
ert w
ebsit
es in
to m
obile
-frien
dly f
orm
ats.
Keep
trac
k of t
he u
sage
of w
ebsit
es w
ith G
oogl
e ana
lytics
.En
hanc
emen
t of t
he co
mpa
ny d
irecto
ry in
the T
&C se
ctor,
inclu
ding
MSM
Es, a
ncho
red
at AC
TIF.
1X Q1
• Tw
o we
bsite
s rev
ampe
dKN
CCI,
KAM
4.1.
3 Es
tablis
h a c
oope
ratio
n fra
mew
ork t
o pr
omot
e the
exch
ange
and
diss
emina
tion
of
T&C
trade
info
rmati
on am
ong
Gove
rnm
ent a
genc
ies, T
ISIs,
med
ia, ac
adem
ia, re
searc
h or
ganiz
ation
s and
the p
rivate
secto
r. Ex
chan
ge o
f com
pany
info
rmati
on am
ong
instit
u-tio
ns.
2X Q3
• On
e netw
ork e
stabl
ished
ACTIF
, EPC
, EPZ
A, te
chnic
al ins
titu-
tions
, KNC
CI
4.1.
4 Or
ganiz
e trai
nings
of c
omm
ercial
attac
hés b
ased
in ke
y targ
et m
arkets
( e.g
. Unit
ed
State
s, So
uth
Afric
a and
the E
U ), a
s well
as tr
ade p
rom
otio
n of
ficial
s, to
bes
t coo
rdina
te,
colle
ct, co
mpu
te an
d di
ssem
inate
trade
info
rmati
on an
d pr
omot
ion
matt
ers.
2X Q1
• On
e trai
ning
orga
nized
and
cond
ucted
Mini
stry o
f For
eign
Affai
rs an
d Int
er-na
tiona
l Trad
eSI
TA ( t
bc )

[ KENYA TEXTILE AND CLOTHING VALUE CHAIN ROADMAP ]
66
Stra
tegi
c ob
ject
ive
4 : E
nabl
e m
arke
t pen
etra
tion
and
prod
uct d
evel
opm
ent t
hrou
gh tr
ade
inte
llige
nce.
Oper
atio
nal
objec
tive
Activ
ities
Prio
rity
1=hi
gh,
3=lo
w
Star
ting
perio
dTa
rget
mea
sure
sLe
adin
g na
tiona
l inst
itutio
nan
d po
ssib
le im
plem
entin
g pa
rtner
s
Ongo
ing /
futu
re
deve
lopm
ent
prog
ram
mes
+
inte
rnat
iona
l par
tner
s
1516
1718
19
4.1
Impr
ove a
c-ce
ss to
strat
egic
trade
intel
ligen
ce
for T
&C fi
rms.
4.1.
5 Bu
ild th
e cap
acity
of E
PC /
EPZA
/ KA
MEA
/ KN
CCI /
ACT
IF to
dev
elop
mark
et pr
ofile
s on
targe
t mark
ets u
se m
arket
analy
sis to
ols a
nd re
searc
h m
ethod
olog
ies (e
.g.
Unite
d St
ates,
Sout
h Af
rica a
nd o
ther
coun
tries
that
offer
pref
erent
ial ac
cess
such
as A
us-
tralia
, Can
ada,
EU co
untri
es, J
apan
, New
Zeala
nd, N
orwa
y, Sw
itzer
land,
Turke
y, Be
larus
, Ka
zakh
stan
and
the R
ussia
n Fe
derat
ion)
. The
se m
arket
prof
iles i
nclu
de p
rodu
ction
and
cons
umpt
ion
trend
s (sp
ecifi
c foc
us o
n fas
hion
desig
ners)
, trad
e ana
lysis,
mark
et req
uire-
men
ts, p
rice i
nfor
mati
on, d
istrib
utio
n ch
anne
ls, lo
gisti
cs (t
ariff
and
non-
tariff
barr
iers)
an
d ke
y bus
iness
cont
acts.
2X Q2
• De
velo
pmen
t of t
wo m
arket
prof
iles
and
traini
ng o
f EPZ
A / AC
TIF / K
AMEA
sta
ff to
capa
citate
them
to p
repare
tw
o m
ore s
uch
prof
iles
• Th
ree tr
aining
s on
com
petit
ive
intell
igen
ce an
d m
arket
prof
iles
orga
nized
and
cond
ucted
EPC,
EPZ
A, K
AMEA
, KNC
CI, A
CTIF,
AF
AD ( K
)SI
TA ( t
bc ) )
, Ind
ian co
n-su
lting
firm
such
as W
azir
4.2
Expa
nd m
ar-ke
t acc
ess a
nd
prom
ote K
enya
’s T&
C pr
oduc
ts.
4.2.
1 En
hanc
e awa
renes
s am
ong
Keny
an fi
rms o
n th
e exte
nsio
n of
AGO
A an
d th
e sig
-na
ture
of th
e trip
artit
e agr
eem
ent,
as w
ell as
on
the e
xisten
ce an
d be
nefit
s of K
enya
’s reg
iona
l and
inter
natio
nal p
refere
ntial
mark
et ac
cess
cond
ition
s ( in
cludi
ng p
refere
ntial
ac
cess
to th
e fol
lowi
ng co
untri
es : A
ustra
lia, C
anad
a, EU
coun
tries
, Jap
an, N
ew Ze
aland
, No
rway
, Swi
tzerla
nd, T
urke
y, Be
larus
, Kaz
akhs
tan an
d th
e Rus
sian
Fede
ratio
n ).
EPZA
shou
ld p
rom
ote a
dditi
onal
prod
ucts
with
hig
h po
tentia
l tha
t T&C
com
panie
s cou
ld
expo
rt un
der t
hese
sche
mes
.
1X Q2
• Br
ochu
re pr
oduc
ed is
diss
emina
ted
to m
embe
rs of
the a
pex b
ody
KAM
, ape
x bod
y, EP
C, re
gion
al su
p-po
rt fro
m A
CTIF,
EPZ
ASI
TA ( t
bc )
4.2.
2 Bu
ild o
n th
e rec
ent e
xtens
ion
of A
GOA
to fu
rther
pen
etrate
the U
nited
Stat
es m
ar-ke
t.
• Se
lect a
ppro
priat
e exh
ibiti
ons i
n th
e Unit
ed S
tates
to p
ublic
ize an
d pr
omot
e the
Ke
nyan
T&C
indus
try ex
perti
se an
d pr
ofes
siona
lism
, and
info
rm A
mer
ican
buye
rs ab
out K
enya
’s lat
est o
fferin
g an
d pe
rform
ance
in th
e Am
erica
n m
arket.
• As
sist s
electe
d Ke
nyan
man
ufac
turer
s to
conn
ect w
ith th
e rig
ht b
uyer
s and
par
tner
s in
the U
nited
Stat
es th
roug
h th
e pro
mot
ion
of K
enya
n kn
ow-h
ow to
selec
ted ap
parel
ret
ail ch
ain st
ores
and
loca
l bran
ded
man
ufac
turer
s to
estab
lish
and /
or st
rengt
hen
relati
onsh
ips.
• As
sist s
electe
d co
mpa
nies i
n bu
ilding
relat
ions
hips w
ith n
ew A
mer
ican
buye
rs ( p
ossib
ly th
roug
h di
fferen
t dist
ribut
ion
chan
nels
than
the e
xistin
g on
es as
m
ultic
hann
el di
strib
utio
n is
a nec
essit
y ) an
d m
ake t
heir
prod
uctio
n an
d di
strib
utio
n pr
oces
s as t
ransp
arent
as p
ossib
le.•
Supp
ort c
urren
t exp
orter
s and
expo
rt-rea
dy fi
rms t
o en
sure
com
plian
ce w
ith A
mer
ican
CSR
stand
ards (
can
be u
sed
for m
arketi
ng e.
g. fo
r pro
duct
storyt
elling
).•
Prom
ote a
nd ta
rget
inves
tmen
t stra
tegica
lly to
: –
Enab
le pr
oduc
tion
of g
armen
ts fo
r FOB
bus
iness
and
be ab
le to
offe
r ful
ly int
egrat
ed se
rvice
s ; –
Focu
s on
refine
men
t of p
re-pr
oduc
tion
servi
ces ;
–Im
prov
e inv
ento
ry co
ntro
l sys
tems,
in pa
rticu
lar, b
y bett
er fo
recas
ting
orde
r de
man
d ; –
Facil
itate
data
com
mun
icatio
n wi
th A
mer
ican
buye
rs by
impl
emen
ting
electr
onic
data
interc
hang
e ; –
Impl
emen
t web
-bas
ed p
rodu
ct or
der f
acili
ties s
o Am
erica
n bu
yers
can
chec
k the
sta
tus o
f the
ir or
ders.
1X Q1
• On
e pro
mot
ion
cam
paig
n ini
tiated
to
ward
s the
Unit
ed S
tates
mark
et•
At le
ast 1
0 ex
porti
ng co
mpa
nies a
re su
ppor
ted to
dive
rsify
their
buy
ers’
base
in th
e Unit
ed S
tates
• At
leas
t 10
com
panie
s ach
ieve
com
plian
ce to
CSR
and
envir
onm
ental
stan
dard
s rele
vant
to
the U
nited
Stat
es m
arket
KNCC
I, KA
M, r
egio
nal s
uppo
rt fro
m
ACTIF
, EPZ
A

[ VALUE CHAIN ROADMAP PLAN OF ACTION ]
67
Stra
tegi
c ob
ject
ive
4 : E
nabl
e m
arke
t pen
etra
tion
and
prod
uct d
evel
opm
ent t
hrou
gh tr
ade
inte
llige
nce.
Oper
atio
nal
objec
tive
Activ
ities
Prio
rity
1=hi
gh,
3=lo
w
Star
ting
perio
dTa
rget
mea
sure
sLe
adin
g na
tiona
l inst
itutio
nan
d po
ssib
le im
plem
entin
g pa
rtner
s
Ongo
ing /
futu
re
deve
lopm
ent
prog
ram
mes
+
inte
rnat
iona
l par
tner
s
1516
1718
19
4.2
Expa
nd m
ar-ke
t acc
ess a
nd
prom
ote K
enya
’s T&
C pr
oduc
ts.
4.2.
3 Bu
ild o
n th
e rec
ent s
igna
ture
of th
e trip
artit
e agr
eem
ent t
o en
ter th
e Sou
th A
frica
n m
arket.
• Se
lect a
nd as
sist c
ompa
nies t
o ex
hibit
their
pro
ducts
at th
e trad
e sho
w So
urce
Afri
ca
2016
Cap
e Tow
n an
d pa
rticip
ate in
side
netw
orkin
g ev
ents
and
busin
ess s
emina
rs :
–Ho
st a f
ashio
n sh
ow an
d co
cktai
l par
ty at
Sour
ce A
frica
201
6 to
pro
mot
e the
Ke
nyan
texti
les in
dustr
y’s ex
perti
se an
d pr
ofes
siona
lism
, and
to st
rengt
hen
the
Keny
an b
rand
and
savo
ir fai
re. P
repare
and
orga
nize b
usine
ss to
bus
iness
mee
tings
wi
th S
outh
Afri
can
buye
rs. –
Orga
nize m
eetin
gs b
etwee
n ke
y Ken
yan
publ
ic an
d pr
ivate
stake
hold
ers a
nd
influ
entia
l nati
onal
coun
terpa
rts su
ch as
Cap
e Tow
n Ch
ambe
r of C
omm
erce,
Wes
tgro
, the
May
or o
f Cap
e Tow
n, et
c. an
d ca
rry o
ut m
edia
inter
views
so as
to
stren
gthe
n Ke
nya’s
intro
ducti
on in
Sou
th A
frica
.•
Selec
t and
assis
t com
panie
s to
exhib
it th
eir p
rodu
cts at
the S
outh
ern
Afric
an
Inter
natio
nal T
rade E
xhib
ition
for R
etail
Prod
ucts
2016
Joha
nnes
burg
and
repea
t the
ap
proa
ch ta
ken
for S
ourc
e Afri
ca.
• Tra
in an
d co
ach
the K
enya
n tra
de at
taché
and
emba
ssy s
taff t
o ca
rry o
ut th
e fol
lowi
ng
activ
ities
: –
Prom
ote K
enya
n pr
oduc
ts to
the m
ajor t
extil
es re
tail c
hain
stores
and
loca
l bran
ded
man
ufac
turer
s to
stren
gthe
n rel
ation
ship
s. Th
is wi
ll en
tail v
isitin
g th
e sou
rcing
di
recto
rs an
d di
scus
sing
how
the t
rade a
ttach
é can
assis
t with
inwa
rd b
uying
for
any s
ourc
ing g
aps.
–Pr
epara
tion
and
facili
tatio
n of
an in
ward
buy
ing m
issio
n. –
Trade
attac
hé In
vesti
gatio
n of
and
parti
cipati
on in
small
er ex
hibiti
ons a
nd fa
irs.
–As
sist K
enya
n m
anuf
actu
rers t
o co
nnec
t with
the r
ight
buy
ers a
nd p
artn
ers i
n So
uth
Afric
a. –
Atten
d of
ficial
texti
les an
d ne
twor
king
even
ts wi
th o
ther
forei
gn co
unter
parts
.
2X Q3
• On
e fas
hion
show
hos
ted at
Sou
rce
Afric
a 201
6•
At le
ast 1
0 bi
later
al m
eetin
gs
betw
een
Keny
an an
d So
uth
Afric
an
stake
hold
ers c
arried
out
• At
leas
t 10
com
panie
s sho
wcas
ed
at th
e Sou
ther
n Af
rican
Inter
natio
nal
Trade
Exh
ibiti
on fo
r Reta
il Pr
oduc
ts 20
16•
At le
ast 1
0 co
mpa
nies a
nd th
e trad
e att
aché
train
ed
KNCC
I, KA
M, A
FAD
( K ),
regio
nal
supp
ort f
rom
ACT
IF, E
PZA
4.2.
4 Su
ppor
t and
wid
en se
rvice
s of t
he E
PC an
d EP
ZA to
supp
ort m
arket
deve
lop-
men
t und
ertak
en b
y com
panie
s. Fo
r exa
mpl
e, Ke
nyan
texti
le ex
porte
rs to
par
ticip
ate in
im
porta
nt in
terna
tiona
l tex
tile f
airs s
uch
as M
AGIC
( USA
), So
urce
Afri
ca–A
ppare
l ( So
uth
Afric
a ), C
PD D
usse
ldor
f ( Ge
rman
y ), S
o Et
hic ( F
rance
), etc
., an
d bu
yer–
selle
r mee
tings
.
2X Q2
• EP
C an
d EP
ZA p
rovid
e at l
east
four
ne
w fai
rs fo
r Ken
yan
expo
rters
to
parti
cipate
in
EPC,
EPZ
A, K
AM, K
NCCI
4.2.
5 AC
TIF, i
n co
llabo
ratio
n wi
th K
enya
n tra
de m
issio
ns ( e
mba
ssies
) bas
ed in
the
Unite
d St
ates a
nd S
outh
Afri
ca, a
rrang
es b
uyer
–sell
er m
eetin
gs to
facil
itate
inter
actio
n be
twee
n Ke
nyan
expo
rters
and
forei
gn b
uyer
s in
targe
t mark
ets.
2X Q2
• At
leas
t 20
buye
r–se
ller m
eetin
gs
cond
ucted
by A
CTIF
with
Am
erica
n an
d So
uth
Afric
an b
uyer
s
ACTIF
, KNC
CI
4.2.
6 De
velo
p ap
prop
riate
natio
nal b
rand /
sign
pro
mot
ion
polic
y and
coor
dina
te im
ple-
men
tatio
n of
activ
ities
und
er th
e ‘M
ade i
n Ke
nya’
tag.
Crea
te a l
ogo
and
mot
to as
a pr
iorit
y.
2X Q3
• On
e nati
onal
bran
ding
strat
egy
deve
lope
d•
Com
mon
logo
/ mot
to ag
reed
KAM
, AFA
D ( K
), ap
ex b
ody,
EPZA
, Br
and
Keny
a Boa
rd, M
oIED
4.2.
7 Co
nduc
t trai
ning
on d
evelo
pmen
t of c
ompa
ny le
vel b
rands
to b
e link
ed w
ith th
e na
tiona
l bran
d (s
ubse
quen
t to
4.2.
6)2
X Q1•
Assis
tance
pro
vided
to at
leas
t 10
firm
s to
crea
te or
impr
ove t
heir
bran
ding
KAM
, AFA
D ( K
), ap
ex b
ody,
EPZA
, Br
and
Keny
a Boa
rd, M
oIED

[ KENYA TEXTILE AND CLOTHING VALUE CHAIN ROADMAP ]
68
Stra
tegi
c ob
ject
ive
4 : E
nabl
e m
arke
t pen
etra
tion
and
prod
uct d
evel
opm
ent t
hrou
gh tr
ade
inte
llige
nce.
Oper
atio
nal
objec
tive
Activ
ities
Prio
rity
1=hi
gh,
3=lo
w
Star
ting
perio
dTa
rget
mea
sure
sLe
adin
g na
tiona
l inst
itutio
nan
d po
ssib
le im
plem
entin
g pa
rtner
s
Ongo
ing /
futu
re
deve
lopm
ent
prog
ram
mes
+
inte
rnat
iona
l par
tner
s
1516
1718
19
4.3
Increa
se
firm
s’ ca
pacit
y to
alig
n pr
oduc
t de
velo
pmen
t wi
th ke
y mark
ets’
requir
emen
ts.
4.3.
1 Su
ppor
t sele
cted
com
panie
s will
ing to
dive
rsify
their
pro
duct
base
by p
rovid
ing
back
up an
d co
nsul
ting
servi
ces t
hrou
ghou
t the
pro
cess
. The
follo
wing
orie
ntati
ons c
ould
be
of i
ntere
st.Hi
gh p
oten
tial p
rodu
cts to
the U
S m
arket
unde
r AGO
A:
• HS
641
410
– Int
imate
wea
r•
HS 6
4044
3 –
Dres
ses o
f che
ap va
lue s
ynth
etic
• HS
640
193
– M
en’s
chea
p va
lue s
ynth
etic o
uter
wear
• HS
611
596
– Sp
ecial
ty ho
siery
of sy
nthe
tics.
Othe
r mark
ets :
• Ya
rn an
d fab
rics (
shirt
ing, b
otto
m w
eight
and
denim
) – re
gion
al m
arkets
• Va
lue a
dded
garm
ents,
dive
rse fi
bre b
ase –
oth
er E
U m
arkets
.Ad
ditio
nal a
ctivit
y: su
ppor
t des
igne
rs in
subs
crib
ing to
fash
ion
trend
data
base
s. To
be
linke
d wi
th th
e mon
itorin
g ce
ll un
der A
CTIF.
2X Q4
• At
leas
t 20
com
panie
s sup
porte
d to
di
versi
fy th
eir p
rodu
ct ba
se in
targ
et m
arkets
KNCC
I, EP
C, K
AM, a
pex b
ody,
re-gi
onal
supp
ort f
rom
ACT
IF, E
PZA
4.3.
2 Ba
sed
on ta
rget
mark
ets’ n
eeds
, trai
n fir
ms o
n ho
w to
enha
nce c
usto
mer
focu
s th
roug
h va
lue a
dded
servi
ces s
uch
as ve
ndor-
man
aged
inve
ntor
y, m
ulti-
fibre
expe
rtise
, IC
T cap
acity
( ICT
-ena
bled
teac
hing )
and
drop
ship
men
t.
2X Q4
• Ei
ghty
to o
ne h
undr
ed co
mpa
ny
man
ager
s trai
ned
per y
ear
KNCC
I, EP
C KA
M, a
pex b
ody
4.3.
3 Co
nduc
t visi
ts to
regi
onal
and
inter
natio
nal t
rade s
hows
on
T&C
prod
uctio
n tec
h-no
logi
es an
d ne
w m
achin
eries
with
T&C
entre
pren
eurs
(indu
strial
asso
ciatio
ns, c
loth
ing
enter
prise
s)Vi
sit th
e wor
ld’s
leadi
ng ap
parel
patt
ern
desig
n an
d cu
tting
equip
men
t man
ufac
tur-
ers,
e.g. L
ectra
Res
earc
h an
d M
anuf
actu
ring
Facil
ity, B
orde
aux ;
Tech
nical
Unive
rsity
of
Libere
c, Te
xtile
Depa
rtmen
t, Cz
ech
Repu
blic
; Prem
ière V
ision
( app
arel s
how )
, Pari
s.Th
e main
out
com
es o
f the
se to
urs s
houl
d be
to ac
quire
know
ledge
on
the l
atest
deve
lop-
men
ts in
the T
&C p
roce
ssing
indu
stry.
1X Q2
• At
leas
t 20
com
panie
s acc
ompa
nied
to tr
ade s
hows
and
equip
men
t tou
rsKN
CCI,
EPC,
KAM
, ape
x bod
y, reg
iona
l sup
port
from
ACT
IF, M
oi
Unive
rsity,
NITA
SITA
4.4
Prov
ide t
ar-ge
ted as
sistan
ce
to h
andl
oom
fir
ms a
nd d
esig
n-er
s on
trade
pr
omot
ion.
4.4.
1 Es
tablis
h lin
kage
s betw
een
Keny
an h
andl
oom
pro
duce
rs an
d de
signe
rs, an
d fo
r-eig
n bu
yers.
• Pr
omot
e uniq
ue h
andl
oom
pro
ducts
and
desig
ns in
colla
borat
ion
with
loca
l and
/ or
inter
natio
nal d
esig
ners
/ buy
ers.
• Lin
k loc
al de
signe
rs wi
th h
andl
oom
wea
vers
to d
evelo
p un
ique
fabr
ics w
hich
can
be
used
to d
evelo
p pr
oduc
ts fo
r loc
al / e
xpor
t mark
ets.
• Su
ppor
t sele
cted
weav
ers a
nd d
esig
ners
to :
–Ap
proa
ch o
nline
stor
es th
at of
fer sp
ecial
colle
ction
s ( e.
g. fa
ir tra
de p
rodu
cts,
susta
inabl
e fas
hion
item
s ) ;
–Se
ll di
rectly
to ag
ents
/ com
panie
s tha
t org
anize
new
shop
ping
expe
rienc
es ;
–Se
ll di
rect t
o cu
stom
ers b
y sett
ing u
p a w
ebsit
e inc
ludi
ng an
onl
ine sh
op fo
r co
nsum
ers (
fem
ale-fr
iendl
y ) ;
–Fa
cilita
te co
nnec
tions
betw
een
Keny
an w
eave
rs an
d de
signe
rs.
2X Q2
• Tw
o to
three
Indi
an d
esig
ners
sign
an M
oU w
ith th
e Ken
yan G
over
nmen
t fo
r pro
ducin
g a h
andl
oom
pro
duct
range
in K
enya
• At
leas
t 100
han
dloo
m p
rodu
cers
and
desig
ners
supp
orted
AFAD
( K ),
apex
bod
y, ha
ndlo
om as
-so
ciatio
n, TV
ETA
Indian
cons
ultin
g fir
m
such
as W
azir¸
regi
onal
supp
ort f
rom
ACT
IF
4.4.
2 En
sure
prom
otio
n of
Ken
yan
hand
loom
pro
ducts
des
igne
d by
Ken
yan
desig
ners.
• Pr
omot
e han
dwov
en p
rodu
cts th
roug
h fai
rs, ex
hibiti
ons,
med
ia an
d ret
ail o
utlet
s.•
Deve
lop
a han
dloo
m b
rand
with
a ge
nuine
han
d-m
ade p
rodu
ct ce
rtific
ation
.•
Prom
ote t
he va
lue o
f han
dmad
e pro
ducts
.•
Prom
ote t
he u
se o
f org
anic
or n
atural
fibr
es in
all h
andw
oven
pro
ducts
for t
he p
urpo
se
of m
arket
diffe
rentia
tion.
• De
velo
p ha
ndlo
om se
ctor /
prod
uct p
rom
otio
nal m
ateria
ls.
1Q2
• Pr
omot
ion
plan
dev
elope
d fo
r ha
ndlo
om p
rodu
cers
and
desig
ners
EPC,
AFA
D ( K
), ap
ex b
ody,
regio
nal
supp
ort f
rom
ACT
IFRe
searc
h or
ganiz
ation
s, ha
ndlo
om
asso
ciatio
n
SITA

APPENDICES

[ KENYA TEXTILE AND CLOTHING VALUE CHAIN ROADMAP ]
70
SECTION A: INVESTMENT AND EPZ
1 ) Table 1: International business rankings of Kenya and its competitors
East African countries Selected Asian textile and apparel exporters
International benchmark Kenya Ethiopia
United Republic
of Tanzania China India Bangladesh
Viet Nam Pakistan Myanmar
Ease of Doing Business ranking (1) 136 132 131 90 142 173 78 128 177
Competitive Industrial Performance ranking (2) 102 130 106 7 43 78 54 74
Not ranked
Global Competitiveness Index (3) 90 118 121 28 71 109 68 129 134
Inward FDI Performance Index (4) 129 120 59 86 97 114 22 110 52
Corruption Perception Index (5) 145 110 119 100 85 145 119 126 156
Economic Freedom Index (6) 122 149 109 139 128 131 148 121 161
1– World Bank Group, 2015); 2– United Nations Industrial Development Organization (UNIDO), 2010; 3– World Economic Forum, 2014; 4– United Nations Conference on Trade and Development, 2010; 5–Transparency International, 2014; 6– Heritage Foundation, 2015
2 ) EPZ and Government concessions
The EPZs were created as means of promoting ex-ports from a number of priority sectors, including the T&C industry, by offering various Government con-cessions, including:
� A 10-year corporate tax holiday and 25% tax rate thereafter
� A 10-year withholding tax holiday on dividend re-mittance
� Duty and VAT exemption on all inputs except mo-tor vehicles
� An investment deduction of 100% on capital ex-penditures for 20 years
� Stamp duty exemption � Exemption from pre-shipment inspection � Availability of on-site Customs inspection � Work permits for senior expatriate staff.
At the Athi River EPZ, space can be rented within office blocks, business centres and industrial build-ings at rates ranging from US$2 to US$2.80 per square foot per year.1 Leases are renewable every six years and subject to a 15% service charge annually. Serviced industrial plots can be leased for a mini-mum of 30 years at a rate of US$5,000 per hectare per year plus a 10% service charge fee. Sixty-year leases are available for US$100,000 per hectare.
1. Kenya Export Processing Zones Authority (2015). Website. Available from http://www.epzakenya.com/.

[ APPENDICES ]
71
SECTION B: TRADE STATISTICS ANALYSIS
Figure 1: Decomposition of Kenya’s T&C export growth, 2004–2013
Source: International Trade Centre (2015).
There are, however, some signs of product diversifi-cation in the T&C sector. For example, in 2004 there were only 11 products whose exports were valued between US $ 1 million and US $ 10 million. A decade later, 26 products fall within this category, while 10 have exports of over US $ 10 million. Even so, it is worrisome to note that the probability of a Kenyan product surviving for two or more years in a market is only 9 %. For the sake of comparison, the probability in Ethiopia is 11 %, while in China, India, Bangladesh and Turkey it ranges between 16 % and 20 %.
An analysis of the Revealed Comparative Advantages Index, which evaluates a country’s exports vis-à-vis other exporters, puts Kenya’s T&C sector in a slightly more positive light. The index suggests that most segments in Kenya’s T&C sector are more competi-tive today than they were 10 years ago ( 2002–2006 ). This improvement is particularly notable in textile segments. Nevertheless, the improvements have been slow compared with other countries. Greater competitiveness should be expected given the rela-tive age and size of the sector when compared with newer industry players.

[ KENYA TEXTILE AND CLOTHING VALUE CHAIN ROADMAP ]
72
Figure 2 : Kenya T&C, Normalized Revealed Comparative Advantage ( NRCA ) ANNEX
Source : International Trade Centre ( 2015 ).
Note : NRCA>0 : comparative advantage ; NRCA<0 : comparative disadvantage.
Table 2 : Kenya’s exported garments with value equal to or above US $ 10 million in 2013 ( US $ thousands )
HS code
Product Exported value in 2013
( US $ thousands )CAGR ( 2004 versus 2013 )
CAGR ( 2009 versus 2013 )
Export share
2009 2013
HS 620462
Women’s / girls’ trousers and shorts, of cotton, not knitted 41 990 52.0 % 9.1 % 14.1 % 13.2 %
HS 620342
Men’s / boys’ trousers and shorts, of cotton, not knitted 33 528 84.7 % 32.6 % 5.2 % 10.5 %
HS 611090
Pullovers, cardigans & similar articles of other textile materials, knitted 25 411 122.5 % 64.7 % 1.6 % 8.0 %
HS 610469
Women’s / girls’ trousers and shorts, of other textile materials, knitted 19 377 114.7 % 69.1 % 1.1 % 6.1 %
HS 620463
Women’s / girls’ trousers and shorts, of synthetic fibres, not knitted 17 355 195.8 % 163.0 % 0.2 % 5.5 %
HS 620469
Women’s / girls’ trousers & shorts, of other textile materials, not knitted 14 778 60.9 % 34.1 % 2.2 % 4.6 %
HS 610590
Men’s / boys’ shirts, of other textile materials, knitted 14 482 102.8 % 78.1 % 0.7 % 4.6 %
HS 610829
Women’s / girls’ briefs and panties, of other textile materials, knitted 13 477 93.2 % 223.5 % 0.1 % 4.2 %
HS 610990
T-shirts, singlets and other vests, of other textile materials, knitted 12 858 29.8 % 33.3 % 1.9 % 4.0 %
HS 630612
Tarpaulins, awnings and sunblinds, of synthetic fibres 7 723 17.2 % 27.5 % 1.4 % 2.4 %
Source : International Trade Centre ( 2015 ).

[ APPENDICES ]
73
Table 3 : Kenya’s textiles exports >= US $ 0.1 million in at least two years between 2004 and 2013
HS code
Product descriptionExport value in 2013 ( US $
thousands )
Growth rateShare in
textile export
CAGR 2004 versus 2013
CAGR 2009 versus 2013 2009 2013
HS 530500
Coconut fibres, abacá, Manila hemp and other vegetable textile fibre 22 153 412.9 % 0.1 % 43.9 %
HS 551110
Yarn, > / =85 % of synthetic staple fibres by weight, put up for retail sale 9 211 12.8 % 16.4 % 18.1 % 18.2 %
HS 530390
Jute and other textile bast fibres, not spun, n.e.s. ; tow and waste of these fibres 8 395 16.6 % 16.3 % 16.6 %
HS 530310
Jute and other textile bast fibres, raw or retted ( excluding flax, true hemp and ramie ) 3 450 79.3 % -27.0 % 43.8 % 6.8 %
HS 560790
Twine, cordage, ropes and cables, of other materials 1 427 43.0 % 56.0 % 0.9 % 2.8 %
HS 580219
Terry towelling and similar woven terry fabrics, of cotton 820 47.4 % 92.3 % 0.2 % 1.6 %
HS 560721
Binder or baler twine, of sisal or other textile fibres of the genus Agave 444 -5.9 % 49.0 % 0.3 % 0.9 %
HS 540754
Woven fabrics of yarn containing >= 85 % by weight of textured polyester filaments 380 48.2 % 41.1 % 0.3 % 0.8 %
HS 560490
Textile yarn, strip and impregnated, coated, covered or sheathed with rubber or plastics 371 26.4 % 74.5 % 0.1 % 0.7 %
HS 560811
Made up fishing nets, of man-made textile materials 309 2.2 % 15.8 % 0.6 % 0.6 %
HS 580810 Braids in the piece 250 63.5 % 2.4 % 0.8 % 0.5 %
Source : International Trade Centre ( 2015 ).

[ KENYA TEXTILE AND CLOTHING VALUE CHAIN ROADMAP ]
74
SECTION C: TRADING ACROSS BORDERS
Table 4: Time and cost to trade across borders in Kenya, Ethiopia and the United Republic of Tanzania
Kenya Ethiopia United Republic of Tanzania
Nature of export / import procedures
Export procedures
Import procedures
Export procedures
Import procedures
Export procedures
Import procedures
Time (days)
Cost (US$)
Time (days)
Cost (US$)
Time (days)
Cost (US$)
Time (days)
Cost (US$)
Time (days)
Cost (US$)
Time (days)
Cost (US$)
Document preparation 12 305 11 250 27 520 29 700 8 270 13 575
Customs clearance and inspections 4 375 3 510 7 290 5 390 4 250 5 250
Ports and terminal handling 6 375 8 390 3 270 3 270 4 320 7 540
Inland transportation and handling 4 1 200 4 1 200 7 1 300 7 1 600 2 250 1 250
Totals 26 2 255 26 2 350 44 2 380 44 2 960 18 1 090 26 1 615
Source: World Bank (2015).2
2. Stakeholders indicated that in practice the number of days is generally lower.

[ APPENDICES ]
75
SECTION D: POTENTIAL INVESTORS
Company Products / activities Turnover ( US $ millions )
Vardhman Textiles Yarn, fabric, threads, fibre & garment 834
JBF Industries Ltd Synthetic fibre 772
Arvind Limited Denim, fabric, apparel, advanced materials 770
Trident Group Towels 624
Welspun India Ltd Home textile and synthetic yarns 570
SRF Limited Tyre cord yarn 551
Garden Silk Mills Polymers, yarn, filament and fabric 495
SEL Manufacturing Company Ltd. Yarns, knitted fabric, terry towels, ready-made garments 477
Bombay Rayon Fashions Ltd Fabrics, apparel 469
RSWM Ltd Synthetic and blended yarn, fabric, denim fabric 463
Indo Rama Synthetic Ltd Synthetic fibre and filament 424
Lakshmi Machine Works Textile machinery 362
Nahar Spinning Mills Limited Yarn and fabric 356
Raymond Limited Suiting and shirting fabric, apparel 353
KPR Mill Limited Yarn and fabric 316
Sutlej Textiles Synthetic and blended yarn, fabric, home textile 303
Filatex India Ltd Synthetic yarn 285
Mandhana Industries Pvt. Ltd Yarn dyeing, weaving, fabric printing, processing & garmenting 245
Century Enka Ltd Nylon & polyester filament yarns, polyfill yarn 237
Sangam India Limited Yarn, fabric, denim fabric 231
Indo Count Industries Ltd Yarn & knitted fabrics 227
Siyaram Silk Mills Ltd Suiting 210
Page Industries Knitwear 192
Spentex Industries Ltd Yarn and fabric 184
Gokaldas Exports Ltd Garments 179
Similar lists can be obtained for each target country from their respective sector associations or inde-pendent sector research. As an example, the follow-ing list offers the names of three of the top clothing brands and retailers in some of Kenya’s most likely sources for T&C FDI. Investment promoters would investigate the top garment factories supplying such firms and target them for investment in Kenya.

[ KENYA TEXTILE AND CLOTHING VALUE CHAIN ROADMAP ]
76
Likely FDI source countries Major brand, retailer or manufacturer Type of business
United States
GAP Specialty store
Limited Brands Specialty store
Polo Ralph Lauren Specialty store
Republic of Korea
Lotte Department store
Shinsegae Department store
Hyundai Department store
China
Youngour Group Ready-made garment manufacturer
Hongdou Group Ready-made garment manufacturer
Heilan Group Ready-made garment manufacturer
Germany
C&A Specialty store
H&M ( Sweden ) Specialty store
KiK Specialty store
Spain
Inditex ( Zara ) Specialty store
Mango Specialty store
El Corte Inglés Department store
United Kingdom
Next Specialty store
Marks and Spencer Department store
Heilan Group Ready-made garment manufacturer
Turkey
Aksa Akrilik Kimya Ready-made garment manufacturer
Korteks Mensucat Ready-made garment manufacturer
Advansa Sasa Polyester Ready-made garment manufacturer

[ APPENDICES ]
77
SECTION E: LIST OF PARTICIPANTS IN PUBLIC PRIVATE CONSULTATIONS
Name of Institution Name
1. Ministry of Industrialization and Enterprise Development - PS Dr. Wilson Songa
2. Ministry of Industrialization and Enterprise Development - Industrialization Secretary Mr. Julius Korir
3. ACTIF Jas Bedi
4. ACTIF Belinda Edmonds
5. ACTIF Joseph Nyagari
6. Africa Apparels EPZ LTD Mr. Pankaj Motilal
7. Africa of Women Entreprenure Program Zohra Baraka
8. Alliance garments Harrison Kinuthia
9. Alltex EPZ Ltd Jane Adero Okech
10. Alpha Knits Limited Mr. Hiran Bid/Mr. Sagar
11. Ashton Apparel EPZ Ltd/Atraco Group Pankaj Mehta
12. Association of Fashion Designers Sally Karago
13. Brother Knits Mohan Arora
14. Cotton Fibre Directorate Anthony Muriithi
15. Cotton Ginners Association James Mathenge
16. Designer Peggy Odhiambo
17. Equator Apparels Mr.Ndumbia
18. Export Processing Zones Authority - Kenya - CEO Cyrille Nabutola
19. Export Processing Zones Authority - Kenya - COO Fanuel Kidenda
20. Export Processing Zones Authority - Kenya - GM Investments Margaret Waithaka
21. Export Processing Zones Authority - Kenya - Head of Projects Moses Ngaruia
22. Export Processing Zones Authority - Kenya - Head of Textiles Moses Kipkebut
23. Export Promotion Council James Munyi
24. Fair Trade Africa James Mwai
25. Global Apparels Mr.Narain Shahdadpuri
26. Handloom Weavers Marketing Cooperative Society Rose Mwathi
27. IREN KENYA James Shikwati
28. Julius Rono - Solidaridad Julius Rono
29. Kapric Apparels Ltd Mr. Thomas Puthoor
30. Kenya Association of Manufacturers Betty Maina/Joseph Wairuko
31. Kenya Civil Society Association Ayoma Mutunga
32. Kenya Industrial Research and Development Institute (KIRDI) Alice Waithaka
33. Kenya Investment Authority Moses Ikiara
34. Kenya National Chamber of Commerce and Industry (KNCCI) Peter Biwott

[ KENYA TEXTILE AND CLOTHING VALUE CHAIN ROADMAP ]
78
Name of Institution Name
35. Kenya Polytechnic University Mary Nyaiyeka
36. Kenya Private Sector Alliance Carole Kariuki
37. Kenya Revenue Authority - Deputy Commissioner of Customs Ms. Rose Gichria
38. Kenya Textile Training Institute - Center Manager Mr. Festus Musyoki
39. Kiboko Leisure wear Ltd Sabine Huster
40. KIKOROMEO (Kiro Ltd) Ann MacCreath
41. Kimili Africa Sylvia Mwaura
42. Kitui Ginneries Ltd Taher Zavery
43. LOULOU CREATIONS Catherine Obam
44. Makueni Ginnery David Masika
45. MEFA Creations Evelyne Akinyi
46. Micro & Small Enterprises Authority/Federation Mathew Ashers
47. Midco Textiles (EA) Ltd Mr. Tejal Shah
48. Moi University Dr. Eric Oyondi
49. New wide Garments Kenya EPZ Ltd Heman Boodia
50. Panah Project Evgeniya Khromina
51. PVH Roy Ashurst
52. Rift Valley Products(Salawa ginnery ) Sital Panara/Ramesh Khagram
53. Rivatex East Africa Ltd - MD Mr. Thomas Kipkurgat
54. Rupa Mills (EPZ)td Mr.Tinu Shah
55. Sandstorm Mark Stephenson
56. Sunflag Textile & Knitwear Mills Ltd Mehboob Moledina
57. Tailor made Jeans EPZ ltd Samuel Meeks
58. Technology Development Center Lucy Wambugu
59. Thika Cloth Mills Ms. Tejal Dodhia
60. Tosheka Textiles Herman Bigham
61. TSS spinning & weaving mills Mr. Mwamisi
62. Ultra Kenya Ltd Sumeet Walia
63. United Aryan (EPZ) Ltd Pankaj Bedi
64. University of Nairobi Dorothy Mc Cormick
65. USAID - EATIH Kanini Mutooni
66. USAID - EATIH Finn Holm Olsen
67. Vision 2030 Seceretariat - Director Social & Political Pillars Dr. Gituro Wainaina
68. World Bank Aref Adamali

[ REFERENCES ]
79
REFERENCES
African Cotton & Textiles Industry Federation ( 2013 ). Policy Research on the Kenyan Textile Industry : Findings and Recommendations. Nairobi : ACTIF.
African Cotton & Textile Industries Federation ( 2011 ). Competitive Supply-Side Analysis of Cotton, Textile & Apparel Sectors in East Africa : Kenya, Sudan, United Republic of Tanzania and Uganda.
Akyeampong, E., Bates, R.H., Nunn, N., and Robinson, J.A., eds ( 2014 ). Africa’s Development in Historical Perspective. New York, N.Y. : Cambridge University Press.
Alexandra Wexler ( 2014 ). Cotton’s crown threatened by man-made fibers. The Wall Street Journal, April 25. Available from http : / / www.wsj.com / articles / SB100014240 52702304049904579516282130809074.
CNBC Africa ( 2015 ). KENGEN to boost Kenya’s power output. Available from http : / / www.cnbcafrica.com / news / east-africa / 2014 / 10 / 15 / kengen-increase-power / .
Encyclopedia of the Earth ( 2008 ). Water profile of Kenya. Available from http : / / www.eoearth.org / view / article / 156956.
Food and Agriculture Organization of the United Nations and International Cotton Advisory Committee ( 2013 ). World Apparel Fiber Consumption Survey. Washington, D.C. : ICAC.
Gereffi, G. and Frederick, S. ( 2010 ). The Global Apparel Value Chain, Trade, and the Crisis : Challenges and Opportunities for Developing Countries. In Global Value Chains in a Postcrisis World : A Development Perspective, Cattaneo, O., Gereffi, G. and Staritz, C., eds. Washington, D.C. : World Bank, pp.157–208.
Global Development Solutions ( 2014 ). Value Chain Analysis of Priority Industrial Sub-Sectors in Kenya, part I : Textiles and Garments.
Holby, Kate ( 2014 ). Can rags create riches? Used clothing in Kenya. Available from http : / / www.worldpolicy.org / blog / 2014 / 05 / 13 / can-rags-create-riches-used-clothing-kenya.
Information for Development Programme ( 2008 ). The Global Textile and Garments Industry : The Role of Information and Communication Technologies ( ICTs ) in Exploiting the Value Chain.
International Trade Centre ( 2015 ). Trade Map Database. Available from http : / / www.trademap.org / Index.aspx.
International Trade Centre ( 2011 ). Non-Tariff Measures Business Survey in Kenya.
Katrina Manson ( 2014 ). Investing in Kenya : textiles sector in Kenya gears up to take a larger share of world market. Financial Times, 2 December. Available from http : / / www.ft.com / cms / s / 0 / 75b7273e-6040-11e4-88d1-00144feabdc0.html#axzz3ZBq7tNDC.

[ KENYA TEXTILE AND CLOTHING VALUE CHAIN ROADMAP ]
80
Kenya Export Processing Zones Authority ( 2015 ). Website. Available from http : / / www.epzakenya.com / .
Kenya Export Processing Zones Authority ( 2013 ). The Export Business Accelerator Programme. Available from http : / / www.epzakenya.com / index.php / investment-information / epz-business-incubator.html.
Kenya Export Processing Zones Authority ( 2012 ). Export Processing Zones Program Annual Performance Report, 2012. Nairobi : EPZA.
Kenya Export Processing Zones Authority ( 2005 ). Kenya’s Apparel and Textile Industry 2005. Nairobi : EPZA.
Kenya Ministry of Industrialization and Enterprise Development ( 2015 ). Kenya’s Industrial Transformation Programme.
Kenya National Bureau of Statistics ( 2015 ). Economic Survey 2015. Nairobi : KNBS.
Kenya Vision 2030 ( 2015 ). Website. Available from http : / / www.vision2030.go.ke / .
Leonie Barrie ( 2015 ). Man-made fibres climb to 70 % of total production. Just-Style, 14 January. Available from http : / / www.just-style.com / news / man-made-fibres-climb-to-70-of-total-production_id124084.aspx.
Mangierie, Tina ( 2006 ). African Cloth, Export Production, and Secondhand Clothing in Kenya. Chapel Hill, NC : University of North Carolina at Chapel Hill.
Matjtenyi, Cathy ( 2010 ). Second-hand clothing hurting Kenya’s textile in-dustry, 16 September. Available from http : / / www.howwemadeitinafrica.com / second-hand-clothing-hurting-kenyas-textile-industry / 4026 /
Odhiambo, W., Kamau, P. and McCormick, D. ( 2015 ). Managing the chal-lenges of WTO participation : case study 20 : Kenya’s participation in the WTO : lessons learned. Available from https : / / www.wto.org / english / res_e / booksp_ e / casestudies_e / case20_e.htm.
Omolo, Jacob O. ( 2006 ). The Textiles and Clothing Industry in Kenya. In The Future of the Textile and Clothing Industry in Sub-Saharan Africa, Herbert Jauch & Rudolf Traub-Merz, eds. Bonn : Friedrich-Ebert-Stiftung.
Por t ia Crowe ( 2014 ). The global business of second-hand clothes thrives in Kenya. Reuters, 15 October. Available from http : / / www.reuters.com / article / 2014 / 10 / 15 / us-kenya-textiles-idUSKCN0I41DS20141015.
Price Waterhouse Coopers ( 2008 ). Global Sourcing : Shifting Strategies.
Regional Agricultural Trade Expansion Support Programme ( 2003 ). Cotton–Textile and Apparel Value Chain Report for Kenya. Nairobi.
Staritz, Cornelia ( 2012 ). Apparel exports – still a path for industrial development? Dynamics in apparel global value chains and implications for low-income countries. Working Paper, No. 34. Austrian Foundation for Development Research.
United Nations Conference on Trade and Development ( 2012 ). An Investment Guide to Kenya : Opportunities and Conditions 2012.

[ REFERENCES ]
81
United States Agency for International Development ( 2014 ). Strengthening the Cotton, Textile and Apparel Value Chain in East Africa : an Assessment ( draft ).
Wazir Management Consultants. Investment Opportunity for Textile Machinery Manufacturing in India : Tapping a US $ 75 billion textile machinery market by 2020.
Wazir Management Consultants ( 2013 ). The Road to 2025 : 5 Market, Trade, and Investment Trends That Will Define the Course of Textile and Apparel Industry.
World Bank ( 2015 ). Doing Business 2015 : Going Beyond Efficiency. Washington, D.C. : World Bank.
World Trade Organization ( 2012 ). Trade Policy Review Report by the Secretariat, East African Community, WT / TPR / S / 271.
World Wide Web Foundation ( 2014 ). Web Index 2014. Available from http : // thewebindex.org / .
Yarns and Fibres News Bureau ( 2014 ). Kenyan textiles industry set to grab bigger share of global market. Available from http : / / www.yarnsandfibers.com / news / textile-news / kenyan-textiles-industry-set-grab-bigger-share-global-market#.VXe-KPlViko.

FSC is an independent, non-governmental, not for profit organization established to promote the responsible management of the world´s forests.
Printed by ITC Digital Printing Service on FSC paper, which is environmentally-friendly paper (without chlorine) using vegetable-based inks. The printed matter is recyclable.
Street address: ITC, 54-56, rue de Montbrillant, 1202 Geneva, Switzerland
Postal address: ITC, Palais des Nations, 1211 Geneva 10, Switzerland
Telephone: +41-22 730 0111 Fax: +41-22 733 4439E-mail: [email protected]: www.intracen.org
financial support from:


