International Journal of Nutrition and Food Sciences 2021; 10(4): 78-85 http://www.sciencepublishinggroup.com/j/ijnfs doi: 10.11648/j.ijnfs.20211004.11 ISSN: 2327-2694 (Print); ISSN: 2327-2716 (Online) Textural and Eye Qualities of Injera Prepared from Quality Protein Maize and Teff Blended Flours Umer Asrat Yasin Food Science and Nutrition Research Directorate, Melkassa Agricultural Research Center, Ethiopian Institute of Agricultural Research, Melkassa, Ethiopia Email address: To cite this article: Umer Asrat Yasin. Textural and Eye Qualities of Injera Prepared from Quality Protein Maize and Teff Blended Flours. International Journal of Nutrition and Food Sciences. Vol. 10, No. 4, 2021, pp. 78-85. doi: 10.11648/j.ijnfs.20211004.11 Received: May 18, 2021; Accepted: July 5, 2021; Published: July 13, 2021 Abstract: Injera is fermented, leavened, flat and round pancake-like Ethiopian traditional bread, and made from cereals like teff, wheat, barley, sorghum, maize or a combination of some of these cereals. This study was conducted to investigate the effect of blending ratio and fermentation times on the textural and eye /hole/ characteristics of injera prepared from quality protein maize (QPM) and teff composite flours. Factorial design of two factors in CRD arrangement was used. The factors were blending ratio of teff flour (20%, 30%, and 40%) and fermentation times (48hr, 60hr, and 72hr). The sensory acceptability scores for eye-size, texture, and rollability were ranged from 5.08 to 5.50, 5.01 to 5.76, and 4.61 to 5.69 due to blending ratio, respectively and from 5.18 to 5.41, 5.28 to 5.48, and 5.08 to 5.29 due to fermentation times, respectively tested for fresh injera. The peak force, which indicate the firmness level of injera samples also varied significantly (p<0.05) and the values ranged between 2.23 to 3.13 N (first day) due to blending ratio and from 2.59 to 2.69 N (first day) due to fermentation times. Increasing the blending proportions of teff flour in the composite was found improving the texture, firmness, and eye qualities of QPM-teff composite injera samples. Keywords: Quality Protein Maize, Teff, Injera, Texture, Firmness 1. Introduction Native to Ethiopia and Eritrea, injera is a traditional sourdough flatbread with teff as a major ingredient [7]. However, depending on the agroecology of the area concerned different cereals (sorghum, wheat, finger millet, maize, and barley) and their blends are used to make injera [11, 5]. A good injera is soft, fluffy, and able to be rolled without cracking. It should retain these textural properties after 2 to 3 days of storage. Injera made from teff is most preferred due to its softer texture, preferred taste, its color and can be rolled without cracking. The front side of a good quality injera has uniformly spaced honeycomb-like pores traditionally called "eyes", formed due to the penetration of escaping gas that is produced during fermentation and baking, whereas the bottom surface of injera is smooth and shiny [10]. Injera prepared from quality protein maize are only preferred in their fresh state and softness does not last as long as teff injera. Upon storage, it firms rapidly and becomes friable. Because of this, the use of quality protein maize for injera making received little attention [13]. Quality protein maize (QPM) is nutritionally enhanced maize developed through conventional breeding method. It contains nearly twice the quantity of lysine (>4.0%) and tryptophan (>0.8%) present in the conventional maize [6, 8, 12]. Increasing the consumption of food products prepared from QPM is the ideal solution to problems related to malnutrition [13]. Therefore, the study planned to improve textural, rollability, and firmness qualities of injera prepared from quality protein maize flour through compositing with teff flour and identifying the fermentation time required to maximize the utilization of QPM by the consumers in the country. 2. Materials and Methods 2.1. Flour Preparations Quality protein maize (Melkassa-6Q) and teff (Magna) grains were collected from Melkassa Agricultural Research Center and Debre Zeit Agricultural Research Center of Ethiopian Institute of Agricultural Research, respectively. The grains were sorted and cleaned, and separately milled
Transcript
International Journal of Nutrition and Food Sciences 2021; 10(4): 78-85
http://www.sciencepublishinggroup.com/j/ijnfs
doi: 10.11648/j.ijnfs.20211004.11
ISSN: 2327-2694 (Print); ISSN: 2327-2716 (Online)
Textural and Eye Qualities of Injera Prepared from Quality Protein Maize and Teff Blended Flours
Umer Asrat Yasin
Food Science and Nutrition Research Directorate, Melkassa Agricultural Research Center, Ethiopian Institute of Agricultural Research,
Melkassa, Ethiopia
Email address:
To cite this article: Umer Asrat Yasin. Textural and Eye Qualities of Injera Prepared from Quality Protein Maize and Teff Blended Flours. International Journal
of Nutrition and Food Sciences. Vol. 10, No. 4, 2021, pp. 78-85. doi: 10.11648/j.ijnfs.20211004.11
Received: May 18, 2021; Accepted: July 5, 2021; Published: July 13, 2021
Abstract: Injera is fermented, leavened, flat and round pancake-like Ethiopian traditional bread, and made from cereals like teff,
wheat, barley, sorghum, maize or a combination of some of these cereals. This study was conducted to investigate the effect of
blending ratio and fermentation times on the textural and eye /hole/ characteristics of injera prepared from quality protein maize
(QPM) and teff composite flours. Factorial design of two factors in CRD arrangement was used. The factors were blending ratio
of teff flour (20%, 30%, and 40%) and fermentation times (48hr, 60hr, and 72hr). The sensory acceptability scores for eye-size,
texture, and rollability were ranged from 5.08 to 5.50, 5.01 to 5.76, and 4.61 to 5.69 due to blending ratio, respectively and from
5.18 to 5.41, 5.28 to 5.48, and 5.08 to 5.29 due to fermentation times, respectively tested for fresh injera. The peak force, which
indicate the firmness level of injera samples also varied significantly (p<0.05) and the values ranged between 2.23 to 3.13 N (first
day) due to blending ratio and from 2.59 to 2.69 N (first day) due to fermentation times. Increasing the blending proportions of
teff flour in the composite was found improving the texture, firmness, and eye qualities of QPM-teff composite injera samples.
Keywords: Quality Protein Maize, Teff, Injera, Texture, Firmness
1. Introduction
Native to Ethiopia and Eritrea, injera is a traditional
sourdough flatbread with teff as a major ingredient [7].
However, depending on the agroecology of the area concerned
different cereals (sorghum, wheat, finger millet, maize, and
barley) and their blends are used to make injera [11, 5]. A
good injera is soft, fluffy, and able to be rolled without
cracking. It should retain these textural properties after 2 to 3
days of storage. Injera made from teff is most preferred due to
its softer texture, preferred taste, its color and can be rolled
without cracking. The front side of a good quality injera has
uniformly spaced honeycomb-like pores traditionally called
"eyes", formed due to the penetration of escaping gas that is
produced during fermentation and baking, whereas the bottom
surface of injera is smooth and shiny [10].
Injera prepared from quality protein maize are only
preferred in their fresh state and softness does not last as long
as teff injera. Upon storage, it firms rapidly and becomes
friable. Because of this, the use of quality protein maize for
injera making received little attention [13]. Quality protein
maize (QPM) is nutritionally enhanced maize developed
through conventional breeding method. It contains nearly
twice the quantity of lysine (>4.0%) and tryptophan (>0.8%)
present in the conventional maize [6, 8, 12]. Increasing the
consumption of food products prepared from QPM is the
ideal solution to problems related to malnutrition [13].
Therefore, the study planned to improve textural, rollability,
and firmness qualities of injera prepared from quality protein
maize flour through compositing with teff flour and
identifying the fermentation time required to maximize the
utilization of QPM by the consumers in the country.
2. Materials and Methods
2.1. Flour Preparations
Quality protein maize (Melkassa-6Q) and teff (Magna)
grains were collected from Melkassa Agricultural Research
Center and Debre Zeit Agricultural Research Center of
Ethiopian Institute of Agricultural Research, respectively.
The grains were sorted and cleaned, and separately milled
79 Umer Asrat Yasin: Textural and Eye Qualities of Injera Prepared from Quality Protein
Maize and Teff Blended Flours
(UDY3010-019, USA) to a sieve size of 0.50 mm [13].
2.2. Injera Making
About 200 g of flour was mixed with 180 ml of water and
kneaded for 2 mins. Then, 10 ml of (5% on flour weight basis)
pre-prepared starter yeast (irsho) was poured on the dough
and left to ferment for 48, 60, and 72 hrs at room temperature.
After the primary fermentation, about 10% of the fermented
dough was taken and mixed with three parts of boiling water
and then mixed thoroughly for 1 min (absit). The mixture
was left at room temperature until the temperature dropped
and then, the mixture was added back on the fermenting
dough and mixed well. To this, 100 ml of water was added
and the mixture was let to ferment for about 3 – 4 hrs at room
temperature until a foamy slurry was formed. Then, the slurry
was poured on an electric clay stove in circular motions and
covered to cook for 2 mins [14].
2.3. Sensory Evaluation
Sensory evaluation of injera samples were carried out by 30
panelists composed of male and female. The evaluation was
carried out for freshly baked injera, on the second and third days,
respectively. The panelists were requested to test the injera
samples in terms of eye-size, texture, and rollability using seven-
point hedonic scale (1=dislike extremely, 2=dislike moderately,
3=dislike slightly, 4=neither like nor dislike, 5=like slightly,
6=like moderately, and 7=like extremely) [16].
2.4. Firmness Test
The firmness of the injera samples were measured following
the procedure described by Senayit et al. with slight
modification [10]. The peak force was determined using texture
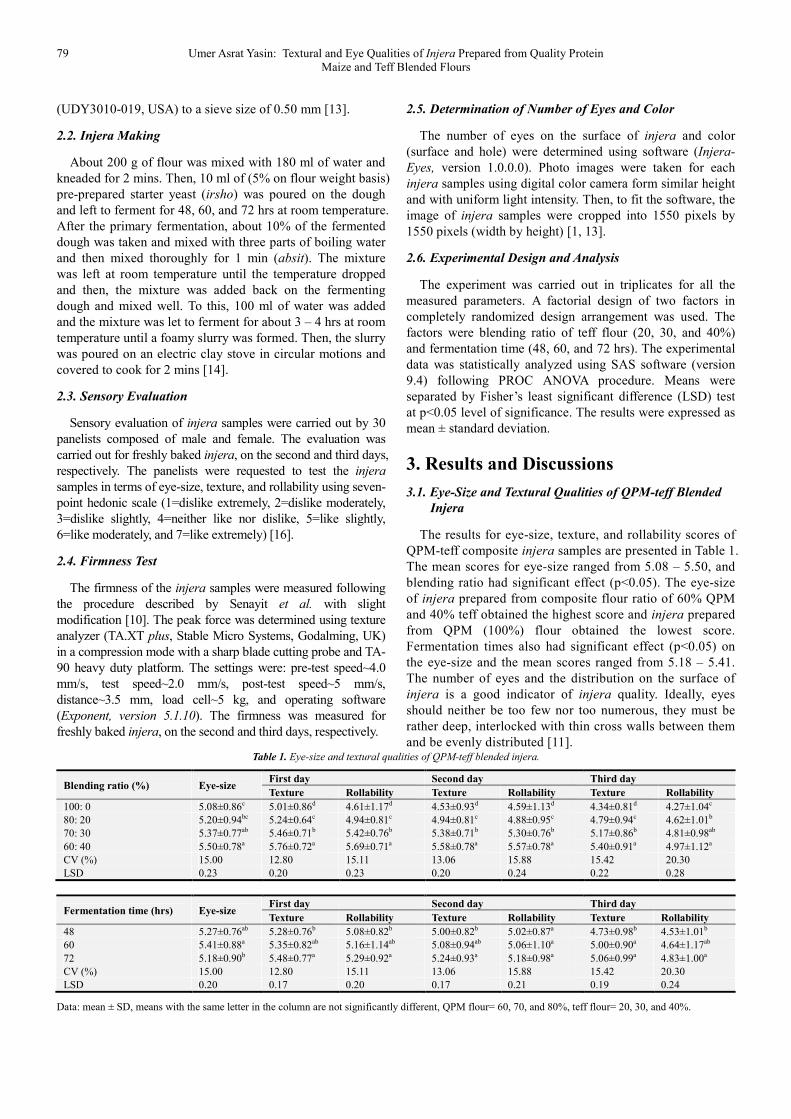
Data: mean ± SD, means with the same letter in the column are not significantly different, QPM flour= 60, 70 and 80%, teff flour= 20, 30 and 40%, L*=
lightness, a*= redness, b*= yellowness.
Figure 1. Firmness graph of QPM-teff composite injera samples fermented for 48 hr.
83 Umer Asrat Yasin: Textural and Eye Qualities of Injera Prepared from Quality Protein
Maize and Teff Blended Flours
Figure 2. Firmness graph of QPM-teff composite injera samples fermented for 60 hr.
Figure 3. Firmness graph of QPM-teff composite injera samples fermented for 72 hr.
Figure 4. Firmness graph of teff injera samples.
International Journal of Nutrition and Food Sciences 2021; 10(4): 78-85 84
Figure 5. QPM-teff blended injera samples.
4. Conclusions
Quality protein maize is nutritionally enhanced variants of
maize, and preparing injera from QPM has considerable
advantages both nutritionally and economically over teff.
However, injera prepared from QPM are only preferred in
their fresh state and softness does not last as long as teff
injera. Fermentation time is important factor that affects the
eye qualities and distributions of injera. The study showed
that, blending ratio of teff flour and fermentation times had
significant effect (p<0.05) on the eye-size, texture, rollability,
firmness, number of eyes and color (surface and hole) of
injera. As the blending proportion of teff flour increased,
better preference was observed for texture and rollability.
Lower stalling and firmness were also observed with
increasing in teff proportions.
Acknowledgements
The author is thankful to Mr. Mulate Zerihun (Food
Science Laboratory, Melkassa Agricultural Research Center)
and the staff of Melkassa Agricultural Research Center for
their helpful contribution on the sensory work.
References
[1] Attuquayefio, W. D. (2014). Influence of processing parameters on eye size and elasticity of teff-based injera. Master’s thesis: Pennsylvania State University.
[2] Bultosa, G., Hall, A. N., and Taylor, J. R. (2002). Physicochemical characterization of grain teff [Eragrostis teff (Zucc.) Trotter] starch. Starch/Stärke, 54 (10): 461–468.
[3] Goesaert, H., Brijs, K., Veraverbeke, W., Courtin, C., Gebruers, K., and Delcour, J. (2005). Wheat flour constituents: how they impact bread quality and how to impact their functionality. Trends in Food Science and Technology, 16 (1-
3): 12–30.
[4] Hayelom, B. (2018). Influence of nitrogen fertilizer rates and varieties on grain yield, grain nutrition and injera sensory quality of teff [Eragrostis teff (Zucc.) Trotter] varieties. Master’s thesis: Addis Ababa University.
[5] Kaleab, B., Claire, M. R., Christèle, I. V., Isabelle, R., and Jean-Pierre, G. (2013). Influence of flour blend composition on fermentation kinetics and phytate hydrolysis of sourdough used to make injera. Food Chemistry, 138: 430–436.
[6] Krivanek, A. F., De Groote, H., Gunaratna, N. S., Diallo, A. O., and Friesen, D. (2007). Breeding and disseminating quality protein maize (QPM) for Africa. Afr. J. Biotech., 6: 312–324.
[7] Mekonnen, M., Zarnkow, M., and Becker, T. (2014). Teff [Eragrostis teff (Zucc.) Trotter] as a raw material for malting, brewing and manufacturing of gluten-free foods and beverages: A review. J. Food Sci. Technol., 51 (11): 2881–2895.
[8] Nuss, E. T., and Tanumihardjo, S. A. (2011). Quality Protein Maize for Africa: closing the protein inadequacy gap in vulnerable populations. Advances in Nutrition, 2: 217–222.
[9] Onyango, C., Unbehend, L., Unbehend, G., and Lindhauer, M. G. (2015). Rheological properties of wheat-maize dough and their relationship with the quality of bread treated with ascorbic acid and malzperle classic bread improver. African Journal of Food Science, 9 (2): 84–91.
[10] Senayit, Y., de Kock, H. L., Rooney, L. W., and Taylor, J. R. (2004). Effects of sorghum cultivar on injera quality. Cereal Chemistry, 81 (3): 314–321.
[11] Senayit, Y., Rooney, L. W., and Taylor, J. R. (2005). Improving the quality of sorghum injera by decortication and composting with teff. Journal of the Science of Food and Agriculture, 85: 1252–1258.
[12] Sofi, P. A., Wani, S. A., Rather, A. G., and Wani, S. H. (2009). Quality protein maize (QPM): Genetic manipulation for the nutritional fortification of maize. Journal of Plant Breeding and Crop Science, 1: 244–253.
85 Umer Asrat Yasin: Textural and Eye Qualities of Injera Prepared from Quality Protein
Maize and Teff Blended Flours
[13] Umer, A. (2019). Effect of blending ratio and natural fermentation time on the qualities of injera prepared from quality protein maize and teff flours. Master’s thesis: Haramaya University.
[14] Weerasooriya, D. K., Bean, S. R., Yohannes, N., Ioerger, B. P., and Tesfaye, T. (2018). The effect of genotype and traditional food processing methods on invitro protein digestibility and micronutrient profile of sorghum cooked products. PLoS ONE, 13 (9), doi.org/10.1371/journa.pone.0203005.
[15] Yoseph, L. (2019). Process optimization and quality characterization of teff flour for the industrial manufacturing of injera. Doctoral thesis: Addis Ababa University.
[16] Zewdu, C., Gregory, R. Z., Habtamu, F., and Ashagrie, Z. (2018). Optimization and modeling of teff-maize-rice based formulation by simplex lattice mixture design for the preparation of brighter and acceptable injera. Cogent Food and Agriculture, 4: 1443381.


![Injera (An Ethnic, Traditional Staple Food of Ethiopia): A ... · composition of the Teff and teff injera from USDA data base is presented in Table 1 [19, 20] In certain aspects,](https://static.documents.pub/doc/80x56/608cd7f8f65b622c61126694/injera-an-ethnic-traditional-staple-food-of-ethiopia-a-composition-of-the.jpg)


