Texture and petrology of modern river, beach and shelf sands in a volcanic back-arc setting, northeastern Japan ? Atsushi Noda a,* a Geological Survey of Japan, National Institute of Advanced Industrial Science and Technology, Tsukuba, Higashi 1-1-1, Ibaraki 305-8567, Japan ABSTRACT The focus in the present study is on characterizing spatial patterns of textural and petrological variabilities, and on evaluating mechanisms influencing the textural and petrological components of modern river, beach and shelf sands in a volcanically active back-arc tectonic setting. Abashiri Bay and the surrounding area in eastern Hokkaido, Japan, has volcanic source land within a back-arc region associated with subduction of the Pacific Plate beneath the Okhotsk (North American) Plate. A total of 41 river, beach and shelf sands were obtained for grain-size and modal composition analyses. Multivariate analytical techniques of hierarchical cluster and principal component analyses were performed on the textural and petrological data for investigating relations among quantitative variables. On the basis of grain-size data, four sedimentary zones were identified: zone I, palimpsest zone; zone II, relict zone; zone III, modern (proteric) zone; zone IV, coastal sedimentary zone. All sands are feldspatholithic and quartz-deficient. The framework (quartz, feldspar and rock fragment) modal compositions were also classified into four clusters, A–D. The characteristic components of each cluster are as follows: cluster A, felsic volcanic rock fragments; cluster B, andesitic– basaltic volcanic rock fragments; cluster C, mixed or plagioclase; cluster D, sedimentary rock fragments. Almost all sands in western and central Abashiri Bay belong to cluster A, where the original compositions are influenced by Kutcharo pyroclastic flow deposits. Andesitic–basaltic lava and Neogene volcaniclastic and sedimentary rocks have a major influence on the compositions of shelf sands in eastern Abashiri Bay. The modal compositions are basically controlled by the source lithology. Compositional maturity (percentage of quartz to feldspar and rock fragments; Q/FR%) slightly increased, in order, from river (1.2), zone IV (coastal, 1.7), zone II (relict, 2.2), zone I (palimpsest, 3.6), to zone III (modern proteric, 7.0). Greater maturity in the recycled sediments is indicative of weathering under the sea or abrasion by transportation induced by sea-level fluctuations, waves, or sea currents. Several controlling factors – (i) source lithological; (ii) mineralogical; (iii) climatic; and (iv) geomorphological controls – might still cause low maturity through all sedimentary zones other than the continental margin sands previously reported. Key words: modern sand; beach; shelf; grain size; modal composition; multivariate analysis; provenance analysis INTRODUCTION The texture and petrology of sedimentary rocks provide ba- sic clues to paleogeographic and paleogeologic reconstructions of a basin and its hinterland. It is well known that grain-size distributions are affected by selective transportation and depo- sition (Komar, 1977; Dacey & Krumbein, 1979; McLaren & Bowles, 1985). The texture of clastic sediments has been uti- lized as a key to their sedimentary environments, such as the ? NOTICE: this is the author’s version of a work that was accepted for publication in The Island Arc vol. 14(4), p. 687–707. Changes resulting from peer review are reflected, but editing, formatting, and pagination from the publishing processes are not included in this document. A definitive version were published in DOI: 10.1111/j.1440-1738.2005.00477.x. * Corresponding author. Fax: +81 29 861 3653. Email address: [email protected](Atsushi Noda). hydraulic, climatic, and geographic conditions. The petrology of clastic materials also has been used to elucidate orogenic process, unroofing, and plate tectonic evolution (e.g. Dickinson & Suczek, 1979; Dickinson, 1985; Suczek & Ingersoll, 1985; Dorsey, 1988; Lee & Lee, 2000). Petrological properties of sediments are, however, affected by various factors, including chemical weathering, physical breakdown, abrasion, and hydro- dynamic sorting (Davies & Ethridge, 1975; Mack, 1978; Dacey & Krumbein, 1979; McLaren & Bowles, 1985; Basu, 1985; Grantham & Velbel, 1988; Johnsson, 1989, 1993). Mixing of detritus from multiple sources may further modify the initial sediment characteristics, especially when dispersal pathways are complex and involve recycling of previously deposited sed- iments (e.g. Critelli et al., 1997; Arribas et al., 2000; Garzanti et al., 2002; Critelli et al., 2003). An environmental signature (e.g. bioclasts or glauconite) may be added to the sediment causing a compositional change that is essentially unrelated to Article published in The Island Arc 14 (2005) 687–707
Transcript
Texture and petrology of modern river, beach and shelf sands in a volcanicback-arc setting, northeastern Japan?
Atsushi Noda a,∗aGeological Survey of Japan, National Institute of Advanced Industrial Science and Technology, Tsukuba, Higashi 1-1-1, Ibaraki 305-8567, Japan
ABSTRACT
The focus in the present study is on characterizing spatial patterns of textural and petrological variabilities, and on evaluating mechanismsinfluencing the textural and petrological components of modern river, beach and shelf sands in a volcanically active back-arc tectonic setting.Abashiri Bay and the surrounding area in eastern Hokkaido, Japan, has volcanic source land within a back-arc region associated with subductionof the Pacific Plate beneath the Okhotsk (North American) Plate. A total of 41 river, beach and shelf sands were obtained for grain-size andmodal composition analyses. Multivariate analytical techniques of hierarchical cluster and principal component analyses were performed on thetextural and petrological data for investigating relations among quantitative variables. On the basis of grain-size data, four sedimentary zoneswere identified: zone I, palimpsest zone; zone II, relict zone; zone III, modern (proteric) zone; zone IV, coastal sedimentary zone. All sandsare feldspatholithic and quartz-deficient. The framework (quartz, feldspar and rock fragment) modal compositions were also classified into fourclusters, A–D. The characteristic components of each cluster are as follows: cluster A, felsic volcanic rock fragments; cluster B, andesitic–basaltic volcanic rock fragments; cluster C, mixed or plagioclase; cluster D, sedimentary rock fragments. Almost all sands in western and centralAbashiri Bay belong to cluster A, where the original compositions are influenced by Kutcharo pyroclastic flow deposits. Andesitic–basalticlava and Neogene volcaniclastic and sedimentary rocks have a major influence on the compositions of shelf sands in eastern Abashiri Bay.The modal compositions are basically controlled by the source lithology. Compositional maturity (percentage of quartz to feldspar and rockfragments; Q/FR%) slightly increased, in order, from river (1.2), zone IV (coastal, 1.7), zone II (relict, 2.2), zone I (palimpsest, 3.6), to zoneIII (modern proteric, 7.0). Greater maturity in the recycled sediments is indicative of weathering under the sea or abrasion by transportationinduced by sea-level fluctuations, waves, or sea currents. Several controlling factors – (i) source lithological; (ii) mineralogical; (iii) climatic;and (iv) geomorphological controls – might still cause low maturity through all sedimentary zones other than the continental margin sandspreviously reported.
INTRODUCTIONThe texture and petrology of sedimentary rocks provide ba-
sic clues to paleogeographic and paleogeologic reconstructionsof a basin and its hinterland. It is well known that grain-sizedistributions are affected by selective transportation and depo-sition (Komar, 1977; Dacey & Krumbein, 1979; McLaren &Bowles, 1985). The texture of clastic sediments has been uti-lized as a key to their sedimentary environments, such as the
? NOTICE: this is the author’s version of a work that was accepted forpublication in The Island Arc vol. 14(4), p. 687–707. Changes resulting frompeer review are reflected, but editing, formatting, and pagination from thepublishing processes are not included in this document. A definitive versionwere published in DOI: 10.1111/j.1440-1738.2005.00477.x.∗ Corresponding author. Fax: +81 29 861 3653.
hydraulic, climatic, and geographic conditions. The petrologyof clastic materials also has been used to elucidate orogenicprocess, unroofing, and plate tectonic evolution (e.g. Dickinson& Suczek, 1979; Dickinson, 1985; Suczek & Ingersoll, 1985;Dorsey, 1988; Lee & Lee, 2000). Petrological properties ofsediments are, however, affected by various factors, includingchemical weathering, physical breakdown, abrasion, and hydro-dynamic sorting (Davies & Ethridge, 1975; Mack, 1978; Dacey& Krumbein, 1979; McLaren & Bowles, 1985; Basu, 1985;Grantham & Velbel, 1988; Johnsson, 1989, 1993). Mixing ofdetritus from multiple sources may further modify the initialsediment characteristics, especially when dispersal pathwaysare complex and involve recycling of previously deposited sed-iments (e.g. Critelli et al., 1997; Arribas et al., 2000; Garzantiet al., 2002; Critelli et al., 2003). An environmental signature(e.g. bioclasts or glauconite) may be added to the sedimentcausing a compositional change that is essentially unrelated to
Article published in The Island Arc 14 (2005) 687–707
the initial detrital spectrum.Spatial patterns of textural and petrological variabilities of
sediments may provide constraints on the geography, climate,tectonics, and lithologies of sediment source areas. An under-standing of the textural and petrological characteristics of mod-ern sediments is desirable to develop more refined provenanceinterpretation schemes, to provide a basis for evaluating pastenvironmental conditions, and to evaluate the role of erosionand sedimentation within the tectonic and hydrologic cycles.Although almost all the researchers referred to above have tar-geted fluvial or beach sands, few have studied shallow marinesands for the purpose of unraveling various influences on thesediments.
The main objectives of this study are (1) characterizing spa-tial patterns of textural and petrological variabilities, and (2)evaluating mechanisms influencing the textural and petrologi-cal components of modern river, beach, and shelf sands. Thisstudy differs from previous works in that it focuses on beachto marine sands in an actively volcanic back-arc setting. Theresults suggest that textural and petrological data for modernsediments aid in interpretation of depositional environments inancient sedimentary rocks of more ambiguous setting.
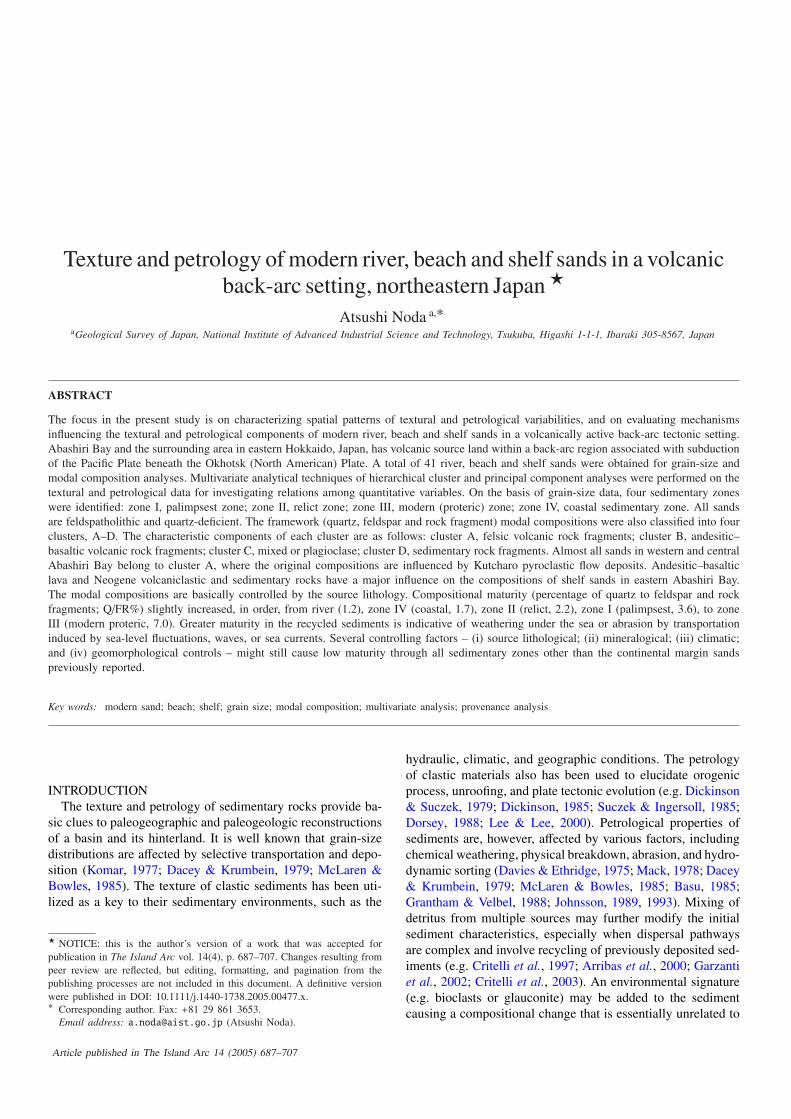
For these purposes, modern sediments were collected fromAbashiri Bay and the surrounding area in eastern Hokkaido,Japan (Fig. 1). Abashiri Bay is situated in the back-arc regionof the Inner Kuril volcanic arc where the Pacific Plate activelyconverges under the Okhotsk (North American) Plate (Fig. 1).
PHYSICAL SETTINGS
GEOLOGYThe Inner Kuril volcanic arc is made up of Tertiary volcani-
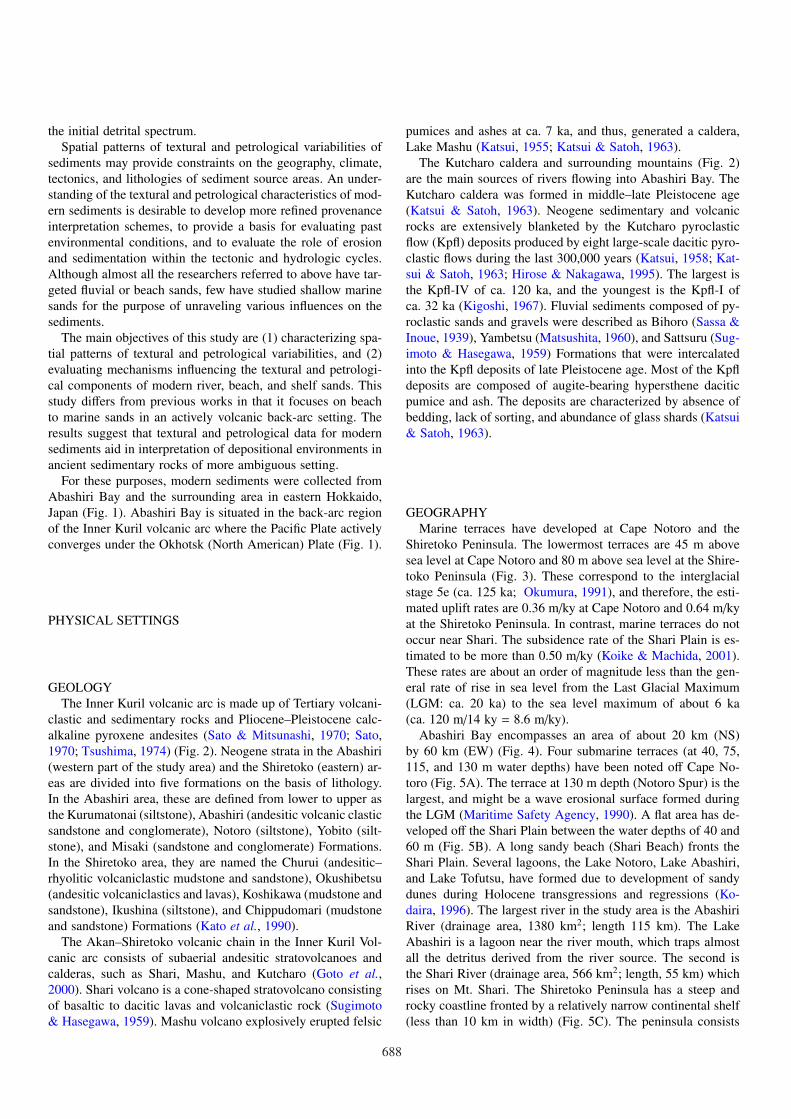
clastic and sedimentary rocks and Pliocene–Pleistocene calc-alkaline pyroxene andesites (Sato & Mitsunashi, 1970; Sato,1970; Tsushima, 1974) (Fig. 2). Neogene strata in the Abashiri(western part of the study area) and the Shiretoko (eastern) ar-eas are divided into five formations on the basis of lithology.In the Abashiri area, these are defined from lower to upper asthe Kurumatonai (siltstone), Abashiri (andesitic volcanic clasticsandstone and conglomerate), Notoro (siltstone), Yobito (silt-stone), and Misaki (sandstone and conglomerate) Formations.In the Shiretoko area, they are named the Churui (andesitic–rhyolitic volcaniclastic mudstone and sandstone), Okushibetsu(andesitic volcaniclastics and lavas), Koshikawa (mudstone andsandstone), Ikushina (siltstone), and Chippudomari (mudstoneand sandstone) Formations (Kato et al., 1990).
The Akan–Shiretoko volcanic chain in the Inner Kuril Vol-canic arc consists of subaerial andesitic stratovolcanoes andcalderas, such as Shari, Mashu, and Kutcharo (Goto et al.,2000). Shari volcano is a cone-shaped stratovolcano consistingof basaltic to dacitic lavas and volcaniclastic rock (Sugimoto& Hasegawa, 1959). Mashu volcano explosively erupted felsic
pumices and ashes at ca. 7 ka, and thus, generated a caldera,Lake Mashu (Katsui, 1955; Katsui & Satoh, 1963).
The Kutcharo caldera and surrounding mountains (Fig. 2)are the main sources of rivers flowing into Abashiri Bay. TheKutcharo caldera was formed in middle–late Pleistocene age(Katsui & Satoh, 1963). Neogene sedimentary and volcanicrocks are extensively blanketed by the Kutcharo pyroclasticflow (Kpfl) deposits produced by eight large-scale dacitic pyro-clastic flows during the last 300,000 years (Katsui, 1958; Kat-sui & Satoh, 1963; Hirose & Nakagawa, 1995). The largest isthe Kpfl-IV of ca. 120 ka, and the youngest is the Kpfl-I ofca. 32 ka (Kigoshi, 1967). Fluvial sediments composed of py-roclastic sands and gravels were described as Bihoro (Sassa &Inoue, 1939), Yambetsu (Matsushita, 1960), and Sattsuru (Sug-imoto & Hasegawa, 1959) Formations that were intercalatedinto the Kpfl deposits of late Pleistocene age. Most of the Kpfldeposits are composed of augite-bearing hypersthene daciticpumice and ash. The deposits are characterized by absence ofbedding, lack of sorting, and abundance of glass shards (Katsui& Satoh, 1963).
GEOGRAPHYMarine terraces have developed at Cape Notoro and the
Shiretoko Peninsula. The lowermost terraces are 45 m abovesea level at Cape Notoro and 80 m above sea level at the Shire-toko Peninsula (Fig. 3). These correspond to the interglacialstage 5e (ca. 125 ka; Okumura, 1991), and therefore, the esti-mated uplift rates are 0.36 m/ky at Cape Notoro and 0.64 m/kyat the Shiretoko Peninsula. In contrast, marine terraces do notoccur near Shari. The subsidence rate of the Shari Plain is es-timated to be more than 0.50 m/ky (Koike & Machida, 2001).These rates are about an order of magnitude less than the gen-eral rate of rise in sea level from the Last Glacial Maximum(LGM: ca. 20 ka) to the sea level maximum of about 6 ka(ca. 120 m/14 ky = 8.6 m/ky).
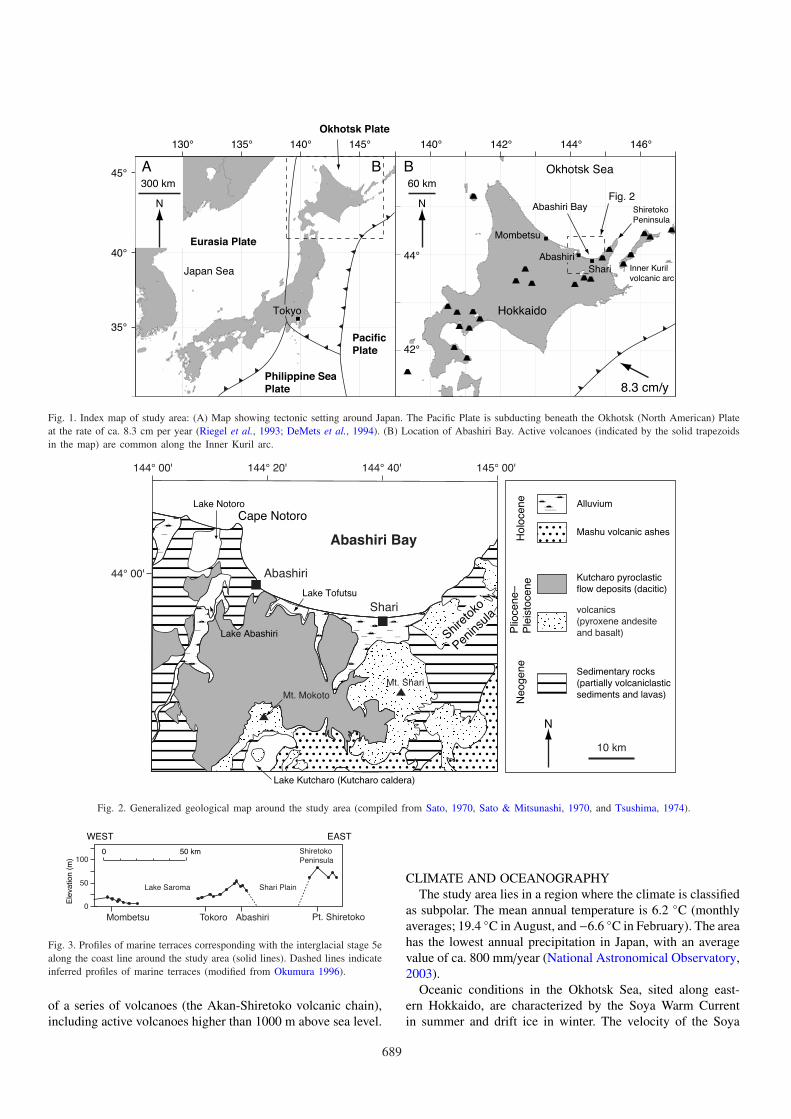
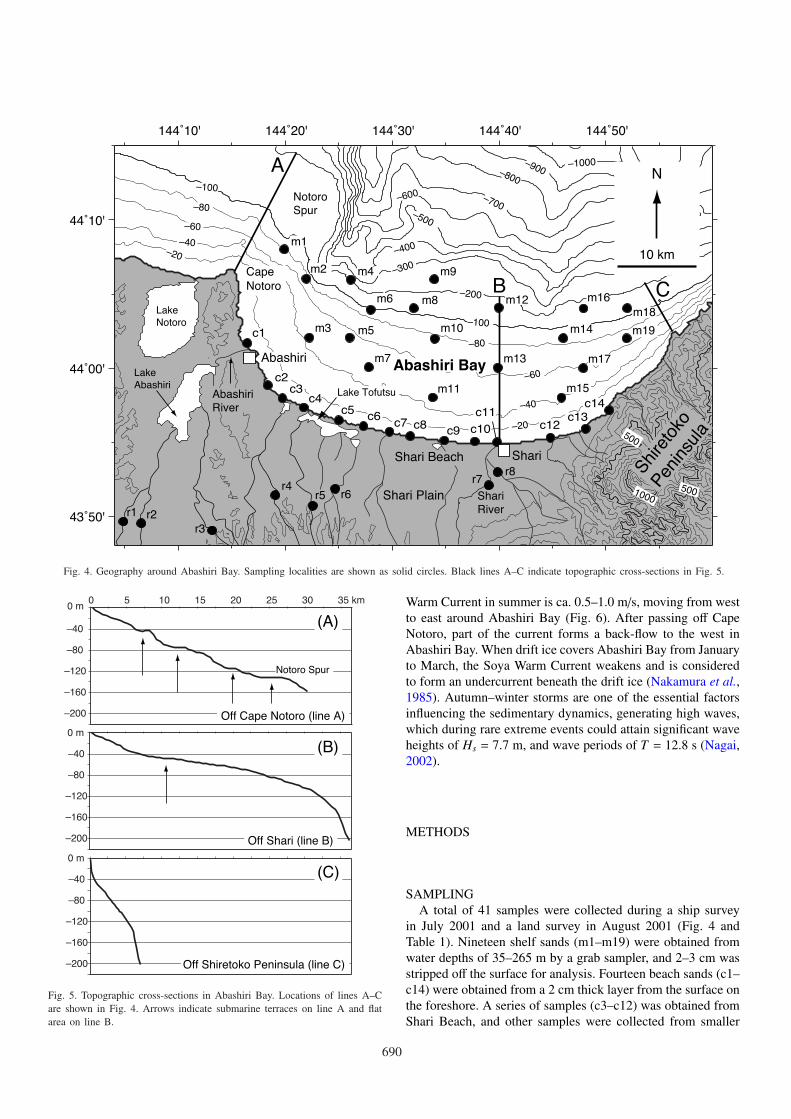
Abashiri Bay encompasses an area of about 20 km (NS)by 60 km (EW) (Fig. 4). Four submarine terraces (at 40, 75,115, and 130 m water depths) have been noted off Cape No-toro (Fig. 5A). The terrace at 130 m depth (Notoro Spur) is thelargest, and might be a wave erosional surface formed duringthe LGM (Maritime Safety Agency, 1990). A flat area has de-veloped off the Shari Plain between the water depths of 40 and60 m (Fig. 5B). A long sandy beach (Shari Beach) fronts theShari Plain. Several lagoons, the Lake Notoro, Lake Abashiri,and Lake Tofutsu, have formed due to development of sandydunes during Holocene transgressions and regressions (Ko-daira, 1996). The largest river in the study area is the AbashiriRiver (drainage area, 1380 km2; length 115 km). The LakeAbashiri is a lagoon near the river mouth, which traps almostall the detritus derived from the river source. The second isthe Shari River (drainage area, 566 km2; length, 55 km) whichrises on Mt. Shari. The Shiretoko Peninsula has a steep androcky coastline fronted by a relatively narrow continental shelf(less than 10 km in width) (Fig. 5C). The peninsula consists
688
130° 135° 140° 145°
35°
40°
45°
Hokkaido
Japan Sea
140° 142° 144° 146°
44°
Okhotsk Sea
Shiretoko
Peninsula
42°
Eurasia Plate
Philippine Sea
Plate
Pacific
Plate
Okhotsk Plate
300 km
8.3 cm/y
Fig. 2N
60 km
N
Tokyo
Abashiri
Mombetsu
Shari
Abashiri Bay
A BB
Inner Kuril
volcanic arc
Fig. 1. Index map of study area: (A) Map showing tectonic setting around Japan. The Pacific Plate is subducting beneath the Okhotsk (North American) Plateat the rate of ca. 8.3 cm per year (Riegel et al., 1993; DeMets et al., 1994). (B) Location of Abashiri Bay. Active volcanoes (indicated by the solid trapezoidsin the map) are common along the Inner Kuril arc.
44° 00'
144° 00' 144° 40'144° 20' 145° 00'
Alluvium
Mashu volcanic ashes
Sedimentary rocks
(partially volcaniclastic
sediments and lavas)
Ho
loce
ne
Plio
ce
ne
–P
leis
toce
ne
Ne
og
en
e
Kutcharo pyroclastic
flow deposits (dacitic)
volcanics
(pyroxene andesite
and basalt)
Abashiri
Abashiri Bay
Shari
Mt. Shari
Mt. Mokoto
10 km
N
Cape Notoro
Shire
toko
Penin
sula
Lake Kutcharo (Kutcharo caldera)
Lake Abashiri
Lake Notoro
Lake Tofutsu
Fig. 2. Generalized geological map around the study area (compiled from Sato, 1970, Sato & Mitsunashi, 1970, and Tsushima, 1974).
Tokoro AbashiriMombetsu Pt. Shiretoko
Shari Plain
Shiretoko
Peninsula
Lake Saroma
100
50
0
0 50 km
Ele
va
tio
n (
m)
WEST EAST
Fig. 3. Profiles of marine terraces corresponding with the interglacial stage 5ealong the coast line around the study area (solid lines). Dashed lines indicateinferred profiles of marine terraces (modified from Okumura 1996).
of a series of volcanoes (the Akan-Shiretoko volcanic chain),including active volcanoes higher than 1000 m above sea level.
CLIMATE AND OCEANOGRAPHYThe study area lies in a region where the climate is classified
as subpolar. The mean annual temperature is 6.2 ◦C (monthlyaverages; 19.4 ◦C in August, and −6.6 ◦C in February). The areahas the lowest annual precipitation in Japan, with an averagevalue of ca. 800 mm/year (National Astronomical Observatory,2003).
Oceanic conditions in the Okhotsk Sea, sited along east-ern Hokkaido, are characterized by the Soya Warm Currentin summer and drift ice in winter. The velocity of the Soya
689
144˚10' 144˚20' 144˚30' 144˚40' 144˚50'
43˚50'
44˚00'
44˚10'
500
5001000
–100
–80
–60
–40
–40
–100
–80
–60
–20
–20
–600
–500
–400
–300
–200
–700
–800
Abashiri
CapeNotoro
Shi
reto
ko
Pen
insu
la
Shari Plain
Shari Beach
NotoroSpur
AbashiriRiver
ShariRiver
Abashiri Bay
–900–1000A
B C
10 km
N
m2
m3
m7
m11
m13
m15
m14
m18m12
m9
m6
m10
m1
m4
m5
m8 m16
m17
m19c1
c12
c14c13c11
c9 c10
c2c3
c4c5
c6c7 c8
r1 r2r3
r6
r7r8
r4r5
Shari
LakeAbashiri
LakeNotoro
Lake Tofutsu
Fig. 4. Geography around Abashiri Bay. Sampling localities are shown as solid circles. Black lines A–C indicate topographic cross-sections in Fig. 5.
0 10 15 20 25 30 35 km
–200
–160
–120
–80
–40
0 m5
–200
–160
–120
–80
–40
0 m
–200
–160
–120
–80
–40
0 m
Off Cape Notoro (line A)
Off Shari (line B)
Off Shiretoko Peninsula (line C)
(A)
(B)
Notoro Spur
(C)
Fig. 5. Topographic cross-sections in Abashiri Bay. Locations of lines A–Care shown in Fig. 4. Arrows indicate submarine terraces on line A and flatarea on line B.
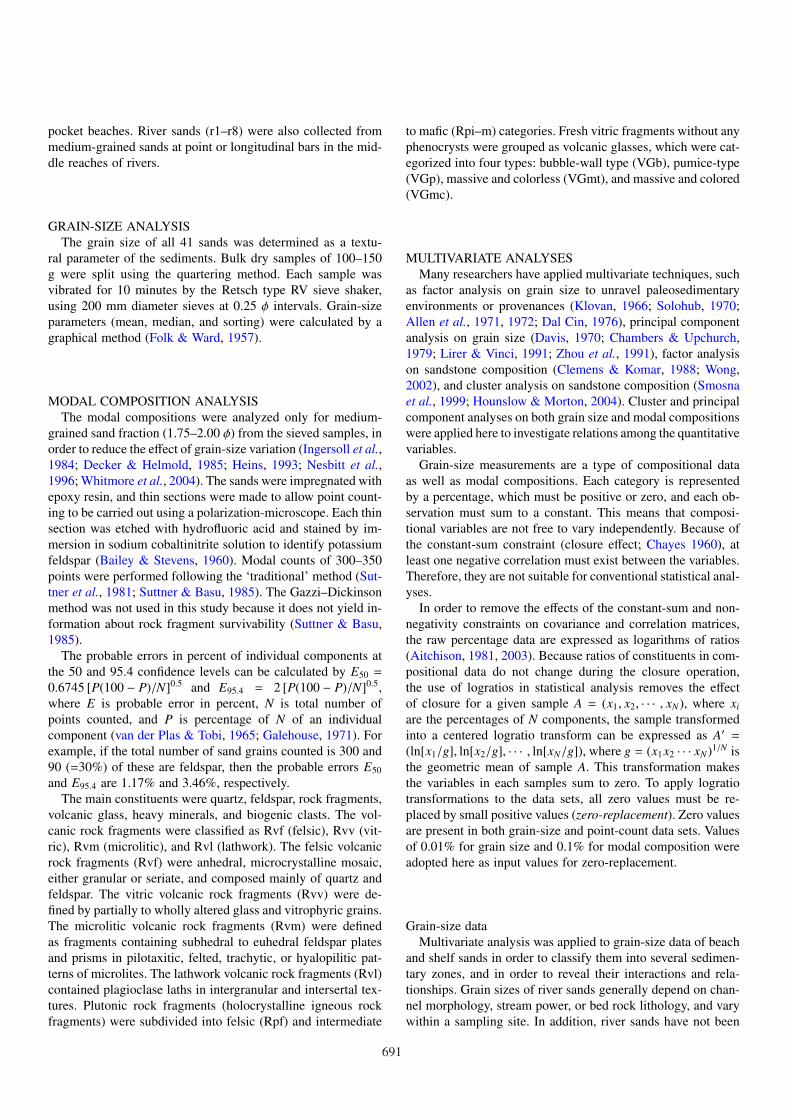
Warm Current in summer is ca. 0.5–1.0 m/s, moving from westto east around Abashiri Bay (Fig. 6). After passing off CapeNotoro, part of the current forms a back-flow to the west inAbashiri Bay. When drift ice covers Abashiri Bay from Januaryto March, the Soya Warm Current weakens and is consideredto form an undercurrent beneath the drift ice (Nakamura et al.,1985). Autumn–winter storms are one of the essential factorsinfluencing the sedimentary dynamics, generating high waves,which during rare extreme events could attain significant waveheights of Hs = 7.7 m, and wave periods of T = 12.8 s (Nagai,2002).
METHODS
SAMPLINGA total of 41 samples were collected during a ship survey
in July 2001 and a land survey in August 2001 (Fig. 4 andTable 1). Nineteen shelf sands (m1–m19) were obtained fromwater depths of 35–265 m by a grab sampler, and 2–3 cm wasstripped off the surface for analysis. Fourteen beach sands (c1–c14) were obtained from a 2 cm thick layer from the surface onthe foreshore. A series of samples (c3–c12) was obtained fromShari Beach, and other samples were collected from smaller
690
pocket beaches. River sands (r1–r8) were also collected frommedium-grained sands at point or longitudinal bars in the mid-dle reaches of rivers.
GRAIN-SIZE ANALYSISThe grain size of all 41 sands was determined as a textu-
ral parameter of the sediments. Bulk dry samples of 100–150g were split using the quartering method. Each sample wasvibrated for 10 minutes by the Retsch type RV sieve shaker,using 200 mm diameter sieves at 0.25 φ intervals. Grain-sizeparameters (mean, median, and sorting) were calculated by agraphical method (Folk & Ward, 1957).
MODAL COMPOSITION ANALYSISThe modal compositions were analyzed only for medium-
grained sand fraction (1.75–2.00 φ) from the sieved samples, inorder to reduce the effect of grain-size variation (Ingersoll et al.,1984; Decker & Helmold, 1985; Heins, 1993; Nesbitt et al.,1996; Whitmore et al., 2004). The sands were impregnated withepoxy resin, and thin sections were made to allow point count-ing to be carried out using a polarization-microscope. Each thinsection was etched with hydrofluoric acid and stained by im-mersion in sodium cobaltinitrite solution to identify potassiumfeldspar (Bailey & Stevens, 1960). Modal counts of 300–350points were performed following the ‘traditional’ method (Sut-tner et al., 1981; Suttner & Basu, 1985). The Gazzi–Dickinsonmethod was not used in this study because it does not yield in-formation about rock fragment survivability (Suttner & Basu,1985).
The probable errors in percent of individual components atthe 50 and 95.4 confidence levels can be calculated by E50 =
0.6745 [P(100 − P)/N]0.5 and E95.4 = 2 [P(100 − P)/N]0.5,where E is probable error in percent, N is total number ofpoints counted, and P is percentage of N of an individualcomponent (van der Plas & Tobi, 1965; Galehouse, 1971). Forexample, if the total number of sand grains counted is 300 and90 (=30%) of these are feldspar, then the probable errors E50and E95.4 are 1.17% and 3.46%, respectively.
The main constituents were quartz, feldspar, rock fragments,volcanic glass, heavy minerals, and biogenic clasts. The vol-canic rock fragments were classified as Rvf (felsic), Rvv (vit-ric), Rvm (microlitic), and Rvl (lathwork). The felsic volcanicrock fragments (Rvf) were anhedral, microcrystalline mosaic,either granular or seriate, and composed mainly of quartz andfeldspar. The vitric volcanic rock fragments (Rvv) were de-fined by partially to wholly altered glass and vitrophyric grains.The microlitic volcanic rock fragments (Rvm) were definedas fragments containing subhedral to euhedral feldspar platesand prisms in pilotaxitic, felted, trachytic, or hyalopilitic pat-terns of microlites. The lathwork volcanic rock fragments (Rvl)contained plagioclase laths in intergranular and intersertal tex-tures. Plutonic rock fragments (holocrystalline igneous rockfragments) were subdivided into felsic (Rpf) and intermediate
to mafic (Rpi–m) categories. Fresh vitric fragments without anyphenocrysts were grouped as volcanic glasses, which were cat-egorized into four types: bubble-wall type (VGb), pumice-type(VGp), massive and colorless (VGmt), and massive and colored(VGmc).
MULTIVARIATE ANALYSESMany researchers have applied multivariate techniques, such
as factor analysis on grain size to unravel paleosedimentaryenvironments or provenances (Klovan, 1966; Solohub, 1970;Allen et al., 1971, 1972; Dal Cin, 1976), principal componentanalysis on grain size (Davis, 1970; Chambers & Upchurch,1979; Lirer & Vinci, 1991; Zhou et al., 1991), factor analysison sandstone composition (Clemens & Komar, 1988; Wong,2002), and cluster analysis on sandstone composition (Smosnaet al., 1999; Hounslow & Morton, 2004). Cluster and principalcomponent analyses on both grain size and modal compositionswere applied here to investigate relations among the quantitativevariables.
Grain-size measurements are a type of compositional dataas well as modal compositions. Each category is representedby a percentage, which must be positive or zero, and each ob-servation must sum to a constant. This means that composi-tional variables are not free to vary independently. Because ofthe constant-sum constraint (closure effect; Chayes 1960), atleast one negative correlation must exist between the variables.Therefore, they are not suitable for conventional statistical anal-yses.
In order to remove the effects of the constant-sum and non-negativity constraints on covariance and correlation matrices,the raw percentage data are expressed as logarithms of ratios(Aitchison, 1981, 2003). Because ratios of constituents in com-positional data do not change during the closure operation,the use of logratios in statistical analysis removes the effectof closure for a given sample A = (x1, x2, · · · , xN), where xi
are the percentages of N components, the sample transformedinto a centered logratio transform can be expressed as A′ =(ln[x1/g], ln[x2/g], · · · , ln[xN/g]), where g = (x1x2 · · · xN)1/N isthe geometric mean of sample A. This transformation makesthe variables in each samples sum to zero. To apply logratiotransformations to the data sets, all zero values must be re-placed by small positive values (zero-replacement). Zero valuesare present in both grain-size and point-count data sets. Valuesof 0.01% for grain size and 0.1% for modal composition wereadopted here as input values for zero-replacement.
Grain-size dataMultivariate analysis was applied to grain-size data of beach
and shelf sands in order to classify them into several sedimen-tary zones, and in order to reveal their interactions and rela-tionships. Grain sizes of river sands generally depend on chan-nel morphology, stream power, or bed rock lithology, and varywithin a sampling site. In addition, river sands have not been
691
Table 1Localities and grain-size parameters of the sand samples.
Depth Median Mean Sorting GR VCS CS MS FS VFS(m) (ø) (ø) (ø) (%) (%) (%) (%) (%) (%)
Fig. 6. Distribution of current velocities around Abashiri Bay during summer (Japan Oceanographic Data Center, 2003). The westerly Soya Warm Currentdominates in the surface water.
affected by oceanic waves, currents, or sea level changes thathave influenced beach and shelf sands. It is meaningless to tryto incorporate river sands in the same classification as that ofbeach and shelf sands, so they were excluded from the analysis.
The usefulness of the median grain size (Mdφ) as a gen-eral discriminator is limited because it does not reflect theoverall grain-size distribution of a sediment. The interpreta-tion of Mdφ and standard deviation (sorting value or σφ) as-sumes that the grain-size distribution of a sample is approxi-mately log-normal. Cluster and principal component analyseswere here applied to whole grain-size data grouped into sixclasses: gravel, very coarse-grained sand, coarse-grained sand,medium-grained sand, fine-grained sand, and very fine-grainedsand (Table 1). Due to low percentages of materials > 4.0 φ,this fraction was included in the very fine-grained sand class.Percentage data of the six grain-size classes were transformedinto centered logratios before multivariate analysis was applied.
Hierarchical cluster analysis was used for determining themembership of groupings of samples with similar sets. Theanalysis was performed employing the Euclidean distances andWard’s method (Swan & Sandilands, 1995).
Principal component analysis was used to determine intercor-relations between variables and similarities between samples(Swan & Sandilands, 1995). Biplots were used here to graph-ically depict patterns of relative variations of multivariate datasets by projection onto planes fixed by principal components(e.g. Aitchison, 1990; von Eynatten et al., 2003). The origin andaxes of the biplot correspond to the center (geometric mean)of the entire data and principal components of the log-centereddata, respectively. An advantage of biplots is that they repre-
Md
(ø
)
–2
–1.5
–1
–0.5
0
0.5
1
1.5
2
2.5 0
0.2
0.4
0.6
0.8
1
So
rtin
g (
ø)
Md (ø)Sorting (ø)
c4c2 c6 c8 c10 c12 c14
c1 c7c5 c9 c11 c13c3
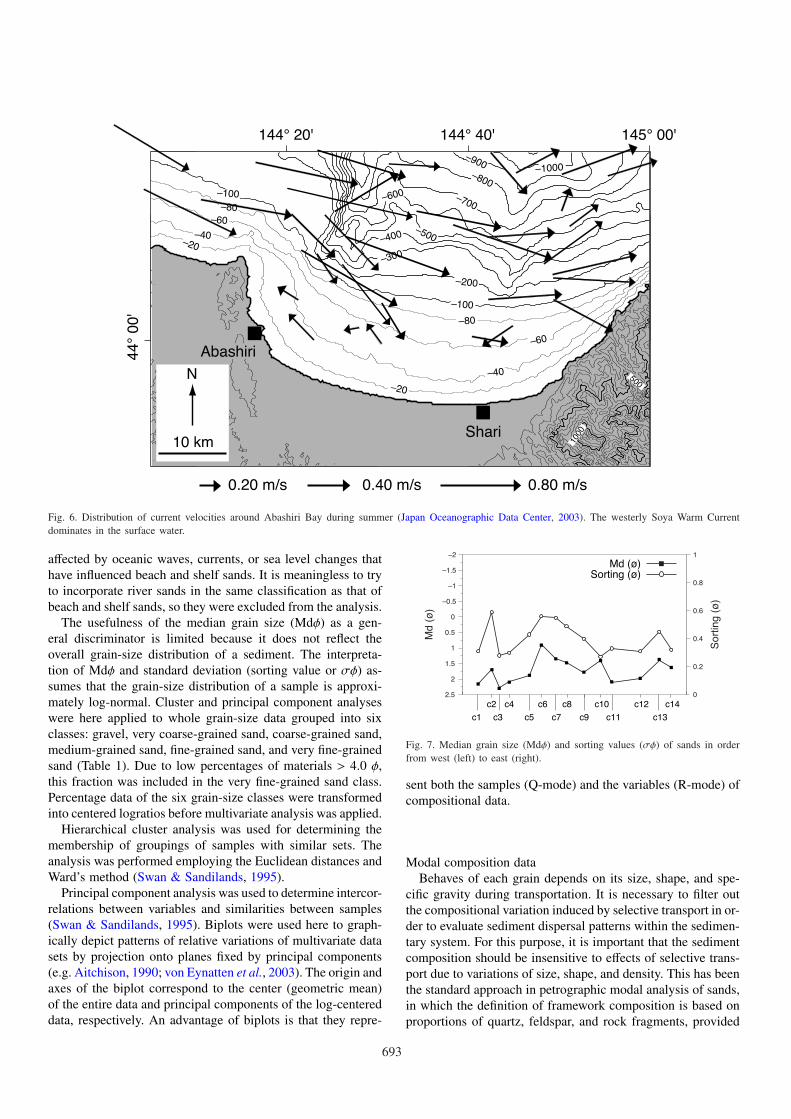
Fig. 7. Median grain size (Mdφ) and sorting values (σφ) of sands in orderfrom west (left) to east (right).
sent both the samples (Q-mode) and the variables (R-mode) ofcompositional data.
Modal composition dataBehaves of each grain depends on its size, shape, and spe-
cific gravity during transportation. It is necessary to filter outthe compositional variation induced by selective transport in or-der to evaluate sediment dispersal patterns within the sedimen-tary system. For this purpose, it is important that the sedimentcomposition should be insensitive to effects of selective trans-port due to variations of size, shape, and density. This has beenthe standard approach in petrographic modal analysis of sands,in which the definition of framework composition is based onproportions of quartz, feldspar, and rock fragments, provided
693
that the grains are of approximately the same size. In general,most of these framework grains show high sphericity and simi-lar density. It indicates that their proportions are not likely to beaffected by selective transport. This allows distinction of com-positional variation induced by selective transport from othermechanisms, such as weathering or mixing of multiple sourcecompositions (Weltje, 1995; Weltje & Prins, 2003).
Multivariate analyses were applied for the framework (QFR)compositions classified into 10 subgroups: total quartz (Q),potassium feldspar (K), total plagioclase (P), felsic volcanicrock fragments (Rvf), vitric volcanic rock fragments (Rvv), mi-crolitic volcanic rock fragments (Rvm), lathwork volcanic rockfragments (Rvl), felsic plutonic rock fragment, intermediate–mafic plutonic rock fragment (Rpi–m), and sedimentary rockfragments (Rs). The sum of 10 subgroups was recalculated to100%, and each group was transformed into centered logratiosin the same way as the grain-size data.
RESULTS
GRAIN SIZE
Coastal sandsFourteen of the beach sands are medium- to fine-grained
(1.35–2.16 Mdφ) and only one (c6) that is coarse-grained (0.91Mdφ) (Table 1 and Fig. 7). The samples are very well to mod-erately well sorted (0.27–0.59 φ). Median grain size (Mdφ) andsorting values (σφ) delineate a change of grain-size character-istics along the shoreline (Fig. 7). The median grain size ofsample c6 is the coarsest and its sorting is the poorest among aseries of Shari Beach sands (c3–c12). Median grain sizes fine,and sortings improve both eastward and westward from c6.
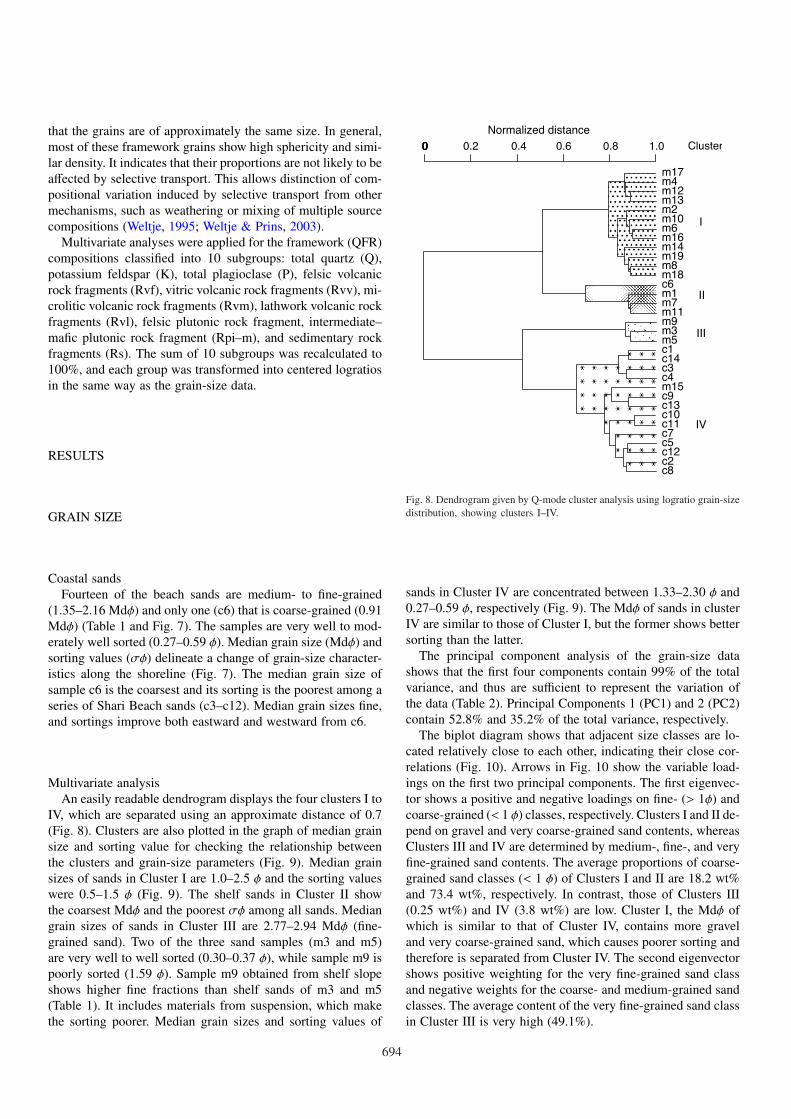
Multivariate analysisAn easily readable dendrogram displays the four clusters I to
IV, which are separated using an approximate distance of 0.7(Fig. 8). Clusters are also plotted in the graph of median grainsize and sorting value for checking the relationship betweenthe clusters and grain-size parameters (Fig. 9). Median grainsizes of sands in Cluster I are 1.0–2.5 φ and the sorting valueswere 0.5–1.5 φ (Fig. 9). The shelf sands in Cluster II showthe coarsest Mdφ and the poorest σφ among all sands. Mediangrain sizes of sands in Cluster III are 2.77–2.94 Mdφ (fine-grained sand). Two of the three sand samples (m3 and m5)are very well to well sorted (0.30–0.37 φ), while sample m9 ispoorly sorted (1.59 φ). Sample m9 obtained from shelf slopeshows higher fine fractions than shelf sands of m3 and m5(Table 1). It includes materials from suspension, which makethe sorting poorer. Median grain sizes and sorting values of
Fig. 8. Dendrogram given by Q-mode cluster analysis using logratio grain-sizedistribution, showing clusters I–IV.
sands in Cluster IV are concentrated between 1.33–2.30 φ and0.27–0.59 φ, respectively (Fig. 9). The Mdφ of sands in clusterIV are similar to those of Cluster I, but the former shows bettersorting than the latter.
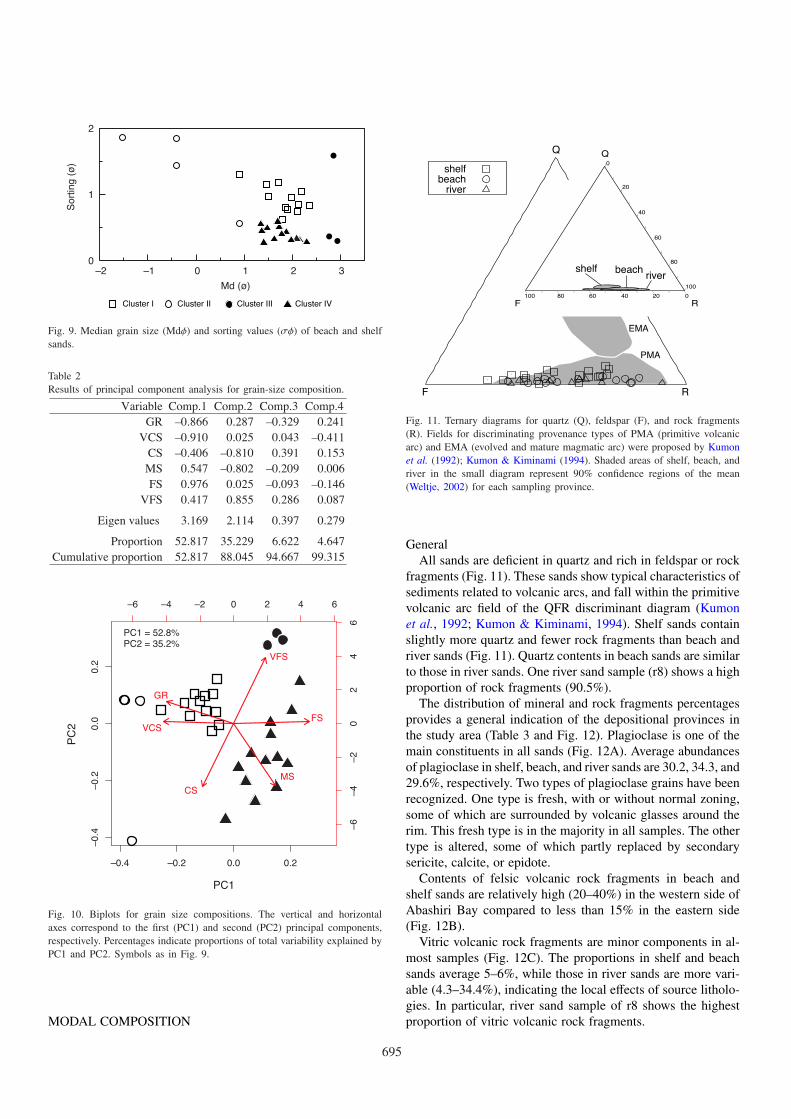
The principal component analysis of the grain-size datashows that the first four components contain 99% of the totalvariance, and thus are sufficient to represent the variation ofthe data (Table 2). Principal Components 1 (PC1) and 2 (PC2)contain 52.8% and 35.2% of the total variance, respectively.
The biplot diagram shows that adjacent size classes are lo-cated relatively close to each other, indicating their close cor-relations (Fig. 10). Arrows in Fig. 10 show the variable load-ings on the first two principal components. The first eigenvec-tor shows a positive and negative loadings on fine- (> 1φ) andcoarse-grained (< 1 φ) classes, respectively. Clusters I and II de-pend on gravel and very coarse-grained sand contents, whereasClusters III and IV are determined by medium-, fine-, and veryfine-grained sand contents. The average proportions of coarse-grained sand classes (< 1 φ) of Clusters I and II are 18.2 wt%and 73.4 wt%, respectively. In contrast, those of Clusters III(0.25 wt%) and IV (3.8 wt%) are low. Cluster I, the Mdφ ofwhich is similar to that of Cluster IV, contains more graveland very coarse-grained sand, which causes poorer sorting andtherefore is separated from Cluster IV. The second eigenvectorshows positive weighting for the very fine-grained sand classand negative weights for the coarse- and medium-grained sandclasses. The average content of the very fine-grained sand classin Cluster III is very high (49.1%).
694
0
1
2
–2 –1 0 1 2 3
So
rtin
g (
ø)
Md (ø)
Cluster I Cluster IVCluster IIICluster II
Fig. 9. Median grain size (Mdφ) and sorting values (σφ) of beach and shelfsands.
Table 2Results of principal component analysis for grain-size composition.
Variable Comp.1 Comp.2 Comp.3 Comp.4
GR –0.866 0.287 –0.329 0.241
VCS –0.910 0.025 0.043 –0.411
CS –0.406 –0.810 0.391 0.153
MS 0.547 –0.802 –0.209 0.006
FS 0.976 0.025 –0.093 –0.146
VFS 0.417 0.855 0.286 0.087
Eigen values 3.169 2.114 0.397 0.279
Proportion 52.817 35.229 6.622 4.647
Cumulative proportion 52.817 88.045 94.667 99.315
–0.4 –0.2 0.0 0.2
–0
.4–
0.2
0.0
0.2
PC1
PC
2
–4 –2 0 2 4 6
–6
–4
–2
02
46
–6
PC1 = 52.8%
PC2 = 35.2%
GR
VCS
CS
MS
FS
VFS
Fig. 10. Biplots for grain size compositions. The vertical and horizontalaxes correspond to the first (PC1) and second (PC2) principal components,respectively. Percentages indicate proportions of total variability explained byPC1 and PC2. Symbols as in Fig. 9.
MODAL COMPOSITION
EMA
PMA
rivershelf beach
Q
F R0
100
80
60
0
20
40
60 40 2080100
river
F R
Q
shelf
beach
Fig. 11. Ternary diagrams for quartz (Q), feldspar (F), and rock fragments(R). Fields for discriminating provenance types of PMA (primitive volcanicarc) and EMA (evolved and mature magmatic arc) were proposed by Kumonet al. (1992); Kumon & Kiminami (1994). Shaded areas of shelf, beach, andriver in the small diagram represent 90% confidence regions of the mean(Weltje, 2002) for each sampling province.
GeneralAll sands are deficient in quartz and rich in feldspar or rock
fragments (Fig. 11). These sands show typical characteristics ofsediments related to volcanic arcs, and fall within the primitivevolcanic arc field of the QFR discriminant diagram (Kumonet al., 1992; Kumon & Kiminami, 1994). Shelf sands containslightly more quartz and fewer rock fragments than beach andriver sands (Fig. 11). Quartz contents in beach sands are similarto those in river sands. One river sand sample (r8) shows a highproportion of rock fragments (90.5%).
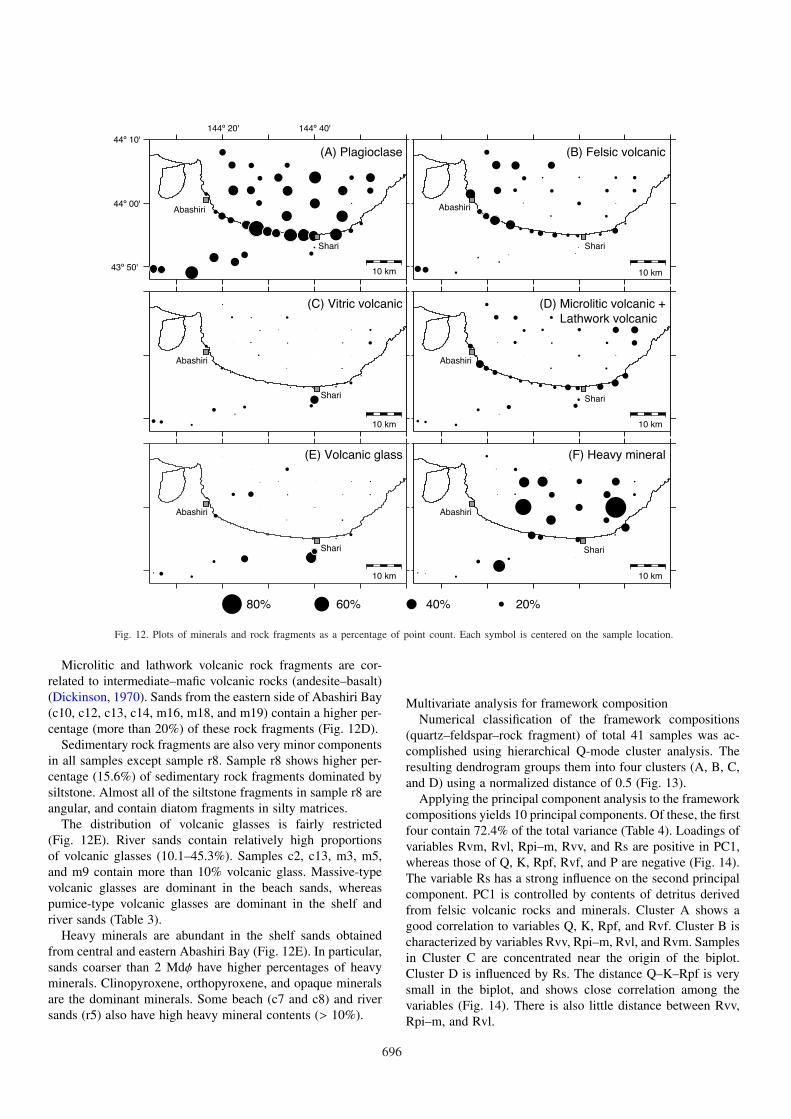
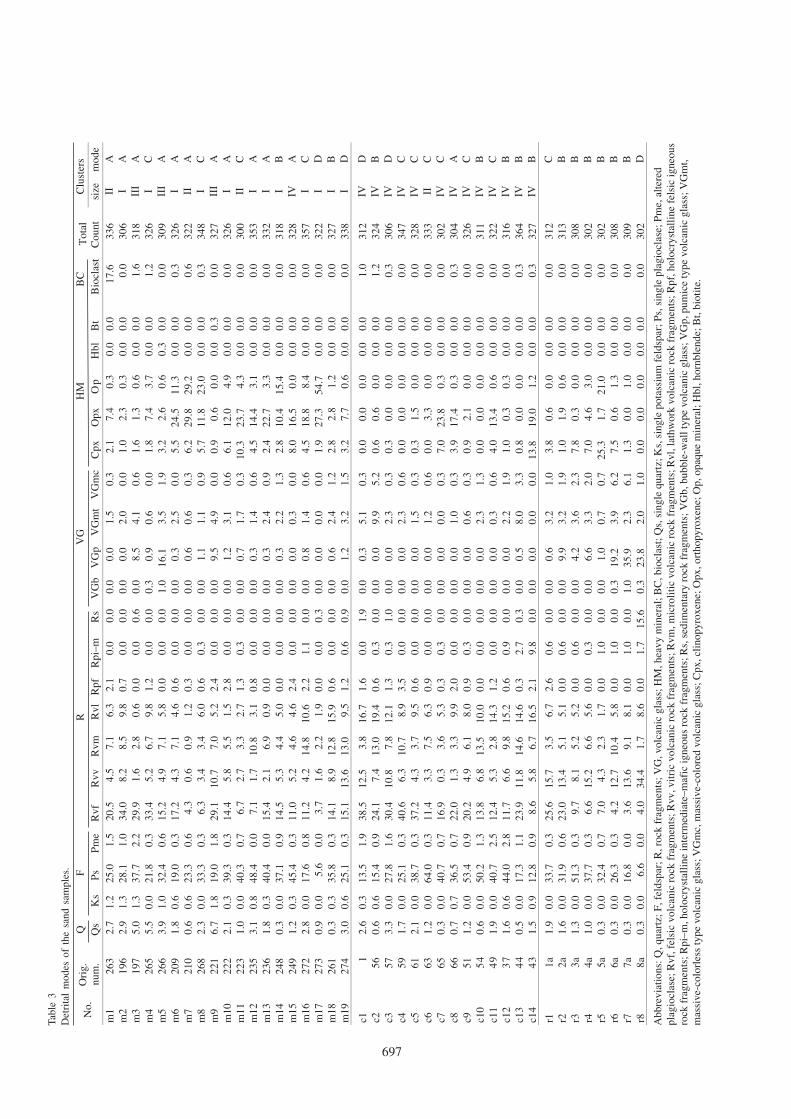
The distribution of mineral and rock fragments percentagesprovides a general indication of the depositional provinces inthe study area (Table 3 and Fig. 12). Plagioclase is one of themain constituents in all sands (Fig. 12A). Average abundancesof plagioclase in shelf, beach, and river sands are 30.2, 34.3, and29.6%, respectively. Two types of plagioclase grains have beenrecognized. One type is fresh, with or without normal zoning,some of which are surrounded by volcanic glasses around therim. This fresh type is in the majority in all samples. The othertype is altered, some of which partly replaced by secondarysericite, calcite, or epidote.
Contents of felsic volcanic rock fragments in beach andshelf sands are relatively high (20–40%) in the western side ofAbashiri Bay compared to less than 15% in the eastern side(Fig. 12B).
Vitric volcanic rock fragments are minor components in al-most samples (Fig. 12C). The proportions in shelf and beachsands average 5–6%, while those in river sands are more vari-able (4.3–34.4%), indicating the local effects of source litholo-gies. In particular, river sand sample of r8 shows the highestproportion of vitric volcanic rock fragments.
695
10 km
10 km
10 km
10 km
10 km
10 km
(B) Felsic volcanic(A) Plagioclase
(E) Volcanic glass (F) Heavy mineral
(D) Microlitic volcanic +
Lathwork volcanic
(C) Vitric volcanic
Abashiri
Abashiri
Abashiri Abashiri
Abashiri
Abashiri
ShariShari
ShariShari
ShariShari
144º 20'
44º 00'
44º 10'
144º 40'
43º 50'
80% 60% 40% 20%
Fig. 12. Plots of minerals and rock fragments as a percentage of point count. Each symbol is centered on the sample location.
Microlitic and lathwork volcanic rock fragments are cor-related to intermediate–mafic volcanic rocks (andesite–basalt)(Dickinson, 1970). Sands from the eastern side of Abashiri Bay(c10, c12, c13, c14, m16, m18, and m19) contain a higher per-centage (more than 20%) of these rock fragments (Fig. 12D).
Sedimentary rock fragments are also very minor componentsin all samples except sample r8. Sample r8 shows higher per-centage (15.6%) of sedimentary rock fragments dominated bysiltstone. Almost all of the siltstone fragments in sample r8 areangular, and contain diatom fragments in silty matrices.
The distribution of volcanic glasses is fairly restricted(Fig. 12E). River sands contain relatively high proportionsof volcanic glasses (10.1–45.3%). Samples c2, c13, m3, m5,and m9 contain more than 10% volcanic glass. Massive-typevolcanic glasses are dominant in the beach sands, whereaspumice-type volcanic glasses are dominant in the shelf andriver sands (Table 3).
Heavy minerals are abundant in the shelf sands obtainedfrom central and eastern Abashiri Bay (Fig. 12E). In particular,sands coarser than 2 Mdφ have higher percentages of heavyminerals. Clinopyroxene, orthopyroxene, and opaque mineralsare the dominant minerals. Some beach (c7 and c8) and riversands (r5) also have high heavy mineral contents (> 10%).
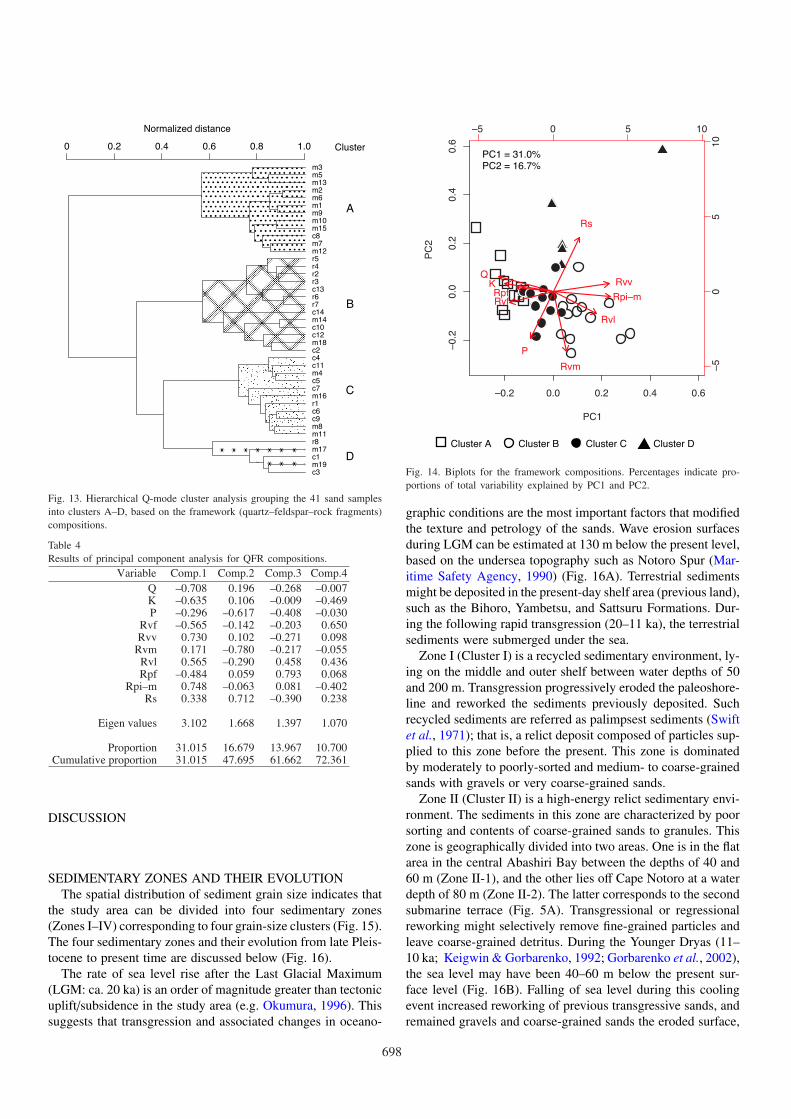
Multivariate analysis for framework compositionNumerical classification of the framework compositions
(quartz–feldspar–rock fragment) of total 41 samples was ac-complished using hierarchical Q-mode cluster analysis. Theresulting dendrogram groups them into four clusters (A, B, C,and D) using a normalized distance of 0.5 (Fig. 13).
Applying the principal component analysis to the frameworkcompositions yields 10 principal components. Of these, the firstfour contain 72.4% of the total variance (Table 4). Loadings ofvariables Rvm, Rvl, Rpi–m, Rvv, and Rs are positive in PC1,whereas those of Q, K, Rpf, Rvf, and P are negative (Fig. 14).The variable Rs has a strong influence on the second principalcomponent. PC1 is controlled by contents of detritus derivedfrom felsic volcanic rocks and minerals. Cluster A shows agood correlation to variables Q, K, Rpf, and Rvf. Cluster B ischaracterized by variables Rvv, Rpi–m, Rvl, and Rvm. Samplesin Cluster C are concentrated near the origin of the biplot.Cluster D is influenced by Rs. The distance Q–K–Rpf is verysmall in the biplot, and shows close correlation among thevariables (Fig. 14). There is also little distance between Rvv,Rpi–m, and Rvl.
696
Tabl
e3
Det
rita
lm
odes
ofth
esa
ndsa
mpl
es.
QB
C
Qs
Ks
Ps
Pm
eR
vf
Rv
vR
vm
Rv
lR
pf
Rp
i–m
Rs
VG
bV
Gp
VG
mt
VG
mc
Cp
xO
px
Op
Hbl
Bt
Bio
clas
tsi
zem
od
e
m1
26
32
.71
.22
5.0
1.5
20
.54
.57.1
6.3
2.1
0.0
0.0
0.0
0.0
1.5
0.3
2.1
7.4
0.3
0.0
0.0
17
.63
36
IIA
m2
19
62
.91
.32
8.1
1.0
34
.08
.28
.59
.80
.70
.00
.00
.00
.02
.00
.01
.02
.30
.30
.00
.00
.03
06
I
m3
19
75
.01
.33
7.7
2.2
29
.91
.62
.80.6
0.0
0.0
0.6
0.0
8.5
4.1
0.6
1.6
1.3
0.6
0.0
0.0
1.6
318
III
A
m4
26
55
.50
.02
1.8
0.3
33
.45
.26
.79
.81.2
0.0
0.0
0.3
0.9
0.6
0.0
1.8
7.4
3.7
0.0
0.0
1.2
32
6I
m5
26
63
.91
.03
2.4
0.6
15
.24
.97
.15
.80
.00
.00
.01
.01
6.1
3.5
1.9
3.2
2.6
0.6
0.3
0.0
0.0
30
9II
IA
m6
20
91
.80
.61
9.0
0.3
17
.24
.37
.14
.60
.60
.00
.00
.00
.32
.50.0
5.5
24
.51
1.3
0.0
0.0
0.3
32
6I
m7
21
00
.60
.62
3.3
0.6
4.3
0.6
0.9
1.2
0.3
0.0
0.0
0.0
0.6
0.6
0.3
6.2
29
.82
9.2
0.0
0.0
0.6
32
2II
A
m8
26
82
.30
.03
3.3
0.3
6.3
3.4
3.4
6.0
0.6
0.3
0.0
0.0
1.1
1.1
0.9
5.7
11
.82
3.0
0.0
0.0
0.3
34
8I
m9
22
16
.71
.81
9.0
1.8
29
.11
0.7
7.0
5.2
2.4
0.0
0.0
0.0
9.5
4.9
0.0
0.9
0.6
0.0
0.0
0.3
0.0
32
7II
IA
m1
02
22
2.1
0.3
39
.30
.31
4.4
5.8
5.5
1.5
2.8
0.0
0.0
0.0
1.2
3.1
0.6
6.1
12
.04
.90
.00.0
0.0
32
6I
m1
12
23
1.0
0.0
40
.30
.76
.72
.73.3
2.7
1.3
0.3
0.0
0.0
0.7
1.7
0.3
10
.32
3.7
4.3
0.0
0.0
0.0
30
0II
C
m1
22
35
3.1
0.8
48
.40
.07
.11.7
10
.83
.10
.80
.00
.00
.00
.31
.40
.64
.51
4.4
3.1
0.0
0.0
0.0
35
3I
m1
32
36
1.8
0.3
40
.40
.01
5.4
2.1
6.9
0.9
0.0
0.0
0.0
0.0
0.3
2.4
0.9
2.4
22.7
3.3
0.0
0.0
0.0
33
2I
m1
42
48
0.3
0.0
37
.10
.91
4.5
5.3
4.4
5.0
0.0
0.0
0.0
0.0
0.3
2.2
1.3
2.8
10
.41
5.4
0.0
0.0
0.0
31
8I
m1
52
49
1.2
0.3
45
.40
.31
1.0
5.2
4.6
4.6
2.4
0.0
0.0
0.0
0.0
0.3
0.0
8.0
16
.50
.00
.00
.00
.03
28
IVA
m1
62
72
2.8
0.0
17
.60
.81
1.2
4.2
14
.81
0.6
2.2
1.1
0.0
0.0
0.8
1.4
0.6
4.5
18
.88
.40
.00
.00
.03
57
I
m1
72
73
0.9
0.0
5.6
0.0
3.7
1.6
2.2
1.9
0.0
0.0
0.3
0.0
0.0
0.0
0.0
1.9
27
.35
4.7
0.0
0.0
0.0
32
2I
m1
82
61
0.3
0.3
35
.80
.31
4.1
8.9
12
.81
5.9
0.6
0.0
0.0
0.0
0.6
2.4
1.2
2.8
2.8
1.2
0.0
0.0
0.0
32
7I
m1
92
74
3.0
0.6
25
.10
.31
5.1
13
.61
3.0
9.5
1.2
0.6
0.9
0.0
1.2
3.2
1.5
3.2
7.7
0.6
0.0
0.0
0.0
33
8I
c11
2.6
0.3
13
.51
.93
8.5
12
.53
.81
6.7
1.6
0.0
1.9
0.0
0.3
5.1
0.3
0.0
0.0
0.0
0.0
0.0
1.0
312
IVD
c25
60
.60
.61
5.4
0.9
24
.17
.41
3.0
19
.40.6
0.3
0.0
0.0
0.0
9.9
5.2
0.6
0.6
0.0
0.0
0.0
1.2
32
4IV
B
c35
73
.30
.02
7.8
1.6
30
.41
0.8
7.8
12.1
1.3
0.3
1.0
0.0
0.0
2.3
0.3
0.3
0.0
0.0
0.0
0.0
0.3
30
6IV
D
c45
91
.70
.02
5.1
0.3
40
.66
.310
.78
.93
.50
.00
.00
.00
.02
.30
.60
.00
.00
.00
.00
.00
.03
47
IVC
c56
12
.10
.03
8.7
0.3
37
.24
.33
.79
.50
.60
.00
.00.0
0.0
1.5
0.3
0.3
1.5
0.0
0.0
0.0
0.0
328
IVC
c66
31
.20
.06
4.0
0.3
11
.43.3
7.5
6.3
0.9
0.0
0.0
0.0
0.0
1.2
0.6
0.0
3.3
0.0
0.0
0.0
0.0
33
3II
C
c76
50
.30
.04
0.7
0.7
16
.90.3
3.6
5.3
0.3
0.3
0.0
0.0
0.0
0.0
0.3
7.0
23
.80
.30
.00
.00
.030
2IV
C
c86
60
.70
.73
6.5
0.7
22
.01
.33
.39
.92
.00
.00
.00
.00
.01
.00
.33
.91
7.4
0.3
0.0
0.0
0.3
30
4IV
A
c95
11
.20
.05
3.4
0.9
20
.24
.96
.18.0
0.9
0.3
0.0
0.0
0.0
0.6
0.3
0.9
2.1
0.0
0.0
0.0
0.0
32
6IV
C
c10
54
0.6
0.0
50
.21
.31
3.8
6.8
13.5
10
.00
.00
.00
.00
.00
.02.3
1.3
0.0
0.0
0.0
0.0
0.0
0.0
31
1IV
B
c11
49
1.9
0.0
40
.72
.51
2.4
5.3
2.8
14.3
1.2
0.0
0.0
0.0
0.0
0.3
0.6
4.0
13
.40
.60
.00.0
0.0
322
IVC
c12
37
1.6
0.6
44
.02
.81
1.7
6.6
9.8
15
.20
.60
.90
.00
.00
.02
.21
.91
.00
.30
.30
.00.0
0.0
31
6IV
B
c13
44
0.5
0.0
17
.31
.12
3.9
11
.81
4.6
14.6
0.3
2.7
0.3
0.0
0.5
8.0
3.3
0.8
0.0
0.0
0.0
0.0
0.3
36
4IV
B
c14
43
1.5
0.9
12
.80
.98
.65
.86
.71
6.5
2.1
9.8
0.0
0.0
0.0
0.0
0.0
13
.81
9.0
1.2
0.0
0.0
0.3
32
7IV
B
r11
a1
.90
.03
3.7
0.3
25
.61
5.7
3.5
6.7
2.6
0.6
0.0
0.0
0.6
3.2
1.0
3.8
0.6
0.0
0.0
0.0
0.0
31
2C
r22
a1
.60
.03
1.9
0.6
23
.01
3.4
5.1
5.1
0.0
0.6
0.0
0.0
9.9
3.2
1.9
1.0
1.9
0.6
0.0
0.0
0.0
31
3B
r33
a1
.30
.05
1.3
0.3
9.7
8.1
5.2
5.2
0.0
0.6
0.0
0.0
4.2
3.6
2.3
7.8
0.3
0.0
0.0
0.0
0.0
30
8B
r44
a1
.00
.03
7.7
0.3
6.6
15
.26
.65
.60
.00.3
0.0
0.0
6.6
3.3
2.0
7.0
4.6
3.0
0.0
0.0
0.0
30
2B
r55
a0
.30
.03
2.4
0.7
7.0
4.3
2.3
1.7
0.0
1.0
0.0
0.0
1.0
0.7
0.7
25
.31
.72
1.0
0.0
0.0
0.0
30
2B
r66
a0
.30
.02
6.3
0.3
4.2
12
.71
0.4
5.8
0.0
1.0
0.0
0.3
19
.23
.96
.27
.50
.61
.30
.00.0
0.0
30
8B
r77
a0
.30
.01
6.8
0.0
3.6
13
.69
.18
.10
.01
.00
.01
.03
5.9
2.3
6.1
1.3
0.0
1.0
0.0
0.0
0.0
30
9B
r88
a0
.30
.06
.60
.04
.03
4.4
1.7
8.6
0.0
1.7
15
.60
.32
3.8
2.0
1.0
0.0
0.0
0.0
0.0
0.0
0.0
30
2D
No
.O
rig
.n
um
.T
ota
lC
ou
nt
Clu
ster
sF
HM
VG
R
Ab
bre
via
tio
ns:
Q,
qu
artz
; F
, fe
ldsp
ar;
R,
rock
fra
gm
ents
; V
G, v
olc
anic
gla
ss;
HM
, h
eav
y m
iner
al;
BC
, b
iocl
ast;
Qs,
sin
gle
qu
artz
; K
s, s
ing
le p
ota
ssiu
m f
eld
spar
; P
s, s
ing
le p
lag
iocl
ase;
Pm
e, a
lter
ed
pla
gio
clas
e; R
vf,
fel
sic
vo
lcan
ic r
ock
fra
gm
ents
; R
vv
, v
itri
c v
olc
anic
ro
ck f
rag
men
ts;
Rv
m,
mic
roli
tic
vo
lcan
ic r
ock
fra
gm
ents
; R
vl,
lat
hw
ork
volc
anic
ro
ck f
ragm
ents
; R
pf,
ho
locr
yst
alli
ne
fels
ic i
gn
eou
s
rock
fra
gm
ents
; R
pi–
m,
ho
locr
yst
alli
ne
inte
rmed
iate
–m
afic
ig
neo
us
rock
fra
gm
ents
; R
s, s
edim
enta
ry r
ock
fra
gm
ents
; V
Gb
, b
ub
ble
-wal
l ty
pe
vo
lcan
ic g
lass
; V
Gp
, p
um
ice
typ
e v
olc
anic
gla
ss;
VG
mt,
mas
siv
e-co
lorl
ess
typ
e v
olc
anic
gla
ss;
VG
mc,
mas
siv
e-co
lore
d v
olc
anic
gla
ss;
Cp
x,
clin
op
yro
xen
e; O
px
, o
rth
opy
rox
ene;
Op
, o
paq
ue
min
eral
; H
bl,
ho
rnb
len
de;
Bt,
bio
tite
.
A C A C A A A CB D B D
697
r4
m3
m5
m13
m2
m6
m1
m9
m10
m15
c8
m7
m12
r5
r2
r3
c13
r6
r7
c14
m14
c10
c12
m18
c2
c4
c11
m4
c5
c7
m16
r1
c6
c9
m8
m11
r8
m17
c1
m19
c3
A
B
C
D
0 0.2 1.00.80.60.4
Normalized distance
Cluster
Fig. 13. Hierarchical Q-mode cluster analysis grouping the 41 sand samplesinto clusters A–D, based on the framework (quartz–feldspar–rock fragments)compositions.
Table 4Results of principal component analysis for QFR compositions.
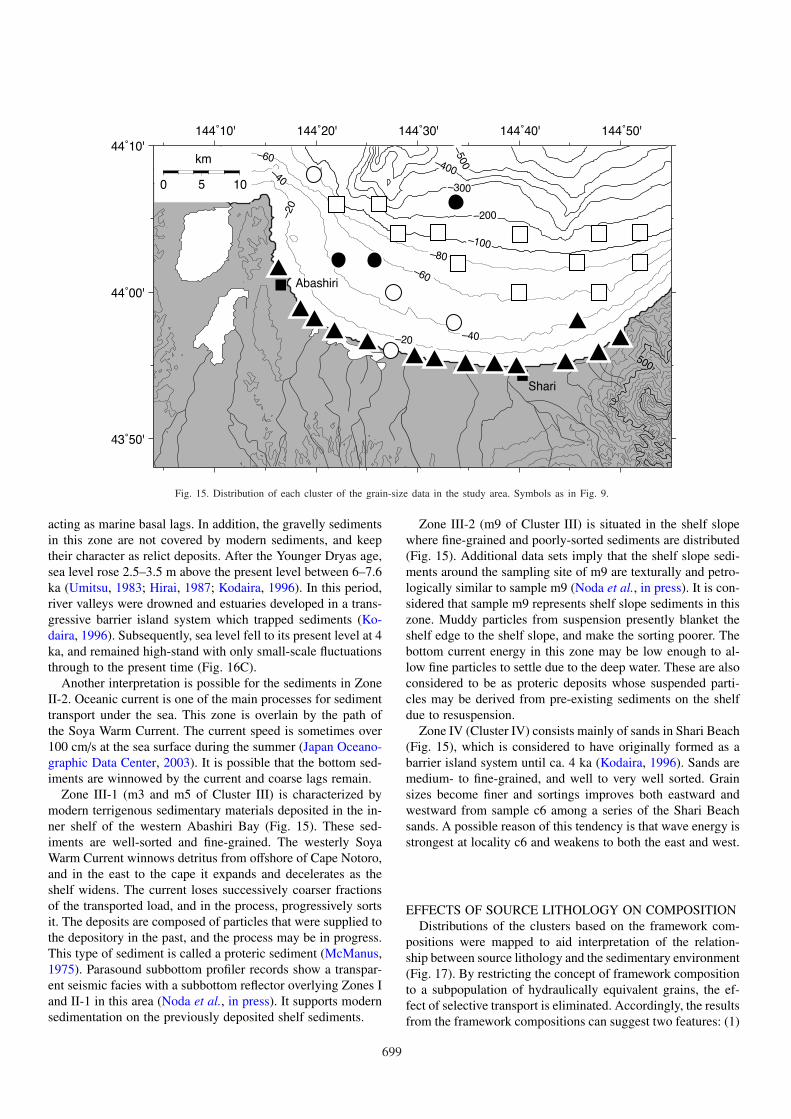
SEDIMENTARY ZONES AND THEIR EVOLUTIONThe spatial distribution of sediment grain size indicates that
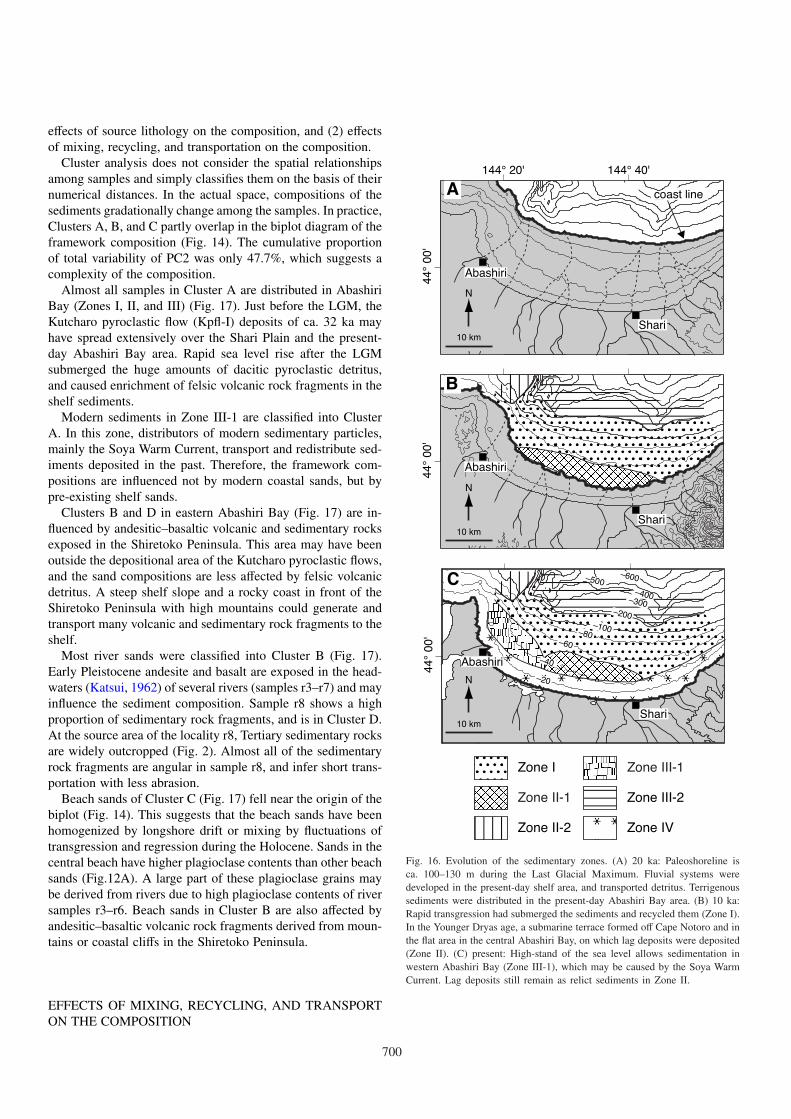
the study area can be divided into four sedimentary zones(Zones I–IV) corresponding to four grain-size clusters (Fig. 15).The four sedimentary zones and their evolution from late Pleis-tocene to present time are discussed below (Fig. 16).
The rate of sea level rise after the Last Glacial Maximum(LGM: ca. 20 ka) is an order of magnitude greater than tectonicuplift/subsidence in the study area (e.g. Okumura, 1996). Thissuggests that transgression and associated changes in oceano-
–0.2 0.0 0.2 0.4 0.6
–5 0 5 10
–0
.20
.00
.20
.40
.6
–5
05
10
PC1P
C2
QK
P
Rvf
Rvv
Rvm
Rvl
Rpf Rpi–m
Rs
PC1 = 31.0%PC2 = 16.7%
Cluster A Cluster DCluster CCluster B
Fig. 14. Biplots for the framework compositions. Percentages indicate pro-portions of total variability explained by PC1 and PC2.
graphic conditions are the most important factors that modifiedthe texture and petrology of the sands. Wave erosion surfacesduring LGM can be estimated at 130 m below the present level,based on the undersea topography such as Notoro Spur (Mar-itime Safety Agency, 1990) (Fig. 16A). Terrestrial sedimentsmight be deposited in the present-day shelf area (previous land),such as the Bihoro, Yambetsu, and Sattsuru Formations. Dur-ing the following rapid transgression (20–11 ka), the terrestrialsediments were submerged under the sea.
Zone I (Cluster I) is a recycled sedimentary environment, ly-ing on the middle and outer shelf between water depths of 50and 200 m. Transgression progressively eroded the paleoshore-line and reworked the sediments previously deposited. Suchrecycled sediments are referred as palimpsest sediments (Swiftet al., 1971); that is, a relict deposit composed of particles sup-plied to this zone before the present. This zone is dominatedby moderately to poorly-sorted and medium- to coarse-grainedsands with gravels or very coarse-grained sands.
Zone II (Cluster II) is a high-energy relict sedimentary envi-ronment. The sediments in this zone are characterized by poorsorting and contents of coarse-grained sands to granules. Thiszone is geographically divided into two areas. One is in the flatarea in the central Abashiri Bay between the depths of 40 and60 m (Zone II-1), and the other lies off Cape Notoro at a waterdepth of 80 m (Zone II-2). The latter corresponds to the secondsubmarine terrace (Fig. 5A). Transgressional or regressionalreworking might selectively remove fine-grained particles andleave coarse-grained detritus. During the Younger Dryas (11–10 ka; Keigwin & Gorbarenko, 1992; Gorbarenko et al., 2002),the sea level may have been 40–60 m below the present sur-face level (Fig. 16B). Falling of sea level during this coolingevent increased reworking of previous transgressive sands, andremained gravels and coarse-grained sands the eroded surface,
698
144˚10' 144˚20' 144˚30' 144˚40' 144˚50'
43˚50'
44˚00'
44˚10'
–100–80
–60
–60
–40
–40
–20
–20
–500–400
–300
–200
500
Abashiri
Shari
0 5
km
10
Fig. 15. Distribution of each cluster of the grain-size data in the study area. Symbols as in Fig. 9.
acting as marine basal lags. In addition, the gravelly sedimentsin this zone are not covered by modern sediments, and keeptheir character as relict deposits. After the Younger Dryas age,sea level rose 2.5–3.5 m above the present level between 6–7.6ka (Umitsu, 1983; Hirai, 1987; Kodaira, 1996). In this period,river valleys were drowned and estuaries developed in a trans-gressive barrier island system which trapped sediments (Ko-daira, 1996). Subsequently, sea level fell to its present level at 4ka, and remained high-stand with only small-scale fluctuationsthrough to the present time (Fig. 16C).
Another interpretation is possible for the sediments in ZoneII-2. Oceanic current is one of the main processes for sedimenttransport under the sea. This zone is overlain by the path ofthe Soya Warm Current. The current speed is sometimes over100 cm/s at the sea surface during the summer (Japan Oceano-graphic Data Center, 2003). It is possible that the bottom sed-iments are winnowed by the current and coarse lags remain.
Zone III-1 (m3 and m5 of Cluster III) is characterized bymodern terrigenous sedimentary materials deposited in the in-ner shelf of the western Abashiri Bay (Fig. 15). These sed-iments are well-sorted and fine-grained. The westerly SoyaWarm Current winnows detritus from offshore of Cape Notoro,and in the east to the cape it expands and decelerates as theshelf widens. The current loses successively coarser fractionsof the transported load, and in the process, progressively sortsit. The deposits are composed of particles that were supplied tothe depository in the past, and the process may be in progress.This type of sediment is called a proteric sediment (McManus,1975). Parasound subbottom profiler records show a transpar-ent seismic facies with a subbottom reflector overlying Zones Iand II-1 in this area (Noda et al., in press). It supports modernsedimentation on the previously deposited shelf sediments.
Zone III-2 (m9 of Cluster III) is situated in the shelf slopewhere fine-grained and poorly-sorted sediments are distributed(Fig. 15). Additional data sets imply that the shelf slope sedi-ments around the sampling site of m9 are texturally and petro-logically similar to sample m9 (Noda et al., in press). It is con-sidered that sample m9 represents shelf slope sediments in thiszone. Muddy particles from suspension presently blanket theshelf edge to the shelf slope, and make the sorting poorer. Thebottom current energy in this zone may be low enough to al-low fine particles to settle due to the deep water. These are alsoconsidered to be as proteric deposits whose suspended parti-cles may be derived from pre-existing sediments on the shelfdue to resuspension.
Zone IV (Cluster IV) consists mainly of sands in Shari Beach(Fig. 15), which is considered to have originally formed as abarrier island system until ca. 4 ka (Kodaira, 1996). Sands aremedium- to fine-grained, and well to very well sorted. Grainsizes become finer and sortings improves both eastward andwestward from sample c6 among a series of the Shari Beachsands. A possible reason of this tendency is that wave energy isstrongest at locality c6 and weakens to both the east and west.
EFFECTS OF SOURCE LITHOLOGY ON COMPOSITIONDistributions of the clusters based on the framework com-
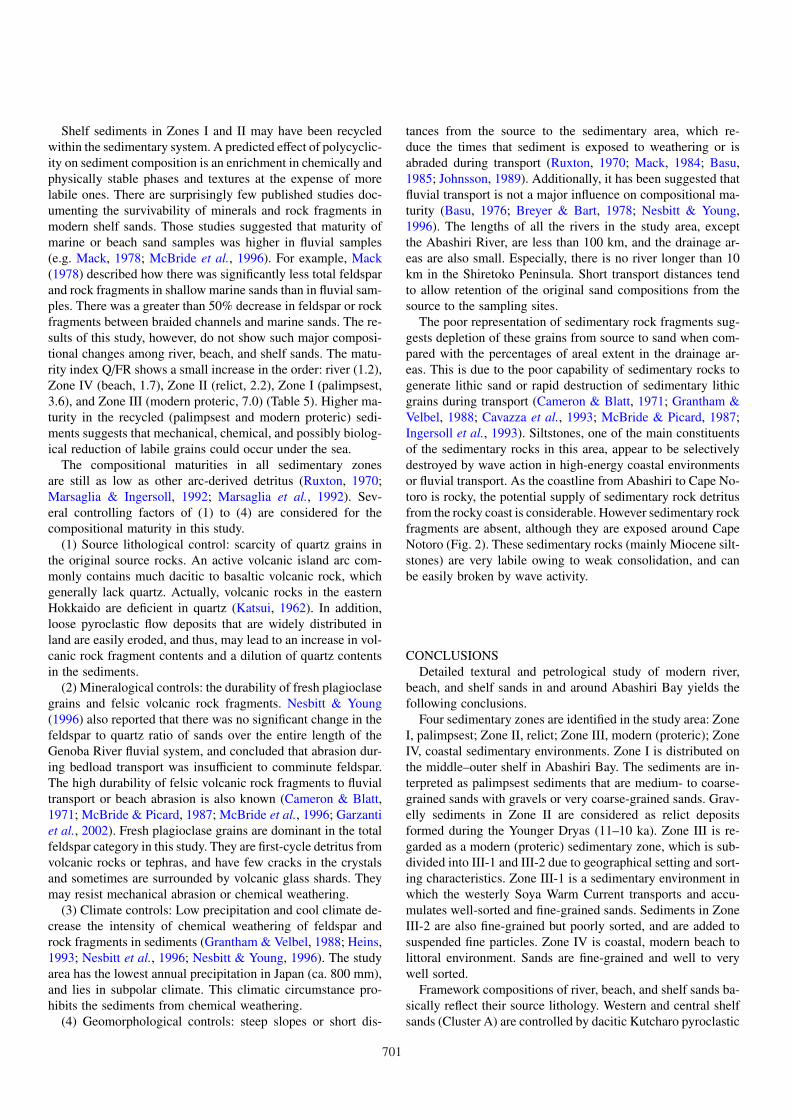
positions were mapped to aid interpretation of the relation-ship between source lithology and the sedimentary environment(Fig. 17). By restricting the concept of framework compositionto a subpopulation of hydraulically equivalent grains, the ef-fect of selective transport is eliminated. Accordingly, the resultsfrom the framework compositions can suggest two features: (1)
699
effects of source lithology on the composition, and (2) effectsof mixing, recycling, and transportation on the composition.
Cluster analysis does not consider the spatial relationshipsamong samples and simply classifies them on the basis of theirnumerical distances. In the actual space, compositions of thesediments gradationally change among the samples. In practice,Clusters A, B, and C partly overlap in the biplot diagram of theframework composition (Fig. 14). The cumulative proportionof total variability of PC2 was only 47.7%, which suggests acomplexity of the composition.
Almost all samples in Cluster A are distributed in AbashiriBay (Zones I, II, and III) (Fig. 17). Just before the LGM, theKutcharo pyroclastic flow (Kpfl-I) deposits of ca. 32 ka mayhave spread extensively over the Shari Plain and the present-day Abashiri Bay area. Rapid sea level rise after the LGMsubmerged the huge amounts of dacitic pyroclastic detritus,and caused enrichment of felsic volcanic rock fragments in theshelf sediments.
Modern sediments in Zone III-1 are classified into ClusterA. In this zone, distributors of modern sedimentary particles,mainly the Soya Warm Current, transport and redistribute sed-iments deposited in the past. Therefore, the framework com-positions are influenced not by modern coastal sands, but bypre-existing shelf sands.
Clusters B and D in eastern Abashiri Bay (Fig. 17) are in-fluenced by andesitic–basaltic volcanic and sedimentary rocksexposed in the Shiretoko Peninsula. This area may have beenoutside the depositional area of the Kutcharo pyroclastic flows,and the sand compositions are less affected by felsic volcanicdetritus. A steep shelf slope and a rocky coast in front of theShiretoko Peninsula with high mountains could generate andtransport many volcanic and sedimentary rock fragments to theshelf.
Most river sands were classified into Cluster B (Fig. 17).Early Pleistocene andesite and basalt are exposed in the head-waters (Katsui, 1962) of several rivers (samples r3–r7) and mayinfluence the sediment composition. Sample r8 shows a highproportion of sedimentary rock fragments, and is in Cluster D.At the source area of the locality r8, Tertiary sedimentary rocksare widely outcropped (Fig. 2). Almost all of the sedimentaryrock fragments are angular in sample r8, and infer short trans-portation with less abrasion.
Beach sands of Cluster C (Fig. 17) fell near the origin of thebiplot (Fig. 14). This suggests that the beach sands have beenhomogenized by longshore drift or mixing by fluctuations oftransgression and regression during the Holocene. Sands in thecentral beach have higher plagioclase contents than other beachsands (Fig.12A). A large part of these plagioclase grains maybe derived from rivers due to high plagioclase contents of riversamples r3–r6. Beach sands in Cluster B are also affected byandesitic–basaltic volcanic rock fragments derived from moun-tains or coastal cliffs in the Shiretoko Peninsula.
EFFECTS OF MIXING, RECYCLING, AND TRANSPORTON THE COMPOSITION
144° 20' 144° 40'
44
° 0
0'
10 km
N
A coast line
44
° 0
0'
10 km
N
B
44
° 0
0'
–60
–100–80
–20
–40
–200
–300
–400
–500–600
10 km
N
C
Zone II-1
Zone II-2 Zone IV
Zone III-1
Zone III-2
Zone I
Abashiri
Shari
Abashiri
Shari
Abashiri
Shari
Fig. 16. Evolution of the sedimentary zones. (A) 20 ka: Paleoshoreline isca. 100–130 m during the Last Glacial Maximum. Fluvial systems weredeveloped in the present-day shelf area, and transported detritus. Terrigenoussediments were distributed in the present-day Abashiri Bay area. (B) 10 ka:Rapid transgression had submerged the sediments and recycled them (Zone I).In the Younger Dryas age, a submarine terrace formed off Cape Notoro and inthe flat area in the central Abashiri Bay, on which lag deposits were deposited(Zone II). (C) present: High-stand of the sea level allows sedimentation inwestern Abashiri Bay (Zone III-1), which may be caused by the Soya WarmCurrent. Lag deposits still remain as relict sediments in Zone II.
700
Shelf sediments in Zones I and II may have been recycledwithin the sedimentary system. A predicted effect of polycyclic-ity on sediment composition is an enrichment in chemically andphysically stable phases and textures at the expense of morelabile ones. There are surprisingly few published studies doc-umenting the survivability of minerals and rock fragments inmodern shelf sands. Those studies suggested that maturity ofmarine or beach sand samples was higher in fluvial samples(e.g. Mack, 1978; McBride et al., 1996). For example, Mack(1978) described how there was significantly less total feldsparand rock fragments in shallow marine sands than in fluvial sam-ples. There was a greater than 50% decrease in feldspar or rockfragments between braided channels and marine sands. The re-sults of this study, however, do not show such major composi-tional changes among river, beach, and shelf sands. The matu-rity index Q/FR shows a small increase in the order: river (1.2),Zone IV (beach, 1.7), Zone II (relict, 2.2), Zone I (palimpsest,3.6), and Zone III (modern proteric, 7.0) (Table 5). Higher ma-turity in the recycled (palimpsest and modern proteric) sedi-ments suggests that mechanical, chemical, and possibly biolog-ical reduction of labile grains could occur under the sea.
The compositional maturities in all sedimentary zonesare still as low as other arc-derived detritus (Ruxton, 1970;Marsaglia & Ingersoll, 1992; Marsaglia et al., 1992). Sev-eral controlling factors of (1) to (4) are considered for thecompositional maturity in this study.
(1) Source lithological control: scarcity of quartz grains inthe original source rocks. An active volcanic island arc com-monly contains much dacitic to basaltic volcanic rock, whichgenerally lack quartz. Actually, volcanic rocks in the easternHokkaido are deficient in quartz (Katsui, 1962). In addition,loose pyroclastic flow deposits that are widely distributed inland are easily eroded, and thus, may lead to an increase in vol-canic rock fragment contents and a dilution of quartz contentsin the sediments.
(2) Mineralogical controls: the durability of fresh plagioclasegrains and felsic volcanic rock fragments. Nesbitt & Young(1996) also reported that there was no significant change in thefeldspar to quartz ratio of sands over the entire length of theGenoba River fluvial system, and concluded that abrasion dur-ing bedload transport was insufficient to comminute feldspar.The high durability of felsic volcanic rock fragments to fluvialtransport or beach abrasion is also known (Cameron & Blatt,1971; McBride & Picard, 1987; McBride et al., 1996; Garzantiet al., 2002). Fresh plagioclase grains are dominant in the totalfeldspar category in this study. They are first-cycle detritus fromvolcanic rocks or tephras, and have few cracks in the crystalsand sometimes are surrounded by volcanic glass shards. Theymay resist mechanical abrasion or chemical weathering.
(3) Climate controls: Low precipitation and cool climate de-crease the intensity of chemical weathering of feldspar androck fragments in sediments (Grantham & Velbel, 1988; Heins,1993; Nesbitt et al., 1996; Nesbitt & Young, 1996). The studyarea has the lowest annual precipitation in Japan (ca. 800 mm),and lies in subpolar climate. This climatic circumstance pro-hibits the sediments from chemical weathering.
(4) Geomorphological controls: steep slopes or short dis-
tances from the source to the sedimentary area, which re-duce the times that sediment is exposed to weathering or isabraded during transport (Ruxton, 1970; Mack, 1984; Basu,1985; Johnsson, 1989). Additionally, it has been suggested thatfluvial transport is not a major influence on compositional ma-turity (Basu, 1976; Breyer & Bart, 1978; Nesbitt & Young,1996). The lengths of all the rivers in the study area, exceptthe Abashiri River, are less than 100 km, and the drainage ar-eas are also small. Especially, there is no river longer than 10km in the Shiretoko Peninsula. Short transport distances tendto allow retention of the original sand compositions from thesource to the sampling sites.
The poor representation of sedimentary rock fragments sug-gests depletion of these grains from source to sand when com-pared with the percentages of areal extent in the drainage ar-eas. This is due to the poor capability of sedimentary rocks togenerate lithic sand or rapid destruction of sedimentary lithicgrains during transport (Cameron & Blatt, 1971; Grantham &Velbel, 1988; Cavazza et al., 1993; McBride & Picard, 1987;Ingersoll et al., 1993). Siltstones, one of the main constituentsof the sedimentary rocks in this area, appear to be selectivelydestroyed by wave action in high-energy coastal environmentsor fluvial transport. As the coastline from Abashiri to Cape No-toro is rocky, the potential supply of sedimentary rock detritusfrom the rocky coast is considerable. However sedimentary rockfragments are absent, although they are exposed around CapeNotoro (Fig. 2). These sedimentary rocks (mainly Miocene silt-stones) are very labile owing to weak consolidation, and canbe easily broken by wave activity.
CONCLUSIONSDetailed textural and petrological study of modern river,
beach, and shelf sands in and around Abashiri Bay yields thefollowing conclusions.
Four sedimentary zones are identified in the study area: ZoneI, palimpsest; Zone II, relict; Zone III, modern (proteric); ZoneIV, coastal sedimentary environments. Zone I is distributed onthe middle–outer shelf in Abashiri Bay. The sediments are in-terpreted as palimpsest sediments that are medium- to coarse-grained sands with gravels or very coarse-grained sands. Grav-elly sediments in Zone II are considered as relict depositsformed during the Younger Dryas (11–10 ka). Zone III is re-garded as a modern (proteric) sedimentary zone, which is sub-divided into III-1 and III-2 due to geographical setting and sort-ing characteristics. Zone III-1 is a sedimentary environment inwhich the westerly Soya Warm Current transports and accu-mulates well-sorted and fine-grained sands. Sediments in ZoneIII-2 are also fine-grained but poorly sorted, and are added tosuspended fine particles. Zone IV is coastal, modern beach tolittoral environment. Sands are fine-grained and well to verywell sorted.
Framework compositions of river, beach, and shelf sands ba-sically reflect their source lithology. Western and central shelfsands (Cluster A) are controlled by dacitic Kutcharo pyroclastic
701
Table 5Averages of framework compositional data. σ means standard deviation of Q/FR ratio. Abbreviations as in Table 3.
500Lithic detritus(volcanic and sedimentary lithicfragments)
FeldsparVolcanic lithic fragmetns
Soya Warm Current
palimpsest
coastal
proteric
relict
Zone II-1
Zone II-2 Zone IV
Zone III-1
Zone III-2
Zone I
Direction of current
Direction of sediment dispersal
Abashiri
Shari
0 5
km
10
Cluster B
Cluster D
Cluster C
Cluster A
Size zones Sand clusters
Fig. 17. Schematic model of the sediment dispersal systems.
flow deposits. Shelf sands in the eastern Abashiri Bay (Clus-ters B and D) are controlled by Neogene andesitic–basaltic vol-canic and sedimentary rock fragments. Beach sands (Cluster C)show mixed or plagioclase-rich characteristics. Compositionsof beach sands in pocket beaches are influenced by their localsources.
There is a small-scale increase of compositional maturityin the order river, Zone IV (beach), Zone II (relict), Zone I(palimpsest), and Zone III (modern proteric). This indicatessubmarine weathering and abrasion have modified sediment
compositions slightly. The active volcanic arc generates largevolumes of volcaniclastic detritus with less quartz grains. Thesource lithology, mineralogy, climate and geomorphology con-trol the maturity of the sediments. Sedimentary rock fragmentsare weakly consolidated, and are poorly preserved in the sed-iments due to rapid destruction during transport or nearshoreprocesses. Processes operating during erosion, transport, anddeposition are intimately interlinked, creating a complex mech-anism within the sedimentary system controlling the textureand petrology of clastic sediments.
702
ACKNOWLEDGMENTSI am much indebted to the officers, crew, and research staff of
the Research Vessel Hakurei-maru No. 2 for their kind supportduring the survey. I am grateful to Y. Okamura, F. Nanayama,M. Kametaka, and T. Tsujino for their useful comments onan early draft of this paper. Thanks go also to A. Owada andto K. Fukuda for providing the excellent thin sections. Thismanuscript has benefited from constructive reviews by B. P.Roser, T. Sakai, and an anonymous reviewer.
This study was a part of the “Marine geological mappingproject of the continental shelves around Japan” program sup-ported by the Geological Survey of Japan/AIST.
REFERENCES CITEDAitchison, J. 1981. A new approach to null correlations of pro-
portions. Journal of the International Association of Mathe-matical Geology 13, 175–189.
Aitchison, J. 1990. Relative variation diagrams for describingpatterns of compositional variability. Mathematical Geology22, 487–511.
Aitchison, J. 2003. The Statistical Analysis of CompositionalData, The Blackburn Press.
Allen, G. P., Castaing, P. & Klingebiel, A. 1971. Preliminaryinvestigation of the surficial sediments in the Cap-BretonCanyon (southwest France) and the surrounding continentalshelf. Marine Geology 10, M27–M32.
Allen, G. P., Castaing, P. & Klingebiel, A. 1972. Distinction ofelementary sand populations in the Gironde Estuary (France)by R-mode factor analysis of grain-size data. Sedimentology19, 21–35.
Arribas, J., Critelli, S., Le Pera, E. & Tortosa, A. 2000. Com-position of modern stream sand derived from a mixture ofsedimentary and metamorphic source rocks (Henares River,Central Spain). Sedimentary Geology 133, 27–48.
Bailey, E. H. & Stevens, R. E. 1960. Selective staining ofK-feldspar and plagioclase on rock slabs and thin sections.American Mineralogist 45, 1020–1025.
Basu, A. 1976. Petrology of Holocene sands derived from plu-tonic source rocks; implications to the paleoclimatic inter-pretation. Journal of Sedimentary Petrology 46, 694–709.
Basu, A. 1985. Influence of climate and relief on compositionsof sands released at source areas, In Zuffa, G. G. (ed.) Prove-nance of Arenite, pp. 1–18, D. Reidel, Dordrecht, Holland.
Breyer, J. A. & Bart, H. A. 1978. The composition of fluvialsands in a temperate semiarid region. Journal of SedimentaryPetrology 48, 1311–1320.
Cameron, K. L. & Blatt, H. 1971. Durabilities of sand-sizeschist and ”volcanic” rock fragments during fluvial transport,Elk Creek, Black Hill, South Dakota. Journal of SedimentaryPetrology 41, 565–576.
Cavazza, W., Zuffa, G. G., Camporesi, C. & Ferretti, C. 1993.Sedimentary recycling in a temperate climate drainage basin
(Senio River, north-central Italy): composition of sourcerock, soil profiles, and fluvial deposits. Geological Societyof America Special Paper 284, 247–261.
Chambers, R. L. & Upchurch, S. B. 1979. Multivariate analy-sis of sedimentary environments using grain-size frequencydistribution. Mathematical Geology 11, 27–43.
Chayes, F. 1960. On correlation between variables of constantsum. Journal of Geophysical Research 65, 4185–4193.
Clemens, K. E. & Komar, P. D. 1988. Oregon beach-sand com-positions produced by the mixing of sediments under a trans-gressing sea. Journal of Sedimentary Petrology 58, 519–529.
Critelli, S., Arribas, J., Le Pera, E., Tortosa, A., Marsaglia,K. M. & Latter, K. K. 2003. The recycled orogenic sandprovenance from an uplifted thrust belt, Betic Cordillera,southern Spain. Journal of Sedimentary Research 73, 72–81.
Critelli, S., Le Pera, E. & Ingersoll, R. V. 1997. The effects ofsource lithology, transport, deposition and sampling scale onthe composition of southern California sand. Sedimentology44, 653–671.
Dacey, M. F. & Krumbein, W. C. 1979. Models of breakageand selection for particle size distributions. MathematicalGeology 11, 193–222.
Dal Cin, R. 1976. The use of factor analysis in determiningbeach erosion and accretion from grain-size data. MarineGeology 20, 95–116.
Davies, D. K. & Ethridge, F. G. 1975. Sandstone compositionand depositional environment. The American Association ofPetroleum Geologists Bulletin 59, 239–264.
Davis, J. C. 1970. Information contained in sediment-size anal-yses. Mathematical Geology 2, 105–112.
Decker, J. & Helmold, K. 1985. The effect of grain size ondetrital modes: a test of the Gazzi-Dickinson point-countingmethod–Discussion. Journal of Sedimentary Petrology 55,618–620.
DeMets, C., Gordon, R. G., Argus, D. F. & Stein, S. 1994.Effect of recent revisions to the geomagnetic reversal timescale on estimates of current plate motions. Geophysical Re-search Letters 21, 2191–2194.
Dickinson, W. R. 1970. Interpreting detrital modes ofgreywacke and arkose. Journal of Sedimentary Petrology 40,695–707.
Dickinson, W. R. 1985. Interpreting provenance relations fromdetrital modes of sandstones, In Zuffa, G. G. (ed.) Prove-nance of Arenite, pp. 333–361, D. Reidel, Dordrecht, Hol-land.
Dickinson, W. R. & Suczek, C. A. 1979. Plate tectonicsand sandstone composition. The American Association ofPetroleum Geologists Bulletin 63, 2164–2182.
Dorsey, R. J. 1988. Provenance evolution and unroofing historyof a modern arc-continent collision: evidence from petrogra-phy of Plio-Pleistocene sandstone, eastern Taiwan. Journalof Sedimentary Petrology 58, 208–218.
Folk, R. L. & Ward, W. C. 1957. Brazons River bar: a studyin the significance of grain size parameters. Journal of Sed-imentary Petrology 27, 3–26.
Galehouse, J. S. 1971. Point counting, In Carver, R. E. (ed.)Procedures in Sedimentary Petrology, chap. 16, pp. 385–407,
703
Wiley-Interscience, New York.Garzanti, E., Canclini, S., Foggia, F. M. & Petrella, N. 2002.
Unraveling magmatic and orogenic provenance in modernsand; the back-arc side of the Apennine thrust belt, Italy.Journal of Sedimentary Research 72, 2–17.
Gorbarenko, S. A., Nurnberg, D., Derkachev, A., Astakhov,A. S., Southon, J. R. & Kaiser, A. 2002. Magnetostratig-raphy and tephrochronology of the Upper Quaternary sedi-ments in the Okhotsk Sea: implication of terrigenous, vol-canogenic and biogenic matter supply. Marine Geology 183,107–129.
Goto, Y., Funayama, A., Gouchi, N. & Itaya, T. 2000. K–Ar agesof the Akan-Shiretoko volcanic chain lying oblique to theKurile trench: Implications for tectonic control of volcanism.The Island Arc 9, 204–218.
Grantham, J. H. & Velbel, M. A. 1988. The influence of cli-mate and topography on rock-fragment abundance in modernfluvial sands of the Southern Blue Ridge Mountains, northCarolina. Journal of Sedimentary Petrology 58, 219–227.
Heins, W. A. 1993. Source rock texture versus climate and to-pography as controls on the composition of modern, pluton-iclastic sand. Geological Society of America Special Paper284, 135–146.
Hirai, Y. 1987. Lacustrine and sublacustrine microforms anddeposits near the shoreline of Lake Saroma and the sea levelchanges in the Sea of Okhotsk in late Holocene. Annals ofthe Tohoku Geographical Association 39, 1–15, (in Japanesewith English abstract).
Hirose, W. & Nakagawa, M. 1995. K–Ar ages of the Neo-gene volcanic rocks from the Kutcharo caldera region, eastHokkaido, with special reference to the Quaternary volcanichistory. The Journal of the Geological Society of Japan 101,99–102, (in Japanese).
Hounslow, M. & Morton, A. 2004. Evaluation of sedimentprovenance using magnetic mineral inclusions in clastic sili-cates: comparison with heavy mineral analysis. SedimentaryGeology 171, 13–36.
Ingersoll, R. V., Bullard, T. F., Ford, R. L., Grimm, J. P.,Pickle, J. D. & Sares, S. W. 1984. The effect of grain size ondetrital modes: a test of the Gazzi-Dickinson point-countingmethod. Journal of Sedimentary Petrology 54, 103–116.
Ingersoll, R. V., Kretchmer, A. G. & Valles, P. K. 1993. Theeffect of sampling scale on actualistic sandstone petrofacies.Sedimentology 40, 937–953.
Japan Oceanographic Data Center. 2003. JODC Data On-lineService System, http://www.jodc.go.jp/index j.html.
Johnsson, M. J. 1989. Physiographic controls on the compo-sition of sediments derived from volcanic and sedimentaryterrains on Barro Colorado Island, Panama. Journal of Sed-imentary Petrology 59, 768–781.
Johnsson, M. J. 1993. The system controlling the compositionof clastic sediments. Geological Society of America SpecialPaper 284, 1–19.
Kato, M., Katsui, Y., Kitagawa, Y. & Matsui, M. (eds.) .1990. Regional Geology of Japan, Part 1, Hokkaido, Ky-oritsu Shuppan, Tokyo, (in Japanese).
Katsui, Y. 1955. Geology and petrology of the Volcano Mashu,
Hokkaido Japan. The Journal of the Geological Society ofJapan 61, 481–491.
Katsui, Y. 1958. Akan and Kutcharo volcanoes. Earth Science39, 19–29, (in Japanese).
Katsui, Y. 1962. Explanatory text of the geological map ofJapan, Kutcharo (scale 1:50000), Hokkaido DevelopmentAgency, (in Japanese with English abstract).
Katsui, Y. & Satoh, H. 1963. Explanatory text of the geologi-cal map of Japan, Mokoto-Yama (scale 1:50000), HokkaidoDevelopment Agency, (in Japanese with English abstract).
Keigwin, L. D. & Gorbarenko, S. A. 1992. Sea level, surfacesalinity of the Japan Sea, and the Younger Dryas event inthe northwestern Pacific Ocean. The Quaternary Research37, 346–360.
Kigoshi, K. 1967. Gakushuin Natural Radiocarbon Measure-ments VI. Radiocarbon 9, 43–62.
Klovan, J. E. 1966. The use of factor analysis in determin-ing depositional environments from grain-size distributions.Journal of Sedimentary Petrology 36, 115–125.
Kodaira, E. 1996. Reconstruction of paleoenvironment aroundShari area during Holocene. Bulletin of the Shiretoko Mu-seum 17, 1–17, (in Japanese).
Koike, K. & Machida, H. (eds.) . 2001. Atlas of Quaternarymarine terraces in the Japan Islands, University of TokyoPress, Tokyo, (in Japanese).
Komar, P. D. 1977. Selective longshore transport rates of dif-ferent grain-size fractions within a beach. Journal of Sedi-mentary Petrology 47, 1444–1453.
Kumon, F. & Kiminami, K. 1994. Model and chemical compo-sitions of the representative sandstones from the JapaneseIslands and their tectonic implications, In Kumon, F. & Yu,K. M. (eds.) Proceedings of the 29th International Geolog-ical Congress, Part A, pp. 135–151, VSP BV, Utrecht, TheNetherlands.
Kumon, F., Kiminami, K., Adachi, M., Bessho, T., Kawabata, K.,Kusunoki, T., Nishimura, T., Okada, H., Okami, K., Suzuki,S., & Teraoka, Y. 1992. Modal compositions of represen-tative sandstones from the Japanese Islands and their tec-tonic implications. The Memoirs of the Geological Societyof Japan 38, 385–400, (In Japanese with English abstract).
Lee, J. I. & Lee, Y. I. 2000. Provenance of the Lower Creta-ceous Hayang Group, Gyeongsang Basin, Southeastern Ko-rea: implications for continental-arc volcanism. Journal ofSedimentary Research 70, 151–158.
Lirer, L. & Vinci, A. 1991. Grain-size distributions of pyro-clastic deposits. Sedimentology 38, 1075–1083.
Mack, G. H. 1978. The survivability of labile light-mineralgrains in fluvial, aeolian and littoral marine environments:the Permian Cutler and Cedar Mesa Formations, Moab, Utah.Sedimentology 25, 587–604.
Mack, G. H. 1984. Exceptions to the relationship between platetectonics and sandstone composition. Journal of SedimentaryPetrology 54, 212–220.
Maritime Safety Agency. 1990. Basic Map of the Sea inCoastal Waters (1:50,000), Abashiri, Tokyo.
Marsaglia, K. M. & Ingersoll, R. V. 1992. Compositionaltrends in arc-related, deep-marine sand and sandstone: a re-
704
assessment of magmatic-arc provenance. Geological Societyof America Bulletin 104, 1637–1649.
Marsaglia, K. M., Ingersoll, R. V. & Packer, B. M. 1992.Tectonic evolution of the Japanese Islands as reflected inmodal compositions of Cenozoic forearc and backarc sandand sandstone. Tectonics 11, 1028–1044.
Matsushita, K. 1960. Explanatory text of the geological mapof Japan, Syari (scale 1:50000), Hokkaido DevelopmentAgency, (in Japanese with English abstract).
McBride, E. F., Abel-Wahab, A. & McGilvery, T. A. 1996. Lossof sand-size feldspar and rock fragments along the SouthTexas Barrier Island, USA. Sedimentary Geology 107, 37–44.
McBride, E. F. & Picard, M. D. 1987. Downstream changesin sand composition, roundness, and gravel size in a short-headed, high-gradient stream, northwestern Italy. Journal ofSedimentary Petrology 57, 1018–1026.
McLaren, P. & Bowles, D. 1985. The effects of sedimenttransport on grain-size distributions. Journal of SedimentaryPetrology 55, 457–470.
McManus, D. A. 1975. Modern versus relict sediment on thecontinental shelf. Geological Society of America Bulletin 86,1154–1160.
Nagai, T. 2002. Long term statistical report on nationwideocean wave information network for ports and harbours(NOWPHAS 1970–1999), Technical note of the Port and Air-port Research Institute no. 1035, Port and Airport ResearchInstitute, Yokosuka, Japan.
Nakamura, K., Aota, M. & Otsuki, T. 1985. Okhotsk Sea –physics, In The Oceanographical Society of Japan & CoastalOceanography Research Committee (eds.) Coastal Oceanog-raphy of Japanese Islands, pp. 7–22, Tokai University Press,(in Japanese).
Nesbitt, H. W. & Young, G. M. 1996. Petrogenesis of sedimentsin the absence of chemical weathering: effects of abrasionand sorting on bulk composition and mineralogy. Sedimen-tology 43, 341–358.
Nesbitt, H. W., Young, G. M., McLennan, S. M. & Keays,R. R. 1996. Effects of chemical weathering and sorting onthe petrogenesis of siliciclastic sediments, with implicationsfor provenance studies. Journal of Geology 104, 525–542.
Noda, A., Ikehara, K. & Katayama, H. in press. Sedimen-tological map Kitami-Yamato Tai, Geological Survey ofJapan/AIST.
Okumura, K. 1991. Quaternary tephra studies in the Hokkaidodistrict, Northern Japan. Daiyonki-Kenkyu (The QuaternaryResearch) 30, 379–390, (in Japanese with English abstract).
Okumura, K. 1996. Tephrochronology, correlation, and defor-mation of marine terraces in eastern Hokkaido, Japan. Geo-graphical Reports of Tokyo Metropolitan University 31, 19–26.
Riegel, S. A., Fujita, K., Koz’min, B. M., Imaev, V. S. & Cook,D. B. 1993. Extrusion tectonics of the Okhotsk plate, north-east Asia. Geophysical Research Letters 20, 607–610.
Ruxton, B. P. 1970. Labile quartz-poor sediments from young
mountain ranges in northeast Papua. Journal of SedimentaryPetrology 40, 1262–1270.
Sassa, Y. & Inoue, T. 1939. Stratigraphy of the Tertiaryaround Abashiri II. Journal of the Japanese Association forPetroleum Technology 7, 26–37, (in Japanese).
Sato, H. 1970. Geological map of Shari (scale 1:200000), Ge-ological Survey of Japan.
Sato, H. & Mitsunashi, T. 1970. Geological map of Abashiri(scale 1:200000), Geological Survey of Japan.
Smosna, R., Bruner, K. R. & Burns, A. 1999. Numerical anal-ysis of sandstone composition, provenance, and paleogeog-raphy. Journal of Sedimentary Research 69, 1063–1070.
Solohub, J. T. 1970. Evaluation of grain-size parameters inlacustrine environments. Journal of Sedimentary Petrology40, 81–101.
Suczek, C. A. & Ingersoll, R. V. 1985. Petrology and prove-nance of Cenozoic sand from the Indus Cone and the Ara-bian Basin, DSDP sites 221, 222, and 224. Journal of Sedi-mentary Petrology 55, 340–346.
Sugimoto, R. & Hasegawa, K. 1959. Explanatory text of the ge-ological map of Japan, Sharidake (scale 1:50000), HokkaidoDevelopment Agency, (in Japanese with English abstract).
Suttner, L. J. & Basu, A. 1985. The effect of grain size ondetrital modes: a test of the Gazzi-Dickinson point-countingmethod—Discussion. Journal of Sedimentary Petrology 55,616–617.
Suttner, L. J., Basu, A. & Mack, G. H. 1981. Climate and theorigin of quartz arenites. Journal of Sedimentary Petrology51, 1235–1246.
Swan, A. R. H. & Sandilands, M. 1995. Introduction to geo-logical data analysis, Blackwell Science, London.
Swift, D. J. P., Stanley, D. J. & Curray, J. R. 1971. Relictsediments on continental shelves: a reconsideration. Journalof Geology 79, 322–346.
Tsushima, K. 1974. Geological map of Shiretoko (scale1:200000), Geological Survey of Japan.
Umitsu, M. 1983. Geomorphic development of the TokoroRiver lowland. Geographical Sciences 38, 1–10, (in Japanesewith English abstract).van der Plas, L. & Tobi, A. C. 1965. A chart for judging
the reliability of point counting results. American Journal ofScience 263, 87–90.von Eynatten, H., Barcelo-Vidal, C. & Pawlowsky-Glahn, V.
2003. Sandstone composition and discrimination: a statis-tical evaluation of different analytical methods. Journal ofSedimentary Research 73, 47–57.
Weltje, G. J. 1995. Unravelling mixed provenance of coastalsands: the Po Delta and adjacent beaches of the northernAdriatic Sea as a test case, In Oti, M. N. & Postma, G. (eds.)Geology of deltas, pp. 181–202, Balkema, Rotterdam.
Weltje, G. J. 2002. Quantitative analysis of detrital modes: sta-tistically rigorous confidence regions in ternary diagrams andtheir use in sedimentary petrology. Earth-Science Reviews57, 211–253.
Weltje, G. J. & Prins, M. A. 2003. Muddled or mixed? Inferringpalaeoclimate from size distributions of deep-sea clastics.Sedimentary Geology 162, 39–62.
705
Whitmore, G., Crook, K. & Johnson, D. 2004. Grain size con-trol of mineralogy and geochemistry in modern river sedi-ment, New Guinea collision, Papua New Guinea. Sedimen-tary Geology 171, 129–157.
Wong, F. L. 2002. Heavy mineral provinces of the Palos Verdesmargin, south California. Continental Shelf Research 22,899–910.
Zhou, D., Chen, H. & Lou, Y. 1991. The logratio approachto the classification of modern sediments and sedimentaryenvironments in northern South China Sea. MathematicalGeology 23, 157–165.