24
1 TGP DART Update Meeting New York, NY May 18, 2017

Agenda
Welcome and Introductions Erin Mortimer
Regulatory Update Gene Nowak
KM Update Sherri Glazebrook
Operations/Scheduling Update Cathy Soape Hutton
Brian Merchant
Commercial Update Coralie Sculley
DART
Contract Updates Sherry Noack
Nominations Debbie Vasquez
Discussion and Feedback All
2

TRANSPORTATION SERVICES ORGANIZATIONAL
STRUCTURE
3
WEARs DSRs

NAESB / KM Update
• Passport – EPNG/Mojave
• October 1, 2017
• Last of 4 major system conversions – 5 ½ years
• Ongoing upgrades to DART
• Limited resources due to focus on conversions and related regression testing
• 2018 will be a year of various improvements that have been backlogged over the years
• NAESB – GEH (Gas Electric Harmonization)
• FERC Order 809 requested NAESB to continue looking for way to have faster
scheduling and confirmation processes
• KM actively participated in a series of GEH forums and NAESB standards meetings
• Default level of confirmations was narrowly defeated
• NAESB Version 3.1 will be published in 3rd Quarter 2017 – no major changes
• INGAA Educational Seminar to FERC Staff – Feb 2017
• Scheduling and Moving Gas Through a Pipeline
• Design, Scheduling and Flexibility
4

Winter Look Back Summary
Peak Day was ~10.1 Bcfd on Jan 7, 2017 - Deliveries
Peak Day was ~1.7 Bcfd on Jan 8, 2017 – Storage (withdrawal)
Peak Day was ~1.8 Bcfd on Jan 7, 2017 – Power Plant Load
Winter OFO count
2016/2017 Zones 5 & 6 - 28 vs 21 in 2015/2016
11 OFO’s were directed at power plants (Dec/Jan) vs 8 in 2015/16
2016/2017 All other zones - 16 vs 6 in 2015/2016
Storage Inventories down from 2015/16
44% lower than the levels for 2015/16
2% higher than 2014/15
System Challenges
Less supply coming in from Dracut/Distrigas
Short Term Unit/Pipeline Issues — Managed without cutting In-Path Services at Timely
Continuous communication between Commercial, Scheduling and Gas Control Groups
5

Winter Days - (%) Restricted Restriction
Point
Highly Utilized
TGP Paths
Percentage
Days Restricted
(November -
March)
Percentage
Days Restricted
(November -
March)
Percentage
Days Restricted
(November -
March)
Percentage
Days Restricted
(November -
March)
2013/2014 2014/2015 2015/2016 2016/2017
Sta. 200/204 30.46% 22.52% 64.47% 68.87%
Sta. 245 100% 100% 100.00% 99.33%
Sta. 261 30.46% 32.45% 68.42% 27.81%
Sta. 267 2.65% 5.29% 30.92% 55.63%
MLV 273 0.00% 0.00% 0.00% 17.22%
Sta. 315 BH 100% 100% 76.32% 96.69%
Sta. 321 94.70% 94.71% 86.18% 92.72%
MLV 336 50.33% 73.51% 57.24% 30.46%
MLV 355 BH 70.20% 5.96% 9.21% 5.30%
Sta. 1 BH 50.99% 11.26% 84.21% 0.00%
Sta. 9 BH 0.00% 0.00% 0.00% 43.71%
Mahwah 49.67% 64.24% 92.76% 88.08%
Rivervale 80.79% 80.79% 66.45% 80.79%

7
Summer Preview
Demand to remain strong across the system
Capacity Utilization on the 200/300 Line in Northeast should remain high
Marcellus and Utica Production to remain at High Levels
Southbound Flows
Volumes through Station 87 should remain in the 2.0-2.2 Bcf/d as maintenance activities are completed
Exports to Mexico and Canada to remain strong
Storage Field Levels
Northern Storage levels down from last year; better able to manage maintenance activities and handle market area supply swings
Bear Creek Storage levels higher than last year; better able to handle higher power demand in the South
High level of system maintenance, repair, rebuild activity
GETTING READY FOR WINTER

DART SCHEDULING TOOLS
No delivery nominations allowed to Dracut
No receipt nominations allowed at Mendon until ID1 (compared to EPSQ volumes)
No delivery nominations allowed at Wright/Shelton until ID1 (compared to EPSQ volumes)
Invalid nominations not allowed
Limitations of Storage Services/Linepack Services
No meter bounces allowed at power plants downstream (may be invoked)
New restriction locations as needed
Imbalance Warnings
Monthly OFOs
Daily OFOs
Hourly OFOs – new screens coming
Additional segment capacities posted to the EBB
8
Forward-Looking Statements /
Non-GAAP Financial Measures
This presentation includes forward-looking statements within the meaning of the U.S. Private Securities Litigation Reform Act of 1995 and
Section 21E of the Securities and Exchange Act of 1934. These forward-looking statements are identified as any statement that does not relate
strictly to historical or current facts. In particular, statements, express or implied, concerning future actions, conditions or events, future operating
results or the ability to generate revenues, income or cash flow or to pay dividends are forward-looking statements. Forward-looking statements
are not guarantees of performance. They involve risks, uncertainties and assumptions. Future actions, conditions or events and future results of
operations of Kinder Morgan, Inc. may differ materially from those expressed in these forward-looking statements. Many of the factors that will
determine these results are beyond Kinder Morgan's ability to control or predict. These statements are necessarily based upon various
assumptions involving judgments with respect to the future, including, among others, the timing and extent of changes in the supply of and
demand for the products we transport and handle; national, international, regional and local economic, competitive and regulatory conditions and
developments; the timing and success of business development efforts; technological developments; condition of capital and credit markets;
inflation rates; interest rates; the political and economic stability of oil producing nations; energy markets; weather conditions; environmental
conditions; business, regulatory and legal decisions; terrorism, including cyber-attacks; and other uncertainties. There is no assurance that any of
the actions, events or results of the forward-looking statements will occur, or if any of them do, what impact they will have on our results of
operations or financial condition. Because of these uncertainties, you are cautioned not to put undue reliance on any forward-looking statement.
Please read "Risk Factors" and "Information Regarding Forward-Looking Statements" in our most recent Annual Report on Form 10-K and our
subsequently filed Exchange Act reports, which are available through the SEC’s EDGAR system at www.sec.gov and on our website at
www.kindermorgan.com.
We use non-generally accepted accounting principles (“non-GAAP”) financial measures in this presentation. These non-GAAP measures should
not be considered as alternatives to GAAP financial measures.
9

Natural Gas Pipelines Segment Outlook
Well-positioned connecting key natural gas resources with major demand centers
Growing Footprint:
Own or operate largest natural gas
network in North America
— ~70,000 miles of pipeline
— ~70 Bcf/d of capacity
— ~690 Bcf of storage capacity
Moving ~40% of U.S. natural gas
consumption
Connected to every important natural
gas resources play in the U.S.
Project Backlog:
$3.4 billion of identified growth projects
over next four years (2017-2020)(a),
including:
— LNG liquefaction (Elba Island, GA)
— Transport projects supporting LNG
liquefaction
— Expansions to Mexico border
— TGP North-South projects __________________________
(a) Includes KM share of non-wholly owned projects. Includes
projects currently under construction. 10
11
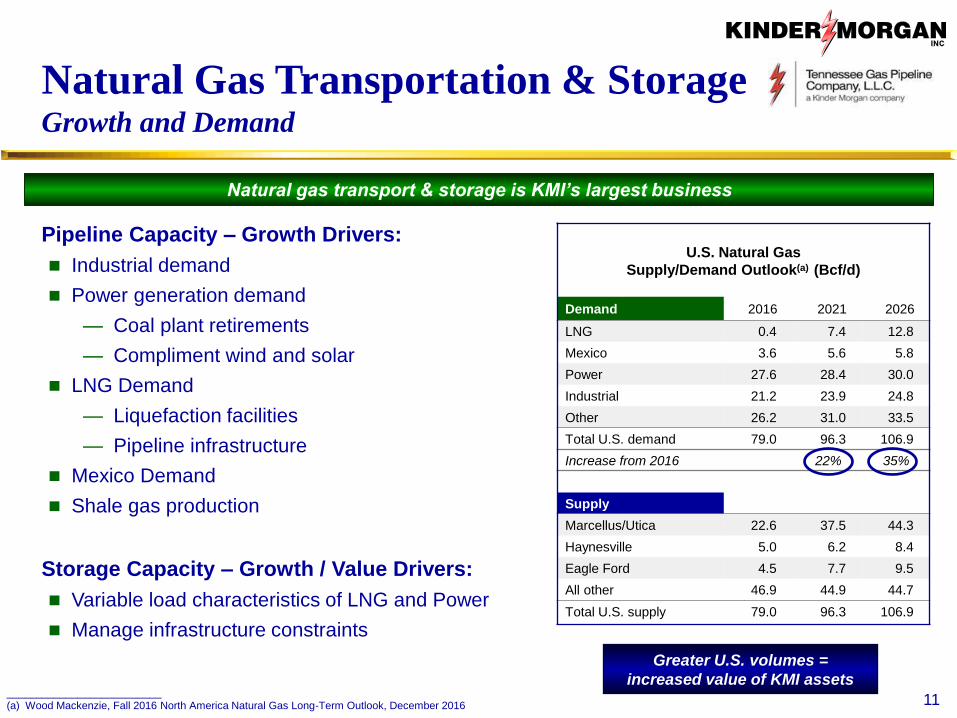
Natural gas transport & storage is KMI’s largest business
U.S. Natural Gas
Supply/Demand Outlook(a) (Bcf/d)
Demand 2016 2021 2026
LNG 0.4 7.4 12.8
Mexico 3.6 5.6 5.8
Power 27.6 28.4 30.0
Industrial 21.2 23.9 24.8
Other 26.2 31.0 33.5
Total U.S. demand 79.0 96.3 106.9
Increase from 2016 22% 35%
Supply
Marcellus/Utica 22.6 37.5 44.3
Haynesville 5.0 6.2 8.4
Eagle Ford 4.5 7.7 9.5
All other 46.9 44.9 44.7
Total U.S. supply 79.0 96.3 106.9
Greater U.S. volumes =
increased value of KMI assets
Natural Gas Transportation & Storage Growth and Demand
Pipeline Capacity – Growth Drivers:
Industrial demand
Power generation demand
— Coal plant retirements
— Compliment wind and solar
LNG Demand
— Liquefaction facilities
— Pipeline infrastructure
Mexico Demand
Shale gas production
Storage Capacity – Growth / Value Drivers:
Variable load characteristics of LNG and Power
Manage infrastructure constraints
__________________________
(a) Wood Mackenzie, Fall 2016 North America Natural Gas Long-Term Outlook, December 2016

Northeast shale production expected
to double by 2026(a)
— 40% of all U.S. natural gas production
— North–to–South transport continues to
grow, even with higher costs
KM Opportunity
— TGP: First mover in the Marcellus/Utica
• ~ 4.5 Bcf/d combined Northeast receipts
• ~ 11 Bcf/d of Northeast receipt capacity
• ~ 2 Bcf/d transported from North-to-South
— 938 MDth/d of expansion projects in
development to support NE supply growth
— Total program capital ~ $1.2 Billion
Drivers of Future Growth Marcellus/Utica
__________________________
(a) ICF – Gas Transport in a Changing Market Environment 4/20/17 and KM analysis.
KM Asset KM Project/Transportation
Contracted
Capacity
(MDth/d)
In-Service
Date
KM Capital
($MM)
TGP Broad Run Flexibility 590 In-Service
$736.1
TGP Broad Run Expansion 200 6/2018
TGP Susquehanna West 143 11/2017 $143
TGP Orion 135 6/2018 $129.3
NGPL Gulf Coast Southbound (via REX) 460 10/2018 $212
12
Forecast

Sta 87
Supply-Push Dth/d In-Service
Broad Run Expansion 200,000 Jun-2018
Susquehanna West 145,000 Nov-2017
Orion 135,000 Jun-2018
Market-Pull Dth/d In-Service
SW Louisiana Supply 900,000 Q1-2018
Lone Star 300,000 Jan-2019
Connecticut Expansion 72,100 Nov-2017
Triad 180,000 Jun-2018
Development Project Updates
13
Sta 219
Sta 17
Sta 534
Sta 313
Sta 47
Sta 40

Market-Driven Project
o Demand growth in Connecticut
Capacity: 72,100 Dth/d
Customers: Southern Connecticut,
Connecticut Natural,
Yankee
Projected In-service: November 2017
Project Scope:
o 13.46 miles of pipeline loop
o Acquisition of Thompsonville Lateral
Project Status:
o FERC certificate received March 11, 201
o FERC issued Notice to Proceed for tree
clearing & full construction April 12, 2017
o MA 401 Permit final and unappeable as of
April 24, 2017
14
Connecticut Expansion Project

The Importance of Fossil Fuels …and the Recent, Modest Growth of Renewable Energy
Fossil Fuels
Have accounted for >80% of total U.S. energy consumption
over the last 100+ years(a)
Generating ~67% of U.S. electricity (Q3-2016)(b)
Over 99% of U.S. light vehicles today run on gasoline or
diesel (>250 million cars and trucks)(c)
Approximately 66% of global textile production comes from
synthetic fibers derived from fossil fuels(d)
__________________________
(a) EIA, Monthly Energy Review, April 2016
(b) EIA, Monthly Energy Review, December 2016
(c) Goldman Sachs, Start Me Up v2.0
(d) Textile Exchange, Preferred Fiber and Materials Market Report, July 2016 15
Coal
Petroleum
Natural Gas
Nuclear Hydroelectric
Other Renewable
Wood
0%
20%
40%
60%
80%
100%
201519751935189518551815
Share of U.S. Energy Consumption by Major Energy Source, 1776-2015
Renewables
Accounted for only ~15% of U.S. generation i(Q3-2016)(a)
— About half is hydropower which is not expected to grow
Renewable energy cannot be stored effectively at scale
— Wind and Solar are intermittent and require reliable
complimentary sources for balancing and backup
— Natural gas has primarily fulfilled this role

Natural Gas Critical to Climate Goals Opposition to Natural Gas is Misplaced
16
Monthly Energy Review(a) 1993 2007 2015
U.S. Population ~260 million ~301 million ~321 million
Real GDP ~$9.5 trillion ~$14.9 trillion ~$16.3 trillion
Power sector CO2 emissions 1.92 GT 2.42 GT 1.91 GT
Power generation (GWh) 3,197,191 4,156,745 4,077,601
Coal 53% 49% 33%
Natural Gas 13% 22% 33%
Nuclear 19% 19% 20%
Solar/Wind <1% <1% 5%
__________________________
(a) EIA, Monthly Energy Review, December 2016.
(b) EPA, U.S. Greenhouse Gas Inventory Report, April 2016.
Natural gas is the cleanest burning fossil fuel with significantly lower
emissions than coal or fuel oil
Switching from coal to natural gas has driven a reduction in the nation’s
power sector CO2 emissions
U.S. methane emissions decreased 6% from 1990 to 2014(b) despite a 46%
increase in natural gas production(a) over the same period

Pipeline Development Environment Attack on Fossil Fuels Focused on Pipelines
17
NGO Opposition
Well funded and organized
— National, regional and local
— Challenging every step in process
Refining tactics
— Widespread misinformation
— Consistently linked to production and exports
— Delaying construction
— Focus on state resource agencies
State Permitting Challenges
Interdependency of permits and delegation of authority
Agency concern with “second guessing”
Requirements vary significantly by state
Impacts
— Costly and time consuming
— Uncertainty and delays in obtaining permits
— More stringent requirements

It’s Changing How We Develop Projects
Project Planning
— Extended timelines – from filing to in-service
— Thorough risk identification & planning
— Early Stakeholder engagement
— Safety and security
Relationship with Customers
— Stronger partnerships
— Earlier engagement
— Setting expectations
— Combined outreach and communication
Contracting
— Recognition of risks
— Risk allocation
— Account for potential schedule impacts
18

DART Modifications - Contracts In Progress/Upcoming
Request Description Status
Re-release Indicator Testing – planned implementation in June
Capacity Release Offer Upload
In discussion – plan to
start working on this in 3rd
or 4th quarter
Other Upcoming Capacity Release Enhancements Ability to release 100% of primary available quantity with the click of a button Ability to copy an offer with one click instead of two
Automatically delete the zero when clicking in the Max Offer Quantity box instead of manually deleting Add more filters to the All Offers/Awards screen Offer an un-editable format for the Capacity Release Award Audit Report in addition to the Excel format
19

20
DART Modifications – Noms/Confs In Progress/Upcoming
Request Description Status Fixing nomination validation and MDQ Utilization screen for specific overlapping nomination scenario In progress - 3rd Quarter
Confirmations for subsequent cycles In progress - 3rd Quarter
Ability to edit/modify submitted nomination batch Submitted
Contract Path Tab – Add row # Submitted Enhance Subscription to Critical Notices for subcategory options Upcoming

21
DART – Nominations

22
UDP Level Confirmation
Denotes confirmation party
Auto Match – On/Off

23
Tips for Buy/Sell transactions between UDPs at the same meter
Auto match - OFF
Nominations may duplicate if UDPs at a single meter use different confirmation methods (Auto match function on/off) AND buy and sell from each other.
UDP
A
UDP B
(as shipper)
UDP
C
UDP B
(as shipper)
Sell 1,000 Buy 1,000
Sell 1,000 Buy 1,000
Blue – manually entered Red – auto generated
Auto match - ON
Auto match - ON
Auto match - ON
Sell 1,000 Buy 1,000
*Possible duplicate nominations

Discussion And Feedback


