18
19 January 2021 4 th Annual General Meeting
19 January 2021
4th Annual General Meeting

2
This presentation is for information only and does not constitute or form part of an offer, solicitation, recommendation or invitation for the sale or purchase or subscription of securities, including units in
Frasers Logistics & Commercial Trust (formerly known as Frasers Logistics & Industrial Trust) (“FLCT”, and the units in FLCT, the “Units”) or any other securities of FLCT. No part of it nor the fact of its
presentation shall form the basis of or be relied upon in connection with any investment decision, contract or commitment whatsoever. The past performance of FLCT and Frasers Logistics & Commercial
Asset Management Pte. Ltd. (formerly known as Frasers Logistics & Industrial Asset Management Pte. Ltd.), as the manager of FLCT (the “Manager”), is not necessarily indicative of the future
performance of FLCT and the Manager.
This presentation contains “forward-looking statements”, including forward–looking financial information, that involve assumptions, known and unknown risks, uncertainties and other factors which may
cause the actual results, performance, outcomes or achievements of FLCT or the Manager, or industry results, to be materially different from those expressed in such forward-looking statements and
financial information. Such forward-looking statements and financial information are based on certain assumptions and expectations of future events regarding FLCT's present and future business
strategies and the environment in which FLCT will operate. The Manager does not guarantee that these assumptions and expectations are accurate or will be realised. You are cautioned not to place
undue reliance on these forward-looking statements, which are based on the Manager’s current view of future events. The Manager does not assume any responsibility to amend, modify or revise any
forward-looking statements, on the basis of any subsequent developments, information or events, or otherwise, subject to compliance with all applicable laws and regulations and/or the rules of the
Singapore Exchange Securities Trading Limited (“SGX-ST”) and/or any other regulatory or supervisory body or agency.
The information and opinions in this presentation are subject to change without notice, its accuracy is not guaranteed and it may not contain all material information concerning FLCT. None of Frasers
Property Limited, FLCT, the Manager, Perpetual (Asia) Limited, in its capacity as trustee of FLCT, or any of their respective holding companies, subsidiaries, affiliates, associated undertakings or
controlling persons, or any of their respective directors, officers, partners, employees, agents, representatives, advisers or legal advisers makes any representation or warranty, express or implied, as to
the accuracy, completeness or correctness of the information contained in this presentation or otherwise made available or as to the reasonableness of any assumption contained herein or therein, and
any liability whatsoever (in negligence or otherwise) for any loss howsoever arising, whether directly or indirectly, from any use, reliance or distribution of this presentation or its contents or otherwise
arising in connection with this presentation is expressly disclaimed. Further, nothing in this presentation should be construed as constituting legal, business, tax or financial advice.
The value of Units and the income derived from them, if any, may fall or rise. Units are not obligations of, deposits in, or guaranteed by, the Manager or any of its affiliates. An investment in the Units is
subject to investment risks, including the possible loss of the principal amount invested. Investors should note that they have no right to request the Manager to redeem their Units while the Units are
listed. It is intended that holders of Units may only deal in their Units through trading on the SGX-ST. Listing of the Units on the SGX-ST does not guarantee a liquid market for the Units.
This advertisement has not been reviewed by the Monetary Authority of Singapore.
Nothing in this presentation constitutes or forms a part of any offer to sell or solicitation of any offer to purchase or subscribe for securities for sale in Singapore, the United States or any other jurisdiction
in which such offer, solicitation or sale would be unlawful prior to registration or qualification under the securities laws of any such jurisdiction.
3
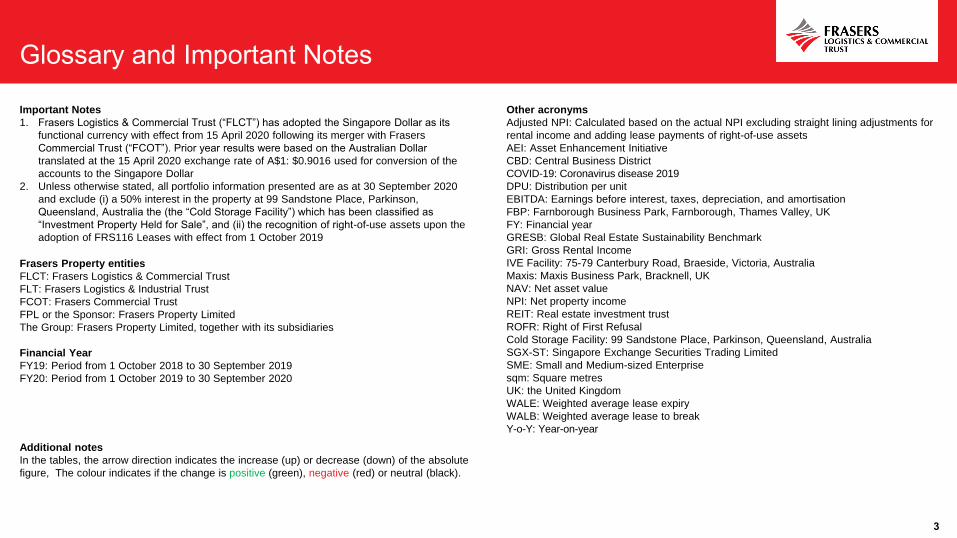
Frasers Property entities
FLCT: Frasers Logistics & Commercial Trust
FLT: Frasers Logistics & Industrial Trust
FCOT: Frasers Commercial Trust
FPL or the Sponsor: Frasers Property Limited
The Group: Frasers Property Limited, together with its subsidiaries
Financial Year
FY19: Period from 1 October 2018 to 30 September 2019
FY20: Period from 1 October 2019 to 30 September 2020
Other acronyms
Adjusted NPI: Calculated based on the actual NPI excluding straight lining adjustments for
rental income and adding lease payments of right-of-use assets
AEI: Asset Enhancement Initiative
CBD: Central Business District
COVID-19: Coronavirus disease 2019
DPU: Distribution per unit
EBITDA: Earnings before interest, taxes, depreciation, and amortisation
FBP: Farnborough Business Park, Farnborough, Thames Valley, UK
FY: Financial year
GRESB: Global Real Estate Sustainability Benchmark
GRI: Gross Rental Income
IVE Facility: 75-79 Canterbury Road, Braeside, Victoria, Australia
Maxis: Maxis Business Park, Bracknell, UK
NAV: Net asset value
NPI: Net property income
REIT: Real estate investment trust
ROFR: Right of First Refusal
Cold Storage Facility: 99 Sandstone Place, Parkinson, Queensland, Australia
SGX-ST: Singapore Exchange Securities Trading Limited
SME: Small and Medium-sized Enterprise
sqm: Square metres
UK: the United Kingdom
WALE: Weighted average lease expiry
WALB: Weighted average lease to break
Y-o-Y: Year-on-year
Additional notes
In the tables, the arrow direction indicates the increase (up) or decrease (down) of the absolute
figure, The colour indicates if the change is positive (green), negative (red) or neutral (black).
Important Notes
1. Frasers Logistics & Commercial Trust (“FLCT”) has adopted the Singapore Dollar as its
functional currency with effect from 15 April 2020 following its merger with Frasers
Commercial Trust (“FCOT”). Prior year results were based on the Australian Dollar
translated at the 15 April 2020 exchange rate of A$1: $0.9016 used for conversion of the
accounts to the Singapore Dollar
2. Unless otherwise stated, all portfolio information presented are as at 30 September 2020
and exclude (i) a 50% interest in the property at 99 Sandstone Place, Parkinson,
Queensland, Australia the (the “Cold Storage Facility”) which has been classified as
“Investment Property Held for Sale”, and (ii) the recognition of right-of-use assets upon the
adoption of FRS116 Leases with effect from 1 October 2019

FY2020: Year in Review
Section Divider To add a background, press Insert > Pictures > Picture from File > Send to back
2 Burilda Close, Wetherill Park, New South Wales, Australia
5
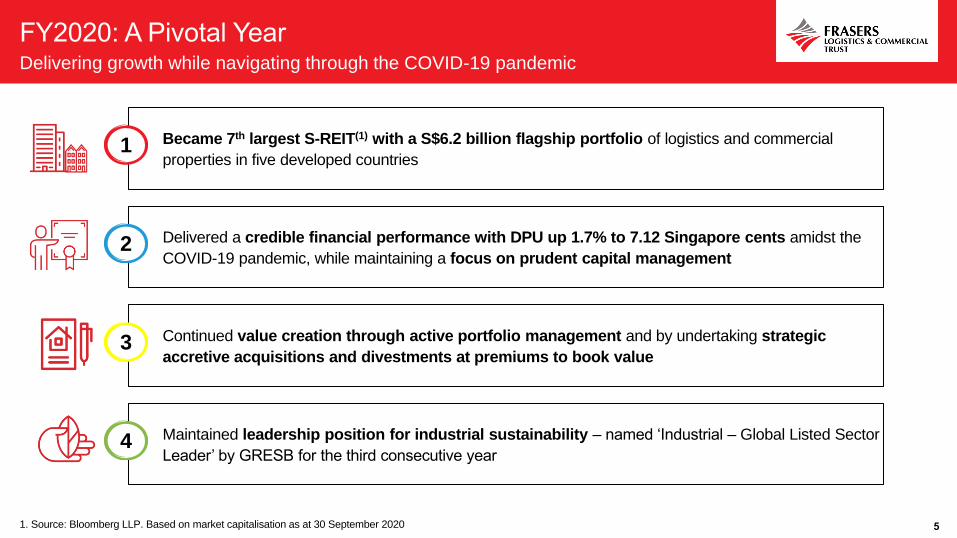
Delivering growth while navigating through the COVID-19 pandemic
Became 7th largest S-REIT(1) with a S$6.2 billion flagship portfolio of logistics and commercial
properties in five developed countries1
Delivered a credible financial performance with DPU up 1.7% to 7.12 Singapore cents amidst the
COVID-19 pandemic, while maintaining a focus on prudent capital management2
Continued value creation through active portfolio management and by undertaking strategic
accretive acquisitions and divestments at premiums to book value3
Maintained leadership position for industrial sustainability – named ‘Industrial – Global Listed Sector
Leader’ by GRESB for the third consecutive year4
1. Source: Bloomberg LLP. Based on market capitalisation as at 30 September 2020

6
Across five developed markets
97.5%
Occupancy Rate(2)
S$6.2 billion
Portfolio Value(1)
100 properties
Across 5 Countries(1)
4.9 years
WALE(2)
1. For the avoidance of doubt, all portfolio information are as at 30 September 2020 and includes the three leasehold properties in South Australia, which are expected to be divested by 31 March 2021. For details on the
divestments, please refer to FLCT’s press release dated 10 December 2020. 2. Based on GRI, being the contracted rental income and estimated recoverable outgoings for the month of September 2020. Excludes straight lining
rental adjustments and include committed leases
Australia , 46.5%
Germany, 21.3%
Singapore, 20.5%
UK, 7.0%
The Netherlands,
4.7%
Portfolio Value by
Geography(1)
UK
(2 Properties)
Australia
(65 Properties)
Singapore
(2 Properties)
Germany
(26 Properties)The Netherlands
(5 Properties)
Industrial & Logistics (93 properties)
Commercial / Business Parks (7 properties)
Logistics & Industrial,
58.6%
Office & Business
Parks, 21.0%
CBD Commercial,
20.4%
Portfolio Value
by Asset Type(1)
1

77
DPU
7.12 S cents▲ 1.7% y-o-y 7.00
7.12FY2020
FY2019
Revenue
S$332.0 m▲ 53.0% y-o-y 217.1
332.0FY2020
FY2019
Distributable Income
S$201.1 m▲ 48.8% y-o-y 2QFY19135.1
201.1FY2020
F20Y19
Adjusted NPI(1)
S$258.3 m▲ 46.2% y-o-y 176.6
258.3FY2020
FY2019
FY2020 Key Financial Highlights
11 Gibbon Road, Winston Hills, New South Wales, Australia
Higher top and bottom-line driven by merger and strong portfolio performance
1. Adjusted NPI refers to Adjusted Net Property Income. FY2020 Adjusted NPI is calculated based on the actual net property income excluding straight lining adjustments for rental income and adding lease payments of right-of-use assets. FY2019 Adjusted
NPI is calculated based on the actual net property income excluding straight lining adjustments for rental income and after adding back straight lining adjustments for ground leases.
2
NAV per Unit
S$1.10▲ 19.6%
0.92
1.1030 Sep 20
30 Sep 19

8
Strong balance sheet and a well-staggered debt maturity profile
Key Financial Metrics
1. Based on trailing 12 months borrowing cost (including FCOT from date of completion of merger). 2. Prior to reaching the 50.0% aggregate regulatory leverage limit. 3. As defined in the Code on Collective Investment Schemes
revised by the Monetary Authority of Singapore on 16 April 2020 and clarified on 29 May 2020 and computed as trailing 12 months EBITDA (excluding effects of any fair value changes of derivatives and investment properties, and
foreign exchange translation), over trailing 12 months borrowing costs. Borrowing costs include effects of FRS 116. 4. The divestment of the Cold Storage Facility was completed on 23 November 2020. 5. Includes S$64 million of
borrowings that have been refinanced to FY2026 in October 2020.
Aggregate Leverage
37.4%
Interest coverage ratio(3)
6.4 times
Debt Headroom(2)
S$1,651 m167 132
49 -111
-
206
21 62
567
67
103
254
81
50
313
64
50
19
203
677
234
130
617
693
FY2021 FY2022 FY2023 FY2024 FY2025 > FY2026
A$ Debt € Debt S$ Debt £ Debt
Well-spread Weighted Average Debt Maturity Profile of 3.0 years
Total Gross Borrowings:
S$2,454 million
S$64 million borrowings have been refinanced to FY2026 in October 2020, thereby
lengthening the weighted average debt maturity from 3.0 to 3.2 years
FY2021 borrowings to be partially paid down with proceeds from the divestment of
the Cold Storage Facility(4)
Approximately 48% of borrowings maturing in FY2021 are due in 2HFY2021
(5)
Cost of Borrowings(1)
1.9%
2
% of Borrowings at Fixed Rates
54.6%
(As at 30 September 2020) (As at 30 September 2020)

9
Resilient portfolio operating metrics amidst a challenging year
1. Based on GRI, being the contracted rental income and estimated recoverable outgoings for the month of September 2020. Excludes straight lining rental adjustments and include committed leases. 2. Calculated based on the signing gross rent (excluding any
contracted fixed annual rental step-ups) of the new/renewed lease divided by the preceding terminating gross rent of each new/renewed lease (weighted by gross rent) of existing space.
◆ High occupancy through proactive portfolio management
Completed 37 lease renewals and 27 new leases in FY2020,
accounting for 267,996 sq m or 10.5% of total lettable area
Tenant retention rate of 88.7%
Average rental reversion of -0.1%(2) reported amidst a volatile
operating environment
IVE Facility, Victoria, Australia
As at 30 Sept 2020Logistics &
Industrial Commercial Total
No. of Properties 93 7 100
Portfolio Value
(S$ million)3,616.3 2,561.0 6,177.3
Lettable Area (sqm) 2,218,893 339,788 2,558,681
WALE(1) 5.5 years 4.2 years 4.9 years
WALB(1) 5.5 years 3.7 years 4.7 years
Occupancy Rate(1) 100.0% 94.3% 97.5%
Active Lease Management
64 leases signed10.5% of portfolio lettable area
Occupancy rate
97.5%High portfolio occupancy(1)
3

10
The REIT Manager is working closely with FLCT’s customers to overcome this trying period together while focusing on managing any near- to mid-term downside risk
from the pandemic
The COVID-19 impact on FLCT’s distributable income in the year-to-date to September 2020, which includes mainly rental waiver granted and provisions for rental
waiver for qualifying SME tenants were approximately S$5.7 million, which has not been material for the REIT
The REIT Manager will continue to monitor the situation closely, support our tenants and exercise prudence
1. COVID-19 (Temporary Measures) Act 2020, 16 July 2020, Rental Relief Framework for SMEs 2. Guidance, National lockdown: Stay at Home, 4 January 2021
Singapore
Fully passing on any
property tax rebate and
rental reliefs, as applicable,
to eligible tenants(1)
Expects near- to mid-term
impact on the retail
components of the
Singapore portfolio
Europe & UK
Limited impact on the
German and Dutch
industrial portfolio
Actively monitoring the
impact of the latest UK
national lockdown(2) on the
physical occupancy and
performance of the UK
properties
Australia
Limited impact on the
industrial and commercial
properties, with eligible
SMEs representing a small
proportion of the portfolio Expects near- to mid-term
impact on the retail
components of the
Australian portfolio
FLCT
No material impact to the FLCT portfolio
to-date
The logistics portfolio continued operating
during the pandemic, while the
commercial portfolio remains largely
stable with the retail segment representing
a small proportion of FLCT’s overall
income at just 2.5% of GRI
Structural changes driven by the growth
of e-commerce activities and ‘hub-and-
spoke’ trend are expected to drive
demand for logistics and suburban office
spaces, respectively
FLCT’s resilient portfolio, strong balance
sheet and financial flexibility well-
positions the REIT to face the current
challenging global environment
Update and commentary3
11
3.6%
6.9% 7.0% 6.4%5.0%
7.6%
4.4% 5.1%
1.0%
9.9%
2.5%
4.3%
5.0%
9.6%
3.6%
11.0%
0.8%
0.3%
1.8%
4.3%
Vacant Sep-21 Sep-22 Sep-23 Sep-24 Sep-25 Sep-26 Sep-27 Sep-28 Sep-29 Sep 2030 andbeyond
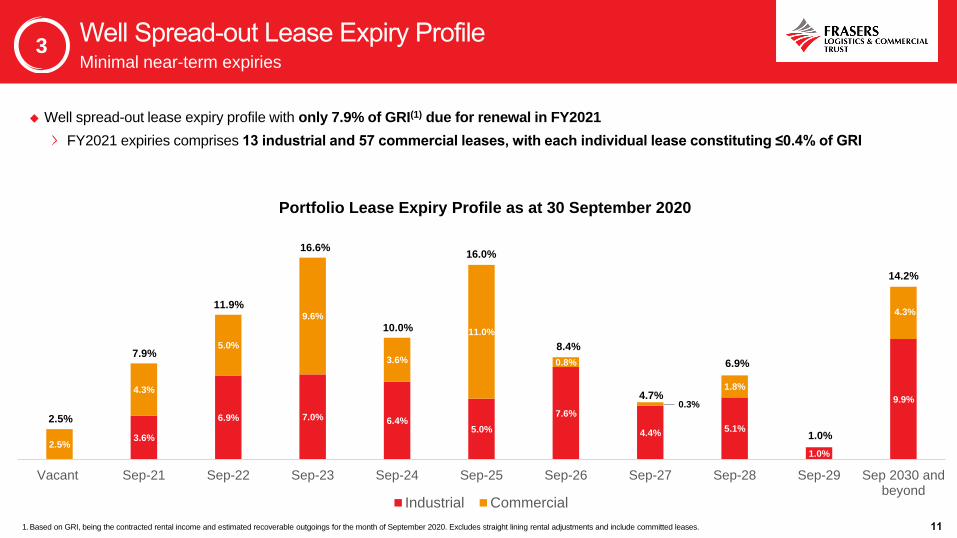
Portfolio Lease Expiry Profile as at 30 September 2020
Industrial Commercial
11.9%
Minimal near-term expiries
2.5%
7.9%
16.6%
10.0%
16.0%
8.4%
4.7%
6.9%
1.0%
14.2%
1.Based on GRI, being the contracted rental income and estimated recoverable outgoings for the month of September 2020. Excludes straight lining rental adjustments and include committed leases.
◆ Well spread-out lease expiry profile with only 7.9% of GRI(1) due for renewal in FY2021
FY2021 expiries comprises 13 industrial and 57 commercial leases, with each individual lease constituting ≤0.4% of GRI
3
12
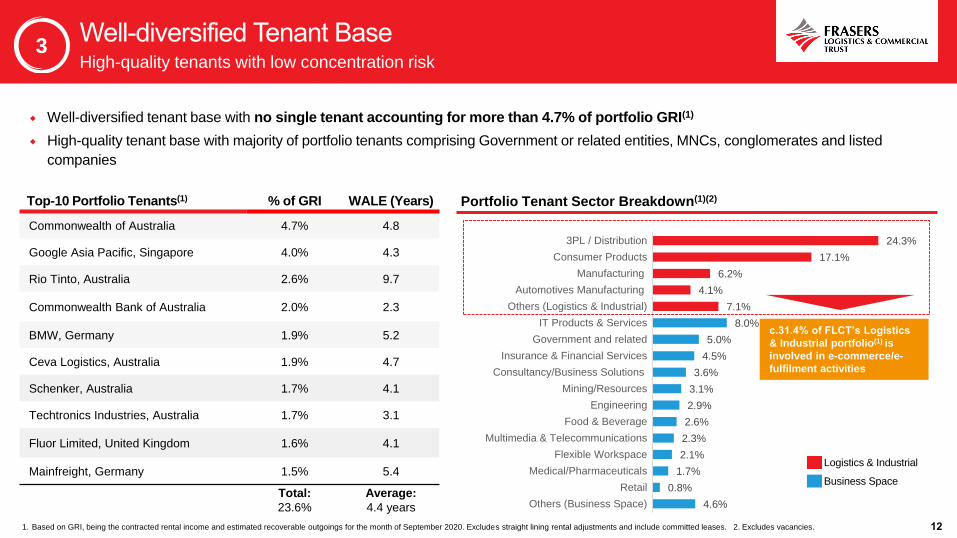
High-quality tenants with low concentration risk
Top-10 Portfolio Tenants(1) % of GRI WALE (Years)
Commonwealth of Australia 4.7% 4.8
Google Asia Pacific, Singapore 4.0% 4.3
Rio Tinto, Australia 2.6% 9.7
Commonwealth Bank of Australia 2.0% 2.3
BMW, Germany 1.9% 5.2
Ceva Logistics, Australia 1.9% 4.7
Schenker, Australia 1.7% 4.1
Techtronics Industries, Australia 1.7% 3.1
Fluor Limited, United Kingdom 1.6% 4.1
Mainfreight, Germany 1.5% 5.4
Total:
23.6%
Average:
4.4 years
1. Based on GRI, being the contracted rental income and estimated recoverable outgoings for the month of September 2020. Excludes straight lining rental adjustments and include committed leases. 2. Excludes vacancies.
24.3%
17.1%
6.2%
4.1%
7.1%
8.0%
5.0%
4.5%
3.6%
3.1%
2.9%
2.6%
2.3%
2.1%
1.7%
0.8%
4.6%
3PL / Distribution
Consumer Products
Manufacturing
Automotives Manufacturing
Others (Logistics & Industrial)
IT Products & Services
Government and related
Insurance & Financial Services
Consultancy/Business Solutions
Mining/Resources
Engineering
Food & Beverage
Multimedia & Telecommunications
Flexible Workspace
Medical/Pharmaceuticals
Retail
Others (Business Space)
Business Space
Logistics & Industrial
Portfolio Tenant Sector Breakdown(1)(2)
c.31.4% of FLCT’s Logistics
& Industrial portfolio(1) is
involved in e-commerce/e-
fulfilment activities
Well-diversified tenant base with no single tenant accounting for more than 4.7% of portfolio GRI(1)
High-quality tenant base with majority of portfolio tenants comprising Government or related entities, MNCs, conglomerates and listed
companies
3
13
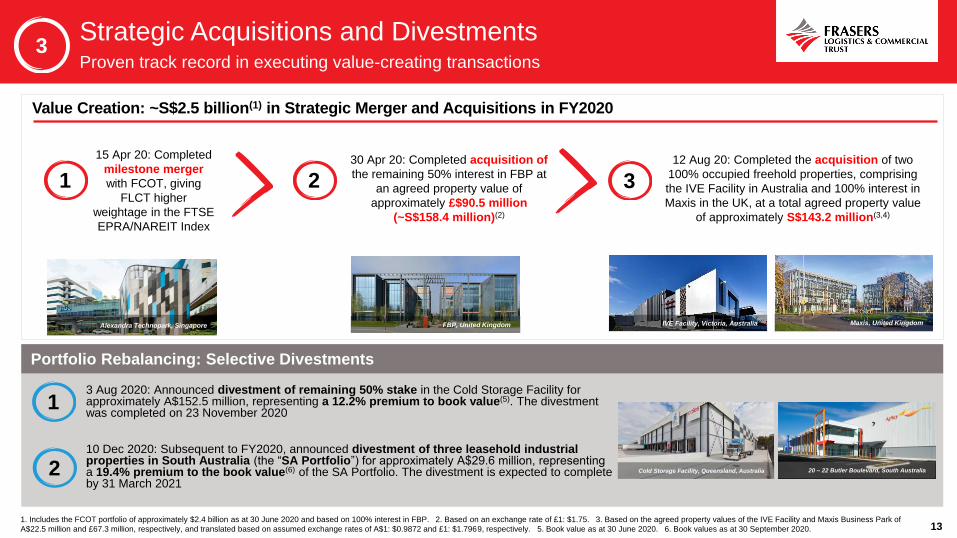
Strategic Acquisitions and DivestmentsProven track record in executing value-creating transactions
3 Aug 2020: Announced divestment of remaining 50% stake in the Cold Storage Facility for approximately A$152.5 million, representing a 12.2% premium to book value(5). The divestment was completed on 23 November 2020
1. Includes the FCOT portfolio of approximately $2.4 billion as at 30 June 2020 and based on 100% interest in FBP. 2. Based on an exchange rate of £1: $1.75. 3. Based on the agreed property values of the IVE Facility and Maxis Business Park of
A$22.5 million and £67.3 million, respectively, and translated based on assumed exchange rates of A$1: $0.9872 and £1: $1.7969, respectively. 5. Book value as at 30 June 2020. 6. Book values as at 30 September 2020.
Portfolio Rebalancing: Selective Divestments
1
10 Dec 2020: Subsequent to FY2020, announced divestment of three leasehold industrial properties in South Australia (the “SA Portfolio”) for approximately A$29.6 million, representing a 19.4% premium to the book value(6) of the SA Portfolio. The divestment is expected to complete by 31 March 2021
2
Value Creation: ~S$2.5 billion(1) in Strategic Merger and Acquisitions in FY2020
15 Apr 20: Completed
milestone merger
with FCOT, giving
FLCT higher
weightage in the FTSE
EPRA/NAREIT Index
IVE Facility, Victoria, Australia Maxis, United Kingdom
12 Aug 20: Completed the acquisition of two
100% occupied freehold properties, comprising
the IVE Facility in Australia and 100% interest in
Maxis in the UK, at a total agreed property value
of approximately S$143.2 million(3,4)
30 Apr 20: Completed acquisition of
the remaining 50% interest in FBP at
an agreed property value of
approximately £$90.5 million
(~S$158.4 million)(2)
1
Alexandra Technopark, Singapore
2
FBP, United Kingdom
3
Cold Storage Facility, Queensland, Australia 20 – 22 Butler Boulevard, South Australia
3
14
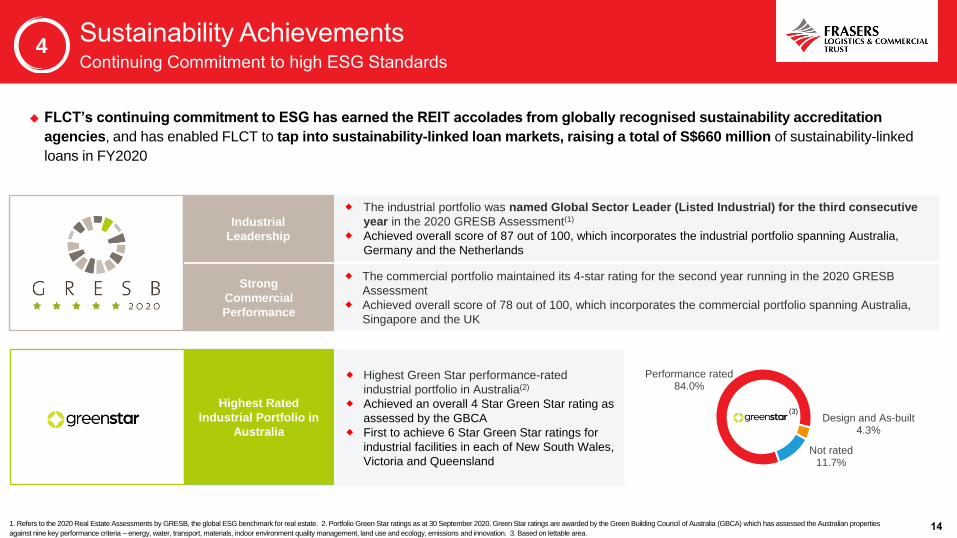
Industrial
Leadership
The industrial portfolio was named Global Sector Leader (Listed Industrial) for the third consecutive
year in the 2020 GRESB Assessment(1)
Achieved overall score of 87 out of 100, which incorporates the industrial portfolio spanning Australia,
Germany and the Netherlands
Highest Rated
Industrial Portfolio in
Australia
Highest Green Star performance-rated
industrial portfolio in Australia(2)
Achieved an overall 4 Star Green Star rating as
assessed by the GBCA
First to achieve 6 Star Green Star ratings for
industrial facilities in each of New South Wales,
Victoria and Queensland
Strong
Commercial
Performance
The commercial portfolio maintained its 4-star rating for the second year running in the 2020 GRESB
Assessment
Achieved overall score of 78 out of 100, which incorporates the commercial portfolio spanning Australia,
Singapore and the UK
Performance rated84.0%
Design and As-built4.3%
Not rated11.7%
(3)
1. Refers to the 2020 Real Estate Assessments by GRESB, the global ESG benchmark for real estate. 2. Portfolio Green Star ratings as at 30 September 2020. Green Star ratings are awarded by the Green Building Council of Australia (GBCA) which has assessed the Australian properties
against nine key performance criteria – energy, water, transport, materials, indoor environment quality management, land use and ecology, emissions and innovation. 3. Based on lettable area.
◆ FLCT’s continuing commitment to ESG has earned the REIT accolades from globally recognised sustainability accreditation
agencies, and has enabled FLCT to tap into sustainability-linked loan markets, raising a total of S$660 million of sustainability-linked
loans in FY2020
4
ROFR and Strategy
Section Divider To add a background, press Insert > Pictures > Picture from File > Send to back
Caroline Chisholm Centre, Canberra, Australia

16
Breakdown by Sector(2) Breakdown by Region(2)
CBD Commercial
5.3%
Office and Business Parks
19.2%
Logistics & Industrial
75.5%
Australia36.9%
Germany26.9%
Others4.6%
The Netherlands0.6%
Singapore6.6%
UK24.4%
Total:
~2.0 million sqm
Total:
~2.0 million sqm
Diversified ROFR pipeline from Sponsor>S$5 billion ROFR across asset classes and key markets in Asia Pacific and Europe
◆Access to a sizeable ROFR pipeline of more than S$5 billion granted by the Sponsor(1)
◆Able to leverage on the Sponsor’s integrated development and asset management capabilities
1. Comprises completed income-producing real estate (i) used for logistics or industrial purposes and located globally, and such real estate assets used for “logistics” or “industrial” purposes may also include office components
ancillary to the foregoing purposes, or (ii) used for commercial purposes (comprising primarily office space in a Central Business District (“CBD office space”)) or business park purposes (comprising primarily non-CBD office
space and/or research and development space) and located in the Asia Pacific region or in Europe (including the United Kingdom). 2. By lettable area as at 30 September 2020.
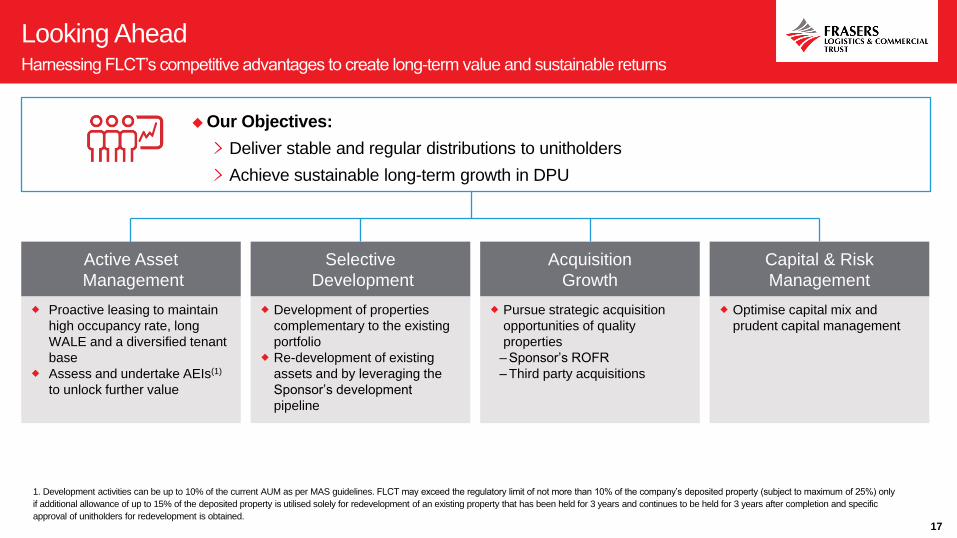
◆Our Objectives:
Deliver stable and regular distributions to unitholders
Achieve sustainable long-term growth in DPU
17
Looking Ahead
Active Asset
Management
Proactive leasing to maintain
high occupancy rate, long
WALE and a diversified tenant
base
Assess and undertake AEIs(1)
to unlock further value
Selective
Development
Development of properties
complementary to the existing
portfolio
Re-development of existing
assets and by leveraging the
Sponsor’s development
pipeline
Acquisition
Growth
Pursue strategic acquisition
opportunities of quality
properties
– Sponsor’s ROFR
– Third party acquisitions
Capital & Risk
Management
Optimise capital mix and
prudent capital management
1. Development activities can be up to 10% of the current AUM as per MAS guidelines. FLCT may exceed the regulatory limit of not more than 10% of the company’s deposited property (subject to maximum of 25%) only
if additional allowance of up to 15% of the deposited property is utilised solely for redevelopment of an existing property that has been held for 3 years and continues to be held for 3 years after completion and specific
approval of unitholders for redevelopment is obtained.
Harnessing FLCT’s competitive advantages to create long-term value and sustainable returns