23
EN EN 5 th Commission Summary on the Implementation of the Urban Waste Water Treatment Directive Commission Staff Working Document SEC(2009) 1114 final, 3.8.2009

EN EN
5th Commission Summary
on the Implementation of the Urban Waste Water Treatment Directive
Commission Staff Working Document SEC(2009) 1114 final, 3.8.2009
EN EN
COMMISSION OF THE EUROPEAN COMMUNITIES
Brussels, 3.8.2009 SEC(2009) 1114 final
COMMISSION STAFF WORKING DOCUMENT
5th Commission Summary on the Implementation of the Urban Waste Water Treatment Directive

EN EN
TABLE OF CONTENTS
1. Introduction...................................................................................................................3
2. Overview at EU level....................................................................................................5
3. Detailed analysis .........................................................................................................10
3.1. Requirements of the Directive ....................................................................................10
3.2. Designation of sensitive areas.....................................................................................10
3.3. Waste water infrastructure ..........................................................................................11
3.4. Compliance of waste water infrastructure ..................................................................15
4. Overall assessment......................................................................................................18
5. Conclusion ..................................................................................................................20
Data in this document are based on reports by Member States and reflect the state of play as of 31 December 2005/2006.
EN 3 EN
1. INTRODUCTION
The population of the European Union - with its 27 Member States - is nearly 500 million and the waste water generated by people and industry is a major source of pollution of European waters -groundwater, rivers, lakes and seas. Waste water discharges can lead to over-fertilisation and speed-up biodiversity loss; can affect drinking water supplies and thereby have important links to public health concerns. These impacts in turn may have serious negative consequences for economic sectors such as tourism.
The Urban Waste Water Treatment Directive1 (‘the Directive’) addresses these challenges by requiring the collection and treatment of waste water in all settlement areas and areas of economic activity (‘agglomerations’) with a population of more than 2000 (or more precisely generating a pollution load of more than 2000 population-equivalent (p.e.) 2). The implementation of this Directive represents a major financial challenge for the Member States. In this regard the Cohesion Policy funds provide a significant support to co-finance waste water treatment plants in the EU. The full implementation of the Directive is a pre-requisite for meeting the objective set out in the EU Water Framework Directive3 - to ensure that all waters in the EU achieve good ecological status by 2015.
The Directive provides for biological waste water treatment (‘secondary treatment’) to significantly reduce the biodegradable pollution in waste water. In the catchments of particularly sensitive waters (‘sensitive areas’), such as those suffering from eutrophication4 or those used for other purposes (bathing, drinking water abstraction, etc.), more stringent treatment is required to eliminate nutrients (mainly nitrogen and/or phosphorus) or bacteriological pollution.
For EU-15 Member States5 all deadlines in the Directive have expired and waste water collection and treatment therefore has to be in place for all agglomerations within the scope of the Directive. For EU-12 Member States6 some transitional periods have been granted for specific agglomerations on the basis of the load, the size of agglomerations or the nature of the discharge area.
This document describes the progress in the implementation of the Directive. The general overview at EU level is in Chapter 2 and a detailed analysis is in Chapter 3.
The report covers obligations which were due to be met by the end of 2005 and is based on a comprehensive questionnaire, which was jointly agreed by the Commission and Member States
1 Council Directive of Council Directive 91/271/EEC of 21 May 1991 concerning urban waste water treatment,
OJ L 135 of 30.5.1991, as amended by Commission Directive 98/15/EC of 27 February 1998, 2 Population equivalent (p.e.) is the standard unit for calculating the organic biodegradable pollution load, 1 p.e.
equals the average pollution generated by one person in one day 3 Directive 2000/60/EC of the European Parliament and of the Council of 23 October 2000 establishing a
framework for Community action in the field of water policy, OJ L327 of 22.12.2000, as amended 4 Eutrophication: enrichment of water by nutrients especially nitrogen and/or phosphorus, causing an accelerated
growth of algae and higher forms of plant life to produce an undesirable disturbance of the balance between organisms present in the water and to the quality of the water concerned.
5 The EU-15 refers to the Member States before the 2004 enlargement: Austria, Belgium, Denmark, Germany, France, Finland, Greece, Ireland, Italy, Luxemburg, Portugal, Spain, Sweden, The Netherlands, United Kingdom
6 EU-12 refers to Member States who acceded to the EU in 2004 and 2007 enlargements: Bulgaria, Czech Republic, Cyprus, Estonia, Hungary, Latvia, Lithuania, Malta, Poland, Slovakia, Slovenia, Romania
EN 4 EN
under the Water Information System for Europe (WISE)7. The questionnaire was sent to all 27 Member States in June 2007 in the context of Article 15 of the Directive as well as Article 10 of the EC Treaty to enable The Commission to establish an overview of implementation of the Directive across the EU. Member States were asked to provide data for the 2005 reference year (or 2006 if available) and replies received in the agreed format by 30 November 2008 were taken into account for this analysis.
Reporting under WISE is already applied to several areas of EU Water legislation, such as the Water Framework Directive, the Bathing Water Directives8, the Nitrates Directive9 and the Drinking Water Directive10. For the Urban Waste Water Treatment Directive, WISE has been applied only for data visualisation11 in the current exercise and will be fully applied for the next exercise.
7 Water Information System for Europe (WISE): http://www.water.europa.eu 8 Council Directive 76/160/EEC of 8 December 1975 concerning the quality of bathing water, OJ L31 of
5.2.1976 and Directive 2006/7 of the European Parliament and the Council of 15 February 2006 concerning the management of bathing water quality
9 Council Directive 91/676/EEC of 12 December 1991 concerning the protection of waters against pollution caused by nitrates from agricultural sources
10 Council Directive 98/83/EC of 3 November 1998 on the quality of water intended for human consumption 11 reported data can be visualised in WISE map viewer:
http://www.eea.europa.eu/themes/water/mapviewers/water-live-maps/urban-waste-water

EN 5 EN
2. OVERVIEW AT EU LEVEL
• Within the EU-27 there are more than 23000 agglomerations12 larger than 2000 p.e.
• These agglomerations produce a total waste water pollution load of about 600 million p.e.
• 68% of the EU-27 territory is considered as sensitive.
Only 18 of the 27 Member States provided a complete dataset by the 30 November 2008 cut-off date: Austria, Belgium, Germany, Denmark, Finland, France, Luxembourg, Netherlands, Portugal and Sweden from EU-15 and Cyprus, Estonia, Hungary, Lithuania, Latvia, Romania, Slovenia and Slovakia from EU-12. Consequently the subsequent analysis and conclusions only cover these 18 Member States13. A detailed technical assessment, which has formed the basis for this document, is available in http://ec.europa.eu/environment/water/index_en.htm.
Within these 18 Member States, 13734 agglomerations of more than 2000 p.e. were reported. These agglomerations produce a total waste water pollution load of more than 313 million p.e. They represent approximately 62% of the total number of agglomerations in the EU-27 and 53% of the total pollution load generated in the EU-27.
The overall conclusions on the implementation of the Directive in these 18 Member States are:
(1) Agglomerations and pollution load
• 2% of the agglomerations are > 150000 p.e. (big cities) - generating 40% of the pollution load.
• 66% of the agglomerations are between 2000 and 10000 p.e. – they generate 13% of the total pollution load.
(2) Infrastructure in place (Figure 1)
• Collecting systems are in place for 93% of the total pollution load.
• Secondary treatment is in place for 87% of the load.
• More stringent treatment is in place for 72% of the load.
• The secondary and more stringent treatment which is in place reached the required reduction levels for only approximately 90% of the load.
12 Best estimate as not all EU-27 MS reported 13 The following countries are hence not covered by the report: EU-15: Greece, Ireland, Italy, Spain & United
Kingdom; Eu-12: Bulgaria, Czech republic, Malta & Poland

EN 6 EN
Figure 1
9387
7872
65
0102030405060708090
100
% o
f the
tota
l gen
erat
ed lo
ad
(p.e
.)
Total generated load of agglomerations ≥ 2,000p.e. in EU18
Collecting system in place
Secondary treatment in place
Monitoring results comply with secondary treatment
More stringent treatment in place
Monitoring results comply with more stringent treatment
(3) "Big cities" (Figure 2)
• Around 300 big cities (i.e. agglomerations with more than 150,000 p.e.) were reported with a total generated load of 130 million p.e.
• More than 98% of this load was collected.
• 90% of the pollution load received secondary treatment or more, but at least 8% received less than secondary treatment (10 million p.e.).
• Ten big cities (5,2 million p.e.) did not have secondary treatment at all.
Figure 2
4% 4%
17%
73%
1% 1%
Type of treatment of big cities/ big dischargers in EU 18 (% of generated load)
Collected, but no treatment
Primary treatment
Secondary treatment
More stringent treatment
Adressed through IAS
Not collected at all
(4) Compliance with the requirements of the Directive
• By 31 December 2005, ten out of the 18 Member States (Austria, Belgium, Denmark, Finland, France, Germany, Luxembourg, Netherlands, Portugal and Sweden) were required to ensure waste water collection and treatment for all agglomerations within the scope of the Directive, and Slovakia was required to ensure waste water collection and treatment for a part of its agglomerations. Therefore, the compliance check in the document was carried out only for those 11 Member States.
EN 7 EN
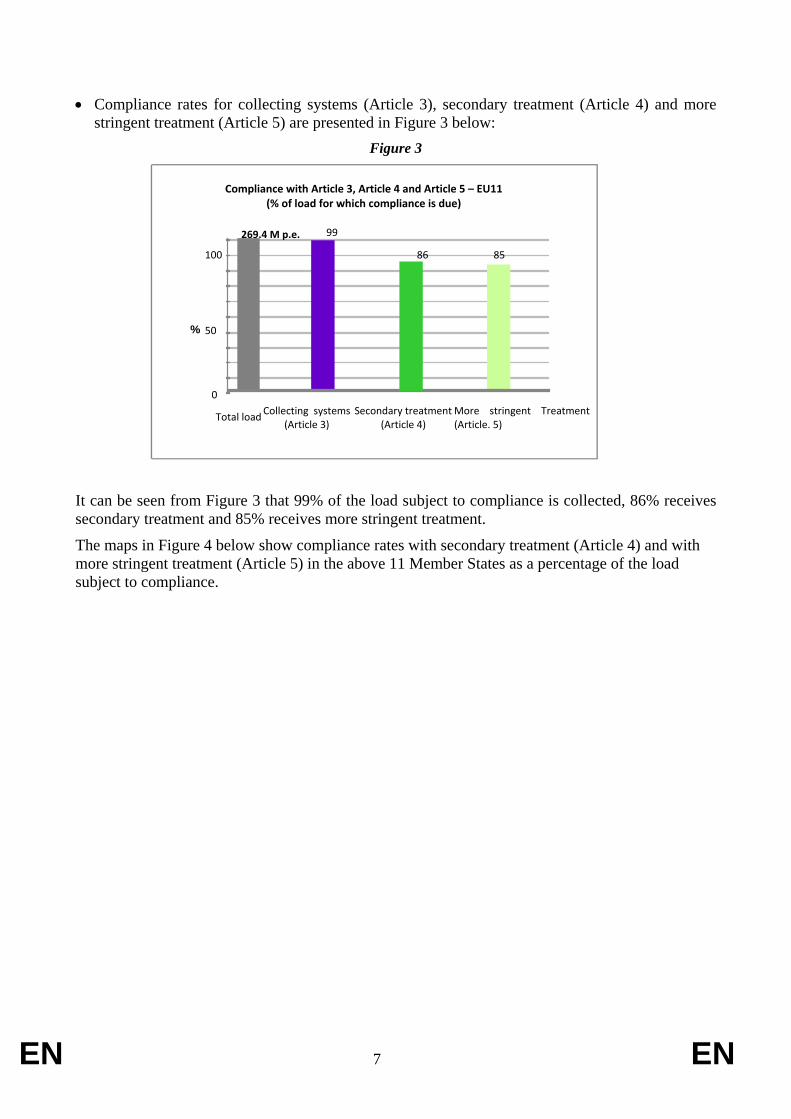
• Compliance rates for collecting systems (Article 3), secondary treatment (Article 4) and more stringent treatment (Article 5) are presented in Figure 3 below:
Figure 3
It can be seen from Figure 3 that 99% of the load subject to compliance is collected, 86% receives secondary treatment and 85% receives more stringent treatment.
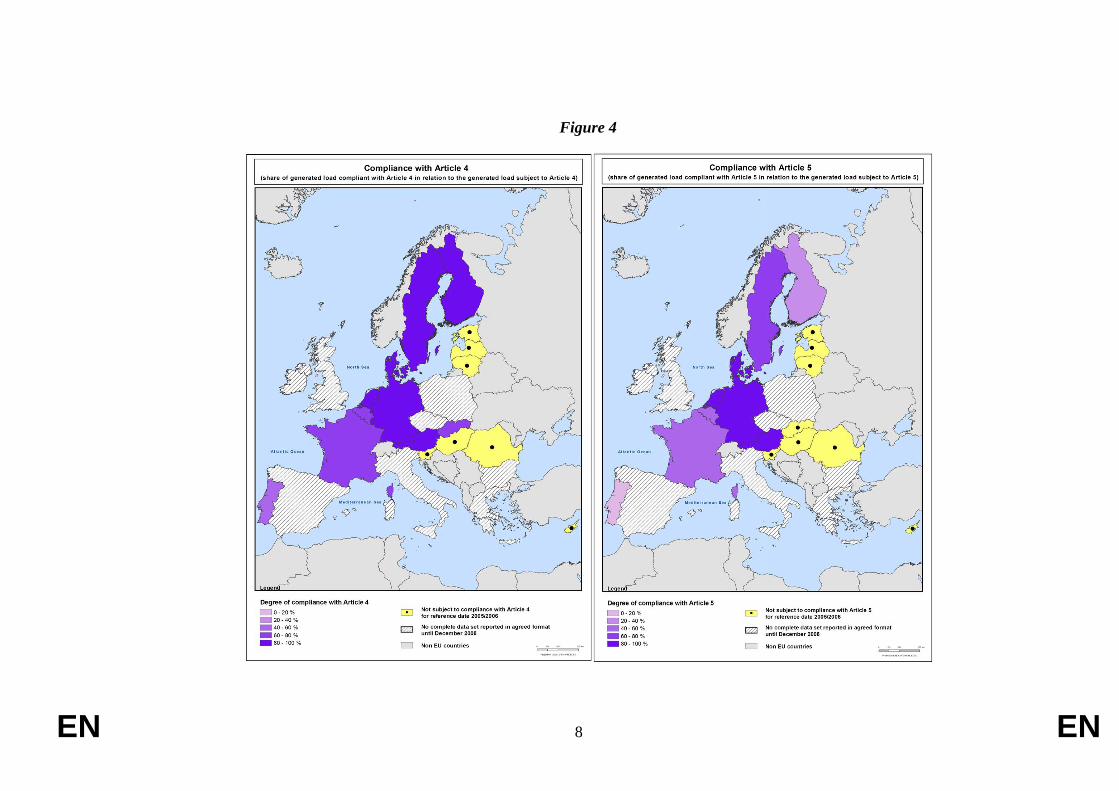
The maps in Figure 4 below show compliance rates with secondary treatment (Article 4) and with more stringent treatment (Article 5) in the above 11 Member States as a percentage of the load subject to compliance.
85
99 86
0
50
100
Total load Collecting systems (Article 3)
Secondary treatment (Article 4)
More stringent Treatment (Article. 5)
%
Compliance with Article 3, Article 4 and Article 5 – EU11 (% of load for which compliance is due)
269.4 M p.e.
EN 8 EN
Figure 4
EN 9 EN
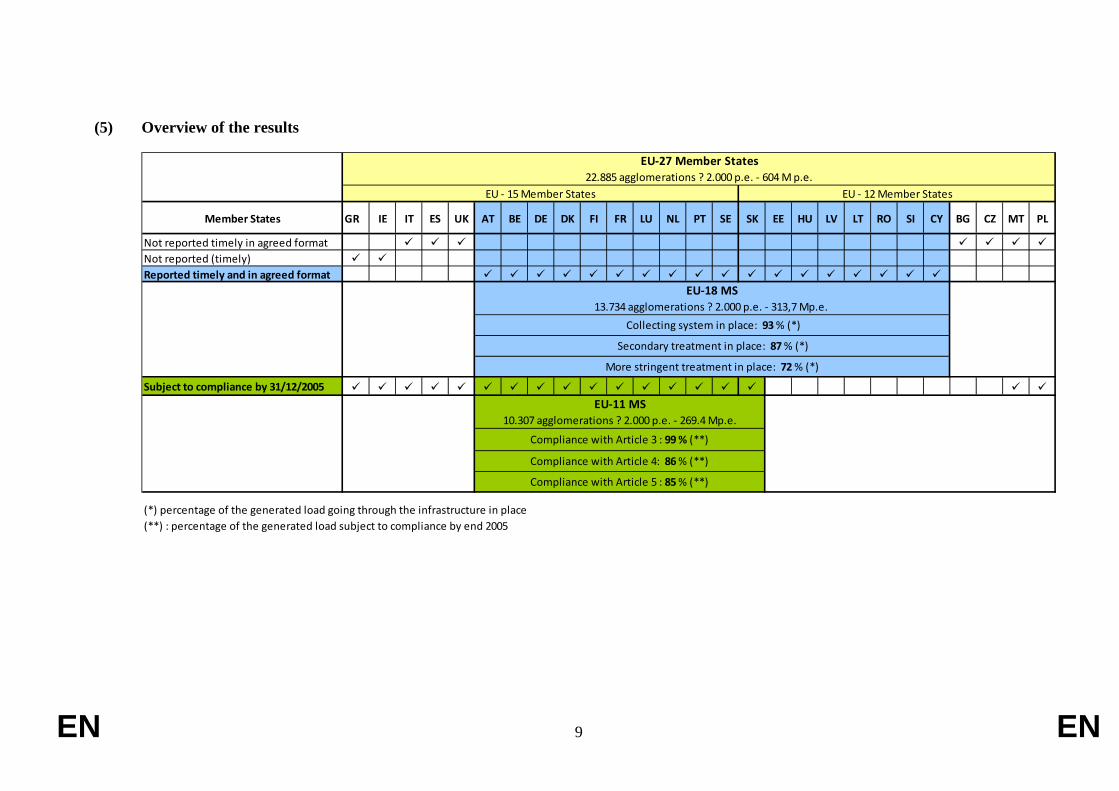
(5) Overview of the results
Member States GR IE IT ES UK AT BE DE DK FI FR LU NL PT SE SK EE HU LV LT RO SI CY BG CZ MT PL
Not reported timely in agreed formatNot reported (timely)Reported timely and in agreed format
Subject to compliance by 31/12/2005
(*) percentage of the generated load going through the infrastructure in place(**) : percentage of the generated load subject to compliance by end 2005
Compliance with Article 4: 86 % (**)
Compliance with Article 5 : 85 % (**)
Collecting system in place: 93 % (*)
Secondary treatment in place: 87 % (*)
More stringent treatment in place: 72 % (*)
EU-11 MS10.307 agglomerations ? 2.000 p.e. - 269.4 Mp.e.
Compliance with Article 3 : 99 % (**)
EU-27 Member States22.885 agglomerations ? 2.000 p.e. - 604 M p.e.
EU - 15 Member States EU - 12 Member States
EU-18 MS13.734 agglomerations ? 2.000 p.e. - 313,7 Mp.e.
EN 10 EN
3. DETAILED ANALYSIS
3.1. Requirements of the Directive
The main requirements of the Directive are:
• waste water collection (Article 3)
• secondary treatment (removal of organic pollution) (Article 4)
• more stringent requirements than secondary treatment for discharges into sensitive areas (Article 514). The more stringent treatment requirements cover nutrient removal (nitrogen and phosphorus) and such processes as disinfection in areas where extraction for drinking water, bathing, and shellfish production is carried out.
For nutrient removal, Member States can apply more stringent treatment in all individual agglomerations of more than 10,000 p.e. (Article 5(2,3)) or achieve a global nutrient removal rate of over 75% for all waste water treatment plants in the area (Article 5(4)).
For EU-15 all deadlines in the Directive expired in 2005 and thus apply fully:
• The 1998 deadline covers agglomerations >10000 p.e. discharging into sensitive areas.
• The 2000 deadline covers agglomerations >15,000 p.e. discharging into normal areas.
• The 2005 deadline covers remaining agglomerations > 2000 p.e..
For the EU-12, deadlines for waste water collection and treatment are set out in the Accession Treaties, and transitional periods and different interim and final deadlines apply15. Except for smaller agglomerations in Romania16, full compliance must be achieved by 2015. Some of the transitional periods for Malta, Poland, and Slovakia expired on 31 December 2005. These related to 25%, 67%, and 83% of the respective total load.
3.2. Designation of sensitive areas
Designation of sensitive areas is a crucial and initial task in implementing the Directive, as the nature of the water body decides the treatment requirements and the deadlines. The 27 Member States have designated their sensitive areas as follows:
14 Member States can either identify sensitive areas (Article 5(1) or apply the provisions of Article 5 (2, 3, 4)
over all their territory (Article 5(8)) 15 For more information please refer to http://ec.europa.eu/environment/water/water-urbanwaste/index_en.html 16 The deadline for implementing the obligations under the Directive for small agglomerations in Romania is 31
December 2018

EN 11 EN
Figure 5 Sensitive areas17 – 14 Member States consider their entire
territory as sensitive area18: Austria, Belgium, Czech Republic, Denmark, Estonia, Finland, Latvia, Lithuania, Luxembourg, Netherlands, Poland, Romania, Slovakia and Sweden.
– 13 Member States have identified certain water bodies in their territory as sensitive areas: Bulgaria, Cyprus, France, Germany, Greece, Hungary, Ireland, Italy, Malta, Portugal, Slovenia, Spain and the United Kingdom.
The total area in the EU which is considered as sensitive is increasing. This is due to the accession of 12 new Member States in the catchment of the Baltic Sea, the Black Sea and the Northern Adriatic, where there are a number of water bodies sensitive to eutrophication, and also to revised designations in the EU-15, particularly in France and Spain.
Within the 18 Member States covered by the assessment, some 80% of agglomerations, representing 81% of the pollution load,
discharge into sensitive areas.
3.3. Waste water infrastructure
The following figures show the infrastructure in place as reported by Member States. They do not reflect actual compliance with requirements of the Directive (some areas are equipped with more stringent treatment not specifically required and vice versa). The assessment of compliance with the Directive is presented in Chapter 3.4.
Figures 6, 7 and 8 show infrastructure in place according to receiving areas.
17 Situation at 31/12/2005 or 31/12/2006 as reported by the Member States. For Czech Republic, Greece and
Ireland no information was reported in the context of this reporting exercise and consequently these countries are left white in the map, however their situation was assessed from previous reporting for Greece and Ireland and from Implementation programme for Czech Republic
18 Either under Article 5(1) or Article 5(8)
EN 12 EN
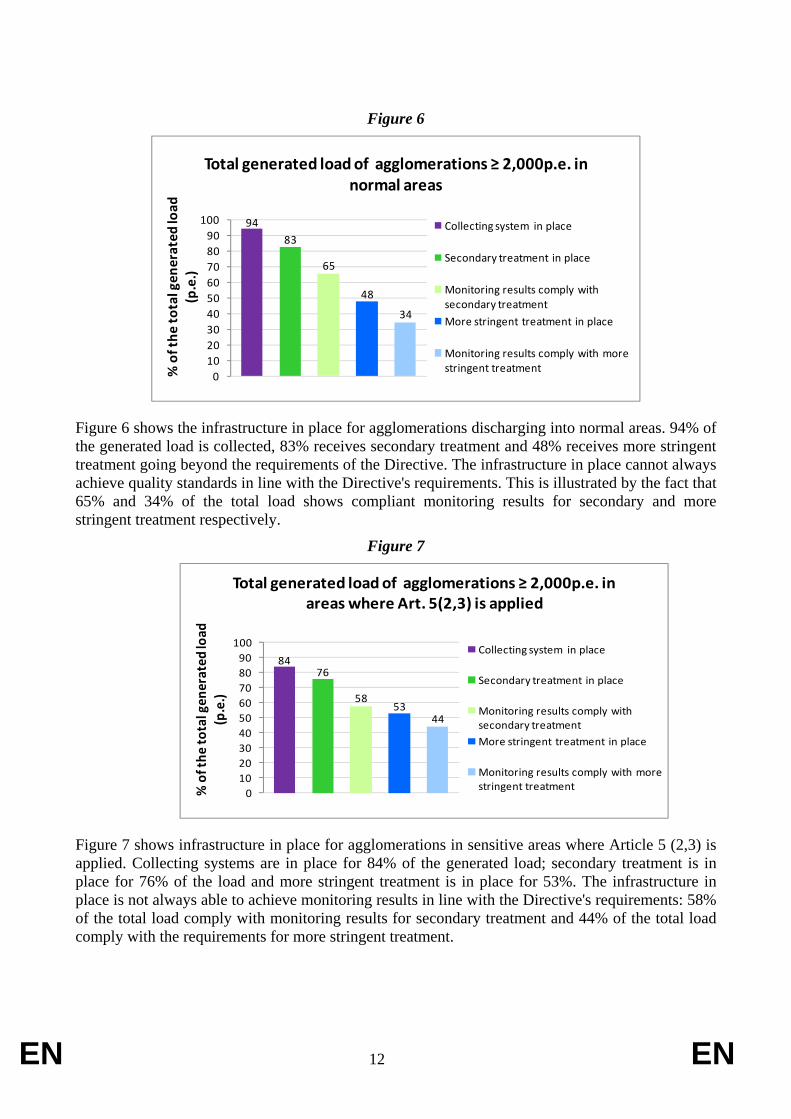
Figure 6
9483
65
48
34
0102030405060708090
100
% o
f the
tota
l gen
erat
ed lo
ad
(p.e
.)
Total generated load of agglomerations ≥ 2,000p.e. in normal areas
Collecting system in place
Secondary treatment in place
Monitoring results comply with secondary treatment
More stringent treatment in place
Monitoring results comply with more stringent treatment
Figure 6 shows the infrastructure in place for agglomerations discharging into normal areas. 94% of the generated load is collected, 83% receives secondary treatment and 48% receives more stringent treatment going beyond the requirements of the Directive. The infrastructure in place cannot always achieve quality standards in line with the Directive's requirements. This is illustrated by the fact that 65% and 34% of the total load shows compliant monitoring results for secondary and more stringent treatment respectively.
Figure 7
8476
5853
44
0102030405060708090
100
% o
f the
tota
l gen
erat
ed lo
ad
(p.e
.)
Total generated load of agglomerations ≥ 2,000p.e. in areas where Art. 5(2,3) is applied
Collecting system in place
Secondary treatment in place
Monitoring results comply with secondary treatmentMore stringent treatment in place
Monitoring results comply with more stringent treatment
Figure 7 shows infrastructure in place for agglomerations in sensitive areas where Article 5 (2,3) is applied. Collecting systems are in place for 84% of the generated load; secondary treatment is in place for 76% of the load and more stringent treatment is in place for 53%. The infrastructure in place is not always able to achieve monitoring results in line with the Directive's requirements: 58% of the total load comply with monitoring results for secondary treatment and 44% of the total load comply with the requirements for more stringent treatment.
EN 13 EN
Figure 8
99 99 98 97 92
0102030405060708090
100
% o
f the
tota
l gen
erat
ed lo
ad
(p.e
.)
Total generated load of agglomerations ≥ 2,000p.e. in areas where Art. 5(4) is applied
Collecting system in place
Secondary treatment in place
Monitoring results comply with secondary treatmentMore stringent treatment in place
Monitoring results comply with more stringent treatment
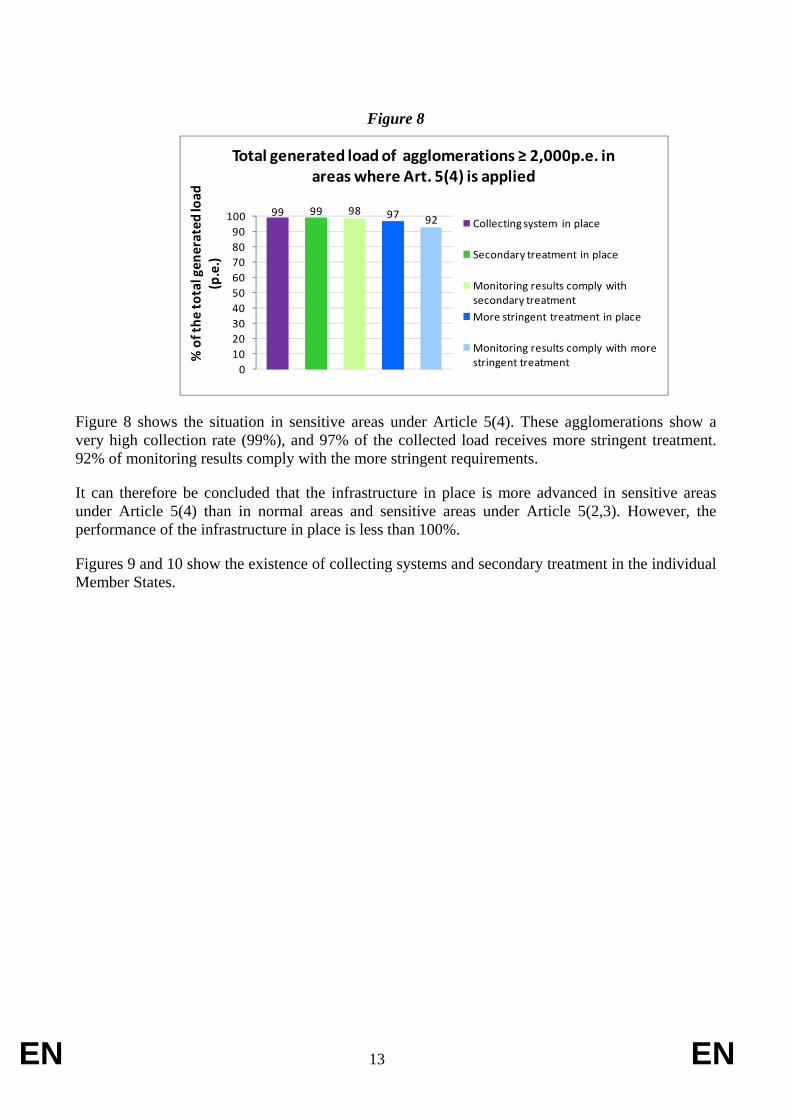
Figure 8 shows the situation in sensitive areas under Article 5(4). These agglomerations show a very high collection rate (99%), and 97% of the collected load receives more stringent treatment. 92% of monitoring results comply with the more stringent requirements.
It can therefore be concluded that the infrastructure in place is more advanced in sensitive areas under Article 5(4) than in normal areas and sensitive areas under Article 5(2,3). However, the performance of the infrastructure in place is less than 100%.
Figures 9 and 10 show the existence of collecting systems and secondary treatment in the individual Member States.

EN 14 EN
Figure 9
99 97
49
100
89
99 100 99
80
9398 100
95
47
76 73
100 9993
0.0
10.0
20.0
30.0
40.0
50.0
60.0
70.0
80.0
90.0
100.0
Shar
e of
gen
erat
ed lo
ad c
olle
cted
in c
olle
ctin
g sy
stem
(% o
f the
era
ted
load
)Share of generated load (p.e.) collected in collecting system
Dat
aon
col
lect
ion
in co
llect
ing
syst
em n
ot r
epor
ted
Figure 9 shows that all EU-15 Member States have collecting systems in place for more than 95% of the generated load. Within EU-12, Estonia, Hungary and Lithuania already report collecting systems in place for 80-90% of their pollution load.
Figure 10
99
66
49
100
89
99
93
99
8082
93
100
71
28
65
51
100
94
87
99
65
0
100
70
87
65
98
63
93 93
100
39
12
42 41
98
85
78
0.0
10.0
20.0
30.0
40.0
50.0
60.0
70.0
80.0
90.0
100.0
Shar
e of
gen
erat
ed lo
ad tr
eate
d by
sec
onda
ry tr
eatm
ent
(% o
f gen
erat
ed lo
ad)
Share of generated load (p.e.) treated by secondary treatment
Dat
aon
con
nect
ion
to s
econ
dary
trea
tmen
t not
repo
rted
Mon
itor
ing
resu
lts n
ot re
port
ed
Installation for secondary treatment in place Monitoring results comply with secondary treatment
SI: o
nly
prel
imin
ary
asse
ssm
ent
Figure 10 shows that secondary treatment is in place for more than 98% of the pollution load in Austria, Denmark, Finland, Germany, Netherlands and Sweden. Implementation of secondary treatment is still lower in Belgium, France and Portugal. In the EU-12, Estonia, Hungary and Lithuania already have secondary treatment in place for more than 80% of the pollution load. In
EN 15 EN
Romania, Cyprus and Slovenia secondary treatment is in place for only 28%, 49% and 51% of the pollution load respectively.
More stringent treatment is in place for 72% of the generated load in the 18 Member States, but is not 100% compliant. In the EU-15 the implementation level is below average for Belgium and Portugal. In the EU-12, Estonia, Hungary and Lithuania are the more advanced countries.
"Big cities" - agglomerations greater than 150,000 p.e.
In normal areas, 84% of the load receives secondary treatment and out of these some 46% receives more stringent treatment, even if not required by the Directive.
In sensitive areas, the most satisfactory situation is reflected in those under Article 5(4), where 98% of the pollution load receives more stringent treatment. In the areas under Article 5(2,3) only 50% of the load receives more stringent treatment, and 19% of the load does not even receive secondary treatment.
As at 2005, six big cities in Portugal and Romania with a combined total load of 4,2 million p.e. had no waste water treatment at all: Barreiro/Moita and Costa do Estoril (PT), Bucharest, Braila, Craiova and Galati (RO).
Another four big cities, with a total load of 1 million p.e., were reported as having only primary treatment: Fréjus (FR), Kaunas (LT), Matosinhos (PT) and Ploiesti (RO).
3.4. Compliance of waste water infrastructure
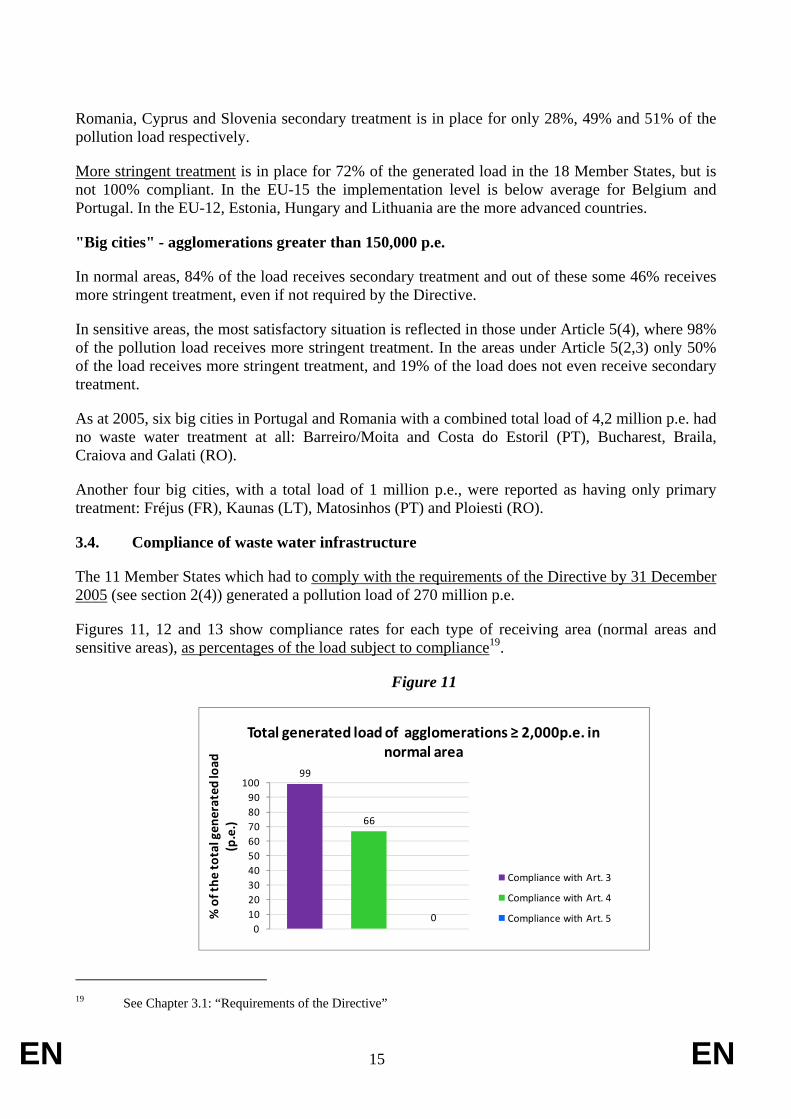
The 11 Member States which had to comply with the requirements of the Directive by 31 December 2005 (see section 2(4)) generated a pollution load of 270 million p.e.
Figures 11, 12 and 13 show compliance rates for each type of receiving area (normal areas and sensitive areas), as percentages of the load subject to compliance19.
Figure 11
99
66
00
102030405060708090
100
% o
f the
tota
l gen
erat
ed lo
ad
(p.e
.)
Total generated load of agglomerations ≥ 2,000p.e. in normal area
Compliance with Art. 3
Compliance with Art. 4
Compliance with Art. 5
19 See Chapter 3.1: “Requirements of the Directive”
EN 16 EN
Figure 12
99
74
54
0102030405060708090
100%
of t
he to
tal g
ener
ated
load
(p
.e.)
Total generated load of agglomerations ≥ 2,000p.e. in areas where Art. 5(2,3) is applied
Compliance with Art. 3
Compliance with Art. 4
Compliance with Art. 5(2,3)
Figure 13
100 99 99
0102030405060708090
100
% o
f the
tota
l gen
erat
ed lo
ad
(p.e
.)
Total generated load of agglomerations ≥ 2,000p.e. in areas where Art. 5(4) is applied
Compliance with Art. 3
Compliance with Art. 4
Compliance with Art. 5(4)
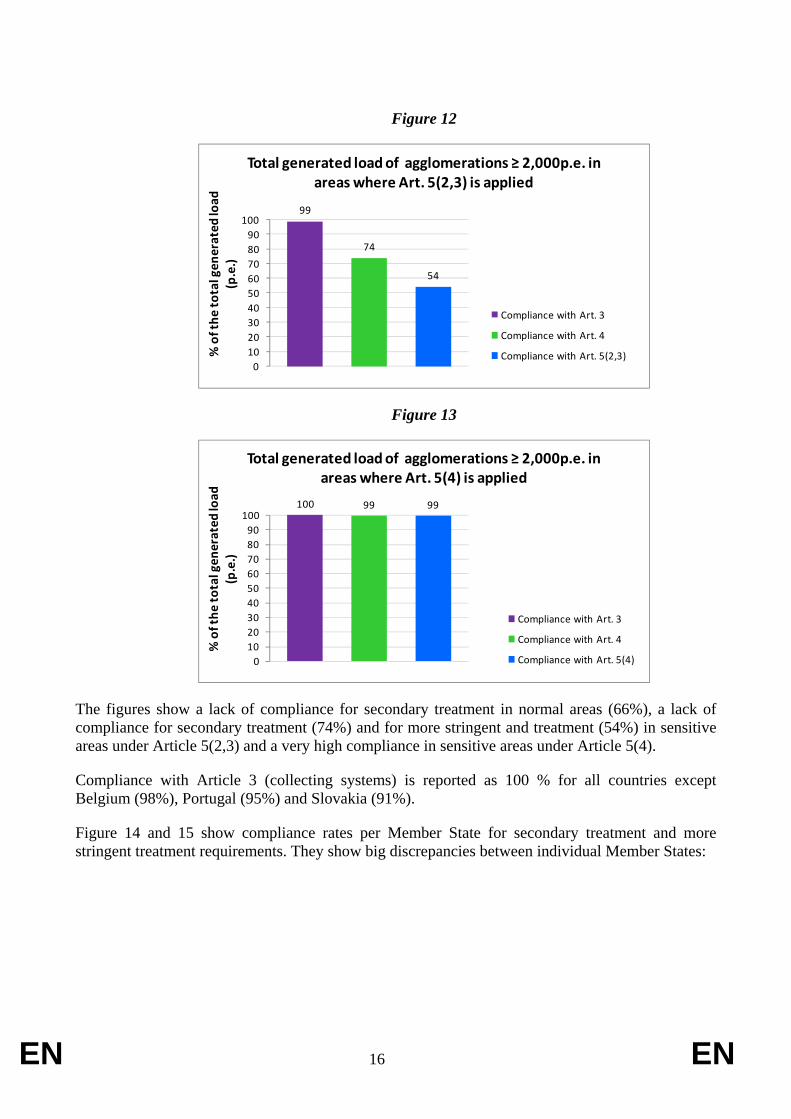
The figures show a lack of compliance for secondary treatment in normal areas (66%), a lack of compliance for secondary treatment (74%) and for more stringent and treatment (54%) in sensitive areas under Article 5(2,3) and a very high compliance in sensitive areas under Article 5(4).
Compliance with Article 3 (collecting systems) is reported as 100 % for all countries except Belgium (98%), Portugal (95%) and Slovakia (91%).
Figure 14 and 15 show compliance rates per Member State for secondary treatment and more stringent treatment requirements. They show big discrepancies between individual Member States:

EN 17 EN
Figure 14
100
67
100
88
64
10095
100
41
62
98
86 86
0.0
10.0
20.0
30.0
40.0
50.0
60.0
70.0
80.0
90.0
100.0D
egre
e of
com
plia
nce
with
Arti
cle
4(%
of t
he g
ener
ated
load
)
Degree of compliance with Article 4in relation to the load subject to compliance with Article 4
Enti
rege
nera
ted
load
not
sub
ject
to A
rt. 4
, as
tran
siti
onal
pe
riod
has
not
yet e
xpir
ed
Enti
rege
nera
ted
load
not
sub
ject
to A
rt. 4
, as
tran
siti
onal
pe
riod
has
not
yet e
xpir
ed
Enti
rege
nera
ted
load
not
sub
ject
to A
rt. 4
, as
tran
siti
onal
pe
riod
has
not
yet e
xpir
ed
Enti
rege
nera
ted
load
not
sub
ject
to A
rt. 4
, as
tran
siti
onal
pe
riod
has
not
yet e
xpir
ed
Enti
rege
nera
ted
load
not
sub
ject
to A
rt. 4
, as
tran
siti
onal
pe
riod
has
not
yet e
xpir
ed
Enti
rege
nera
ted
load
not
sub
ject
to A
rt. 4
, as
tran
siti
onal
pe
riod
has
not
yet e
xpir
ed
Enti
rege
nera
ted
load
not
sub
ject
to A
rt. 4
, as
tran
siti
onal
pe
riod
has
not
yet e
xpir
ed
Compliance with Article 4 (secondary treatment requirements) in Austria, Denmark, Germany and Netherlands is 100%, while Belgium, France and Portugal have significantly lower compliance rates. Slovakia has a compliance rate of 62%.
Figure 15
100
49
0
88
34
50
10095
100
13
67
85 85
0.0
10.0
20.0
30.0
40.0
50.0
60.0
70.0
80.0
90.0
100.0
Deg
ree
of c
ompl
ianc
e w
ith A
rticl
e 5
(% o
f the
gen
erat
ed lo
ad)
Degree of compliance with Article 5in relation to the load subject to compliance with Article 5
Enti
rege
nera
ted
load
not
sub
ject
to A
rt. 5
, as
tran
siti
onal
pe
riod
has
not
yet e
xpir
ed
Enti
rege
nera
ted
load
not
sub
ject
to A
rt. 5
, as
tran
siti
onal
pe
riod
has
not
yet e
xpir
ed
Enti
rege
nera
ted
load
not
sub
ject
to A
rt. 5
, as
tran
siti
onal
pe
riod
has
not
yet e
xpir
ed
Enti
rege
nera
ted
load
not
sub
ject
to A
rt. 5
, as
tran
siti
onal
pe
riod
has
not
yet e
xpir
ed
Enti
rege
nera
ted
load
not
sub
ject
to A
rt. 5
, as
tran
siti
onal
pe
riod
has
not
yet e
xpir
ed
Enti
rege
nera
ted
load
not
sub
ject
to A
rt. 5
, as
tran
siti
onal
pe
riod
has
not
yet e
xpir
ed
Enti
rege
nera
ted
load
not
sub
ject
to A
rt. 5
, as
tran
siti
onal
pe
riod
has
not
yet e
xpir
ed
Enti
rege
nera
ted
load
not
sub
ject
to A
rt. 5
, as
tran
siti
onal
pe
riod
has
not
yet e
xpir
ed
Compliance with Article 5 (more stringent treatment) in Austria, Germany and the Netherlands is 100%, while compliance is lower in Belgium, Denmark, Finland, France, Portugal and Sweden20.
20 When conflicting opinion occurs between the Member State and the European Commission regarding the
extension of the Sensitive Area and/or its catchment and the required level of treatment, this report follows the European Commission's opinion

EN 18 EN
4. OVERALL ASSESSMENT
Overall figures show considerable progress in the implementation of the Directive, but also an important number of shortcomings:
Very high degree of inadequate or no reporting
Only 18 Member States out of 27 reported on time and in the agreed format for this reporting exercise. Consequently the current report covers only 53% of the EU-27 pollution load.
Whereas previous reporting exercise (4th Implementation Report) targeted 1998 and 2000 deadlines for all EU Member States at the time (EU-15), the current exercise targeted all deadlines throughout the EU-27.
It is therefore impossible to make a direct comparison between the two exercises and to make clear assessments whether and to what extent implementation has improved throughout the EU.
Within the 18 reporting Member States, ten of the EU-15 Member States and Slovakia were subject to compliance by the end of 2005. Italy, Spain, Ireland, United Kingdom, Greece, Malta and Poland were also subject to compliance but did not report on time and/or in the agreed format. Therefore, the compliance rates calculated in this report do not necessarily give a comprehensive picture of EU-27 compliance by end 2005.
Establishment of collecting systems is progressing well
All EU-15 Member States had collecting systems in place for almost the entire pollution load (more than 95%).
The analysis shows that good progress has been made on establishing collecting systems in the EU-12 with collection rates between 70% and 100% except for Romania (47%) and Cyprus (49%).
Good overall level of secondary treatment, but big variations
Secondary treatment was in place for 87 % of the pollution load, with a compliance rate of 86%.
Austria, Denmark, Germany and the Netherlands had compliance rates of 100%, while Belgium, France and Portugal had significantly lower rates. Slovakia has a compliance rate of 62%.
Some EU-12 Member States were advancing well towards full implementation of secondary treatment requirements (Estonia, Hungary and Latvia), while others were still at an early stage (Cyprus, Romania, Slovakia and Slovenia). Greater efforts are needed in this respect.
Varied implementation picture as regards more stringent treatment
More stringent treatment is in place for 72% of the pollution load with a compliance rate of 85%.
Compliance rates vary between 13% in Portugal and 100% in Austria, Germany and the Netherlands.

EN 19 EN
Normal areas and sensitive areas under Article 5(2) have less infrastructure in place than sensitive areas under Article 5(4)
Sensitive areas under Article 5(4) were best equipped with treatment facilities. Normal areas and sensitive areas under Article 5(2) suffered from a lack of secondary treatment facilities. For normal areas secondary treatment was in place for 83% of the load, with a compliance rate of 66%. For sensitive areas under Article 5(2) secondary treatment was in place for 76% of the load, with a compliance rate of 74%.
On the other hand, 48% of the load discharged into normal areas received more stringent treatment, going beyond the requirement of the Directive.
Waste water treatment of big cities/big dischargers is at a very high level
More than 98% of the pollution load generated by the 300 big cities was collected and more than 90% received secondary treatment.
However 50% of the load from big cities in sensitive areas does not receive more stringent treatment and 10 million p.e. is still not treated adequately. In the EU-15 Member States covered by the report, four big cities are still lacking the required level of treatment for their entire load.
Ongoing integration of UWWTD reporting into WISE
This 5threporting exercise represents the first step in integrating the Urban Waste Water Treatment Directive reporting into WISE, together with other water-related reporting (Water Framework Directive and Bathing Water Directive).
Extensive work has gone into developing databases and data information flows to streamline this integration. The exercise is now complete for almost all Member States and this work will be beneficial to the next reporting exercise, which will provide a comprehensive picture of implementation in the EU.
The Commission is furthermore working on involving candidate countries and potential candidates into WISE with a view to facilitating implementation of the Directive at an early stage.

EN 20 EN
5. CONCLUSION
Considerable progress has been achieved in implementing the Directive. Progress in addressing waste water related challenges has ensured notable improvements in water quality and has drastically improved the quality of EU beaches in line with the quality standards of the EU Bathing Water Directives.
However, key challenges remain to align waste water treatment in the entire EU with the provisions of the Directive and the ‘good status’ environmental objective under the Water Framework Directive:
(1) Secondary treatment needs to be improved in some EU-15 Member States. While some EU-12 Member States are progressing well towards full implementation, others are still at an early stage of implementation and greater efforts are needed.
(2) Compliance rates for more stringent treatment are very low in some EU-15 countries and, overall greater efforts in implementation are needed. This is especially true for sensitive areas under Article 5 (2,3).
(3) While implementation in big cities is generally high, greater efforts are needed to ensure implementation of the Directive, especially in the six big cities which had no waste water treatment at all, and the four big cities which had only primary treatment in place by 2005.

EN 21 EN
EN 22 EN
Commission of the European Communities 5th Commission Summary on the Implementation of the Urban Waste Water Treatment Directive Commission Staff Working Document SEC(209)1114final of 3.8.2009 Contact address: European Commission, Directorate General Environment, B-1049 Brussels; Email: [email protected] This document is available as PDF file at http://ec.europa.eu/environment/water/water-urbanwaste/implementation/implementationreports_en.htm Cover photo: Waste water treatment plant Emschermündung (Germany); published with kind permission of Emschergenosssenschaft Essen


