September 30 - October 2, 2009 Buffalo, New York SPONSORED BY THE CONSORTIUM FOR STUDENT RETENTION DATA EXCHANGE AT THE UNIVERSITY OF OKLAHOMA LIGHTING THE WAY TO HIGHER LEVELS OF STUDENT SUCCESS THE PROCEEDINGS OF THE 5TH ANNUAL N ATIONAL S YMPOSIUM ON S TUDENT R ETENTION
Transcript
September 30 - October 2, 2009Buffalo, New York
sponsored by the Consortium for student retention data exChange at the university of oklahoma
Lighting the Way to higher LeveLs of student success
The papers and presentations contained in this publication were approved for presentation at the 5th Annual National Symposium on Student Retention in Buffalo, New York. This symposium is just one of the strategic initiatives undertaken by the Consortium for Student Retention Data Exchange (CSRDE) at the University of Oklahoma. The CSRDE, composed of approximately 650 colleges and universities is dedicated to sharing data, knowledge, and innovation that helps advance the retention and success of college students.
The National Symposium on Student Retention was developed in response to the needs
of administrators and practitioners from our member institutions for current, evidence based research on student retention and success. Recognizing that the field of student retention is maturing and has more to offer than anecdotal information, all proposals and papers submitted to this symposium went through a peer review process. The quality of the presentations is why the symposium is growing exponentially and gaining national recognition.
This growth would not happen without the contributions of the conference authors and
presenters. Student retention issues cannot be addressed within a vacuum and their contributions have helped to broaden horizons and perspectives. As you read through the proceedings, you will find examples of best practices and programs which may serve as interesting models for your institution. You will also find research related to retention theory, data resources, and retention efforts with special populations, as well as articles that look beyond first year retention. This symposium provides a forum to recognize the work of researchers in the field and make their work available to practitioners in a collegial, interactive environment.
It is our hope that this publication assists you in your efforts to improve student retention
and success at your institution. All the Best! Rosemary Hayes, Ph.D., Editor Executive Director, CSRDE
Copyright Notice
Copyright 2009 The University of Oklahoma
The Center for Institutional Data Exchange and Analysis
Terms and Conditions of Use By virtue of its creation and compilation, this publication, The Proceedings of the 5th Annual National Symposium on Student Retention and the conference CD, are the property of the University of Oklahoma and the Center for Institutional Data Exchange and Analysis, sponsors of the CSRDE National Symposium on Student Retention and, as such, are subject to certain rights, protections, and Copyright restrictions. By accepting this publication and CD the recipient accepts and agrees to the following terms and conditions: 1. The Proceedings of the 5th Annual National Symposium on Student Retention and this CD are
subject to the Copyright restrictions as defined by law, The University of Oklahoma and the Center for Institutional Data Exchange and Analysis (C-IDEA). C-IDEA provides and maintains the Consortium for Student Retention Data Exchange (CSRDE).
2. The Proceedings of the 5th Annual National Symposium on Student Retention and this CD may not
be redistributed or reproduced, in any format, including but not limited to print, electronic or web, in whole or in part, without the express written permission of the Center for Institutional Data Exchange and Analysis. Such requested permission should be submitted in writing to:
Center for Institutional Data Exchange and Analysis The University of Oklahoma 1700 Asp Avenue Norman, OK 73072 [email protected]
3. Authors whose papers are contained in this compilation retain the rights to reprint, modify, and republish their own works.
Suggested bibliographic reference format: For the proceedings as a whole: Hayes, R. (Ed.). (2009). Proceedings of the 5th National Symposium on Student Retention, 2009, Buffalo. Norman, OK: The University of Oklahoma. For an article within the proceedings: Author of Article, (2009). Title of article. In R. Hayes (Ed.), Proceedings of the 5th National Symposium on Student Retention, 2009, Buffalo. (pp. x-y). Norman, OK: The University of Oklahoma.
TABLE OF CONTENTS Keynote Address (Speaker Bios Only)................................................................................... 1 Randy Swing, Association for Institutional Research Nevin Brown, Achieve Carl Dalstrom, USA Funds Papers Thursday, October 1, 2009 A Holistic Approach to Students at Risk: The SOAR Program at Cazenovia College .............. 4
Elisabeth Burick, Cazenovia College Idonas Hughes, Cazenovia College Jesse Lott, Cazenovia College Timothy McLaughlin, Cazenovia College Tiffany Varlaro, Cazenovia College
Conquering the Great Divide--Student Success Is Student Retention...................................... 14 Harriett McQueen, Austin Peay State University Patty Mulkeen, Austin Peay State University Sherryl Byrd, Austin Peay State University
Face to Face Student Orientations: Their Impact on Online Student Retention and Success .......................................................... 25
Darrylinn Todd, Center for Distance Learning, Kennedy King College Selom Assignon, Center for Distance Learning, Kennedy King College
How Well Do Remediated Students at 4-Year Institutions Fare in Terms of Persistence to Degree? .................................................................................. 35
Philip Garcia, California State University
Methods of Inquiry: Using Critical Thinking to Retain Students............................................. 43 Kelly Ahuna, University at Buffalo Christine Gray Tinnesz, University at Buffalo Carol VanZile Tamsen, University at Buffalo
Year 1 at Anna Maria College: The Successful Implementation of a New Retention Plan at a Small Liberal Arts College ............................................................... 50
Andrew Klein, Anna Maria College
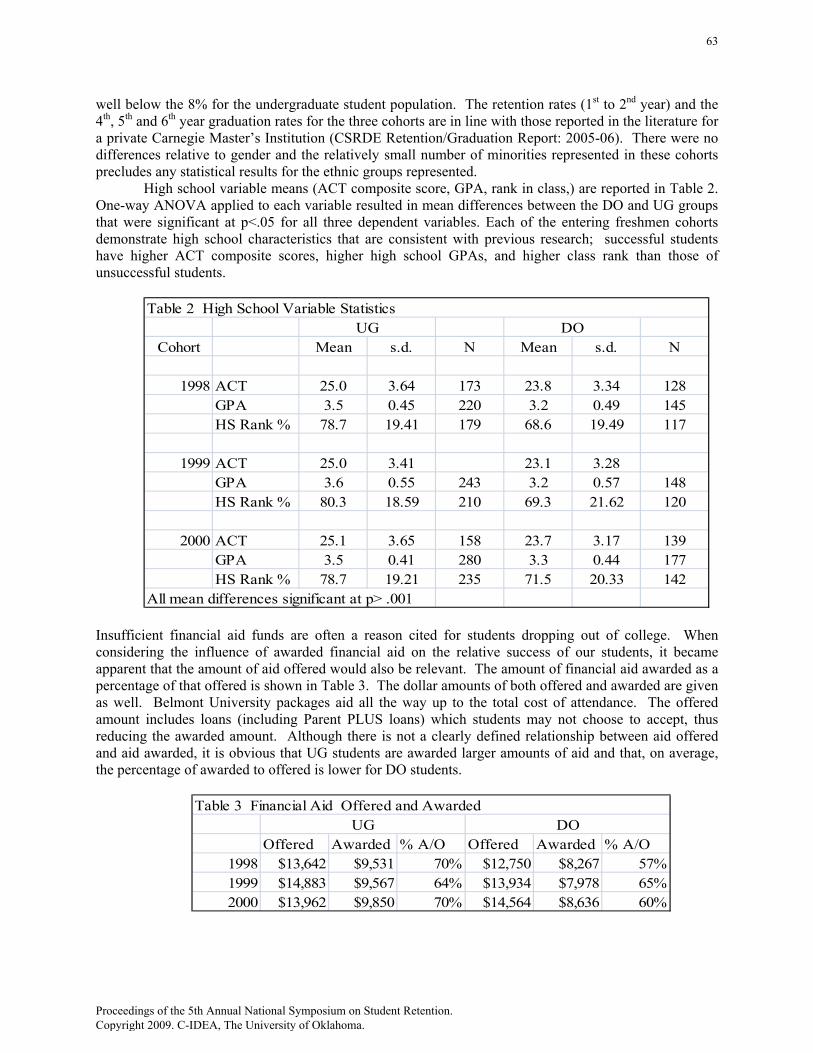
Entering Freshmen to Graduating Seniors: Partnering CIRP Entering Freshmen Surveys, Graduating Senior Surveys, and Instituional Data.................................... 60
Roy Ikenberry, Belmont University
Thursday, October 1, 2009 (continued)
FYI as a Diagnostic of Student Academic Performance .......................................................... 71 Joseph Montgomery, Columbia Basin College Ty Jones, Columbia Basin College Madeline Jeffs, Columbia Basin College Jason Schlegel, Columbia Basin College
Identifying ‘Hard-to-Reach’ Students and Strategies for Intervening Before It Is Too Late................................................................ 78
Elizabeth Herr, Noel-Levitz/ForecastPlus Beth Richter, Noel-Levitz
Predictive Modeling Tutorial: Logistic Regression.................................................................. 96 Kyle Hawkins, Carroll University
Structural Reorganization, Curricular Reform & Collaborative Programs: Strategies to Improve Retention of First-Year Students......................................................... 107
Ralph J. Rascati, Kennesaw State University
Utility of CART™: Classification and Regression Trees for Improving College and University Graduation Rates ............................................................ 117
Gerard LaVarnway, Norwich University Cathy Frey, Norwich University
If at First You Don't Succeed, Try Community College: An Analysis of Community College Transfers Who Applied as First Time Freshmen ......... 127
Jaclyn Cameron, DePaul University
Justifying Investments in Retention Efforts Based Upon their Return on Investment........... 135 Charles Perkins, Point Park University Anne Skleder, Chatham University
Developing and Implementing an Early Alert System........................................................... 143 Dale Tampke, University of North Texas
Improving Student Persistence and Success: A Data-Driven Outreach Approach ................ 152 Monica Michalski, St. Francis College Steven Catalano, St. Francis College
Thursday, October 1, 2009 (continued) It Takes a University: Designing and Implementing a System of Academic Probation and Intervention in Support of Student Success and Retention.............................................. 165
Cynthia Demetriou, University of North Carolina at Chapel Hill Alice Dawson, University of North Carolina at Chapel Hill Amy Schmitz-Sciborski, University of North Carolina at Chapel Hill
Retention of Developmental Students and the Complicated Desire for "Caring Teachers"... 178 Kathrynn Di Tommaso, Bronx Community College, CUNY
The Sophomore Experience: Identifying Factors Related to Second-Year Attrition ............. 190 Cathy Coghlan, Texas Christian University Jessica Fowler, Texas Christian University Matthew Messel, Texas Christian University
Undergraduate and Graduate Retention - Two Concepts, One Outcome............................... 202
Cathy Alexander, California Lutheran University Maria Kohnke, California Lutheran University Angela Naginey, California Lutheran University
Tutorial Part 1: Multiple Indicators for Monitoring Undergraduate Transfers Through to the Baccalaureate: Community College Topics................................................... 211
Patrick Perry, California Community College System Office Philip Garcia, California State University
Tutorial Part 2: Multiple Indicators for Monitoring Undergraduate Transfers Through to the Baccalaureate: 4-Year Institution Topics ...................................................... 215
Philip Garcia, California State University Patrick Perry, California Community College System Office
Dual Enrollment: An On Ramp to College Success............................................................... 220 Linda Fossen, UT Brownsville and Texas Southmost College Blanca Trevino Bauer, The University of Texas at Brownsville/Texas South Matthew Johnson, The University of Texas at Brownsville/Texas South
The Benefits of Dual Enrollment: Graduation Advantages.................................................... 228 Michael Morrison, North Iowa Area Community College Karen Pierson, North Iowa Area Community College
Thursday, October 1, 2009 (continued) Opportunity and Action to Stay in School (OASIS): A First Year Student Retention Mentoring Program.............................................................. 238
Joy Himmel, Pennsylvania State University - Altoona Jamie Pyo, Pennsylvania State University - Altoona Linda Strauss, Pennsylvania State University - University Park
The Effect of Traditional Peer-Mentoring vs. Hybrid Peer-Mentoring on Student Retention and Goal Attainment............................................................................ 245
Elijah Ward, Saint Xavier University Earl Thomas, Saint Xavier University William Disch, University of Connecticut
A Touch of CLASS: Centering Learners Attention on a Super School – Cheyney University ................................ 258 Shelly Weeks-Channel, Cheyney University of Pennsylvania
Marlene Archie, Cheyney University of Pennsylvania
Students Staying on Track and Reaching Toward Success- A Retention Program for At-Risk First Year College Students: Preliminary Results............ 268
Ellen Nagy, Heidelberg University
A Longitudinal Look at the Summer Bridge Program at Chaminade University .................. 275 Curtis Washburn, Chaminade University of Honolulu
Papers Friday, October 2, 2009 Alphabet Soup: The ABCs of GPAs ...................................................................................... 285
Jaclyn Cameron, DePaul University
Growing the Nurse Pipeline: Examining the Role of the BSN .............................................. 294
Nathan Daun-Barnett, University at Buffalo Sarah Barnett-Tranum, Jamestown Community College
Practical Retention Solutions for the Community College .................................................... 306
Jennifer Miller, Ozarka College Joan Stirling, Ozarka College Richard Williams, Ozarka College
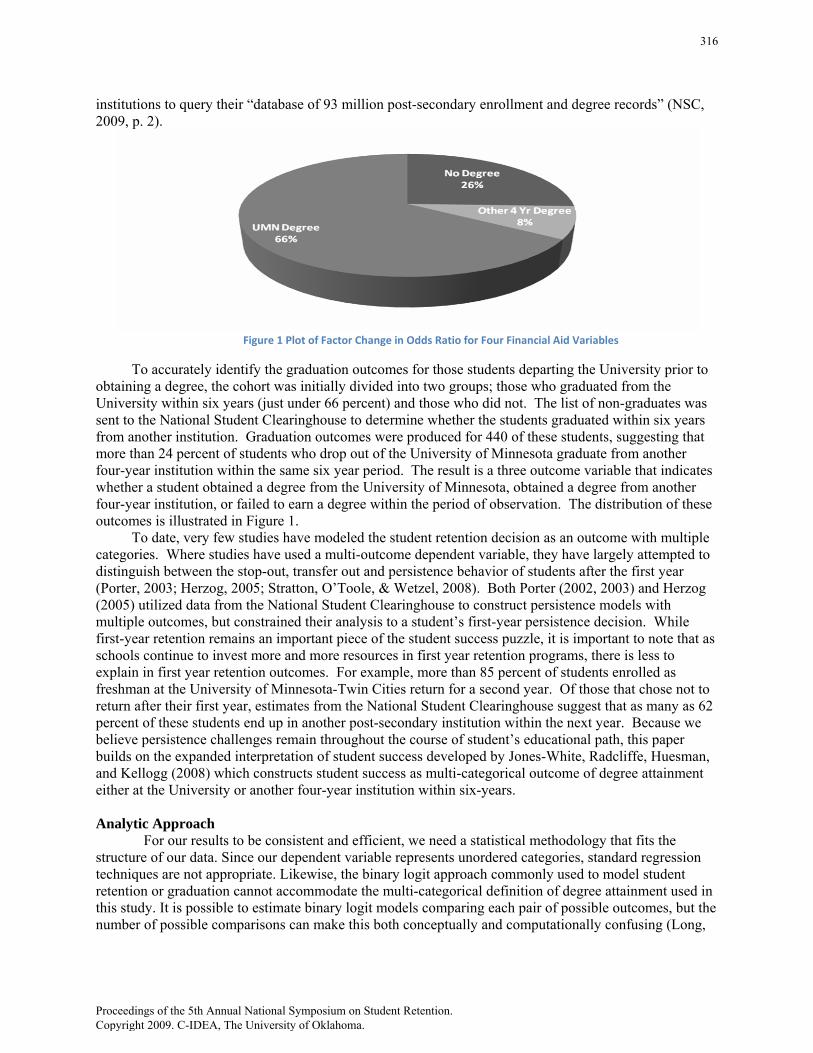
Friday, October 2, 2009 (continued) Priced out? Does Financial Aid Affect Student Success? ..................................................... 313
Daniel Jones-White, University of Minnesota Peter Radcliffe, University of Minnesota Linda Lorenz, University of Minnesota
Programs and Practices that Retain Students in the First-Year: Insights from a National Study .................................................................. 327
Linda DeAngelo, Cooperative Institutional Research Program at the University of California, Los Angeles
The Academic Intervention and Mentoring Model: A Comprehensive Academic Initiative for At Risk First-Year Students ............................... 343
Nicole Boulais, Rochester Institute of Technology Lynne Mazadoorian, Rochester Institute of Technology
The Comprehensive Retention Review: A Step by Step Guide for Evaluating the Overall State of Retention at Your Institution ...... 352
Kerri Sleeman, Michigan Technological University Susan Liebau, Michigan Technological University
Attempting to Make Sense of First Generation Student Success: Part II (Part I: Is There Such a Thing as Too Much of A Good Thing When It Comes to Education? Reexamining First Generation Student Success)................................................. 361
Mary Lou D'Allegro, Penn State Berks Stefanie Kerns, Penn State Berks
Facilitating Student Success Through a System of Prescriptive Engagement and Transition......................................................................................................................... 373
Roosevelt Shelton, Kentucky State University
Five Factors for Improving Nontraditional Student Retention: Findings from a 2004 Comparative Analysis Study Using National BPS Data and Data from a 2008-09 Study at Santa Fe College .................................................................... 385
Angela Long, Santa Fe College
Progress toward Graduation: The 30-60-90 Student Success Roadmap ................................ 396
Mary Keenan, University of Minnnesota Duluth Paul Treuer, University of Minnesota Duluth Susan Darge, University of Minnesota Duluth Matthew Larson, University of Minnesota Twin Cities
Friday, October 2, 2009 (continued) The Life-Health Sciences Internships Program: Research and Professional Experience Internships as an Undergraduate Retention Tool ................................................................... 404
Brandi L. Gilbert, Indiana University-Purdue University Indianapolis N. Douglas Lees, Indiana University-Purdue University Indianapolis Simon J. Rhodes, Indiana University-Purdue University Indianapolis
The Relationship of What Students Know and Who They Are in Predicting Academic Success: Assessment of Non-Cognitive Factors Affecting the Success of Freshmen............ 412
Patty Mulkeen, Austin Peay State University Melissa Gomez, Austin Peay State University
“Yes, We Can”: Improving Retention and Learning Outcomes for High-Risk Students through Curricular Reform at Trinity Washington University ......... 418
Elizabeth Child, Trinity Washington University Cristina Parsons, Trinity Washington University
Note: The PowerPoint for this panel is located in Resource Folder See Dual Enrollment Paper and Benefits of Dual Enrollment Paper Dual Enrollment: An On Ramp to College Success
Linda Fossen, UT Brownsville and Texas Southmost College Blanca Trevino Bauer, The University of Texas at Brownsville/Texas South Matthew Johnson, The University of Texas at Brownsville/Texas South
The Benefits of Dual Enrollment: Graduation Advantages
Michael Morrison, North Iowa Area Community College Karen Pierson, North Iowa Area Community College
Panel Session 2: Programs to Engage African American Male Students............................... 431
Note: The PowerPoint for this panel is located in Resource Folder
Student African American Brotherhood & Brother-2-Brother: Retaining Black & Latino Males in Higher Education....................................... 438-449
Robert Mock, University of Arkansas Cledis Stuart, Southern Arkansas University Lonnie Williams, Arkansas State University
Panel Session 3: Early Alert ................................................................................................... 432
Note: The PowerPoint for this panel is located in Resource Folder See Developing and Implementing Paper
Carroll University's Retention Alert System
Kyle Hawkins, Carroll University Jeff McNamara, Carroll University James Wiseman, Carroll University Elizabeth Towell, Carroll University
Note: The PowerPoint for this panel is located in Resource Folder See OASIS Paper and The Effects of Traditional Mentoring Paper
Opportunity and Action to Stay in School (OASIS): A First Year Student Retention Mentoring Program
Joy Himmel, Pennsylvania State University – Altoona Jamie Pyo, Pennsylvania State University - Altoona Linda Strauss, Pennsylvania State University - University Park
The Effect of Traditional Peer-Mentoring vs. Hybrid Peer-Mentoring on Student Retention and Goal Attainment
Elijah Ward, Saint Xavier University Earl Thomas, Saint Xavier University William Disch, University of Connecticut
Panel Session 5: Bridging the Student Experience for Success ............................................. 435
Note: The PowerPoint for this panel is located in Resource Folder See the Touch of Class Paper, Students Staying on Track Paper and the Summer Bridge paper
A Touch of CLASS: Centering Learners Attention on a Super School – Cheyney University
Shelly Weeks-Channel, Cheyney University of Pennsylvania Marlene Archie, Cheyney University of Pennsylvania
Students Staying on Track and Reaching Toward Success: A Retention Program for At-Risk First Year College Students: Preliminary Results
Ellen Nagy, Heidelberg University
A Longitudinal Look at the Summer Bridge Program at Chaminade University
Curtis Washburn, Chaminade University of Honolulu
Panel Session 6: The Consortium. ........................................................................................ 437
Note: More information about the Consortium for Student Retention Data Exchange at the University of Oklahoma can be found at: http://csrde.ou.edu What is the CSRDE (the sponsor of this conference) About?
Sandra Whalen, CSRDE, The University of Oklahoma Blake Cannon, CSRDE, The University of Oklahoma
Posters Poster Sessions (Abstracts Only) ...............................................................................450 Hobsons EMT Retain: Improve Student Retention by Integrating Institutional Changes, Student Resources and Technology
Hobsons Representative
Breaking the Promise: Examining the Gap Between State Policy Adoption and Institution-level Implementation
Nathan Daun-Barnett, University at Buffalo
If at First You Don't Succeed, Try Community College: An Analysis of Community College Transfers Who Applied as First Time Freshmen
Jaclyn Cameron, DePaul University Note: See paper for this poster
Integration of Retention Programs to Improve Student Graduation and Success Rates
James Mackin, Bloomsburg University of Pennsylvania S. Ekema Agbaw, Bloomsburg University of Pennsylvania Jonathan Lincoln, Bloomsburg University of Pennsylvania Irvin Wright, Bloomsburg University
Justifying Investments in Retention Efforts Based Upon their Return on Investment
Charles Perkins, Point Park University Anne Skleder, Chatham University
Note: See paper for this poster Life-Health Sciences Internships: Research and Professional Experience Internships as an Undergraduate Retention Tool
Brandi L. Gilbert, Indiana University-Purdue University Indianapolis N. Douglas Lees, Indiana University-Purdue University Indianapolis Simon J. Rhodes, Indiana University-Purdue University Indianapolis Note: See paper for this poster
Matters of Success: A Deliberative Approach to Retaining Students
Matthew T. Kenney, Austin Peay State University
Poster Sessions (continued) More Than Balls and Whistles: An Examination of the Impact Physical Activity Courses have in Student Retention
Dylan Naeger, University of Louisville David Britt, University of Louisville
The Comprehensive Retention Review: A Step by Step Guide for Evaluating the Overall State of Retention at Your Institution
Susan Liebau, Michigan Technological University Kerri Sleeman, Michigan Technological University Note: See paper for this poster
Penny Pinchers: The Impact of the Economic Downturn on Student Financial Persistence in Higher Education
Emily Coleman, Midway College
Rebound: Second-Chance Seminar For Freshmen In Academic Difficulty
Linda J Burke, Saint Xavier University Maureen Wogan, Saint Xavier University Carrie Scahde, Saint Xavier University Susan Swisher, Saint Xavier University
Retention 101: Making Theory Work on Your Campus
Emily Coleman, Midway College The Effect of Locus of Control, Motivation and Learning Style on Retention in Online Community College Courses
Vondra Armstrong, Pulaski Technical College L. Carolyn Pearson, University of Arkansas at Little Rock Charles Donaldson, University of Arkansas at Little Rock Edward Franklin, Arkansas Association of Two-Year Colleges
When It's Not Working--Fix It: Redesign Developmental Mathematics at Austin Peay State University
Harriett McQueen, Austin Peay State University Martin Golson, Austin Peay State University
CSRDE: Data, Knowledge and Innovation. Sandra Whalen, CSRDE. The University of Oklahoma Blake Cannon, CSRDE, The University of Oklahoma
Workshops
Workshops (Abstracts).......................................................................................................... 458 Early Alert and Warning Programs: An Intentional Approach to Ensuring Student Success and Persistence
Brandon Miller, Baylor University
Retention for Rookies
Tim Culver, Noel Levitz
Targeted Intervention for At-Risk First-Time College Students and Transfers
DeLaine Priest, University of Central Florida Charlene A. Stinard, University of Central Florida Bernadette M.E. Jungblut, University of Central Florida
Data and Decisions to Support Student Success
Gerald McLaughlin, DePaul University Richard Howard, University of Minnesota Josetta McLaughlin, Roosevelt University
Predictive Modeling Tutorial: Logistic Regression
Kyle Hawkins, Carroll University Note: See Sample Data in Resource Folder Also see the Predictive Modeling Paper Two-part Tutorial: Multiple Indicators for Monitoring Undergraduate Transfer Through to the Baccalaureate Patrick Perry, California Community College System Office Philip Garcia, California State University Student Retention and Success Glossary Rosemary Hayes, CSRDE, The University of Oklahoma
Keynote Presentations
Opening Session
Randy Swing Association for Institutional Research
[email protected] Dr. Randy L. Swing is the Executive Director of the Association for Institutional Research (AIR). AIR is a professional association of more than 4,200 institutional researchers, planners, and decision makers representing over 1,500 higher education institutions around the world. Prior to joining AIR, Swing served as Co- Director & Senior Scholar at the Policy Center on the First Year of College and as a fellow in the National Resource Center for The First-Year Experience and Students in Transition at the University of South Carolina. He has worked with numerous research teams in Japan, and served as an advisor to the Quality Assurance Agency of Scotland. Dr. Swing has authored articles, chapters, monographs, and books, including Achieving and Sustaining Excellence in the First College Year (2006) and Proving and Improving: Tools and Techniques for Assessing the First College Year (2004). He is a frequent speaker at national and international conferences on institutional change, assessment, retention, and undergraduate student success. He serves on the editorial/review boards for the Journal of General Education, The Journal on Excellence in College Teaching, and Innovative Higher Education. For two decades prior to 1999, he held various leadership positions at Appalachian State University in assessment, advising, Upward Bound, and Freshman Seminar. He holds a Ph.D. in Higher Education from the University of Georgia, MA and ED.S from Appalachian State University, and a B.A. in Psychology from the University of North Carolina–Charlotte. Randy began postsecondary education as a first-generation college student at Davidson County Community College in Lexington, NC.
Nevin will briefly review the work of Achieve to align high school standards with college and career readiness; he will focus in particular on a set of college- and career-ready policy initiatives now being implemented by the thirty-five states participating in Achieve's American Diploma Project (ADP) Network, including setting achievement benchmarks in mathematics and English/language arts, establishing more rigorous high school graduation requirements, creating college-ready assessments, and development of data systems that can follow student success across the K-16 continuum. Nevin will also provide several state-level examples, such as the Indiana Core 40 initiative and the California State University's Early Assessment Program .
1
Proceedings of the 5th Annual National Symposium on Student Retention. Copyright 2009. C-IDEA, The University of Oklahoma.
Keynote Presentations, cont’d Nevin Brown, cont’d Nevin Brown is Director of Postsecondary Initiatives at Achieve, an independent, bipartisan, non-profit education reform organization created in 1996 by the nation’s governors and corporate leaders to help make college and career readiness a national priority. Before joining Achieve, Brown was president of the International Partnership for Service-Learning and Leadership (IPSL), a New York-based organization that provided academic and community service study-abroad opportunities for undergraduate and graduate students. Prior to that, Brown was for eleven years a principal partner with the Education Trust; he worked closely with community-based school-university collaborative initiatives through the Trust’s K-16 and Community Compacts for Student Success initiatives, directed for six years the Trust’s annual national conferences, and was the communications officer for the Quality in Undergraduate Education initiative. From 1980-1991, Brown headed the Division of Urban Affairs of the National Association of State Universities and Land-Grant Colleges (NASULGC). He also has held previous appointments with the District of Columbia Public Schools, the American Association of State Colleges and Universities (AASCU), the University of Houston, and the Southern Regional Council’s Southern Governmental Monitoring Project. Mr. Brown has been a member of the governing boards of the Urban Affairs Association (UAA), the National History Education Network, and the Colleges and Universities of the Anglican Communion (CUAC). He has also served as a review panelist for the National Science Foundation, Innovations in American Government Awards, and National History Day, and as a member of the editorial boards of several professional journals. He also co-chaired the European Links Committee for UAA from 1995-2003, through which he was involved in the creation of the European Urban Research Association (EURA). Brown received a B.A. with highest honors in history from the University of California, Santa Barbara in 1972 and an M.A. in history from the University of Virginia the following year. In 2001 he received the Urban Hero Award of the National Association of State Universities and Land-Grant Colleges.
Financial Aid and Higher Education
Carl Dalstrom USA Funds
[email protected] Carl C. Dalstrom has nearly four decades of experience in financial aid for higher education. Prior to becoming president and chief executive officer of USA Funds® in 2000, he worked in a number of capacities at USA Funds and its former parent company, USA Group. Dalstrom joined USA Funds in 1989 and subsequently directed a variety of initiatives and participated in industry-wide collaborative efforts that dramatically improved the delivery of student loan services. Immediately prior to becoming USA Funds’ CEO, he managed education loan operations as executive vice president of USA Group. As USA Funds CEO, Dalstrom oversees an organization that since 1960 has guaranteed nearly $171 billion in education loans to help 19.7 million students and families across the nation pay
2
Proceedings of the 5th Annual National Symposium on Student Retention. Copyright 2009. C-IDEA, The University of Oklahoma.
Keynote Presentations, cont’d Carl Dalstrom, cont’d for higher education. Dalstrom has spearheaded a variety of efforts that encourage involvement of the business community in supporting higher education, with USA Funds in 2008 providing more than $15 million for programs that promote preparation for, access to and success in higher education. Included in that figure is $8.4 million in scholarships. Before joining USA Funds, he directed Student Need Analysis Services at ACT and served as a campus financial aid administrator at the University of Illinois at Chicago and at Northeastern Illinois University in Chicago. He holds a master’s degree in education from Loyola University of Chicago and an undergraduate degree from Northeastern Illinois University. He currently serves on the board of USA Funds and chairs the boards of its affiliates, SMS Hawaii® and Northwest Education Loan Association®. He also is a member of the board of Indiana Dollars for Scholars.
3
Proceedings of the 5th Annual National Symposium on Student Retention. Copyright 2009. C-IDEA, The University of Oklahoma.
A Holistic Approach to Students at Risk: The SOAR Program at Cazenovia College
Abstract - Presentation highlights the Student Observation, Assessment and Response (SOAR) Program at Cazenovia College. The program has a three part focus: a fact-gathering online module allowing faculty and staff to report concerns regarding students at risk; a committee of stakeholders acting as a clearinghouse for information, reporting on interactions with the student; and following up with the student through the appropriate combination of residence life, athletic, academic, student support, and counseling services. Communication with faculty and staff is coordinated via e-mail and additional information is gathered through Early Alert Referrals from faculty and staff, athletics progress reports, judicial/security reports, and residence hall reporting. Students are identified because of risk behavior in the classroom (absences, poor academic quality) and throughout campus (residence halls, co-curricular activities). The SOAR committee assists students with academic or social concerns placing them or their peers at risk. We meet weekly to discuss information, coordinate use of campus resources, inform appropriate community members and assist students with their needs. The committee strives to communicate with students in a non-threatening manner. Assessment data consists predominantly of campus-wide retention data. Information concerning class attendance, judicial processes, academic support sessions and counseling sessions are used to gauge student needs and participation. Retention as a national issue President Obama, in remarks to the Hispanic Chamber of Commerce on March 9, 2009 pointed out that “In just a single generation, America has fallen from 2nd place to 11th place in the portion of students completing college. … We are investing $2.5 billion to identify and support innovative initiatives across the country that achieve results in helping students persist and graduate.” (New York Times Online, 2009) Current economic circumstances obviously make this effort even more critical given the challenge posed to our students and institutions of higher education. The Student Observation, Assessment and Response (SOAR) Program at Cazenovia College is a crucial aspect of Cazenovia’s response to this challenge. The Student Observation, Assessment and Response (SOAR) program
The SOAR program was initiated in fall 2003 as a part of a holistic approach to student success in their first year of college. After the College’s First Year Committee endorsed a ‘crisis management team’ concept in spring 2003 to work with at-risk first year students, the SOAR program took shape based on our perception of Cazenovia students and a judicious emulation of external models. Vincent Tinto noted in an e-mail posted to the First Year Experience list serve in 2002 that “one of the best "predictors" of
4
Proceedings of the 5th Annual National Symposium on Student Retention. Copyright 2009. C-IDEA, The University of Oklahoma.
student difficulty is student difficulty. Faculty who teach first year classes should carefully monitor their students in-class behaviors and provide weekly feedback to the appropriate office (e.g. through a web based response form).” (V. Tinto, e-mail to the First Year list serve [email protected] posted February 11, 2002). Joe Cuseo provided a specific set of ‘red flags’ to watch out for in“"Red Flags": Behavioral Indicators of Potential Student Attrition”:
“… the following behaviors could serve as signals for detecting students who are at risk for academic failure or who intend to withdraw from the institution: (a) poor academic performance in more than one class, (b) delay or failure to pre-register for next-term classes; (c) delay or failure to renew housing agreements; (d) delay or failure to reapply for financial aid or work-study, (e) failure to declare a major by the end of their sophomore year, or (f) request copies of transcripts before eligibility to graduate.” (Cuseo, 2002) Implementation of the new SOAR committee was strongly influenced by a presentation by Janet
E. Schulte, Dean of Lesley College (MA) about their informal student-at-risk committee at the International Conference on the First-Year Experience in Vancouver, BC in July 2003 (Schulte, 2003). Schulte’s team met on a regular basis to discuss students exhibiting “poor academic skills, stress, rude behavior in class, inappropriate behavior outside class, inappropriate disclosures, missing meetings with advisors and other college staff, poor attendance, not eating, and evidence of a short attention span”.
Building upon this mix of concepts and experience, SOAR brought together stakeholders with a wide variety of perspectives and sources of information and charged them to mobilize campus resources on behalf of students in need. Procedurally, students are identified and looked at on a case-by-case basis. Information is gathered from academic advisors, instructors, coaches, staff/administrators, student club advisors, and student life staff. Behaviors from all aspects of college life are integrated into this examination. Strategies are discussed within the committee and a point person identified who follows up on the agreed upon strategies. Frequently we refer the student to someone who has a good relationship with the student. Possible referrals include counseling or chaplain, student mentor, academic support services, mediation via residence life or other office, creation of a self-care plan, academic advisor, time management workshop, and contacting parents (a last resort if the student is a danger to self or others).
The SOAR committee’s initial membership reflected the emphasis on first year student issues and the commitment to a college-wide approach to these issues:
• Dean of the First Year Program: Chair, gather information from faculty and the Registrar’s Office, also college community as a whole.
• Associate Dean for Student Development/Judicial Coordinator: Takes resident advisor and director reports, also contact for housekeeping, security staff, and college community.
• Resident Director/Director of First Year Residential Program: Resident advisors meet with her every two weeks to discuss student problems; also takes resident director reports on first year students.
• Director, Center for Teaching and Learning: Reports from peer and professional tutors in the Learning Center, channel information from grant-funded programs (HEOP, C-STEP, Student Support Services).
• Athletic Director: Collects reports from coaches, will also institute and monitor academic reports on all first year athletes.
• First Year Seminar faculty: Academic information from students and faculty. The committee’s current membership is largely the same as above with the exceptions that the
Athletic Director and Faculty Athletic Representative now represent athletics (which possesses its own academic progress reporting system) and faculty committee members are drawn from fulltime faculty teaching first year students. The college’s Counseling Center and Office of Special Services Office are not represented on the SOAR committee due to confidentiality issues but monitor SOAR e-mail traffic and are also contacted by the SOAR Chair if they need to be involved. By fall 2005, SOAR’s mission had been enlarged to include the entire student population but the primary focus remains on first year students. SOAR now acts as a clearinghouse for information; reports on interactions with the student; and
5
Proceedings of the 5th Annual National Symposium on Student Retention. Copyright 2009. C-IDEA, The University of Oklahoma.
follows up with the student through the appropriate combination of academic, residence life, athletic, student support, and counseling services. Some benefits of the SOAR approach are early intervention and awareness amongst faculty and staff that a systematic response exists to common behavioral problems. Student retention at Cazenovia College
Institutional concern regarding retention predates Cazenovia’s transformation from a two year into a four-year institution. Then President Schneeweiss commissioned a study by Vincent Tinto (Tinto, 1993) that revealed a host of issues impacting student retention, including physical and social problems in the residence halls, hostile administrative policies and procedures, and a negative racial climate on campus. Tinto’s analysis explained why only 52.8% of the entering first year class in 1992 returned the following fall. This number equates to the average persistence of first year students in two-year public colleges (53.7% in 2008) rather than that of the baccalaureate institution we sought to become (72.9% in 2008 (ACT, 2008). The study helped us understand that the college needed to be transformed on a number of fronts and provided impetus for taking a holistic approach to the issue of student retention. Comparing the Cazenovia student population with national trends in college demographics
Cazenovia’s current student population differs in regard to age, residency, and minority status from national trends in student demographics discussed by Jennifer L. Crissman Ishler (2005) in 'Today's First Year Students'. Cazenovia is predominantly a residential institution with a traditional age student population. Ishler cites Chronicle of Higher Education statistics that indicate roughly 28% of the nation’s undergraduates are 25 and older. This same age group makes up only 3% of the Cazenovia student population. Our commuter population is also relatively small. In fall 2008, of 976 fulltime students, 875 lived in residence halls and 101 were commuters. The National Center for Education Statistics identifies seven characteristics on the increase in the American student population: delayed entry into college, part time status, increased financial independence, full time employment, possession of dependents other than a spouse, single parenthood, and lack of a standard high school diploma. (Upcraft et al, 2005) Only one of these trends, the tendency to work fulltime, comes close to fitting our population. In fall 2008, only eleven part time students enrolled, excluding evening Continuing Education participants, and only eighteen students were financially independent. Cazenovia’s minority student enrollment shrank from 19% in 2000-2001 to 9% in 2008-2009. The college no longer offers two-year degrees that are more accessible to minority or other populations that may possess limited financial resources. The cost of a four-year education has increased substantially to place Cazenovia in the midrange of comparable baccalaureate colleges within our region. We have, however, maintained a strong HEOP program that counterbalances this trend to a limited extent.
Our student population resembles current national norms in regard to gender balance, reliance on support services, intrusion of emotional and physical health issues, concerns about alcohol consumption, need for employment, and first generation status. A former women's college, Cazenovia College’s efforts to increase male enrollment have been hampered by the national trend towards a greater overall percentage of women in college. We have maintained roughly a 75/25% ratio of women to men over the last eight years. Students with learning disabilities and their parents have found Cazenovia attractive given its small size and support services offered through the Center for Teaching and Learning. In fall 2008, the Office of Special Services reported that 110 (11%) of the overall student population had been diagnosed with learning disabilities including 29 (10%) of 284 first year students. Cazenovia College has traditionally enrolled a substantial number of first generation students, who may experience greater emotional challenges in going off to college than the general population. Between 2005 and 2007, 446 out of 849 (52.5%) entering first year Cazenovia students belonged to this demographic.
Nationally, students report an increase in emotional and physical health issues. Cazenovia is no different in this regard. Family disruptions continue to increase and make a substantial difference in how
6
Proceedings of the 5th Annual National Symposium on Student Retention. Copyright 2009. C-IDEA, The University of Oklahoma.
we discuss student issues with parents. A common pattern is for students to come in for appointments with one parent (often the mother) and hesitate to share information with the non-custodial parent. Because emotional issues frequently intrude into our considerations, two fulltime counselors receive SOAR e-mails and the committee also will intervene to get students to the counseling center. Drug use is another common factor in placing students at risk. Alcohol is the primary drug of choice at Cazenovia College according to the college’s 2008 administration of the American College Health Association’s National College Health Assessment II although actual use (60.3%) is lower than perceived use (94.3%). Stress, sleeping problems, roommate issues, relationship difficulties, depression, and the death of family or friends are other significant issues that lead to academic difficulties. SOAR cases frequently tie together academic problems with alcohol consumption identified through residence life reports.
A trend towards greater academic selectivity and a concurrent drop in less prepared students has been the most noticeable change in our population since 2000. The college’s upward trend in academic selectivity is demonstrated by a growth in SAT/ACT scores. The average incoming first year combined SAT score increased from 890.30 in fall 2000 to 1012.69 by fall 2008. In fall 2008, seventy (24.6%) incoming first year students were required to use Center for Teaching and Learning tutorial services as a precondition for admission. In comparison, roughly 29% of college students require such assistance (Upcraft et al, 2005). Retention theories and practice at Cazenovia College
Cazenovia’s retention efforts have been very pragmatic in approach as we addressed the problems described above but are largely congruent with those of private four-year baccalaureate colleges. Four-year private college respondents to a 2004 ACT survey reported use of freshman seminar/university 101 for credit (16.5%), advising interventions with selected student populations (16.2%), internships (13.5%), integration of academic advising with first-year transition programs (12.7%), pre-enrollment orientation (10.5%), and an early warning system (10.5%). (ACT, 2004). We have adopted all of these strategies except the integration of academic advising with first year programs.
Our awareness and use of retention theories has come primarily through interaction with individuals such as John Gardner and his colleagues, Vincent Tinto, and Joe Cuseo who themselves possess a strong theoretical grounding. Our holistic and cross-college approach was fostered by our analysis of Cazenovia’s needs, advice from Gardner and Tinto, and literature such as Astin and Braxton. There is a growing trend noted by Randy McClanahan to use aspects of various theories in constructing a holistic approach to retention (McClanahan, 2004). We have consistently advocated such an approach based on experience. Our approach was further influenced by Cuseo’s ‘red flags’ (Cuseo, 2002) and a conference presentation on Lesley College’s students-at-risk strategies (Schulte, 2003).
The road to SOAR’s creation began as part of our efforts to address the needs of our most critical population, first year students. As a small college with limited expertise and resources, we sought to connect with national initiatives targeting the first year of college. John Gardner and his associates advocate for holistic approaches to first year issues including retention through publications and conferences sponsored by the National Resource Center for the First Year Experience and Students in Transition and the Policy Center on the First Year of College. In The Keys to First-Year Student Persistence, Jennifer L. Crissman Ishler and M. Lee Upcraft conclude a wide ranging review of persistence models by endorsing Lee Noel’s view that “retention is the result or byproduct of improved programs and services in our classrooms and elsewhere on campus that contribute to student success.” (Upcraft et al, 2005, p. 46). Cazenovia participated in the initial development of the Foundations of Excellence project organized by the Policy Center on the First Year of College in 2003-2004 as an affiliate college. We paid careful attention to the initial Foundations of Excellence statement of philosophy:
“Foundations Institutions create organizational structures and policies that provide a comprehensive, integrated, and coordinated approach to the first year. These structures and policies provide oversight and alignment of all first-year efforts. A coherent first-year experience
7
Proceedings of the 5th Annual National Symposium on Student Retention. Copyright 2009. C-IDEA, The University of Oklahoma.
is realized and maintained through effective partnerships among academic affairs, student affairs, and other administrative units and is enhanced by ongoing faculty and staff development activities and appropriate budgetary arrangements.”
Various theorists have emphasized the need for comprehensive approaches to student success. Kuh states that "Only a web of interlocking initiatives can over time shape and institutional culture that promotes student success" (as cited in McClanahan, 2004, p. 7). Astin posited that the implications for practice should be overarching, rather than singular in nature. “Institutions need not look far afield to find the key to enhanced student retention. It is achievable within the confines of existing institutional resources. It springs from the ongoing commitment of an institution, of its faculty and staff, to the education of its students” (as cited in McClanahan, 2004, p. 4). Bruffee (2000) claims that in collaborative partnerships “all members are perceived and recognized as holding important knowledge and experiences that can contribute to the group’s learning process.” In our case faculty and student affairs professionals all contribute information that helps the team find the best method of assisting a student. Each committee member, depending on his or her relationship with the student, has the ability to possess information that helps the committee devise the proper course of action to take with the student.
Values that stand behind such holistic approaches are equally critical to success. John Braxton of Vanderbilt University has identified two organizational attributes or characteristics that impact students staying or leaving institutions of higher education. (Braxton, 2006) The mission and role of SOAR on our college campus helps illustrate the significance of these two characteristics: commitment of the institution to student welfare and institutional integrity. Braxton states that the first attribute, commitment of the institution to student welfare, can define the role an institution plays in communicating the value it places on the “growth and development of its students…in such a culture all students are treated as if they are at-risk. Key people believe in the promise of each student in a fervently held way.” SOAR represents both an organizational commitment (college-wide staff) and intervention component that the college has for helping to ensure the success of all students. All college personnel are encouraged to notify SOAR of a student’s difficulty in making the adjustment to his or her living and learning community. Faculty and staff are provided clear communication through college orientation of college-wide staff and students, faculty and staff meetings, and policy statements on the purpose and role of SOAR in helping identify and refer students at-risk to appropriate college services. All SOAR referrals are considered confidential and involve a request for action by staff. The second attribute, institutional integrity, requires the college or university to be true to its mission and core values. We believe our students deserve “…a community focused on learning, nourished by diversity, and strengthened by integrity.” (Cazenovia College Catalog) SOAR is a clear manifestation of the institution’s efforts to model a community of professionals who seek out the best ways of serving students in need.
Interlocking Retention Initiatives
Interlocking initiatives such as the Center for Teaching and Learning’s array of programs and academic support services, our Residential First Year Program, the orientation process, our version of the First Year Seminar, efforts to improve academic advising, and a one-stop enrollment management restructuring helped turn around student retention results. Cazenovia’s initial approach to the first year focused on creating or clarifying policies, implementation of the fall First Year Seminar, and coordination between Seminars and the equally new First Year Residential Program. A cross-college First Year Committee authorized by the college’s administration and Board of Trustees in February 2003 worked to develop, implement, and coordinate programs aimed at enhancing the experiences of first year students. These new and improved residential, academic, and academic support programs provided students with greater opportunities to achieve academic success and consequently increased student retention.
In spring 2001, newly appointed President Mark Tierno charged the faculty with the development of interdisciplinary First Year Seminars taught by fulltime faculty to be offered incoming students in fall 2001 and the position of Dean of the First Year Program was established in Academic Affairs. While the previous Freshman Seminars had been the least popular aspect of the curriculum (Tinto, 1993), the new
8
Proceedings of the 5th Annual National Symposium on Student Retention. Copyright 2009. C-IDEA, The University of Oklahoma.
First Year Seminars immediately became the most highly rated component of the college curriculum. The Summary of Findings from the November 2001 administration of the Noel-Levitz Student Satisfaction Survey (SSI) indicated that most incoming First Year students found the new First Year program more significant and more satisfying than the previous program offered at Cazenovia. Student evaluations of teaching (Table 1) reflected this change in perception:
Student Course Evaluations of First Year Seminars, Fall 2001 Averages on 5 point scale by First Year Seminars, all 100 Level Courses, All Courses
First Year Seminar All 100 Level Courses All Courses Average Rating 4.52 4.38 4.37
Table 1: Student Course Evaluations
This change has now become an acknowledged aspect of the curriculum; in the fall 2008 student satisfaction with teaching survey the overall average for all courses was 4.40, for all First Year Seminars 4.57, and for First Year Seminars offered as Living/Learning Communities, 4.75.
Our Student Life division conducts the First Year Residential Program (FYRP), a series of student life programs which address issues that first-year students face in their transition to college. FYRP helps students connect to the college so they can establish a sense of ownership and belonging. We use a calendar that indicates students’ greatest concerns at various points throughout the year as the basis for these programs. In collaboration with other campus constituencies we present programs on such topics as study skills, interpersonal communication skills, career advice, healthy eating and fitness and knowledge of campus resources. We stage Quad Day, a campus clubs/organizations fair, early in the fall semester as a starting point for first-year students getting involved on campus. Events that foster socialization like The Roommate Game, room decorating contests and various receptions are offered as well. The FYRP allows more interaction with the professional residence life staff members who live in the first-year residential halls. As a result, both student affairs professionals and students form connections through a positive, proactive avenue providing another means of student support. Those connections assist student affairs professionals in spotting risky behaviors that may place students at risk.
The Center for Teaching and Learning (CTL) works with all students to provide opportunities to maximize their academic potential. To achieve this goal, the CTL offers a variety of alternative methods to assist in learning, such as peer mentoring through one-on-one or small groups, tutoring, assistance in study skills, writing, reading, and mathematics proficiency, and college success planning. CTL staff act as primary agents for helping students address negative attributes that lead to poor performance in their academic success through supportive services such as tutoring, academic counseling, study skills workshops, and services for special needs students. We continue to find that students, especially in their first year, seek to shed their learning disability label. Cyndi Pratt, Special Services Program Director, reports that roughly 40% of first year students with a learning disability diagnosis fail to take advantage of their accommodations. First year students often possess a “resource mentality” and see the Special Services office as the equivalent of their high school “resource room” which they desire to outgrow. Those students who reject Special Services support based on this perception often appear on the SOAR at-risk list. SOAR Implementation and Challenges
Our major organizational topics of conversation since SOAR’s establishment have concerned (1) how to effectively mobilize college resources on behalf of students, (2) steps to publicize the committee’s role to campus constituencies, and (3) gaining student acceptance of SOAR. At the beginning of each term, the college is reminded via e-mail that “the SOAR committee works to help those students that have academic or social issues that place them (or their peers) at risk. SOAR helps students resolve these issues by putting them in contact with the people best suited to aid them – that could be a faculty member, a
9
Proceedings of the 5th Annual National Symposium on Student Retention. Copyright 2009. C-IDEA, The University of Oklahoma.
Resident Director, a coach, the Counseling Center, Enrollment Services, or other college resource.” The fall term is particularly critical in regards to identifying students at risk. The fall calendar of SOAR Committee activities includes an introduction of SOAR to students, faculty and staff through orientation programs followed by weekly meetings that review
• Initial attendance reports from instructors • On-line SOAR reports • E-mail sent to the SOAR mailbox • Reports from student development staff • Reports from the athletic department
Following the term, a three-person panel drawn from the SOAR committee reviews student appeals for readmission following academic dismissal.
E-mail and intranet have been key tools in gathering information about at-risk students and mobilizing our resources on their behalf. A SOAR e-mail address allows faculty and staff to alert the committee about a student that they believe to be at risk for any reason, academic or social. In fall 2007, SOAR initiated an on-line report form which provides a more structured means of gathering information through our secure intranet. SOAR reports can be either filled in electronically and sent to the SOAR mailbox or printed out and sent to the Academic Affairs Office via snail mail. SOAR has gradually developed a database based on these sources that will allow more quantitative assessment in the future. The SOAR process has limits and constraints which must be acknowledged. Students frequently respond to SOAR contacts with a high level of trepidation that must be overcome before any effective intervention can take place. The challenge is to locate the person(s) that can best work with that individual. Our counseling and special services staffs receive information from SOAR but are limited by confidentiality in what they can share with us in return. Most importantly, underreporting remains a frustrating challenge. We are always searching for those ‘quiet failures’ who go to classes, live peacefully in the residence halls, and who will be dismissed for academic failure at the end of the term. SOAR data and results
Data indicate that SOAR has gained acceptance as a campus resource. One key question regarding effectiveness is whether or not the Cazenovia College community perceives SOAR as an appropriate mechanism for reporting students in trouble. We monitor the participation rate of academic programs on campus (Table 2) to see if the proportion of students reported to SOAR in the total population approximates that of individual programs. Of course, being a small college means that some of these numbers fluctuate dramatically but the overall average demonstrates equal participation.
Participation in the SOAR Process by Academic Program Term F07 S08 F08 S09
Total number of students reported to SOAR 125 59 103 83 % of total student population 13.3 6.8 10.5 8.6 Average % of majors reported by academic program (N = 17) 16.5 8.9 14.4 12
Table 2: Participation in the SOAR Process
The most direct data to consider are our overall retention rates for the general student population, first year students, and those students reported to SOAR. At present, we have limited numbers to work with comparing the three populations for fall to fall (Table 3) and fall to spring (Table 4) retention rates.
10
Proceedings of the 5th Annual National Symposium on Student Retention. Copyright 2009. C-IDEA, The University of Oklahoma.
Comparative Fall to Fall retention rates, Fall 2006 – Fall 2008
Population F06- F07 F07-F08 Students Eligible to Return 92.80% 95.60%Retention Among Students Eligible to Return 83.30% 81.80%
All students Actual Retention 77.30% 78.30%
Students Eligible to Return 85.90% 93.40%Retention Among Students Eligible to Return 76.00% 77.70%First Time
Freshmen Actual Retention 65.40% 72.50%
Students Eligible to Return 84.32% 82.58%Retention Among Students Eligible to Return 83.33% 87.34%SOAR
Students Actual Retention 70.27% 72.13%Table 3: Fall to Fall retention rates 2006-07
Comparative Fall to Spring retention rates, Fall 2007 – Spring 2009
Population F07 - S08 F08 - S09 Students Eligible to Return 98.26% 97.50%Retention Among Students Eligible to Return 92.02% 93.48%
All students Actual Retention 90.41% 91.14%
Students Eligible to Return 96.68% 93.99%Retention Among Students Eligible to Return 89.38% 89.01%First Time
Freshmen Actual Retention 86.40% 83.75%
Students Eligible to Return 80.43% 92.51%Retention Among Students Eligible to Return 92.57% 85.50%SOAR
Students Actual Retention 74.46% 79.14%Table 4: Fall to Spring retention rates 2007-09
Has SOAR been able to identify the students most in need of assistance? One way to answer this
is to note the overlap between students we know are in trouble based on information sent to SOAR and those academically dismissed at the end of the term. As recently as spring 2007, we identified only 10 out of 23 students who ultimately were academically dismissed (Table 5). Since that time, we have identified through SOAR roughly 65% of those students at risk who were later dismissed. We are, of course, intent on achieving a decrease in numbers dismissed and making sure that we have identified those in jeopardy earlier in the term.
Academically dismissed students identified through SOAR Term Opening
enrollment # identified via
SOAR # dismissed % dismissed
Spring 2007 759 10 23 3.03 Fall 2007 938 19 29 3.09 Spring 2008 856 17 27 3.15 Fall 2008 976 14 22 2.25
Table 5: Academically dismissed students
Another check is provided by the explanations given by students who leave Cazenovia College. A recently implemented withdrawal survey form provides insight on students’ reasons for departure. The
11
Proceedings of the 5th Annual National Symposium on Student Retention. Copyright 2009. C-IDEA, The University of Oklahoma.
selected information below provides insight into the challenges we face and demonstrates that opportunities for intervention are often limited by circumstances beyond our control. Given our college’s small size and the consequent small number of departing students (26 in fall 2008), the survey results have to be viewed cautiously.
The following findings from the fall 2008 departing student survey were of particular interest to SOAR given its mission. Very few students indicated that they were leaving due to academic failure (4%), a key statistic given SOAR’s goal of mobilizing resources to help students in academic jeopardy. No students cited dissatisfaction with academic advising as a reason for leaving, another major concern to SOAR. A significant percentage (15%) did indicate that classes were in fact not challenging enough and an even higher percentage (20%) reported that their desired major was not offered at Cazenovia. There were several responses that indicate issues still to be addressed in the students’ life outside of the classroom. 23% of withdrawing students were dissatisfied with the lack of diversity on campus, 19% criticized the college for a perceived lack of community and 27% identified dissatisfaction with their roommate as contributing to their decision to depart. These are all areas where SOAR can work with students on an individual basis to improve satisfaction with their experience at Cazenovia College. On the other hand, 54% of departing students indicated that they wanted to be closer to home, 38% sought a more urban environment, and 46% cited personal reasons for leaving that had nothing to do with their experiences at Cazenovia. These results show how important it is that SOAR collects data from across the college rather than being confined to purely academic concerns.
There are a number of initial findings based on the college’s experience in developing, implementing, and operating the SOAR process that call for further study and the creation of additional quantitative measures. These findings impact athletics, residence life, counseling services, special support services, grant-supported services for minority and first generation students, tutor usage, faculty advisors and other college constituencies. They include the beneficial impact of greater communication to identify interconnected problems faced (or generated) by students at risk. One conspicuous example is the link between SOAR with the parallel retention system conducted by our athletics program. This collaboration provides opportunities for coaches to intervene in situations where students may be less inclined to listen to anyone else. Opportunities now exist to get students connected with college services that they previously avoided. The creation of another channel to refer troubled students to counseling services has led to a smaller incidence of end-of-term psychological ‘meltdowns’ by students just realizing that they faced failure. SOAR create another means for faculty to identify students with possible learning disabilities as well as a way for Office of Special Services to uncover instances where identified students are not using their accommodations. The SOAR process improved student use of the Center for Teaching and Learning by identifying students in need of tutoring services. More information about advisees’ overall academic issues is provided to faculty advisors who may not have students in class or (especially with first year students) know them well enough to spot problems. Instructors and advisors are more aware of the scope of problems faced by their students, whether problems exist only in regard to an individual course, poor performance in most or all of their courses, an overcommitment to athletics or other co-curricular activities, too much socializing to commit to their studies, or are due to medical issues (following FERPA guidelines). One last result concerns those students who do not succeed despite our encouragement. For those students, SOAR information provides better knowledge about why they failed and what chance they really have of future success. The result was a rethinking of our response to appeals in both fall and spring terms and a greater understanding of the strengths and weaknesses of those students applying for readmission.
The SOAR process has served since 2003 as an important means of aiding and encouraging individual students to become successful learners. We are now beginning to use SOAR data to help us improve other aspects of the college’s learning environment to promote greater student success. In the long term, this feedback from SOAR assessment will likely produce significant changes in our set of interlocking academic and student life initiatives.
12
Proceedings of the 5th Annual National Symposium on Student Retention. Copyright 2009. C-IDEA, The University of Oklahoma.
References ACT. (2004) What Works in Student Retention – Four-Year Private Colleges accessed April 20, 2009
from http://www.act.org/path/postsec/droptables/pdf/FourYearPrivate.pdf ACT. (2008) Retention/Completion Summary Tables accessed April 15, 2009 from
http://www.act.org/research/policymakers/pdf/retain_2008.pdf American College Health Association (2008). National College Health Assessment II survey format
accessed April 1 from http://www.acha-ncha.org/docs/ACHA-NCHA_II_2008.pdf Braxton, J. (2006). Grounded Retention Strategies: Maximizing the Success of Your Student Retention
Efforts accessed from http://www.cic.edu/conferences_events/caos/2006_CAO_Resources/2006CAO_braxton.pdf
Bruffee, K.A. The art of collaborative learning. Change, 1987, (3), 42-17. As cited in Engstrom, C.,
Tinto, V. (2000). Developing partnerships with academic affairs to enhance student learning. In Barr, M., & Desler, M., & Associates (eds.), The handbook of student affairs administration (p. 425-425). San Francisco: Jossey-Bass.
Crissman Ishler, J.L. (2005). Today's First Year Students. In Upcraft, M.L., Gardner, J.N., Barefoot, B.O.
and Associates Challenging and Supporting the First-Year Student a Handbook for Improving the First Year of College (pages 15-26). San Francisco: Jossey-Bass
Crissman Ishler, J.L. and Upcraft, M.L (2005). The Keys to First-Year Student Persistence. In Upcraft,
M.L., Gardner, J.N., Barefoot, B.O. and Associates Challenging and Supporting the First-Year Student a Handbook for Improving the First Year of College (pages 27-46). San Francisco: Jossey-Bass
Cuseo, J. (2002) "Red Flags": Behavioral Indicators of Potential Student Attrition accessed from
http://www.uwc.edu/administration/academic-affairs/esfy/cuseo/ McClanahan, R. (2004). Review of Retention Literature Appendix 1. In What Works in Student Retention
accessed April 20, 2009 from http://www.act.org/path/postsec/droptables/pdf/Appendix1.pdf New York Times Online (2009) Transcript of remarks by President Obama to the Hispanic Chamber of
Commerce on March 9, 2009 retrieved on March 10, 2009 from http://www.nytimes.com/2009/03/10/us/politics/10text-obama.html?pagewanted=6&ref=politics)
Schulte, J.E. (2003, July) First Year Responders: Student Case Management at Lesley College. Paper
presented at the 16th International Conference on the First-Year Experience, Vancouver, British Columbia
Tinto, V. (1993) A Study of First Year Students and First Year Persistence at Cazenovia College
13
Proceedings of the 5th Annual National Symposium on Student Retention. Copyright 2009. C-IDEA, The University of Oklahoma.
Conquering the Great Divide
Student Success Is Student Retention
Harriett McQueen Enrollment Management and Academic Support Services Austin Peay State University
Abstract - In 2003, fall-to-fall retention of first-time, full-time freshmen at Austin Peay State University was the lowest among Tennessee universities. Changes in organization placed all enrollment management services and academic support services under one umbrella that regularly collaborates both with faculty and Student Affairs. Academic initiatives to promote student success include a mandatory “summer welcome” and freshman orientation; all new freshmen must enroll in a freshman seminar. In addition to admissions assessments, non-cognitive factors that may place students at risk of failure are assessed using the TCI index. An academic alert system available to faculty through Banner Self Serve, and a redesign of developmental studies that has received national attention by the National Council for Academic Transformation (NCAT) replaced non-university credit developmental studies. An Academic Support Center with peer tutoring, a writing lab, and on-line tutoring provides academic support to all students without an additional fee. Technology is used extensively in building successful communications with students. An Academic Alert system, incorporated into Banner Self-Service, enables faculty to refer students for academic support. In order to “tear down the wall” between student affairs and academic affairs, a reorganization of the university placed academic affairs and student affairs under the supervision of a university provost. Thus, a seamless unit now focuses on student engagement simultaneously with academic success. When new retention initiatives were first implemented, the benchmark for improvement was set at 2 % annually for the first two years and 5% in five years. In 2004, the fall-to-fall retention rate for first-time full-time freshmen was 61.01 percent. Four years later (Fall 2008), this rate had increased to 67.58 percent. Thus APSU has already exceed its benchmark by 1.57%. Introduction
The SACS Quality Enhancement Plan for Austin Peay State University (APSU) focuses on improving student retention by creating new initiatives that support student success. APSU’s fall-to-fall retention rates have been consistently 10 percent lower than the other four-year institutions in Tennessee. Approximately half of the new freshmen each year are first-generation college students who are entering unprepared for university-level academic responsibilities. About 85 percent of the 9400 students who attend APSU live within a 50-mile radius of the University in an area where both the educational attainment and family income are lower than the state average; 84 percent of students are commuters; approximately 48 percent of first time, full time freshmen expect to work off campus more than 30 hours per week. APSU also has the
14
Proceedings of the 5th Annual National Symposium on Student Retention. Copyright 2009. C-IDEA, The University of Oklahoma.
lowest six-year persistence-to-graduation rate in the state for first-time, full-time students, falling at times 10 percentage points below other Tennessee universities.
In anticipation of SACS reaffirmation (2002-2003) student retention was chosen through campus-wide discussions as the focus of a Quality Enhancement Plan. From these discussions emerged a three-part plan for improving student retention and success. First, a planning committee designed a freshman seminar to orient students to the University and to enhance the university’s then liberal arts mission. Entitled “Introduction to the Liberal Arts and University Life,” this course combined aspects of a traditional freshman experience course (e.g., emphasis on study skills, health and wellness, introduction to the library and student support services, etc.) with an overview of the content, goals, and value of a liberal arts education. Second, an academic advisement committee researched best practices in advising and recommended possible improvements to current advising procedures at APSU. Among this group’s recommendations were renewed emphasis on training for faculty advisors, new advisor incentives and accountability measures, the use of student peer mentoring to supplement faculty advising, and the development of an advisement center to handle the advising of undecided students. Third, a student life and support services committee reviewed current programs and operations that have an impact on retention, researching best practices in the field, and exploring recommendations for new plans and programs that have a potential to positively impact student retention and success. Finally, representatives from all three committees formed a group that investigated early alert procedures and recommended such actions as the establishment of an Office of Student Success to oversee intervention procedures for at-risk students. The 3-part plan resulted in 13 action items that included a tracking system to monitor the progress of each action item.
Student Success Initiatives Lead to Increases in Freshman Retention
The reports and recommendations of these student success committees were used to finalize the APSU SACS Quality Enhancement Plan and to develop a calendar of action for the Fall 2003 semester. Two new positions, a Director of Retention Services and a Minority Retention Coordinator, were created to provide leadership for implementing and sustaining the plan. Given the complexity of the retention issue and the multifaceted approach recommended by the student success committees, the SACS steering committee anticipated that multiple phases sustained over the course of several years would be needed to complete the implementation. Regular assessment of new initiatives would determine their impact on student retention. During the Fall, 2003 semester, the Director of Retention Services, guided by the QEP, led the work of a newly appointed retention task force, appointed by the university president, that included university-wide representation. They undertook the task of analyzing the status of the university in achieving the13 action items.
Coinciding with the implementation of the QEP action items in Fall 2003, Enrollment Management services were moved to Academic Affairs in order to recognize the importance of the offices of Admissions, the Registrar’s, and Student Financial Aid and Veterans Affairs in retaining students. This unit, with new directors, has placed service to students and faculty on a higher plane than existed before. Admission standards have increased; a category of admission, conditional admission, allows access for students in the region of Tennessee most served by
15
Proceedings of the 5th Annual National Symposium on Student Retention. Copyright 2009. C-IDEA, The University of Oklahoma.
APSU who are less well prepared to meet university requirements. Deficiencies in mathematics and writing are being addressed differently so that students no longer enroll in non-university level courses but address their deficiencies while completing core English and mathematics courses. While these are not “action items,” they are changes that have been made to better ensure that student success goals articulated in the Quality Enhancement Plan are met.
In 2006, an Assessment and Retention Analysis Council was formed. This group monitors the progress of student success initiatives and makes recommendations for changes. Through a secure web site, the Council may access assessment data as it is posted. During the spring 2008 semester, the Council has concluded an intense analysis of the progress of each of the 13 QEP initiatives and the impact of each on student retention. With the guidance of the Director of Institutional Research and Effectiveness, a computer-assisted tracking system was implemented to monitor the retention of first-time, full-time freshmen. It has evolved into a mature system for continuous assessment of variables, particularly those which place students at risk of dropping out.
The Freshman Seminar is the Foundation for Freshman Success
The design of the freshman seminar, APSU 1000: Liberal Arts in University Life, is based on best practices cited in research on the first-year college student and the work of Dr. John Gardner and others associated with the Policy Research Council at the University of South Carolina. Common among the practices of institutions who exceed their expected retention and graduation rates (DEEP institutions) is a freshman seminar. APSU first offered a freshman seminar in 2003 by piloting a three-hour credit class (LART 1000) in Fall 2003. The class was not mandatory, and only 161 (13.5%) of 1191 first-year freshmen were enrolled; 116 (72 %) of the students passed the course. 84 (52%) returned for the fall 2004 semester. The results of the pilot suggested that if the intent of the freshman seminar was to increase the fall-to-fall retention rate, the pilot needed to be redesigned so that the focus is on the transition to university expectations as well as issues that place students at risk of dropping out.
Once the redesigned freshman seminar was approved by the university’s Academic Council, a university committee, consisting of faculty and professional student affairs staff, developed the new course. This committee met regularly, participated in the First-Year Experience annual conference in Dallas in 2004, and developed a curriculum with a dual focus: the importance of the liberal arts and making the transition to university demands. A customized textbook was created. An assessment tool, freshman survey, was developed and approved as the instrument to administer as the course evaluation. Faculty and professional staff were recruited as course instructors. In order to prepare faculty for this new role, a day of faculty development was conducted by Dr. Connie Staley, Professor of Communications at Colorado State University and nationally known authority on freshman seminars. All first-time, full-time freshmen, any student entering the university with fewer than 12 credit hours, and transfer students entering who were required to enroll in two areas of developmental studies are required to enroll in APSU 1000. During the fall 2003 semester, 1,353 students enrolled in 51 sections. Four sections were designated for students in the housing complex, Hand Village, and two sections were designated for students in the Honors Program. The spring semester brings approximately 100 new freshmen; they, too, are required to complete APSU 1000.
16
Proceedings of the 5th Annual National Symposium on Student Retention. Copyright 2009. C-IDEA, The University of Oklahoma.
The Freshman Seminar is now a one-hour requirement (since 2004) in every academic program. Each section meets one day each week; students who enter with documented deficiencies in mathematics and writing must enroll in a section that meets two days each week and provides a more intense focus on study skills, test-taking, and time management. All sections are capped at 20 students, and each instructor receives a modest stipend for teaching the course.
At the end of the fall semester, the course instructors meet in a day-long workshop to review the results of the Freshman Survey to make recommendations for changes in APSU 1000. In the beginning, the greatest concern was the emphasis on the liberal arts mission and the textbook which was too lengthy to cover. After that first semester, both instructors and students had learned that the greatest values of APSU 1000 rested in its ability to ease the transition from high school to college and to give continuous academic advising until the students can be assigned to their permanent advisors. Discussions revealed the need for an assessment of non-cognitive factors that place students at risk of withdrawal that would be administered before students are influenced by their enrollment in APSU 1000. This assessment would enable course instructors to better know the students with whom they would be working. Another recommendation was that more discipline specific sections be offered. Thus, by fall, 2008 each department offered at least one section for freshman who intended to major in the discipline.
Since its inception in 2004, the freshman seminar continues to evolve. In 2005, peer mentors were added; they work in tandem with the course instructor to assure that students are able to navigate university processes, particularly in the use of technology required by the university. In 2006 a director of new student programs assumed the responsibility for staffing and curriculum development for APSU 1000 as well as the freshman orientation. The textbook has been eliminated and resources formerly in the textbook are now available in the D2L shell for APSU 1000. Faculty and staff contribute to the development of these resources. The CIRP assessment was used for 3 years as an attempt to track characteristics of successful students. In 2008, the TCI, which identifies the student’s non-cognitive factors that can impede success, replaced CIRP and is administered during Summer Welcome when students come for a brief orientation and to enroll for the fall semester. Course instructors have the data on their students when the semester begins. Special sections of APSU 1000 were added in 2008 for students with documented academic deficiencies who are conditionally admitted students. These sections meet two days each week and include a much heavier emphasis on study skill and time management.
Academic Advisement Guides Students to Good Decisions Tinto, Astin, Adelman, Kuh and others cite the importance of academic advisement in retaining students. QEP action items addressing academic advisement included a centralized unit for advising undecided students (3), mandatory advisor training (4), an accountability system providing for student evaluation of advisors (5). Data show that 479 undecided undergraduates were enrolled on the main campus in fall 2003 and 400 in spring 2004. To enhance the quality of advising for these students, two professional advisors were employed for the Career and Advisement Center, They advise all students who have not yet decided on a major. In addition they guide students through career exploration that occurs as a part of the APSU 1000 (Freshman Seminar) curriculum. The advisors also teach a section of APSU 1000 for undeclared students. Currently, each advisor sees approximately 400 students each semester. The advising process for undeclared students has been further refined with the development of forms, up-to-date web sites to explain services, and a data base to enable tracking of student activity.
17
Proceedings of the 5th Annual National Symposium on Student Retention. Copyright 2009. C-IDEA, The University of Oklahoma.
Students who have declared a major are advised within the departments that house their majors. As is true in many colleges and universities, some faculty are more heavily involved in academic advising than others. These faculty participate regularly in advising workshops to assist them in improving their advising skills in order to enhance the concept that Academic Advising is teaching. In 2005, Dr. Nancy King, NACADA consultant from Kennesaw State University, conducted a workshop entitled “Advising as Teaching” for department chairs and faculty who advise freshmen that focused on the quality of advising described in the mission and vision of advising at APSU. An advising syllabus was developed, submitted to NACADA for approval, and subsequently adopted as a model to be used by NACADA in workshops they conduct. Both faculty and staff have participated in NACADA summer institutions and other workshops.
In order to provide for greater accountability, an assessment of academic advising was developed by the Faculty Senate and Deans Council. It is an on-line assessment; students are invited to participate in the process immediately after priority advisement and registration ends each semester. Thus far, response rates have been low; however, insights have been gained and feedback provided to departments regarding the quality of advisement in their areas.
As the university migrated from the SIS+ platform for student information systems to the Banner platform, all training focused on preparing both faculty and staff to use the advising and enrollment tools available in Banner. Thus, advisor training addresses technology to assist in the advising process and the quality of academic advising as described in the mission and vision of advising at APSU. The Office of the Registrar continues monthly training in the effective use of AP Self Service and baseline Banner. In 2007, an advising council that includes all professional advisors as members began meeting three times each semester to assure better coordination of APSU advising services.
In fall 2004, all advisor lists were reviewed and updated; every student who had no
faculty advisor listed was assigned an advisor. Freshmen are assigned a permanent faculty advisor during their first semester through APSU 1000. The Faculty Senate was given the responsibility to develop an evaluation instrument; this was completed in Spring 2006 and was implemented (online) during the 2006-07 academic year. Although the participation rate was low, the comments were revealing. Anecdotal reviews of student/faculty advising sessions suggest that work is still to be done on improving the culture of advising at APSU.
Outstanding faculty advisors, who are selected by department chairs and deans, are recognized during the spring honors and awards ceremony. Department chairs recommended to deans the faculty in their departments who were especially attentive to quality advisement and who are skilled in advising students. The college deans, then, in consultation with the chairs and directors, select thirteen faculty to be recognized at the Spring Honors and Awards Day.
Early (now Academic) Alert Rescues Students in Academic Jeopardy
A cumbersome paper/pencil Early Alert System was implemented during the fall 2003 and continued through the spring 2004 semester. The few faculty who used the system referred students for non-attendance and poor performance in the classroom. An analysis of the students who were academically suspended or who were placed on probation indicated that students who needed to be referred were not. Furthermore, many students who were referred did not respond to the meeting request issued by the academic alert coordinator. The system proved to be
18
Proceedings of the 5th Annual National Symposium on Student Retention. Copyright 2009. C-IDEA, The University of Oklahoma.
ineffective and a very labor intensive process both for faculty and for the Academic Support office.
In fall 2004, an e-mail based system managed by a graduate assistant was implemented. Faculty participation increased but inefficiencies still existed. When comparing the lists of students referred with those who were placed on academic probation or suspended—the student population that should have been referred--very few names appeared. Discussions with faculty members revealed that many placed no faith in such a system to improve student retention and were, therefore, unwilling to take the time necessary to refer a student. Building a system into the student information system (SIS) was an additional burden for which Information Technology Services lacked the staffing.
Even with the continued use of a web-based system in the 2005-06 academic year, faculty participation began to increase. During that year, nearly 2000 students were referred to Early Alert; 51 percent were referred for excessive absences. A 0.2 point grade increase was noted in the average course of those students who responded by seeking tutoring or counseling. Furthermore, the retention rate among the students who responded was over 6% higher than those who did not respond. These results were encouraging, and the university budget was increased to provide more support for the system the following year. A part-time coordinator was hired to manage the referrals.
In order to develop an Early Alert system that would enable faculty to refer students with minimal effort, the office of Academic Support investigated systems used by other universities and worked with Information Technology Services to create a system connected to the faculty grade book in SIS. With the newly designed system, each faculty member was able to report students in academic jeopardy using a special column that was added to the class roll; the instructor could refer the student by simply choosing the reason for poor performance and typing in the corresponding code number. A data base file was updated nightly for the Academic Support office; the graduate assistant initiated the first contact with students the following day. Participation in the early alert system increased significantly. Subsequently, the Assessment and Retention Analysis Council recommended that the name be changed to Academic Alert so that faculty would understand that it was never too late to refer a student whose academic performance started to decline. This recommendation was approved by the president.
But the new system was short-lived; migration to the Banner platform began in fall 2007, and the Banner platform would not support the SIS system. Thus, in fall 2007, a web-based system was designed and implemented. Although it was not as cumbersome as a paper/pencil system, it lacked the ease of use characteristic of the grade-book based system. Furthermore, faculty who attempted to use the system often experienced difficulty with the technology. The number of students referred to academic alert plummeted to 340 students.
A major change occurred in fall 2008 with the discovery of an Early Alert system compatible with Banner and housed in the faculty member’s Self Service. A full-time coordinator was employed with a graduate assistant to assist during the peak times. When the faculty member files an alert, an e-mail is sent to the coordinator with a copy to the student. The coordinator attempts to reach the student and requests a conference to discuss academic performance. Many of those contacted are referred to the Academic Support Center for tutoring. Referrals were limited to 1000 and 2000 level classes so that the major focus would be on freshmen and sophomores. In addition, tutoring is more likely to be available for such courses. The implementation of this system brought about increased use and the number of referrals increased to approximately 1500. Included in Academic Alert is required submission of mid-
19
Proceedings of the 5th Annual National Symposium on Student Retention. Copyright 2009. C-IDEA, The University of Oklahoma.
term grades for 1000 and 2000 level courses. Students who have not already been referred who have a D or F at mid-term are contacted by the coordinator. Retention data is collected each semester in order to determine the impact when students are referred and respond. The Academic Support Center Curbs Academic Failure
The university makes peer tutoring available for most core courses in a centralized Academic Support Center at no additional cost to the student. The services provided include peer tutoring and a Writing Lab which supports students in any course, using any writing style. Created in 2001 as a Learning Center, the Academic Support Center has observed exponential growth in demand for support from students. From fall 2001 to fall 2008, the number of students supported increased from 179 to 1586 per semester, an average annual growth of 36.6 percent. By collecting, using, and sharing data, the Academic Support Center has been able to tailor the support provided to the needs of the students and focus support on individual students in a timely manner.
In 2007, the university eliminated developmental mathematics and writing and implemented Structured Learning Assistance (Ferris State University) as the venue for students to address their deficiencies. This program links mandatory workshops, supervised by student workers, with core mathematics and English courses in order to allow students to remove their mathematics and English deficiencies while earning core course credit. By combining technology with small group exploratory learning activities and review sessions, the workshops allow the university to provide support more efficiently than could be done with tutors.
Another innovation recently implemented at APSU is a Virtual Academic Support Center as the academic support system for online students and provides tutoring support for all students using D2L and Wimba. This service was piloted during the 2008-09 academic year. During the pilot, the service averaged 32 requests for assistance per week. By using student workers and existing technology to provide this support to our students, the Academic Support Center was able to reduce the cost of online support by $20,000 annually.
Peer tutors and Structured Learning Assistance peer leaders are selected only after a recommendation by the academic departments that house the courses for which peer tutoring is provided. Students who are selected must participate in a rigorous training program that focuses on content delivery and classroom management. Tutors generally work six hours each week and earn an hourly wage for their services.
Minority Retention Surpasses Overall Retention
APSU’s enrollment of African American students mirrors the percentage of African
Americans in the APSU service area. Although fall-to-fall retention rates for African American students are similar to the overall retention rate, graduation rates of these students continues to lag behind those of the student population as a whole. The fall-to-fall retention rate of black students saw an increase with the implementation in 2001 of special academic support initiatives, which were funded for five years by the state, as a result of the settlement of a 38-year old court case, Geier vs. Tennessee.
During the last year of Geier funding, a minority retention coordinator directed an academic support program that provided scholarships to African American students who were in
20
Proceedings of the 5th Annual National Symposium on Student Retention. Copyright 2009. C-IDEA, The University of Oklahoma.
academic jeopardy. Students “earned” the scholarship by committing to raise their cumulative GPA by participating in prescribed academic support initiatives. Approximately half of the students who began the program finished it and made the necessary gains to earn their scholarship.
The retention rate for the Fall 2003 cohort of white students (66.8% of the student population) was 62.48%; the retention rate for the Fall 2007 cohort was 66.85%, an increase of 4.37%. In Fall 2008, 61.7 percent of the student population was white; their freshman fall-to-fall retention rate for the Fall 2007 cohort was 66.8 percent. African American students represented 17.4% of the student population in 2003 with a retention rate of 57.62%. This increased for the Fall 2007 cohort to 68.8% or 6.76% greater gain than for white students. This increase in retention demonstrated that a strong academic support program does indeed affect student success.
Once the funding ended, the definition of minority retention was expanded to include all underrepresented populations. New scholarship opportunities were provided and were designed to increase the representation of these groups. The design of academic support initiatives was influenced by the initiatives that contributed to minority student success. The major thrusts for retaining minority student populations are the African American Culture Center and the Hispanic Culture Center. Both provide activities that are open to all students but reflect the culture of the minority population. Enrollment Management is Integral to Student Retention The importance of the service rendered to APSU students from admission to graduation is recognized by the university’s organization which places Enrollment Management and Academic Support Services under one dean who reports to the provost who is also the Vice President for Academic Affairs. Standards of excellence combined with an accountability system that includes an on-line assessment of service quality and evaluation of anecdotal comments have elevated the quality of enrollment management services including Admissions, the Office of the Registrar, and Student Financial Aid and Veterans Affairs. Regular meetings of the directors of these units with the directors of academic support units create a seamless process for students as they complete their APSU academic journey—from the time they are recruited to attend APSU until they leave with cap and gown in hand, ready to graduate, at the Grad Finale event. The “one-stop” created by locating all enrollment management services in one building, which is easily recognized and accessible, has greatly minimized the time students once spent going from place-to-place for these services.
When the decision was made by the Tennessee Board of Regents that all higher education institutions would migrate to the Banner platform for student information in 2005, the Enrollment Management unit was charged with significant responsibility for converting to Student Banner. Lengthy training sessions were required and staff worked many, many hours overtime implementing the system and providing much of the training for faculty and staff. The initial migration was complete by fall, 2007; however, work continues as Banner evolves to provide more services for both faculty and staff. Most recently, technology to improve academic advising has been the focus of faculty development.
Another significant change that impacts service is the Transfer Center, implemented in 2008 as a unit in the Admissions Office and Office of the Registrar. The transfer counselor who
21
Proceedings of the 5th Annual National Symposium on Student Retention. Copyright 2009. C-IDEA, The University of Oklahoma.
recruits students and oversees their progress through admission, orientation, and registration is housed in the Admissions Office while the Transcript Evaluator for transfer students in housed in the Office of the Registrar.
The Office of Student Financial Aid and Veterans Affairs serves 94 percent of the student population. They oversee all initiatives that provide funding for students to attend college including lottery scholarships, loans, Pell grants as well as an office that serves veterans who make up 15 percent of our student population. New technologies have been employed to better inform students of their financial aid status. This office now provides workshops that pertain to borrowing and the wise use of resources while in school. They visit all high schools in the area and conduct a Sunday workshop in February to assist prospective students in filing a FAFSA form. The Student Financial Aid and Veterans Affairs office is one of the busiest on campus.
In 2004 a new “Summer Welcome” program replaced the previous “Transitions” program and brought new students to campus for a brief orientation, academic advising, and enrolling for the fall semester. A more intense orientation, beginning with freshman convocation, now brings all new freshmen to campus for two days immediately preceding the beginning of the fall semester. As a cooperative effort between the Academic and Student Affairs divisions, new students meet with the other students in their APSU 1000 sections for small group activities and with larger groups for non-academic activities. The purpose of the orientation is to prepare students for their classes and to create a level of confidence needed for success. Students are introduced to all academic support services as well as other student services such as the Health Center, Recreation Center, and Counseling Center. They review the code of conduct and academic requirements that affect the entire campus.
Student Affairs and Academic Affairs Strengthening Partnership
Student Affairs became involved once again in the new student registration program at APSU – Summer Welcome. The Dean of Students and Director of New Student Programs now jointly select and train the student Orientation Assistant. The Office of Housing, Residence Life, & Dining Services is providing an overnight option for students to stay in the residence hall during selected Summer Welcome sessions. The Director of Student Affairs Programs and Services has revived the dormant parent program to become APPA – Austin Peay Parent (Family) Association. Student Affairs is also supporting Summer Welcome with the design and publication of a New Student Guide distributed during the program, facilitation of two parent panels, and evaluation of the experience of both parents and students. Other Student Affairs initiatives and collaboration with academic departments include:
• designating two buildings in one of the residence areas for new freshmen only and linking to APSU 1000 sections taught by Student Affairs professional staff;
• notifying the Associate Director of Housing/Residence Life if student lives on campus and has not responded to other Academic Alert contacts;
• allowing new transfer students to check-in the residence halls early with new freshmen and participate in welcome activities if desired;
• recruiting faculty to participate in the Housing/Residence Life “Welcome Wagon” move-in event for new students;
• establishing AP Reads program using faculty to moderate discussion groups and connecting to academic courses/departments as appropriate;
22
Proceedings of the 5th Annual National Symposium on Student Retention. Copyright 2009. C-IDEA, The University of Oklahoma.
• expanding the AP Reads program sponsored by Student Life & Leadership to a common reading program through APSU 1000 for all first-time freshmen;
• providing grants from student activity fee funds to academic departments to host welcome events for their new students;
• hosting social activities for new freshmen during Orientation weekend such as a Luau and Dive-In Movie at the recreation center pool;
• publishing three newsletters during the academic year sent to the parents of first-time freshmen highlighting adjustment/transition issues and important deadlines;
• increasing travel stipends available to students who will be representing APSU and academic departments attending conferences and/or presenting papers/research;
• initiating Global Govs Passport series by Student Life & International Education and encouraging co-sponsorship or support from academic departments;
• making the Child Learning Center available for use by academic departments and classes for projects and as an educational lab;
• having faculty director of the Hispanic Cultural Center while providing administrative supervision and support from Student Life; and
• enhancing the assistive technology available through the Office of Disability Services.
As student retention and graduation rates in colleges and universities continue to rise in importance in state and national-level discussions, APSU seeks to achieve a proper balance between serving under-prepared students, who are limited in access to higher education by distance to a community college, and improving retention and graduation rates. Retention efforts since 2004 have been most heavily focused on students entering as first-time, full-time freshmen (fewer than 12 college credits.) Retention data is submitted to the Consortium for Student Retention Data Exchange (CSRDE) for analysis and comparison with peer institutions nationwide. When compared with 9 self-selected CSRDE peer institutions, APSU ranks 8th in fall-to-fall retention. When compared with 15 generated peer institutions in College Results.org, APSU ranks 11th. When the QEP was implemented in Fall 2004, the fall-to-fall retention rate (2003 freshman cohort) was 61.01%; the rate rose to 67.59 % for the Fall 2007 cohort. Thus APSU exceeded the 5th year benchmark after 4 years by 1.58%. Students who enter with no academic deficiencies are retained the following fall at 71.3% . Students entering with remedial level deficiencies are retained at 53.3%, and students entering with deficiencies at the developmental level are retained at 64.4%. Student success is the pinnacle of strategic planning at APSU, the focus of discussion in the President’s Cabinet, and continually emphasized in both Academic Affairs and Student Affairs initiatives. Retention data for APSU can be viewed by visiting http://www.apsu.edu/ire/stats/APSURetentionReportSpring2009.pdf
23
Proceedings of the 5th Annual National Symposium on Student Retention. Copyright 2009. C-IDEA, The University of Oklahoma.
Bibliography
Barefoot, B., Cutright, M., Gardner, J., Morris, L., Schroeder, C., Schwartz, S., et al. (2005). Achieving and Sustaining Institutional Excellence for the First Year of College. San Francisco. Jossey – Bass.
Kuh, G., Kinzie, J., Schuh, J., Whitt, E., et al. (2005). Student Success in College: Creating
Conditions that Matter. San Francisco. Jossey – Bass. Habley, W., McClanahan, R., (2004).What Works in Student Retention? Four Year Public
Colleges. ACT Information for Life’s Transitions. Lotkowski, V., Robbins, S., Noeth, R., (2004). The Role of Academic and Non-Academic
Factors in Improving College Retention. ACT Information for Life’s Transitions. Seidman, A. (2005). College Student Retention: Formula for Student Success. Westport, CT:
American Council on Education and Praeger Publishers. Sungard Higher Education. SunGard Summit 2008. Supporting Student Retention: Early Alert
(0640). Blake Mackesy, M.A., Director of University College, Wilkes University. April 15, 2008. http://www.softconference.com/sungard/sessionDetail.asp?SID=108569
Department of Institutional Research and Effectiveness at Austin Peay State University,
Retention Report http://www.apsu.edu/ire/stats/APSURetentionReportSpring2009.pdf Austin Peay State University Bulletin, 2008-2009. (USPS 072-040) is published yearly by Austin
Peay State University, P.O. Box 4548, Clarksville, TN 37044: Volume 78, No. 1, June 2008. page 27.
Austin Peay State University Quality Enhancement Plan. February 20, 2004. pages 1-36. The National Center for Academic Transformation. The Learning MarketSpace. “Tennessee
Board of Regents: Developmental Studies Redesign Initiative. Austin Peay State University”. July, 2009. http://www.thencat.org/States/TN/Abstracts/APSU%20Algebra_Abstract.htm#FinalRpt
National Academic Advising Association (NACADA). Kansas State University. Manhattan,
Kansas. http://www.nacada.ksu.edu/. 1990 – 2008. Terenzini, P., Reason, R. Parsing the First Year of College Year 3 Progress Report. Center for
the Study of Higher Education. Pennsylvania State University. University Park, PA. December 31, 2008. Pages 1 – 33.
College Results Online. The Education Trust. 2009.
Abstract - This exploratory study was designed to examine the 2006-2007 qualitative and quantitative data of community college students enrolled in face to face (F2F) and online student orientation programs. The purpose of this study was to determine if the presence of an F2F orientation would increase the retention rates of students in an online course. The study also examines whether certain demographics will influence the retention rates of students in an online course. Conclusions from this data research must be taken as preliminary and require additional investigation. However, there were indications from evaluations, interviews, and retention reports that F2F orientations had an effect on the retention of students in online courses when compared to students who completed an online orientation. Introduction
The primary goal of any higher learning institution is to provide exceptional training and learning opportunities and experiences for their students that prepare them for real life challenges. One important factor that helps college to achieve that goal is the learning atmosphere established, both academically and socially, that enables students to work their way through and come out of programs with flying colors. Factors such as retention and course completion can not be ignored when referring to students’ success rates.
The Center for Distance Learning (CDL) conducted a research study to find out the student retention rate in online learning. CDL used the student orientation which is the most frequently used intervention strategy in community colleges to determine the retention rate of students. Astin (1993) and Tinto (1993) stated that students are more likely to have academic success if they are integrated into the social and academic systems of the college/university.
Purpose This research study was designed to examine the 2006 -2007 academic year data on students
enrolled in the CDL Student Orientation program. The purpose of this study is to discover whether there is a relationship in the methods used to teach the student orientation (e.g. online versus face-to-face).
The study also examined the impact that the face to face student orientation has on student retention in a course and how academic and social factors affect the outcomes. According to the Tinto’s model of student retention whether a student persists or drops out of a course is quite strongly predicted by their degree of academic integration, and social integration (Drapper, 2005).
25
Proceedings of the 5th Annual National Symposium on Student Retention. Copyright 2009. C-IDEA, The University of Oklahoma.
Participants
The researchers conducted the study using a diverse population of male and female students
taking distance learning credit courses with the one of the City Colleges of Chicago (CCC). The target population was segmented into distance learning students who completed an online
student orientation and those who completed a F2F orientation. In order to be included in the study, distance learning students had to meet the following criteria: (a) enrolled in at least one online credit course during the Summer 2006-Spring 2007 academic year, (b) had a complete student profile (no missing data) in PSSA (PeopleSoft), and (c) had a completed CDL contact form. CDL students who had incomplete data in PSSA or on the CDL contact form were not included in this study. Based on the required criteria, data from 105 distance learning students were included in this study. Research Design
The research was conducted over three semesters namely Summer 2006, Fall 2006 and Spring 2007. The data collected was categorized by method of instruction (e.g. traditional, online), and student retention rates. The study provided a data comparison of the impact of a face to face distance learning student orientation on students’ retention rates in an online course (e.g. Are student retention rates in a course higher for those who participated in a face to face or online orientation?).
An online orientation evaluation and telephone interviews were used to gather quantitative and qualitative data. Immediately after the orientation, participants were initially asked to evaluate the course content and instruction.
The data collected assisted the researchers to determine if the student orientation is focusing on the correct objectives and information (e.g. technology, academic, personal) and if not, make the necessary modifications and revisions.
Methodology The research study was conducted in three different phases. In Summer 2006, the researchers
conducted the pilot study using only students who were enrolled in Business 181(Financial Accounting) at one of the City Colleges of Chicago. During this pilot, Business 181 student data collected from the CDL contact form indicated that the majority of the students enrolled in this course had taken no more than a maximum of two (2) online courses. Business 181 students were informed about the availability of the CDL student orientation through the Blackboard (Bb) course announcement board. Participating students were given an opportunity to take the CDL student orientation online or attend face-to- face session. Participants were informed that their participation in the pilot was voluntary. However, they were awarded 5 extra points by the course instructor if they did complete the CDL student orientation (online or face-to-face).
At the end of the both methods of orientation, participants were asked to complete an online
evaluation which provided a rating of the course components and instructors (if applicable). Each orientation (online/face-to-face) included a statement of consent that described the purpose of the study and the participants’ rights to include or exclude themselves from the study. Participants were also informed that they might be randomly selected at a later date to participate in telephone interviews with the researchers.
26
Proceedings of the 5th Annual National Symposium on Student Retention. Copyright 2009. C-IDEA, The University of Oklahoma.
Table 1.0 shows a summary of the information gathered at this phase.
Table 1.0
Phase two of the study took place during Fall 2006. The researchers conducted this study using a larger population of CDL students enrolled in a distance learning credit course. Three sections of English 101(Composition I) were selected for the second phase of the study. The choice of this target population was based on the criteria previously mentioned. Once again, participation in the selected orientation was voluntary, however; students who part in the orientated were awarded 5 extra points by the course instructor to encourage participation. Table 1.1 shows a summary of the information gathered at phase two.
Fall 2006 - English 101 online courses
Face to face Orientation Online Orientation
Number of students
15 18
Retention rate 83.3% 77.5% Table 1.1
The next phase of the study involved all CDL students that were enrolled in the online course
sections at one of the campuses. The same criteria for selection were used and extra credit points were awarded as in the previous pilot studies. The table 1.2 below gives a summary of the outcomes.
Table 1.2 shows a summary of the information gathered at phase three.
Spring 2007 - CDL online courses at one of the CCC Face to face Orientation Online Orientation Number of students
22 25
Retention 86.8% 73.3%
Table 1.2
Instrumentation The quantitative and qualitative instruments used in the study were the orientation evaluation and
telephone interview. The orientation evaluation presented a series of questions about the CDL student orientation course and the CDL staff instructors. Students were asked to complete the evaluation at the end of the orientation. Participation was voluntary. There were 20 evaluation questions that took
Summer 2006 - Business 181 course Face to face orientation Online orientation
Number of students
12 13
Retention rate 82% 76.5%
27
Proceedings of the 5th Annual National Symposium on Student Retention. Copyright 2009. C-IDEA, The University of Oklahoma.
approximately 10-15 minutes to complete. Each question in Part I and II also included a section where the student could provide additional comments and recommendations (qualitative data).
The telephone interview questions (10) were inquiry-based and directed towards the orientation course content in relation to the academic and social integration factors as stipulated in Tinto’s model. The questions in part I were directed towards the participant’s satisfaction with the course experience and Part II questions focused on the participant’s completion of the course, or when the participant withdrew from the course (if applicable) and the participant overall satisfaction with the course experience. The telephone interview could be conducted in 15-30 minutes depending on the length of each participant’s response. The researchers interviewed about twenty percent (20%) of the total target population.
At the end of the study, all orientation evaluation and telephone interview questions were analyzed and reported on separately based on the percentage of response for each item. The evaluation survey used was originally developed in 1997 for Harold Washington College (one of City Colleges of Chicago) by the Office of Research and Planning. Survey items have been modified over the years to improve clarity of items and address changes in course/college objectives. The Office of Research and Planning oversees the review of the survey for content and validity. The telephone interview questions were developed by the researchers based on the CDL student orientation content and its relationship to Tinto’s theory of retention.
Although the original 1997 orientation survey questions were used to guide the online evaluation and telephone interviews, the telephone interviews provided an opportunity for the research to gain a greater depth of information on factors influencing student decisions. The interview questions were validated by identifying and interviewing eight CDL students volunteers who previously had taken the online orientation but had not participated in the study. They agree to an interview with the researchers to test the validity of the orientation interview questions. After these interviews were conducted it was determined that several questions needed to be modified to gain the intended response for which the question was designed. In most cases only follow up questions were added (e.g. why, why not) to provide sufficient feedback on the top or tutorial in question. These modifications provided the researchers the freedom to build a conversational style, explore, probe and ask questions that clarified a particular topic or subject area.
Data Collection Data collection was kept confidential, no names or identifying information was used in this study.
Telephone conversations were taped or transcribed. However all associated materials were destroyed after the data analysis was completed.
Data Analysis Data analysis was conducted using descriptive statistics and distributions to examine all variables.
The researchers used a data analysis software (e.g. SPSS) for this purpose. Quantitative responses from the evaluation questions were compiled and presented in a table format. All qualitative data from the telephone interviews were grouped together based on key themes. The key themes will then be integrated into a narrative description.
Findings
This study was designed to determine how a distance learning F2F orientation could be used to improve student retention in an online course. Specifically, the research questions guiding the study were:
28
Proceedings of the 5th Annual National Symposium on Student Retention. Copyright 2009. C-IDEA, The University of Oklahoma.
1. Does the presence of a F2F orientation increase the retention of students in an online course? 2. Do certain social factors influence the retention rates of students in an online course? 3. What elements in a F2F orientation do students report as the most effective?
In this study, retention was defined as the percentage of students who continue participation in a
learning event to completion, which, in higher education, could be a course, program, institution, or system. The learning event for the purpose of this study was identified as an online course. Finally, social factors are demographic variables such as race, gender, and age.
Over the years, a number of researchers have discussed the importance of a successful college experience, which increases students’ commitment to college and course completion (Cueso, 1991, 1997; Gardner, 1986; Sax et al., 2000; Tinto, 1987, 1993). Other studies also examined retention in a community college environment and focused on the increase in retention as one of the most important outcomes of a student orientation (Gardner, 1986; Glass & Garrett, 1995; Zimmerman, 2000).
The results of this study indicated there were some statistical difference in the retention rates between online students who completed a distance learning F2F orientation and those who completed an online orientation over an academic year.
The demographic factors of this study did not appear to interact with the effect of the F2F
orientation as they were not significantly related to the retention status. This result is consistent with researchers (Powell et al., 1990) who attempted to measure the relationship of particular demographics to student success, as measured by levels of retention and achievement.
Because the demographic factors of this study showed no direct influence on whether a student
was retained or not retained in an online course, it appears--based on the qualitative data--that the retention increases were primarily associated with the treatment (F2F orientation) that was applied in this study.
Telephone interview results showed that 80% of the interviewees agreed that attending the F2F student orientation prepared them adequately for their online courses. Factors that were identified by students as most effective in this course preparation were the use of a readiness quiz, reviewing goal-setting strategies, providing a clear definition of online learning, and the discussion on basic computer skills. Interviewees (85%) expressed their satisfaction with the information that was provided in the F2F orientation. The information that was seen as most effective in the F2F orientation was overcoming personal barriers, time management, financial aid resources, understanding learning styles, and the Bb tutorials. The interviewees also indicated that faculty-to-student interactions during the orientation and the opportunity to participate in F2F instruction were important.
Table 2 (code sheet) below, is a summary of the telephone interview responses organized by major themes: course readiness, course satisfaction, and other considerations. Each major theme is followed by several key factors (e.g., A, B, C). The process for identifying themes and factors from the interview responses was facilitated by the use of the F2F orientation task list. A sample of the telephone interview responses (see B) that characterized the students’ view of the F2F orientation are organized and coded in Table 2.
29
Proceedings of the 5th Annual National Symposium on Student Retention. Copyright 2009. C-IDEA, The University of Oklahoma.
Table 2 - CDL Telephone Interview Code Sheet
1. Readiness 2. Satisfaction 3. Other
Considerations A. Expectation of online learning
A. Flexibility A. Self-preparation and independence
B. Understanding of online learning
B. Informed of process B. Course support
C. Skills needed C. Student-to-acuity interaction C. Personal issues
Readiness: Overall, 80% of the telephone interviewees agreed that attending the F2F student orientation was quite helpful and prepared them adequately for their online courses. One effective element of the F2F orientation that was identified by the telephone interviewees was readiness for online learning. Responses to this element included:
1. “The readiness quiz questions made me aware of what to expect as an online student.” 2. “The goal setting materials covered helped me a lot. Without that knowledge, I couldn't have been successful at all. I needed those skills to perform effectively as a student.” 3. “The definition provided in the orientation was very clear. . . . This course was a lifesaver. My understanding of what was expected of me changed once I completed this course.” 4. “I wanted to perform well as a student, and this course gave me the confidence that I could do it,”
“I learned that if I did not have at least basic computer skills, it would be difficult for me to pass the course. I also learned that good keyboarding skills are important since you have to type, and I knew that I would need to find a way to improve my typing skills.” Some students (10%) found the F2F orientation was not effective in preparing them for online
learning. They expressed concerns that after starting their course, they still did not fully understand what was involved in taking an online learning course.
1. I really did not have a good understanding of online courses. I thought I would be able to do everything when I was ready but found out that I was wrong and there were due dates I had to follow.
2. I still did not have a real understanding of how much reading and writing was involved in taking an online course. I was overwhelmed with the amount of time it took to read what needed to be completed and then prepare the assignment.
Other important factors identified by telephone interviews (10%) were the understanding of the processes (e.g., time commitment, due dates), precise expectations in an online learning environment (e.g., text base), and adequate preparation to meet online format (e.g., keyboarding and writing skills).
Satisfaction: The element that gave interviewees the highest level of satisfaction (85%) with the
F2F orientation was the opportunity to participate in a F2F environment. They expressed their satisfaction with the types of information that were provided during the F2F orientation and indicated that they were glad they had attended the session.
Some participants (20%) expressed concerns because they were not able to contact their online course instructors immediately. Each interviewee’s online experience was unique, and the following are some examples of the interview comments that were provided to the researcher.
30
Proceedings of the 5th Annual National Symposium on Student Retention. Copyright 2009. C-IDEA, The University of Oklahoma.
1. The information on personal barriers was helpful. I learned that time scheduling will make you a good student and students who have a study schedule find themselves better able to keep up with their assignments. I also learned that you have to be prepared for not always being able to get your instructor when you need them; they have 24 hours to get back to you. That meant I had to plan for that, too. I did this, and I only missed one assignment in the semester.
2. It provided me with some tricks on how to get more financial aid and other online strategies, which I used to successfully to complete my course.
3. The Blackboard tutorial was what I needed. I could go back and look at it even after my class was over. I was still confused about the digital dropbox feature, but I kept on referring to the tutorial, and it worked out fine.
4. I struggled with my online class at first, but I kept reviewing the online strategies she gave me (like taking charge and contacting my professor when I did not understand something, using technical support). At the end, I successfully completed my course. . . . I stopped feeling stupid; I knew it was okay to ask for help, and I also learned how to help myself.
5. The biggest challenge in taking these courses was not having regular contact with my instructor. In the orientation, my instructor discussed ways to build support networks because feedback from the instructor might not always be immediate. . . . This made me feel more confident that I could do this.
Other considerations: Some participants (30%) expressed concerns directly related to academic barriers (limited knowledge of resources, motivation) and personal barriers (financial, work, family).
1. I dropped my first course because I just was not prepared for online courses. It was not because the class was not good and did not have good information; it was because I had money problems, work problems, and my babysitter was just not reliable.
2. I think if I had paid more attention to the information that was given me in the class and taken it seriously, I would have done a better job the first time. I was annoyed because I had to do it. I am now a much better student. I took the F2F orientation class two times, and now I think I really understand what resources are available to me. I did not use the technical support. I use the CDL helpdesk a lot now, and they answer all my questions, even the ones that are more about the college, not just CDL.
3. There was a lot of useful information in the orientation, but I forgot to use it when I really needed it. I had a hard time managing my time with work, and there were lots of information on time management, things that I did not realize I had access to. I did not really listen and understand it until after I was dropped from my course. I am using it now. I have taken several online courses since my first semester, and I have finished them all and gotten passing grades.
Overall, students who participated in the F2F orientation had a higher satisfaction rating on the orientation evaluation than did the online group. The telephone interviewees acknowledged that the F2F orientation did prepare them for online learning and agreed that the orientation allowed them to complete the course successfully. The findings are supported by research studies that encourage the development of orientation courses for online students because learning online requires different skills (e.g., introduction of new communication patterns). Berge (2001) and Willis (1992) discuss the skills required of online
31
Proceedings of the 5th Annual National Symposium on Student Retention. Copyright 2009. C-IDEA, The University of Oklahoma.
learners and emphasize the need for students to be adequately oriented to an online environment in order to increase student retention and success. Recommendations for Future Research
The findings in this research have had an impact on the administration and delivery of the F2F and online orientation programs for the CDL. Areas under investigation and implementation include distance learning admission requirements, methods of instruction, orientation of instructors, and changes in the delivery technology.
CDL has already started implementing some of the recommendations such as:
• Emphases are being placed on building relationships and the “learning community”
because of students physical isolated from each other. • The use of Elluminate (web-based conference tool) is now an integral part of instructions
where instructors are required to hold at least two sessions a semester. • Instructors are now required to take more online professional development courses before
they are assigned CDL courses. • Online student orientations are redesigned to include more live meetings (video
conferencing software) and incorporate additional features from the F2F student orientation.
CDL is working on the following:
• CCC admissions procedures for online students are being reviewed by CDL administration. Possible prerequisites for admission into online courses, such as, a minimum score on reading and writing assessment tests, which are administered during student enrollment, are under consideration.
• DVD resources for distance learning instructors that encourage the implementation of desired factors into all CDL courses are being developed.
• Procedures for monitoring distance learning students for early warning signs of possible course withdrawal and for providing online counseling and advising are being developed
• CDL administration are working on the exit interview questionnaires for students who do not complete online courses to determine causes and provide ongoing reports to determine appropriate strategies for recurring issues are .
Summary
This study has explored the evidence to determine whether students were learning from their F2F orientation experience and whether this method of orientation resulted in higher student retention in an online course. The researcher processed students’ experiences through interviews and evaluations to determine which factors in the F2F orientation influenced these students.
The F2F orientation was effective in helping distance learning students adjust to the processes and procedures associated with taking an online course and, as a result, complete their online course. Higher course retention of students who received F2F orientations in comparison to online orientations provided indications that this method of instruction would provide promising results with further research.
32
Proceedings of the 5th Annual National Symposium on Student Retention. Copyright 2009. C-IDEA, The University of Oklahoma.
The retention findings for students who completed the distance learning F2F orientation showed that this support system provided some level of success in helping students transition into online learning. The findings also demonstrated a level of student success, especially considering that students self-reported that they thought they were underprepared for a college-level curriculum and online learning.
Finally, this study provided a holistic approach by examining and describing the influence of sociocultural factors and their relationship to retention. It is hoped that this study can serve as a foundation for continued study of the effectiveness of F2F orientation programs.
33
Proceedings of the 5th Annual National Symposium on Student Retention. Copyright 2009. C-IDEA, The University of Oklahoma.
References
Astin, A. (1993). What matters in college: Four critical years revisited. San Francisco: Jossey-Bass.
Berge, Z. (ed.) (2001). Sustaining Distance Training. San Francisco: Jossey-Bass.
Cueso, J. B. (1991). The freshman orientation seminar: A research-based rationale for its value, delivery, and content (Monograph No. 4). (ERIC Document Reproduction Service No. ED334883)
Cueso, J. B. (1997). The freshman orientation seminar at community colleges: A research based rationale for its value, content, and delivery. (ERIC Document Reproduction Service No. ED411095)
Drapper, S. (2005, September 19). Tinto's model of student retention. Retrieved December 9, 2006, http://www.psy.gla.ac.uk/~steve/localed/tinto.html
Gardner, J.N. (1986). The freshman year experience. College and University, 61, 262-274.
Glass, J. C., & Garrett, M. S. (1995). Student participation in a college orientation course, retention, and grade point average. Community College Journal of Research and Practice, 19(2), 117-132.
Powell, R., Conway, C., & Ross, L. (1990). Effects of student predisposing characteristics on student success, Journal of Distance Education, 5(1). Retrieved October 23, 2006 from http://cade.icaap.org/vol5.1/ 8_powell_et_al.html
Sax, L. J., Gilmartin, S. K., Keup, J. R., DiCrisi, F. A., III, Bryant, A. N. (2000, October). Designing an assessment of the first college year: Results from the 1999-2000 YFCY pilot study. Higher Education Research Institute, Graduate School of Education and Informational Studies, Los Angeles, CA.
Tinto, V. (1987). Leaving college: Rethinking the causes and cures of student attrition. Chicago: University of Chicago Press.
Tinto, V. (1993). Leaving college: Rethinking the causes and cures of student attrition. (2nd ed.). Chicago: University of Chicago Press.
Willis, B. (1992). Strategies for teaching at a distance. ERIC Document Reproduction Service No. ED351008).
Zimmerman, A. (2000). A journal based orientation course as predictor of student success at a public two-year technical college. Journal of the First-Year Experience & Students in Transition, 12(2), 29-43.
34
Proceedings of the 5th Annual National Symposium on Student Retention. Copyright 2009. C-IDEA, The University of Oklahoma.
How Well Do Remediated Students at 4-Year Institutions Fare in Terms of Persistence to Degree?
Abstract. This paper is an examination of a system-wide remediation policy’s impact on promoting higher graduation rates across the California State University. To assess the efficacy of the policy, graduation rates for first-time undergraduates who were not proficient at entry (i.e., they had to take remediation classes) were compared to graduation rates for first-time undergraduates that were English or math proficient at entry (i.e., they did not have to take remediation classes). The all important assessment was identifying those students that successfully completed their remedial work. The assumption was that if students that gained proficiency by taking remedial courses earned degree at the same rate as students that were proficient at entry, then the policy would seem to be working as expected. Separate results were computed for those that needed remedial instruction in math, English, or both subjects.
Introduction
Do remedial courses in math and English at higher education institutions promote academic success? At this time, there doesn’t seem to be a consensus answer. Remedial staffs can always be counted upon to provide anecdotal evidence of success stemming from participation in their programs. However, their claims are often countered by the anecdotal observations of faculty that teach the upper division curriculum. Editorial remarks on the opinion-pages of higher education publications continue to be full of negative accounts related the presence of remedial courses on college campus and university campuses. Sometimes these unfavorable critics seem to have found support in the findings generated from national studies that have tracked high school students through their college-going years. For example, Attewell et al. (2006), using NELS 1988 data, found that about 70 percent of under-prepared students passed the reading and writing remedial courses they were required to take; but, just 30 percent passed all of their remedial mathematics courses. Then, of course, there is Adelman’s often reported finding of the negative linear relationship between the number of remedial courses taken and eventual graduation (1999). Unfortunately, the findings from evaluations remedial programs have not provide many helpful facts. As many scholarly observers have noted before, most evaluations of remedial programs have had fatal methodological flaws in their research designs (Bailey & Alfonso, 2005; Grubb, 2001). The intent of this study is to describe one case where participation in remedial courses was positively related to long-term academic success: bachelor’s degree attainment at the California State University (CSU. The foundation for the study is not the results of prior research; rather, it is the ingredients for a sound assessment of remedial education outcomes. The study was initiated well before Levin’s et al. (2008) review of evaluation practices was published. Nevertheless the study contains many of the suggestion puts forth by Levin and company. The design’s key assets are: 1) the statistical findings go beyond the simple comparison of remedial and non-remedial students, and 2) the statistical findings also include observations of students that did not complete their remedial courses. The other major methodological assets are a by-product of the CSU policy concerning who needs remediation. The selection criteria are based on common test scores and testing is mandatory.
35
Proceedings of the 5th Annual National Symposium on Student Retention. Copyright 2009. C-IDEA, The University of Oklahoma.
What is Proficiency? Remedial courses, no doubt, have been a component of instruction at the campuses of CSU since the system of comprehensive schools was created in 1960. Since 1984, however, CSU has had a standardized remediation policy for new freshmen that were judged to be under-prepared for college-level instruction in math or English. The policy was amended in 1996, when universal testing before enrollment became a mandatory provision. It was amended again in 2000 when under-prepared students were given just one year to complete their remedial instruction. Who is directed to take CSU remedial courses is based on an assessment of proficiency, where proficiency suggests being prepared to engage the lower division. Students that score above established cut-off scores from as set of pre-identified tests are deemed proficient, and therefore exempt from taking any remedial course work. So only those that score below the cut-offs are required to successfully complete one or more remedial courses before they are allowed to enroll in math or English courses that are part of the general education curriculum. In more specific terms, math proficiency is defined as mastery of number and data, algebra, and geometry; in other words, three years of high school math preparation. English proficiency is defined as reading comprehension, vocabulary in context, logical relationships, and composing skills; in short, four years of high school English preparation. In operational terms, proficiency is determined by test scores. The enrolled students in this study that scored 550 or above on both the SAT math component and SAT verbal component were deemed to be math and English proficient. The comparable scores for ACT test takers were 24 and above on both the math and English components.
Table 1. Proficiency Cut-Off Scores at Selected Institutions
Campus SAT Cut-Off Score ACT Cut-Off Score Web Site Source UC Berkeley
Verbal 680 English 30 http://www-writing.berkeley.edu/newsite/awpexam.htm
As the table above indicates, what constitutes math and English proficiency varies across
institutions. At UC Berkeley, California’s flagship doctoral institution, an SAT score of 680 results in an exemption from a remedial English course. At a Florida State campus, on the other hand, an SAT score of just 470 will earn a student an exemption from a remedial English course. So the definition of proficiency is the first contextual variable for framing the results associated with CSU students that entered as new freshmen. Proficiency at the CSU is below the standard set by a very selective research university, but it is higher that the standards set by two similar university systems. The Success Indicator and Comparison Groups The study’s outcome variable is baccalaureate attainment, but the indicator is not the six-year graduation, the measure that has become the standard for reporting graduation rates. The CSU allows for part-time enrollment. The average number of semester-units attempted each term is about 12. Among completers, more that 75 percent of all degree recipients attain a baccalaureate in six years or less, regardless of whether they remained at their origin campus or transferred to another CSU campus; so about one-fourth
36
Proceedings of the 5th Annual National Symposium on Student Retention. Copyright 2009. C-IDEA, The University of Oklahoma.
of graduates earn their degrees after six years have elapsed from their matriculation date. To capture the attainments of the part-timers that earn degree, a proxy for an eventual graduation rate was created. Data from scores of historical freshman cohorts at the CSU have confirmed that the sum of the 6-year graduation rate and the 6-year continuation rate yields a very accurate estimate of the eventual graduation rate (i.e., a 12-year rate). The 12-year tracking data displayed below, derived from the fall 1994 cohort of regularly-admitted, first-time freshmen, illustrate the reliability of the surrogate measure. To further minimize the number of censored graduation events, degree recipients were counted even if the degrees or (or implied degrees) were associated with a CSU other than the origin campus at matriculation.
Table 2. Surrogate and Observed Graduation Rates Rate Earned a degree at origin CSU campus Earned a degree at any CSU campus a. 6-year graduation 0.411 0.451 b. 6-year continuation 0.104 0.136 c. Surrogate measure (a+b) 0.515 0.587 d. 12-year graduation 0.527 0.604 e. Difference (c-d) -0.012 -0.017 Source: CSU Statistical Abstract (2007, Table 140).
The key to the analysis was the ability to discern which remedial students were able to complete the prescribed pre-college courses during their first academic year. The three basic contrast groups were: 1) those proficient in math and English at entry, 2) those successfully completing remedial coursework by the end of their initial years of study, and 3) those that did not successfully complete remedial coursework during their initial first year. The basic analysis scheme was applied to the full cohort of first-time freshmen and then replicated for females, males, Latinos, African Americans. For the full cohort, complimentary contrasts also were done for subgroups of remedial students that did not demonstrate proficiency at entry in 1) just math, just English, and 3) both math and English. Those comparisons provided checks for discipline-specific effects.
In general, a positive outcome was declared if there was equality in the eventual graduation rate
between successful remedial students and students that were proficient at entry. There was no positive or negative effect assigned to one group taking more or less time to successfully complete a bachelor’s degree program. An original assumption was that remedial students would take longer to graduate because remedial courses have never satisfied any academic program requirements. Moreover, new students with pre-identified risks often have been counseled to attempt fewer units per term in their first year of enrollment. The Program and Observations
Proficiency in math and English, obviously, is not an admission requirement for new freshmen, but as mentioned, proficiency in math and English must be demonstrated before enrollment is permitted in college-level math or English courses. Some specifics of the remedial program continue to be:
• Proficiency assessment is mandatory before classes begin • For those not found to be proficient by SAT/ACT scores, home-grown tests (ELM/EPT) are used
to make the final decision about proficiency status • Enrollment in remedial class is mandatory for those assessed below proficiency • Proficient status must be attained by the end of first-academic year, or re-enrollment may be
blocked
37
Proceedings of the 5th Annual National Symposium on Student Retention. Copyright 2009. C-IDEA, The University of Oklahoma.
The particulars of the home-grown tests and the topic coverage of the remedial courses are fully documented in two complimentary CSU publications: Focus on Mathematics (2002) and Focus on English (2002).
The students that were tracked in this study all matriculated to the CSU in fall 2001 as first-time undergraduates and were subject the policy as stated above. All the students in the study met the full eligibility criteria of the university. The “regular admits” numbered 35,263 students enrolled across 22 campuses. Because the observations did not represent a sample of students, tests of statistical significance were not performed. Instead, substantive differences were assessed. In graduation rate studies, 5-10 percent gaps are usually deemed noteworthy, and gaps of more than 10 percent are judged to be very considerable.
In all, about 92 percent of the freshmen reported SAT scores prior to enrollment. The average SAT Math score for regular admits was just over 510. About 39 percent earned proficiency status via SAT scores, and another 15 percent earned proficiency through additional testing (i.e., the ELM). Thus about 54 percent of new freshmen were math proficient at entry. The average SAT Verbal score for regular admits was just over 500. About 27 percent earn proficiency status via SAT scores, and about another 27 percent earned proficiency through additional testing. All told, about 54 percent of new freshmen were English proficient at entry. These descriptors suggest another important contextual factor. The students, in the main, reflect those high school graduates that were admitted to low to moderately selective universities. Their average SAT composite score was just over 1000; and two-thirds of the population had scores between 840 and 1170. On balance, then the students shared a lot of common background characteristics related to preparedness. Thus the study avoided the ill-advised practice of comparing students with vastly different academic profiles or aspirations.
When math and English proficiency were intersected, fully 62 percent of the new freshmen were required to take at least one remedial course during their first term. That the majority need remediation should have been an expected outcome for many observers, since it was evident that the CSU proficiency standards exceed the CSU admission criteria. Distribution of Students Of the examined groups, males had the highest percentage of students that were proficient in both math and English at entry. The lowest percentage of proficiency at entry was found for African Americans. The modal category for the total group was the group that successfully completed remedial coursework during their first year of study (see table 3).
Table 3. Distribution of Students by Remediation Status One Year After Entry Remediation Status
Total Latino African American Female Male
Proficient at entry 38% 22% 15% 34% 44% Proficient within 1 year
49% 63% 62% 55% 44%
Not proficient in 1 year
13% 15% 23% 12% 12%
Successful remedial students 79% 80% 73% 83% 79%
In all, 79 percent of those that needed remedial courses completed the coursework on time. The percentage varied by group; the highest percentage was exhibited by females (83%) and the lowest was for African Americans (73%). With the exception of African American, the success rates across groups were very comparable.
38
Proceedings of the 5th Annual National Symposium on Student Retention. Copyright 2009. C-IDEA, The University of Oklahoma.
These rates of successful completion have been somewhat stable for cohorts of freshmen that entered the CSU after fall 2001. In the past five years the highest completion rate for the total cohort of incoming freshmen has been 84 percent, but this high was followed a return to the original percentage (i.e., 79%). So, in all, the CSU remedial program has been unable to improve the proportion of in-need students that attain proficiency in one year. Analysis
The percentages displayed in table 4 show the most typical presentation of outcomes for remedial students. Their graduation rate is not disaggregated by success in the pre-college curriculum and they are compared to those that were proficient at entry. The gross difference for the eventual graduation rate indicates the expected finding from such a contrast: students proficient at entry exhibit higher graduation rates than those not proficient at entry. For the observed students, the difference is 13 percentage points.
Table 4. Graduation Rates (Expressed as Percentages) by Remediation Status at Entry Remediation Status Graduated in 6 years Continued 6 years later Eventual graduation Proficient at entry 60% 9% 69% Needed remediation 46% 11% 57%
Because table 4 shows the components of the eventual graduation rate, it is apparent that a larger proportion of remedial students need more that 6 years to attain baccalaureates. In the context of all completers, fully 20 percent (i.e., 11%/57%) of remedial students would not have their degree in had at the six year marker, but just 13 percent (9%/69%) of the proficient students would be in the same situation.
The percentages in table 5 take into account performance in remedial courses; that is, remedial
students are separated in groups denoting performance in pre-college courses. Now we see that remedial students that gain proficiency during their initial year of study are just as likely as those with proficiency at entry to attain bachelor’s degrees (i.e., the difference in rates between the first two columns are essentially zero for each of the observed populations).
Table 5. Eventual Graduation Rates (Expressed as Percentages) by Remediation Status One Year After Entry
Population Group Proficient at entry Proficient within 1 year Not proficient in 1 year Total 69% 68% 27% Latinos 66% 66% 27% African Americans 57% 62% 26% Females 73% 71% 29% Males 64% 63% 24%
Again, only African Americans seem to be a special case. Their situation has been reported in other studies, the “remediated” group exhibits a higher graduation rate that the proficient at entry group. On the surface, this pattern seems to be related to the skewed distribution of African Americans that were proficient at entry; that is, more African American gained proficiency by just making the cut-off scores, when compared to others.
The final column of rates displayed in table 5, show the graduation rates for students that did not
successfully complete their coursework during their first year. Their rate of degree completion is less than half the rate exhibited by the other two proficiency groups, regardless of population. This magnitude of disparity suggests that the unsuccessful remedial students face obstacles beyond those just associated with proficiency. Perhaps, one of the more important ones is the prohibition to re-enroll at the CSU. Many, but not all, unsuccessful students are advised to gain proficiency at another institution (e.g., a
39
Proceedings of the 5th Annual National Symposium on Student Retention. Copyright 2009. C-IDEA, The University of Oklahoma.
community college). This of course means a disruption of continuous enrollment at the CSU. This disruption my in fact be a major determinant of attrition.
In the absence of data, the conventional wisdom at the CSU always has been that students
needing remediation in just math were more at risk of dropping out than those needing remediation in just English. And the corollary assumption has been that those need remediation in both math and English were at the highest risk of dropping out. The last table displays degree attainment by the type remediation that was needed. The figures do not fully support the conventional wisdom.
Table 5. Eventual Graduation Rates (Expressed as Percentages) by Remediation Group
One Year After Entry Remediation Group Proficient at entry Proficient within 1 year Not proficient in 1 year None 69% English 70% 33% Math 68% 28% Math and English 67% 26% When it comes those that gained proficiency within one year, their eventual graduation rates were all within ± 2 percentage points of the corresponding rate exhibited by those that were proficient at entry. Among themselves the difference was just 3 percentage points. For those that did not gain proficiency within one year, the variance was wider. Those needing just English remediation had eventual graduation rates that were 5 percentage points higher than those needing just math remediation; and those needing just English remediation had eventual graduation rates that were 7 percentage points higher than those needing remediation in both math and English. Conclusion There is no single, over-arching judgment about the efficacy of remedial educations on colleges and universities. If the focus is on bachelor’s degree attainment, the answer is certainly conditional. Observations from community colleges and elite institutions frame the possible answers. Most community college students never transfer to baccalaureate-conferring institutions; so many students that take remedial courses at 2-year institutions will never receive baccalaureates. Most students at very selective institutions earn bachelor’s degree, so many students that take remedial courses at selective institutions will also graduate in high numbers. Therefore any summative comments made about remedial-education effects should be accompanied by a host of contextual qualifiers:
• What is the setting?
• Who are the students?
• How was need for remediation defined?
• How was need for remediation determined?
• Was participation mandatory?
• How many students successfully completed the “treatment”?
The most important things to know about this study are that:
40
Proceedings of the 5th Annual National Symposium on Student Retention. Copyright 2009. C-IDEA, The University of Oklahoma.
• Remediation took place a moderately selective set of institutions that award bachelor’s degrees
• Math proficiency was defined as equivalent to three years of high school instruction, and English proficiency was defined as equivalent to four years of high school instruction
• Need was determined by cut-off scores (i.e., less than 550 on the SAT Math or SAT Verbal components)
• Participation in remedial courses was mandatory for those labeled “in need”
• Assessment included determining which remedial students successfully completed the pre-collegiate coursework
The general finding was that students who successfully completing the remediation requirements during their first year attained bachelor’s degrees at the same rates at those students that did not need remedial instruction. For those students who were not able to successfully complete the pre-college course within one year, their odds of graduation were decidedly lower than the other students. Those findings were more or less consistent across students groups and across subject areas (i.e., math or English). On balance, the CSU program of math and English appears to be helping raise the overall graduation of cohorts of first-time freshmen.
There is of course room for improvement. About 20 percent of those taking remedial courses fail to complete the pre-college requirements. Lowering that failure rate is certainly a worthy goal. But since there are no benchmark regarding this outcome, it probably too early to project optimum passing rates.
41
Proceedings of the 5th Annual National Symposium on Student Retention. Copyright 2009. C-IDEA, The University of Oklahoma.
References
Adelman, A. (1999) Answers in the Tool Box: Academic Intensity, Attendance Patterns, and Bachelor's Degree Attainment. Washington, DC: U.S. Department of Education
Attewell, P., Lavin, D., Domina, T., & Levey, T. (2006). New evidence on college remediation. Journal of Higher Education, 77, 886-924 Bailey, T., & Alfonso, M. (2005). Paths to persistence: An analysis of research on program effectiveness at community colleges. Indianapolis, IN: Lumina Foundation for Education. California State University (2002). Focus on Mathematics: Entry Level Mathematics (ELM) Examination. Long Beach, CA: Office of the Chancellor. California State University (2002). Focus on English: English Placement Test (EPT). Long Beach, CA: Office of the Chancellor. California State University (2007). Statistical Abstract, to July 200. Long Beach, CA: Office of the Chancellor. Grubb, W. N. (2001). From black box to Pandora’s box: Evaluating remedial/developmental education. New York: Columbia University, Teacher’s College, Community College Research Center.
Levin, H. M. & Calcagno J.C. (2008) Remediation in the Community College: An Evaluator's Perspective. Community College Review, 35, 181-207.
42
Proceedings of the 5th Annual National Symposium on Student Retention. Copyright 2009. C-IDEA, The University of Oklahoma.
Methods of Inquiry: Using Critical Thinking to Retain Students
Abstract -- In the late 1980s the State University of New York at Buffalo (UB) implemented a critical thinking course for undergraduate students entitled Methods of Inquiry (MOI). Combining insights from cognitive psychology and philosophy, this class sought to give students concrete strategies they could employ to ensure academic success. One byproduct of the course has been a positive influence on persistence. The MOI directors and the Office of Institutional Analysis at UB joined efforts to examine the impact of the MOI course on retention and graduation rates. The analyses in this study are based on university warehouse data for three consecutive entering freshmen cohorts, 2001, 2002, 2003, resulting in a sample of 9,665 students, 1900 of whom successfully completed the Methods of Inquiry course. Results show that MOI students are more likely to be retained or graduate by the second, third, fourth, and fifth year as compared to those students who do not complete the MOI course. This paper will discuss the MOI course design, the methodology behind the research, and corresponding results. Introduction One of the biggest challenges facing universities today is retaining students to graduation. While more high school graduates than ever are entering college, getting them to persist to degree completion seems to be more difficult. This is a problem for both students and higher education institutions. For students, persistence to graduation yields greater employability while time to graduation reflects tuition amounts paid and loans borrowed. Retention is an issue for universities because it affects revenue and college rankings (which draw applicants). As a result, colleges and universities are investing time and money into programs designed to increase persistence. Much has been written about the success or lack of success of these programs. In the late 1980s the University at Buffalo, State University of New York (UB) implemented a critical thinking course for undergraduate students entitled Methods of Inquiry (MOI). Combining insights from cognitive psychology and philosophy, this class sought to give students concrete strategies they could employ to ensure academic success. One byproduct of the course has been a significant difference in retention and graduation rates, on average, between the students who take MOI and those who do not. This research examines the impact of the MOI course on retention and graduation rates. Retention
The study of college student retention and persistence is a complex problem because there are so many relevant variables including sociological, psychological, academic, and economic considerations. Tinto (1975) was among the first to posit explanations for student departure. His initial focus was sociological – investigating commonalities among those students who did not persist to graduation (e.g., parents’ education level, socioeconomic status, peer groups, etc.). Tinto (1993) later expanded his theory to include the student’s sense of academic integration or sense of belonging to the college. Such factors as participation in activities, faculty-student relationships, and student seminars were considered.
43
Proceedings of the 5th Annual National Symposium on Student Retention. Copyright 2009. C-IDEA, The University of Oklahoma.
Despite these insights, retention has become an ever-increasing concern for colleges and universities and is manifested in poor graduation rates. In 2006 the American College Testing Program reported that 48 percent of students in two-year colleges left after the first year (Braxton, Brier & Steele, 2008). The U.S. Department of Education (2004) quotes the six year graduation rate at 53 percent. With such discouraging numbers, subsequent research about persistence has shifted to focus on academic achievement. Pascarella and Terenzini (1991) examined factors including tutoring, academic counseling, mentoring, and academic intervention programs influencing student persistence. They found that, on the whole, these types of programs are effective in positively influencing retention. Additionally, other academic factors found to influence retention include positive faculty interaction, advising, study skills programs, and academic integration (Bean, 2003). Some of the more extensive efforts to address issues of retention include first-year seminars, learning communities, and supplemental instruction programs. First-year seminars are typically small classes that work to integrate students into the college environment. The seminars can cover such topics as study skills, financial aid, library skills, class registration procedures, and more. Studies investigating the influence of first-year seminars on retention have found a positive effect. One particular study conducted by John Gardner at the University of South Carolina-Columbia examined persistence rates of each cohort of first-year seminar participants and non-participants between 1973 and 1996. Gardner found that participants were more likely to be retained to their second year than non-participants. The difference was statistically significant in 15 of the 23 years (Pascarella and Terenzini, 2005). Vincent Tinto writes extensively about the link between active engagement in the college classroom and student persistence (2000). One attempt to increase active engagement has been the development of learning communities. Learning communities can take varying forms across colleges, but consist of core groups of students taking multiple classes together to form smaller peer and study groups within the larger class environment. Tinto has found that learning communities are successful in influencing student persistence because they address both the social and academic lives of students, which Tinto argues, must be looked at in unison. Two other avenues shown to positively influence persistence are supplemental instruction programs and Federal Student Support Services. Supplemental instruction programs provide additional out-of-class assistance for all students in “historically difficult courses” (Pascarella and Terenzini, 2005, p. 399) while Federal Student Support Services (SSS) is a national effort only offered to at-risk students. It includes instruction in study skills, mentoring, tutorial services, career information, and workshops. Research on SSS and other comprehensive programs has found “a statistically significant and positive effect” on retention and graduation (Pascarella and Terenzini, 2005, p. 405). In short, academic intervention attempts have been shown to positively influence student persistence. The Methods of Inquiry Course
The Methods of Inquiry Program at the University at Buffalo began in 1988 with support from the Fund for the Improvement of Postsecondary Education (FIPSE). Its purpose continues to be to provide overt instruction about the learning and thinking processes so that students can take control of their academic lives. All activities in the course explore the theoretical foundations of effective learning. The main emphasis of the course, however, is the development of methods to assure comprehensive learning and provide for accurate assessment of what is indeed learned. These methods, in turn, lead to an understanding that is necessary for clear critical thinking based upon good reasons. The course is a three-credit elective available to any undergraduate student, regardless of major, year in school or grade point average. MOI students attend two 50-minute lectures each week. The lectures introduce four active strategies for student learning (i.e., understand your course, get involved with the material, think like the teacher, and pay attention to your comprehension) and several techniques for fulfilling those learning strategies (e.g., note-taking, reading, concept mapping, creating mock exams). Students are also exposed to the dynamic components of learning, including enthusiasm, persistence, and curiosity (Iran-Nejad, A &
44
Proceedings of the 5th Annual National Symposium on Student Retention. Copyright 2009. C-IDEA, The University of Oklahoma.
Chissom, B. S., 1992). In addition, students are taught philosophical frameworks for thinking, reaching judgment, and creating and analyzing arguments. The third contact hour for students is a one-on-one weekly meeting with a peer monitor. Monitors are undergraduate students who have either taken the MOI course and received an A (and a 3.0 grade point average) or students enrolled in the Honors Program at the university. Monitors undergo training each semester and are carefully supervised by graduate Teaching Assistants. In the thirty minute 1-on-1 weekly meetings students show the monitor their efforts in applying techniques presented in lecture to their other academic classes. The student and the monitor work together to evaluate the quality of the student’s work based on set criteria. The goal of these meetings is for students to become proficient at self-assessment by the end of the semester. In addition, the MOI grading procedures are predicated on a mastery learning philosophy. This approach allows students to make repeated attempts at assignments until they reach “mastery” or real understanding. Final grading takes students’ best efforts into account without averaging in all previous scores. In short, students are credited for how much they learn in the end, not how long it took them to learn it. As a requirement of the original FIPSE funding, the Program kept careful data on the effect of the course on students’ use of active and dynamic strategies through a pre and post-course inventory at the outset and conclusion of each semester. Although the FIPSE funding expired long ago and MOI is now a university-sponsored program, the data collection has continued uninterrupted. Recently, the Office of Institutional Analysis joined with MOI to investigate the effects of the course on student retention and graduation rates. This study examines the influence of the MOI course on retention and graduation rates. Although the course was designed to advance students’ learning and thinking skills and not as an intervention for retention purposes, this paper investigates whether a link exists. Method Data Source and Sample The analyses in this study are based on university warehouse data for three consecutive entering freshmen cohorts, 2001 (N = 3,018), 2002 (N = 3,048), and 2003 (N = 3,599), resulting in a sample of 9,665 students, 1,900 (19.7%) of whom successfully completed the Methods of Inquiry course at some point during their undergraduate course work. Successful completion is operationally defined as earning a grade of C or higher in the course. Of the MOI completers, 1,498 (80.0%) earned an A or B in the course. Demographic and educational background variables selected for inclusion in the final data file were those thought to be related to the primary outcomes in the study: retention, credit hours completed, grades, and years to graduation. Among the demographic variables are gender, under-represented minority status, family income status (a low income is anything below the typical $40,000 cut-off for receiving PELL grants), international status, and first-generation college status. We also included the continuous measures of age at college entrance and family income in thousands. However, only students who filed a completed Free Application for Federal Student Aid (FAFSA) before their freshmen year (N = 7,757) have family income and first-generation college information on record. The educational background factors include the following dichotomous variables: student athlete, Honors Scholar, Educational Opportunity Program participant, and initially enrolled as undecided. Additional continuous measures of educational background include High School Average, SAT Verbal score, SAT Math score, and percent of semesters enrolled full-time during undergraduate career. Procedures and Data Analysis Techniques The outcome variables were also derived from data in the university data warehouse. All semester data for five academic years was pulled for all participants. For example, data for the 2001 cohort was pulled from Fall 2001 through Spring 2006. The persistence outcome variable for each year of the study was created by coding anyone who was enrolled in the subsequent fall or who had graduated
45
Proceedings of the 5th Annual National Symposium on Student Retention. Copyright 2009. C-IDEA, The University of Oklahoma.
by that fall as a 1, and coding all others 0. This method of combining retention and graduation into a single outcome variable provides an accurate indicator of those who continue enrollment or exit successfully versus those who simply leave the university. An outcome variable indicating years-to-graduation was also created in order to specifically examine 4- and 5-year graduation rates. Once all of the variables were collected into a single data file, simple comparisons were done to examine the characteristics of students who successfully complete Methods of Inquiry as compared to all other students. Chi square analyses were used to compare the two groups on the dichotomous variables, and t-tests for independent samples were used to compare the two groups on the continuous variables (Anderson & Finn, 1996; Ott, 1993; Tabachnik & Fidell, 2007). In order to examine effect sizes for the chi square analyses, the analyses were also run as binary logistic regression analyses, and the odds ratios were used to describe the size of the effect in practical terms (Garson, n.d.). Cohen’s d was used to examine effect size for each significant difference identified for continuous variables (Anderson & Finn, 1996; Garson, n.d.). For each year’s analysis of persistence, only those students who had completed MOI successfully before the fall of the persistence year were coded as MOI students so as not to include students who had not yet taken the course. Four separate chi square analyses were computed to examine the relationship between MOI completion and retention to year-two, year-three, year-four, and year-five. Similar analyses were conducted to examine the relationship of MOI completion to graduation within four years and graduation within five years. Results Characteristics of MOI Students Table 1 shows the characteristics of MOI students as compared to non-MOI students.
First Generation College2 31.1 37.0 29.5 32.97*** 1.40 Low Income2 28.9 36.5 26.9 56.92*** 1.56 Filed for Financial Aid 84.4 87.8 83.6 19.97*** 1.42 Educational Opportunity Program 6.5 18.2 3.6 533.45*** 5.95
International 3.4 2.5 3.6 6.35* 0.67 Athlete 4.1 7.1 3.3 54.97*** 2.21 Honors Scholar 31.6 23.8 33.5 66.89*** 0.62 Enrolled as Undecided 22.8 27.6 21.6 31.45*** 1.39 Continuous Variables Mean (SD) Mean (SD) Mean (SD) T d Family Income (in thousands)2
69.5 (46.6)
63.7 (47.1)
71.0 (46.3)
-5.52*** 0.16
High School Average 89.8 (5.5)
88.6 (6.1)
90.3 (5.3)
-9.80*** 0.30
SAT Verbal 550.9 (79.8)
527.0 (84.6)
556.7 (77.5)
-13.50*** 0.37
SAT Math 578.2 (78.4)
556.4 (83.2)
583.4 (76.3)
-12.46*** 0.34
46
Proceedings of the 5th Annual National Symposium on Student Retention. Copyright 2009. C-IDEA, The University of Oklahoma.
Variable Full Sample (N = 9665)
MOI Students (N = 1900)
Non-MOI Students
(N = 7765) Test Statistic Effect Size
Age at College Entrance 18.0 (1.2)
17.9 (0.9)
18.0 (1.3)
-2.73** 0.08
Percent Full Time Semesters
91.6 (11.2)
90.6 (10.3)
91.8 (11.4)
-4.45*** 0.11
Table 1. Sample Composition Notes. Typographical symbols represent statistically significant differences: # p < .06; * p < .05, **, p < .01, *** p < .001. 1 Based on domestic students only (N = 9335). 2 Based only on students who filed the Free Application for Federal Student Aid (FAFSA, N = 7757). Those who enroll in MOI are more likely to be members of demographic groups that historically are less successful in college and less likely to be retained. For example, they are more likely to be from under-represented minority groups (χ2 = 147.18, p < .001) and to be first generation college students (χ2 = 32.97, p < .001). Students who enroll in MOI are more likely to be from low income homes (χ2 = 56.92, p < .001) and to apply for financial aid (χ2 = 19.97, p < .001). Further, students who enroll in MOI are slightly more likely to enroll as undecided (χ2 = 31.45, p < .001) and to be student athletes (χ2 = 54.97, p < .001). MOI students are much more likely to be members of the Educational Opportunity Program (EOP) than to be members of the University Honors Program (χ2 = 533.45, p < .001, and χ2 = 66.89, p < .001, respectively). In addition to demographic differences, students who enroll in MOI enter the university less prepared to succeed academically. For example, as shown in Table 1, MOI students enter with lower high school averages (T = -2.06, p < .05), and lower SAT Verbal and Math scores (T = -13.50, p < .001, and T = -12.46, p < .001, respectively). Finally, students who enroll in MOI have slightly fewer full-time semesters during their college careers (T = -4.45, p < .001), suggesting that these students should require more semesters to complete their degree programs. Based on effect sizes, however, the most important differences are for high school average and SAT scores. Those students enrolled in MOI are approximately a third of a standard deviation lower than non-MOI students on these three measures of academic preparation. Although these effect sizes are considered “moderate’ (Garson, n.d.), these differences suggest that about 66.0% of students who complete MOI enroll in college with high school averages and SAT scores below the averages of non-MOI completers. Persistence of MOI Students The results of analyses of persistence rates for MOI and non-MOI students are shown in Table 2.
Persistence Year Total MOI Non-MOI χ2 Odds Ratio
Second Year 84.9 91.7 84.2 35.37*** 2.06
Third Year 74.9 82.6 73.7 47.82*** 1.70
Fourth Year 71.2 79.7 69.7 62.89*** 1.71
Fifth Year 67.5 77.3 65.4 94.04*** 1.81 Table 2. Percent Retained/Graduated over Five-Year Period Note. Asterisks represent statistically significant differences: * p < .05, **, p < .01, *** p < .001. Even without statistically controlling for the many academic disadvantages that characterize MOI students, the advantage gained by enrolling in the MOI course is evident. MOI students are more likely to
47
Proceedings of the 5th Annual National Symposium on Student Retention. Copyright 2009. C-IDEA, The University of Oklahoma.
be retained to or to graduate by the second, third, fourth and fifth year as compared to those students who do not complete the MOI course. The χ2 for each year is statistically significant at the p < .001 level. The odds ratios suggest that, at the beginning of each academic year (second through fifth), those students who have completed MOI are approximately twice as likely to be retained or to have graduated than those students who have not taken MOI. The biggest effect is for the second year, suggesting that it is important for persistence for students to take MOI in their first year of study. Time-to-Graduation of MOI Students The percentages of MOI and non-MOI students who graduate within 4 years and 5 years are shown in Table 3.
Graduation Year Total MOI Non-MOI χ2 Odds Ratio
Fourth Year 39.2 40.8 38.8 2.80 1.09
Fifth Year 56.7 63.7 55.0 46.72*** 1.43 Table 3. Percent Graduated in 4 and 5 Years Note. Asterisks represent statistically significant differences: * p < .05, **, p < .01, *** p < .001. Students in the two groups are equally likely to graduate within 4 years (χ2 = 2.80), but MOI students have a distinct advantage for 5-year graduation (χ2 = 46.72, p < .001). Those who complete MOI are 1.4 times as likely to graduate within 5 years as those who do not complete MOI. Discussion
The findings of these analyses show that, in spite of the many academic and demographic
disadvantages with which MOI students enroll, they outperform non-MOI students on the important academic outcomes of retention and graduation rates. MOI was designed to offer students active strategies for learning and critical thinking skills and not overtly as a program to improve persistence. Clearly, however, increased retention and improved graduation rates are a byproduct of this course. In fact, the U.S. Department of Education (2004) quotes the six year graduation rate at 53 percent. The MOI completers in this study had a 63.7 percent graduation rate in only five years – a 10 percent difference and one year fewer.
Much of the research on retention discusses first-year intervention programs, with the reasoning that the earlier the intervention, the more likely students will persist. Not surprisingly, this study found the most positive benefit from the MOI course to be from the first to the second year. In other words, the sooner in their college careers that students take MOI, the greater the impact on retention and persistence.
Although the impact of the course for MOI-completers is impressive, one insight of note is that students who perform best in MOI seem to reap the benefits of the course more than those who do the worst. This makes sense in light of the compliance and effort required to be most successful in the course. In short, students who do minimal work and put in minimal effort internalize the strategies and techniques the least. Therefore, their corresponding retention and graduation benefit is less.
In an era when retention and gradution is so important to both students and higher learning institutions, it is worthwhile to explore possible interventions to improve persistence. The data presented about the Methods of Inquiry course at the University at Buffalo offers clear evidence that the course positively influences both retention and graduation rates. Unique in its approach (e.g., weekly peer monitor meetings and a mastery learning grading philosophy), MOI gives students concrete skills to be successful in school. Those skills, although not directly aimed at persistence, have a positive impact on student retention and graduation rates. These findings, therefore, build upon existing research into the ongoing issue of persistence in higher education.
48
Proceedings of the 5th Annual National Symposium on Student Retention. Copyright 2009. C-IDEA, The University of Oklahoma.
References
Anderson, T. W., & Finn, J.D. (1996). The new statistical analysis of data. New York: Springer-Verlag New York, Inc. Ahuna, K. H. & Tinnesz, C. G. (2006). Methods of inquiry: Applied critical thinking (2nd ed.).
Dubuque: Kendall/Hunt Publishing Co. Bean, J. P. (2003). College student retention. In James W. Guthrie (Ed.), Encyclopedia of
Education (pp. 401-407). New York: Macmillan Reference U.S.A. Braxton, J. M. (2000). Reworking the student departure puzzle. Nashville: Vanderbilt University
Press. Braxton, J. M., Brier, B. M. & Steele, S. L. (2008). Shaping retention from research to practice.
Journal of College Student Retention, 9 (3), 377-399. Cabrera, A. F., Castaneda, M. B., Nora, A. & Hengstler, D. (1992, March/April). The
convergence between two theories of college persistence. Journal of Higher Education, 3 (2), 143-164.
Garson, G.D. (n.d.). Logistic regression. In Statnotes: Topics in multivariate analysis. Retrieved 3/23/09 from http://www2.chass.ncsu.edu/garson/pa765/statnote.htm. Garson, G.D. (n.d.). Univariate GLM, ANOVA, and ANCOVA. In Statnotes: Topics in multivariate analysis. Retrieved 3/23/09 from http://www2.chass.ncsu.edu/garson/pa765/statnote.htm. Iran-Nejad, A. & B.S. Chissom. 1992. Contributions of active and dynamic self-regulation to learning. Innovative Higher Education, 17, 125-36. Kuh, G. D. (2001, May/June). Assessing what really matters to student learning: Inside the
national survey of student engagement. Change, 33 (3), 10-17. Ott, R. L. (1993). An introduction to statistical methods and data analysis. Belmont, CA: Wadsworth, Inc. Pascarella, E. T. & Terenzeni, P. T. (2005). How college affects students, vol. 2: A third decade
of research. San Francisco: Jossey-Bass. Tabachnik, B. G., & Fidell, L. S. (2007). Using multivariate statistics (5th ed.). New York:
Pearson Education, Inc. Tinto, V. (1993). Leaving college: Rethinking the causes and cures of student attrition (2nd ed.).
Chicago: University of Chicago Press.
49
Proceedings of the 5th Annual National Symposium on Student Retention. Copyright 2009. C-IDEA, The University of Oklahoma.
Year 1 at Anna Maria College: The Successful Implementation of a New Retention Plan
at a Small Liberal Arts College
Andrew O. Klein Dean of Student Affairs and Retention
Abstract - Anna Maria College, a Catholic liberal arts college with liberal admissions standards and 30% first-generation students was suffering from poor retention rates. The freshman retention rate had fallen as low as 59% and six-year graduation rates had slipped under 50%. In a year in which national retention rates decreased by two percentage points (ACT, 2009), at Anna Maria College first year student retention increased from 64% (Fall 2006 cohort) to 70% (Fall 2007 cohort). The initial implementation of the retention plan that brought about this improvement included an Early Warning System, a Success Program for students on probation, and a revised New Student Orientation program. This paper focuses on the genesis of the retention plan and the implementation and community support that made it successful.
Introduction
Anna Maria College is a four-year, private, co-ed, Catholic liberal arts college located in Paxton Massachusetts with an undergraduate enrollment of 768 and graduate student enrollment of 274. The college was established in 1946 by the Sisters of St. Anne with a mission to foster in its students intellectual involvement, career preparation, social awareness, dedication to justice and peace, and religious and moral sensitivity. In the summer of 2007 the college welcomed new leadership as it faced fiscal and enrollment challenges.
The retention of first year students at the college had declined steadily in the previous years, as shown in Table 1. The fall cohorts of 2002 and 2003 had been retained at rates of 69% and 70% respectively. Approximately half of each cohort graduated within four years and the six year graduation rate for the cohorts were 59% and 56%. A review of the academic performance of these cohorts has revealed that if the current academic standards for probation and suspension at the college were applied at that time, the retention rates would have been much lower.
The retention rates for the next two cohorts, Fall 2004 and Fall 2005, fell decisively. An analysis of the academic preparedness and performance of the cohorts revealed that the admissions standards for the college were relaxed considerably in an effort to admit more students. The retention rate for the cohort of Fall 2006 was 64%. Although this retention rate would be typical for a private college with Open Admission policies, the typical retention rate for schools with “liberal” or “traditional” admissions selectivity standards is 71% and 73% respectively (Mortenson, 2005).
50
Proceedings of the 5th Annual National Symposium on Student Retention. Copyright 2009. C-IDEA, The University of Oklahoma.
Table 1: Retention and Graduation Rates at Anna Maria College
Freshmen Cohort Year
2002 2003 2004 2005 2006
# of Entering Freshmen
N=162 N=154 N=189 N=161 N=181
Official retention rate
69% 70% 59% 59% 64%
% Enrolled 2 years later
62% 59% 52% 52% 57%
4 Year Graduation Rate
50% 49% 37% 42%
6 Year Graduation Rate
59% 56% 43%
projected
Development of the Retention Plan
A new president came to the college in July of 2007 with the philosophy that enrollment growth would be dependent on higher retention rates and while maintaining higher academic standards. He brought in a Dean of Student Affairs and Retention and charged the Dean with developing and implementing a retention plan with the goal of increasing the retention rate to a level over 70% within three years.
The decision to assign retention to the Dean of Student Affairs was well thought out. The ACT publication What Works in Student Retention (Habley & McLanahan, 2004) clearly recommends that campuses should designate a visible individual to coordinate efforts on campus. By assigning this to a Dean, as did 30% of campuses with a designated individual, the message was sent to the community about the importance of this venture.
Following the ACT model, the Dean assembled a working group that completed an assessment of the characteristics of Anna Maria students, focusing on those who had left the college in previous years. This project revealed that indicators such as first generation (typically 30% of recent incoming classes) and ethnicity (15% of entering classes were students from underrepresented populations) were not unique predictors of persistence at Anna Maria. The most common factors present in students who left the college were poor academic preparedness as indicated by High School GPA and SAT scores, and poor
51
Proceedings of the 5th Annual National Symposium on Student Retention. Copyright 2009. C-IDEA, The University of Oklahoma.
academic performance at Anna Maria as indicated by GPA and academic standing. The findings at Anna Maria are consistent with national data as reported in 2004 by ACT which showed that average ACT score for returners was 1.5 points higher than for those who did not return, and that the average GPA for returners was 0.9 GPA units higher than the GPA of non-returners (Ziomek & Harmston, 2004).
The Dean of Student Affairs, in conjunction with faculty and Student Affairs staff who could provide data and institutional history, developed the following outline of a retention plan and corresponding goals:
2007 – 2008
1. Early Warning System 2. Success Program for Students on Probation 3. Revised New Student Orientation
Fall 2007 Cohort Retention Goal: 67%
2008 – 2009
1. Conditional Acceptance Program 2. First Year Residence Hall/Learning Community 3. Noel-Levitz College Student Inventory as an Advising Tool 4. Dean’s Council
Fall 2008 Cohort Retention Goal: 70%
2009 – 2010
1. First Year Seminar 2. Peer Advisors 3. Sophomore year experience programming
Fall 2009 Cohort Retention Goal: 73%
Implementation of the Plan: Year One
Early Warnings Early warnings have been implemented on many campuses as an important component of
effective retention plans. Seton Hall University implemented an electronic early warning notification system in 2005 as an important component of the retention strategies for freshmen and reported successful implementation and response (Wankel, 2006). The Early Alert Program at New Mexico Highlands University involved a team of academic advisors, social work interns and per advisors to develop the response to the alerts received by faculty. Students would be contacted and encouraged to meet with an academic advisor to discuss academic issues and to work on a strategy for success (Wolff, 2006). When the University of Arizona assembled a Retetnion Working Group, they identified eight
52
Proceedings of the 5th Annual National Symposium on Student Retention. Copyright 2009. C-IDEA, The University of Oklahoma.
strategies that were a high priority if they were to improve retention. The early alert program, which they named Success Net, was one of the three strategies determined to be the highest priorities (Wilkes, 2005).
The Early Warning System was developed on the premise that mid-term warnings are often issued too late for most students to salvage a high grade in a class in which they are doing poorly. An intervention within the first two or three weeks of the semester is intended to get the student on track early in the semester and identify any other steps necessary for the student’s success. One of the distinct advantages of a small college is that a system like this can be implemented and successfully identify a high percentage of students who need additional support or direction.
The Early Warning System was initially put in place in the fall semester of 2007. The Dean of Student Affairs and Retention announced at an all-college meeting, followed by an email to all faculty, that any faculty member that had a concern about a student should notify the Dean by email. Possible warning signs included, but were not limited to, non-attendance, a student consistently not being prepared for class, poor quality of written assignments, poor performance on tests and expressions of mild anxiety or lack of confidence in the student’s ability to do college level work. Faculty were asked simply to call or email the Dean with concerns.
In preparation for the Early Warning Program, a response plan was developed by the Dean and key staff within Student Affairs. The Director of the Learning Center was prepared to contact students having academic difficulties and establish a plan to review the student’s course load, assess the student’s ability to complete the courses successfully and to develop an action plan for the semester. The action plan might include recommended hours spent studying in the learning center, working with peer tutors and enrolling in a section of College Learning Strategies, a credit bearing course designed to acclimate students to the rigors of college level work.
If the student concerns were centered on personal adjustment issues, the Residence Life staff was prepared to contact the student and make the appropriate intervention. Mild concerns could be addressed by a Resident Assistant or Professional Hall Staff member and more serious concerns could be referred to the Counseling Center.
In a college where many of the first year students were not fully prepared for college level work, the early warnings proved to be a very valuable tool. Faculty and staff were able to identify students who were falling behind in time to get them caught up before it became too late in the semester. For many students, the solution was structured time spent in the Learning Center developing the study habits necessary for college work. For others, it was an introduction to the writing fellows so the students could improve their writing skills. The system also identified several students who were dealing with general adjustment issues and they were referred to the Counseling Center in a timely manner.
One successful strategy that was documented was the positive impact of reducing the course load from 15 to 12 credits (5 to 4 classes in most instances). This was not a decision that was made lightly, however for some students with two or more courses with significant writing requirements, dropping one of those courses made the work load manageable. The fact that the college does offer a 2 week “Winter Session” in January and has a liberal policy about transferring in summer courses taken elsewhere eased the students’ concerns about falling behind. The impact of a reduced load on these students was
53
Proceedings of the 5th Annual National Symposium on Student Retention. Copyright 2009. C-IDEA, The University of Oklahoma.
significant enough that it was adopted into the Conditional Acceptance policy discussed later in this paper.
Assessment of the Early Warning System In the assessment of the program, it was clear that the original design did not allow for enough
involvement by the faculty in assisting the students. Communication that came in from a faculty who had a student in class was not necessarily shared with that student’s faculty advisor. The program has been adjusted so that there is more communication to faculty advisors about academic issues facing their advisees. Additionally, even though faculty members were notified that their referral had been received, the program did not include a follow up with the referring faculty member after an intervention plan was determined. In the future, after the initial student intervention, the faculty will be notified that the student has been contacted and that the faculty should witness a change in behavior. The faculty member will also be encouraged to file another warning if the behavior does not improve.
Success Advising In January 2008 the College introduced the “Success Advisor” program for all students on
academic probation or warning. The college already had a requirement that students on probation spend required hours in the Learning Center but that was the only requirement of the probation. The academic progress of the students was not monitored in any way until the final grades were posted at the end of the next semester.
The Success Advisor program was designed with the goal of immediate improvement in the academic performance of the students on probation. Recent data revealed that Anna Maria students who performed well enough to get off of probation within one semester were unlikely to end up back on probation. Students who lingered on probation for multiple semesters were much more likely to withdraw or be suspended from the college. Although the required studying hours in the Learning Center were beneficial, it was a passive requirement. Participation in the Success Advisor program would be a more active requirement for the students.
Each student on probation was assigned to one of four Success Advisors. The Advisors included the Dean of Student Affairs, the Director of the Learning Center, an Associate Dean of Student Affairs and an Associate Dean of Academic Affairs. Each student received a letter from their Success Advisor explaining the benefits and requirements of the program. They were told that participation was an expectation of their probation, and that while there was no penalty for not participating, the benefits would make it worthwhile. They were also informed that the Success Advisor would be filing a report on each student to the Academic Standards committee at the end of the semester. Approximately two-thirds of the students on probation opted in and met monthly with a Success Advisor.
The first meeting with each student was spent completing a seven item questionnaire. The first three questions asked about the student’s motivation and priorities. The next questions asked the student to focus on the previous semester and articulate what went wrong, what distractions prevented academic success and what would have to change for the upcoming semesters. The final questions asked the student about time management, what sacrifices are necessary for success, and finally, what are the goals for the upcoming semester.
54
Proceedings of the 5th Annual National Symposium on Student Retention. Copyright 2009. C-IDEA, The University of Oklahoma.
The discussions that ensued while completing these questions revealed a great deal about the students and their challenges. For many it was learned that the challenges were external, such as a demanding work schedule or a distracting social life. These issues would prove to be easier to address than the internal challenges. Self doubt or a lack of motivation were the most common internal challenges, and for each student the answer would also lie within. For these students the Success Advisors would provide a pep talk and have the students focus on the motivators identified earlier in the questionnaire. Some were also referred to the Counseling Center when appropriate. At this first meeting, students were also given a daily calendar and encouraged to write in all of their classes, due dates for assignments and to schedule their study time.
After the first meeting, the Success Advisor would confer with each student’s faculty advisor, usually by email. This gave each an opportunity to learn about the student from another perspective and to coordinate their advising approach. One of the reasons for including the faculty advisor was to provide the faculty with a specific contact if they had a concern about the student over the course of the semester. Although the initial discussions were very helpful in allowing each person to learn more about the student, the communication during the semester was infrequent. Many of the students, particularly first year students who may only be taking one course in their major during their second semester, would not have a class with their advisor. These students were unlikely to drop by their advisor’s office until it was time to register for the next semester. Unless the student’s instructors shared concerns with the faculty advisor, the faculty advisor would often not have direct knowledge of the student’s academic performance. It was, however, beneficial to have the initial conversations and for the faculty to know that there was a Success Advisor for each student on probation.
Over the course of the semester, each participating student would meet monthly with their Success Advisor. At these meetings the student would bring the calendar, the syllabus for each class and an example of recent graded work. Discussions would pick up on the issues identified at the first meeting and the effectiveness of strategies put into place in the current semester. The specific topics for these meetings were determined by each tandem; there was not a consistent agenda for each Success Advisor to follow.
Twice during the semester the Success Advisors met to discuss the program. In these meetings the advisors would identify common issues facing the students and share strategies that were working for their students. The Success Advisors also were provided with the list of students who received mid-term warnings so that they could address these with their advisees.
Assessment of the Success Advising At the end of the semester, the program was evaluated by comparing the academic success of the
students who participated with the academic success of the students on probation who chose not to participate. The results were significant. Of the students who participated, 80% improved their GPA, most to a level that moved them off of probation for the next semester. Of the students who did not participate, 50% improved their grades, and only 25% of the total moved off of probation.
Admittedly, these results alone do not guarantee that the effect of the Success Program was the cause of the increase. Since the program itself was voluntary, although strongly encouraged, it can be assumed that the participants were the students who were already more motivated to succeed. Students who participated were asked about their perception of the Success Program and the effect it had on their
55
Proceedings of the 5th Annual National Symposium on Student Retention. Copyright 2009. C-IDEA, The University of Oklahoma.
grades. Citing the tips on time management, eliminating distractions and articulating their motivations for academic success, the students indicated that the Success Program had a significant positive impact on their academic performance.
This program has continued for three semesters and the results have been strikingly similar to those of the first semester. In general, two thirds of students invited participate and follow through with the meetings, and 75% to 80% of the students improve their grades. The improvement rate for students who do not participate is holding steady at 50%. These rates are discussed at faculty meetings regularly and the faculty have been active in advising students on probation to participate.
The ongoing assessment of the program has led to some changes. The number of Success Advisors has increased so that each staff member is assigned an advising load between five and seven students. The discussions with faculty advisors still occur, however it has not yet been expanded to include each faculty member teaching the student in a given semester. This has been considered but has been ruled out at this time. Although it is appropriate for a faculty advisor to be aware of a student’s probation status, it may not be appropriate for all faculty to have that information. Since any Early Warnings from faculty are shared with the Success Advisor when applicable, intervention strategies can be discussed based on those warnings.
New Student Orientation The third component of the retention plan to be implemented in the first year was a revised and
extended New Student Orientation. Prior to 2007, new students at Anna Maria College moved in on a Friday and classes began that following Monday. Academic advising and course registration meetings took place on move-in day giving students very little time to buy books and get acclimated to their schedule. The orientation schedule was very social and focused on community building and an awareness of the Code of Conduct. There was no programming or emphasis on academic success, living in a diverse community or social health and wellness issues.
In 2007, a summer registration program was instituted. The program was a one-day program that followed a traditional schedule. Most importantly the students met with an advisor and selected their classes well before arriving in September. Parents were invited to take part in a series of programs throughout the day that would be of interest to them. In addition to meeting with representatives from Financial Aid and the Business Office, parents also heard from Student Affairs staff and were encouraged to spend time over the summer discussing time management, money management, social decisions and other important issues. Students had the opportunity to meet new classmates and faculty members and to hear many of the same messages that were delivered to their parents.
In the fall, the New Student Orientation was also increased by two days. The schedule was significantly revamped and included more programs designed to focus on student success. Orientation leaders, who were selected and trained more rigorously than in prior years, were charged with providing a student to student perspective on being successful both in and out of the classroom. The new students attended interactive programs on alcohol education, multicultural issues, academic support services and introductions to key personnel on campus. There was also a tour of the library and a scavenger hunt designed to bring the students through the important offices on campus. The highlight of the orientation
56
Proceedings of the 5th Annual National Symposium on Student Retention. Copyright 2009. C-IDEA, The University of Oklahoma.
was the Matriculation Ceremony, an academic ceremony in which the faculty, in full regalia, welcomed the new class. Class members signed a class book and received a lapel pin signifying their entrance into the college community. The class then participated in the raising of the College Flag indicating the start of the new academic year.
Assessment of New Student Orientation Through focus groups with new students throughout the year, it was learned that the Orientation
met stated goals of creating a community feeling throughout the class. Retention of the information provided during orientation was not at the level hoped for, although students did indicate they knew where the key offices are on campus and where to go for help. They also reported that they wished they had time to interact with their faculty in a non-classroom situation during Orientation.
Summary of 2007 – 2008 Retention Efforts
There was great community support for these programs. It was clear that increased retention was high on the president’s priority list and that the programs would receive the necessary resources. Faculty were responsive to the requests to provide early warnings and staff was quick to intervene with the students identified through these warnings. Students on probation were given the direction and tools they needed to succeed. An expanded orientation gave the new students a sense of community and academic engagement. The result was a retention rate of 70% which exceeded the goal set in the initial retention plan.
Year Two (2008 – 2009)
The second year of the plan has attempted to build on the momentum of the first year. The three programs discussed in this paper were assessed and improvements were implemented. Communication with faculty has been increased, particularly with the Early Warning program. Additionally, there have been new retention efforts implemented.
Dean’s Council The newly formed Dean’s Council meets every week to discuss students who may need
assistance and to assign responsibility for the agreed upon intervention. The Dean’s Council is made up of the Dean of Student Affairs and Retention, the Dean of Academic Affairs, Associate Dean for Campus Life, Director of Learning Center, Director of Counseling and Director of Health Services. This group is publicized on campus and receives referrals from anyone in the community. The council also reviews all early Warnings, Mid-term Warnings and Probation students.
Conditional Acceptance The admissions standards for the college have been increased incrementally. Students who have
the minimum High School GPA but lower SAT scores have been admitted on a conditional basis. The conditions placed on these students include monthly meeting with their faculty advisor, enrollment in the credit bearing College Learning Strategies, and a restricted course load of 12 hours (4 courses). The average GPA for the Conditional Accepted students was 2.48 for the Fall semester, which compares well to the overall First Year Student GPA of 2.55 and exceeds the GPA of the group of students who had admissions standards slightly higher than theirs (defined as non-Conditional Accepted students who were
57
Proceedings of the 5th Annual National Symposium on Student Retention. Copyright 2009. C-IDEA, The University of Oklahoma.
advised into the College Learning Strategies Class). The preliminary assessment of the data indicates that the restricted load for the first semester may be the most important independent variable.
Conclusion
Anna Maria College is an example of the success that can be achieved by a well thought out and supported retention plan. The importance of executive support and high level responsibility cannot be overstated. With that in place, the initial focus was on the top reason that students left the institution, poor academic performance. With a concerted effort and significant faculty support, the results in the first year of implementation exceeded the goal for the program. This success has led to even more support and participation in the efforts, such as more Early Warnings and improved communication between faculty and staff.
The next stages of the retention plan will focus on implementing the student engagement model, increasing the number student led organizations and activities on campus and providing increased scholarship opportunities. The expectation is that in the course of the first year, students with academic or motivational needs will learn the skills needed for academic success, and then throughout their college career they will need less intrusive academic advising. The increase in engagement opportunities, such as internships, service learning, and student organization involvements will not only provide for a well rounded education but will also create a community bond and loyalty within the student body.
References
ACT News, (2009) “Fewer Students Returning to Same School for Second Year of College,” January 22, 2009 from http://www.act.org/news/releases/2009/1-22-09.html
Habley, W. and McClanahan, R. (2004) “What Works In Student Retention – All Survey Colleges,” ACT, Inc. Retrieved June 4, 2007 from http://www.act.org/research/policymakers/reports/retain.html.
Mortenson, T. (2005). College Student Retention: Formula for Student Success (Seidman, A, Ed.). Westport, CT: Praeger
Wankel, L. and Gottlieb, A. (2006) “Creating a Culture of Success: A University-wide Effort to Improve Retention,” Proceedings from 2006 National Symposium on Student Retention, October 2006.
Wilkes, G et al, (2005) “A Data-driven, College-based Strategic Retention Master Plan: From Precious Individuals to Meaningful Data, and Back Again,” Proceedings from 2005 National Symposium on Student Retention, October 2005.
Wolff, L and Baskerville, J. (2006) “Early Alert and First year Experience Initiatives at New Mexico Highlands University,” Proceedings from 2006 National Symposium on Student Retention, October 2006.
58
Proceedings of the 5th Annual National Symposium on Student Retention. Copyright 2009. C-IDEA, The University of Oklahoma.
Ziomek, R. and Harmston, M. (2004) “Retention, ACT Composite Score, and College GPA: What’s the Connection?” ACT, Inc. Retrieved July 27, 2009 from http://www.act.org/research/briefs/2004-1.html
59
Proceedings of the 5th Annual National Symposium on Student Retention. Copyright 2009. C-IDEA, The University of Oklahoma.
Abstract – Belmont University has participated in the UCLA Higher Education Research Institute, Cooperative Institutional Research Program (CIRP) Freshman Survey for fourteen years. The institution has also been using a home-grown graduating Senior Survey for several years, however, within the last eight years identifiers have been added to allow for matching survey responses to specific students in the administrative database. The current study partners the CIRP responses, graduating Senior Survey responses and a robust database of institutional data in an effort to identify characteristics of students who are successful (graduate from the institution) versus those who are not successful (dropouts). Three separate entering freshmen cohort years (IPEDS based) are in included in this study: 1998, 1999, and 2000. These cohorts represent six year graduations based on the spring 2006 commencement. Belmont graduation rates for the three cohorts are generally at 55+% in six years. Thus, roughly one half of the entering freshmen for three cohort years present the researcher with a plethora of data for analysis regarding successful students and equally, one half that are not successful based on their leaving the university before graduating. Quantitative and qualitative methods of analysis reveal a series of indicators of success or failure of the study groups. The study revealed that although retention and persistence in the largest program on campus were challenged by a number of issues, timely interventions resulted in increases in both parameters. Introduction A review of current literature reveals a virtual plethora of scholarly works regarding the retention of college freshmen and their persistence through graduation. Over thirty years of scholarly research on retention has followed the pioneering efforts of Tinto (1975), later by Pascarella and Terrenzini (1991), and later still by Astin (1993). Much of the extensive literature is focused on the use of pre-college characteristics of incoming freshmen as predictors of persistence (i.e., high school GPA and class rank, and ACT or SAT scores (Gillespie and Noble, 1992; Harmston, 2004; Hezlett et al., 2001; Noble and Sawyer, 2002; Perkhounkova, Noble, and McLaughlin, 2006). In addition to these pre-college characteristics, numerous studies have utilized the University of California, Los Angeles; Higher Education Research Institute (HERI); Cooperative Institutional Research Program (CIRP) Freshman Survey to identify entering characteristics of college freshmen (e.g. life and degree goals, expectations about college, sources of financial aid, academic major and self-ratings). Astin and Oseguera (2002) developed a model for predicting retention rates using both pre-college achievement variables and CIRP variables. They found that by adding the CIRP variables to the equation, the accuracy of the prediction was increased by 57 percent for four-year completion and by 50 percent for six year completion. Other findings were “two-thirds of the variation among institutions in their degree completion rates is attributable to differences in their entering classes rather than to differences in the effectiveness of their undergraduate retention programs”. Adelman (1999) produced a study of persistence of a high school cohort scheduled to graduate in 1982 through college graduation in 1993. Adelman (2006) replicated the study following a cohort graduating from high school in 1992 through college graduation in December 2000 which was based on
60
Proceedings of the 5th Annual National Symposium on Student Retention. Copyright 2009. C-IDEA, The University of Oklahoma.
three types of national data sets. In addition to the NCES transcript-based grade-cohort study: NELS:88/2000; the other data sets included the CIRP annual survey of entering college freshmen (Astin and Oseguera, 2002) and the NCES Beginning Postsecondary Student studies. In combination, these studies are representative of the body of data relating to factors that influence persistence to graduation from college. The National Survey of Student Engagement (NSSE), a relatively new instrument, asks students to report how often they do activities that are deemed to be good educational practices and to rate their perceptions of the educational environment at their institution (Kuh, 2003). Williford (2008) used NSSE along with institutional data to study retention/attrition at Ohio University and found that persisting students (stayers) tend to have a greater sense of engagement than those who drop out (leavers). Belmont University has participated in the UCLA Higher Education Research Institute, Cooperative Institutional Research Program (CIRP) Freshman Survey for fourteen years. The institution has also been using a home-grown graduating Senior Survey for several years, however, within the last eight years identifiers have been added to allow for matching survey responses to specific students in the administrative database. The current study partners the CIRP responses, graduating Senior Survey responses and a robust database of institutional data in an effort to identify characteristics of students who are successful (graduate from the institution) versus those who are not successful (dropouts). Methodology
Three separate entering freshmen cohort years (IPEDS based) are used in the current study: 1998, 1999, and 2000. These cohorts were followed through six plus years, from fall 1998 through spring commencement 2008. The Office of Institutional Research has maintained cohort databases since fall 1998 which include: student identifiers (name, social security number (SSN), and an internal number), ACT and SAT both composite and sub scores, gender, ethnicity, religious preference, home state, and high school data. A separate term related database was generated for each cohort for all fall and spring semesters through a six year span for each cohort respectively. Each database contained, in addition to the student identifiers in the cohort database, such items as: college, major, advisor, term GPA, degree sought, financial aid received, credit hours attempted, degree sought. Dropouts were identified by the term/year in which they dropped out. Graduating students are identified by the term/year in which they graduated. At the end of the six year span for each cohort every student was categorized by the changes of major by term and the degree of lateral movement (change of college) during their time at the university. An attempt was made to track stop out students; however, due to the exceptionally small numbers in this group that procedure was discontinued.
Belmont University has been an annual participant in the University of California, Los Angeles; Higher Education Research Institute (HERI); Cooperative Institutional Research Program (CIRP) Freshman Survey since 1994. Raw data for each cohort year was purchased, although it is now available at no charge. Following the six year span of study for each cohort year, each cohort database was matched to or partnered with its respective CIRP file. All data points reflecting dropout or success and term/year along with all the CIRP survey items were aggregated in a master file for each cohort. The cohort master files were subjected to one-way Analysis of Variance (ANOVA) with all items from the CIRP as dependent variables. The independent variables in the ANOVA were dropouts (DO) and graduates (UG). Those item variables with mean differences that were statistically significant (p<.05) were used in the study.
The university has administered a “home grown” graduating Senior Survey for approximately twelve years. Students are required to respond to the 60 item survey at the time they apply for graduation. Nine years ago, student identifiers (name and SSN) were included in the resultant data. The survey consists of three subsections asking for responses to learning experiences (outcomes), personal satisfaction with the Belmont experience and satisfaction with services and programs offered. Graduates from each of the cohorts were matched with senior surveys covering a six year post matriculation period in order to ensure the largest sample possible. Unfortunately, one full year (2004-05) of the Senior
61
Proceedings of the 5th Annual National Symposium on Student Retention. Copyright 2009. C-IDEA, The University of Oklahoma.
Survey data was not collected which did have the effect of reducing the number of students sampled, particularly in the 2000 cohort.
In the interest of time, effort, and maintenance of sanity this researcher decided to limit the number of possible correlations to a manageable 19 of 20 items from the “Objectives Considered to Be Essential or Very Important” which is the Goals/Values from the CIRP survey (scaled 1 = Least Important and 4 = Essential) and 24 items from the learning outcomes of the Senior Survey (scaled 1= No Significant Gain and 4 = Significant Gain). The assumption was made that Goals/Values in the CIRP may have relationships to the learning experiences (outcomes) response items in the Senior Survey. Such a result would be consistent with Astin’s (1993) Input-Environment-Outcome (I-E-O) model along with an institutional interest in seeing if the intent of entering students is matched with their perception of outcomes achieved as they graduate.
Belmont University has experienced unprecedented enrollment growth in the past ten years to an enrollment of nearly 5,000 as of fall semester 2008. The campus is residential for the first two years with first-time, full-time, degree seeking freshmen numbering 930 in fall 2008. Fifty-six percent of the freshmen are female, 61% are Tennessee residents, and 7% are multicultural (minority and international). Undergraduates make up 84% of the student body; 40% of whom are in music related programs (music business and commercial music). Results Table 1 represents pertinent retention/persistence attributes for each cohort.
Although cohort characteristics are similar from one cohort to another, one difference worthy of note is the 11% dropout rate for the 1st semester in the 2000 cohort. The university was faced with a larger than anticipated entering freshman class and the decision was made to house students in local motels as the residence halls were oversubscribed. This led to a greater than expected 1st semester dropout rate as students did not respond well to being housed off-campus. Female and minority percentages are representative of overall enrollment with the exception of the 1998 cohort minority graduates which is
62
Proceedings of the 5th Annual National Symposium on Student Retention. Copyright 2009. C-IDEA, The University of Oklahoma.
well below the 8% for the undergraduate student population. The retention rates (1st to 2nd year) and the 4th, 5th and 6th year graduation rates for the three cohorts are in line with those reported in the literature for a private Carnegie Master’s Institution (CSRDE Retention/Graduation Report: 2005-06). There were no differences relative to gender and the relatively small number of minorities represented in these cohorts precludes any statistical results for the ethnic groups represented. High school variable means (ACT composite score, GPA, rank in class,) are reported in Table 2. One-way ANOVA applied to each variable resulted in mean differences between the DO and UG groups that were significant at p<.05 for all three dependent variables. Each of the entering freshmen cohorts demonstrate high school characteristics that are consistent with previous research; successful students have higher ACT composite scores, higher high school GPAs, and higher class rank than those of unsuccessful students.
Insufficient financial aid funds are often a reason cited for students dropping out of college. When considering the influence of awarded financial aid on the relative success of our students, it became apparent that the amount of aid offered would also be relevant. The amount of financial aid awarded as a percentage of that offered is shown in Table 3. The dollar amounts of both offered and awarded are given as well. Belmont University packages aid all the way up to the total cost of attendance. The offered amount includes loans (including Parent PLUS loans) which students may not choose to accept, thus reducing the awarded amount. Although there is not a clearly defined relationship between aid offered and aid awarded, it is obvious that UG students are awarded larger amounts of aid and that, on average, the percentage of awarded to offered is lower for DO students.
Proceedings of the 5th Annual National Symposium on Student Retention. Copyright 2009. C-IDEA, The University of Oklahoma.
Change of major has been cited as a factor that may or may not play a role in successful completion of a college degree. This conundrum may well be due to differences in type of institution and/or the relationship of majors to one another. It is apparent from Table 4 (an aggregate of all three cohorts over a six year period), that unsuccessful students in this study are reluctant to change their major whereas successful students find it more advantageous to change major one or more times. Further, DO students may tend to remain in a major that may not be the best fit rather than seek assistance from an advisor. Although Table 4 does not indicate it, DO students that drop out in the first year are less likely to change their major as are those who enroll over several semesters before leaving. Those DO students who drop out after the first year tend to not change major as often as the UG students.
Upon establishing the retention status of all students in each cohort, students were matched to their CIRP survey raw data. The results of these matches are seen in Table 5. CIRP cohorts were tested for sample reliability and were found to be reliable within +/- 3.0% of the entire CIRP population for all statistically significant variables in all three cohorts.
Table 5 Entering Freshmen CIRP Survey Matches Cohort 1998 1999 2000 N 412 454 538 CIRP Matches 304 202 207 % match 74% 44% 38%UG N 241 278 316 CIRP Matches 159 126 83 % match 66% 45% 26%DO N 161 176 222 CIRP Matches 101 67 71 % match 63% 38% 32%
One-way ANOVA allowed for the determination of significantly different means of the selected dependent variables (CIRP responses) with regard to the independent variables UG and DO. The 1998 cohort had 26 variables, the 1999 cohort had 30 variables, and the 2000 cohort had 24 variables that showed significance at p<0.05 or greater. Those CIRP responses that were shared by two or more cohorts are shown in Table 6. The >and< signs indicate that one group mean was statistically higher or lower than the other for each CIRP variable. The only CIRP variable that was not equally shared was “voted in student election”. Self-reported high school grade point and ACT composite test score means were higher for the UG group which was determined to be the case using the student information database in Table 2 above. Those CIRP variables with higher means for the UG group were (including high ACT Composite and High School GPA means): “offered financial aid” (reason for choosing Belmont), “voted in student election” (previous activity), “mathematical ability” (self-rating), and “be elected to an academic honor society” (possible future activity). These six variables were designated as traits of persistent students.
64
Proceedings of the 5th Annual National Symposium on Student Retention. Copyright 2009. C-IDEA, The University of Oklahoma.
Those variables that had higher means for the DO group were: “creativity” (self-rating), “sex is ok if people like each other” (student opinion), “transfer to another college” (possible future activity), “smoked cigarettes” (previous activity), “drank beer” (previous activity), “partying” (hours per week spent), and “work full-time while attending” (possible future activity). These seven variables, in addition to self-reported lower ACT and High School GPA means, are considered to be traits associated with unsuccessful students.
Shared by all three cohorts Mean Mean Average High School Grade DO < UG Offered financial assistance DO < UG Sex OK if people like each other DO > UG Transfer to another college DO > UGShared among two of three cohorts Mean Mean Smoked Cigarettes DO > UG Drank Beer DO > UG Voted in Student Election DO = UG Mathematical ability DO < UG Creativity DO > UG Partying DO > UG Work full-time while attending DO > UG Be elected to an academic honor society DO < UG ACT Composite Score DO < UG
Table 6 Shared CIRP Variables
The CIRP population of retained students was matched to the Senior Survey with the results shown in Table 7.
The unfortunate loss of Senior Surveys for the 2000 cohort is obvious and because of this reduced number, the results of the three cohorts were combined to yield responses from 37% of the graduating seniors in lieu of analyzing each cohort separately. The following tables were developed to demonstrate relationships between CIRP Goals and the Senior Survey responses to learning outcomes statements in which students were asked to reflect on the level of gain they had made during their time on campus. Correlation analyses of any pairing of goals to outcomes that were statistically different (p<.05) were used in the final analysis. Nineteen Goals statements were common in all three editions of the CIRP. Of the 19 Goals, 12 were found to occur more often at p<.05 or greater as correlates, either negatively or positively related. These Goals were broadly categorized into four groups: Creative: Personal: Become accomplished in performing arts Have administrative responsibility Write original works Obtain recognition from colleagues Create artistic work Be very well off financially Social: Political:
65
Proceedings of the 5th Annual National Symposium on Student Retention. Copyright 2009. C-IDEA, The University of Oklahoma.
Participate in community action programs Keep up to date with political affairs Help others in difficulty Influence political structure Promote racial understanding Be a community leader
The results of pairing CIRP Goals Groups and the Senior Survey learning outcomes are seen in Table 8. The relationships are expressed as either positive (+) or negative (-) correlations. The table is arranged such that gains in outcomes associated with the importance of the four groups of goals are listed in decreasing order of the number of associations.
Learning Outcomes Political Personal Social CreativeSpeaking clearly and effectively to groups. * + + + -Leadership abilities. + + +Reading with ability to analyze and comprehend. + + -Writing clearly and effectively. * + + -Writing short papers and reports (1-5 pages) + + -A global perspective on issues and problems. + + -A broad general education covering many different fields of knowledge. * - - -Problem solving skills. * + +Appreciation of literature, art, music, and drama. + +Having productive work relationships with both men and women. * + +
An historical perspective on issues and problems. + +Job seeking skills (e.g., interviewing, resume' writing). + -Gaining an awareness of the moral/ethical issues in society. * + -Writing business memos and letters. - -Spiritual growth and development. * +Interacting easily with people from other cultures. * -Effectively using technology (e.g., computers, high-tech equipment). * -Effectively participating in projects as a team member rather than as an individual. * -Awareness of the impact of new technology and science upon society. -Learning about research methods in your field. -* Similar to NSSE Institutional Contribution items
The outcomes correlates for the Political and Personal groups are representative of students motivated toward careers in business, healthcare, and the liberal arts and sciences (speaking, leadership skills, writing, problem solving, teamwork, global and historical perspectives). The Social group correlates are interesting in that some of the outcomes are shared by the other groups: speaking, leadership skills,
66
Proceedings of the 5th Annual National Symposium on Student Retention. Copyright 2009. C-IDEA, The University of Oklahoma.
problem solving, and teamwork but distinct in two outcomes specific to the social realm (awareness of moral/ethical issues in society and spiritual growth and development). Within the Creative group the only positive outcome correlate is “Appreciation of literature, art, music, and drama”. The negative correlations for the other fourteen outcomes are somewhat disconcerting until one considers that the two majors with the largest enrollments are indeed chosen by those considered to be more creative students (Music Business - MBU and Commercial Music- COM). These students may be more intent on creating and/or performing and may be more consumed with studio activity and practice time than with other competing pursuits. Those outcomes identified as being similar to the Institutional Contribution items in NSSE shown by Williford and Wadley (2008) to be those items that students who remained at Ohio University (stayers) exhibited higher means and thus higher levels of engagement than those who left. Most of these items showed a negative correlation in the Creative group which further indicates that this group of students, although successfully completing their undergraduate career are not as fully engaged in other pursuits. Testing this assumption was clearly the next step. As mentioned previously, roughly 40% of the undergraduate enrollment at Belmont is made up of these two majors; MBU enrollment being roughly 3 times larger than COM. The two programs are very different in terms of the degrees associated with the two programs; the Music Business program leads to a Bachelor of Business Administration degree while Commercial Music leads to a Bachelor of Fine Arts degree. Results of a correlation analysis pairing the “Become accomplished in performing arts” CIRP Goal with the Senior Survey learning outcomes statements are shown in Table 9. Table 9 Learning Outcomes Associated with "Become accomplished in performing arts" Goal
MBU COM BothNumber of matches of CIRP/Senior Survey matches 99 32 131Percentage of CIRP/Senior Survey matches 32.50% 10.50% 43.00%
Appreciation of literature, art, music, and drama. + -Writing clearly and effectively. * - +Writing short papers and reports (1-5 pages) - -The ability to think analytically and logically. * -Reading with ability to analyze and comprehend. -Learning about research methods in your field. -Effectively using technology (e.g., computers, high-tech equipment). * -Achievement of knowledge, skills, and education needed in your major field. * -A broad general education covering many different fields of knowledge. * -Gaining an awareness of the moral/ethical issues in society. * -An historical perspective on issues and problems. -Impact of the Belmont experience on your becoming a lifelong learner. -* Similar to NSSE Institutional Contribution Items
The influence of MBU responses is clear when the two programs are analyzed separately and when they are combined. However, the premise that these students share an emphasis on creative ability that
67
Proceedings of the 5th Annual National Symposium on Student Retention. Copyright 2009. C-IDEA, The University of Oklahoma.
negatively influences their attitudes toward other pursuits does have a basis in fact. All of the outcomes that are similar to NSSE items are negative correlates for the MBU graduates. Students pursuing a BBA in Music Business indicate that they have not gained significantly in those learning outcomes that are assumed to be measures of good educational practices. Conclusions The results of this study are not unusual in that the attributes of Belmont entering freshmen indicate that retention and persistence to graduation are strikingly similar to other studies. Pre-college achievements including high school GPA, rank, and ACT composite scores can be used as predictors of retention in the first year of college and as good indicators of persistence to graduation. Retained students have higher mean values for each of these measures while their counterparts demonstrate lower achievements. Another familiar reason for attrition is the amount of financial aid available to students who are at risk to drop out. Of course, if financial aid packages are determined, in part by criteria that include pre-college achievements, students who score lower will not receive aid that fully meets their need. The influence of change of major has been cited as a cause in some retention studies (Gillespie and Noble, 1992; Harmston, 2004). This deferential may be due more to the type of institution and the types of major programs offered. The institution and the student share responsibility for the student’s maintenance of a major. Fair and impartial advisors can be influential in helping a student determine the program that best suits the aspirations of the student. Students, on the other hand, should be cognizant of the requirements of the program and be prepared to make informed decisions about continuing in a major that does not meet their expectations, imagined or real. Belmont students who change majors have a higher retention rate than those that persist in their incoming major. Partnering student information databases with the CIRP survey items produced an interesting series of results. Persistent students shared six variables that had higher means than those of the unsuccessful students. Five of these variables are broadly related to academic pursuits. In addition to higher High School GPA and ACT Composite scores three of the variables indicated these students were offered financial aid, have a high mathematical ability and expected to be elected to an academic honor society. Taken in combination, these variables could describe students with high academic expectation. On the other hand, unsuccessful students shared seven variables that were broadly related to a somewhat less noble pursuit. These variables included lower High School GPA and ACT Composite means, as well as, smoking cigarettes, drinking beer, partying, a liberal view of sexual activity, intending to work full-time while attending college, and potentially transferring to another college. These variables can be readily ascribed to behavior that could be classified as risky. The one variable that does not fit into this risky behavior categorization is the self-rating of being highly creative. The results of partnering the Senior Survey database with the CIRP database for those students who were persistent to graduation were equally interesting. Correlation of CIRP Goals/Values with Senior Survey Learning Outcomes indicated arbitrary groupings based on shared outcomes. The arbitrary groupings are: Creative, Personal, Social, and Political. Most of the correlations were positive, however, several were negative. Of these groups, the Creative group showed negative correlations in 14 of 20 outcomes, seven of which are similar to the NSSE Institutional Contribution items. The sheer number of negative correlates indicates disengagement rather than engagement in academic pursuits. The Creative group had only one positive correlation with a Senior Survey outcome: “Appreciation of literature, art, music, and drama. Creativity is a constant in the lives of a significant number of students at Belmont, as previously stated, 40% of the undergraduate student body are in music related programs. When Music Business and Commercial Music Senior Survey responses are correlated with the CIRP Goal: “Become accomplished in performing arts” a pattern similar to the one described above is
68
Proceedings of the 5th Annual National Symposium on Student Retention. Copyright 2009. C-IDEA, The University of Oklahoma.
apparent. Although Commercial Music majors correlate positively with “Appreciation of literature, art, music, and drama”, Music Business majors do not. In fact, for this major, there are no positive correlates among the outcomes tested. Again, there is evidence that Music Business majors may not be fully engaged in other pursuits.
Epilogue
When one-third of the undergraduate student body is in a single program, it is expected that the
group would exert some degree of influence on the institution’s retention and graduation rates. In the spring of 2004, the Music Business program became the mainstay of the new Mike Curb College of Entertainment and Music Business with programs in Audio Engineering Technology, Entertainment Industry Studies, and Songwriting spinning off as new majors with BA and/or BS degrees awarded. Prior to the formation of the new college, the quality of advising (a response on the Senior Survey) in the Music Business major was questionable. The Office of Institutional Research produced a Senior Survey report and presented the findings to the Provost’s Council Retreat in August 2005. The findings indicated that 67% of the students in Music Business were dissatisfied with the advising they were receiving. The college opened the First Year Experience and Advisement Center in the fall of 2006 with the expressed mission of “helping students identify and achieve their academic goals and follow a rewarding path toward personal and intellectual discovery”. The office has a staff of two including a professional counselor. Faculty members of the college are expected to serve the advising center 2 hours each week for 12 weeks both fall and spring semesters. The advisee to advisor ratio is 85:1. Since the inception of the Advising Center, the dissatisfaction with advising has decreased to less than 40%. First year experience students have indicated a 99% satisfaction rate with their experience in the advising center (data from a survey taken after each student has completed an advising session).
The university has enjoyed a 68% increase in enrollment since the fall of 2000; the Music Business program has shown a 53% increase. First to second year retention for the university is 79% while that of Music Business is 78%. The most current six year graduation rates are 67% for the university and 72% for Music Business (up from this study’s three cohort averages of 60% for the university and Music Business at 66%). The program has become a “best practice” across the campus in regard to retention and persistence and concomitantly the university has benefited.
69
Proceedings of the 5th Annual National Symposium on Student Retention. Copyright 2009. C-IDEA, The University of Oklahoma.
References Adelman, C. (1999). Answers in the tool box: academic intensity, attendance patterns, and bachelor’s
degree attainment. Washington, D. C.: U.S. Department of Education. Adelman, C. (2006). The toolbox revisited: paths to degree completion from high school through college.
Washington, D. C.: U.S. Department of Education. Astin, A. W. (1993). What matters in college?: Four critical years revisited. San Francisco: Jossey-
Bass. Astin, A.W. and Oseguera, L. (2002). Degree attainment rates at American colleges and universities.
Los Angeles: Higher Education Research Institute, UCLA. CSRDE Retention Report. (2006). Center for Institutional Data Exchange and Analysis. The University
of Oklahoma. Norman, OK. Gillespie, M. and Noble, J. (1992). Factors affecting student persistence: A longitudinal study. ACT
Research Report Series, No.92-4. Iowa City, IA: ACT, Inc. Harmston, M., (2004). Cross-validation of persistence models for incoming freshmen. (AIR Professional
File No. 93). The Association for Institutional Research. Hezlett, S., Kuncel, N., Vey, A., Ahart, C., Ones, D., Campbell, J., and Camara, W.J. (2001). The
effectiveness of the SAT in predicting success early and late in college: A comprehensive meta-analysis. Paper presented at the National Council of Measurement in Education, Seattle, WA.
Kuh G. D. (2003). The national survey of student engagement: conceptual framework and overview of
psychometric properties. Retrieved April 14, 2009, from Indiana University Web site: http://nsse.iub.edu/pdf/conceptual_framework_2003.pdf.
Noble, J. and Sawyer, R. (2002). Predicting different levels of academic success in college using high
school GPA and ACT Composite score. (ACT Research Report No.2002-4). Iowa City IA: ACT, Inc.
Pascarella, E. T. and Terenzini, P. T. (1991). How college affects students. San Francisco: Jossey-Bass. Perkhounkova, Y., Noble, J., and McLaughlin, G. (2006). Factors related to persistence of freshmen,
freshman transfers, and nonfreshman transfer students. (AIR Professional File No.99). The Association for Institutional Research.
Tinto, V. (1975). Dropout from higher education: A theoretical synthesis of recent research. Review of
Educational Research, 45, 89-125. Williford, A. M. and Wadley, J.Y. (2008). How institutional research can create and synthesize retention
and attrition information. (AIR Professional File No. 108). The Association of Institutional Research.
70
Proceedings of the 5th Annual National Symposium on Student Retention. Copyright 2009. C-IDEA, The University of Oklahoma.
FYI as a Diagnostic of Student Academic Performance
This study hypothesized that student performance in a First Year Experience program, representing an initial sampling of students’ academic behaviors, would correlate with subsequent academic success. Subjects were 1501 first-time, first-year students attending Columbia Basin College in fall quarter, 2007, whose FYE performance was graded by program facilitators. Students passing FYE subsequently obtained significantly higher GPAs than those failing FYE, and displayed higher retention rates for the next 3 quarters. While conventional research on FYE’s has focused on program impacts (e.g., learning or socialization), this study suggests viewing FYE as an initial sampling of academic behaviors that can identify at-risk students and trigger interventions in advance of their beginning their actual academic programs. Introduction
A majority of colleges and universities offer some form of first-year seminar (FYS) designed to enhance student academic performance as well as retention and completion rates (Pascarella and Terenzini, 2005). The exact format of FYSs varies considerably from college to college, with some operating like a traditional course with a single instructor, while others are short programs offered at or before the start of school and involving multiple instructors, facilitators and current students as discussion leaders and guides. Programs may target specific groups or entire cohorts, may be elective or required—the variations seem endless. Regardless, the primary goal is to improve retention and completion rates, which have been seen as particularly problematic for students with multiple risk factors (Farley, 2001, Opp, 2002).
Several different approaches to FYS have emerged over the years, beginning with a “learning strategies model” introduced by John Gardner at the University of South Carolina in 1972. The pedagogy of such courses was influenced by research on adult learning and teaching underprepared students of all ages (Ryan and Glenn, 2004). Initially, this model typically included instruction on study skills, textbook reading skills, time management, note taking and test taking skills. The seminars were later expanded to include metacognitive and self-regulation skills. The assumption was that, for many students, these were new skills that needed to be learned for academic success, could be taught in a constrained time frame, and were skills that college faculty were often unwilling or unable to address in conventional coursework.
A second model-- “academic socialization”-- began to appear in the late 70’s and early 80’s, based on the reasoning that first-generation and nontraditional students needed to become integrated into the culture of the college. These programs gradually eclipsed the more study-skills oriented programs, focusing on history of the institution, community building, personal values, relationships, and diversity awareness. These programs were influenced by Tinto’s (1993) model of retention in which student attrition could be attributed largely to lack of social and academic integration of the student with the institution and resulting inadequate commitment to remain in school. More recently, FYS programs have tended to integrate the two approaches (Ryan and Glenn, 2004).
Regardless of the approach, evaluations of program impacts have generally focused on first to second year retention. In their review of the FYS evaluation literature, Pascarella and Terenzini (2005)
71
Proceedings of the 5th Annual National Symposium on Student Retention. Copyright 2009. C-IDEA, The University of Oklahoma.
concluded that there was consistent evidence of positive and statistically significant impacts on retention for students who take FYS. They found evidence of benefits to all types of students regardless of gender, age, or risk factors. Recent studies, using more rigorous research methodology and controlling for demographic and pre-college characteristics, have been less positive. For example, Pascarella and Terenzini (2005) reviewed a study by Sax and Gilmartin (2002), in which data were gathered on 43 FYS programs around the country, involving over 3,000 students. No significant impact on second-year enrollment was found. Nonetheless, the reviewers concluded that FYS programs “appear to promote both persistence and college grade performance” (p. 403).
The purpose of FYS to date, then, has been to directly impact student academic performance and retention. The goal has been to either provide effective learning strategies, to facilitate the socialization process, or both, with the hope of particularly impacting nontraditional and minority students who have consistently demonstrated lower retention and completion rates than other students. However, there are other possible purposes for FYS programs that have not yet been considered in the research literature. One such purpose is to elicit a sample of student academic behavior that can be used for diagnostic and feedback purposes (e.g., input into “early alert” interventions).
The First Year Introduction (FYI) program at Columbia Basin College (CBC), for example, is required of all new, degree- and certificate-seeking students and includes four full days of activities occurring just prior to the start of fall quarter. The program includes sample classes by CBC faculty members, campus tours, library assignments, written homework and a final grade. In essence, FYI is a mini-academic quarter during which students are asked to demonstrate many of the behaviors that will be required of them at the college.
Performance on FYI could serve as a diagnostic tool to 1) identify students who are likely to experience academic performance problems, and 2) provide an opportunity for an “early alert”-type intervention. Currently, students can obtain low grades for two entire quarters before they officially enter academic probation and receive regular advising and support. Two quarters of below 2.0 GPA performance can be very difficult to overcome, even for the well-motivated, and can contribute to students giving up and withdrawing from school. An earlier diagnosis might result in more effective intervention outcomes.
Several hypotheses were developed regarding the anticipated relationships between FYI performance and subsequent academic performance. It was predicted that students who passed FYI, compared to those who failed FYI, would:
• Earn higher academic grades in the fall quarter (Hypothesis 1), • Achieve a greater number of course credits in the fall quarter (Hypothesis 2), • Earn higher academic grades in winter and spring quarters (Hypothesis 3), • Display higher retention rates in winter and spring quarters (Hypothesis 4).
Methodology Subjects
Subjects in this study were 1501 first-time first-year students attending Columbia Basin College in fall quarter, 2007. There were more females (n=824, 54.9%) than males (n=677, 45.1%). Most were enrolled as transfer students (n=1229, 81.9%) who planned to continue their education at the baccalaureate level. Approximately 18% were workforce students (n=263, 17.5%) attending to obtain job skills and enter the workforce upon graduation. Most students (n=1020, 68.0%) were attending at a full-time, 10-credit level; the mean number of credits was 12.5 (St. Dev.=3.7). Most students were White (n=1061, 70.7%) with a smaller number of Hispanics (n=335, 22.3%), Blacks (n=15, 1.0%), Asians (n=50, 3.3%), and Native Americans (n=30, 2.0%).
72
Proceedings of the 5th Annual National Symposium on Student Retention. Copyright 2009. C-IDEA, The University of Oklahoma.
First Year Introduction Program
Based on an analysis of the retention literature and previous experience in developing programs to assist students, CBC developed an intrusive, integrated, and comprehensive program designed to equip all new degree- and certificate-seeking students with the knowledge, skills, and attitudes to maximize their potential for success. Following nine months of debate, planning and development, CBC implemented "FYI: First Year Introduction," a mandatory, pass/fail graded, 12-hour transition experience for all new students.
FYI is composed of small group seminars, learning modules, and sample classes completed prior to the start of each quarter. Small group seminars give students the opportunity to get to know each other at the same time they are learning critical college information. Students choose learning modules that meet their needs or pique their interest. Within sample classes, instructors introduce students to particular disciplines and to their expectations regarding reading, writing, class participation, and assessment. Throughout, students complete assignments, take class notes, and participate in active learning exercises. Successful completion is necessary for subsequent registration.
Since 2004, FYI has been shown to improve total quarter-to-quarter retention by about 20%. Under-represented student retention after FYI has increased roughly 30%, when compared to pre-FYI data. Self-reported outcomes include a greater awareness of student responsibilities for their education; greater degree of comfort in the college environment; knowledge and use of support services; establishment of relationships with faculty, staff and peers; use of the library; and the recognition of the importance of diversity in today’s world.
Data Collection
CBC’s data warehouse was used to extract student grades in FYI and COMPASS placement test scores, as well as academic grades and credits earned for each quarter of the 2007-08 academic years. The data warehouse was also used to determine retention rates for winter and spring quarters. Grades for the fall 2007, FYI cohort were reported for 1364 of the participants, of whom 1241 passed (91.0%), 117 failed (8.6%) and 6 withdrew from the program (0.4%). Results Hypothesis 1
Hypothesis 1 was that those passing FYI would receive higher academic grades than those failing FYI. As shown in Table 1, students who passed FYI had a significantly higher first quarter GPA than those who failed FYI. Those passing FYI achieved a 2.6 average GPA, roughly a “C+” overall, while those failing achieved only a 1.4, roughly a “D” grade on average, a difference of over a full grade point. Table 1 Mean differences in 1st quarter GPA by Pass/Fail FYI
FYI Pass
FYI Fail
Mean Diff. t df p
College GPA 2.60 1.41 1.19 12.16 1493 .000001 Hypothesis 2
Hypothesis 2 proposed that students passing FYI would complete a greater number of quarter credits than those failing FYI. This proved to be the case, as shown in Table 2. Those passing FYI accumulated nearly 3 more credits (43.4% more) than did those failing FYI, a highly significant result.
73
Proceedings of the 5th Annual National Symposium on Student Retention. Copyright 2009. C-IDEA, The University of Oklahoma.
Table 2 Credits achieved in first quarter by those passing vs failing FYI
Hypothesis 3 predicted higher academic grades in winter and spring quarters for those passing versus those failing FYI. As shown in Table 3, mean GPAs for those passing FYI continued to exceed those failing FYI, with mean differences highly significant. Those passing FYI had nearly a ¾ point higher GPA than those failing, while the difference was roughly ½ point in the spring.
Table 3 Winter and Spring Quarter GPAs for those passing vs failing FYI
Hypothesis 4 predicted higher rates of retention in winter and spring quarters for those passing FYI. Table 4 shows the number of students initially, by FYI performance, and for winter and spring quarters. Of the initial 1323 who passed FYI prior to fall quarter, 1111 (84%) returned for winter quarter and 1000 (75.6%) returned for spring quarter. Of those failing FYI, 63 (36.6%) returned winter quarter and 62 (36.0%) returned in the spring. The retention rates for those passing FYI were over twice as high as for those failing FYI.
Table 4 Retention rates in Winter and Spring quarters for those passing vs. failing FYI Fall Quarter Winter Quarter Spring Quarter FYI Performance:
Most research on First Year Seminar programs has focused on the ability of such programs to improve student retention and completion rates. However, the present study viewed FYS performance as an indicator of future student academic performance. Four hypotheses were proposed, including predictions that those who passed would achieve higher grades, earn more credits, and display higher rates of retention. The data indicate strong support for each of the hypotheses. Students who pass FYI generally earn higher grades and have higher retention rates than those students who fail FYI.
74
Proceedings of the 5th Annual National Symposium on Student Retention. Copyright 2009. C-IDEA, The University of Oklahoma.
One question that arises from these results is why students are failing FYI. The program involves some work but is not particularly challenging academically. However, it is possible that the students who fail are simply those with less academic preparation. As a way to assess this theory, student COMPASS placement test scores for writing, reading and mathematics were added to the dataset and the college-level placement scores of students who passed and those who failed FYI were compared. In terms of writing, 65.4% of those passing FYI scored at college-level compared to 45.5% for those failing FYI, a significant difference in placement rates (chi-squared (2)=23.8, p< .000001). For reading, 68.8% of those passing FYI scored at college-level versus 62.7% for those failing FYI, not a significant difference (chi-squared (2)=2.4, NS). For math placement, however, 25.7% of those passing FYI scored at college level compared to 7.6% for those failing FYI (chi-squared (2)=26.8, p< .000001). These results suggest that those failing FYI are also those with performance deficiencies in writing and mathematics, two areas key to academic success in college. Note also that college math placement rates for both groups are alarmingly low.
In addition to weaknesses in academic preparation, students who fail FYI may exhibit attitude and motivational deficits. Earlier research has shown that students with poor academic performance generally demonstrate low self-efficacy beliefs regarding their own college success, especially those who are first-generation college students (Bandura, 1997; Chung & Sadlacek, 1999). At the moment, FYI does not systematically assess attitudinal and motivational dimensions, but it has been proposed that the Learning and Study Strategies Inventory (LASSI) , be administered prior to the start of FYI at the time of placement testing. The LASSI is a 10-scale, 80-item assessment tool that assesses students’ awareness and use of learning strategies, attitude towards college and academic success, motivation to succeed, and ability to concentrate. The instrument has been shown to not only be a reliable and valid diagnostic tool, but also predictive of academic success. Potential Applications
At this point, the FYI process is designed more for information dissemination and learning than for providing feedback, but structural changes could be made to improve the feedback element. Currently, CBC utilizes an “early alert” program in which faculty are asked to contact the New Student Center by the mid-term with the names of students who are experiencing academic difficulties. A new software program developed specifically for early alert is being piloted to electronically provide this information in a standard format to both advisors and students. The shortcoming of the system is the time lag; by the time contact is made with advisors, advisors contact students and a strategy for improvement is designed, the quarter is essentially over. The “early alert” process becomes a “too late alert process” due to the logistics involved.
Sharing FYI performance information prior to the start of students’ matriculation would greatly enhance the existing early alert process. Although the data used in this study do not indicate why students fail at FYI, informal discussions with the program director, CBC administrators, and program facilitators suggest that those who fail FYI tend to display poor attendance, arrive late at sessions, fail to complete and/or submit assignments, and submit assignments of poor quality. That is, they display the same behaviors during FYI that contribute to poor grades in traditional courses. If feedback could be provided directly to low-performing students near the conclusion of FYI, along with a discussion about the implications for future academic success, this feedback could, in fact, constitute a more timely and perhaps more effective version of the early alert process proposed above. Students receiving the low-performance feedback might also be matched to a counselor, with meetings to be held prior to the start of the quarter.
It should also be noted that the results of this study have significantly altered the College’s FYI remediation requirements. Previously, students who failed FYI were required to re-take an abbreviated FYI workshop. Instead, beginning in 2009, FYI failures will be required to complete one of two, 2-credit college skills courses - Education 100 (College Success) or Education 135 (College Major/Career Planning.
75
Proceedings of the 5th Annual National Symposium on Student Retention. Copyright 2009. C-IDEA, The University of Oklahoma.
Additional work could also be done to enhance the feedback aspect of FYI, so that it might resemble a form of “assessment center” as used in the private sector for hiring/promotion decisions or for developmental purposes. Assessment centers typically involve multiple raters evaluating participants on multiple dimensions of performance, include processes for reaching consensus on ratings, and provide for feedback to the participants (Thornton, 1992). Additional work would be needed to identify the key dimensions of student performance, develop measurement tools and rating scales, and train facilitators in the use of these instruments. Implications for Future Research
The present study has several potential shortcomings that could be addressed in future research. The program duration is only four days and involves a limited number of assignments. Facilitators tend to be focused on content rather than evaluation. Further, the dichotomous pass/fail grading structure provides only a limited picture of student performance. A grading scale with multiple points, such as the traditional letter grade or decimal grading convention, would allow more sophisticated analyses and a deeper examination of findings. Further, the current grade reflects a single, global dimension of performance. It would be extremely helpful to obtain performance information on discrete dimensions of performance (e.g., attendance, punctuality, and quality of work) and more subjective factors such as motivation, interaction with peers, and interaction with faculty. Efforts could also be made to expand the existing evaluation system to include peer feedback, as well. Fellow students are likely to have a unique and potentially valuable perspective on student performance. Thus, much can be done to improve the measurement of student performance in FYI.
Conclusion
In conclusion, First Year Seminar programs are becoming ubiquitous on college campuses, requiring a vast amount of planning, logistics support and implementation at each campus. Given the resources expended, it only makes sense to obtain as much value as possible from these programs. Previous research dating back over twenty years suggests that such programs have a positive impact on student academic performance, retention and completion. It is possible that these impacts can be substantially increased by viewing FYS programs as indicators of future student academic behavior, building in a more conscious process of student evaluation and feedback, and creating an effective “early alert” process for students who are likely to fail or drop out.
76
Proceedings of the 5th Annual National Symposium on Student Retention. Copyright 2009. C-IDEA, The University of Oklahoma.
References
Bandura, A. (1997). Self-efficacy: the exercise of control. New York: Freeman. Chung, Y. Barry & Sedlacek, William E. (1999). Ethnic differences in career, academic, and
social self-appraisals among incoming college freshmen. Journal of College Counseling, 10990399, 2(1).
Farley, J.E. (2005). Contesting our everyday work lives: the retention of minority and working-class sociology undergraduates. The Sociological Quarterly. 43 (1), 1-25.
Opp, R.D. (2002). Enhancing program completion rates among two-year college students of color. Community College Journal of Research and Practice. 26, 147-163.
Pascarella E.T. & Terenzini, P.T. (2005). How college affects students. San Francisco: John Wiley & Sons.
Ryan, M.P. & Glenn, P.A. (2004). What do first-year students need most: learning strategies instruction or academic socialization? Journal of College Reading and Learning. 34(2), 4-28.
Sax, L. & Gilmartin, S. (2002). A study of first- to second-year persistence. Unpublished manuscript. Los Angeles: University of California, Higher Education Research Institute. Tinto, V. (1975). Leaving college: Rethinking the causes and cures of student attrition. Chicago: University of Chicago Press.
Thornton, G.C. III (1992). Assessment centers in human resource management. Reading, MA: Addison-Wesley.
77
Proceedings of the 5th Annual National Symposium on Student Retention. Copyright 2009. C-IDEA, The University of Oklahoma.
Identifying ‘Hard-to-Reach’ Students and Strategies for Intervening Before It Is Too Late
Abstract - On every campus, there exists a group of at-risk students that remains elusive to traditional intervention strategies. While these students have varying attitudes and needs, they share one characteristic: they are less responsive to outreach efforts. These students may not recognize their need for academic, career, personal, or financial assistance even when made aware that support is available. Or, they may not yet be ready to acknowledge these challenges to themselves or others. Too often, the hopes and dreams of these hard-to-reach students may be unrealized without the opportunity for successful intervention. With the changing demographics of first-year learners, we anticipate an increase in students who fall into this at-risk but harder-to-reach category. Today’s economy may further intensify the strains on these students. How do you reach students who could benefit from your services, but who may be less receptive? How can you support their transition to college, while they juggle jobs, family responsibilities, financial need, and academic stress? This paper focuses on ways to identify these hard-to-reach students and implement successful intervention and retention strategies. We outline some of the characteristics of this population through analysis of data from the College Student Inventory™, sharing case studies of effective interventions. Introduction
On every campus, there exists a group of at-risk students that remains elusive to traditional intervention strategies. While these students have varying attitudes and needs, they share one characteristic: they are less responsive to outreach efforts. These students may not recognize their need for academic, career, personal, or financial assistance even when made aware that support is available. Or, they may not yet be ready to acknowledge these challenges to themselves or others. Too often, the hopes and dreams of these hard-to-reach students may be unrealized without the opportunity for successful intervention.
In the past, students whom one might consider to be “hard-to-reach” may have been side-stepped in interventions, given they require more attention or novel approaches. Or, they simply may appear not to need support. The ramifications of the current socioeconomic environment and the reality of students arriving to college with varying levels of academic preparation, necessitate a renewed perspective toward interventions on behalf of student success. As we take a closer look at how to serve these students, we inquire, how do you reach students who could benefit from your services, but may be less receptive? How can you support their transition to college, while they juggle jobs, family responsibilities, financial need, and academic stress? Are campus programs seen as something apart from the students’ experience, rather than integrated into its daily occurrence?
This paper focuses on how to identify hard-to-reach students, using the College Student InventoryTM as a conceptual framework for this definition. Examples of how to approach these students are illustrated by successful student intervention programs at Delgado Community College; Rutgers, The State University of New Jersey; Montana State University; Silver Lake College; and Mid-South Community College.
78
Proceedings of the 5th Annual National Symposium on Student Retention. Copyright 2009. C-IDEA, The University of Oklahoma.
Data
The College Student Inventory™ Form B (CSI), from the Noel-Levitz Retention Management System™ (RMS) has its roots in academic and social motivation theories and cognitive and social psychology. It is an assessment tool that aims to create a coherent framework for understanding human motivation and identifying specific motivational variables that are most closely related to persistence and academic success in college. These variables then lend themselves to interventions that are directed at changing student behavior toward more successful outcomes. The independent and summary scales of the CSI focus on those areas of social and academic integration that reveal students’ readiness to become fully engaged on their campus. The interventions that are derived from the scales are designed as an early intervention tool to assist college advisors in helping each student attain the intellectual and personal growth that lie within his or her capacity. This is done through an assessment of students’ personal and academic needs, and students’ strengths and coping mechanisms. The goal is to understand the students’ attitudes and motivational patterns to make interventions more successful.
The CSI-B survey instrument consists of 100 questions that comprise 17 motivational scales. These scales probe the students’ desire to finish college, attitude toward educators, intellectual interests, study habits, math and science confidence, verbal confidence, career closure, family emotional support, sense of financial security, sociability, opinion tolerance, receptivity to academic assistance, receptivity to career counseling, receptivity to financial guidance, receptivity to personal counseling, receptivity to social enrichment and their desire to transfer. All raw scales scores are translated into percentiles and displayed on advisor, coordinator and individual student reports.
Additionally, four summary scales are computed from the CSI survey data that measure a student’s dropout proneness, predicted academic difficulty, educational stress and overall receptivity to institutional help. These composite scales are included in the coordinator report of the Retention Management System as a means to help campuses prioritize their outreach to incoming students. For instance, dropout proneness indicates students who historically may have a pattern of intellectual or motivational traits generally associated with dropping out of college. Comparably, the predicted academic difficulty scale provides some indication of students who may experience academic difficulty in college, whereas the educational stress scale gives a sense of students’ perspective toward the emotional aspects of the college or university experience. Students’ receptivity to institutional help expresses their desire for academic assistance, personal counseling, career counseling, financial guidance, and social enrichment. These summary scales are also translated into percentiles, but then expressed as stanines.1
The Form B version of the College Student Inventory is completed by approximately 100,000 students each year at more than 250 different institutions, where many institutions have integrated the CSI into their early alert and student success initiatives. Over the past five years, Noel-Levitz has examined this data from many different perspectives and has discovered important trends by ethnicity, age, first generation students and gender. These results are published in the Noel-Levitz National Freshman Attitudes Reports which highlight the attitudes and motivations of first-year students nationally at the beginning of their undergraduate experience. It is the experience of the researchers that these demographic trends are robust and recur in each year’s data.
This study is based on data collected from the CSI-B in the summer and fall of 2008. A total of 98,120 first-year college students nationwide completed the 100-item attitudinal survey during orientation or within their first few weeks of classes. Most students completed the survey online while others used a traditional paper-and-pencil format. Respondents were enrolled at a broad cross-section of 278 institutions, with 38.4 percent of respondents coming from four-year private institutions, 39.5 percent from four-year public institutions, and 22.1 percent from two-year institutions. Consistent with national trends, respondents’ ethnic/racial breakdowns were as follows: 57.5 percent white/Caucasian, 20.8 percent black/African American, 9.5 percent Hispanic or Latino, 3.5 percent Asian or Pacific Islander, 0.8 1 Stanines are based on a military classification called “standard nine” that assigns nine categories to a percentile distribution. Typically, stanine scores are interpreted as above average (9, 8, 7), average (6, 5, 4), and below average (3, 2, 1).
79
Proceedings of the 5th Annual National Symposium on Student Retention. Copyright 2009. C-IDEA, The University of Oklahoma.
percent American Indian or Alaskan Native and 8.0 percent reporting “multiethnic or other,” or preferred not to respond. Overall 27 percent of respondents were first-generation students. This average masks large differences by ethnic groups. Half of Hispanic/Latino students are first-generation students, compared to 22 percent of white/Caucasian students. The average age of respondents was 20.
All Survey Items
Students at 4-Year private
institutions
Students at 4-Year public
institutions
Students at 2-Year
institutions
First Generation
Students
Non-first Generation
Students
Overall national
percentages Number of respondents 37,722 38,765 21,633 26,199 66,847 98,120
Percent distribution 38.4 39.5 22.1 26.7 68.1 100
Percent male 47.6 42.8 53.5 43.0 46.3 45.5 Percent female 52.4 57.2 46.5 57.0 53.7 54.5 Racial/ethnic origin by column Percentage by ethnic group Black/African-American 19.0 25.1 16.2 30.2 62.7 20.8
American Indian or Alaskan Native 0.6 1.0 1.1 29.8 65.1 0.8
Asian or Pacific Islander 3.8 2.6 4.4 30.1 62.1 3.5
Multiethnic or other ethnic origin 3.6 2.9 3.1 23.2 69.8 3.2
Prefer not to respond 2.6 1.8 2.4 22.0 66.7 2.2
Note: Percent values may not add up to 100 due to a small percentage of missing values
Table 1: Fall 2008 CSI-B Survey Respondents Methodology
In order to identify students who were hard to reach, the survey data was divided into two groups, based on the receptivity to institutional help scale, using percentile scores rather than stanines.2 Students whose overall receptivity was at the 50th percentile or below were considered to have low receptivity, compared to those students in the 51st through 99th percentile. The responses of students to the 17 motivational scales were analyzed by the level of receptivity to discover differences in response patterns that may inform interventions for hard-to-reach students.
Students rate questions using a Likert scale that ranges from 1 (not true at all) to 7 (completely true), with 4 indicating a neutral stance. For this study, any student response of 5, 6 or 7 was coded to a “1,” indicating some level of agreement with the statement. Students who responded with a 1, 2, 3, or 4 were coded with a “0” to indicate a lack of agreement. This recoded data was then used to determine the percentage of students who agree with a certain statement. These percentages were examined between the two groups of students by t-tests to ascertain whether differences in means of students who agree were statistically significant. Significant differences imply that there is a difference between groups in the way these respondents approach the motivational scale in question.
Due to the large number of students in each group, virtually all differences in means were statistically significant, based on their t-value and resulting p-value. Because of this, an additional criterion for assessing meaningful differences was introduced in the form of Cohen’s d. Cohen’s d is used in meta- 2 The fifth stanine covers the middle of a normal distribution, ranging from the 41st to 60th percentile. Because of this, the use of the actual percentile score was preferred to using a stanine definition of hard-to-reach.
80
Proceedings of the 5th Annual National Symposium on Student Retention. Copyright 2009. C-IDEA, The University of Oklahoma.
studies to allow for comparisons between different studies and sample groups. The results are summarized as “negligible effects,” “small effects,” “medium effects,” or “large effects.” Depending on the relative sample sizes, differences in means between 4 and 17 percent were classified as “small effects” while larger differences were classified as “medium effects.” The largest observed difference in means was 17.8 percent, and this was classified as a “medium effect.” Comparing Hard-to-Reach Students to Receptive Students
The goal of this comparison was to identify additional characteristics that differentiate hard-to-reach students from highly receptive students beyond the information already contained in the definition of hard-to-reach: the receptivity to institutional help scale. The comparison between hard-to-reach and receptive students was conducted by comparing the CSI data in two ways: conducting a t-test between groups for the motivational scales using the reported scales percentiles, and conducting another t-test using the percentage of students who agreed with each item of each scale on the instrument. The results were intriguing. Please refer to the two student profiles in Appendix A for an illustration of the subtle differences between receptive and hard-to-reach students.
Hard-to-Reach Students May Not Acknowledge Concerns with Study Habits
While the average percentile scores between hard-to-reach and receptive students showed meaningful differences on three of the academic motivation scales: study habits, verbal confidence, and math and science confidence, the item analysis revealed a distinctive pattern of responses that differentiated high receptivity students from low receptivity students. For example, receptive students had on average lower percentile scores in the study habits scale. These lower scores were due to the way students answered the questions that focused on difficulties or lower confidence. Significantly more receptive students agreed with the question “I have great difficulty concentrating on schoolwork and I often get behind” than hard-to-reach students (27.4 percent of receptive students agreed, contrasted with 15.0 percent of hard-to-reach students). Similar response patterns emerged for the other two contraits of this scale: “My studying is very irregular and unpredictable” and “When I try to study, I usually get bored and quit after a few minutes.” Here the percent agreement was 37.4 percent versus 27.4 percent for irregular study habits, and 33.4 percent versus 22.9 percent agreement with getting bored and quitting the task.3
CSI-B Items by Scale Low Receptivity
High
Receptivity Difference: Low-High Receptivity
National Average
Study Habits
I take very careful notes during class, and I review them thoroughly before a test. 55.8 62.6 -6.9 59.6
I study very hard for all my courses, even those I don’t like. 55.4 59.6 -4.3 57.7
I have developed a solid system of self-discipline, which helps me keep up with my schoolwork. 56.1 57.1 -1.1 56.6
I have great difficulty concentrating on schoolwork, and I often get behind. 15.0 27.4 -12.4 21.9
My studying is very irregular and unpredictable. 27.4 37.4 -10.0 32.9
When I try to study, I usually get bored and quit after a few minutes. 22.9 33.4 -10.5 28.7
Table 2: Study Habits Scale by Low and High Receptivity
3 Please refer to the table in the appendix for a complete analysis of the items of the motivational scales and significant responses.
81
Proceedings of the 5th Annual National Symposium on Student Retention. Copyright 2009. C-IDEA, The University of Oklahoma.
Less Receptive Students Apparently Less Aware of Need for Services
The pattern of those students who are significantly more receptive to assistance being able to acknowledge their limitations or doubts also holds true for the verbal confidence scale, the math and science confidence scale and the attitude toward educators scale, where receptive students were more likely to agree with statements that teachers had been “too opinionated and inflexible,” “more concerned about themselves than they are about their students,” or as having “a superior attitude.”
The patterns of higher agreement with negatively-worded questions continues in the general coping scales, where students who are more receptive to support simultaneously acknowledge more confusion about their career choice (i.e., as indicated in the career closure scale) while also reporting lower percentiles on the family emotional support scale. Whereas the more receptive students experience a lower sense of financial security, they also indicate more sociability than the harder-to-reach students. By implication, the harder-to-reach student may be more hesitant or unaware of their academic or personal concerns, or their need for goal-setting or career planning.
Receptive students have a lower average percentile score on many of the motivational and general coping scales than hard-to-reach students. However, the lower scale percentiles appear to be the result of a higher sense of self-doubt or lower sense of confidence that results in these students being more receptive to assistance, as they see the need for outside assistance. By contrast, hard-to-reach students do not acknowledge their limitations as much. Speculating, this may be because they truly do not have concerns and are not – in fact – at risk. Or, it may be a situation where they simply are not yet aware of latent needs that make them vulnerable to the pressures associated with transitioning to, and persisting in college. On the surface, these hard-to-read students may appear ready to meet the challenges of college more so than their anxious counterparts. Indeed, hard-to-reach students display lower educational stress and academic difficulty scores. Admittedly, the difficulty for educators is to distinguish which of these students are prepared and which students are overconfident, thereby resisting the invitation to services. By not connecting with these valuable resources, they are even more vulnerable to pressures implicit in the first-year college experience that may “catch them unaware.”
The desire to finish scale shows an interesting juxtaposition between two of the questions on that scale. Namely, receptive students are more convinced that “Of all the things I could do at this point in my life, going to college is definitely the most satisfying,” with 89.7 percent agreeing with this statement compared to 80.6 percent of the low receptivity students. Yet, 19.6 percent of these same receptive students agree with the statement “I often wonder if a college education is really worth all the time, money and effort that I’m being asked to spend on it,” compared to 12.8 percent of low receptivity students. Though these less receptive students may want to be enrolled in their post-secondary institution, they need continued and sustained reinforcement of the benefits of a college experience.
A final dimension of high receptivity is demographic. Students’ demographic patterns related to race/ethnicity and first-generation college student background display differences. For example, the highly receptive half of the responses includes more minority students. Thirty-two percent of highly receptive students self-report as black/African American, 14.7 percent self-report as Hispanic or Latino. On the other hand, the low receptivity group is comprised of 66.5 percent white/Caucasian students, compared to the high receptivity group, which includes 40.5 percent white/Caucasian students. There are fewer first-generation students in the hard-to-reach category. In short, the hard-to-reach students tend to be white/Caucasian from homes where one or more parent had some college experience.
Highlighting Student Success Initiatives that Reach Hard-to-Reach Students
Hundreds of campuses intervene with students each year, recognizing the long-standing principle of getting students started right on their path to college, and using motivational assessment as a means for initiating meaningful dialogue early in the term.
Whether a campus administers the College Student Inventory Form A, B, or C, the goal is the same; to learn more about the incoming students’ self-reported areas of strength and challenge, and to connect
82
Proceedings of the 5th Annual National Symposium on Student Retention. Copyright 2009. C-IDEA, The University of Oklahoma.
them – early in the term – with campus resources and colleagues who can help them to move in the direction of their academic, personal, and career goals. Below are three examples of effective outreach to incoming students. Delgado Community College
At Delgado Community College (LA), Provost Arnel Cosey has initiated a College Coach program, as a way to reach out to incoming students who may not otherwise respond to invitations and interventions from advisors or other educational professionals.
In the College Coach program, colleagues in positions ranging from assistant vice chancellors to clerks in the business office become mentors of incoming students, allowing the phrase "retention as a campus-wide responsibility" to take tangible form. This past year, approximately 200 students were coupled with a college coach, facilitating engagement into the campus community, and social and academic integration.
A sense of prestige is associated with this mentoring program, which is expanding in this upcoming academic year. Academic chairs, leaders of departmental units and division heads recommend individuals for the College Coach position, based on their student-centered characteristics. These individuals recognize the mentoring role as an honor, and participate in development workshops with Cosey’s advising staff.
As impetus for the students to connect with their coach, they are asked to complete the College Student Inventory, after which they receive a laminated and customized student planner, which informs assignments that comprise 10 percent of the first-year seminar course grade. This year, 800 students completed the CSI.
Cosey explains that the extra structure and interventions have allowed them to reach students that otherwise may have been hesitant to participate in workshops on goal-setting, financial literacy, career development, and stress management, for example. She further reflects that sometimes students who may need the help most do not ask for it. Though these self-assured students are more difficult to reach, the college proactively makes them aware of resources, extending a hand should they ever need it.
Cosey states, “the success of Delgado’s College Coach program is the result of dedicated, concerned faculty/staff and the usefulness of the CSI data. Our students have greatly benefited from the inventory feedback put in context by the coaches.”
Rutgers, The State University of New Jersey - New Brunswick Campus
Erica Anderson, the Director of Scholastic Standing at the School of Arts and Sciences of Rutgers University, New Brunswick campus, emphasizes the importance of personal choice when working with students. Though she recognizes and acknowledges the struggles students face in their college and university careers, she believes in the value of students’ potential, emphasizing “how actions and choices either create or diminish” success. Toward this end, she teaches a seven-week program, including time management and goal setting, with development of purpose statements and values clarification.
Further reflecting on the theme of student success, Anderson notes the adjustment of expectations in college contrasted with those they experienced in secondary school. Whereas studying an hour or two may have been sufficient in the past, twenty hours may be necessary in college for a comparable grade. She notes that this is a “culture shock” for some students, especially those who come from backgrounds wherein college was not the norm.
The reward that Anderson experiences in serving students through her program involves watching them “learn to do it for themselves.” She emphasizes that it is not a matter of whether students can accomplish a given goal; rather, it is contingent upon their commitment to figuring out how to accomplish their goals with the appropriate guidance and support of those available to assist them. Toward that end, the university “meets them more than half way,” she notes.
According to Anderson , “the College Student Inventory has been the foundation for the Freshman Retention Program at Rutgers College and since restructuring, Rutgers new School of Arts & Sciences. During the time in which the CSI has been utilized to assist first year students on probation, it has added
83
Proceedings of the 5th Annual National Symposium on Student Retention. Copyright 2009. C-IDEA, The University of Oklahoma.
immensely to the quality of advising the program has been able to provide to struggling students. Specifically, outcomes data consistently demonstrate that students who participate in the program at the highest level are restored to good academic standing at the highest rates. Conversely, those who participate at the lowest levels are academic dismissed at the highest rates.”
Generally, Anderson notes, since Rutgers College began using the CSI as the cornerstone of its Freshman Retention Program in the year 2000, the number of students academically dismissed at the end of the freshman year in this category was consistently reduced from approximately 54 percent in prior to 2000, to a low of 39.4 percent in 2006, and most recently 40.3 percent in 2008 in the newly structured School of Arts & Sciences. Although, many initiatives continue to be developed towards enhancing retention efforts for students at Rutgers University, the CSI remains a consistently effective tool in assisting students toward achieving their goals. Montana State University
Situated in a region historically recognized for self-reliance, Erika Swanson, FYI Coordinator and Assistant Dean of Students, Montana State University, observes students who would like to handle concerns on their own in accordance with their expectations of adult roles. However, she works with them to make them cognizant that asking for help is not only beneficial, but appropriate, given the heightened demands of college. With time, she hopes that students become aware that they need to ask for help, and that the campus offers an array of services toward that end, as outlined in a regularly updated resource and referral guide used by advisors and other campus colleagues.
In Swanson’s interactions with students, she notices both those individuals who see their obstacles more clearly, with a tenor of realism, as well as those who are less aware of the challenges they will face in the rigors of university programs.
In an effort to reach students, she acknowledges that some may be re-evaluating the need for college, especially those who are first-generation college students and whose parents have fared adequately without higher degrees. For these students, exposure to longer-term goals and opportunities can provide a bridge to persistence. She notes that these students who are the first in their family to attend college may lack confidence and may not realize that academic support is readily accessed.
An established approach to intervention has proven effective at Montana State University through the First Year Initiative program. Swanson reflects upon the use of motivational assessment and factors of risk below:
“Our staff of First Year Initiative (FYI) advisors utilizes the mandatory implementation of the College Student Inventory (CSI) in identifying and communicating with these students. Factors such as students not completing the CSI or completing the instrument with low validity are two significant indicators that the student may struggle in following processes, completing coursework, or be lacking the motivation to progress through a degree. Meanwhile, individuals who present with low opinion tolerance, subpar attitude toward educators, or few to no areas of receptivity are oftentimes students that do not trust school authorities, feel that others are not able to help them, or are not yet open to asking for help.”
Given the imperative of early intervention, Swanson further observes the importance of structure and persistence in working with incoming students, while emphasizing the need to share a positive relationship with students who may otherwise misunderstand the role of a given office.
“In order to effectively encourage a student to work with a student success program, hard-to-reach students may benefit from understanding why utilizing campus resources can be helpful. Locations for students must be accessible and comfortable, [which is] one of the reasons that our program recently opened a branch office in one of our most populated residence halls. These students must also realize that a student success program is more interested in student benefit than sanctions for non-compliance.”
Student-centered outreach, for individuals, cohort populations, and programming, have fostered positive retention results. In recent years, the parental hot-line has been increasingly utilized as further support. The College Student Inventory (CSI) assists the First Year Initiative (FYI) in meeting several of
84
Proceedings of the 5th Annual National Symposium on Student Retention. Copyright 2009. C-IDEA, The University of Oklahoma.
its programmatic goals. Most importantly, the CSI allows the University to make timely contact with first year students within the first six weeks at Montana State University. Trained advisors work with first year students to discover and address holistic needs and concerns, many of which can be met or remedied with campus resources. CSI meetings connect students with on campus personnel and increase awareness of campus programs and offices. In comparison with institution fall-to-fall retention rates, students that meet with an FYI advisor for a CSI interpretation are retained at a higher rate than the institutional average at Montana State University, ranging from an early 1 percent to 6.1 percent in 2006-2007, according to Swanson. The Imperative of Structured Programs and Intensified Interactions
In reaching students who may be less receptive to your interventions, structure is imperative, as are multiple contact points, and systems of reward or consequence for participation in the interventions. Additionally, the campus colleagues must take the initiative, modeling this behavior for students who experience its benefit. Below are some basic approaches to intervention with the hard-to-reach student. These four tenets are not intended to be exclusive areas of attention, but initial steps to build upon: Initiating Direct Contact between Instructors and Students
Emphasizing the benefits of structure and intensified contact, a campus may set the expectation of a students’ participation in a learning community or mentoring program. Sometimes, this contact may take the form of overtly placing oneself in the students’ environment.
For instance, based on the finding from the CSI summary and planning report that 52 percent of the students at Mid-South Community College (AR) were receptive to academic assistance, while only 7 percent actively used the Learning Success Center, the college now requires faculty to serve half of their office hours in the Learning Success Center. This approach, coupled with counseling, academic coaching, advising, workshops, and computer access, has resulted in an increased usage of the Learning Success Center by 70 percent in two years. Developing Highly Structured Educational Plans, Goals, Timelines, and Progress Reports
Expectations for participation in a certain program can be coupled with an educational plan, including specific steps toward goals, timelines, regularly scheduled progress reports, and perhaps even signatures that reflect agreement.
For example, at Silver Lake College (WI), Dr. Jane Bishop, Vice President of Enrollment, finds the technique of an individual game plan for success effective in adding structure to her early-term meetings with students. Initially, she asks the student to identify two of their strengths from the CSI student report, followed by two areas wherein they seek to improve. Next, she works with them to identify areas of assistance in which they would like to grow, coupled with three strategies and plans to implement them, in order to make the first year at the college successful.
These game plans are submitted during the meeting of the First Year Experience, and copies are kept on file with the academic advisor and vice president of enrollment. Monthly progress reports occur throughout the freshman year, with on-going feedback and suggestions for improvement. Meeting with a high-level administrator, within the context of structure and accountability over time, supports progress by students who otherwise may be more passive to intervention.
Implementation of the “Game Plan for Success” program has led to an increase in fall-to-fall freshmen retention from 68 percent in 2006 to 80 percent in 2007. The fall retention rate at the end of the 2006 refund period was 91 percent, compared to a fall retention rate of 100 percent at the end of the 2007 refund period. Increasing Referrals through Connections and Expanding Webs of Services
The positive experience during the initial meeting between the educator and the student sets the stage for a continued flow toward more in-depth referrals to address additional areas of growth, serving as a
85
Proceedings of the 5th Annual National Symposium on Student Retention. Copyright 2009. C-IDEA, The University of Oklahoma.
springboard for referrals to other relevant services. Hence, a strength-based approach to student development is necessary, so that students recognize the sincere nature of student success initiatives.
This is especially important for the hard-to-reach student, who may have a lower attitude toward educators or sensitivities based on past experiences. Specifically, Erica Anderson of Rutgers University emphasizes the importance of “creating a conversation” through an attitude of mutual respect.
Effective dialogue includes probing for student reactions to the results of their motivational assessments, with a discussion of underlying attitudes, exploration of steps for improvement, and tangible ways to put ideas into action to help a given situation. Demonstrating Seriousness through a Variety of Strategies
It is possible that the hard-to-reach students may consider themselves as somewhat invisible to the campus, and therefore perceive their problems and circumstances in isolation, rather than situated within the social or communal context. Campuses can employ a variety of strategies to cultivate awareness along a continuum, ranging from the more subtle to increasingly restrictive.
For instance, the students at Delgado Community College are not able to receive their academic planner until they complete their motivational assessment and meet with the advisor. An accountability structure that is more watchful can demonstrate a very serious intent through specific processes, policies, and programs. Elaborating upon this dynamic, Erika Swanson of Montana State University explains:
“It is oftentimes the hard-to-reach student that must first see a record of poor performance before they are willing to make steps to improve performance or change routines. For this demographic, illustrating a recorded deficiency in classroom performance may become a catalyst for change…hard-to-reach students are oftentimes surprised when they receive follow-up communications in one or more methods of communication. A student support service must prove to students that they track and are concerned about an individual's performance before many students will participate in the program.
“Communicating to a student what to expect from an appointment, such as any associated price, time length, and what will be discussed is very important in yielding a made appointment into a completed meeting. Lastly, the encounter with staff in an office must be comfortable in order for a student to favorably evaluate such an experience. As such, FYI utilizes upper-division and graduate students in its work with struggling students in order to minimize feelings of intimidation or self-consciousness that one may experience in a discussion regarding student concerns, frustrations, and fears."
Though some hard-to-reach students will acknowledge their need for campus or community services, others will be more resistant to outside assistance, making their path more arduous. To encourage these influential connections to occur, it is sometimes necessary to build constraints into one’s program. For instance, Erica Anderson of Rutgers University incorporates monitoring and support – such as restrictions in credit loads for all students who sustain academic standing sanctions. In particular, those students deemed most academically vulnerable are required to participate in a minimum number of meetings as a requirement of the Freshman Retention Program (a mandatory requirement for freshmen with GPA averages lower than 1.00 after the first term of enrollment) or two meetings for students required to participate in the seven-week Academic Success intervention program. In both cases, students’ registration privileges are suspended until they have satisfied their advising requirement. These constraints are rooted in principles of student success, as they emphasize the imperative of participation in programs designed to help the student progress in college. In Conclusion
As we consider students who are less receptive to our assistance through campus services, we need to take a closer look to determine which of them will fall through the cracks without needed interventions. Though these students may be less receptive to assistance, it is apparent that many of them could benefit from campus and community services. In the current higher education environment, campuses have a
86
Proceedings of the 5th Annual National Symposium on Student Retention. Copyright 2009. C-IDEA, The University of Oklahoma.
heightened responsibility to intervene through a concerted effort using a variety of strategies. On the one hand, these may take the form of incremental and integrated touch-points throughout the campus community. On the other hand, broad programmatic initiatives can provide the needed structure of support.
Recognizing the importance of engagement, these student success interventions provide the avenue to a realm of new opportunities and accompanying growth. Relevant campus services can become the connective tissue for the resistant student. Toward that end, and as a ray of hope, educational leadership is well-situated to reach out to these students with a proactive stance.
87
Proceedings of the 5th Annual National Symposium on Student Retention. Copyright 2009. C-IDEA, The University of Oklahoma.
Acknowledgements We greatly appreciate the collaboration and sharing from our colleagues referenced in this article, who demonstrate service-orientation in their student success initiatives. These acknowledgements include:
• Erica Anderson, Assistant Dean and Director for Scholastic Standing, Probation, Retention Programming and Assessment, Rutgers, The State University of New Jersey New Brunswick Campus (NJ)
• Jane Bishop, Ph.D., Vice President for Enrollment Management, Silver Lake College (WI) • Arnel W. Cosey, Provost, City Park Campus and Assistant Vice Chancellor for Student Affairs,
Delgado Community College (LA) • Dorothy Gautreaux ,Vice President Student Affairs, Mid-South Community College (AR) • Erika Swanson, FYI Coordinator and Assistant Dean of Students, Montana State University (MT)
References National Freshman Attitudes Reports, 2007-2009, Noel-Levitz, Inc. Iowa City. https://www.noellevitz.com/Papers+and+Research/Papers+and+Reports/ResearchLibrary/Freshman+Attitudes.htm Stratil, Michael L. (2002); The RMS Research and Technical Guide, Noel-Levitz, Inc.
88
Proceedings of the 5th Annual National Symposium on Student Retention. Copyright 2009. C-IDEA, The University of Oklahoma.
Appendix A
Students with Different Receptivity: Two Sample Reports Below are the coordinator reports for two sample students, showing both the motivational scales and
the four composite scales. Student One shows a Receptivity to Institutional Help of 8, which places the student in the 89th-96th percentile. Student Two is much less receptive with a stanine score of 3, which places him in the 11th-23rd percentile. While there are several similarities in the scores for these two students, there are some strong differences which illustrate the characteristics of hard-to-reach students.
Student One
Student One suggests a less confident student in that while his study habits are in the 70th percentile, his verbal confidence and math and science confidence are below the 50th percentile. This student received a B average in high school, but feels he needs a lot of assistance in academic, personal and career counseling. His past experience with educators was apparently not very positive, resulting in a 14th percentile in the attitude toward educators scale, though he is willing to receive assistance.
Of particular salience, Student One reports a low desire to finish college, indicating wavering commitment. While this student has some challenges, he is highly receptive to intervention.
89
Proceedings of the 5th Annual National Symposium on Student Retention. Copyright 2009. C-IDEA, The University of Oklahoma.
Appendix A
Student Two represents an individual who is more academically confident than the previous student. While he reports lower study habits, he expresses more verbal confidence as well as math and science confidence. His attitude toward educators is high, suggesting a positive educational experience to date. Note that his overall receptivity to any type of assistance is very low, as is his desire to finish college.
Student Two
The important piece of information here is the senior year GPA of a C+ average. While this student presents as confident, the dissonance between his past performance and current confidence, coupled with low receptivity, makes him a challenge to educators, given his pattern as a hard-to-reach student.
90
Proceedings of the 5th Annual National Symposium on Student Retention. Copyright 2009. C-IDEA, The University of Oklahoma.
Appendix B (Optional)
Looking at Freshman Attitudes by Receptivity to Institutional Help CSI-B National Percentages
CSI-B Items by Scale Low Receptivity High
Receptivity Difference: Low-High Receptivity
National Average
Desire to Finish College
Of all the things I could do at this point in my life, going to college is definitely the most satisfying. 80.6 89.7 -9.1 85.6
I am deeply committed to my educational goals, and I’m fully prepared to make the effort and sacrifices that will be needed to attain them.
88.3 91.4 -3.2 90.0
I am very strongly dedicated to finishing college―no matter what obstacles get in my way. 93.0 95.5 -2.4 94.4
I have a very strong desire to continue my education, and I am quite determined to finish a degree.
94.1 95.7 -1.7 95.0
I dread the thought of going to school for several more years, and there is a part of me that would like to give up the whole thing.
8.9 10.4 -1.5 9.7
I wish that society did not put so much pressure on people to go to college, as I’d really rather be doing other things at this point in my life.
9.1 11.7 -2.6 10.5
I can think of many things I would rather do than go to college. 11.3 12.3 -1.0 11.9
I often wonder if a college education is really worth all the time, money, and effort that I’m being asked to spend on it.
12.8 19.6 -6.8 16.5
Attitude toward Educators
Most of my teachers have been very caring and dedicated. 78.3 78.7 -0.4 78.5
The teachers I had in school respected me as a person and treated me fairly. 80.9 81.8 -1.0 81.4
I liked my teachers, and I feel they did a good job. 75.8 76.6 -0.7 76.2
Most of the teachers I had in school were too opinionated and inflexible. 12.0 18.7 -6.7 15.7
In my opinion, many teachers are more concerned about themselves than they are about their students.
11.9 16.7 -4.8 14.5
Most teachers have a superior attitude that I find very annoying. 14.1 20.0 -5.9 17.3
91
Proceedings of the 5th Annual National Symposium on Student Retention. Copyright 2009. C-IDEA, The University of Oklahoma.
Appendix B (Optional)
Looking at Freshman Attitudes by Receptivity to Institutional Help CSI-B National Percentages, continued
CSI-B Items by Scale Low Receptivity High
Receptivity Difference: Low-High Receptivity
National Average
Intellectual Interests
I get a great deal of personal satisfaction from reading. 43.6 49.9 -6.3 47.1
Over the years, books have broadened my horizons and stimulated my imagination. 53.9 59.6 -5.7 57.0
Books have never gotten me very excited. 39.4 39.0 0.5 39.2
I don’t enjoy reading serious books and articles, and I only do it when I have to. 40.4 43.0 -2.6 41.8
Study Habits
I take very careful notes during class, and I review them thoroughly before a test. 55.8 62.6 -6.9 59.6
I study very hard for all my courses, even those I don’t like. 55.4 59.6 -4.3 57.7
I have developed a solid system of self-discipline, which helps me keep up with my schoolwork. 56.1 57.1 -1.1 56.6
I have great difficulty concentrating on schoolwork, and I often get behind. 15.0 27.4 -12.4 21.9
My studying is very irregular and unpredictable. 27.4 37.4 -10.0 32.9
When I try to study, I usually get bored and quit after a few minutes. 22.9 33.4 -10.5 28.7
Math and Science Confidence
I have a very good understanding of general biology (e.g., cell structure, metabolism, genetics, and the circulatory system).
35.2 38.3 -3.1 36.9
I have always enjoyed the challenge of trying to solve complex math problems. 35.9 39.2 -3.2 37.7
I have a very good grasp of the scientific ideas I’ve studied in school. 44.8 48.1 -3.2 46.6
Math has always been a challenge for me. 38.4 48.0 -9.6 43.7
I have a hard time understanding and solving complex math problems. 38.3 52.4 -14.1 46.1
My understanding of the physical sciences is very weak. 23.7 31.1 -7.4 27.8
92
Proceedings of the 5th Annual National Symposium on Student Retention. Copyright 2009. C-IDEA, The University of Oklahoma.
Appendix B (Optional)
Looking at Freshman Attitudes by Receptivity to Institutional Help CSI-B National Percentages, continued
CSI-B Items by Scale Low Receptivity High
Receptivity Difference: Low-High Receptivity
National Average
Verbal Confidence
I pick up new vocabulary words quickly, and I find it easy to use them in my speech and writing. 52.8 57.7 -4.9 55.5
I am very good at figuring out the deeper meaning of a short story or novel. 50.8 57.1 -6.3 54.3
I am capable of writing a very clear and well-organized paper. 66.5 61.8 4.7 63.9
I have difficulty organizing my ideas in a paper, and I tend to make a lot of punctuation and grammar mistakes.
23.8 41.1 -17.3 33.3
Learning new vocabulary words is a slow and difficult process for me. 13.0 21.1 -8.1 17.4
In English classes, I’ve had difficulty analyzing an author’s style and theme. 24.3 32.3 -8.0 28.7
Career Closure
I have found a potential career that strongly attracts me. 79.7 79.0 0.8 79.3
I have made a firm decision to enter a certain occupation and have begun planning my life around that decision.
61.3 62.8 -1.5 62.1
I become very confused when I try to choose an occupation. 16.2 27.7 -11.5 22.5
I am very confused about what occupation to pursue. 14.7 25.0 -10.3 20.4
Family Emotional Support
When I was a child, my parents usually understood me, respected my judgment, and treated me in ways that helped me grow.
79.5 75.2 4.3 77.1
My family and I communicated very well when I was young, and we had a good understanding of each other’s point of view.
70.4 64.9 5.5 67.4
My family had one way of looking at me when I was a child, and they didn’t understand my feelings very well.
10.2 19.5 -9.3 15.3
When I was a child, the other members of my family often said hurtful things that caused unpleasant feelings.
8.3 16.9 -8.7 13.0
93
Proceedings of the 5th Annual National Symposium on Student Retention. Copyright 2009. C-IDEA, The University of Oklahoma.
Appendix B (Optional)
Looking at Freshman Attitudes by Receptivity to Institutional Help CSI-B National Percentages, continued
CSI-B Items by Scale Low Receptivity High
Receptivity Difference: Low-High Receptivity
National Average
Sense of Financial Security
I have the financial resources that I need to finish college. 53.1 41.0 12.0 46.4
I don’t have any financial problems that will interfere with my schoolwork. 45.5 33.3 12.2 38.8
I have financial problems that are very distracting and troublesome. 20.9 36.2 -15.3 29.3
I am in a bad financial position, and the pressure to earn extra money will probably interfere with my studies.
11.1 24.0 -13.0 18.2
Sociability
I greatly enjoy getting together with a crowd of people and having fun. 75.5 84.4 -8.9 80.4
I am very adventurous and outgoing at social gatherings. 54.0 63.5 -9.5 59.2
Participating in large social gatherings is of little interest to me. 26.6 23.0 3.6 24.6
It is hard for me to relax and just have fun with a group of people. 10.5 14.9 -4.4 12.9
Opinion Tolerance
I get along well with people who disagree with my opinion openly. 61.9 64.6 -2.7 63.4
I can feel comfortable with someone who thinks quite differently than I do on major social issues. 61.9 64.5 -2.6 63.3
I find it easy to be friends with people whose political ideas differ sharply from my own. 57.0 59.0 -2.0 58.1
When someone’s opinions strongly disagree with my own, I tend to develop unfriendly feelings and to avoid close contact with the person.
11.5 14.7 -3.1 13.2
I feel uneasy and distrustful toward people whose way of thinking is quite dissimilar to my own. 7.1 11.6 -4.5 9.6
Because they irritate me, I tend to stay away from people whose ideas are quite different from my own.
7.1 10.7 -3.6 9.1
94
Proceedings of the 5th Annual National Symposium on Student Retention. Copyright 2009. C-IDEA, The University of Oklahoma.
Appendix B (Optional)
Looking at Freshman Attitudes by Receptivity to Institutional Help CSI-B National Percentages, continued
CSI-B Items by Scale Low Receptivity High
Receptivity Difference: Low-High Receptivity
National Average
Desire to Transfer
I plan to transfer to another school before completing a degree at this college or university. 12.0 14.5 -2.6 13.4
I have no desire to transfer to another school before finishing a degree at this college or university.
63.7 61.2 2.5 62.3
Demographic Variables
Two-Year School Flag 22.8 21.4 1.4 22.1
Four-Year Private School Flag 37.8 39.0 -1.1 38.4
Four-Year Public School Flag 39.4 39.6 -0.3 39.5
Adult-Students 25 Years or Older 11.9 9.2 2.7 10.2
Student Gender=Male Flag 46.8 44.4 2.4 45.5
First Generation Student 25.2 30.6 -5.4 26.7
Black/African American Students 11.5 29.3 -17.8 20.8
Hispanic or Latino Students 7.1 11.8 -4.7 9.5
Asian or Pacific Islander Students 2.3 4.6 -2.3 3.5
American Indian or Alaskan Native Students 0.9 0.9 0.0 0.8
White/Caucasian Students 73.1 47.5 25.6 57.5
Average Age 20 20 20
Totals 43.967 54,153 98,120 * Bolded differences indicate t-tests between the two populations in question that are both statistically significant based on their t-value and fall into the range of either a small or medium effect size based on Cohen's d.
95
Proceedings of the 5th Annual National Symposium on Student Retention. Copyright 2009. C-IDEA, The University of Oklahoma.
Workshop on Predictive Modeling: Logistic Regression
Abstract: In partnership with Jenzabar, Carroll University has developed and implemented a Retention Management System to help organize activities and data resources aimed at student persistence. The system utilizes a mathematical model derived from historical retention data and applies that model to current students to calculate a probability of an individual student leaving Carroll. The model was built off of a logistic regression tool in SPSS combining both static variable such as academic ability and dynamic variables such as the number of unfavorable grades. This workshop will focus on performing logistic regression using SPSS to predict retention and detail how to apply the model to a new cohort. General topics will include how to prepare data for modeling, how to perform logistic regression through SPSS, how to read the results, and how to verify and validate the results. This workshop will cover concepts of regression such as goodness of fit, tests of significance, classification tables, and correlation.
Introduction
Back in July 2008, Carroll University teamed up with Jenzabar to invest resources and direction into a high-tech and high-touch initiative that had a focus on improving the retention and success rates of undergraduate students. The first step in this initiative was to identify those students that were at risk of leaving, and this was done using a predictive mathematical model. This model predicts the probability of a student being retained based on a number of dynamic and static variables. The model was built utilizing binary logistic regression on historical retention data.
This paper will focus on the details of how to perform binary logistic regression to produce a model that can predict student retention, specifically using SPSS PASW 17.0 Statistics Regression module. The topics include how to prepare data for modeling, how to perform logistic regression through SPSS, how to read the results of the regression, and how to verify and validate the results. Statistical concepts for regression are covered as well and they include goodness of fit, tests of significance, classification tables, and correlation. Overview of Binary Logistic Regression
Binary logistic regression is a form of multiple regression where the dependent variable is dichotomous rather than continuous. Dichotomous variables are binary variables that take on the form Yes/No, True/False, Happened/Did not happen, or within SPSS 1 or 0. In fact the actual numerical or qualitative value of the variable is not important and is only a matter of convenience. (Pampel, 2000) Instead the important concept is predicting the probability that a case will be classified into one of the two possible categories.
96
Proceedings of the 5th Annual National Symposium on Student Retention. Copyright 2009. C-IDEA, The University of Oklahoma.
Why Don't We Just Use Linear Regression? Intuitively it seems that this can be done with linear regression with a dummy dependent
variable but overall there are two fundamental problems with this approach. First is a problem of functional form; since probabilities are limited by a floor and a ceiling, they can only take on values between 1 and 0, and using linear regression with a dummy dependent variable can give you values that are outside of that range. Probabilities greater than 1 and less than 0 make no sense, and are therefore useless. At first it appears that it would be possible to solve this issue by simply truncating those values outside of the range, but this brings us to the second problem, a problem of statistical inference. This is because using linear regression with a dummy dependent variable violates the assumptions of normality and homoscedasticity. Homoscedasticity, or equal variances, is violated because the residuals can take on small values or large values, therefore the variances of the errors is not constant. This violates normality because the residuals only take on two possible values:
and
Since the distribution of errors only has two values, it cannot be normal. Violating normality does not create many problems in small samples, and only creates a few problems with larger samples. However violating homoscedasticity will provide incorrect standard errors and invalid tests of significance which are much more serious problems. For these reasons the preferred method of calculate dichotomous variables is to use binary logistic regression. (Pampel, 2000) How Does Logistic Regression Work?
The problem that linear regression has with predicting probabilities of dichotomous variables is that probabilities have a floor and a ceiling because they only take on values between 0 and 1. Binary logistic regression gets around this problem by transforming the probabilities into odds and then into logits. Please remember that odds and logits are simply just other ways of expressing the same concept, a probability. Odds express the likelihood of an event happening compared to the likelihood of the event not happening. (Pampel, 2000) Therefore if we have Pi as the probability of an event happening then the odds are expressed as follows:
Since odds have no upper bound, this removes the ceiling problem for regression purposes.
The final step is to remove the floor and that involves transforming the odds into a logit, which are the logged odds. Since logit have no lower bound or upper bound, this removes the ceiling and floor problem for regression purposes. The logit is expressed as follows:
Now that the problems of ceilings and floors have been removed, we can look at how
coefficients are estimated. Traditional linear regression does ordinary least squares to estimate coefficients, while logistic regression utilizes maximum likelihood estimation (MLE). MLE attempts to find the coefficient that has the maximum likelihood of producing the observed results. This is done by maximizing the log likelihood function. (Pampel, 2000)
97
Proceedings of the 5th Annual National Symposium on Student Retention. Copyright 2009. C-IDEA, The University of Oklahoma.
Where Yi is the observed value of the dichotomous dependent variable for the ith case and Pi is
the predicted probability for the ith case. This function varies between negative infinity to zero, as the function gets closer to 0 it means that the parameters are more likely to predict the observed results.
Preparing for Binary Logistic Regression
Performing logistic regression with SPSS is rather simple, but there are a few steps that happen beforehand that need to be completed in order to have an easier time performing the regression and understanding the results. First a data file must be created where each row is a student, and the columns are the variables involved, and the data must have the dependent variable that tells whether the student retained or not (usually this is kept as 1 = Yes and 0 = No). SPSS can open Excel, SAS, SyStat, Portable, Lotus, Sylk, Text, dBase, and Stata files, but at Carroll University Excel was used.
The data should be as complete as possible; this is because rows that are incomplete are thrown out of the model. If you have missing data you can handle this by using fillers that make sense regarding the variable in question. For example if you were to use cumulative GPA as a variable, missing values could be given an average GPA. As long as the filler makes sense, the variable in question will work properly. The data should also be as numeric as possible, this allows for easier interpretation of the results. SPSS can work with categorical variables (qualitative variables) but transforming the categories into numeric values makes the process a lot easier. For example if you having a categorical variable that puts students into categories based on their out of pocket expenses, you can change this to a numeric variable by using a numeric rating with 1 being the lowest category (students who pay the least) and 5 as the highest category (students who pay the most).
Once you have a data file that has been manipulated to have mostly numeric values, you can import the file into SPSS. Launch SPSS PASW Statistics 17.0 and make sure that "Open an existing data source" is selected. This is displayed in Figure 1.
98
Proceedings of the 5th Annual National Symposium on Student Retention. Copyright 2009. C-IDEA, The University of Oklahoma.
Figure 1
Be sure that the Excel is selected under "Files of type:" and then navigate to the appropriate
excel file, and then click Open. This is displayed in Figure 2.
99
Proceedings of the 5th Annual National Symposium on Student Retention. Copyright 2009. C-IDEA, The University of Oklahoma.
Figure 2
You will then be prompted with the following window, select "Read variable names from the first row of data" and hit OK. This is shown in Figure 3. You have then successfully imported a data file into SPSS.
Figure 3
Performing Binary Logistic Regression
Now that you have an SPSS file created and the data import, you can perform logistic regression. Open your data file in SPSS and on the menu bar click on Analyze> Regression > Binary Logistic, this is demonstrated in Figure 4.
100
Proceedings of the 5th Annual National Symposium on Student Retention. Copyright 2009. C-IDEA, The University of Oklahoma.
Figure 4
Now you are prompted with the following screen in Figure 5. Here place the dependent variable in the box labeled "Dependent" by selecting the dependent variable (labeled DVariable here) and click on the top arrow. Next select all of your independent variables (labeled IVariable1-13) and then press the middle arrow to place them in the "Covariates" box (Covariates are the same as independent variables). The last thing you want to make sure is selected is that under "Method" that you select "Enter", because we want to see the results for all the variables. The next step is to click on the right side button labeled "Options".
101
Proceedings of the 5th Annual National Symposium on Student Retention. Copyright 2009. C-IDEA, The University of Oklahoma.
Figure 5
The next screen (Figure 6) will list various options; this gives us the options for various tests of correlation and goodness of fit. The tests we want selected are the Hosmer –Lemeshow goodness of fit, Classification plots, and Correlation of estimates. Once you have them selected click on "Continue".
Figure 6
102
Proceedings of the 5th Annual National Symposium on Student Retention. Copyright 2009. C-IDEA, The University of Oklahoma.
Now you will be back at the previous screen. At this point you can click OK and the regression will be performed.
Interpreting Regression Results Once the regression is performed SPSS will display a list of different tables and charts that detail
the results of the regression. The focus for this paper will be a few tables within the section labeled Block 1: Method = Enter.
The first table to observe is the results from the Hosmer and Lemeshow Goodness of Fit test show in Table 1 below. This test break ups the data into deciles, and computes a chi-square distribution across those deciles. Then a probability is calculated from that distribution, and a significance value can be pulled. In order for us to fail to reject the null hypothesis (Or say that the model fits the data) the test should have a significance of .05 or higher, as shown in the results below. (Garson, 2009)
Step Chi-square df Sig.
1 14.113 8 .079Table 1: Hosmer and Lemeshow Test
The next table of importance is known as the Classification Tables (Table 2), which is another way to measure the strength of the model. Although this method is not as robust and reliable as the Hosmer and Lemeshow test, it is a quick way to determine if the model is along the right track. Please note that you should never rely on Classification Tables over the Hosmer and Lemeshow test. Classification tables are 2 X 2 tables with the columns as the two predicted values of the dependent variable and the rows as the observed values of the dependent variable. The goal is to have all the values along the diagonal and have the percent correct be 100; the closer it is to that value the better the model fits the data. (Garson, 2009)
Predicted
DVARIABLE
Observed 0 1
Percentage
Correct
0 72 58 55.4 DVARIABLE
1 20 492 96.1
Step 1
Overall Percentage 87.9
Table 2: Classification Table
The next important table is the table titled Variables in the Equation (Table 3), which essentially summarizes the significance and coefficients of all the variables in the regression. The test used for variables is known as the Wald Statistic, which is calculated by taking the ratio of unstandardized logistic coefficient to its standard error and squaring it. (Garson, 2009) The important column to focus on is the Sig column, which details the significance of the Wald Statistic, which essentially relates to the significance of the variable in the row. Significant variables are those with a Sig that is below 0.05. In the example below, the variables that are considered significant would be IVARIABLE 1, 5, 8, 11, 12, and 13, all of the other variables should be removed from the model. The next important column is the B
103
Proceedings of the 5th Annual National Symposium on Student Retention. Copyright 2009. C-IDEA, The University of Oklahoma.
column, which are the coefficients for the variables. For example IVARIABLE3 is a significant variable with its coefficient being -1.446; this coefficient will be used when we apply the model to a new cohort.
B S.E. Wald df Sig. Exp(B)
IVARIABLE1 .000 .000 .395 1 .530 1.000
IVARIABLE2 -.336 .193 3.044 1 .081 .715
IVARIABLE3 -1.446 .220 43.070 1 .000 .235
IVARIABLE4 .035 .032 1.200 1 .273 1.036
IVARIABLE5 .075 .026 7.982 1 .005 1.078
IVARIABLE6 -.004 .006 .446 1 .504 .996
IVARIABLE7 -.047 .250 .036 1 .850 .954
IVARIABLE8 -1.238 .622 3.961 1 .047 .290
IVARIABLE9 -1.525 1.009 2.284 1 .131 .218
IVARIABLE10 .584 .344 2.878 1 .090 1.794
IVARIABLE11 -.171 .038 19.933 1 .000 .843
IVARIABLE12 -.057 .015 14.572 1 .000 .944
IVARIABLE13 .169 .030 32.331 1 .000 1.184
Step 1a
Constant .005 3.723 .000 1 .999 1.005
Table 3: Variables in the Equation
These three tables give us the two most important metrics for logistic regression modeling: how well the model fits the data (Table 1 and Table 2) and the significance and coefficients of our variables (Table 3). The next step is to check for correlation because this can throw off our model by affecting the significance of variables and their coefficients. An easy way to tell if there is correlation within the model is to first check if the model makes sense. If variables that clearly should be negatively affecting a student's retention (such as poor grades) have a positive coefficient, this is a red flag that there is possible correlation within the variables of the model.
Correlation is the magnitude of the negative or positive relationship between two independent variables. Perfect correlation means that one independent variable is a mathematical combination of another variable. (Menard, 2001) When variables have a high amount of correlation, whether positive or negative, it is impossible to determine the correct estimations for coefficients. The Correlation Matrix (Table 4, for space reasons this has been reduced to just 4 independent variables) gives us the best way to measure the correlation between variables at a glance. The closer the values in this table are to 1 and -1 means that these variables are highly correlated, and further analysis should be taken. The variables in this matrix are not highly correlation; therefore no further analysis is required. However since this matrix does not include any measurement of the significance of the correlation this should not be used as the determining factor of correlation, it should only serve as a glance at correlation. To get the full picture you must run a Bivariate correlation between the variables, which is beyond the scope of this paper.
104
Proceedings of the 5th Annual National Symposium on Student Retention. Copyright 2009. C-IDEA, The University of Oklahoma.
Now that you have the results of your regression, how do you apply it to the current cohort? The regression can be applied with the following equation. Let A be the set of independent variables and let B be the set of the variables respective coefficients, both of size n. Then to calculate the logit L (which is a form of probability) apply the following:
This is equivalent to the following:
The last calculation transforms the logit L back into a probability P, which lies between 0 and 1.
This result is the probability a student being retained (Pampel, 2000)
Conclusion
There you have it, a quick and practical way to perform logistic regression that can be applied to freshmen cohorts. Be warned that logistic regression is still a complicated and intense analysis procedure that requires great attention and more tests than detailed in this paper, but this outline will give you a start. Iterative development of the model is the best approach to defining a strong and dynamic model that can help predict which of your students will be retained. For further studies into logistic regression, I highly recommend that you look further into the references detailed in this paper.
105
Proceedings of the 5th Annual National Symposium on Student Retention. Copyright 2009. C-IDEA, The University of Oklahoma.
References Garson, D (2009, August 7). Logistic Regression. Retrieved August 12, 2009, from StatNotes Web site:
http://faculty.chass.ncsu.edu/garson/PA765/logistic.htm Menard, S (2001).Applied Logistic Regression Analysis. Safe University Papers Series on Quantitative
Applications in the Social Sciences, 07(106), 17-90. Pampel, F. C. (2000).Logistic Regression: A Primer. Safe University Papers Series on Quantitative
Applications in the Social Sciences, series no. 07-132, 1-53.
106
Proceedings of the 5th Annual National Symposium on Student Retention. Copyright 2009. C-IDEA, The University of Oklahoma.
Structural Reorganization, Curricular Reform & Collaborative Programs: Strategies to Improve Retention of First-Year Students
Ralph J. Rascati
Associate Vice President for Academic Affairs Dean, University College
Abstract - Kennesaw State University, over the last 5 years, has undergone significant changes designed to foster student success and increase retention rates. A new academic college, University College, was formed to house a variety of academic programs and support services that previously existed without college-level affiliation and to foster the development of new programs and services to serve the needs of our students. Subsequently, a new Department of First-Year Programs was created within University College to provide greater focus for those programs specifically targeting first-year students. Curricular reforms were instituted to strengthen the academic offerings for first-year students. Finally, a renewed spirit of collaboration between University College and the division of Student Success and Enrollment Services produced new programs and services designed to increase the success of first-year students. Each of these initiatives will be discussed. Background
Student persistence is positively influenced by the degree to which the students are academically and socially involved (Astin, 1984; Mallette & Cabrera, 1991; Nora, 1987; Pascarella & Terenzini, 1980; Terenzini & Pascarella, 1977; Tinto, 1993) and the degree to which they view themselves as valuable, integrated members of the institution (Rendon, 1994). Stage, in his article entitled Reciprocal effects between the academic and social integration of college students suggests that academic and social integration positively influence persistence in different ways and that the probability of persistence is increased even further when both forms of integration occur (Stage, 1989). Tinto (1993) also wrote, “The point of retention efforts is not merely that individuals be kept in college. Education, the social and intellectual development of individuals, rather than just their continued presence on campus should be the goal of retention efforts”. Therefore, it is student success, academically, that is the goal. Retention is the result.
Much of the effort at promoting student success is focused on the first year of college. Pascarella and Terenzini (2005) analyzed data from decades of research. They suggested that academic self-confidence declines during the first-year of college as students experience the increased academic rigor associated with higher education. Helping students deal with these issues, thereby increasing the probability of success and reducing attrition becomes an important goal for programs and services designed to serve first-year students. Upcraft, Gardner and Barefoot, in their introduction (entitled “The first year of college revisited”) to Challenging and supporting the first-year college student: A handbook for improving the first year of college also cite the first-year of college as a critical transition for students entering higher education and suggest that students need to have the support and array of experiences necessary to learn and succeed in the first year of college. Kuh, Palmer, and Kish (2003) reviewed the literature on extracurricular involvement (including leadership positions, student organization membership, and service/community engagement activities) and concluded that such activities can have a positive impact on student learning and development, and therefore, student success and retention.
Vincent Tinto, in his article entitled Colleges as communities: Taking research on student persistence seriously (Tinto, 1998) suggests several organizational reforms to improve student success,
107
Proceedings of the 5th Annual National Symposium on Student Retention. Copyright 2009. C-IDEA, The University of Oklahoma.
and therefore retention, based on these and similar findings. First, colleges and universities should adopt a community model of academic organization that would promote involvement through the use of shared, connected learning experiences among its members, students and faculty alike (e.g. learning communities). Second, colleges and universities, four-year ones in particular, should reorganize the first year of college as a distinct unit (e.g. University College) with its own underlying logic and pedagogical orientation. Third, colleges and universities should reorganize faculty work to allow them, as well as their students, to cross the disciplinary and departmental borders that now divide them.
In addition to structural/organizational changes, there are many “best practices” designed to foster academic and social integration. Barefoot et al (2005) list the following initiatives as being among those that contribute to excellence in the first year of college: advising, common reading programs, common course sequences, convocations, first-year seminars, learning communities, mentoring, orientation, peer leaders, summer academic programs, service learning/civic engagement, and supplemental instruction. While these specific practices can, and do, foster student success and contribute to increased retention rates, other studies suggest that factors such as campus culture and leadership will enhance their effects.
Consider the “Graduation Rates Outcome” study that was conducted by the American Association of State Colleges and Universities (AASCU, 2005), in which 12 institutions, considered to be successful in terms of retention and graduation rates, were analyzed for factors contributing to that success. The following statement can be found in the final report of that study:
Visiting team reports provide detailed examples of many…specific practices engaged in by particular study institutions. But it is important to emphasize that although these practices may indeed be effective individually and instrumentally, the real thrust of what visiting teams found is how intentionally they are deployed as part of a larger strategy for student success, which is in turn embedded in a pervasive institutional culture… there is no one “magic bullet” that guarantees success. Simply finding what appears to be a “best practice” combination of programming and “plugging it in” on campus is unlikely to be sufficient. Success instead means carefully reading the current campus culture, aligning people and programs, and making a collective commitment to be in it for the long haul…leadership is where all of this begins.
That study also emphasized the importance of collaboration between student affairs and academic
affairs. The report states that “At some study campuses, boundary spanning has simply become part of the way the institution does business and appears to operate without a great deal of visible organization or authority. The following extracts from team reports illustrate this succinctly:
When asked how they collaborate . . . most were not conscious of doing so . . . they simply call others when they need their assistance (which is daily) if they want them to be part of a program or service or part of a planning team . . .“it’s just what we do all the time” (Montclair State University).
The success of these programs for first year students is due in part to a pervasive spirit of cooperation among various offices in the Student Affairs and Academic Affairs divisions (Murray State University).
Consider Tinto’s three principles of retention (Tinto, 1993).
1. Effective retention programs are committed to the students they serve. 2. Effective retention programs are first and foremost committed to the education of all, not just
some, of their students. 3. Effective retention programs are committed to the development of supportive social and
educational communities in which all students are integrated as competent members. These principles reinforce the idea that both intellectual and social aspects of the higher education experience are important to student success.
108
Proceedings of the 5th Annual National Symposium on Student Retention. Copyright 2009. C-IDEA, The University of Oklahoma.
Finally, Noel (1985) argued, “The more students learn, the more they sense they are finding and developing a talent, the more likely they are to persist; and when we get student success, satisfaction, and learning together, persistence is the outcome”.
The key to retention therefore, is the institutional commitment to providing the highest quality education possible. Retention will follow.
KSU: Early Efforts to Promote Student Success
Modeled after the University of South Carolina’s nationally regarded University 101 course, Kennesaw College (now KSU) implemented a Freshman Seminar (now the First-Year Seminar) in 1983 with the goal of improving student success and retention. Dr. John Gardner, a leading scholar in the field of students in transition and founder of USC’s National Resource Center for the First Year Experience and Students in Transition, helped shape the seminar at its inception. Since that time the course has been refined to address the specific needs of KSU’s ever-changing student body. In the early years of the program, the seminar course was taught by faculty from the various disciplines as part of their course load. As KSU’s enrollment grew, those faculty were needed to teach exclusively in their discipline. Simultaneous with this was a change in admissions practices that reduced the number of students that were being admitted with learning support requirements. To maintain the teaching load of the learning support faculty, primary responsibility for the first-year seminar was given to the Department of Learning Support. With the addition of other programs (e.g. the Honors program) the department was renamed the Department of University Studies. This was the beginning of KSU’s signature approach of having dedicated tenure-track faculty teach first-year seminars. In 2000, the first learning communities were organized. Learning communities are one way of addressing the first and third of the recommendations of Tinto (1998). Structural Reorganization Creation of University College
In 2003-2004, KSU was selected as one of the founding institutions for the Foundations of Excellence Project organized by Dr. John N. Gardner, Senior Fellow of the National Resource Center for The First-Year Experience and Students in Transition, and Executive Director of the Policy Center on the First Year of College. Two major recommendations resulted from that project: (1) Increase collaboration between the academic programs and the programs/services offered by the Division of Student Success and Enrollment Services and (2) Establish a college-level affiliation for the Department of University Studies, which had been reporting to a Dean of Undergraduate Education but was not affiliated with a specific academic college. The second recommendation operationalized in a specific manner the general recommendation from Tinto’s work cited above (Tinto, 1998). In response, a University College was established in the 2004-2005 academic year with the Department of University Studies as its only department. In July 2006, a new Dean of University College was hired. Subsequently, a college-level Director of First-Year Retention Initiatives was appointed to develop new programs/services intended to increase student success and retention. Creation of the Department of First-Year Programs
In July 2007, University College was restructured into two departments. Faculty with primary responsibility to the first-year seminar and/or the learning communities program were moved into a new Department of First-Year Programs (FYP). The remaining academic programs and academic support services (including the Learning Support Program and the Supplemental Instruction Program) stayed within the Department of University Studies. The FYP department has no degree programs. Therefore, its sole focus is on the success of first-year students and helping them transition to an academic major.
109
Proceedings of the 5th Annual National Symposium on Student Retention. Copyright 2009. C-IDEA, The University of Oklahoma.
As indicated above, learning communities were first developed in 2000. However, at that time neither the learning communities program, nor the first-year seminar was required. In fall 2005 KSU instituted a First-Year Curriculum Requirement for first-time, full-time students entering the university with fewer than 15 semester credit transfer hours (usually in AP, IB, or joint-enrollment transfer credit). Though it was originally proposed that all students take a first-year seminar course, some students with high credit-hour programs would have had great difficulty fulfilling this requirement. Therefore, students can fulfill the requirement by (1) completing a first-year seminar or (2) enrolling in a learning community (LC) that combines two or more General Education courses. (Most, but not all, LCs contain a first-year seminar). This flexible requirement ensures first-year students receive the transitional support they need while providing them with some choice as to how they fulfill that requirement. This curriculum requirement provides the foundation for a multifaceted first-year experience (FYE) program. Retention Effects of the First-Year Experience Program
The success of the first-year experience (FYE) program can be seen in Tables 1 and 2 below.
TABLE 1: Retention by Cohort Year before Curriculum Requirement 2002 2003 2004
Category N % Ret
% Inc N
% Ret
% Inc
N
% Ret
% Inc
Not in FYEa 1053 74.0 -- 1264 73.4 -- 711 71.4 -- In FYEb 769 78.9 4.9 788 80.1 6.7 937 76.5 5.1
a Students not enrolled in a first-year seminar (KSU 1101) or a learning community (LC) b Students enrolled in KSU 1101 (alone or in an LC) + Students enrolled in an LC without a KSU 1101 section TABLE 2: Retention by Cohort Year after Curriculum Requirement
2005 2006 2007
Category N % Ret
% Inc N
% Ret
% Inc
N
% Ret
% Inc
Not in FYEa 322 60.6 -- 378 68.3 -- 213 74.2 -- In FYEb 1705 75.1 14.5 1975 77.6 9.3 2136 76.4 2.2
a Students not enrolled in KSU 1101 or an LC b Students enrolled in KSU 1101 (alone or in an LC) + Students enrolled in an LC without a KSU 1101 section
It can be seen from the data that there is a measureable positive effect of the FYE program. In the years since the implementation of the first-year curriculum requirement, that effect appears to be more variable. However, that can probably be attributed to the small number of students in the base (students not enrolled in either a first-year seminar and/or a learning community). With numbers that small, a difference in retention of 2 or 3 students changes the retention rate by 1%. For example in fall 2007 a difference of 21 students retained would change retention by 10% for those not in the FYE, whereas those same 21 students would only change the retention by 1% for those students in the FYE. Therefore, instead of looking at each year independently, it may be more instructive to calculate the mean retention over the entire 6-year period. The baseline retention (those not in FYE) would be 71.7%. Retention for those in the FYE would be 77.0%. This is a 5.3% increase due to the FYE program. Given the total number of students served by the FYE program, this translates to an additional 440 students retained over the 6-year period analyzed and, if one considers the current (fall 2008) size of the class of incoming first-year students, means an additional 130-135 students retained this year and even more as enrollment grows.
110
Proceedings of the 5th Annual National Symposium on Student Retention. Copyright 2009. C-IDEA, The University of Oklahoma.
Refinement of Learning Outcomes The foundation for KSU’s first-year initiatives are strong learning outcomes for both the seminar
courses and the learning communities programs. These have undergone several revisions in the history of KSU’s programming for first-year students. The most recent changes occurred in 2006. Intense faculty effort and discussion produced four specific categories of learning outcomes for all sections of the first-year seminar, including a new globally-focused version. , The categories are: 1) Life Skills, 2) Strategies for Academic Success, 3) Campus and Community Connections, and 4) Foundations of Global Learning. The learning outcomes in these categories drive all content, readings, assignments, and assessments. In addition, all seminar sections utilize Foundations of Academic Inquiry (Braden & Hoerrner, Eds, 2008), the custom-published textbook written and edited by University College faculty and supported by a custom website hosted by Pearson Custom Publishing. Learning communities also have a common set of learning outcomes, related to but different from, those established for the first-year seminar. They are: 1) Students will demonstrate skills in interacting appropriately with other students, faculty, and staff; 2) Students will demonstrate cross-disciplinary connections; 3) Students will reflect upon the value of global learning for engaged citizenship; and 4) Students will use critical thinking skills and problem solving skills. Common Reader Program
All sections of the seminar also integrate a common reader as well as out-of-class activities that promote connections with the campus and greater community. For example, the 2008-09 common reader selection was Three Cups of Tea: One Man’s Mission to Promote Peace … One School at a Time by Greg Mortenson and David Oliver Rellin (2006). After reading the book and hearing Mr. Mortenson speak on campus, first-year students raised $16,000 for his organization to build a school in rural Pakistan in honor of KSU. Student responses to surveys administered to them indicated the following:
79% thought it challenged them to view the world from new perspectives 85% reported that they were more aware of other cultures 85% reported a greater understanding of global issues 67% reported that it contributed to peer-to-peer connections
Globally Focused First-Year Seminars
In 2008, a new globally-focused version of the seminar was launched to provide students with a distinct context for fulfilling seminar course learning outcomes. It was based on the Center for Strategic and International Studies’ (www.CSIS.org ) initiative called the Seven Revolutions (www.7revs.org), which forecasts what the world will look like in 2025 and beyond as a result of seven driving forces1. Student evaluations were particularly strong for this version, outpacing the aggregate evaluations for seminars employing the traditional approach. Additional focused versions are now being planned, including, in fall 2009, a globally-focused learning community, containing a first-year seminar, whose students will travel to Brazil for 10 days. While there, they will learn about Brazilian culture and become involved in one or more community engagement projects. Early Start Bridge Academy
In summer 2008 a summer bridge program called the Early Start Bridge Academy (ESBA) was piloted for a cohort of 29 students requiring learning support math. These students, self-selected to participate, were given the opportunity to enroll in a two-course learning community consisting of learning support math (MATH 0099) and a first-year seminar. The program provided students with additional time to master the material because the courses started in the summer (4 weeks) and continued into fall semester (15 weeks). Therefore, the students had 19 weeks to master the mathematics material
1 These seven driving forces, according to CSIS researchers, are: population, resource management, technology,
information/knowledge, economic integration, conflict, and governance.
111
Proceedings of the 5th Annual National Symposium on Student Retention. Copyright 2009. C-IDEA, The University of Oklahoma.
rather than the traditional 15 weeks. The first-year seminar course focused on time management skills and strategies for academic success during the four-week summer timeframe to better prepare the students for the additional courses they picked up at the start of the fall semester. This early start resulted in improved grades in that section of MATH 0099 (DFW rate = 7%; Pass rate = 93%) vs. students in the traditional 15-week MATH 0099 (DFW rate = 33%; Pass Rate = 67%). In addition, post-test responses on the Mathematics Self-Efficacy Test, students’ journal entries, online discussion forums, and focus group discussions indicated improved study skills and demonstrated a positive attitude regarding their ability to be successful in college in general and mathematics in particular. These encouraging numbers have resulted in an expansion of ESBA planned for summer/fall 2009. Establishment of a Modified Version of a First-Year Seminar for Students on Academic Probation
In spring 2009 faculty in the Department of First-Year Programs developed a 10-week, 1-credit-hour, pass/fail course (KSU 0090) to help students who are on academic probation after their first semester, regain good academic standing. The course, which will be required of these students beginning spring 2010, focuses on time management, learning styles, and strategies for academic success as well as strategic choice of a major. Individual Development Plans (IDPs) will be created with each student, and follow-up appointments will be required after the 10-week session. Collaborative Programs
As indicated earlier, one of the recommendations coming from KSU’s participation in the Foundations of Excellence project was to strengthen the collaboration between the academic programs and the programs/services offered by the Division of Student Success and Enrollment Services that are beneficial to first-year students. This was reinforced in 2006 when a consultant-led retention summit resulted in a retention plan that also involved collaborative efforts between University College and the Division of Student Success and Enrollment Services. A renewed spirit of collaboration produced new programs and services designed to increase the success of first-year students. These include the development of an early alert/early intervention system, the creation of a First-Year Advising Center (FYAC), and the use of advising teams. Early Alert/Early Intervention
In fall 2007 the Director of First-Year Retention Initiatives piloted an Early Alert/Early Intervention program in first-year seminar classes to identify first-semester students who were experiencing poor academic performance and to direct them to appropriate resources or interventions that could help them succeed. Early Alert referrals that fall were received for 198 students, who were then contacted by the Early Alert office. Of these 198 students, 125 (75%) completed the semester in good academic standing. In fall 2008, 138 students were referred to the Early Alert office. Of these, 88 (64%) students completed the semester in good academic standing. The current manual implementation of the program will continue in the first-year seminar. However, because the manual implementation is labor intensive, expansion to other courses will be dependent on the acquisition of software with a point-and-click interface for identification and intervention referral in order to automate the process for faculty. First-Year Advising Center
In fall 2008, a new First Year Advising Center (FYAC) was opened to better serve the needs of first-year students. This advising center is jointly operated by Student Success Services (SSS), in the Division of Student Success and Enrollment Services, and University College. It is staffed by professional academic advisors from SSS, a faculty member from the Department of First-Year Programs with 50% responsibility to the FYAC, and the college’s Director of First-Year Retention Initiatives.
112
Proceedings of the 5th Annual National Symposium on Student Retention. Copyright 2009. C-IDEA, The University of Oklahoma.
Peer Leaders/Peer Advisors In collaboration with the Center for Student Leadership (CSL), which jointly reports to the Vice
President for Student Success and Enrollment Services and to the Dean of University College, two related programs have been developed. The Peer Leader program uses students affiliated with the CSL who have previously completed the first-year seminar, as student assistants for faculty currently teaching a first-year seminar. They attend every class session for the section to which they are assigned and perform a variety of functions at the request of the instructor, such as facilitating class discussions, organizing co-curricular activities associated with the class, helping students in the class prepare for advising sessions, or helping students connect to campus resources and activities.
The Peer Advisor program was developed concurrently with the pilot of the Advising Team program (see below). Peer Advisors meet with the class to which they are assigned a few times during the semester to discuss academic advising and other campus connections. Many maintain contact with students in their assigned classes through Facebook accounts, and are available by this mechanism or by email to answer questions from students. Feedback indicates that Peer Leaders and Peer Advisors have been well received by both the faculty and the students. Advising Teams
Faculty in the Department of First-Year Programs have taken an active role in student advising, functioning as academic advisors and mentors, especially to exploratory students who have not yet declared a major. In fall 2006 a pilot study was done in which advising teams were formed for 10 sections of the first-year seminar. Teams consisted of the instructor of the section, a professional advisor supplied by SSS, and a student Peer Advisor supplied by the Center for Student Leadership. Retention and GPA were compared to a matched set of students in sections that did not have advising teams assigned. Retention results were encouraging, but, because of the small numbers involved, not statistically significant. GPA results, however, did show a significant increase for students with advising teams assigned, when the students followed up with those teams. In fall 2007, the program was expanded to 50 sections. Results are presented in Table 3.
TABLE 3: Effects of Advising Teams on Retention and GPA Control-1 Control-2a Study-1 Study-2b
aStudents in the Control Group (no advising team assigned) who independently sought advising at SSS = 20.8% bStudents in the Study Group (advising teams assigned) who sought advising at SSS = 32.8%
cRetention for Study-2 is significantly different from all other groups – X2=11.399; df=3; p=0.01 dGPA for Study-2 is significantly different from all other groups - p<0.001
In the control group (no advising teams assigned) 143 students (20.8%) independently made
appointments with the professional advisors on the office of Student Success Services (SSS). In the study group (advising teams assigned) only 389 (32.8%) made follow-up appointments with the professional advisors in SSS. The results show statistically significant increases in both GPA and retention for those students in the 50 sections with advising teams who followed up with their team members. Furthermore, a somewhat larger percentage of the students in the study group made appointments with the professional advisor member of the team, as compared to the percentage of students in the sections without advising
113
Proceedings of the 5th Annual National Symposium on Student Retention. Copyright 2009. C-IDEA, The University of Oklahoma.
teams assigned who independently made appointments with the professional advisors in SSS. Therefore, the advising teams stimulated more students to seek advising than might otherwise do so, and better prepared them for success, as measured by retention and GPA. Based on these results, all fall 2008 sections of the First-Year Seminar were assigned advising teams. This has now become a permanent feature of the program, and efforts are now directed at getting more students to make follow-up appointments. One way this is being done is by providing a more-formalized training program for the Peer Advisors that focuses on ways they can more effectively interact with the students in their assigned sections. Conclusion In the last several years Kennesaw State University has undergone significant changes designed to foster student success and increase retention rates. In 2004-2005 KSU reorganized to form a new college, University College, to house a variety of academic programs and support services that previously existed without college-level affiliation. Subsequently, a new Department of First-Year Programs was created within University College to provide greater focus for those programs specifically targeting first-year students. Curricular reforms were instituted creating a multifacted curriculum requirement for incoming students and new sets of learning outcomes for first-year seminars and for learning communities. A common reader program focused on global, civic/community engagement was put into place. Globally focused versions of the first-year seminar and learning communities have also been developed. A summer bridge program was initiated for students entering KSU with a learning support requirement in math. Each of these reforms was successful as measured by objective and/or subjective criteria. Finally, a renewed spirit of collaboration between University College and the division of Student Success and Enrollment Services produced new programs and services that have effectively increased the success of first-year students. These include the development of an early alert/early intervention system, the creation of a jointly staffed First-Year Advising Center, the use of Peer Leaders and Peer Advisors, and the use of advising teams in first-year seminar sections.
114
Proceedings of the 5th Annual National Symposium on Student Retention. Copyright 2009. C-IDEA, The University of Oklahoma.
Literature Cited
AASCU (2005). Student success in state colleges and universities: A matter of culture and leadership. A report of the Graduation Rates Outcomes Study. Washington, DC: American Association of State Colleges and Universities.
Astin, A. (1984). Student involvement: A developmental theory for higher education. Journal of College Student Personnel, 25(3), 297-308.
Barefoot, B. O., Gardner, J. N., Cutright, M. Morris, L. V., Schroeder, C. C., Schwartz, S.W., Siegel, M. J., & Swing, R. L. (2005). Achieving and sustaining institutional excellence for the first year of college. San Francisco: Jossey-Bass.
Braden, S. & Hoerrner, K. (Eds.) (2008). Foundations of academic inquiry (2nd Ed). Boston: Pearson Custom Publishing
Kuh, G., Palmer, M., & Kish, K. (2003). The value of educationally purposeful out-of-class experiences. In T/L. Skipper & R. Argo (Eds.), Involvement in campus activities and the retention of first-year college students (Monograph No. 36, pp. 1-18). Columbia, SC: University of South Carolina, National Resource Center for the First-Year Experience & Students in Transition
Mallette, B. I., & Cabrera, A. (1991). Determinants of withdrawal behavior: An exploratory study. Research in Higher Education, 32(2), 179-194.
Mortenson, G. & Rellin, D.O. (2006). Three cups of tea: One man’s mission to promote peace…one school at a time. New York: Penguin
Noel, L., (1985). Increasing student retention: New challenges and potential. In L.R. Noel-Levitz, D. Saluri, & Associates (Eds.), Increasing student retention (pp.1-27). San Francisco: Jossey-Bass.
Nora, A. (1987). Determinants of retention among Chicano college students. Research in Higher Education, 26(1), 31-59.
Pascarella, E. T., & Terenzini, P. (1980). Predicting persistence and voluntary dropout decisions from a theoretical model. Journal of Higher Education, 51(1), 60-75.
Pascarella, E. T., & Terenzini, P. (2005). How college affects students, volume 2: A third decade of research. San Francisco: Jossey-Bass.
Rendon, L. (1994). Validating culturally diverse students: Toward a new model of learning and student development. Innovative Higher Education, 9(1), 33-52.
Stage, F. (1989). Reciprocal effects between the academic and social integration of college students. Research in Higher Education, 30, 517-530.
115
Proceedings of the 5th Annual National Symposium on Student Retention. Copyright 2009. C-IDEA, The University of Oklahoma.
Terenzini, P. T., & Pascarella, E. T. (1977). Voluntary freshman attrition and patterns of social and academic integration in a university: A test of a conceptual model. Research in Higher Education, 6(1), 25-43.
Tinto, V. (1993). Principles of effective retention. Journal of The Freshman Year Experience, 2(1), 35-48.
Tinto, V. (1993). Leaving college: Rethinking the causes and cures of student attrition (2nd ed.). Chicago: University of Chicago Press.
Tinto, V., (1998). Colleges as Communities: Taking Research on Student Persistence Seriously. The Review of Higher Education 21(2), 167-177.
Upcraft, M.L., Gardner, J.N., & Barefoot, B.O. (2005). The first year of college revisited. In M.L. Upcraft, J.N. Gardner, B.O. Barefoot, & Associates (Eds.), Challenging and Supporting the First-Year College Student: A Handbook for Improving the First Year of College (pp. 1-12). San Francisco: Jossey-Bass.
116
Proceedings of the 5th Annual National Symposium on Student Retention. Copyright 2009. C-IDEA, The University of Oklahoma.
Utility of CARTTM: Classification and Regression Trees for Improving College and University
Graduation Rates
Gerard T. LaVarnway, PhD Cathy M. Frey, Dean Department of Mathematics
School of Mathematics and Sciences Norwich University [email protected]
Abstract - We apply a classification algorithm in an effort to successfully predict if a student will or will not graduate. Specifically, the CARTTM (Classification and Regression Trees) algorithm was applied to university retention data. CARTTM is a nonparametric approach to classification and regression problems. It is a very robust method of performing classification. CARTTM has several features that make it attractive over more traditional methods. Traditional methods of dealing with this problem often lack flexibility. Observations for example, are often assumed to be normally distributed. Traditional methods typically cannot deal with observations that contain categorical data or missing data in a natural way. CARTTM analysis often makes progress on high dimensional data sets when other methods do not. The flexible nonparametric approach of CARTTM will be discussed. The classification rules appear in the form of binary trees, which are easy to understand and interpret. Such decision tools may prove useful to colleges and universities trying to improve their retention challenges. CARTTM techniques have been applied to several years of data from a small private undergraduate institution. Academic program specific models for predicting graduation indicate the potential to improve graduation rates by an average of twenty percent across the academic programs investigated. Introduction
Retention of enrolled students is a critical issue that faces many colleges and universities across the United States. Low graduation rates of incoming classes can have a negative impact on an institution. It clearly is in the best interest of a university to improve retention and maximize the graduation rate of the students that it admits. Retention of enrolled students and ultimately graduation of admitted students should be of primary importance to all in the university community.
Low graduation rates can have a devastating effect on the long-term health of an institution. A university spends valuable resources to attempt to find the “right fit”. An immense effort is put forth by enrollment management teams to “make the class” each year. A tremendous effort goes into recruiting prospective students. In addition, financial aid packages are fine tuned to attract students in increasingly tight markets. Even before a student steps foot on campus, the university has invested heavily in the individual. Once a student has selected a university, the institution continues to invest in the individual by allocating resources (human, physical and financial) in an effort to have each and every student be successful. High attrition can have a devastating effect on budget managers who have built budgets expecting certain stable revenues from enrolled students. Loss of students makes for a very unstable situation for those responsible for the financial health of the institution. Finally, poor graduation rates deflate morale. Students, faculty and staff all suffer when large numbers of students leave an institution.
This study investigates undergraduate retention at Norwich University. Norwich’s graduation rate has been hovering around 50% and the university has recently set a goal of a six year graduation rate of 70% by the year 2019. We will apply a classification algorithm in an effort to successfully predict if an undergraduate student will or will not graduate. Specifically, the CARTTM (Classification and Regression Trees) algorithm was applied to university data for the entering classes of 1995-2002 (graduation classes
117
Proceedings of the 5th Annual National Symposium on Student Retention. Copyright 2009. C-IDEA, The University of Oklahoma.
of 1999-2006). CARTTM is a nonparametric statistical approach to classification and regression problems. It is a very robust method of performing classification. CARTTM has several features that make it attractive over more traditional methods. In addition, CARTTM has been used successfully in a variety of applications that suggest it has potential as a classifier for our problem. CARTTM Methodology
The general classification problem may be described as follows: Given a multivariate observation z, which is known to belong to one of n possible populations, determine which population is most likely. The analyst who is performing the classification has a historic database of observations, for each of which the actual population is known, and has suspicions in the form of prior probabilities – regarding the likely population of z. CARTTM: Classification and Regression Trees is both an elegant mathematical theory and a sophisticated piece of software. The mathematical theory of CARTTM was developed by Leo Breiman, Jerome Friedman, Richard Olshen and Charles Stone culminating in the monograph Classification and Regression Trees (Wadsworth, 1984). In addition, CARTTM is a registered trademark. The software was developed by California Statistical Software, Inc. and is exclusively licensed to Salford Systems of San Diego, CA. CARTTM Professional Edition 6.0 was used for all processing in this investigation.
CARTTM is a robust decision-tree tool for data mining, predictive modeling and data processing. CARTTM performs both classification and regression. For our problem, only the classification capabilities of CARTTM were used. One asset that makes CARTTM attractive to our problem is that CARTTM is nonparametric. CARTTM makes no assumptions as to the distribution of any of its variables (e.g., normality). In addition, CARTTM has many attractive features not available in more traditional approaches including powerful binary-split approach, reliable pruning strategy, automatic self-validation procedures, surrogate splits, adjustable misclassification penalties, alternative splitting criteria and linear combination splits are possible.
We briefly summarize the theory of CARTTM presented in the monograph by Breiman et al (1984). We only present the main components of the theory to give the reader a basic understanding of how binary decision trees are obtained. For a more detailed account of the motivation of the procedures discussed below, we refer the reader to the monograph.
We start with a learning set of vector measurements for which the true class of each vector is known. For our purposes a vector is a collection of measurements we have on an applicant for admission. Included in our measurement vector is any variable (SAT scores, ACT scores, academic major, class rank, etc.) which is thought to have some predictive power in determining the classification (graduate/non-graduate) of the measurement. From the learning set with members having known classification, we desire to construct a tree which will help predict future members whose class is unknown.
118
Proceedings of the 5th Annual National Symposium on Student Retention. Copyright 2009. C-IDEA, The University of Oklahoma.
Figure 1
At each non-terminal node (Figure 2), we have a binary (yes-no) question which splits the non-terminal node into two descendant sub-nodes which may or may not be terminal nodes. The CARTTM software package allows for univariate splits (e.g., math SAT > c), linear combination splits (e.g., .6math SAT + .45 verbal SAT > c) and categorical variable splits (e.g., is initial academic major A or B). This important capability allows us to incorporate continuous variables such as SAT and ACT scores, high school GPA, etc., as well as categorical variables like academic major, athletics, gender, etc.
In Figure 2, we have a hypothetical decision tree on a two class problem {Graduate, Non-graduate} with two univariate splits on continuous variables Math SAT and Verbal SAT and a categorical split on academic major.
Figure 2
So we have at our disposal a set of binary questions. At each step in our decision tree building process CARTTM decides to split a node or not. CARTTM determines it’s splitting questions based on the notion of impurity. Impurity is a measure of how “mixed up” the classes are in a node. Impurity measurements have the property that if there are equal numbers of each class in a node the impurity measurement is maximized and if the node is pure (all one class) the impurity measurement is minimized. Basically the impurity measure is evaluating how well separated our classes (graduate/non-graduate) are. The CARTTM software has a variety of options for measuring impurity including Gini, Symmetric Gini, Entropy, Class Probability, Twoing and Ordered Twoing. We refer the reader to the monograph for a
119
Proceedings of the 5th Annual National Symposium on Student Retention. Copyright 2009. C-IDEA, The University of Oklahoma.
complete description of these impurity measures. If a split is performed CARTTM selects the split that minimizes the impurity. This splitting process is continued until an overly large tree is produced. By an overly large tree we mean a tree for which every terminal node there is, up to duplication, less than a fixed number of elements (default = 5) in it from the learning set when it is run down the tree. From this overly large tree, a process known as pruning generates a nested sequence of subtrees. A subtree in the sequence is created by pruning off branches that have the weakest predictive power for classification. Class assignment is performed in a natural way. If the misclassification cost are equal then we assigned to each terminal node the class of the most populous class of the learning set elements in that terminal node when these elements are run down the tree. CARTTM does allow the analyst to assign misclassification cost. For example, it may be desirable to assign a higher cost for calling a non-graduate a graduate or vice versa. At this point in the process the CARTTM software has produced a nested sequence of subtrees ranging from an overly large tree down to a single tree with one node in which no splitting occurred. One of the trees in the sequence will be selected as the optimal tree and used as our classifier. CARTTM selects the optimal tree from the sequence which minimizes the overall misclassification rate. Two methods are available for estimating the misclassification rate: resubstitution and n-fold cross validation. For large data sets a portion of the learning set can be allocated to generate the optimal tree and the remainder of the data set used to estimate the misclassification rate. For smaller data sets n-fold cross validation is suggested. With n-fold cross validation every data point is used in tree construction and every data point is also used in estimating the misclassification rate. A large n will give more accurate results but will also require more intensive computation. Again, see the monograph for complete details. It is important to note why a researcher might choose CARTTM over alternative techniques. CARTTM makes no assumptions as to the distributions of any of its variables. (e.g. normality). This was of particular interest since we observed many of our programs were seeing bimodal and/or skewed distributions of applicant scores (SAT, ACT etc.). CARTTM allows for categorical variables such as major, athletics etc. CARTTM utilizes the powerful binary-split approach described above. In addition, CARTTM has automatic self-validation procedures. With cross validation every data point is used in tree construction as well as used to calculate error rates. CARTTM’s utilizes surrogate splits to handle missing data in a natural way. This may be useful if an applicant does not take the SAT or ACT or has other missing data. Adjustable misclassification penalties help avoid costly errors. CARTTM allows the analyst to assign a higher penalty for assigning a non-graduate as a graduate or vice versa. CARTTM also provides a ranking of variable importance. This is a ranking is a list of variables that CARTTM determines to have the most predictive power in the CARTTM analysis. CARTTM Analysis of Norwich University Retention Data Our retention problem can be formulated in several ways as a general classification problem defined above. We decided to formulate our question as a two-class problem. That is a student is considered being in one of two classes: class 0 – does not graduate and class 1 – does graduate. We have not constrained the number of semesters it took an individual to graduate or leave the university. (We could define success as the individual graduates 8 semesters, 10 semesters, etc.) We simply are interested in the ability to predict if an attending student will or will not graduate from Norwich University. Our database included all undergraduate students entering the university from 1995 - 2002.
120
Proceedings of the 5th Annual National Symposium on Student Retention. Copyright 2009. C-IDEA, The University of Oklahoma.
Included in the data set are the typical continuous variables such as math and verbal SAT scores, ACT scores, high school GPA, class rank (if available), etc. Norwich University is somewhat unique in the landscape of higher education. Being the nation’s oldest private military college, a portion of Norwich’s student body is composed of a Corps of Cadets. In addition, we also have traditional students who lead a more typical college lifestyle and a small number of commuter students. The distribution by lifestyle is approximately 1200 students in the Norwich University Corps of Cadets, 700 traditional students and 100 commuter students. CARTTM’s ability to handle categorical variables allows us to include variables such as lifestyle (Corps, Civilian, and Commuter) plus additional categorical variables gender, athletics, etc.
Norwich University is composed of six undergraduate academic schools including Architecture and Art, Business, Engineering, Humanities, Mathematics and Sciences and Social Sciences. The average SAT score for the entering class is typically 1050. Approximately 25% of the entering students take the ACT exam. Cohort groups were identified by school. In diverse schools cohort groups were identified by similarities in specific academic programs. CARTTM models were completed for 1) Business, 2) Engineering, 3) Communications, 4) English, 5) Biology/Sports Medicine/PE/Geology/Environmental Science, 6) Nursing, 7) Social Science, 8) Criminal Justice, and 9) Undeclared Bachelor of Arts/Undeclared Bachelor of Science. A particular challenge, are students who enter with an undeclared major. Currently this cohort has a graduation rate of 30%.
Two-thousand one hundred and sixty (2160) individual CARTTM analyses were conducted on the eight (8) years of data including entering classes for fall semesters1995 - 2002. Membership in a cohort was determined by initial academic major declared. A systematic approach was developed examining one variable at a time and then adding additional predictors one variable at a time (e.g., math SAT, verbal SAT, math and verbal SAT, ACT scores, math SAT and verbal SAT and ACT scores, etc.). This is an effective way to mine the data, as well as look for improved separation of the two groups during analysis. In addition, sensitivity analysis was conducted on the CARTTM parameters splitting rule (e.g., Gini, Towing), linear combination splits (e.g., yes/no) and prior probabilities (e.g., Equal, Data, Mixed). The reader is referred to CARTTM Professional Version 6.0 for a complete description of these parameters.
The classification models for the cohorts were selected on a variety of factors including, but not limited to, improvement to the current graduation rate for that cohort, tree simplicity (e.g., number decisions and terminal nodes) and ease of understanding. A sample of decision tree models are in figures 3 - 6. Figure 3 is a CARTTM decision tree for the Business cohort.
121
Proceedings of the 5th Annual National Symposium on Student Retention. Copyright 2009. C-IDEA, The University of Oklahoma.
Is 0.931 * Math SAT +0.364 *Verbal SAT >630?
Yes
No
Non Graduate
Graduate
CART Retention StudyModel 2 for Business
This decision tree correctly identifies 36.3% of the Non Graduates and 77.1% of the Graduates.
Implementing this decision tree would increase the graduation rate for Business from 49.0% to 77.1%
Figure 3
Figure 3 demonstrates a binary decision tree with one split. The split is a linear combination split
on math and verbal SAT and improves the graduation rate for the Business cohort. This decision would improve the graduation rate for this cohort by 28.1%.
Similarly, Figure 4 is a binary decision tree for the Engineering cohort.
Figure 4
122
Proceedings of the 5th Annual National Symposium on Student Retention. Copyright 2009. C-IDEA, The University of Oklahoma.
Figure 4 demonstrates a binary decision tree with one split. The split is a single decision on math SAT and improves the graduation rate for the Engineering cohort by 15.5%.
Figure 5 is a model for the English cohort where the optimal model selected uses ACT scores.
Figure 5
Figure 5 demonstrates a binary decision tree with one split. The optimal model selected for this
model uses ACT scores in the decision process. It is important to note that this model identifies 100% of the non-graduates correctly, as well as 71.4% of the graduates in this cohort. This improves the graduation rate for English by 19.4%. It is also very important to note that CARTTM has a feature known as surrogate splits. What would we do if the student has not taken the ACT exam? For each split in a decision tree, CARTTM calculates a surrogate split. The surrogate spit is an alternate decision that has the greatest association with the chosen split. The surrogate split in Figure 5 is on verbal SAT. If a member of the English cohort had not taken the ACT exam (or scores are not available) then a decision would be made on verbal SAT. In the example in Figure 5, if the student’s ACT comprehensive score is not above 24, we check to see if verbal SAT is above 585. The surrogate decision is not simply a conversion of ACT to SAT, but an association that CARTTM determines as having the greatest association with the optimal split as determined by CARTTM. This is a very attractive feature for the analyst developing the retention models, as well as admissions personnel. This handling of missing data in a natural way makes CARTTM very attractive for our purposes.
Figure 6 demonstrates a binary decision tree with two univariate splits on math and verbal SAT for the Nursing cohort.
123
Proceedings of the 5th Annual National Symposium on Student Retention. Copyright 2009. C-IDEA, The University of Oklahoma.
Figure 6
Figure 6 demonstrates an improvement to the graduation rate for the Nursing cohort of 30.6%. Similar models and results were obtained for the remaining cohorts. Table 1 summarizes the effect of the optimal CARTTM models selected for all 9 cohorts.
Results of CARTTM Analysis for Norwich University Entering Classes Fall 1995 – Fall 2002
Cohort Current Graduation Rate
CARTTM Graduation Rate
Increase N Net Gain In Graduates
Business
49.0% 77.1% 28.1% 569 160
Engineering
54.6% 70.1% 15.5% 434 67
Communications
40.0% 41.5% 1.5% 133 2
English
52.0% 71.4% 19.4% 662 128
Biology/Sports Medicine, etc.
44.5% 79.8% 35.3% 479 169
Nursing
51.1% 81.7% 30.6% 235 72
Social Science
50.1% 61.9% 11.8% 662 78
Criminal Justice
46.7% 61.4% 14.7% 680 100
Undeclared BA/BS
30.0% 71.9% 41.9% 1116 468
Average Increase
22.1% Graduates Gained
1244
124
Proceedings of the 5th Annual National Symposium on Student Retention. Copyright 2009. C-IDEA, The University of Oklahoma.
Table 1
Students who entered Norwich University as undeclared majors have been a particularly challenging group. For the period studied, the graduation rate has been a dismal 30.0%. As Table 1 indicates CARTTM achieves a graduation rate of 71.9%; an improvement of 41.9% for the undeclared cohort group. The average CART graduation rate across all nine cohorts is 68.5% with an average increase of 22.1% In addition to the CARTTM analysis performed, linear discriminate analysis was performed on all cohorts for comparison. For a description of linear discriminate analysis see Anderson (1984) or Dillon et al (1984). For all cohorts, the CARTTM models did as well as or performed significantly better than the linear discriminate models developed. Given the ability to include categorical data, handle missing data in a natural way and the ease of interpretation, the CARTTM models are preferred. Conclusion A total of 2160 tests were conducted on entering classes of Norwich University from 1995 – 2002. The results demonstrate that CARTTM has significant potential as an analysis tool to assist with Norwich University retention challenges. Significant improvements to graduation rates for identified cohorts are obtained with the CARTTM models. The average improvement across the nine cohorts is 22.1%. The greatest improvement, 41.9%, was obtained with the highest risk cohort (Undeclared BA/BS) Tests conducted on data sets with high dimensionality suggest CARTTM has the ability to discover complex relationships between data from multiple areas.
What makes these models attractive for Norwich University is that the models are developed from institutional data and are directly applicable to Norwich University. It is believed that similar models could be developed for other institutions including their unique set of circumstances and identity. The ease of understanding of these binary decision tree models makes them attractive. They are easy to understand by university personnel, as well as potential applicants. The use of categorical variables is important and provides another dimension to the analyst’s list of potential predictors. Models were developed that did split on categorical variables however they were not in the optimal trees indentified. This suggests that perhaps future optimal models may select these variables or that alternative categorical variables (currently not identified) may be of use in future models. The ability to handle missing data is very helpful from both a development aspect, as well as a practical matter for university acceptance decision makers. Classification trees could be implemented in a variety of ways: 1) as a screening tool for admission, 2) as a classifier after admission/enrollment, and 3) as a tool for determining a candidate's financial aid. The CARTTM models could be used to determine admission to the university or into a specific academic major. Alternately the models could be used to identify admitted students as “at risk” and place them on an early intervention programs to maximize a student’s chances for success. Finally, financial aid personnel could use the CARTTM models to allocate financial aid to students identified with the greatest potential to ultimately graduate from the university.
125
Proceedings of the 5th Annual National Symposium on Student Retention. Copyright 2009. C-IDEA, The University of Oklahoma.
References
Anderson T. (1984) An Introduction to Multivariate Statistical Analysis, Second Edition. John Wiley & Sons., New York, NY. Breiman L., Friedman, J., Olshen R., and Stone C. (1984) Classification and Regression Trees. Wadsworth, Belmont, CA. Dillon W. and Goldstein, M. (1984) Multivariate Analysis: Methods and Applications. John Wiley & Sons, New York, NY. Steinberg, D. and Colla P. (1995) “CARTTM: Tree-Structured Non-Parametric Data Analysis”.
Salford Systems, San Diego, CA.
126
Proceedings of the 5th Annual National Symposium on Student Retention. Copyright 2009. C-IDEA, The University of Oklahoma.
If at First You Don’t Succeed, Try Community College: An Analysis of Community College Transfers who Applied as First
Time Freshmen
Jaclyn Cameron Research Associate DePaul University
Abstract- Community colleges have been regarded as important stepping stones on the path to student success. The primarily general education curriculum along with the availability of pre-college level coursework offered at the community college provides a low cost, local opportunity to strengthen academic profiles. This research supports the argument that community college enrollment can be key to student success. The study will compare first time freshmen, admitted non-matriculated students who entered later as community college transfer students, and denied applicants who entered later as community college transfers. First, 4-, 6-, and 8-year graduation differences will be compared. Second, entering academic profile information (including high school GPA and ACT scores) of the groups will further distinguish differences in graduation rates. Lastly, the expected graduation rates of the transfers, based on if they had entered as freshmen, will be modeled from freshmen academic profiles, and compared to actual rates. Issues concerning time between first application and transfer entry, full versus part time enrollment, and number of hours transferred in will be related to the findings. This research has implications for strengthening support for community colleges, institutional partnerships, dual enrollment programs, and pre-entrance advising. Introduction
The National Center for Education Statistics reports that as of the Fall of 2006, nearly 35% of all postsecondary students were enrolled at a community college (Provasnik and Planty, 2008). Community college enrollment is utilized by a vast number of students whose ultimate goal is the attainment of a 4 year degree. In fact, Provasnik and Planty (2008) report that nearly 66% of all students who enroll in community college immediately after high school intend to earn a baccalaureate degree. Interestingly, the authors also distinguished that 39% of this group revised their plans of attending a 4-year institution and began their postsecondary education in a community college. The National Center for Education Statistics has found that more than 70% of community college students intend to pursue a 4-year degree (2001). Success at the 4-year institution for transfer students, however, is riddled with obstacles. As Adelman (2006) has so comprehensively studied, transfer students who transfer with few hours, take time off between terms, and enroll less than full time will struggle to graduate. A 2003 study found that only 35% of the community college transfer students who intended to earn a bachelor’s degree had graduated with a 4-year degree within 6 years of starting postsecondary education (National Center for Education Statistics, 2003). What is missing from this line of research is an in-depth look into the group of students who revise their plans of attending a 4-year institution and begin their academic career at a community college. Why have these students decided to change their path? The answer to this question may be tied to economic reasons, time obligations, and/or academic preparedness. It may be possible that some of these students were advised to begin at a community college by postsecondary professionals. The goal of this research is to investigate the pattern of academic behavior for students whose original intent was to enroll in a 4-year institution and later enrolled at that institution as a community college transfer student. Intent
127
Proceedings of the 5th Annual National Symposium on Student Retention. Copyright 2009. C-IDEA, The University of Oklahoma.
in this study is defined as students who applied to the institution as first time freshmen. The study identifies students who were admitted but did not enroll as first time freshmen and students who were not admitted as first time freshmen. The institution at which this research is being conducted is a large, private, 4-year, research intensive university in an urban Midwestern location. Issues relating to transfer enrollment and retention have become a primary focus and the subject of current strategic planning goals. The results of this study may be unique to this institution; however the methodology and research goals can be modeled across institutions of higher education.
Methodology
The sample was obtained from the total entering community college transfer population between the years of 2000 to 2004. The 4,334 transfer students were queried to determine if any application was received prior to the transfer admission. Students who had previously applied for first time freshmen admission were identified. The data was cleaned so that students who enrolled as transfers the same term they applied as freshmen were eliminated. The resulting sample of students consisted of 177 (4%) transfer students who had previously applied as first time freshmen. The admission decision status was also included, such that students were identified as either admitted (n=118; 67% of total) or non-admitted (n=59; 33% of total). High school GPA and ACT scores which were submitted and entered into the University system at the time of the freshmen application were retrieved for the sample. Missing information from the time of the freshmen application was supplemented with data at the time of transfer enrollment, if available. ACT scores were obtained for 259 total students; 53 students in the admit group (45%), 10 students in the non-admit group (17%) and 196 in the freshmen group (87%). High school GPA was obtained for 328 students total; 87 in the admit group (74%), 30 students in the non-admit group (51%), and 211 students in the freshmen group (95%). Additionally, the date of first admission, as well as the date of first enrollment was gathered. The graduation status at four, six, and eight years after the initial transfer enrollment, the number of hours transferred in, the cohort year of entry, and cohort year if the student had entered as a freshmen rounded out the dataset. The analyses compare three groups; the transfer students who were admitted as freshmen but did not matriculate the transfer students who were not admitted as freshmen and a comparison group of first time freshmen students. For the freshmen comparison group, a sample of 221 students from the 2000-2004 cohorts was taken. This group was sampled to reflect a similar distribution of ethnic and college enrollment characteristics, as these are two prominent variables at this institution that are related to differences in graduation rates. The samples of the transfer group as a whole and the freshmen comparison group were primarily white (55-59%), with a large proportion of Hispanic (16-18%) and Asian/Pacific Islander (14-15%) identified students. The slight majority of students were entering into the College of Commerce (40%) followed by the College of Liberal Arts and Sciences (36-38%).
Analyses
The first step of this investigation was to compare the 4-, 6-, and 8-year graduation rates of the three groups of interest (Table 1). The size of the cohort that is available for each particular rate is included, as not all 5 of the cohorts which were used in the aggregate have 6- and 8-year rates at this time. As illustrated, students who were admitted, but did not enroll as first time freshmen have the highest graduation rates overall. Students who were not admitted as freshmen had lower rates than the admitted students, but higher rates than the first time freshmen students. The four year rate for first time freshmen is substantially lower than the two other groups, but this is to be expected, as it is common for student to take more than four years to graduate. Interestingly, transfer students from the cohorts that have eight years of data had all graduated, however the sample of freshmen students had only graduated at nearly 88% by the eighth year. This may be an indication that transfer students who had previously applied to the institution are a particularly unique group of students.
128
Proceedings of the 5th Annual National Symposium on Student Retention. Copyright 2009. C-IDEA, The University of Oklahoma.
Entering academic profiles such as high school GPA and ACT scores have traditionally been related to success outcomes. The next step of this research was to determine if differences between the groups could be enhanced with this additional knowledge. A One-Way ANOVA was computed to look at the differences between the groups on both ACT and high school GPA; however these results must be used with caution, as cell sizes were small and unequal. For high school GPA, the ANOVA was significant (F(2,325) = 42.49, p < .01) and Scheffѐ post hoc tests revealed that each group differed significantly from each other (p < .01). The freshmen group had the highest average GPA at 3.36 (SD = .57), followed by the admitted group at 3.09 (SD = .52) and the non-admitted group at 2.38 (SD = .67). The ANOVA to test group differences on ACT was also significant (F(2, 256) = 14.74, p < .01) and Scheffѐ post hoc tests revealed significant differences between all three variables at the p < .01 level. Again, the same trend emerges, with freshmen having the highest average ACT score of 23.8 (SD = 3.54), followed by admitted transfers (M=22.0, SD = 3.71) and non-admitted transfers (M=18.3, SD = 3.43). Although these results were statistically significant, they were not entirely surprising. The non-admitted students were obviously not admitted based on some criteria, and it would be a safe presumption that at least some of these students were denied admission due to unmet academic criteria. Additionally, the admitted sample may be differing from the freshmen sample due to different incentives, such as academic scholarships offered at the time of admission, influencing the decision to enroll or attend elsewhere. To investigate the relationship between graduation, group type and pre-collegiate academic performance indicators, 2x3 ANOVAs were ran for each 4-, 6-, and 8-year graduation rate for both high school GPA and ACT. This analysis technique was utilized to determine whether high school GPA or ACT scores differed by the interaction effect of admission type and graduation rate. None of the 6 analyses resulted in significant interaction effects. The main effects of admission type and graduation status were significant in all models, which support the academic research as well as the analyses performed above. However, as this was not of primary interest to this section, the main effects are not included here. Although statistical significance did not exist, the average high school GPAs and ACT scores are provided for insight. As is illustrated in Table 2, those who graduated tended to have higher GPAs and ACT scores, and the freshmen have higher measures than the admit and non-admit groups.
Table 2. Average high school GPA and ACT scores by admission group and graduation status at three points.
129
Proceedings of the 5th Annual National Symposium on Student Retention. Copyright 2009. C-IDEA, The University of Oklahoma.
However, high school GPA and ACT scores cannot be differentiated with the combination of the two characteristics. To determine how the transfer students might have fared if they had entered as a first time freshmen, given their high school GPA and ACT scores, the fourth, sixth, and eighth year graduation rates were predicted based on the results of logistic regressions modeling freshmen graduation statuses at each of the three points. First, the freshmen four year status, coded as graduated or not graduated, was modeled, using high school GPA and ACT. The overall model was significant, χ2 (df = 2, n = 211) = 30.07, p < .01, and 67.6% of the cases were correctly identified. The addition of the academic variables improved the prediction nearly 10 percentage points (from 58% to 68%). However, the model predicts those who do not graduate (79.8% correctly classified) better than those who do graduate (50.6% correctly classified). Cox & Snell R2 suggests that this model explains approximately 15% of the variance between graduating and not graduating. This result should be recognized as low, which may be expected, given that only two variables are attempting to predict graduation outcomes. Additional relevant regression statistics are provided below.
Table 3. Summary statistics from logistic regression analysis modeling freshmen 4 yr graduation rates from high school GPA and ACT scores.
Next, the sixth year graduation status for freshmen was modeled. This model was also significant (χ2 (df = 2, n = 156) = 17.50, p < .01) and classified 69.2% of cases correctly. Overall, there was no improvement in the percent of correctly classified cases, however there was improvement in the distribution of the correctly classified cases, as the percent correctly classified as not graduated increased (from 0 to 18.8%) with the addition of high school GPA and ACT information. Cox and Snell R2
suggests only 11% of the variance in graduation status is explained by these variable. Again, this should be considered a small amount, and the interpretation of the model should take this into account. The summary statistics for the model are included in the following table.
Table 4. Summary statistics from logistic regression analysis modeling freshmen 6 yr graduation rates from high school GPA and ACT scores. The final model predicted eighth year graduation of freshmen based on high school GPA and ACT scores. This model was also significant (χ2 (df = 2, n = 130) = 10.40, p < .01) and correctly predicted 86.2% of cases. The result of this model may be due to few observations in the not graduated category, as the inclusion of the academic performance measures did not improve the prediction of classification. Additionally, Cox and Snell R2 for this model are reduced to .077, suggesting that only 8% of variance is explained. Model statistics have been provided in the table below.
130
Proceedings of the 5th Annual National Symposium on Student Retention. Copyright 2009. C-IDEA, The University of Oklahoma.
Table 5. Summary statistics from logistic regression analysis modeling freshmen 6 yr graduation rates from high school GPA and ACT scores.
To predict how the transfer students may have succeeded if they had entered as first time freshmen, each regression equation from the previous models was applied to the transfer students. Due to the fact that the majority of cases were missing either high school GPA or ACT scores, the prediction could only be calculated on 33 of the possible 177 transfer students, making interpretation of these results anecdotal, at best. For this reason, the two transfer student groups will not be compared. Using the criteria of .50, the freshmen model applied to the transfer students predicted that 9.1% of the transfer students would graduate in 4 years, 59.4% would graduate in 6 years, and 93.9% would graduate in 8 years. This is a far cry from the observed rates of this group of 33 students, who graduated at 51.5% in 4 years, 64.5% in 6 years, and 100% in 8 years. It is obvious that this method, although relevant, is not suitable for this sample of students. As an alternative and supplemental method, the transfer cohorts were recoded into transfer equivalency cohorts, such that the level of the student, based on the number of hours transferred in aligned the student back to a cohort as if they had entered as freshmen. For example, a sophomore level transfer student who entered in 2000 would be placed into the 1999 cohort, on the presumption that a sophomore level is equivalent to having completed one year of academic work. This, of course, changes the timing of graduation, as transfer students coming in have a greater opportunity to graduate within four years from the first enrollment, due to credits brought with them. The effect of this equivalency method on graduation rates of the transfer students in general are displayed in Table 6. As evidenced, the transfer
Table 6. Transfer Equivalency Graduation Rates
rates are lower than the freshmen comparison group rates. This is confounded by the fact that transfer students are entering the institution with credit, and although that is accounted for by this method, what is not accounted for is the coursework that does not translate to acceptable coursework, which must be replaced with additional courses at the institution. Rates of the different types of admit transfers reflect
Table 7. Transfer Equivalency Graduation Rates by Admit Type
the trend as evidence at the start of this research. Non-admitted students graduate at slightly lower rates than the admitted students; however the differences are more subtle using this method than the differences are when tracking transfer students from the point of entry forward to each time period. Traditionally, transfer students tend to have unique characteristics, including the propensity for part time enrollment, stopping out within the academic year, and poor persistence based on the number of
4 Yr Rate (Cohort n) 6 Yr Rate (Cohort n) 8 Yr Rate (Cohort n)
Freshmen 42.5% (n=211) 71% (n=183) 87.6% (n=153)
Transfers 39% (n=177) 61.4% (n=158) 66.7% (n=108)
4 Yr Rate (Cohort n) 6 Yr Rate (Cohort n) 8 Yr Rate (Cohort n)
Admitted 39.8% (n=118) 61.5% (n=104) 67.6% (n=68)
Non-Admitted 37.3% (n=59) 61.1% (n=54) 65% (n=40)
131
Proceedings of the 5th Annual National Symposium on Student Retention. Copyright 2009. C-IDEA, The University of Oklahoma.
hours transferring to the recipient institution. In relation to this study, these characteristics are explored for the sample to lend insight to the results of the analyses. First, it is noteworthy that 85% of the transfer students in this sample entered as full time students. This may be evidence of motivation toward goal-achievement, as the initial application for admission as a first time freshmen suggests that these students have had goals of obtaining a 4-yr degree.
Second, the time between first applying as a first time freshmen and entering as a transfer student suggests that most students did not waste precious time. On average, only 2.4 years separated the first application from the initial entry for the overall transfer sample (range .14 – 9.13 years; SD = 1.83). Students who were admitted had slightly less time between application and matriculation (M=2.26 years; SD = 1.74) than those who were not initially admitted (M=2.76 years; SD = 1.97). An independent samples T-Test revealed that those transfer students who graduated within 4 years had significantly less time between the application and enrollment (M=2.03, SD = .13) than those who did not graduate within 4 years (M=2.80, SD = .25) (t(171) = -2.944, p < .01). Analysis at the 6 year rate was not significant, which may suggest that less time between application and enrollment will reduce the time it will take to earn the degree, but will not reduce the likelihood of earning a degree.
One might hypothesize that students would be taking the time between applying as a freshmen and enrolling as a transfer student to attend a community college and complete a large majority of the general education curriculum. Interestingly, however, the time between the first application and enrollment is not related to the number of hours transferring into the institution (Pearson’s r = .140, p =.062). This may be due to the fact that the average number of hours transferred in for this sample of student is 72 hours (SD = 29.43), and the mode is 90. The proportion of students entering at a sophomore or higher class level for the admitted group is 67% and similarly, 61% of the non-admitted group enters as sophomore or upper class level students. This may serve as evidence that these transfer students are spending time wisely, and cumulating necessary coursework to transfer into the receiving institution; a good practice considering students with more hours transferred in are more likely to graduate within 4 years (Independent samples T-Test: t(171) = 5.13, p < .01)1. Those who graduate in 4 years transfer in an average of 81.2 hours (SD = 24.5) compared to those who do not graduate within 4 years (M=59.3, SD = 31.6). Conclusion Overall, there is evidence that students who first intend to enroll in the institution as first time freshmen are motivated to earn a bachelor’s degree. The high success rates of these students are a positive result of repeat applicants and a testament to a student’s desire to attain a goal. As an incentive to increase transfer enrollment and success, this repeat applicant behavior should be highlighted in admission decisions. There seems to be some evidence, however, that students who did not qualify for admission at the initial application may return underprepared academically, as they take more time to earn the degree, compared to those that are initially admitted. This research provides yet another example of the advantage of community colleges. For students who may be economically challenged or unable to commit to the less flexible schedule of a traditional 4-year institution, a community college can provide a constructive starting point on the path to a baccalaureate degree. Given these results, institutions should consider capitalizing on potential partnerships with community colleges. Dual enrollment opportunities for students who show strong interest in earning a 4-year degree but are not prepared to enroll at a 4-year institution may benefit from the dual support offered by both institutions. Additionally, dual enrollment programs provide seamless entry into the 4-year institution and potential course articulation pitfalls can be monitored during the course of the student’s career. Pre-collegiate advising can also be enhanced with this knowledge, as both 1 Due to the immense overlap between those who graduate within 4 and 6 years, analysis of the 6 year graduation rate was not done.
132
Proceedings of the 5th Annual National Symposium on Student Retention. Copyright 2009. C-IDEA, The University of Oklahoma.
financial and academic counselors can confidently advise students that postponing entry into a 4-year institution replaced by enrollment in a community college can be a successful path towards a 4-year degree. Limitations and Future Research This research was limited to the population of students who applied as freshmen at only this institution. To advance this research, the sample should be expanded to any student who applied at any 4 year institution as a freshman, prior to attending a community college. The small sample size in this study occluded many of the statistical tests utilized. Additionally, this research did not include a wide variety of variables that are related to retention and graduation, thus the results may change if such variables were included. Identifying the reasons for not being admitted would provide another rich layer of information that may help determine the characteristics that differentiate attrition and retention behaviors. The lack of pre-collegiate academic performance measures for the transfer students also hindered this investigation, thus the inclusion of missing high school GPA and ACT scores would excel this research.
133
Proceedings of the 5th Annual National Symposium on Student Retention. Copyright 2009. C-IDEA, The University of Oklahoma.
Bibliography
Adelman, C. (2006) The Toolbox Revisited: Paths to Degree Completion From High School Through College. Washington, D.C.: U.S. Department of Education.
National Center for Education Statistics (2003). Community College Students: Goals, Academic
Preparation, and Outcomes, NCES 2003–164, by Gary Hoachlander, Anna C. Sikora, and Laura Horn. Project Officer: C. Dennis Carroll. Washington, DC.
National Center for Education Statistics, (2001). Community College Transfer Rates to 4-year
Institutions Using Alternative Definitions of Transfer, NCES 2001–197, by Ellen M. Bradburn and David G. Hurst. Project Officer, Samuel Peng. Washington, DC.
Provasnik, S., and Planty, M. (2008). Community Colleges: Special Supplement to The Condition
of Education 2008 (NCES 2008-033). National Center for Education Statistics, Institute of Education Sciences, U.S. Department of Education. Washington, DC.
134
Proceedings of the 5th Annual National Symposium on Student Retention. Copyright 2009. C-IDEA, The University of Oklahoma.
Justifying Investments in Retention Efforts Based upon their Return on Investment
Abstract - Increasing a college or university’s retention rate is conceptually appealing to academic leaders. Many quality and benchmarking measures are use first to second year retention and graduation rates as strong indicators of institutional quality. Colleges and universities have worked to implement those initiatives which can be improved through attention to detail and heightened customer service. We start this paper by reviewing many of the actions which, while individually not costly, can require resources to coordinate and work across organizational units. Such actions can result in a positive improvement in retention. When taken in conjunction with some dedicated specific actions, these interventions may not only impact retention rates but also the quality of the experience for all students. We then explore the financial arguments which can be used to demonstrate the positive impact of increased retention on the “bottom line,” and conclude with a simple system which can be used to collect and present both actions and their results.
Introduction
Every college and university is a victim of “past successful practices.” In the military it is often referred to as “preparing to fight the last war.” Many of these routine practices were developed to solve a problem or deal with an issue as it developed. Members of the academic community may remember for many years the problem which needed to solved, but be blind to the unintended consequences of the action that resulted from the selected solution. Perhaps nowhere is this phenomenon more prevalent than in the policies of the Business office. These professionals may view students with unpaid balances as “derelict” in their responsibilities. This is certainly understandable. Many of us in the academic side of the house tend to believe any story presented by a sincerely appearing student. Both those in the finance office have heard it all. Students and parents have made promises, failed to keep them, and those with means have claimed they are unable to pay. Also, for these professionals, the bad debt expense or uncollected revenue ratio is a benchmark against which they are measured. It is helpful for those charged with the responsibility for retention efforts reach out to the leaders in the Business office to discuss interventions, especially in these challenging economic times. It is crucial that the approach be focused on helping them achieve their goals of increased revenue for the college or university. We recommend that meetings be scheduled where a number of topics can be discussed. Retention Initiatives: Across a Broad Spectrum Examine Routine Practices
It is important to examine business-as-usual and look for ways to decrease obstacles to registration inherent in the process. First, all of our institutions must set the maximum balance students may have on their account. In these times, it is important to reconsider the maximum balance students may have on their accounts before registering. In our experience, increasing the limit by as little as $500 will allow an increased number of students to register and plan to return to the institution rather than look for more friendly alternatives.
135
Proceedings of the 5th Annual National Symposium on Student Retention. Copyright 2009. C-IDEA, The University of Oklahoma.
It may be advisable to waive or having an “amnesty period” for late registration fees as an incentive for getting students to register, and we also advise reconsidering the type of holds that can prevent registration. Ask the hard questions, such as whether or not you really want to have a library hold for $20 prevent a student from registering for classes. With a “zero balance” rule, you may find as we did that when a student had an outstanding library fine, instead of withholding library privileges, the fine when to the student account and were often not high enough to trigger a new invoice, yet created a registration hold on the account which blocked a student from registering. This neither taught the student accountability for returning materials, nor facilitated the student’s registration.
You may also want to consider allowing students with above the maximum balance to register, and alerting them to the fact that they will need to pay the balance by a specific date or their registration will be dropped. This has several benefits. First, it sends a positive message, gets the students attention, and moves them to action, and yields revenue that would not have otherwise come to the institution, and it uncovers problems and misconceptions.
The impact of a positive experience with the Financial Aid Office on retention cannot be overestimated. These professionals often find themselves bound by rules and the brunt of complaints from students, parents and faculty. Retention benefits can be realized by selected action assigned to highlight the customer service and positive approach these professionals have on the college experience of student. Such efforts need increase the visibility and approachability of the office. Examples include:
• Holding Fill out your FAFSA” nights for students and parents. This can be for local high school students as well as incoming and current students. A great community service, recruitment opportunity and reduces the likelihood of students failing to complete these important forms. .
• Include Financial Aid updates as part of regular faculty and university-wide orientation and education programs. Such programs can help others at the University understand that every dollar of financial aid is one fewer dollar that is available for education and student support activities.
Exploit the unique or special opportunities that are available at your institution
As a college or university, what makes it special and student success oriented? Such advantages need to be widely promoted and celebrated. Too often you can talk with the administration and faculty who will describe passionately all the virtues and opportunities available to students. But too many students are unaware of that these opportunities are there for them.
There are many ways to do this, but we suggest just two here. First, find the opportunity to showcase successes gently. This must be success achievable by most of the students, not only the special few. A simple success campaign can include a listing of all of the students who are participating in internships and the places where they are interning.
Second, if you have 5-year degrees, consider holding sessions to help students “regroup” and “refocus” to enable them to earn a master’s degree at your institution. Market the year of tuition they save, and the year earlier they are “on the market.” The hidden benefit is that it may keep the student from leaving.
Develop a Series of Targeted Interventions
One approach that can work at a small institution, is to create a small group to meet either in person or virtually on a regular basis to review at-risk students, such a group needs a person of sufficient organizational status to lead it but will need participation from many other offices on campus. These include representatives from the Academic Dean/Asst. Dean/Dean of First Year, Dean of Students, Residence Life, Academic assistance (ADA, tutoring), Athletic Director and/or Faculty Athletic Representative, Counseling, and Health Services.
We suggest that you consider creating an alert email address to which members of the faculty and staff can send short notes of concern about students, without detail. With the expansion of internet based communication such information can avoid privacy concerns and permit immediate action to be
136
Proceedings of the 5th Annual National Symposium on Student Retention. Copyright 2009. C-IDEA, The University of Oklahoma.
coordinated by the university to support the identified student. It is important that this communication is monitored by one person so as to be sure that efforts are not misdirected and time is not wasted.
It is important to enlist First Year Experience faculty and staff in the effort, and ask them to pass along names of any student they think is experiencing problems or has discussed the possibility of transferring. During the first semester, administer a “temperature-taking” survey within the first three weeks of school for First years and transfers. If possible situate this in the classroom, but can be on-line as well. Look for the “big three” things that can be done systemically with the group. It is advisable to have one part of the survey that is not anonymous. The last section of the survey should ask them to express the need to talk to someone and provide a short description of the problem they are experiencing—ranging from adjustment to the college classroom, to their roommates, to parking. Triage individual issues and enlist help of key staff and faculty to help. Create a list of students from this temperature taking that are “At risk” or some other term. This is the core of the database that will be used post week three.
At midterm, add students with midterm grades below C in two or more classes, and contact advisors to ask them to check in with their advisees. If your institution does not have mid-term grades, ask those teaching in the First Year Experience to report on those students “below C-level” at midterm.
Data, Data, and more Data: Maintain and Assess
Too often we do not even use information that we routinely collect. Convening the data managers of many areas under the leadership of an experienced administrator or outside consultant can often result in a system being developed which can identify students for whom a special intervention may prove helpful.
First, we suggest that you create a database with variables relevant to your institution that is able to be captured by your data system. This will require working with a number of individuals across the campus including: Financial Aid, Student Accounts/Bursar, Registrar, Student Life, Academic Affairs, and Athletics. Some examples of this data include:
• Name and class level for each student, not including seniors • Advisor as contact • Any crucial identifiers: International, top scholarship recipients, etc. • Type of hold on registration • Amount of hold • Missed at least one installment in installment plan • Intent to transfer, as evidenced by a faculty member, advisor, coach, or other staff member having
reported this to the alert team • Academic standing—probation, warnings, etc. • Fulfilled any mandated requirements for academic or student life support, such as tutoring,
conduct, etc. • Financial aid status • Students who have requested transcripts for anything other than graduate school and scholarships,
focusing largely but not exclusively on first and second year. • Whether they have met with faculty or staff to discuss transferring • Cumulative and term GPAs to provide indication of academic progress • Any problems with athletic eligibility • Completed advising meeting for the next semester (if appointments are required) • Registered for the next semester Second, mine any data you have to identify variables which predict retention, including: Results of
the National Survey of Student Engagement, Internal satisfaction surveys, Exit interviews, and Admitted Student Questionnaires. Engage the Institutional Research Staff and the Assessment Committee, if possible. These individuals are often very eager to see how data such as this is being used and are very helpful to the effort. They are often open to modifying instruments in order to test hypotheses about retention in future years.
137
Proceedings of the 5th Annual National Symposium on Student Retention. Copyright 2009. C-IDEA, The University of Oklahoma.
Consider the following variables which have been showed to predict retention in our experience, and in the literature:
• Demographics, including Age, Gender and Ethnicity • First-time first year versus transfer students • Resident versus commuter • For Resident Students, type of residence (Single, double, apartment, etc) • International vs. domestic • Out of state, In-state, International • High School and Transfer Institution Academic indicators (SAT/ACT, GPA) • Number of pre-college credits transferred in • Athlete (and by sport, and gender) • Financial indicators (Expected Family Contribution, Pell Eligibility, Independent Student, no
FAFSA/Full Pay) • Advisor One example illustrates the power of mining data. In one analysis it could be found that resident
retention was lower than expected but varied by type of housing. An analysis all the way to the particular dorm rooms could reveal that students in three-person residence rooms were twice as likely to leave after their first year as were those in two- or four-person rooms, due largely due to the interpersonal dynamics. The decision to “de-triple” was made in consultation between residence life and finance. The action would certainly come with a cost, the unrealized revenue from the third roommate. However, steps coud be taken to neutralize the cost. A premium could be charged for those desiring a two-person room (with the space for three), and those willing to live with three, rather than two roommates, could be offered a discount. In addition, the professional time to work with students with roommate issues could also be significant, if not calculated precisely. In order to minimize risk, the impact on retention could be assessed after a “pilot de-tripling” to demonstrate that retaining even one or two more students (tuition and room and board) would more than cover the lost revenue from the third roommates.
Justifying Additional Resources in the Business Environment Unfortunately, after the free and low cost efforts are completed, efforts directed to increasing retention often become justifying efforts in a dollar and cents fashion. College and University financial leaders focus their attention on those activities which will lead to a positive bottom line contribution. Their world is one in which the concepts of academic excellence and a quality student experience lack traction because they cannot be quantified. In the competition for resources, those responsible for retention efforts need to become more familiar with the justifying their efforts in those areas which can demonstrate a positive return on investment. Business decisions are generally based upon the concepts of net present value or return on investment. They represent the hurdle that a given investment must pass over in order to justify the expenditure. Each business sets it return on investment rates based upon a measure that includes what it costs to raise capital and the desired profit level to be attained. While it may seem foreign to higher education culture, the principle is very much at work. New program submissions for state approval generally require an analysis which will show that the proposed program will generate sufficient funds to cover its direct costs and make a contribution to the general operations of the college. The Compounding Effect of Retention Most retention efforts are directed to increasing traditional aged First Year retention. While often not expressly stated it is understood that you cannot increase graduation rates or student head count if student leave the university during or after their first year. The following effect can be realized from a 5% increase in First Year retention even if the retention rate at all other levels remains the same.
138
Proceedings of the 5th Annual National Symposium on Student Retention. Copyright 2009. C-IDEA, The University of Oklahoma.
Table 1: Impact of Interventions
The Bottom Line Contribution The simple example described above only increased the graduation rate by 2% but if we were to
assume net tuition revenue from each student as $10,000, the financial impact from the additional 14 students would be $140,000. The impact would then be multiplied by the total new First Year population. Therefore if 400 First Year students were admitted, the budget impact would be 4 times as much or $560,000. The premise of our argument is that the investment in this case would need to be less than $140,000 per 100 new First Year students. Generally if the investment could be made which would result in the increased First Year retention, then we would need to consider the impact of any increased costs associated with providing these students their academic and student support programs. In this case, assuming the size of the incoming class is 400 there would be few additional costs since there would be 20 more new sophomores, 16 new juniors and 12 new seniors distributed across all the majors at the University. The Law of Diminishing Returns
A fundamental economic concept known as the law of diminishing returns demonstrates that it becomes more difficult for the same level of investment to return its results at the same rate. In practice, this means that if we were to assume that we invested $70,000 to realize the 5 percent increased return on new First Years, an additional investment of $70,000 may only realize a return of 3 percent. This example is demonstrated in Table 1 below:
Post-First Intervention N=100
Post-Second Intervention N=100
First-Year 75% 75 78% 78 Sophomore 80 60 80 62 Junior 80 48 80 50 Senior 80 38 80 40 Total Retained 221 230 Table 2: Impact of First and Second Interventions
While the investment benefit $90,000 still exceeds the cost of $70,000 it will be much more difficult to justify from a return on investment basis.
Taking the example one more level assuming that another $70,000 will increase First Year retention by another 2 percent, Table 2 displays the following results. At this level the benefit will only be $60,000 for an investment of $70,000.
Proceedings of the 5th Annual National Symposium on Student Retention. Copyright 2009. C-IDEA, The University of Oklahoma.
While there may be many other reasons to make the investments to promote academic excellence
or a quality student experience, the financial justification becomes moot. Therefore as retention increases the incremental cost of increasing it further increases at a much faster rate.
Competing Investments The simple example presented above illustrates one of the serious obstacles to be overcome in attempting to justify on a financial basis investment in retention programs. Another is that is often very difficult to isolate the cause and effect of any given action. Unlike a clinical trial, we tend to make retention program investments college-wide, and several initiatives are often started simultaneously and without proper controls. If there is resistance based upon resources to implementation the value of piloting and activity should be explored. The key to all such activities is obtaining the buy-in for the investment from the finance leadership and then the accountability for results from the operational leadership.
Time is Money: Use Both Well Time is money, so it is important to be mindful that it is best not to spend valuable professional time in interventions for students with various levels of retention risk. Therefore, it is important to consider categorizing these students to focus attention on those for whom intervention might prove most fruitful: And creating and maintaining this database does not require high level executives. A good administrative assistant can manage the process well. Confidentiality is crucial, of course, so we advise against student workers maintaining or updating the database. Table 4 presents one possible system, in which each student name is color coded, each representing a category at the time of the most recent document update.
Category Action? Color Student Definitely Returning No action Purple No hold, not registered Intervene to facilitate registration
and note areas of concern Orange
Hold Intervene to help remove hold, problem solve
White
Not at risk but not registered Intervene to facilitate registration Blue At risk but registered for upcoming semester Keep an eye on Green Not registered for the current semester (on leave or in some other inactive status)
Keep in touch Yellow
Definitely Withdrawing (No chance to keep) No action Light Gray Withdrawn No action Dark Gray Table 4: Example Coding System
At each review of the database, it is important to move students from one color to another but maintain the complete database, so that assessment of the success of various interventions can be determined at the conclusion of the year. And it is important to note any intervention taken and by whom, in order to:
• Assist those working with the student understand all of the issues and be able to contact someone who has spoken most recently to the student
• Maintain consistent and complete records to facilitate analysis
To maximize the utility of this system, it is critically important to update this database consistently, weekly during peak times. An out of date database is a useless database. Celebrate Success, but don’t stop this Continuous Process It is crucial to communicate progress, however small, and celebrate success in “saving a student” – by working to solve problems that will enable them to stay or by moving a student from one category to another. It is also important to consider it a success when the conditions are created whereby students
140
Proceedings of the 5th Annual National Symposium on Student Retention. Copyright 2009. C-IDEA, The University of Oklahoma.
stay one more semester. This increases the chance of them staying to graduation. Last, it is important to celebrate the success of addressing a systematic obstacle to retention that will reap benefits later in impacting more students. The Big Decisions It is naïve to imagine that retention teams can bring about significant increases in retention rates through “no cost” and “low cost” measures discussed thus far. It is almost always necessary to make investments in infrastructure, personnel, and financial aid. However, these expenditures require buy in from the finance department (as well they should). Thus, it is important that the retention team provide a comprehensive education to those who work in the finance area about all the no- and low-cost initiatives that had been undertaken first, and the impact of these initiatives. This demonstrates the commitment the team has to work to impact the many factors that increase retention, and a recognition that most tuition- driven institutions do not have the luxury of using “big ticket items” as first-line retention interventions. A common practice is increasing the number and amount of merit scholarships. This can be very expensive in terms of unrealized revenue. However, it can be the only way to be competitive to the most highly-credentialed students, who may retain at higher rates and help raise the profile of the institution. There are many significant changes that can be made to the curriculum, the co-curriculum and to Financial Aid that can have a significant impact on retention. These interventions should be investigated, analyzed for likely return on investment, and implemented one at a time, if at all possible so that the impact can be assessed. Among these “big decisions” are include Student Success Centers and Advising Centers, both of which are often expensive in terms of bricks and mortar, personnel and programmatic costs. First Year Experience Programs are very common and usually include both curricular and co-curricular elements. These require significant faculty expertise, buy-in and effort, as well as investments in programmatic elements such as speakers, mentor programs and events and activities. Also popular are guaranteeing small class sizes for First Year, and in some cases, in-coming Transfer students. These small classes can be powerful ways to connect students to faculty and create support systems, but require cost-shifting to ensure that full-time faculty are teaching the sections and/or increase the adjunct or part-time faculty budget. Living and Learning Communities are often expensive in terms of both bricks and mortar and staff time, both live-in and student activities. Study abroad programs and Honors Programs can also be very effective in increasing retention, but require significant investment in professional time, programming costs and professional development.
At Risk Database Updated: 5/1/09
Name and Student ID
Class Level
Advisor Hold? Amount Number of Transcript
requests
Intent to Transfer
(informed faculty,
advisor or dean/s)
Academic Standing
Meeting Probation Req’ts?
Financial Aid
Probation (Federal)
Mary Smith FY Jones Yes 1000 3 advisor Probation Yes No
Scholarship Probation
(Institutional)
Request for Faculty Recommendation or discuss major issues
Number of Missed
installments
Cumulative GPA
Destination of Transcript(s)
Registered for Fall 09
Yes Yes: 3 1 2.0 Comm. College No
141
Proceedings of the 5th Annual National Symposium on Student Retention. Copyright 2009. C-IDEA, The University of Oklahoma.
Key: White = Financial Hold Purple = Returning Blue = not "at risk" but not registered
Orange = No hold; not registered
Green = At risk but registered for Fall 09 Yellow = not registered Sp 09 Gray = No Chance of Returning Dark Gray = LOA/Withdrawn Figure 1: Example Tracking Document: Identification of High Retention-Risk Students.
142
Proceedings of the 5th Annual National Symposium on Student Retention. Copyright 2009. C-IDEA, The University of Oklahoma.
Developing and Implementing an Early Alert System
Dale R. Tampke Associate Dean, Undergraduate Studies
Abstract - Early alert systems offer institutions systematic approaches to identifying and intervening with students exhibiting at-risk behaviors. Many of these systems rely on a common format for student referral to central receiving point. Systems at larger institutions often use web-based technology to allow for a scalable (available campuswide) approach to at-risk intervention. This paper describes the development and implementation of a web-based, fully integrated early alert referral system at a large, public university in the Southwest. After a brief review of the academic early alert concept, the paper describes the development of the system from a conceptual perspective, including how administrative, faculty, and student service input guided development. The next section details the technical aspects of system design, presented from the end-user perspective, emphasizing the integration of the system into the campus student information system. The following section includes a thorough description of the first term’s experience implementing the system, including aggregated descriptive data for those using the system, the students referred, and the follow-up to the referrals. Initial analysis indicates a modest positive relationship between personal follow-up to referral and student success. The paper concludes with recommendations for research and practice. Early Alert Systems
The retention literature suggests that effective intervention at the first indication of academic difficulty can play a role in reducing student attrition (Braxton, Hirschy, and McClendon, 2003). The idea, reminiscent of mid-term grade reporting, is that creating a systematic method of recording and communicating student behaviors that contribute to student attrition can aid student retention efforts. “Early alert systems” are one form of such efforts that have gained currency in campuses across the county (Hanover, 2007).
Early alerts systems take many forms. Some systems focus on performance in class and are similar to mid-term grades (Eimers, 2000; Geltner 2000). Others focus on class attendance (Bowen, et al. 2005; Hudson, 2006; Richie & Hargrove, 2005). Some institutions widen the scope of their monitoring to include other types of academic behaviors including the use of course management systems (Fischman, 2007). Responses to alerts vary from one-to-one contact with students, usually at smaller institutions, to mass e-mail communication that includes information about academic and student support resources, more typical of the approach at larger institutions (Hanover, 2008).
A more comprehensive approach involves multiple indicators and an array of communication approaches to students. These systems often begin with a list of potential issues for which a student might be referred, ranging from academic issues like class attendance and performance on assignments to issues in the psycho-social realm like adjusting to college, uncertainty about choice of major, or mental health concerns (Hanover, 2007). Some institutions target certain identified at-risk student groups, such as students on academic probation (Miller, Hambrick, & Firmin, 2008). Many others use the early alert system for all students, including community colleges (Kelly & Anandam, 1979), small liberal arts institutions (Wasley, 2007), and large comprehensive universities (Tampke & Shirley, 2009). Comprehensive approaches to following up with students feature multiple contacts by faculty, staff, and
143
Proceedings of the 5th Annual National Symposium on Student Retention. Copyright 2009. C-IDEA, The University of Oklahoma.
student para-professionals using personal interaction, e-mail, cell phone, and text-messaging (Wasley, 2007; Tampke & Shirley, 2009). Web-enabled systems are common among institutions of all sizes (Hanover, 2007)
The remainder of the paper describes the development and initial use of a comprehensive early alert system at a large, public university in the Southwest. The university enrolls 35,000 students in 10 colleges and schools. Its residence hall system houses approximately 6,000. Entering classes at the university average around 3,600 new first-time-in-college students.
The next two sections include details of the system’s development and design. Results from the first term of the system’s use come next. The paper concludes with recommendations for research and practice.
Developing an Early Alert System
The goal of the Early Alert Referral System (EARS) was to increase student success and persistence, two strategic goals for the campus. Under the executive sponsorship of the chief academic officer, EARS began as one component of multi-faceted approach to improving institutional performance.
Consistent with the retention literature, EARS was designed to facilitate early identification and intervention of academic issues that could lead to a student’s departure from the university. The guiding principle was that if there was a way to facilitate communication about an issue before it reached a point beyond which intervention could be helpful, student persistence and success could be improved.
Given that the system was to be a retention tool, obvious stakeholders emerged. Faculty, academic advisors, student services offices, those responsible for identified special populations (e.g. developmental education, federally funded student support programs like TRIO, athletics), and enrollment management professionals had input in the system’s conceptual development. This collaboration among several university areas produced a system with substantial investment across the campus.
Among the most important areas of early agreement among the stakeholders were how alerts would be initiated, what student issues would evoke an alert, and the approach to intervention. Since the goal of the system was to increase student success and retention, stakeholders agreed that the system should be initially available to faculty. Faculty stakeholders indicated that they often were not aware of the resources available to aid students and that being able to refer a student to a central “clearinghouse” would be helpful. Some faulty allowed how they were reluctant to be immediately involved in some student concerns because they felt ill-prepared or unqualified to offer effective assistance. The early alert system would provide faculty a response option they would be confident using.
Options for capturing the student issue(s) evoking a referral included a pre-formulated list from which faculty could select, a free-form space on the form where faculty could write their own description of the issue, or a combination of the two. Stakeholders opted for the combination approach. Individual interviews with stakeholders then yielded the following list of indicators of student difficulty:
1. Poor class attendance 2. Poor performance on quizzes/exams 3. Poor performance on writing
assignments 4. Does not participate in class 5. Difficulty completing assignments 6. Difficulty with reading 7. Difficulty with math 8. Sudden decline in academic
performance
9. Concerns about their major 10. College adjustment issues 11. Financial problems 12. Physical health concerns 13. Mental health concerns 14. Alcohol or substance use concerns 15. Roommate difficulty 16. Disruptive behavior 17. Absent from work 18. Student needs veterans assistance
144
Proceedings of the 5th Annual National Symposium on Student Retention. Copyright 2009. C-IDEA, The University of Oklahoma.
In addition, stakeholders recommended an “Other concerns” category with an open-ended response option. Figure 1 (on the following page) is an example of a completed Early Alert
The intervention approach was the final area of development. The idea of a central clearinghouse was an attractive feature. One department would be designated to receive all of the alerts, assess their content, and respond to the student either by directly intervening with an offer of assistance or a referral to another academic or student services area. That department would establish points of contact with these other areas to facilitate prompt response to referrals. System Design
1. Faculty may readily refer a student with minimal information about the student 2. Referral information is stored in a secure environment on a scalable platform 3. Referral outcomes are recorded and summarized
A brief description of each system attribute follows.
Faculty access EARS through an icon on their on-line class roster. The roster is available though a secure faculty portal, accessible only to instructors of record after they enter their login and password. Passwords change every six months. Since virtually all faculty use the on-line class roster, EARS is scalable to the entire campus. Figure 1 – Completed Early Alert Form
145
Proceedings of the 5th Annual National Symposium on Student Retention. Copyright 2009. C-IDEA, The University of Oklahoma.
146
Proceedings of the 5th Annual National Symposium on Student Retention. Copyright 2009. C-IDEA, The University of Oklahoma.
Faculty referring a student click the EARS icon beside that student’s name on the class roster. The EARS form then appears on the screen with the student’s demographic information included. To complete the form, faculty indicate their relationship to the student, the reason(s) for the referral (faculty could choose up to three), whether they have spoken to the student about the issue or concern, and may elect to send an e-mail form of the alert to the student by clicking a check box.
EARS collects and stores referrals in a table that allows retrieval by form for an individual student or in a tabular format for multiple students. Daily EARS reports come to a central receiving point. E-mail notification happens daily and the e-mail includes an embedded link to that day’s report. Student service providers and academic advisors can also access referrals through the student information system; access to EARS is linked to individual staff’s logins. Since the student information system is the authoritative source of student data and the foundation of EARS, access to referral reporting is available to any appropriately trained faculty or staff member.
While following up on a referral may take many forms, one common element is contacting the student about the referral to offer appropriate resources. T he system design allows for ready recording of the outcomes to initial student contact. Each EARS form includes an area to record the substance of the response to the referral, as well as how the student was contacted and whether the student responded to the contact. Click boxes are included to indicate “Initial Contact,” “Personal Follow-up,” and “On-Going Intervention.”
Results from the First Term
After a brief outline of how the system was announced to the campus. This section includes two categories of EARS results, descriptive and outcomes. Descriptive results include the volume and characteristics of the referrals and the students referred; outcomes data include academic success and persistence measures for the students referred.
EARS became went live during the first week of the fall term. Communication about the system included an e-mail to faculty briefly describing the purpose of the system and instruction for its use. The EARS coordinator also briefed academic and student affairs support units as well as academic department chairs and the faculty senate. The in-house campus newsletter also included a story about the system accessible from the university homepage.
Descriptive Results By the end of its initial term of use, 87 faculty had referred 255 students from 108 course sections though EARS. Referred students were demographically similar to the general campus population in across many characteristics. Proportionally more continuing undergraduates and fewer graduate students were referred, not a surprising outcome given the purpose of the system. In addition, relatively more men and African-American students were referred. Table 1 summarizes selected demographics.
Characteristic Early Alert (n=255) Campus (N=34,698) Women 49.0 56.6
Asian/Pacific Islander 3.9 4.8 Native American 0.4 0.8
Non-resident 1.6 4.5 Other 0.8 1.2
First Time in College 10.6 10.9
147
Proceedings of the 5th Annual National Symposium on Student Retention. Copyright 2009. C-IDEA, The University of Oklahoma.
Continuing Undergraduate 70.5 58.0 New transfer 12.9 10.8
Graduate 5.2 20.2 Other 0.8 --
Table 1 – Frequencies of Selected Demographic Characteristics Referral frequency varied through the 15 weeks of the term. By the end of the first four weeks, 43% of the term’s referrals had been submitted, 46% came in during the second four weeks, and just over 10% were submitted after the eighth week. Most EARS users – 86% - described themselves as “professors.” Just over 12% were teaching assistants, while the remainder described themselves as “academic advisors.”
Reasons for referral varied as the table below indicates.
First reason for referral (n=255)
Frequency (%)
Poor class attendance 56.5 Poor performance on exam 27.1
Other reasons 10.2 Difficulty completing work 2.0
Does not participate in class 1.6 Mental health concerns 1.2
Concerns about major 0.8 Physical health concerns 0.4
Alcohol/substance use concerns 0.4 Table 2 – Frequencies of EARS Referral Reasons The majority of the first cited reasons for referral are related to course issues, a natural outcome of the course-based nature of access to the system. Many of the “Other” reasons cited for referral included combinations of reasons that could have been cited using the selections available on the form.
Outcomes Outcomes data for the referred students include the grades for the courses from which they were referred, their cumulative grade point average (CGPA), term grade point average (TGPA), and the percentage of students re-enrolling for the subsequent term. Just over 21% of the referred students passed their course with a C or better. About 43% failed the course, just over 21% dropped, while the remainder either took an incomplete or received a D. CGPA and TGPA for these students were 1.39 and 1.94 respectively (on a four-point scale), while slightly over 70% of the students persisted to the next term; there were no graduating seniors in the group.
Judging the efficacy of EARS based on student success and persistence outcomes presents challenges. The absence of a readily identifiable control group (students in the same courses who could have been referred) makes a between-groups comparison difficult. Analysis within the EARS group does, however, reveal some interesting associations.
There is evidence that the type of follow-up is associated with higher levels of student success and persistence within the EARS group. The analysis of EARS follow-up has two components, personal follow-up by faculty and personal follow-up by EARS staff. For purpose of the analysis, “personal” follow-up required some response on the part of the student. These responses could take one of several forms. Face-to-face conversations, phone calls, and text messaging were considered personal. E-mail responses were also considered; EARS staff e-mailed all referred students. If the student did not respond
148
Proceedings of the 5th Annual National Symposium on Student Retention. Copyright 2009. C-IDEA, The University of Oklahoma.
to the communication, no contact was assumed. The table below summarizes the frequency of the types of follow-up and the relationship to persistence. Personal contact Frequency (%) Persistence to next term (%) Faculty
Yes 11.7 83.3 No 88.3 68.4
EARS staff Yes 34.1 74.7 No 65.9 67.9
Table 3 – EARS Contacts by Type and Persistence Despite the apparent differences in persistence, a chi-square analysis did not confirm a statistically significant association between type of contact and persistence.
Student success results indicated a positive association with personal contact by both faculty and EARS staff and TGPA. The results of the one-way ANOVA appear in the table below. Personal contact Mean TGPA Significance Faculty
Yes (n=25) 2.15 No (n=213) 1.30 F=11.894, p<.001
EARS Staff Yes (n=60) 1.63 No (n=158) 1.26 F=5.436, p<.021
Table 4 – Personal Contact and TGPA The association between TGPA and personal contact with faculty is not surprising. Most instances of personal contact with faculty would require the student to be in attendance in the course, a behavior often associated with academic success. The association between personal contact and EARS staff while not as significant as faculty contact, suggests that EARS could have a positive impact on student success.
Recommendations for Research and Practice
Early alert systems are an established tool in the institutional retention toolkit. The EARS project suggests some difficulty, however, in assessing the effectiveness of an intervention like EARS while lacking a control group. Future research could attempt to ameliorate that shortcoming by creating matched pairs of students with similar demographic characteristics enrolled in sections of the same course. A quasi-experimental design could be deployed where one course section could be a treatment group where EARS was used and the other sections not included in the early alert system. The ethical consideration of excluding a group of students from the EARS intervention still remains.
The lack of significance in the association between personal contact and student persistence merits a more thorough look. As the system gains acceptance and use expands, a larger data set might enable a more disaggregated approach to examining how students are contacted. A qualitative approach to examining student reactions to contacts might be enlightening.
An additional area of research could explore the efficacy of types of follow-up for certain presenting issues. It could be that residence hall paraprofessionals could follow-up more readily and with greater effect with students for absence issues, while course performance issues are perhaps more efficaciously dealt with by faculty or staff in an academic support unit.
149
Proceedings of the 5th Annual National Symposium on Student Retention. Copyright 2009. C-IDEA, The University of Oklahoma.
In practice, EARS has some potential for wider use. Expanding the availability to all staff at the institution will require some design changes, but is currently under development. Taking greater advantage of EARS’ potential as a case management system for at-risk students is also under consideration. Finally, automating more aspects of the system is a current project as well, particularly acknowledgements to faculty submitting an alert, as well as offices receiving referrals.
150
Proceedings of the 5th Annual National Symposium on Student Retention. Copyright 2009. C-IDEA, The University of Oklahoma.
References Bowen, E., Price, T., Lloyd, S., & Thomas, S. (2005). Improving the quantity and quality of attendance data to enhance student retention. Journal of Further and Higher Education, Vol. 29 (4), 375-385. Braxton, J., Hirschy, A., & McClendon, S. (2003). Understanding and reducing college student departure. ASHE Higher Education Report, Vol. 30 (3), 140 pp. San Francisco: Jossey- Bass. Eimers, M. (2000). Assessing the impact of the early alert program. AIR 2000 Annual Forum Paper. (ERIC Document Reproduction Service No. ED446511) Retrieved February 28, 2009, from ERIC database. Fischman, J. (2007, October 29). Purdue uses data to identify and help struggling students. Chronicle of Higher Education Online, Retrieved May 15, 2009 from http://chronicle.com/daily/2007/10/530n.htm. Geltner, P., & Santa Monica Coll., CA. (2001). The characteristics of early alert students, Fall 2000. (ERIC Document Reproduction Service No. ED463013) Retrieved February 28, 2009, from ERIC database. Hudson, W. (2006). Can an early alert excessive absenteeism warning system be Effective in retaining freshman students? Journal of College Student Retention, Vol. 7(3-4), 217- 226. Kelly, J. & Anandam, K. (1979). Computer enhanced academic alert and advisement system. (ERIC Document Reproduction Service No. ED216722) Retrieved February 23, 2009, from ERIC database. Miller, B., Hambrick, D., & Firmin, S. (2008, February). Early warning systems: A comprehensive approach to ensuring student success and persistence. Pre-conference workshop presented at the 27th Annual Conference of the First Year Experience. Addison, TX. Richie, S. & Hargrove, D. (2005). An analysis of the effectiveness of telephone intervention in reducing absences and improving grades of college freshmen. Journal of College Student Retention, Vol. 6(4), 395-412. Tampke, D. & Shirley, M. (2009, March). Early alert! Letting students know you are concerned. Conference presentation at the Alliance ’09 Higher Education Users Group Conference, Anaheim, CA. The Hanover Research Council. (November 2007). Universal tracking and early warning systems for student retention. Washington, DC: Author. The Hanover Research Council. (May 2008). Intrusive advising and large class intervention strategies: A review of practices. Washington, DC: Author. Wasley, P. (2007, February 9). A secret support network. Chronicle of Higher Education, 53(23), A27.
151
Proceedings of the 5th Annual National Symposium on Student Retention. Copyright 2009. C-IDEA, The University of Oklahoma.
Improving Student Persistence and Success: A Data-Driven Outreach Approach
Abstract - In 2006 St. Francis College, a small liberal arts college, formed a Retention Working Group which was charged with analyzing enrollment policies, student persistence and graduation rates utilizing internal data as well as the motivational scales ascertained from the Noel-Levitz College Student Inventory. The findings and recommendations of the working group led to the modification of the College’s freshman acceptance criteria, expansion of the College’s Project Access program and implementation of four early-intervention initiatives for institutionally defined at-risk students. These efforts have resulted in reduced numbers of undeclared majors and steadily improving rate of persistence. Introduction
St. Francis College is a private, nonprofit, independent co-educational undergraduate college that endeavors to provide a liberal arts education to students from various backgrounds at an affordable price. Both the Franciscan heritage and the Catholic tradition establish a cornerstone of academic excellence, social responsibility, and mutual respect throughout the entire College community. The College has an average full-time enrollment of 2,000 students and over 60 Academic and Professional Programs.
Student persistence and success of undergraduates is a major concern for nearly all colleges, but it is particularly acute for small, tuition-driven institutions such as St. Francis College. Attrition drains resources, detracts from the reputation of the college, and retards the academic careers of students. In order to improve the likelihood that a student will continue his or her studies through graduation, colleges have developed many intervention programs and services to help students become academically and socially integrated into the college setting. However, despite the personal, social, and economic value of a college education, more students leave their college or university prior to degree completion (Tinto, 1993). With student retention widely viewed as a significant measure of a college’s effectiveness, developing quality programs to meet this end are essential to the success of the student body and the college.
In line with the St. Francis College mission, “…to welcome students from all walks of life by providing a superior liberal arts education at an affordable price,” the College’s programs and initiatives are focused on promoting student success and persistence; demonstrated in the College’s current 53%, 6- year graduation rate (2002 first-time, full-time freshman cohort). The College attributes its graduation rates to effective campus communication, strong advising, and a wide range of available student support services. Since 2002, St. Francis College’s first time, full-time, freshmen retention rate has remained relatively steady at 76% after two semesters (see Figure 1 Student Retention for Freshman Cohorts).
152
Proceedings of the 5th Annual National Symposium on Student Retention. Copyright 2009. C-IDEA, The University of Oklahoma.
Figure 1- Student Retention for Freshman Cohorts Entering Fall 1997-2007
The College attributes its first-year retention rate to successful programs such as SFC 1001 Freshman Seminar; a first-year experience course intended to help incoming freshmen adjust to the demands of college life, Project Access; a program designed to assist academically under-prepared students succeed in college courses, and extensive programs and support services that welcome first year students to St. Francis College life. Furthermore, as part of the College’s commitment to assessing performance, the Office of Institutional Research and Planning regularly reviews the College's graduation rates and student achievement trends with comparison peer institutions. Data are derived from the Integrated Postsecondary Education Data System (IPEDS), a postsecondary education national database and ACT, an independent, not-for-profit organization which is involved in a comprehensive study of college student retention practices.
Development of the Retention Working Group
A growing number of colleges and universities are including their Institutional Research departments in college wide retention teams in order to provide a data-driven foundation and validation for their strategic plan retention efforts. “Institutional research plays a major role in helping the university to understand the dynamics of its student enrollment flow. Linking this information to university planning involves interpreting and presenting the data in ways that make sense to the audience…thereby completing the link from model, to study, to planning, to action” (Schartman & Rhee, 2000).
While there are many underlying causes for attrition, St. Francis College has taken active steps in identifying potential reasons and developing programs and services to address these causes. The Retention Working Group was established and made responsible for coordinating campus retention strategies and developing improvement goals based on the College’s graduation and retention rates. The Group relies heavily on data produced and maintained by the Office of Institutional Research. Stated goals are incorporated into the College’s Strategic Plan in order to continue to improve efforts to recruit, enroll, and retain a qualified and diverse student population, determine levels of student program completion and promote degree attainment.
153
Proceedings of the 5th Annual National Symposium on Student Retention. Copyright 2009. C-IDEA, The University of Oklahoma.
The efforts of the Retention Working Group resulted in collaborative work between the Office of Institutional Research and Planning and other offices involved in enrollment and student services which has contributed to the quality of assessment analysis. This relationship allows administration and faculty to make informed decisions by examining and reporting on the College's performance and effectiveness. A primary goal of the College was to create a culture of evidence using a mission-focused and data-driven decision making module that incorporates assessment of the development, implementation, and outcomes of all initiatives in order to affect positive change.
In the fall of 2006, the Retention Working Group was charged with analyzing available enrollment data and developing recommendations and strategies for improving retention. To this end, the Group reviewed national literature on the topic, analyzed a variety of internal and external data related to retention and developed a list of recommendations and implementation strategies. The results influenced the modification of the freshman acceptance criteria and the development of four major early-intervention initiatives.
Modification of the freshman acceptance criteria
Many colleges and universities are using a predictive modeling approach by mining data such as SAT scores and other variables to predict which best correlate with student attrition (Rampell, 2008). The Retention Working Group’s analysis of the College’s current retention efforts and persistence data resulted in the implementation of several initiatives and programs for identifiable at-risk groups. According to Perez (1998), “a more functional definition of being at-risk explains the relations between the resources a student brings to the educational experience and the demands the educational program makes on the student.” Similarly, Roueche and Roueche (1994) characterize the student at risk as “one who possesses academic, social, and economic problems that challenge his or her success in college.” To this end, the Retention Working Group reviewed the College’s current definition of at-risk students and the current programs developed to increase student persistence and success.
It was found that students with no reported SAT scores or SAT scores below 800 had lower persistence rates if not exposed to the College’s Project Access program. Project Access was developed by the Academic Enhancement Center to offer academic support for incoming freshmen whose verbal SAT scores and placement test results indicate academic weakness. The program’s goal is to help students develop college-level basic skills and competencies in reading and writing.
Based on this data, admissions policies were changed to allow conditional acceptance of students with SAT scores below 800, high school averages below 80 and those with no reported SAT scores. Acceptance is contingent upon interviews and assessment by an admissions acceptance committee. Applicants that meet this criterion are accepted on a contingent basis with mandatory participation in the Project Access program.
The Project Access program requires that students attend a 3-week summer workshop and a zero-credit (SFC 0040) reading, writing, and study skills course in their first semester. The cost of books, course materials, and educational field trips is covered for all participants in the program. Since the transition between high school and college is a difficult one, the program begins with a summer workshop that provides students a bridge to college. The workshops expose students to the fundamentals of learning—how to study, how to think and read critically, and how to understand the expectations of being part of a college community. During the student’s first semester, regular tutoring sessions and mandatory one-on-one meetings with Project Access instructors are an integral component of the program to ensure student success. Project Access helps students adjust to their new environment and get a jump start on their career at St. Francis College.
154
Proceedings of the 5th Annual National Symposium on Student Retention. Copyright 2009. C-IDEA, The University of Oklahoma.
To accommodate the increase in enrollment in Project Access recommended by the Retention Working Group, the current program was expanded in the summer of 2007 to include two 3-week summer workshop sessions instead of the traditional single session offering. Furthermore, a supplemental Project Access SFC 0040 course is provided in the second semester for students needing additional skill-building after the fall semester. Project Access Enrollment With the new admissions initiatives and acceptance criteria in place, the enrollment in the Project Access program has significantly increased over the past few years. Since the program’s start in 2003, 540 academically at-risk freshmen have participated in the program. At present, there are 280 Project Access students enrolled at the College. For the past few recent freshman cohorts 90-110 new Access students have been enrolled each year. The average SAT combined score for Access students is approximately 769 and the average high school GPA is 77 as compared to the non-Access incoming freshman average combined SAT score of 968 and average high school GPA of 82 (see Figure 2 Project Access Enrollment 2003-2008).
Project Access Enrollment 2003-
2008
Figure 2- Project Access Enrollment 2003-2008
Project Access Student Academic Success As of the fall 2008 semester, the cumulative grade point average (GPA) of the 280 Project Access
students was 2.5, as compared to the 2.9 GPA of the 1,860 non-Access students enrolled at the College as of January 27, 2009 (see Figure 3 GPA Comparison: Access vs. Non-Access). Of special note, 148 (53%) of the 280 currently enrolled Project Access students have a GPA of 2.5 or above. A review of the Access and non-Project Access students enrolled for the fall 2008 semester shows that although the number of students in each group was not equal (280 Access – 1,860 non-Project Access) the representation by level and major was comparable (see Tables 1 and 2).
155
Proceedings of the 5th Annual National Symposium on Student Retention. Copyright 2009. C-IDEA, The University of Oklahoma.
Fall 2008 Average GPA Comparison: Access vs. Non-Access
Figure 3- Fall 2008 Average GPA Comparison Access vs. Non-Access
Fall 2008 Enrollment by Level: Access vs. Non-Access Access Non-Access
Freshman 43% 36% Sophomore 28% 26% Junior 17% 19% Senior 12% 19% 100% 100% *Transfer credits were not included when determining level Table 1- Fall 2008 Enrollment by Level: Access vs. Non-Access
Fall 2008 Enrollment by Major Field of Study Access vs. Non-Access
Major Access Non-
Access Major Access Non-
Access Accounting 4.7% 6.8% Liberal Arts 0.7% 1.0% Adolescent Education 1.1% 1.4% Mathematics 0.7% 1.0%
Biology 2.9% 4.5% Medical Technology 0.4% 0.0%
Biomedical Science 1.8% 1.0% Management 17.2% 13.9% Business Administration 0.4% 0.2% Nursing 0.0% 2.4% Chemistry 1.1% 0.9% Physical Education 2.9% 2.9% Childhood Education 5.0% 3.3% Philosophy 0.4% 0.1% Criminal Justice 3.9% 4.6% Physician Assistant 1.4% 2.0% Communication Arts 11.5% 9.7% Political Science 1.1% 1.7% Economics 1.4% 2.4% Professional Studies 0.4% 4.5% English 0.4% 2.4% Psychology 7.9% 7.9%
History 0.0% 2.0% Radiological Sciences 1.1% 1.9%
Health Promotion & Science 2.2% 1.5% Religious Studies 0.4% 0.3% Int'l Cultural Studies 0.4% 1.0% Sociology 1.8% 2.0% Information Technology 6.1% 3.0% Undecided 21.1% 14.0% Total 100.0% 100.0% Table 2- Fall 2008 Enrollment by Major Field of Study Access vs. Non-Access
156
Proceedings of the 5th Annual National Symposium on Student Retention. Copyright 2009. C-IDEA, The University of Oklahoma.
Project Access Freshman Retention Rate Traditionally, retention rates are recorded in 2 semester, 4 semester, and 6 semester intervals. The
average 2-semester freshman retention rate of Project Access students by cohort is 70%, as compared to the average non-Project Access freshmen retention of 75% (see Figure 4 Project Access vs. Non-Project Access Retention After 2 semesters) This 5% difference is small in light of the academic preparedness of the incoming Project Access student (average SAT combined 769; average HS GPA 77, as compared to the non-Access average SATC 968; average HS GPA 82), and the more difficult transition they encounter when compared to the non- Access college student.
Project Access vs. Non-Access Retention After 2 Semesters
Figure 4- Project Access vs. Non-Access Retention After 2 Semesters
The Retention Working Group noted that retention after 2 semesters for the 05/FA Project Access cohort dropped in comparison to the 04/FA and 06/FA cohorts. Specifically, the retention rate for Project Access students went from 70% for the 04/FA cohort to 63% for the 05/FA cohort and then back up to 72% for the 06/FA cohort. While the retention rate for non-Project Access students in these cohorts also showed a somewhat similar up and down trend, the 10% drop and subsequent 14% rise in retention is mostly attributable to the difference in average SAT scores of the 3 cohorts (see Table 3 below).
Average SAT Scores by Cohort Cohort Average SAT Scores 04/FA 768 05/FA 735 06/FA 752
Table 3- Average SAT scores by cohort
Of the 6 cohort years listed in Figure 2, the 05/FA Project Access cohort had the lowest average SAT scores. While there are other factors that may have contributed to the above-noted fluctuations in persistence, the average SAT scores of the 05/FA cohort is significantly below the 800 score admissions policy threshold established by the Retention Working Group.
157
Proceedings of the 5th Annual National Symposium on Student Retention. Copyright 2009. C-IDEA, The University of Oklahoma.
The Development of Early Intervention Initiatives
The Retention Working Group found that using data to identify students underprepared for the rigors of college life and developing early intervention programs to reach and assist these students can make a significant impact on student performance and success. At St. Francis College, the implementation of new initiatives including expanded utilization of the College Student Inventory (CSI), enhanced major and career programs, the creation of a midterm grade module and an on-line exit survey mechanism, have significantly aided in the College’s student academic performance and persistence.
Using the College Student Inventory
To assist counselors in supporting incoming freshmen, in 2003 the Office of Freshman Studies began administering the Noel-Levitz College Student Inventory (CSI), a motivation assessment that asks students to reflect on academic, personal and social experiences and perspectives. The information gathered from the CSI helps students reflect on how to maximize their college experience, assists academic advisors by identifying potential student concerns and provides them with specific intervention strategies to address problem areas. In addition, the CSI provides academic and student affairs with a summary report of the freshman cohort. The CSI Scales that provide the College with valuable information on the incoming students include: 1) Study Habits, 2) Intellectual Interests, 3) Verbal Confidence, 4) Math and Science Confidence, 5) Desire to Finish College, 6) Attitude Toward Educators, 7) Sociability, 8) Family Emotional Support, 9) Opinion Tolerance, 10) Career Closure, 11) Sense of Financial Security, and receptivity to the following: 12) Academic Assistance, 13) Personal Counseling 14) Social Enrichment, 15) Career Counseling, and 16) Financial Guidance. These 16 factors are then organized generally under three categories: Academic Motivation, General Coping Skills, and Receptivity to Support Services. The CSI also weighs the above scales to construct four compound scales, each designed to summarize any given student’s Academic Motivation: 1) Dropout Proneness, 2) Predicted Academic Difficulty, 3) Educational Stress, and 4) Receptivity to Institutional Help.
The CSI early-alert system allows St. Francis College freshmen to receive immediate intervention in a specific area of concern that may have gone previously unnoticed due to no visible warning signs. Furthermore, the CSI information provides an excellent platform for establishing a dialogue between student and advisor with the overarching goal of building upon student strengths and addressing potential barriers to success. The CSI reinforces the College’s mission to look at the whole student by introducing data from both an academic and personal perspective. Understanding how students perceive their academic and personal ability in the college setting allows advisors to assist students in their persistence and success. The College also receives the CSI Summary & Planning Report, which is a valuable resource tool for campus-wide planning. It provides averages of the students’ responses, based on national norms, allowing identification of students who are at risk for experiencing academic and/or personal difficulty during their tenure at the College. The information also provides an opportunity to view the incoming freshman classes’ attitudes and needs on a cohort level so that intervention is more successful when techniques in areas of need are identified and implemented.
The College has found the College Student Inventory (CSI) a reliable measurement tool to gather individual information that reflects each freshman’s transition to college, motivation, receptivity to assistance, and subsequent retention. A study conducted by Irvine Valley College, found the CSI to be a valuable counseling tool and good predictor of students at-risk for attrition. “We do feel that the CSI could be excellent as a counseling tool for identifying students with certain ‘at-risk’ indicators much earlier than the typical mid-semester early alert procedure” (Rudmann, 1992).
The Retention Working Group took further steps in utilizing this report. The 2003 College Student Inventory results were compared to persistence rates for the fall 2003 cohort in order to identify which of the scales and other variables on the CSI had a significant relationship with retention after 6
158
Proceedings of the 5th Annual National Symposium on Student Retention. Copyright 2009. C-IDEA, The University of Oklahoma.
semesters. After analyzing the 17 Noel-Levitz motivational scales, the group focused its efforts on the six variables that were found to be statistically significant vis-à-vis retention statistics after 6 semesters. Those predictors included: high dropout proneness, predicted academic difficulty, low sense of financial security, career indecision, and receptivity to both academic assistance and institutional help.
After 6 semesters, 214 of the original 370 freshman from the 2003 Noel-Levitz cohort were still registered at St. Francis College (156 did not register, were academically dismissed or transferred to another college). This translates into a retention rate of 58%. As previously noted, the overall retention rate for all 2003 freshman (regardless of Noel-Levitz participation) after 6 semesters is 55%. This 3 point difference can be attributed to the Noel-Levitz data not including applicants who, due to their late application to the College, could not complete the CSI which was found to negatively affect retention.
The Retention Working Group’s analysis also found the following variables to be statistically significant to persistence at the College:
1. Academic Difficulty and Receptivity to Institutional Assistance: The St. Francis College Retention Working Group found that there was an interaction between the results of the individual student’s College Student Inventory (CSI) and participation in the College’s Project Access program and retention.
The CSI contains 4 “compound scales” that summarize the student’s self-reported academic motivation. The “Predicted Academic Difficulty” scale provides an aptly named identifier of students who would benefit from intrusive academic assistance. The working group found, however, that students also categorized with high “Receptivity to Institutional Help” persisted to a greater extent in the Project Access program than students with “Predicted Academic Difficultly” but low receptivity to assistance. By using both the “Predicted Academic Difficulty” and “Receptivity to Institutional Help” CSI scales within the Project Access program, the College was able to focus intervention resources where they would be most effective resulting in a positive affect on retention.
a. In the self-reported category of academic difficulty, 146 (39%) of the 370 were classified as having high predicted academic difficulty and 121 (32%) were classified as receptive to institutional help (academic, social, career, and personal counseling). When academic difficulty and receptivity to institutional help were paired, participation in Project Access showed a significantly positive impact on retention. Students with predicted high academic difficulty, receptivity to institutional help and participation in Project Access had a retention rate of 64%, which is 6 points higher than the average of all students. Students with the same characteristics who did not participate in Project Access, or any other intervention program, had a retention rate of only 44% after 6 semesters, which is 20 points lower than those in Access and 14 points lower than the overall average. The analysis showed that Project Access, as defined as an intervention tool for students with predicted academic difficulty, had a positive effect on student retention.
2. Dropout Proneness: In the category of dropout proneness, 192 (52%) of the 370 were classified as having high dropout proneness. Of the 156 students who did not return, 105 (67%) had predicted high dropout proneness (51 dropped out or were dismissed; 54 transferred) making Noel-Levitz high dropout proneness a reliable indicator of student persistence. When dropout proneness is paired with a HS GPA of less than 80, the retention rate significantly drops. Of the 110 students that met the criteria of high dropout proneness and less than 80 HS GPA, only 50 were registered for the fall 2006 semester resulting in a retention rate of 45%, which is 12.6 points lower than the overall Noel-Levitz cohort 6 semester retention rate of 58%.
159
Proceedings of the 5th Annual National Symposium on Student Retention. Copyright 2009. C-IDEA, The University of Oklahoma.
3. Predicted Academic Difficulty and Receptivity to Academic Assistance: When analyzing the scales on receptivity as it relates to predicted academic difficulty, 146 (39%) of the 370 were classified as having high predicted academic difficulty and 89 (24%) of the 370 were classified as receptive to academic assistance. Students with high predicted academic difficulty combined with high receptivity to academic assistance showed a high retention rate (67%) after 6 semesters when participating in Project Access. The efficacy of Project Access was further supported when a HS GPA of less than 80 was coupled with the above mentioned Noel-Levitz predictors (70% retention rate after 6 semesters)
4. Low sense of financial security: In the category of financial security as related to college, 127 (34%) of the 370 were classified as low sense of financial security with regard to meeting the financial obligations of their college education. Students with predicted low sense of financial security drop out at a statistically significant rate. Specifically, 79 of the 127 students with low financial security did not return for the spring 2007 semester (62% drop out rate). Of the 79 that did not return, 27 (34%) were placed on student financial holds and are therefore unable to register for classes.
5. Career Indecision and Dropout Proneness: Career indecision as defined by Noel-Levitz encompasses students who might benefit from career counseling based upon their desire for counseling on specific career issues. Our analysis shows that a high score on career indecision alone is not correlated to retention; however, when coupled with high dropout proneness, students with a high score on career indecision coupled with dropout proneness have a retention rate of 43% which is 15 points lower than the retention rate of those who completed the CSI.
The results yielded several strong recommendations for using the Noel-Levitz CSI in the future. Due to the highly predictive value of the Noel-Levitz indicators on student motivation and persistence the College decided on an earlier administration of the Noel-Levitz CSI. The survey is now administered at the Student Placement/Parent Orientation held in the months of April and May, instead of during the Freshman Seminar course held in the first semester. The earlier administration allows counselors to receive reports prior to the start of the fall semester. For early intervention purposes, academic advisors meet with each student in the beginning weeks of the semester to discuss their CSI results. Counselors utilize the Noel-Levitz Retention Management system in the advisement process and in the Freshman Seminar (SFC 1001) lesson plans. During the one-on-one sessions, students and advisors discuss the results and students are asked to develop goals based on the results in self-reflection assignments required in their SFC 1001 course. Additionally, referrals to other campus services are conducted as part of the action plan the student receives. For example, a student displaying low sense of financial security would be referred to the Student Financial Services counselors to discuss alternative educational financing options. Follow-up sessions with their academic advisor are conducted throughout the semester to ensure students are progressing with their action plan. Since the Retention Working Group found the CSI receptivity scores to be highly correlated with persistence, St. Francis College academic advisors are trained to highlight student’s receptivity to assistance in the advisement session.
Moving forward, the Office of Freshman Studies will embark on a new initiative recommended by the Retention Working Group to further utilize the CSI data through the creation of the Freshman Success Team comprised of members from Academic Enhancement, Student Financial Services, Wellness Center, Career Development, and Student Activities. Using CSI data that captures students that have indicated both difficulty and receptivity to support in the areas of academic preparation, career counseling, social enhancement and financial aid assistance, the group will conduct targeted outreach to the specific populations in the second semester as part of the first year experience. This initiative is aimed at closing the loop made in the first semester when referrals are made by the academic advisors who then ensure that the student has made contact with the recommended department. To this end, the needs of the student can be addressed using an even more comprehensive approach.
160
Proceedings of the 5th Annual National Symposium on Student Retention. Copyright 2009. C-IDEA, The University of Oklahoma.
Undeclared Majors
Another finding from nationwide retention studies is the identified relationship between unclear career goals, poor academic performance, and attrition. Strong student commitment to educational and career goals is perhaps the strongest factor correlated with student persistence and degree completion (Wycoff, 1999). Research on retention indicates that prolonged indecision about an academic major is significantly correlated with student attrition (Astin, 1975). The implication of these findings is to introduce a proactive approach to assisting students in declaring a major area of study earlier in their academic career. In December 2006, the Retention Working Group found that 793 (71%) of the 1,110 students in their freshman or lower sophomore year had not yet declared a major area of study. Based upon this finding, the College decided to implement a stronger career focus within academic majors and departments.
The first step in this direction was the streamlining of the process for declaring a major by allowing faculty to identify advisees and conduct proactive outreach immediately. The new streamlined declaration of major process allowed students to easily declare a major with any advisor. The revised form includes an option for students to indicate a potential academic major interest if they do not wish to declare immediately. Students are able to submit the form without a faculty signature unless the major requires department chair approval. In January 2007, all students listed as undeclared majors (1,058) were sent the newly revised form asking them to either indicate their declared major or indicate an area of interest. During the SFC 1001 Freshman Seminar course, academic advisors discuss the major areas of study earlier in the semester and ask each student to complete a modified Declaration of Major form that allows them to indicate a major area of study or if still undecided, to indicate up to two areas of interest. Completed declaration forms are forwarded to the registrar for appropriate processing which immediately allows faculty to contact their advisees. Data on freshmen indicating interest areas are forwarded to the respective academic departments for follow-up and target outreach. The undecided student also receives one-on-one appointments with academic advisors in the Office of Freshman Studies to discuss major and career exploration. Enrollment in the SFC 2001: Managing Your Future career course is recommended for the student’s second year. This initiative has resulted in an overall decrease in the undeclared population from 1,058 in November 2006 to 317 as of March 5, 2009. Midterm GPA module
In November 2007, a Hanover Research Council publication titled “Universal Tracking and Early Warning Systems for Student Retention,” cited Utah State University’s intrusive advising program which targeted students with GPA’s below 2.3 as being at-risk. As part of the program, registration holds were placed until students met with their advisor and established “action plans.” St Francis College uses a midterm grade module as a tool to identify enrolled students who are struggling academically. Research conducted by the Retention Working Group found a strong relationship between poor midterm performance and poor final grade performance. Prior to this finding, midterm grades were accessed on an individual basis by academic advisors in the Advisement office and by department chairs. Although useful, access to the data was cumbersome and time-consuming. To alleviate this issue, and to create a more usable interface, the Retention Working Group, along with the College’s Information Technology team, imported the midterm grade average into a student-tracking database. This enabled the academic advisors to more easily identify at-risk students and contact them for early intervention. The accessible data led to the development of an intrusive advising system for academically at-risk students who were now easily flagged and contacted for intervention. Students are invited to participate in a study skills workshop series, “Removing Obstacles to Success,” where study improvement action plans are created. At the conclusion of each semester, final grades are reviewed and any student with a GPA below 2.0 is placed on an Academic Advisement registration hold and must see an advisor for intervention.
161
Proceedings of the 5th Annual National Symposium on Student Retention. Copyright 2009. C-IDEA, The University of Oklahoma.
Exit Survey
Another outgrowth of the Retention Working Group’s study found that the College lacked quantitative data regarding reasons for students departing the institution. With this recommendation in mind, the Office of Institutional Research and Planning, in collaboration with the Office of Freshman Studies, developed an exit survey for students withdrawing from the College. Integrated into the College’s on-line transcript request and web function, data from this survey is used to garner information as to why students are departing the institution and to which schools they are transferring to. This is done in an effort to inform and strengthen the College’s retention polices and guide the allocation of additional resources as necessary. The preliminary results illustrated in Figure 5 indicate that while “financial difficulties” are a major factor for departing St. Francis College, a surprising result has been data indicating that almost 30% of transferring students do so because they are relocating to another area. Moving forward, this data will be further analyzed through the use of telephone and email surveys to further understand the implications of this data.
Top 5 Reasons Students Transfer to Another School
Figure 5- Exit Survey Results – Top 5 Reasons Students Transfer to Another School
On-going and future initiatives
With the changing needs of each incoming cohort, it will be vital for the College to continue its efforts in creating a culture of assessment and excellence through the use of constant assessment mechanisms which analyze the effectiveness of the College’s enrollment and retention initiatives.
Currently, the Retention Working Group is conducting a systematic analysis on student characteristics using data obtained from an internal student database and the National Clearinghouse to identify potential reasons for departure from the College. The Group’s focus will be to ensure that retention interventions are systematically applied to all facets of a student’s experience and that efforts are coordinated campus-wide. Additionally, since attracting and admitting qualified and interested students aids in the success and retention of the student base, the Group is currently analyzing data on accepted
162
Proceedings of the 5th Annual National Symposium on Student Retention. Copyright 2009. C-IDEA, The University of Oklahoma.
students who did not enroll at St. Francis College. Based on the fall 2007 accepted pool, it was found that 40% of applicants who enrolled at other Colleges were found to be enrolled at schools that are part of New York City’s University system (CUNY). The Retention Working Group will continue to analyze this data for trends but suspects the strong CUNY enrollment is financially motivated.
The College took steps during the spring 2009 semester to further understand factors that may impact student persistence by implementing the Noel-Levitz Student Satisfaction Inventory. Survey data will be used to create a benchmark for student satisfaction. Student satisfaction is achieved by assessing student expectations and satisfaction with the primary goal of maintaining strengths and addressing concerns. The byproduct of this assessment is highlighting the institution’s performance gaps between strengths and weaknesses. While the College is pleased with its current graduation and retention rates, it will continue to focus its efforts on improving the quality of its programs and services by identifying best practices for increasing student retention and persistence rates. Conclusions
Over the last 3 years, the St. Francis College Retention Working Group has analyzed internally generated data together with data from national studies and publications on student retention. The findings of the group’s analysis have been integrated into the College’s strategic planning process with regards to admissions policies and student outreach and assistance programs. In some instances, the data has validated previously held perceptions regarding the definition of at-risk students and the course of intrusive action needed to target and assist students in navigating the often tenuous early years of college life. In other instances the data has elucidated previously unknown correlations of students’ characteristics and persistence that have reshaped current policies both in the long and short term.
Overall, the integration of data into the student persistence and success paradigm has proven to be an effective tool in the overall process necessary for determining, planning and achieving student success.
163
Proceedings of the 5th Annual National Symposium on Student Retention. Copyright 2009. C-IDEA, The University of Oklahoma.
References
Astin, A. W. (1975). Preventing students from dropping out. San Francisco: Jossey-Bass.
Hanover Research Council, (2008, December). Assessing the Impact of Enrollment Growth on Student Services. Retrieved on April 21, 2008. Pérez, L. (1998). Sorting, Supporting, Connecting, and Transforming: Intervention Strategies for Students at Risk. Community College Review, 26; 63. Rampell, C. (2008, May 30). Colleges Mine Data to predict Dropouts. The Chronicle of Higher Education, Volume 54, Issue 38, Page A1. Roueche, J. E., & Roueche, S. D. (1994). Responding to the challenge of the at-risk student. Community College Journal of Research and Practice, 18(1), 1-11.
Rudmann, J. (1992, August 27). An Evaluation of Several Early Alert Strategies for Helping First Semester Freshmen at the Community College and A Description of the Newly Developed Early Alert Retention System (EARS) Software. California Community College Fund for Instructional Improvement. CA: Irvine.
Schartman, L. & Rhee, B. (2000). Linking Student Retention Model with Institutional Planning: The Benefits and Limitations of a Student Matrix Model. Proceedings from the Annual Forum of the Association for Institutional Research. OH: Cincinnati.
Tinto, V. (1993). Leaving College: Rethinking the Causes and Cures of Student Attrition. Second Edition. University of Chicago Press, Chicago, IL.
Wyckoff, S. C. (1999). The academic advising process in higher education: history, research, and improvement. Recruitment & Retention in Higher Education, 13(1), pp. 1-3.
164
Proceedings of the 5th Annual National Symposium on Student Retention. Copyright 2009. C-IDEA, The University of Oklahoma.
It Takes a University: Designing and Implementing a System of Academic Probation and
Intervention in Support of Student Success and Retention
Abstract - This paper provides a model of academic probation and intervention at a large public research university. It tells the story of one university’s year-long journey through the process of implementing a system of academic probation in support of student success and retention. A system of academic probation and intervention was created at the University of North Carolina at Chapel Hill to increase undergraduate student retention by helping students identify obstacles to student success and offering a one semester opportunity to help students get back on track towards degree completion. This paper examines the research, development, implementation and preliminary assessment of these significant changes. Introduction This article tells the story of one university’s year-long journey through the process of implementing a system of academic probation and intervention in support of student success and retention. It describes current practices in retention and student success at a large, public university. In 2007, the University of North Carolina at Chapel Hill (UNC-CH) made two monumental changes to its academic policies to support student success and retention: creating a system of academic probation and raising standards for good academic standing. These changes were the result of recommendations from a university-wide study of the institution’s retention policies, services and procedures (Retention Study Group, 2004). The study was led by the Retention Study Group, a University-wide committee, and conducted by the Office of Institutional Research and Assessment.
The study focused on three major research questions: what factors impact retention and graduation for undergraduate students at UNC-CH?; how do institutional policies and services impact persistence and graduation?; and, what do these results suggest in terms of steps that might be taken to better support students in persisting and graduating from UNC-CH? The study’s methodology included the analysis of characteristics and enrollment patterns of two freshmen cohorts (n=6,841). Variables examined included academic preparation, engagement, demographic characteristics, socio-economic status and achievement at UNC-CH. Additionally, non-returning students were surveyed, academic appeal letters were analyzed and the academic eligibility policies and practices of peer institutions were examined.
Prior to the study, UNC-CH did not have a system of academic probation. Students were considered either eligible or ineligible to register for courses based their cumulative GPA. Ineligible students (students not meeting the required GPA) were not permitted to enroll in the fall or spring terms but could take courses during summer sessions. The University did not have an undergraduate academic dismissal policy prior to the study nor did it create one after the study. Admitted students had the opportunity to work towards an undergraduate degree as long as they meet the academic eligibility standards (see Table 1) to enroll in fall and spring terms. Under this system of academic eligibility, while a cumulative GPA of 2.000 was required for graduation, students were not required to earn a cumulative
165
Proceedings of the 5th Annual National Symposium on Student Retention. Copyright 2009. C-IDEA, The University of Oklahoma.
GPA of 2.000 until their senior year. There was also no systemized program of intervention for students failing to meet eligibility standards.
Academic Hours Passed Cumulative GPA
To Enter 2nd Semester 9 1.000 To Enter 3rd Semester 24 1.500 To Enter 5th Semester 51 1.750 To Enter 7th Semester 78 1.900 To Enter 9th Semetser 105 2.000 If, in a 3rd, 5th, or 7th semester, a student passes 9 academic hours AND earns a 1.000 term GPA for that semester alone, there are no additional requirements to enter the subsequent 4th, 6th, or 8th semester. If, in a 3rd, 5th, or 7th semester, a student fails to pass 9 academic hours OR fails to earn a 1.000 term GPA for that semester alone, the student must meet the following cumulative minimums in order to enter the subsequent 4th, 6th, or 8th semester:
Academic Hours Passed Cumulative GPA
To Enter 4th Semester 36 1.500 To Enter 6th Semester 63 1.750 To Enter 8th Semester 90 1.900 Table 1 Old academic eligibility standards: Students who entered UNC-Chapel Hill as degree seeking students before May 2007
The study found that after five years, 83.9 % of cohort students graduated, 5.7% transferred and
10.4% neither graduated nor transferred (Retention Study Group, 2004)). After controlling for all other variables, the predictors of not graduating or transferring within five years were low income, first generation college student, low GPA during the first year at UNC-CH, becoming ineligible at least once, enrolling part-time more than once, UNC-CH was not first choice and low engagement in campus social activities. The study’s major conclusion was that poor academic performance is the single strongest predictor of not graduating from UNC-CH (Retention Study Group, 2004). Students who never become ineligible graduated at a rate of 90% within five years, compared to less than 40% of those who became ineligible even one time. Even for students who do not become ineligible, low performance was strongly correlated with transferring to another institution or not graduating at all (Retention Study Group, 2004). While poor academic performance was the strongest predictor of not graduating, it is important to note that this is not the dominant reason for failure to persist. The study found that failure to persist is related to multiple interacting factors including academic problems such as struggles with chosen majors, personal problems such as depression, familial responsibilities, and being unaware of services available to help students successfully manage demands. In particular, many students reported feeling ashamed to seek help (Retention Study Group, 2004).
The Retention Study provided several recommendations to improve, broadly, the quality of the undergraduate experience and, specifically, to increase undergraduate retention and graduation rates. Two of these recommendations apply to the development of the system of academic probation and intervention discussed in this article. The first is the recommendation to revise the academic eligibility requirements. This recommendation was implemented by changing the cumulative GPA required for Good Academic Standing (see Table 2). This implementation raised standards with the belief that UNC-CH students
166
Proceedings of the 5th Annual National Symposium on Student Retention. Copyright 2009. C-IDEA, The University of Oklahoma.
would rise to the expectation. Under the new standards, all students must maintain a 2.000 cumulative GPA throughout their undergraduate career to be eligible to register for courses. Previously, students did not have to obtain a 2.000 cumulative GPA until their senior year- a time in which most students are engrossed in their major and their most challenging courses. The goal of raising the standard to the minimum required to graduate is to put students on the path towards graduation beginning in their first year at the University. The second relevant recommendation was to develop an early intervention for students who become ineligible (do not meet the new academic eligibility standards). This recommendation was implemented through the creation of the academic probation and intervention program. The story of this development and implementation follows. The goals of the implementation were to develop an intervention process for students who encounter academic difficulties while encouraging them to maintain their enrollment at UNC-CH and working towards regaining good academic standing. Another goal was to encourage students to take advantage of support services targeted at helping them meet their academic requirements and remove other obstacles to progress towards graduation.
Academic Hours Passed Cumulative GPA
To Enter 2nd Semester 9 2.000 To Enter 3rd Semester 24 2.000 To Enter 4th Semester 36 2.000 To Enter 5th Semester 51 2.000 To Enter 6th Semester 63 2.000 To Enter 7th Semester 78 2.000 To Enter 8th Semester 93 2.000 Special Permission of the Dean is required to enter a 9th Semester. Students who fall short of the standards for good academic standing, but have passed at least nine credit hours of graded coursework (excluding By-Exam or Placement credits) in the preceding semester and who were not already on probation, will be on academic probation for one semester with the objective of meeting those standards.
Table 2 New academic eligibility standards: Students who entered UNC-Chapel Hill as degree-seeking first-year students in summer 2007 or later Development of the System of Academic Probation and Intervention The Retention Study (2004) contained a literature review of select readings on undergraduate retention and persistence. To begin the process of developing the academic probation system, another literature review was conducted with specific attention not just to retention literature but also to current research focusing on methods of social and academic intervention as well as the philosophical underpinnings of effective intervention programs. Because the 2004 Retention Study identified multiple interacting factors as the cause for students to end up on academic probation, developmental psychology literature on Ecological Systems Theory was reviewed. In Ecological Systems Theory multiple interacting factors across settings are examined to explain human development (Bronfenbrenner, 1989). The ecological perspective presents individuals developing in relation to the ever-changing environments of their home, family, school, community and society (Berk, 2007). From this review it became clear that any system of intervention the University develops would have to be communicated both inside and outside of the classroom and would have to address students developing in relation to their community, family, home and the University.
167
Proceedings of the 5th Annual National Symposium on Student Retention. Copyright 2009. C-IDEA, The University of Oklahoma.
Research emphasizes the institutional responsibility for retention via wide-range programming (Kadar, 2001; Keels, 2004; Lehr, 2004; Salinitri, 2005; Thayer, 2000; Tinto, 2000; Walters, 2004; White, 2004). Institutional and student success are inseparable (Noel & Levitz, 1991). Additionally, students are most likely to persist at a university that holds high expectations and actively involves students in their learning (Tinto, 2002). The emergent theme of the literature is that it requires the efforts of the entire University community to successfully retain students (Elmers, 2001; Nut, 2007; Habely, 2004; Noel & Levitz, 1991; Pascarella & Terenzini, 1991; Wyckoff, 1998; Tinto, 1987; Tonto, 2006-2007; Wes, 1981). Encouraging student responsibility through academic advising and beyond bolsters all university retention initiatives. Furthermore, creating a culture of student responsibility enhances student learning. When students take responsibility for their learning they achieve at higher levels, are more motivated to learn and are more efficient in their learning (Hom & Murphy, 1983); they better understand their strengths and weaknesses as learners, enabling them to leverage their strengths in learning situations (Blakely & Spencer, 1990). Successful intervention programs for students struggling academically must address the student experience both inside and outside of the classroom. All interactions students have on campus are potential learning opportunities and can influence a student’s ability to successfully navigate the campus culture, to meet expectations and to stay and succeed at the university. The interactions a student has with all university members (peers, faculty, staff, and administrators) influence a student’s intent to remain at the university (Wyckoff, 1998). Over twenty years ago, in his book, Increasing Student Retention, Noel (1985) stated, “The caring attitude of college personnel is viewed as the most potent retention force on campus” (p. 17). The literature today still supports this notion. The quality of interaction students have with concerned individuals on campus directly affects retention (Habley, 2004). Finally, it is imperative for universities to offer academic, personal and social support services that are easily accessed by students (Tinto, 2004). By creating a caring culture in which college personnel encourage students to take responsibility for their academic actions, decisions and plans, as well as provide accessible support services, universities empower students to forge a path to graduation. After reviewing the literature, three guiding principles were identified for the development of the academic probation and intervention program. First, the program must be embracing. This principle encourages students to stay in the University community while they work to identify difficulties and identify strategies for resolution. Second, probation is an opportunity. It is not punitive. It is an opportunity for students to reflect on their academic experience, assess their current situation and then set a path, make a plan, to return to good academic standing. The third principle is student responsibility. Students are encouraged to give thoughtful consideration to their academic and personal goals leading them to take responsibility for their academic choices and decisions. Overall, it was determined that all interventions would take an ecological approach with a goal of creating interventions that support students in relation to the changing environments of home, family, school and community and acknowledge multiple interacting factors as the causes of academic probation. With the study recommendations in hand, a thorough literature review completed and guiding principles identified, additional University voices from academic and student affairs departments campus were solicited. This was done in the form of departmental visits, individual meetings and the formation of a committee called the Retention Working Group. To create a comprehensive University-wide initiative, students, faculty, staff and administration were consulted. It was determined that the program would be housed in the Office of Undergraduate Education in the College of Arts and Sciences. This office thus worked collaboratively with the Academic Advising Program, Academic Services (including the Learning Center, the Writing Center, Academic Support for Student-Athletes and the Academic Success Program for Students with LD/ADHD), Counseling and Wellness Services, Diversity and Multicultural Affairs, Disability Support Services, University Career Services, the Office of the Dean of Students, Housing and Residential Education, Greek Life, Scholarships and Student Aid, and Student Government. All of these departments were already providing excellent services to students. In creating the academic probation interventions it was imperative that we did not ‘recreate the wheel’ but, rather, coordinate and utilize existing systems already in place and working effectively on campus. Finally, a review of the systems of
168
Proceedings of the 5th Annual National Symposium on Student Retention. Copyright 2009. C-IDEA, The University of Oklahoma.
academic probation and intervention at UNC-CH’s peer institutions were reviewed and discussed with all stakeholders. Preparing the University Community for Change
Once the system of intervention was determined (discussed in the following section), multiple efforts were taken to prepare students, faculty, staff and administration. A multifaceted information campaign was started to inform students of the new eligibility standards and the action that should be taken if students find themselves in academic jeopardy or on academic probation. Because the new eligibility requirements were grandfathered in, the focus of the campaign during the initial year was on the first-year population. A webpage (www.studentsuccess.unc.edu) was created and the webpage was emailed to all first-year students. A postcard highlighting the new eligibility requirements and advertising the webpage was also created. These postcards were left in locations around campus that students frequently visit and were delivered by resident advisors to all first-year students living on campus (the vast majority of the first-year population at UNC-CH lives on campus). A representative from the Office of Undergraduate Education also met with all new resident advisors in a training course. The representative trained the resident advisors and their supervisors, community directors, on the new eligibility requirements as well as making appropriate referrals. An email with the new eligibility requirements as well as a description of the academic intervention process was sent to all parents of first-year students registered with the UNC-CH Parents listserv. Additionally, an email was sent to faculty teaching First-Year Seminars. Faculty members were asked to announce the eligibility standards as well all the resources designed to help students succeed. The University’s daily student-run newspaper was also used to inform students. An article appeared on the changes and an advertisement was placed in the “Surviving Exams” issue of the newspaper. A banner advertisement was also purchased on the student newspaper’s website. Faculty and staff were invited to an open house breakfast meeting to learn about the new standards as well as the system of intervention. Folders and promotional materials were provided to all attendees. A separate training meeting was scheduled for all full-time and part-time academic advisors. These advisors were provided with a binder containing more in-depth information, procedures and resources. The System of Intervention
The system of intervention to help students on academic probation has three components. The first is a four step intervention program required of all students on academic probation. If a student does not complete these steps, a hold is placed on the student’s account preventing the student from registering for the next semester. The second component is an optional program called Bounce Back. This program involves students meeting in a group setting on a weekly basis for the duration of the probationary semester. The third component involves working to intentionally change the campus culture to create a more inclusive environment where students are encouraged to take advantage of University resources and where help seeking behavior is normalized.
The 4 Step Intervention The system of intervention for students on academic probation consists of four required steps and one optional program called Bounce Back. One of the goals of the four step program is to provide a variety of activities in varying formats, both online and in-person, for students to reflect on their academic experiences and plan a course of action to return to good academic standing. This goal was necessary to attend to the students’ multiple learning styles as well to create an administratively manageable system. Students must reflect independently in a self-assessment, move through a self-paced online seminar, meet in-person with an academic advisor and sign a contract. Step 1. Self-Assessment
169
Proceedings of the 5th Annual National Symposium on Student Retention. Copyright 2009. C-IDEA, The University of Oklahoma.
All students on academic probation are directed to the Student Success Webpage (www.studentsuccess.unc.edu). Here students will find the online Self-Assessment. The Self-Assessment is a questionnaire designed to guide students to reflect on their academic and personal experiences as well as their performance at the University. The assessment asks students both academic and non-academic questions encouraging students to understand that students often suffer academically for non-academic reasons. The assessment is also designed to assess the resources a student has used in the past as well ones they may want to use in the future. Additionally, it identifies any sub-populations the student may belong to such as a Greek Life organization, a scholarship organization with support services or an academic program such as the Honors Program or the Summer Bridge program. These subpopulations are referred to as neighborhoods. With a first-year class nearing four-thousand students, the goal is to have students connect with at least one neighborhood or smaller group on campus. Once the student completes the Self-Assessment, it is automatically emailed to the Retention Coordinator in the Office of Undergraduate Education. Here the assessment is analyzed and shared with appropriate resources. For example, if a student indicates on the assessment that he or she is a Covenant Scholar, his or her assessment is emailed to the director of that program. If the student is an athlete, the assessment is emailed to the Director of Academic Support for Student-Athletes. If the student reveals on the assessment that alcohol or substance abuse was a factor contributing to his or her current academic status, the assessment is emailed to a health educator in Counseling and Wellness Services. Similarly, if the student indicates housing or roommate or involvement in fraternity or sorority life factored into the student’s academic status, the assessment is emailed to a contact in Housing and Residential Education or the Director of Greek Life. A copy of the assessment also is saved to a shared electronic file so that all academic advisors can access it (if there is any confidential information such as a learning disability, it is masked in this copy). Academic advisors then review the assessment with students when they come in for their probation appointment (Step 3). The assessment also screens for depression and mental health concerns. If the assessment contains responses that may reflect depression or mental health crisis, the student is personally contacted. Additionally, the assessment scans for indicators the student may be struggling with a learning disability or an attention disorder. If students respond positively to particular questions that may evidence a learning disability or an attention disorder, the assessment is shared with the Academic Success Program for Students with LD/ADHD. The assessment intentionally ends with a series of questions that should elicit positive responses. This is an opportunity to highlight student success and draw upon strengths. Each department is encouraged to follow up on the assessment by contacting the student. The goal of sharing the assessments is to work collaboratively across multiple departments, share information and break down institutional silos. The hope is that if students are contacted from multiple sources, they will find at least one person, office or support service with which they feel comfortable. It is important to note that students are not required to respond to all of the questions. If a student chooses not to respond to all of the questions but submits the assessment, the student will receive credit for having completed the assessment. Additionally, if the student reveals personal information such as a physical or learning disability, the information is masked when sharing the assessment to respect the student’s privacy. Step 2. Online Seminar The online format was chosen for the seminar for multiple reasons. One of the goals of the intervention was to utilize multiple learning styles and formats. The online seminar, in part, responded to this goal. It was also affordable to create and easy to maintain. The seminar is self-paced and interactive. Students are responsible for completing the seminar on their own and are able to access the seminar at anytime. Students are encouraged to complete the seminar in a quiet setting where they can concentrate and when they have ample time to devote to the multiple exercises and worksheets included in the seminar. The seminar addresses issues that could influence student performance including time management, procrastination, study skills, personal relationships, working while attending college and challenges for transfer students. To prevent students from feeling overwhelmed with information, particularly information that is not relevant to their individual situations,
170
Proceedings of the 5th Annual National Symposium on Student Retention. Copyright 2009. C-IDEA, The University of Oklahoma.
the seminar has several tracks that direct students based on their responses to questions about their individual experience. For example, the seminar asks the students if they work. If a student does work, the student is lead through a series of slides on working while attending college including the optimal number of hours to work and choosing a job that is conducive to being a college student. Following each section of the seminar, there is a multiple-choice assessment in which students are prompted to recall information they have just learned. Correct responses are positively acknowledged. When a student chooses an incorrect answer, feedback is provided in the form of an explanation as to why the answer is incorrect. The student is then prompted to try again. Answers are not recorded and the student’s performance is not graded. The assessment is provided so that student’s can monitor their own performance. Students verify that they have completed the seminar by signing the probation contract found at the end of the seminar. Step 3. Probation Contract The probation contract is designed for students to complete with their academic advisor. The contract was carefully written to avoid negative or punitive language. It has a positive tone and clearly outlines the requirements necessary for the student to return to good academic standing. The goals of the contract are to remind students that probation is an opportunity to return to good academic standing, to outline the requirements for good academic standing and to encourage students to take responsibility for their academic performance. Each student must write in their current cumulative GPA as well as the minimum cumulative GPA they need to earn. Going through the process of writing in this information themselves encourages students to take responsibility. There is a space on the contract for advisors to add comments and suggestions for improved performance as well as utilization of resources. Step 4. Academic Advising Students on academic probation are required to meet with an academic advisor at least two times during their probationary semester. During the advising appointment, the advisor discusses the Self-Assessment with the student as well as the terms of the probation contract. The advisor will also ask the student about the online seminar, go over worksheets the student may have completed and answer any questions the student may have about the information presented in the seminar. A hold is placed on the student’s account preventing registration for the following fall or spring semester until the student has the first meeting with the academic advisor. This strongly encourages students to meet with their academic advisor before registration time which generally begins mid-semester. At the first meeting the advisor and the student determine a timeframe in which they will meet again for the second required meeting. This meeting is often held towards the end of the semester. At this meeting, the advisor and the student may discuss an end of semester questionnaire which is emailed to students on academic probation during the last few weeks of the semester and encourages students to reflect on their progress throughout the semester. The Bounce Back Retention Program In addition to the required four step academic intervention program, The Bounce Back Retention Program is offered to all students on academic probation as an optional program. The Bounce Back Retention Program was developed at San Diego State University (Hanger, Schmitz-Sciborski & Weinberg, 2007) and is offered at UNC-Chapel Hill through the Office of Counseling and Wellness Services in cooperation with the Office of Undergraduate Education. Bounce Back is a semester long program where students on academic probation meet weekly in small groups of approximately ten to twelve students. The groups are facilitated by a mental health professional and peer coach. Bounce Back is unique in that it teaches academic related skills such as study skills, time management and learning styles, while also enhancing students’ resiliency by addressing personal as well as psychological issues.
Bounce Back classes are experiential. In each class, students are encouraged to self-reflect on obstacles and encouraged to address challenges in order to persist academically. The curriculum was designed to develop resiliency traits. These traits include persistence, motivation, optimism, confidence, emotion regulation, decisive risk taking, self-efficacy and altruism (Hanger et al., 2007). Bounce Back is
171
Proceedings of the 5th Annual National Symposium on Student Retention. Copyright 2009. C-IDEA, The University of Oklahoma.
grounded in positive psychology and resiliency theory (Hanger et al., 2007). Both theories offer a “strength-based” orientation. Rather than emphasizing limitations, pathology, or barriers, positive psychology and resiliency theory promote finding the strengths and accomplishments within individuals (Banyard & Cantor, 2004; Beasley, Thompson & Davidson, 2003; Fassig, 2004; Shields, 2001). Bounce Back, therefore, focuses on students’ successes, encourages an optimistic perspective, and highlights the persistence that students are already evidencing. Changing Campus Culture At the same time as the new eligibility requirements, academic probation and the system of intervention were introduced to the University community, efforts to create a campus culture enhancing student success were launched. Specifically, focus was placed on creating a culture which normalizes help seeking behavior, fosters relationships and encourages the utilization of peer leaders. These goals were discussed with faculty, staff and students in meetings as well as professional development and training sessions. In effort to normalize help seeking behavior, advisors, counselors and other individuals that work directly with students were called upon to carefully consider the language they use when working with students. For example, instead of saying to a student, “You should go to Counseling and Wellness Services,” advisors were encouraged to say, “Many students find it helpful to speak with a counselor in Counseling and Wellness Services. Have you ever considered this?” Phrasing the referral in this manner highlights the fact that many individuals in the community utilize this service and, should the person being addressed choose to utilize this service, that behavior would be normal. Faculty, staff, administration and student peer leaders were asked to communicate to students that, in general, students that seek help will be more successful.
As discussed earlier, one of the greatest factors affecting retention is a student’s belief that there is at least one concerned individual he or she can turn to on campus in a time of need (Noel, 1985). As part of the efforts to change campus culture, faculty, staff and peer leaders were asked to consider, “For how many students are you that concerned individual?” This question and additional discussions, encouraged faculty, staff and administration to reflect on their relationships with students and how they might strengthen these relationships as well as serve as that concerned individual to even more students. Additionally, the question, “What can everyone do to encourage student success?” was posed to the entire community. From the interactions a student has with professor to a secretary in health services to a director in housing to a senior provost, what can every faculty, staff and administrator do to promote student success? Trainings and meetings centered on this question conveyed that all members of the community should be able to make clear, specific referrals. All individuals that work with students should strive to know their referrals. For example, individuals that repeatedly make referrals to The Learning Center should go visit The Learning Center so he or she knows the name of some tutors in the Center, can clearly explain where the Center is located and, if necessary, walk a student over to the Center. Many of these conversations focused on the message of building bridges across the University environment.
The final component of the initiative, to change campus culture, sought to enhance the use of peer leaders including resident assistants, orientation leaders, student government representatives and peer mentors. The message communicated to peer leaders through a variety of forums including meetings, class visits and training sessions was that there are three essential ways peer leaders encourage student success. First, peer leaders should be informed of the resources and services available to students on campus. Second, peer leaders should make informed referrals. Just as faculty, staff and administrators were encouraged to get to know their referrals, peer leaders were encouraged to visit the places they make referrals to and to utilize campus resources themselves. Also, if a peer leader is in doubt, he or she should refer a student instead of trying to answer the student’s question him or herself. Third, all peer leaders should model student success. Taking advantage of university resources and modeling the behavior of successful students, normalizes help seeking behavior. Additionally peer leaders are essential to communicating to students that probation should be seen not as punitive but as an opportunity for change and growth.
172
Proceedings of the 5th Annual National Symposium on Student Retention. Copyright 2009. C-IDEA, The University of Oklahoma.
Preliminary Assessment During the first semester of academic probation and the system of intervention, out of 3893 first-year students there were 159 students on academic probation during their second semester at the University. Of the 159 students on academic probation, 100% completed the online Self-Assessment. It is believed that the “stop” placed on students’ accounts created this strong response rate. The “stop” prevents students from registering for the next fall or spring semester until the student has completed the Self-Assessment and met with an academic advisor. The Self-Assessment, similar to the Retention Study, found that students were on academic probation as a result of multiple interacting factors. Not one assessment reported just one factor for academic probation. All students reported a combination of multiple factors. The top ten multiple interacting factors, with one being the most frequently reported, contributing to academic probation were:
1. time management 2. study skills 3. procrastination 4. stress management 5. inability to concentrate 6. test taking skills 7. course selection 8. lack of motivation 9. family and personal relationships 10. depression.
Preliminary assessment of the system intervention for students on academic probation has yielded positive results especially for Bounce Back participants. On average, after one semester on academic probation, the students that completed the intervention program raised their cumulative GPA by .336. By the end of one term, Spring 2008, 54% of students on academic probation returned to good academic standing. By the end of the next term, Summer 2008, 75% of students on academic probation returned to good academic standing. Students that regularly participated in the Bounce Back Retention Program on average raised their cumulative GPA by .512 with 60% of students returning to good academic standing (see Figures 1 and 2). Regular participation is defined as attending between ten and thirteen of the thirteen total classes of Bounce Back offered in the semester. Percentage of Students on Probation Returning to Good Standing
0% 10% 20% 30% 40% 50% 60% 70% 80%
End of Term Spring
End of Term Summer
54% 75%
173
Proceedings of the 5th Annual National Symposium on Student Retention. Copyright 2009. C-IDEA, The University of Oklahoma.
Figure 1. Percentage of students on academic probation returning to good academic standing at the end of the probationary term (spring 2008) and the following term (summer 2008) Bounce Back: Percentage of Students on Probation Returning to Good Standing
All Probation
Bounce Back Regular Attenders
Figure 2. Percentage of Bounce Back participants and all students on academic probation returning to good academic standing at the end of the probationary term (spring 2008) Conclusion and Future Plans
In summary, the story of how a system of academic probation and intervention was developed
and implemented has been presented here to describe current practices in retention and student success at a large, public university. It will take several years to fully assess the impact of the changes in academic eligibility standards as well as the implementation of academic probation including Bounce Back and all of the intervention measures at UNC-CH. The new eligibility standards are still in the process of being grandfathered in to the undergraduate population. In the 2008-2009 academic year, the standards apply to just first-year and sophomore students. In a few years, it will be possible to compare retention and graduation rates from prior years to the rates since the implementation of these changes. In the meantime, key stakeholders have engaged in many discussions about how to assess the current data available. One idea discussed at length is to assess the probation interventions by creating a control group consisting of students from the 2006 cohort (one year before the new eligibility standards were implemented). It is possible to assess these students as if probation existed during their second semester. It could then be determined how many would have ended up on probation if the new standards existed and then how many would have come off probation by the end of the semester. These numbers could then be compared to how students performed once probation and the interventions actually were implemented. Through exhaustive discussions, it was decided that this would not be a worthwhile study for several reasons. The dominant reason was that the key motivating factor is missing from the 2006 cohort. Students were not on academic probation and, as long as students’ cumulative GPA was over a 1.000 and they passed nine credit hours, they were meeting expectations. There was no motivating factor to raise a cumulative GPA
174
Proceedings of the 5th Annual National Symposium on Student Retention. Copyright 2009. C-IDEA, The University of Oklahoma.
under a 2.000 to over a 2.000. It was thus decided that determining whether or not these students would have come off a probation that did not exist would not provide any insightful comparisons. Rather, stake holders are looking forward to assessing the interventions in the years to come by examining overall retention and graduation rates as well as a variety of other measures including a more in-depth study of the Self-Assessments over the course of multiple semesters and revisiting the 2004 Retention Study with plans to include more information on the performance of transfer students and first generation college students. Appendix A
The Self-Assessment, Online Student Success Seminar and Probation Contract are available to the public and can be accessed at www.studentsuccess.unc.edu. Appendix B Timeline of Institutional Changes
2003-2004 University-wide retention study conducted by Institutional Research 2004-2006 Faculty Council makes changes to academic policies based on study recommendations 2006-2007 Creation of position of Retention Coordinator based on study recommendation 2007-2008 Design and implementation of academic probation and intervention system 2007-2010 Grandfathering-in of probation program for all undergraduates
Acknowledgements
The History section of this article is based on the work of the Retention Study Group at UNC-Chapel Hill (Retention Study Group, 2004).
175
Proceedings of the 5th Annual National Symposium on Student Retention. Copyright 2009. C-IDEA, The University of Oklahoma.
References Banyard, V.L. & Cantor, E.N. (2004). Adjustment to college among trauma survivors: An
exploratory student of resilience. Journal of College Student Development, 45(2), 207-221. Blakey, E., & Spence, S. (1990). Developing metacognition. Syracuse, NY: ERIC Clearinghouse
on Information Resources. (ERIC Digest Reproduction Service No. ED 327 218.) Beasley, M., Thompson, T. & Davidson, J. (2003). Resilience in response to life stress: The
effects of coping style and cognitive hardiness. Personality and Individual Differences, 34, 77-95. Berk, L. E. (2007). Development through the lifespan (4th ed.). Boston: Allyn and Bacon. Bronfenbrenner, U. (1989). Ecological systems theory. Annals of Child Development, 6, 187-249. Elmers, M.T. (2001). The impact of student experiences on progress in college: An examination
of minority and nonminority difference. NASPA Journal, 33(3), 386-409. Fassig, E.I. (2004). Attachment and resilience as predictors of adjustment to college in the
college freshman. Dissertation Abstracts International: Section B: The Sciences of Engineering, 64(7-B), 3520.
Habley, W. R. (Ed.). (2004). The status of academic advising: Findings from the ACT sixth national survey (Monograph No. 10). Manhattan, KS: National Academic Advising Association.
Hanger, M., Schmitz-Sciborski, A. & Weinberg, M. (2007). The Bounce Back Retention Program: Facilitator and Coach Manual. San Diego: Montezuma Press.
Hom, H.L., Jr., & Murphy, M.D. (1983). Low achiever's performance: The positive impact of a self-directed goal. Personality and Social Psychology Bulletin, 11, 275-285.
Kadar, R.S. (2001). A counseling liason model of academic advising. Journal of College Counseling: Research, Theory and Practice. 4(2), 174-179. Keels, C. (2004). Keeping students afloat: Noel-Levitz awards recognize retention programs that
generate results. Black Issues in Higher Education, 21 (18), 32. Lehr, C.A. (2004). Increasing school completion: Learning from research-based practices that
work. Research to Practice Brief: Improving Secondary Education and Transition Services through Research. National Center on Secondary Education and Transition, University of Minnesota, 3(3). Retrieved October 30, 2008, from http://www.ncset.org/publications/viewdesc.asp?id=1646
Levitz, R., Noel, L. & Richter, B. (1999). Strategic moves for retention success. New Directions for Higher Education, 108, 31-49.
Noel. L, Levitz, R., & Saluri, D. (Eds) (1985). Increasing student retention. San Francisco: Jossey-Bass.
Noel, L. & Levitz, R. (2000). Tired of moving mountains? Getting retention results really is easy. Retrieved October 30, 2008, from www.noellevitz.com
Office of the Executive Vice Chancellor and Provost. (2003). Academic Plan. Chapel Hill, NC: The University of North Carolina at Chapel Hill.
Office of the Chancellor. (2003). Measures of Excellence. Chapel Hill, NC: The University of North Carolina at Chapel Hill.
Pascarella, E., & Terenzini, P. (1991). How college affects students: Findings and insights from twenty years of research. San Francisco, CA: Jossey-Bass.
Retention Study Group. (2004). Promoting success for Carolina’s undergraduates: Factors related to retention and graduation. Chapel Hill, NC: University of North Carolina at Chapel Hill, Enrollment Policy Advisory Committee.
Salinitri, G. (2005). The effects of formal mentoring on the retention rates for first-year, low achieving students. Canadian Journal of Education, 28(4), 853-873.
Shields, N. (2001). Stress, active coping and academic performance among persisting and non persisting college students. Journal of Applied Behavioral Research, 6(2), 65-81.
Thayer, P.B. (2000). Retention of student from first-generation and low-income backgrounds.
176
Proceedings of the 5th Annual National Symposium on Student Retention. Copyright 2009. C-IDEA, The University of Oklahoma.
Opportunity Outlook, (May), 2-8. Tinto, Vincent. (1987). Increasing student retention. San Francisco: Jossey Bass. Tinto, V. (2000). Linking learning and leaving: Exploring the role of the college classroom in
student departure. In J.M. Braxton, ed., Reworking the Student Departure Puzzle (pp. 81-94). Nashville, TN: Vanderbilt University Press.
Tinto, V. (2002). Taking students learning seriously. Maricopa Center for Learning and Instruction. Retrieved September 9, 2005, from http://www.mcli.dist.maricopa.edu/events/lcc02/presents/tinto.html
Tinto, V. (2004). Student Retention and Graduation: Facing the Truth, Living With the Consequences. The Pell Institute, p. 8. Retrieved January 6, 2005, from http://www.pellinstitute.org/tinto/TintoOccasionalPaperRetention.pdf
Tinto, V. (2006-2007). Research and practice of student retention: What’s next? Journal of College Student Retention: Research, Theory and Practice, 2 (4), 327-340.
Walters, E. (2004). Enhancing student learning and retention through the merger of the academic and student affairs unit: The Olivet Plan. Journal of College Student Retention: Research, Theory and Practice, 5(1), 23-36.
White, J. (2004). Sociolinguistic challenges to minority collegiate success: Entering the discourse community of the college. Journal of College Student Retention: Research, Theory and Practice, 6(4), 369.
Wyckoff, S. (1998). Retention theories in higher education: Implications for institutional practice. Recruitment and Retention in Higher Education, 12(2), 2-7.
177
Proceedings of the 5th Annual National Symposium on Student Retention. Copyright 2009. C-IDEA, The University of Oklahoma.
Retention of Developmental Students and the Complicated Desire for "Caring Teachers"
Abstract – Attrition rates in programs for developmental students are often extremely high because students experience challenges beyond academic skills in their pursuit of higher education. Programs must be attentive to the ways in which non-cognitive variables (environmental and socio-affective factors) influence students’ experiences to better retain students. This paper discusses a qualitative study conducted at a community college that investigated the importance of non-cognitive variables to a cohort of developmental writing students. Findings demonstrated that students associated increased engagement and a desire to remain in college with faculty members who cared about their lives, experiences, perspectives, and progress. However, the ways in which some students defined “caring” involved a desire for instructional practices that could actually hurt their educational success. These results indicate that faculty may need to change their definitions or help students redefine what it means to be a “caring teacher” for positive effects on retention to occur. Specific suggestions for positive teacher-student relationships, effective instructional methods, and future research are offered. Introduction
The successful education of underprepared college students has been characterized as “the most important educational problem in America today, more important than educational funding, affirmative action, financial aid, curriculum reform, and the rest” (Astin, 1998, cited in Holland, 1999, p. 5). In recent years, the problem of an underprepared student body has grown to alarming proportions across the United States, and colleges usually advise these students to enroll in developmental coursework prior to taking transfer-level courses. Despite increased research in response to this trend, attrition rates in developmental programs are often as high as 60% to 70%, and some studies report graduation rates as low as 2% (Campbell & Blakey, 1996; Clagett, 1996; Grimes & David, 1999; Hoyt, 1999).
Research indicates that these programs are often unsuccessful because developmental students experience challenges in areas other than academic skills (non-cognitive variables). While cognitive deficits have some effect on success, developmental student experiences with education are often complicated by non-cognitive variables. Cognitive tests only provide a limited assessment of the ability of a student to perform academically because they do not consider environmental or personal factors that could hinder or support that performance (Hill, 1999). Student demographics, behavior, and personality style in addition to affective, situational, and dispositional variables are more strongly related to course grades and retention (Bryant, 2001; Liff, 2003). In order for a developmental program to be attentive to student needs, it must consider student experiences with variables that are not directly related to basic skills. While some research in non-cognitive variables exists, there is a lack of understanding about the ways in which developmental students experience non-cognitive variables, and this complicates the ability of educators and administrators to determine what developmental students need or which program components might address those needs (Boylan, 1999; Colton, Connor, Shultz, & Easter, 1999; Schinoff, 1983).
This paper presents a study that provides more in-depth descriptions of the experiences of a cohort of developmental students with non-cognitive variables. I investigated the ways in which a cohort of developmental writing students at a community college described their experiences with seven non-cognitive variables and the importance that these variables had for them. I focused this study on three
178
Proceedings of the 5th Annual National Symposium on Student Retention. Copyright 2009. C-IDEA, The University of Oklahoma.
situational factors (environmental or circumstantial factors) and four socioaffective factors (internal, dispositional, attitudinal, psychosocial, or emotional factors). My research questions were as follows:
1. How do 20 beginning developmental writing students describe their understanding of three situational non-cognitive factors (finances, college surroundings, and study management) in their educational experiences?
2. How do 20 beginning developmental writing students describe their understanding of four socioaffective non-cognitive factors (views of self, views of education, motivation, and interpersonal relationships) in their educational experiences?
The goal of this study was to provide descriptions of the meaning and importance of these factors to developmental writing students at a particular site for a deeper understanding of their experiences. Analysis of student descriptions demonstrated patterns in many areas including reasons for not using support services, the relationship between role model relationships and self-direction, the need to differentiate from peers, and the desire for caring teachers. For the purpose of this paper, I focus on the ways in which students associated positive educational experiences with “caring teachers” and the possible influence of this pattern on their successful retention and education. Background
Research in developmental education emphasizes a wide variety of psychological, personal, personality, or environmental factors as most important to the educational experiences of developmental students. Some authors discuss the ability of developmental students to negotiate and manage their college environments, often describing difficulties in value clarification and in the management of academic affairs such as registration, financial aid, and course planning (Horn, 1997; Liff, 2003; McCabe, 2003; McCusker, 1999; Roueche & Roueche, 1993; Schinoff, 1983). Often the first in their families to attend college, developmental students may have “a minimal understanding of the demands the institution will make or the expectations that it has of its students” (Roueche & Roueche, 1999, p. 1). In addition to being students, many developmental students are also employees and caretakers of children or elderly relatives, and these obligations can severely deplete the amount of time available for them to focus on their school work. Issues with finances are also often described as part of a complex web as students attempt to balance financial obligations, employment, student status, and family responsibilities (McCabe, 2003; Roueche & Roueche, 1993). Because community colleges are commuter institutions, problems with the cost or efficiency of public transportation, stressful commutes, unreliable vehicles, cost of gas, or lack of campus parking can create additional access barriers for students who have limited time and resources (Bolge, 1994; Doucette & Hughes, 1990; McCusker, 1999). These variables are described as creating an entanglement of inconveniences, aggravations, and possible obstacles to educational success.
The developmental education literature describes various combinations of internal factors that also interact in complicated ways to influence developmental students’ experiences in higher education. Developmental students are most often described as rejecting help, experiencing anxiety, fearing failure, being passive learners, and lacking motivation and self-esteem, all of which may hinder their academic progress (Hirsch, 1994; Maxwell, 1997). For some students, negative previous experiences with education might have contributed to a lack of personal autonomy, negative views of learning, or distrust of teachers, and they may harbor negative emotional associations toward previous academic failures (Hirsch, 1994; Mealey, 1990). Many developmental students may also believe that grades reflect their worth and attach great significance to them, causing previous academic failures to have severe effects on their self-esteem. The interaction among factors related to self-esteem, previous school experience, and views of failure may cause developmental students to believe that their effort has no influence over their educational success and instead to blame external factors for their academic performance, a phenomenon that is often referred to as learned helplessness in the developmental education literature (Maxwell, 1997; Roeuche & Roueche, 1999).
Students may claim that the level of difficulty of the assignment, the amount of work, the instruction, luck, or some other external factor caused their success or failure. In a study of 233
179
Proceedings of the 5th Annual National Symposium on Student Retention. Copyright 2009. C-IDEA, The University of Oklahoma.
developmental students, for example, Smith & Price (1996) found that students tended to “blame external factors such as task difficulty, luck, amount of work assigned, and teaching quality as the reasons for their limited success in high school” while “very few talked about their own effort or lack of effort as contributing to their achievement” (p. 3). Similarly, based on their study of 500 community college students, Grimes & David (1999) report that developmental students may be more likely than college-ready students to “view luck, fate, or powerful individuals as controlling events in their lives and project blame on others” causing them to be “less likely to exert effort on tasks, but they are more likely to experience anger, depression, substance abuse, or physical symptoms” (p. 88). Negative attitudes about learning and negative views of themselves as learners can also interact in ways that prevent developmental students from being motivated to learn (Liff, 2003; Mealey, 1990). Research also indicates that non-cognitive factors related to motivation and views of self can be particularly important for developmental students who may lack emotional support from their peers or families.
Research has indicated that these non-cognitive variables can have important influences on student retention. Grimes & Antworth (1996) analyzed exit surveys that asked students to rate 48 items in personal, academic, institutional, financial, and employment categories as a major, minor, or noncontributing factor to their decision to leave college. Most often, students named relocation, employment, family, emotional or health problems as related to dropping out. In another study, Valeri-Gold, Callahan, Deming, & Mangram (1997) asked 125 developmental students to respond to prompts about academic, social, family, and personal issues through regular journal entries. Student responses indicated that they experienced difficulties integrating with peers, were embarrassed about their developmental course placement, and were fearful of failing classes, losing focus, dealing with stress, disappointing family members, being disliked, or being exposed as stupid. In a retention study of the same cohort of students, Errico et al. (2000) conducted phone interviews of 45 of the 79 students who had left the university four years later and found that 42 of these students had dropped out for situational and affective reasons rather than academic difficulty.
More research that examines factors related to student attitudes, beliefs, identity, self-perceptions, and motivation is needed in order to improve developmental education programs. While research in non-cognitive variables does exist, none of these studies provide in-depth descriptions of student experiences with these factors and the importance that these variables have for them. As a result, the ways in which developmental students experience non-cognitive influences is unclear. Researchers in the field emphasize the need for studies that listen more directly to students’ voices and perceptions of their own college experiences. As Higbee, Arendale, & Lundell (2005) report: “an educator may know quantitatively how a student is performing,” but “when a student arrives underprepared for college….learning more about the nature of this student’s experience…may produce further insights into improving performance” (p. 8). A better understanding of particular student characteristics, perspectives, and experiences is necessary in order to provide true educational opportunity to developmental students.
Methods
Based on recommendations in developmental education research, this study investigated the ways in which a cohort of developmental writing students at a community college described their experiences with non-cognitive variables. I began this study by reviewing the literature in needs assessment, program components, and evaluation of developmental college programs. My review indicated that researchers describe many non-cognitive variables related to a student’s surroundings or external environment and to a student’s emotions, interactions, and relationships as important to educational experiences. I grouped the most commonly mentioned non-cognitive variables into three situational non-cognitive variables (finances, college surroundings, and study management) and four socioaffective non-cognitive variables (views of self, views of education, motivation, and interpersonal relationships), and my study focused on these seven non-cognitive variables.
My research site was a community college that is part of the City University of New York system. I conducted 30-45 minute interviews with 4 faculty members who had knowledge of the history, policies, and programs at the site, and each interview was taped, transcribed, and coded. I also conducted
180
Proceedings of the 5th Annual National Symposium on Student Retention. Copyright 2009. C-IDEA, The University of Oklahoma.
observations of 6 different sections of this course during three day classes and three night classes. I used these observations to better understand the context of the learning experiences of English 01 students and to recruit participants for interviews. During observations, I took field notes that focused on classroom interactions, student participation and engagement, and the ways in which the class was conducted. I used the data from these faculty interviews and classroom observations to develop more questions for use during my student interviews and to provide a broader context for understanding and analyzing student interview data.
At the end of each observation, I also introduced my research project and asked students who were interested in being interviewed to provide contact information on a sign-up sheet. Of the 46 sign-up sheets that I received, I randomly selected several students from each section for a total of 20 student participants, and I conducted semi-structured interviews that lasted from 60 minutes to 2 hours with each of these students for the core data of my study. In these interviews, I asked open-ended questions about the ways in which participants experience non-cognitive variables. I wrote post-interview memos of impressions, observations, and emerging themes. Each interview was taped, transcribed, and coded to seek thematic connections through codes derived from the developmental education literature and through open coding. I grouped sections of the transcript into categories based on these codes and investigated any similarities and differences among students’ responses.
Findings
In order to explore the ways in which this cohort of developmental students described their experiences with non-cognitive variables, students responded to open-ended questions regarding their educational experiences in relation to these seven factors. While participants discussed experiences with all seven non-cognitive variables, they described socioaffective factors more often and in greater detail than situational factors. Situational Factors Students described experiences with all three of the situational factors of finances, college surroundings, and study management. However, study management was the factor that these students most often discussed as important to their experiences. Students rarely described college surroundings and had very little to report regarding their experiences with this factor. Finances
Descriptions of finances included any student mentions of money as it related to their educational experiences. I asked students questions about any ways in which their finances related to school, family, peers, and employment. Most often students described the desire for more financial security to be independent, to provide support for their families, to get better jobs and higher wages. College Surroundings
Descriptions of college surroundings included student mentions of the circumstances or conditions of the college environment. I asked students questions about their experiences with classroom conditions, the college campus, facilities, and transportation and parking. Students’ descriptions of the college were overwhelmingly positive, but most students had not tried campus services because they did not have time, did not want to remain on campus when not in class, or were unaware of available resources. Study Management
Descriptions of study management included student mentions of the ability to balance multiple responsibilities or restructure their environments in order to study. I asked students if there were any ways in which they believed their families, peers, and employment status related to their ability to study and complete school assignments. I also asked students questions about their experiences with academic affairs in terms of navigating campus buildings and offices and understanding college policies and
181
Proceedings of the 5th Annual National Symposium on Student Retention. Copyright 2009. C-IDEA, The University of Oklahoma.
procedures. Most often students described registering for classes, obtaining financial aid, and locating necessary offices as an extremely negative experience. They often lacked information about the developmental program or were confused about their placement score. Also, most students described their families as helping them study and their peers as hindering their studying. Many students described how they do not study either because it is too difficult for them, or they feel they do not need it. Socioaffective Factors
Participants discussed experiences with each of the socioaffective factors of views of self, views of education, motivation, and interpersonal relationships. Findings from these interviews indicated that experience with interpersonal relationships was the factor that these students most often discussed as important to them. Views of Self
Descriptions of self included any student mentions of their character, beliefs, and personalities. I asked students questions related to their self-awareness, self-worth, self-direction, and resilience. Participants discussed self-awareness in terms of their personality type, skill level, future job goals, and the type of employment that would most suit them. Several students described themselves as not needing improvement in basic skills or as not having actually failed the placement exam. Students often described feeling confident about their decision to attend college and felt happy with themselves because they got to college without the emotional support of anyone else. Other students explained that they had been afraid to attend college because they were concerned it would be too difficult for them to handle intellectually. They stated that they felt like failures when they could not complete academic tasks at the same level as others and often described themselves using the words “stupid,” “dumb,” or “not smart.” They were often fearful of failing their exams and described their performance on exams as unrelated to any action on their part. Many participants also stated that they experienced challenges in self-direction and described their high schools as not holding them accountable, so they were afraid of missing classes or not having adequate self-discipline in college. Many students described wanting their teachers to provide them with direction by providing the right answer, not leaving them behind, and telling them precisely what to do, step by step. Views of Education
Descriptions of education included any student mentions of their views of past, present, or future schooling in terms of peers, teachers, family, and course content. Participants often viewed family as a supporting them in their college education. Many students who described their peers as relating to their views of education discussed proving their peers wrong, attempting to be different from their peers, and choosing a different path for themselves. Several students described peers as a bad influence that distracted them and hindered their learning process. Nearly all of the participants in this sample discussed education related to teachers in terms of their desire for teachers to care about them. Teachers were often described as possessing the power to determine whether they enjoyed their educational experiences and passed or failed their courses. Students often wanted teachers who would coddle them and demonstrate that they deeply cared about students’ progress, and they gave positive descriptions of teachers who walked them through the process of learning. Often, teachers whom participants viewed as caring about them were also credited with consoling them about their placement in remediation. Students enjoyed classes in which teachers cared that the students were present and learning, and these teachers were described as more “into it.” They described not making an effort in classes where their teachers expected them to copy information and figure things out independently. Motivation
Descriptions of motivation included student mentions of their drive or incentive for attending school. I asked students questions related to their motivation in terms of family, peers, teachers, and self. Participants described being motivated by the desire to support their families, to serve as an example to
182
Proceedings of the 5th Annual National Symposium on Student Retention. Copyright 2009. C-IDEA, The University of Oklahoma.
younger family members, and to be the first in their families to attend college. Many of these students described returning to education after receiving their high school diplomas or after a period of absence because their families had convinced them. Motivational teachers were described as encouraging students to push themselves and as varying classroom activities. They discussed teachers who cared about them and varied classroom activities as motivating them. Several students described being self-motivated to attend college in order to better their lives and feel a sense of accomplishment. Nearly all of the students in this sample described their motivation to attend college in order to better themselves. Often, students described college education as a powerful tool for life transformation, and they associated being in college with becoming somebody, doing something, or going somewhere. Interpersonal Relationships
Descriptions of interpersonal relationships included any student mentions of relations between or among people related to their experiences with conflict resolution, understanding others, and communication with peers, family, and teachers. Most students who described positive interpersonal relationships felt supported by a role model who had altered their perspective and behavior. Several other students similarly described teachers and counselors who protected them when they were feeling lost and scared or whom they admired for having expelled violent students at their high schools. Most often, relationships with family and peers were described in negative terms. Participants described extremely unstable family environments and childhoods that included moving repeatedly among family members, switching high schools multiple times, disappearing parents, being placed in foster care, or being abused. While most descriptions of abuse were of incidents from childhood, several participants described abuse that had occurred the week of our interview, and some students also described witnessing the abuse of others as children. Students also commonly reported negative histories with their peers, describing them as not being in college, acting violently in class, and often cutting classes. Most participants stated that they currently did not having any quality friendships with peers in college and that they did not have the desire for these relationships. Students described positive relationships with teachers who had put pressure on them, made them do their work, knew them on a personal level, gave them advice, and asked them how they were doing in their classes. Participants gave negative descriptions of teachers who did not notice when they were not doing well, provide enough guidance, take the time to help them, or care if they were present in class. Discussion
One pattern that emerged from this study was that students associated positive educational experiences and increased engagement and participation with faculty members that they believed cared about them. Teachers who demonstrated that they cared about students’ lives, experiences, perspectives, and progress encouraged these students to increase their effort in class and their motivation to succeed. Students in this sample did not associate positive educational experiences with enjoyment of the subject matter, effective teaching methods, or personal love of learning. Their degree of their effort and enjoyment in their educational experiences was dependent on their belief that certain teachers cared about them as individual students. In addition, they did not describe the desire to develop personal reciprocal relationships with teachers; instead, they understood effective educators to be those teachers who had a personal relationship to them. Thus, these students had particular definitions of what it meant “to care,” and they reported that teachers who met that definition motivated them to work hard. Students viewed teachers who did not meet their definitions of “caring” as “uncaring,” and they reported that they made less of effort in class as a result of this determination.
Many students described teachers who cared about them as being first in the teacher-student relationship to make an effort, thereby motivating them to reciprocate that effort. Teachers show that they care by making the effort to get to know students’ work and providing personal suggestions about ways in which students can improve. According to these students, the initiation of effort in the classroom was the teacher’s responsibility. As Laura explained, when a teacher “showed that somebody does care…I tried to make an effort staying in class and not talkin…I did it because I felt I owed him, so because he was
183
Proceedings of the 5th Annual National Symposium on Student Retention. Copyright 2009. C-IDEA, The University of Oklahoma.
trying to help me, I was trying to help him.” Laura was not motivated to remain in the class and “help” the teacher through actively learning from him until she felt she “owed” that effort to him because he initiated the effort to help her. Similarly, Henry explained that two of his teachers “care” because they made the effort to tell him where he made mistakes and regularly checked his work. He stated that some of his teachers did not care because “they’re not showing more effort or nothing to do nothing.” He explained, “It’s like you show me effort, you show me care, okay, I’m going to do it…You showed that you read my work…you know the mistakes I can make…So I know……okay, she’s caring, alright, let me do the work.” Henry described the completion of his assignments and his engagement in the class as dependent on teachers making the effort first. If teachers showed that they cared about him, he would then care about the content of the course in return and then “took the work seriously.” When students felt that teachers did not make the first effort, they disengaged from the learning process in the classroom.
Students also described caring teachers as making an effort through having a personal relationship to them. Justin, for example, described his high school teachers as caring because they “gave me a lot of advice, of things to do…would try to help me out…looked at my transcript and everything…and on every test that I took…they were like…how did you do?” Justin believed that these teachers cared because they notified him of his progress and knew him by name: “They even remembered my name and everything, and that really made me feel good. It made me feel like I was part of that school.” He felt supported as an individual member of the learning environment because teachers knew his name which indicated to him that they cared about him. Similarly, Kenny described liking his experience at a small high school because “in the bigger high school…you feel like you’re worthless, like you come to class for no reason.” In contrast, at the smaller high school, teachers “always try to find out about you” and students have “somebody that’s going to be there to support you.” Students who believed that their teacher knew them as individuals described being more motivated to learn as a result of the personal relationship the teacher had to them. Teachers who called students by name got a chance to know them as individuals and were described as caring more about their progress. Several students in this cohort stated that they did not know their teachers’ names, yet in their descriptions of effective teachers, they explained their need for teachers to know their names to show that they cared about them.
Students also described caring teachers as knowing them well enough to check in with them and redirect them when they lose momentum in the class. Henry explained why he liked his teachers in high school: “I mean they took me as one of their kids, they didn’t want to see nobody messing up.” He completed high school because his counselor did not “give up” on him and explained, “Every day she was coming to my house, calling me, come to school, you got to do this, don’t be like that. I know you’re going through a lot of stuff, but don’t give up.” Many other students similarly described teachers who care as checking in when students are not doing well in class. Pam described teachers who did not push her to complete her work as not caring about her enough for her to experience success in the classroom. She explained that she was not focused in high school “because these schools in New York, they really don’t push you. You might find a few teachers or a maybe a few counselors that’s willing to help. The rest of them, they don’t really care…It’s like you’re not going nowhere.” For Pam, teachers who care push their students to succeed and know their students well enough to be aware of which students are doing what they “are supposed to do.” Without teachers whom she felt cared about her, she described being unable to pass her courses and move on. Students in this cohort often associated teachers who care with knowing their skills and improvements and following up with them when they missed class or failed exams. Students did not describe instances in which they asked teachers for help and were refused or disappointed in the response; rather, they expected teachers to diligently monitor their progress, independently know when help was needed, and proactively approach them to offer it. Observations and faculty interviews further supported the claim that when students believe that teachers care about them, they exert more effort in their classes. During classroom observations, several students who were engaged and participatory in class later described their teachers as caring in interviews, while several students who were confrontational and argumentative in class later described their teachers as not caring.
Although many students stated that “caring” teachers led to their increased effort in class, the ways in which some students defined caring teachers could actually be counterintuitive to educational
184
Proceedings of the 5th Annual National Symposium on Student Retention. Copyright 2009. C-IDEA, The University of Oklahoma.
success. Several students described caring teachers as providing them with specific direction regarding the exact changes that they needed to make to their writing in order to “fix” their work. Henry, for example, described interactions with “caring teachers” as following a step by step process of precise direction in which teachers provided him with a formulaic approach to check and correct his work quickly by telling him exactly what he was “doing wrong,” and how to “fix it.” However, providing this degree of direction could actually prevent the inquiry and discovery that is characteristic of the learning process. Similarly, Quincy explained that he stopped attending his class because his teacher would not allow him to turn in late homework when he could not afford to purchase the textbook in the first few weeks of class. He believed that if his teacher cared, she would demonstrate her understanding of his financial difficulties by revising her class policies regarding late work; however, according to his definition, a caring teacher would not hold him accountable for purchasing his textbook and meeting deadlines. Even if he makes more of an effort in her class if she meets this definition of caring, his increased effort will not likely lead to educational success if he does not have the textbook, fails to meet deadlines, and falls behind in class. Thus, the ways in which some students define “caring” could cause them to interpret a teacher’s methods as “uncaring” even if those methods are intended to assist students in successful learning.
In these ways, student definitions of “caring teachers” might differ from faculty definitions of what it means to care, and in some cases meeting students’ definitions might not be advisable or possible. Some participants defined “caring teachers” as providing a level of support and individual attention that faculty may not be willing or able to provide. Some faculty members, for example, might feel that activities such as diligently following each student’s progress, knowing exactly when students need help even when they do not ask for it, or calling them at home when they do not attend class or fall behind is beyond the scope of their jobs even if they care about their students. In addition, some participants described “caring teachers” as engaging in practices that faculty members might associate with educational failure and with being uncaring such as providing extremely specific direction or not holding students accountable. In fact, while some students described their teachers as “uncaring,” full-time faculty members at this site described choosing to teach English 01 (despite having the option to teach upper-level courses) because of how deeply they cared about the developmental students. One faculty member characterized developmental education as a “salvation” for students and the college’s “paramount responsibility,” describing these courses as “immensely rewarding” to teach. Yet, he noted, “They want to be told the answers which goes completely against what I consider education to be – the journey to find the answer, together exploring.” Similarly, while Quincy described his teacher as uncaring because she because she required that he purchase the textbook and meet specific deadlines, his teacher noted during our interview that her developmental students needed to be “coddled,” so she allowed them three weeks to purchase the book. While she may have made this concession because she cared about students’ financial difficulties, Quincy nonetheless interpreted the requirement as “uncaring.” Thus, in some cases, teacher and student definitions of “caring” might differ, but meeting students’ definitions of what it means to care might not help students succeed even if it leads to an increase of their effort.
Research in developmental education also indicates that caring faculty can assist students in addressing non-cognitive challenges. In an interview study of 19 students who had persisted for four years from an original cohort of 125 students, Valeri-Gold, Kearse, & Deming (2001) found that some students attributed their success to their teacher “who tirelessly worked to make sure they understood the material,” called them at home, and “really seemed to care about the students,” and 63% of the students had interacted with at least one faculty member (p. 31). Other studies have similarly indicated that the belief that faculty care about the students can have impacts on the retention, degree of effort, and success of developmental students. Phillips (2001) surveyed developmental students to test the correlation among subscales of the Institution Integration Scales to explore college persistence and withdrawal. Students who interacted more with faculty tended to have stronger goals and show more concern in their own development, indicating that if “students perceive that the faculty is concerned about them, then the students will be more concerned with their academic goals and their commitments to their programs of study” (p. 21). While this research emphasizes that students are more successful when they believe that
185
Proceedings of the 5th Annual National Symposium on Student Retention. Copyright 2009. C-IDEA, The University of Oklahoma.
faculty members care about them, these studies do not describe the ways in which students arrive at that belief. The results of my study indicate that more positive teacher-student interactions could allow for an increase of student effort, but that faculty may need to determine the ways in which their students define “caring.” In some cases, faculty members may need to change their own definitions or help students redefine what it means to be a “caring teacher” in order for positive effects on educational outcomes to occur. However, in my review of the literature, I was unable to find any studies that explore the ways in which students defined caring teachers or the extent to which meeting student definitions might facilitate or hinder the success of students.
Implications
These results indicate possible directions for future program designs that could be more successful with developmental or at-risk students. For students who need more meaningful teacher and peer interactions, researchers recommend including a learning community model in which students enroll in several courses together as a cohort, and instructors link these courses with common themes and collaborative learning activities. Advocates of the learning community model argue that this format allows the classroom to become a network of support that encourages attendance, engagement, participation, and successful learning of academic, critical thinking, and social skills (Boylan, 1999; Horn, 1997; Tinto, Russo, & Kadel, 1994). Results from this study indicate that students may initially experience difficulty being a member of a learning community due to their views of education. If they view teachers as responsible for dispensing information and providing direction, they may interpret a community of learners discovering together as uncaring and unhelpful in their pursuit of education. The design of an effective learning community might require that administrators and faculty understand the ways that their students view the educational process, and faculty may need to bridge any divide between their students’ views of an ideal educational experience and the format of the learning community model. The design of the learning community can include an orientation during which students are introduced to this model of education, the goals of learning communities, and the necessary conditions for the community to be successful. Instead of merely expecting students to adapt to this model without discussion, their possible resistance can be acknowledged, discussed, and addressed within this environment and throughout their experience in the learning community. Through these discussions, students who prefer directive teachers may become more open to a community approach.
Findings from this study also emphasize the importance of pedagogical approaches that allow for positive relationships within the classroom community. Teachers can establish credibility by developing personal, supportive relationships with students and by demonstrating knowledge of their ability to succeed. This type of support involves consistently addressing students by name and even participating in casual conversations with students, thereby making the teacher seem less threatening and more “caring.” Building this relationship with students can also be facilitated by using class time for collaborative learning activities as the teacher provides individualized attention and expresses positive comments about students’ efforts. Teachers can also demonstrate their caring about student success by creating consistent and attainable objectives that are meaningful to the students and by stating clearly what performance standards will meet those objectives. The ways in which faculty interact with students can also influence self-direction and challenges associated with learned helplessness or blaming external forces. When a situation arises in which students express an external locus of control, teachers can challenge student excuses for failure by asking them what they could have done differently for a more positive result (Roueche & Mink, 1982). Students need to be expected to succeed and reinforced for their efforts until they shift to an internal locus of control and realize that they have power over their own educational success.
The teacher can also be available to students outside of class during office hours and allow time for peer and teacher conferencing to build positive relationships. Teachers can regularly notify their students of their progress during teacher-student conferences and clearly state areas in which a student needs improvement. These conferences also encourage a personal connection between teacher and student so that the student is more likely to follow the teacher’s advice and exert effort in class. During
186
Proceedings of the 5th Annual National Symposium on Student Retention. Copyright 2009. C-IDEA, The University of Oklahoma.
teacher-student interactions, faculty members can also develop a better understanding of what the educational process means to students. They can ask students what they want and expect from their teachers and which instructional approaches they view as helpful and caring. When teachers define their role in different ways or believe in different methods, they can explain their views to help students understand it. Even if the teacher and student cannot reach an agreement or compromise, the understanding of each other’s perspective could positively influence student effort and successful learning. Through personal contact, frequent feedback, and regular teacher-student conferences, instructors could assist students in understanding the benefits of higher education, their roles and responsibilities in class, specific course requirements, and methods of achieving their academic and personal goals, allowing them to become self-directed, independent learners (Colton et al, 1999; Lipsky, 2000).
Course content can also assist students in feeling cared for in the academic environment and encourage self-direction in students’ approaches to education. Response journals in which students reflect on their learning and on methods of increasing success also provide valuable opportunities for teachers to strengthen individual relationships and encourage students to view themselves as active learners. The teacher can provide individual feedback to students to show that she cares about their experiences, abilities, needs, and progress and can gradually increase student responsibility as the teacher-student relationship develops. Course materials can also include examples of successful individuals who were motivated, responsible, and took the initiative to actively seek outside supports to assist in the achievement of their goals. Specific training in responsibility and self-direction with clearly defined purposes, in conjunction with the reinforcement, comfort, and convenience of learning support may facilitate student success and retention. Results of this study also indicate possible directions for future research focused on the influence and importance of non-cognitive variables in the experiences of developmental students. Currently, a follow-up study is being conducted to explore the educational outcomes of this cohort of students and the extent to which these variables influenced their success. Future research could conduct affective assessments of students through similar interviews and then track student progress in order to explore possible influences of these variables. In addition, future studies could investigate the ways in which students understand the responsibility of their teachers in relation to their self-direction and motivation to learn. Greater research in this area could allow educators and administrators to better understand students’ needs in order to design educational environments that increase student responsibility in their own learning. Also, a future study could investigate and compare the ways in which students and teachers define and understand what it means to be “caring” or the relationship among students’ definitions, their response when teachers meet their definitions, and their degree of academic success. Research in these areas could help teachers better understand their students, their own expectations, and situations in which a compromise is advisable. It could also help administrators better understand the expectations and needs of their faculty and their developmental students in order to design interventions that might address any divide. The results of this study clearly emphasize the need for individual colleges to accurately determine the ways in which their developmental students understand their experiences with non-cognitive factors in their pursuit of higher education in order to best serve them. References Bolge, R. D. (1994) Identifying and dealing with access barriers at Mercer County Community College.
West Windsor, NJ: Mercer County Community College, Academic Affairs. (ERIC Document Reproduction Service No. ED376876).
Boylan, H. (1999). Exploring alternatives to remediation. Journal of Developmental & Remedial Education, 22(3), 2-4, 6, 8.
Bryant, A. N. (2001). ERIC review: community college students: recent findings and trends. Community College Review, 29(3), 77-93
Campbell, J. W. & Blakey, L. S.(1996) Assessing the impact of early remediation in the persistence and
187
Proceedings of the 5th Annual National Symposium on Student Retention. Copyright 2009. C-IDEA, The University of Oklahoma.
performance of underprepared community college students. (AIR 1996 Annual Forum Paper). Michigan: AIR Forum. (ERIC Document Reproduction Service No. ED397749).
Clagett, C.A. (1996). Correlates of success in the community college: Using research to inform campus retention efforts. Journal of Applied Research in the Community College, 4(1) 49-68.
Colton, G. M., Connor, U. J., Jr., Shultz, E. L.,& Easter, L. M.(1999). Fighting attrition: One freshman year program that targets academic progress and retention for at-risk students. Journal of College Student Retention Research, Theory, and Practice, 1 (2), 147-62.
Doucette, D. & Hughes, B. (Eds). (1990). Assessing institutional effectiveness in community colleges. Laguna Hills, CA: League for Innovation in the Community College.
Errico, M., Valeri-Gold, M., Deming, M. P., Kears, W., & Callahan, C. (2000). Interviewing as an assessment tool to examine developmental learners’ reasons for leaving college. Research and Teaching in Developmental Education, 17 (1), 49-61.
Grimes, S.K. & Antworth, T. (1996). Community college withdrawal decisions: Student characteristics and subsequent reenrollment patterns. Community College Journal of Research and Practice, 20(4), 345-361.
Grimes, S. K. & David, K. C. (1999). Underprepared community college students: Implications of attitudinal and experiential differences. Community College Review, 27(2), p. 73-92.
Higbee, J.L., Arendale, D.R., & Lundell, D.B. (2005). Using theory and research to improve access and retention in developmental education. New Directions for Community Colleges: Responding to the Challenges of Developmental Education, 129, 5-15.
Hill, A.B. (1999). Personality characteristics associated with academic achievement among developmental college students. (Doctoral dissertation, The Fielding Institute, 1999). (ERIC Document Reproduction Services No. ED446484).
Hirsch, G. (1994). Helping students overcome the effects of difficult learning histories. Journal of Developmental Education, 18(2), 10-16.
Holland, T. S. (1999). Support through Challenge: An Initial Intervention Program for At-Risk College Freshmen. The Learning Assistance Review, 4 (1), 5-19.
Horn, S. K. (1997). Ideas in practice. Journal of Developmental Education, 21(2), 26-28, 30, 32, 37. Hoyt, J (1999) Remedial Education and student attrition. Community College Review, 27(2) 51-72. Lipsky, S. (2000). Assessing the effectiveness of a course for developmental probationary freshmen.
Research and Teaching in Developmental Education, 17 (1), 21-30. Liff, S.B. (2003). Social and emotional intelligence: Applications for developmental education. Journal of
Developmental Education, 26(3), 28-34. Maxwell, M. (1997). The role of counseling in a comprehensive developmental program for post-
secondary students. Kensington, MD: MM Associates. (ERIC Document Reproduction Service No. ED415932)
McCabe, R.H. (2003). Yes we can! A community college guide for developing America’s underprepared. Phoenix, AZ: League for Innovation in the Community College and American Association of Community Colleges.
McCusker, M. (1999) Effective elements of developmental reading and writing programs. Community College Review, 27(2), 93-105.
Mealey, D. L.(1990). Understanding the motivation problems of at-risk college students. Journal of Reading, 33 (8), 598-601.
Phillips, L. (2001). Developmental reading students and the college experience. Research and Teaching in Developmental Education, 17 (2), 15-26.
Roueche, J.E. & Mink, O.G. (1982). Overcoming learned helplessness in community college students. Journal of Developmental Education, 5(3), 2-5, 20.
Roueche, J.E. & Roueche, S. (1993) Between a Rock and a Hard Place: The at-risk student in the open- door college. Washington, D.C.: The Community College Press.
Roueche, J.E. & Roueche, S.D. (1999). High stakes, high performance: Making remedial education work. Washington, D.C.: Community College Press.
188
Proceedings of the 5th Annual National Symposium on Student Retention. Copyright 2009. C-IDEA, The University of Oklahoma.
Schinoff, R.B. (1983). Advisement and counseling challenges facing community college educators: The Miami-Dade experience. In A. Thurston & W.A. Robbins (Eds.), New Directions for Community Colleges: Counseling A Crucial Function for the 1980s, 43, 61-72.
Smith, J.O. & Price, R.A. (1996). Attribution theory and developmental students as passive learners. Journal of Developmental Education, 19(3), 2-6.
Tinto, V., Russo, P. & Kadel, S. (1994) Constructing educational communities: Increasing retention in challenging circumstances. Community College Journal, 64, 26-30.
Valeri-Gold, M., Callahan, C.A., Deming, M.P., & Mangram, M.T. (1997). Reflections: Experience commentaries by urban developmental students. In P.L. Dwinell and J.L. Higbee (Eds.) Developmental Eduvation: Enhancing Student Retention. (p. 3-18). Carol Stream, IL: The National Association for Developmental Education.
Valeri-Gold, M., Kearse W., & Deming MP. (2001). Examining College developmental learners’ reasons for persisting in college: a longitudinal retention study. Research and Teaching in Developmental Education, 17(2), 27-40.
189
Proceedings of the 5th Annual National Symposium on Student Retention. Copyright 2009. C-IDEA, The University of Oklahoma.
The Sophomore Experience: Identifying Factors Related to Second-Year Attrition
Catherine L. Coghlan
Office of Institutional Research Texas Christian University
Abstract – Colleges and universities have paid little attention to the retention of college students after the first year; however, literature suggests that the sophomore experience at the university is just as crucial and plays a key role in the decision to persist past the second year. Many students experience the “sophomore slump” during this second year demonstrating distinctive symptoms and experiences that could be indicative of future departure. The literature points to certain vectors in which students indicate that they are missing something. This study explores whether commitment to the institution, a major and/or career choice, and perceived faculty and staff interactions contribute to the ability to differentiate between those who persist or depart during or beyond the second year. Survey data were collected from two student groups from the same entering cohort after completion of their second year, one group consisting of those who persisted and the other of those who voluntarily dropped out. This study seeks to understand the most significant factors and experiences which contribute to sophomore attrition or retention. Introduction
The vast majority of retention research over the past seventy years has focused on first-to-second year retention. Over the decades, several models and frameworks have been developed to explore and explain factors related to first-year attrition and retention. These models, such as Tinto’s (1975) model of student integration, Bean’s (1985) student attrition model, and Nora’s (2004) student engagement model are well known and have been widely applied to the study of first-year retention. A great deal is known about why students return or not after the first year. Evidence suggests, though, that even after students have returned for a second year of study at the institution of initial enrollment, they are still at substantial risk for attrition. In fact, among the 441 four-year colleges and universities who share retention data with the Center for Student Retention Data Exchange, the total percentage of students who depart sometime during or after the second year (17.7%) is almost equal to the percentage that leave after the first year (19.5%) (Hayes, Whalen, & Cannon, 2008). At the university described in this study, using a four year average, about 15% of the students left after the first year and about half as many (8%) did not return for a third year. These data indicate that, on average, almost one quarter of a cohort is gone by the start of the third year. Other retention analyses at this university have revealed that those students who return for the first semester of the third year are very likely to graduate from the university within six years (more than 90% do so). Thus, retention to the third year is an important milestone and one whose attainment almost guarantees eventual graduation from the university. Consequently, an in-depth exploration of factors which contribute to second year attrition is warranted and perhaps long overdue. To that end, this study will examine the experiences of second-year students and how those experiences influence the decision to persist at or depart from the institution after the second year.
Literature Review
Sophomores at a four-year university are not unlike the middle child in a family (Gahagan & Hunter, 2006). The plight of the sophomore as the forgotten, overlooked, and sometimes invisible middle child has long been acknowledged in university circles and written about for some time (Gahagan & Hunter, 2006; Graunke & Woolsey, 2005; Lemons & Richmond, 1987; Morgan & Davis, 1981;
190
Proceedings of the 5th Annual National Symposium on Student Retention. Copyright 2009. C-IDEA, The University of Oklahoma.
Richmond & Lemons, 1985; Schaller, 2005; Wilder, 1993). An entire monograph, Visible Solutions for Invisible Students: Helping Sophomores Succeed, published in 2000 by the University of South Carolina, National Resource Center for the First-Year Experience and Students in Transition, was devoted to examining the needs of sophomores and helping universities find better ways to meet those needs (Schreiner & Pattengale, 2000). Surprisingly, despite the wealth of literature devoted to describing the sophomore experience and how to enhance it, literature on how the sophomore experience is related to sophomore attrition is relatively sparse. Most of the studies to date addressing sophomore attrition have focused primarily on objective student characteristics which can be obtained from student record data such as high school and first-year college GPA, standardized test scores, financial aid status, percentage of credit hours attempted and completed, residence hall status, and various demographic characteristics. Only a small number of studies have examined sophomore attrition using perceptual data (Nora, Barlow, & Crisp, 2005).
In one of the few studies to examine sophomore persistence using perceptual variables, Wilder (1993, p. 23) found that variables which assessed various characteristics of the sophomore slump1 such as lack of commitment to school, absenteeism, educational goals, extracurricular activities, and perceptions of faculty-staff interactions significantly discriminated between students who maintained or improved their GPA after the first year and those students whose GPA declined after the first year. The relationship between these variables and academic success (which is closely associated with attrition) suggests that students who do not successfully navigate through this difficult period may be at greater risk of attrition during or following their second year than those students who don’t experience a slump or who are better able to cope with it.
In their study of factors contributing to sophomore academic success, Graunke and Woolsey (2005) examined both perceptual and demographic indicators. Among the perceptual variables, interactions with faculty were a significant positive predictor of GPA for both the fall and spring semesters while commitment to the major was a positive predictor for the spring GPA, but not the fall GPA. Graunke and Woolsey (2005) found no relationship between involvement in activities and sophomore academic success nor any relationship between institutional commitment and sophomore academic success. They speculate that involvement in activities is likely more related to retention than academic success and that the power of institutional commitment could be diminished for sophomores because they lack the institutional ties inherent in first-year experience programs and have yet to establish strong departmental ties. While academic success is not the same as retention, it is often a precursor to a retention or attrition decision (Tinto, 1993) and it is worth exploring whether variables related to sophomore academic success are also related to sophomore retention.
The Sophomore Year
The second year of college is distinctly different from the first year (Coburn & Treeger, 2003), so it stands to reason that the factors which contribute to sophomore attrition may be distinctly different from those which contribute to first year attrition. Sophomores, by virtue of their return, have achieved some measure of academic and social integration into the university community, yet a sizeable proportion of the group is still at risk for attrition after the second year. As Coburn and Treeger (2003) note, the sophomores who return to campus may initially bring with them a sense of confidence and belonging. Upon return, they will also find a new crop of wide-eyed, perhaps bewildered, freshmen who serve as a reminder that they are now experienced, seasoned college students who know the ropes and how to manage in the college environment. After all, they survived and perhaps even flourished during the first year, didn’t they...? However, it may not be long until the freedoms and successes of the first year give way to overwhelming choices and frustrations in the second year as students begin to feel pressure to make decisions about their future (Coburn & Treeger, 2003, p. 328).
1 “Sophomore slump” is a term “widely used to describe students who lack motivation, feel disconnected, and flounder academically” during the second year (Gahagan & Hunter, 2006, p. 18).
191
Proceedings of the 5th Annual National Symposium on Student Retention. Copyright 2009. C-IDEA, The University of Oklahoma.
The second year of college is also fraught with choices and change. Developmentally, for traditional age sophomores (those who are 19 or 20 during their second year of college), this time marks a transitional period from adolescence to adulthood. During this time period, Baxter Magolda (2001) suggests that individuals begin to move from a position of “absolute knowledge” where all knowledge is certain, choices are clear, and there is a right or a wrong approach to everything, to “transitional knowledge” where everything is no longer black or white, right or wrong, and subtle shades of gray begin to emerge from the shadows so that which was once certain is now uncertain. Uncertainty about whether their values still match their parents’ values, what to major in, how to mix and mingle old and new relationships, and even the value of their educational experience is commonplace among sophomores (Chickering & Reisser, 1993; Coburn & Treeger, 2003; Gahagan & Hunter, 2006; Graunke & Woolsey, 2005; Lemons & Richmond, 1987; Richmond & Lemons, 1985). Along with this uncertainty often comes an increased sense of dissatisfaction with the college experience. Historically, sophomores are thought to be the least satisfied of all college students (Feldman & Newcomb, 1969). The sense of uncertainty and dissatisfaction that some sophomores experience as they struggle with the many choices to be made during the second year is commonly referred to as the “sophomore slump.” How well a student copes with the sophomore slump could determine whether he or she returns for a third year.
The Sophomore Slump
“Sophomore slump” has been a common colloquialism for some time and is a broad term often used to describe the turmoil associated with the second year of college (Lemons & Richmond, 1987). One of the earliest references in the literature to the sophomore slump was by Freedman in a 1956 article “The Passage Through College.” Freedman did not coin the term, however, referring to it as “what has been called ‘sophomore slump’” and in fact noted that in the case of the students he was studying, the “sophomore slump” was rare (p.22).
In their 1987 article, Lemons and Richmond proposed a theoretical model of the sophomore slump based on Chickering’s model of student development. Chickering’s model, first presented in 1969, described seven vectors or areas of college student development: “(a) developing competence, (b) managing emotions, (c) developing autonomy, (d) establishing identity, (e) freeing interpersonal relationships, (f) developing purpose, and (g) developing integrity” (Lemons & Richmond, 1987, p. 15). Though slightly modified and refined in 1993, Chickering’s model has stood the test of time and contributed to understanding the transition from adolescence to adulthood (Chickering & Reisser, 1993). Lemons and Richmond (1987) suggest that the sophomore slump may be linked to problems with four of the seven vectors: developing competence, developing autonomy, establishing identity, and developing purpose. While all four vectors may be helpful in explaining the phenomenon of the sophomore slump, two vectors, developing autonomy and establishing identity may be particularly useful in understanding whether experiences commonly associated with the sophomore slump are related to attrition during or after the second year.
In the 1993 revision of Chickering’s model, the original vector, developing autonomy, has been slightly redefined and called “moving through autonomy toward interdependence” (Chickering & Reisser, 1993). In this vector, individuals are learning to function with relative self-sufficiency, take more responsibility for their own goals, and be less bound by others’ opinions. Successful navigation of this vector requires emotional and instrumental independence followed later by recognition and acceptance of interdependence. Emotional independence means that individuals no longer need constant reassurance, affection, or approval and ultimately reach a point where they may be willing to risk the loss of friends or status in order to pursue individual interests or take a stand on strong convictions. Instrumental independence has two major components: the ability to organize activities and to solve problems in a “self-directed” way (Chickering & Reisser, 1993, p. 47). Achieving autonomy may be one of the more challenging developmental milestones for college students today in the age of “helicopter parents”2 and
2 A “helicopter” or hovering parent is described as one who “repeatedly tries to intervene and manage his or her child’s life”
(White, 2005, p. B16).
192
Proceedings of the 5th Annual National Symposium on Student Retention. Copyright 2009. C-IDEA, The University of Oklahoma.
escalating tuition costs which are a constant concern for many college students and their families, especially for students attending private institutions where tuition costs are even higher (Lemons & Richmond, 1987).
Establishing an identity is the second of four vectors which Lemons and Richmond (1987) argue plays a critical role in the sophomore slump and one which may be linked to sophomore attrition. Chickering and Reisser (1993, p. 48) suggest that developing an identity is “like assembling a jigsaw puzzle” and in the college setting those puzzle pieces include things such as deciding upon a major, what organizations to join, integrating new ideas with old values, and finding the right balance between new and old relationships. Of the four components proposed by Lemons and Richmond (1987), establishing identity may be the most critical for sophomores. As a college student, one of the principal facets of the student identity is the major and the sophomore year is the time at which most universities require a student to declare a major. Tinto (1993, p. 176) suggests that “the inability to resolve educational and occupational goals” is one of three primary risk factors for attrition beyond the first year. Choosing a major is an early critical step toward resolving educational and occupational goals.
Declaring a major and the stress associated with that task is a prominent theme in the literature describing the sophomore slump (Freedman, 1956; Gahagan & Hunter, 2006; Graunke & Woolsey, 2005; Richmond & Lemons, 1985; Schaller, 2005). Regarding its importance in the student’s life, Coburn and Treeger (2003, p. 338) write
Choosing a major not only means choosing a course of study, it means selecting a niche on campus – assuming an identity.... When students meet each other, one of the first questions they ask is “What’s your major?” And the response elicits a set of assumptions, an initial code for sizing each other up.
Complicating the decision may be pressure from family or friends to choose a particular major, such as one that will continue a family tradition or one which will offer some semblance of stable employment or opportunity for the future (Coburn & Treeger, 2003; Schaller, 2005). As sophomores, students without a declared major may find themselves wandering in an academic wilderness. They no longer qualify for the wealth of support services offered to first-year students and have yet to find a home in an academic department (Coburn & Treeger, 2003; Gahagan & Hunter, 2006; Graunke and Woolsey, 2005; Richmond & Lemons, 1985). “Failure to become or remain incorporated in the intellectual and social life of the institution” is another key factor in attrition beyond the first year (Tinto, 1993, p. 176). Caught between the abundant support of first-year experience programs and the collegial support of an academic department which comes with the declaration of a major, sophomores who had made inroads toward academic and social integration into the university community during their first year, may become stalled in that effort during their second year. Summary
Sophomores have long been the academy’s forgotten middle child. And, despite a fair amount of literature about their differences, needs, and challenges, little is known about why a substantial number leave the university after their second year. The few studies examining sophomore attrition thus far have relied primarily on demographic characteristics and student record data to understand differences between students who persist following the second year and those who don’t. While these studies provide useful information about sophomore attrition, they do not adequately address many of the unique circumstances encountered by sophomores. Choosing a major and feeling good about the decision, balancing academic and social activities, redefining old relationships and forming new ones while negotiating the treacherous terrain between adolescence and adulthood are just some of the challenges facing students as they return for their second year of college. Students who have difficulty with one or more of these areas may find themselves caught in the proverbial “sophomore slump” which may set the stage for an early exit from the university.
193
Proceedings of the 5th Annual National Symposium on Student Retention. Copyright 2009. C-IDEA, The University of Oklahoma.
Research Questions
The present study examines perceptual factors associated with the “sophomore slump” to determine if they are related to third year persistence. The following areas will be explored: issues surrounding the choice of major, university life, academic interest, faculty-student relationships, second-year advising experiences, knowledge and use of campus resources, leadership roles, time management, and financial aid.
Methodology
Students who were first-time, full-time students at a mid-sized, private university in the southwest in the fall of 2006 were the population of interest for this study. Of this group, there were 108 students who were enrolled in the Spring 2008 semester who were not enrolled in the Spring 2009 semester and who were not studying abroad or had not been dismissed for academic reasons. There were 1,181 students from the 2006 entering cohort who had been continuously enrolled in the fall and spring semesters from Fall 2006 through Spring 2009. From this group of continuously enrolled students, a stratified random sample of students was drawn which matched the non-returners in the cohort on the characteristics of college, sex, and ethnicity.
Data were collected using an electronic survey which was distributed to all 108 non-returners and 108 returners via email and available online for approximately two weeks in February 2009. Prior to the survey delivery, non-returning students were sent a letter from the Chancellor advising them of the survey and asking them to provide an updated e-mail address via a self-addressed, stamped postcard if the e-mail address noted in the letter was no longer valid. Shortly before the survey was launched, both groups received an e-mail letter from the Chancellor advising them of the survey and encouraging their participation. Because the accuracy of the non-returner e-mail addresses was not guaranteed, one final attempt was made to contact non-returners via telephone to obtain a valid e-mail address or to complete the survey over the telephone if they did not complete the survey online. Thirty-one contacts were made via telephone. In most cases, an updated e-mail address was provided so that the survey could be resent. Only one non-returning student opted to complete the survey via telephone. Survey Instrument
The survey instrument contained seven scales described as follows: • Major Choice – Eight items which assessed how confident the student was in his or her choice of
major, whether the student felt pressure to choose a major, and whether the major choice reflected the preferences of the student. (Cronbach’s α = .78)
• University Life - Six items assessing how well the student felt they fit in at the university. (Cronbach’s α = .85)
• Academic Interest – Five items regarding coursework and academic challenge during the second year. (Cronbach’s α = .74)
• Advising – Five items addressing second-year advising experiences. (Cronbach’s α = .96) • Student Perceptions of Faculty – Four items assessing faculty expectations, concern, feedback,
and accessibility. (Cronbach’s α = .86) • Faculty-Student Interactions – Five items exploring the nature and frequency of faculty-student
interactions outside the classroom. (Cronbach’s α = .79) • Time Management –Ten items examining time management issues such as the ability to turn
assignments in on time and balance academic, extracurricular, family, and work commitments. (Cronbach’s α = .87)
With the exception of the Faculty-Student Interactions scale, the items noted above were measured
using a 5-point Likert type scale ranging from (1) Strongly Agree to (5) Strongly Disagree. Scale scores
194
Proceedings of the 5th Annual National Symposium on Student Retention. Copyright 2009. C-IDEA, The University of Oklahoma.
were calculated by summing the values for the scale items. Items worded negatively retained the original coding. Items worded positively were recoded (1) Strongly Disagree to (5) Strongly Agree prior to scale calculations so that a high scale score represented higher satisfaction, coping, or time management skills. The Faculty-Student Interactions scale items were measured on a scale ranging from (1) Never to (4) 3 or more times per semester. All seven scales had strong alpha reliability scores as noted above.
In addition, there were four items assessing knowledge of and satisfaction with campus resources, seven items asking students to rate from 1(no demands) to 5 (great demands) the extent to which various activities placed demands on their time, and one item asking students about their own advising preparation. Finally, the survey instrument included several items gauging the extent of extra-curricular activity, leadership activities, work commitments, housing circumstances during the second year, and financial aid offered throughout the student’s tenure at the university. In addition to these items, non-returning students only were asked to specify the top three factors which contributed to their decision not to return to the university following their sophomore year. A pilot test of the survey instrument including a cognitive interview was completed with two upper level social science research methods classes and the final instrument incorporated revisions recommended by the students to improve the clarity and validity of several survey items. At the close of the data collection period, the data were downloaded, combined with student demographic data available from official student records, and analyzed in SPSS using appropriate statistical techniques.
Findings
Of the 108 returners and 108 non-returners to whom the survey was sent, 38 returners and 33 non-returners responded for an overall response rate of 34%. A z-test for proportions was conducted to determine if there were significant differences between responders and non-responders between and within the groups (returners and non-returners). There was no significant difference between the returners and non-returners regarding response rate. Within both groups, females were more likely than males to respond to the survey. The difference was statistically significant for non-returners (p<.05), but not returners. There were no significant differences within the groups in response rate by ethnicity. Students with a GPA of 2.5 or greater were more likely to respond to the survey than students with a GPA of less than 2.5. This difference was also statistically significant for non-returners (p<.05), but not returners. The significant differences in response rate by gender and academic performance among the non-returners suggest that the results should be interpreted with caution and care should be taken not to generalize the responses of the non-returners who completed the survey to the entire group of non-returners.
Demographic Characteristics
Among those who responded to the survey, there were no significant differences between the returners and non-returners regarding sex, ethnicity, Frog Camp participation, Greek participation, residential status, or SAT equivalent. There were also no significant differences in cumulative university GPA between the groups; however, returners had a significantly higher high school GPA than did the non-returners. See Table 1 below.
195
Proceedings of the 5th Annual National Symposium on Student Retention. Copyright 2009. C-IDEA, The University of Oklahoma.
Table 1. Demographic Characteristics of Respondents Returners Non-returners n = 38 n = 33
Male 28.9% 24.2% Female 71.1% 75.8% White 78.9% 72.7% Minority 15.8% 18.2% Other/Unknown Ethnicity 5.3% 9.1% Frog Camp 73.7% 78.8% Greek 39.5% 39.4% Lived on campus 2nd year 84.2% 78.8% Cumulative University GPA 3.3 3.0 SAT Equivalent 1195 1177 High School GPA* 3.5 3.2
* (t(52.492), p<.01) Scales
There were no differences between the returners and non-returners on five of the seven scales: Major Choice, Academic Interest, Advising, Student Perceptions of Faculty, and Faculty-Student Interactions. Returners were more likely to be more satisfied with university life than were non-returners with a mean score on the University Life scale of 22.5, sd 2.9, compared to a mean score of 19.6, sd 4.5, for the non-returners (t(54.156)=-3.179, p<.01). Returners also had significantly more problems with time management than did non-returners. Returners had a mean score of 33.7, sd 5.4, while non-returners had a mean score of 37.8, sd 9.3, on the Time Management scale (t(48.399)=2.220, p<.05). Respondents were also asked to rate the demands put on their time on a scale of 1 to 5 (no demands to great demands) by extra-curricular activities, academic course work, academic internships, work, social activities, family responsibilities, and religious/worship activities. The only area where the two groups differed significantly regarding time demands was academic course work. Ninety-five percent of returning students reported that academic course work placed greater demands on their time compared to 76% of the non-returning students who reported that academic course work placed greater demands on their time (χ2(1)=3.806,p=.05). Returners also reported spending an average of 3 hours more per week on academic course work than did non-returners (18.4 hours, sd 7.1, compared to 15.4 hours, sd 9.0) although the difference was not statistically significant.3
Extra-Curricular Activities and Leadership Roles
Returners and non-returners were involved in about the same number of organizations (two) during their second year and spent almost exactly the same number of hours per week in extracurricular activities (10 hours per week for returners and 11 hours per week for non-returners). The nature of involvement appears to be different however as returners were almost twice as likely to report having a leadership role on campus as were the non-returners (62% compared to 36%) (χ2(1)=3.669, p=.055). For those involved in leadership roles, there was no significant difference in the number of hours per week spent in leadership roles between the two groups.
3 Four of the 22 returners responded “more than 30 hours/week” for this item. These four values were recoded to 31 so that
mean comparisons could be made. Consequently, the actual mean number of hours spent on academic course work by returners may be underestimated.
196
Proceedings of the 5th Annual National Symposium on Student Retention. Copyright 2009. C-IDEA, The University of Oklahoma.
Work Returners and non-returners were equally as likely to report having worked during their second year
and there was no difference in on/off campus employment between the two groups. However, non-returners worked almost twice as many hours per week (22 hours/week, sd 7.6) as did returners (12.5 hours/week, sd 5.9) (t(19)=3.081, p<.01). Financial Aid
There was no significant difference between returners and non-returners regarding offers of financial aid for the first year. For the second year, two non-returners who had been offered financial aid the first year were not offered financial aid the second year and that was enough to make the differences between the two groups for the second year border on significance (χ2(1)=3.801, p=.051). Eighty-two percent of returners received offers of financial aid for the second year compared to fifty-eight percent of non-returners. There were no differences in type of aid offered during the first two years (grants, loans, or scholarships). Returners were more than two and a half times as likely to have been offered financial aid for the third year as were non-returners (82% compared to 30%) (χ2(1)=16.988, p<.001). However, about one-third of the non-returners cancelled their financial aid applications and there were no financial aid data on all but one of the remaining non-returners suggesting that no offers were made because students had already made the decision not to return for a third year. The importance of financial aid regarding persistence to the third year has been well documented (Nora et al., 2005). Therefore, further exploration is needed to determine the time-order of events and the relative importance of the observed difference between retained and non-retained students regarding financial aid offers to the third year. Discussion
Academic and social integration into the university community are well established factors in first-to-second year persistence (Astin, 1993; Berger & Braxton, 1998; Billson & Terry, 1987; Braxton & Mundy, 2001-2002; Braxton, Vespar, & Hossler, 1995; Brower, 1992; Helland, Stallings, & Braxton, 2001-2002; Pascarella & Chapman, 1983; Pascarella & Terenzini, 1980; Pascarella & Terenzini, 1983; Tinto, 1975; Tinto, 1993). They are thought to be important factors in persistence beyond the first year as well (Tinto, 1993). Returners and non-returners appeared to be almost evenly matched in regard to academic integration as there were no differences between the two groups on the Academic Interest scale, the Student Perceptions of Faculty scale, the Faculty-Student Interaction scale, or the Advising scale. Social Integration
Returning students did seem to have a greater level of social integration into the university community than did non-returning students. Students who returned for a third year had higher scores on the University Life scale, were almost twice as likely to serve in a leadership role, and worked fewer hours per week than did non-returning students during their sophomore year. These findings support Tinto’s (1993) assertion that social integration into the university community remains an important key to persistence beyond the first year.
Further evidence that the non-returning students experienced less social integration into the university community than returners can be found in the open-ended responses they gave explaining their three top reasons for not returning. Several non-returning students indicated that they did not feel like they fit in. As one student put it, “I didn’t feel connected to the people at [the university].” Lack of diversity within the student population (the student body is more than 80% white) and what was described as an “overwhelming” Greek presence were also frequent reasons given for not returning. These comments shed light on issues contributing to the greater sense of dissatisfaction with university life reported by non-returners compared to returners. Feldman and Newcomb (1969) note that the source of dissatisfaction associated with the sophomore slump is often more likely to be related to institutional arrangements than fellow students. The level of diversity and proportion of Greek students at this
197
Proceedings of the 5th Annual National Symposium on Student Retention. Copyright 2009. C-IDEA, The University of Oklahoma.
university are institutional arrangements, social facts4 which are deeply rooted and slow to change. While there may be incremental changes in the institutional arrangements over time, there are not likely to be any radical changes in the fundamental institutional arrangements. Thus, it is incumbent upon the university to explore options to counteract marginalization issues that arise from such institutional arrangements. Structured programs and activities such as learning communities that bring students together on a regular basis and create a sense of familiarity and interdependence may be a step in that direction (Braxton & Mundy, 2001-2002; Chickering & Reisser, 1993; Gahagan & Hunter, 2006). Time Management
Time management issues were related to third year attrition, but not in the direction one might expect. The literature describes the second year as a time filled with stress and turmoil which might lead to the assumption that non-returners would have more issues with time management than returners. However, in this study, returners reported more problems with time management than did non-returners. Returners were more likely to be involved in leadership roles and to say that academic course work placed greater demands on their time than were non-returners. But non-returners were busy too, spending almost twice as much time per week working as did the returners. The time management difference between returners and non-returners may be a reflection of stronger integration into the university community by returners. A busy schedule dominated by university related activities as opposed to external activities may help cement the relationship between the student and the university. Care must be taken, however, to ensure that students have resources available to help them with time management issues so they do not become overwhelmed and drop out. Sophomore Slump
Some of the factors associated with the sophomore slump such as difficulty choosing a major, academic malaise, and faculty-student relationships did not appear to be related to retention or attrition decisions among the group of students studied here. Major choice was a factor in the departure decision of five non-returning students, but four of those five students noted that it had to do primarily with the chosen major not being offered at the university. The sophomore slump may have been a factor in the departure of the fifth student who mentioned major as a reason for not returning. This student reported leaving because of indecision about a major and needing time off from school to think about it.
Other factors associated with the sophomore slump may have had more of an influence on the decision process than the data above indicate. The development of instrumental autonomy is an important milestone in the transition from adolescence to adulthood marked by the ability to organize activities and to solve problems in a “self-directed” way as noted earlier (Chickering & Reisser, 1993, p. 47) and according to Lemons and Richmond (1987) may be a contributing factor to the sophomore slump. Concerns about the cost of college, and how to pay for it, may leave some students feeling guilty about the burden they are placing on their family and frustrate the development of instrumental autonomy (Lemons & Richmond, 1987, p. 16). In this study, cost of attendance was the most frequently cited reason for leaving among the students who gave reasons for not returning for a third year. The fact that non-returning students worked at paid jobs, on average, almost twice as many hours per week as returning students gives further credence to the idea that the struggle for individual autonomy may play a key role in the sophomore attrition process and is an area that warrants further study. Limitations of the Study
There are several limitations which affect the generalizability of this study. The low response rate suggests that the findings should be interpreted with caution and not generalized to all returning and non-returning students. In addition, among the non-returners, females and students with a GPA greater than 2.5 were more likely to respond to the survey than males and students with a GPA of less than 2.5. These 4 Social facts are “realities external to the individual” (Durkheim, 1993, p. 81).
198
Proceedings of the 5th Annual National Symposium on Student Retention. Copyright 2009. C-IDEA, The University of Oklahoma.
significant differences raise concerns that the non-returning respondents may not be a representative sample of the non-returning students. Finally, as a case study at one, private, mid-sized university in the southwest with a predominantly white, traditional age student body, the findings may not be generalizable to other universities. Other universities asking the same questions could get very different results. Despite these limitations, the findings do seem to confirm a well known tenet in the retention literature, namely that social integration, a key factor in first-year retention, remains an important factor in the retention process well beyond the first year. Future Research
This was a retrospective study conducted after the decision to return or not return for a third year had been made. Such studies rely on participants to accurately recall feelings and events of sometime past and may produce less reliable results than studies which ask participants about the here and now. Future sophomore attrition research would be enhanced by gathering information during the second year while students are still enrolled. Such data could then be used to develop predictive models of sophomore attrition/retention similar to those which have been developed in the study of first year attrition/retention. The results of this study hint at the possibility that at least some of the second year experiences characteristic of a “sophomore slump” may be associated with attrition or retention decisions. More studies utilizing perceptual data are needed, however, to confirm such a relationship. The ultimate goal for a student when he or she enters college is not retention to the second year or even the third year. The ultimate goal is graduation from college. If retention to the first semester of the third year represents the same milestone for student success at other universities as it does for this university, such studies could be useful in improving four and six-year graduation rates which are the ultimate measure of student success.
199
Proceedings of the 5th Annual National Symposium on Student Retention. Copyright 2009. C-IDEA, The University of Oklahoma.
References
Astin, A. W. (1993). What Matters in College?: Four Critical Years Revisited. San Francisco: Jossey-
Bass.
Baxter Magolda, M. B. (2001). Making Their Own Way. Sterling, VA: Stylus Publishing.
Bean, J. P. (1985). Interaction effects based on class level in an explanatory model of college dropout syndrome. American Educational Research Journal, 22, 35-64.
Berger, J. B., & Braxton, J. M. (1998). Revising Tinto's Interactionalist Theory of Student Departure Through Theory Elaboration: Examining the Role of Organizational Attributes in the Persistence Process. Research in Higher Education, 39(2), 103-119.
Billson, J. M., & Terry, M. B. (1987). A Student Retention Model for Higher Education. College and University, 62(4), 290-305.
Braxton, J. M., & Mundy, M. E. (2001-2002). Powerful Institutional Levers to Reduce College Student Departure. Journal of College Student Retention, 3(1), 91-118.
Braxton, J. M., Vespar, N., & Hossler, D. (1995). Expectations for College and Student Persistence. Research in Higher Education, 36(5), 595-612.
Brower, A. (1992). The "Second Half" of Student Integration: The Effects of Life Task Predominance on Student Persistence. The Journal of Higher Education, 63(4), 441-462.
Chickering, A. W., & Reisser, L. (1993). Education and Identity (2nd ed.). San Francisco: Jossey-Bass.
Coburn, K. L., & Treeger, M. L. (2003). Letting Go: A Parents' Guide to Understanding the College Years ( 4th ed.). New York: Quill.
Durkheim, E. (1993). Sociology and Social Facts. C. Lemert (Editor), Social Theory: The Multicultural and Classic Readings (pp. 79-82). Boulder, CO: Westview Press.
Feldman, K. A., & Newcomb, T. M. (1969). The Impact of Colleges on Their Students. San Francisco: Jossey-Bass.
Freedman, M. B. (1956). The Passage Through College. Journal of Social Issues, 12 (4), 13-28.
Gahagan, J., & Hunter, M. S. (2006). The Second-Year Experience: Turning Attention to the Academy's Middle Children. About Campus, 11(3), 17-22.
Graunke, S. S., & Woolsey, S. A. (2005). An Exploration of the Factors That Affect the Academic Success of College Sophomores. College Student Journal, 39(2), 367-376.
Hayes, R. Q., Whalen, S. K., & Cannon, B. (2008). 2007-2008 CSRDE Retention Report: The Retention and Graduation Rates of Entering Baccalaureate Degree-seeking Freshman Cohorts from Fall 2000 through Fall 2006 in 441 Colleges and Universities. Norman, OK: The University of Oklahoma, Center for Institutional Data Exchange and Analysis.
200
Proceedings of the 5th Annual National Symposium on Student Retention. Copyright 2009. C-IDEA, The University of Oklahoma.
Helland, P. A., Stallings, H. J., & Braxton, J. M. (2001-2002). The Fulfillment of Expectations for College and Student Departure Decisions. Journal of College Student Retention, 3(4), 381-396.
Lemons, L. J., & Richmond, D. R. (1987). A Developmental Perspective of Sophomore Slump. NASPA Journal, 24(3), 15-19.
Morgan, J. D., & Davis, D. A. (1981). Sophomore Students: They Are Special, Too. Journal of College Student Personnel, 22, 170-171.
Nora, A. (2004). The role of habitus and cultural capital in choosing a college, transitioning from high school to higher education, and persisting in college among minority and non-minority students. Journal of Hispanic Higher Education, 3(2), 180-208.
Nora, A., Barlow, E., & Crisp, G. (2005). Student Persistence and Degree Attainment Beyond the First Year in College. A. Seidman (Editor), College Student Retention: Formula for Success (pp. 129-153). Westport, CT: American Council on Education/Praeger Series on Higher Education.
Pascarella, E. T., & Chapman, D. W. (1983). A Multiinstitutional, Path Analytic Validation of Tinto's Model of College Withdrawal. American Educational Research Journal, 20(1), 87-102.
Pascarella, E. T., & Terenzini, P. T. (1980). Predicting Freshman Persistence and Voluntary Dropout Decisions from a Theoretical Model. The Journal of Higher Education, 51(1), 60-75.
Pascarella, E. T., & Terenzini, P. T. (1983). Predicting Voluntary Freshman Year Persistence/Withdrawal Behavior in a Residential University: A Path Analytic Validation of Tinto's Model. Journal of Educational Psychology, 75(2), 215-226.
Richmond, D. R., & Lemons, L. J. (1985). Sophomore Slump: An Individual Approach to Recognition and Response. Journal of College Student Personnel, 26, 176-177.
Schaller, M. A. (2005). Wandering and Wondering: Traversing the Uneven Terrain of the Second College Year. About Campus, 10(3), 17-24.
Schreiner, L. A., & Pattengale, J. (2000). Visible Solutions for Invisible Students: Helping Sophomores Succeed (Monograph no. 31). Columbia, SC: University of South Carolina, National Resource Center for the First-Year Experience and Students in Transition.
Tinto, V. (1975). Dropout from Higher Education: A Theoretical Synthesis of Recent Research. Review of Educational Research, 45(1), 89-125.
Tinto, V. (1993). Leaving College: Rethinking the Causes and Cures of Student Attrition (2nd ed.). Chicago: University of Chicago Press.
White, W. S. (2005). Students, Parents, Colleges: Drawing the Lines. The Chronicle Review, 52(17), B16. http://chronicle.com/weekly/v52/i17/17b01601.htm. Accessed May 22, 2009.
Wilder, J. S. (1993). The Sophomore Slump: A Complex Development Period That Contributes to Attrition. College Student Affairs Journal, 12( 2), 18-27.
201
Proceedings of the 5th Annual National Symposium on Student Retention. Copyright 2009. C-IDEA, The University of Oklahoma.
Undergraduate and Graduate Retention Two Concepts, One Outcome
Cathy Alexander Maria Kohnke Angela Naginey
Institutional Research Officer Associate Provost for Academic Services and Registrar
Abstract – California Lutheran University is intentionally taking a comprehensive approach to improving its graduation and retention rates as suggested by current retention literature. The resulting Retention Plan is one that addresses the current challenges and proposes solutions to address those challenges on a campus wide basis. The collaborative nature of this plan and goal includes all campus constituencies (faculty, staff and students) to identify, problem solve and implement solutions to the goal of retaining and graduating a well prepared and diverse student body. The first section of the paper looks at the completed undergraduate retention plan, the process followed and data used in the creation process. Assessing retention of graduate programs presents different challenges than with undergraduate retention. The second half of the paper focuses on the data gathering process for evaluating retention in graduate programs. Introduction
California Lutheran University’s (CLU) current strategic plan provided the opportunity to create an intentional, comprehensive approach to retention for both undergraduate and graduate programs. The challenge was for the retention efforts to be data-informed while studying the various programs whose retention and graduation concepts are different.
CLU is a comprehensive university with traditional undergraduate programs, an adult evening undergraduate program, masters programs and a doctorate in education (Ed.D.). CLU’s adult evening program (ADEP) is intended for adult learners returning to school to complete a bachelor’s degree. The programs runs on four, 11-week accelerated semesters a year. The ADEP program provides personal attention utilizing professional advisors and small classes.
CLU’s master degree programs are offered on both traditional semesters and 11-week accelerated semesters. The programs offered include degrees in education, business, public administration, and information technology and computer science. In addition, various credential and certificate programs are offered. The students and their needs vary by program. Each program delivers the advising and services necessary for students in the programs.
The university also offers a doctorate of education that has two emphases. Students may seek to complete the K-12 emphasis or the emphasis in higher education. The Ed.D. was first offered in Fall 2002 and both emphases are run on a cohort model. The first cohort graduated in Spring 2006. The higher education emphasis is a hybrid program, run partly online and partly in a traditional classroom format.
CLU has always been individually proactive regarding undergraduate retention. This attention to traditional undergraduate retention has led to a freshmen retention rate that consistently averages around 80% and a six-year graduation rate that averaged around 65% (CLU Fact Book, 2009). The University completed an initial study of the status of undergraduate retention in 2005. Among other findings of the study, the university found a lack of coordination of retention efforts and a lack of a more in depth analysis of retention beyond the second year persistence and six year graduation rates of first-time freshmen (CLU Traditional Undergraduate Retention: A Cross Functional Project, 2006).
Simultaneously with the retention study, CLU initiated the creation of a new strategic plan. The results of the retention study were used to inform the strategic planning process. Ultimately, improving
202
Proceedings of the 5th Annual National Symposium on Student Retention. Copyright 2009. C-IDEA, The University of Oklahoma.
retention was incorporated as one of the seven objectives of the University’s new strategic plan (CLU Strategic Plan, 2008). Just as CLU is a comprehensive university with graduate, adult and undergraduate programs, the goal contained in the new strategic plan focuses on improving retention for the entire university. Literature Review
There is an overwhelming body of research and data for undergraduate retention to support practitioners. However, when analyzing and studying graduate and adult learner programs there is a lack of a corresponding body of research and data. Seidman (2005) states in his book College Student Retention that the research on retention and traditional undergraduate students did not begin in earnest until the 1930’s. These studies were the first to examine college student mortality, as it was originally called, and were one of the first widespread studies to examine numerous issues related to the departure of students at multiple institutions. In the 40 years that followed, a significant amount of human and capital resources were devoted to learning more about why students leave a university before graduation. In the 1970’s there was a more sustained effort to formulate theories across the educational spectrum. Practitioners began to realize the myriad of issues relating to student attrition. “In many ways, this era really begins with the publication of William Spady’s seminal article, “Dropouts from Higher Education: An Interdisciplinary Review and Synthesis” (Seidman, pg. 19). Not long after, Vincent Tinto built upon and enhanced Spady’s model with other emerging sources of evidence about the nature of the student departure process as cited in Seidman. While Tinto is considered the “father” of retention, there have been many more studies and theories presented since then. There is a significant amount of literature devoted to improving the chances of student success. The studies now also devote their attention to specific student populations. It has become widely recognized that one size does not fit all in student retention. This concept is no truer than with graduate and adult learners and yet the amount and scope of academic study on this population is deficient especially when compared with the traditional undergraduate student. A search of most academic databases shows a scattered and incomprehensive look at these populations. The beginning of the problem lies with the lack of an accepted or widely known definition of retention. While the National Center for Educational Statistics (IPEDS) and most accrediting bodies require extensive reporting of retention and graduation rates for first-time freshmen, there are no requirements for graduate programs or for programs developed for non-traditional predominately part-time undergraduate students. Since there is no systemic data collection and reporting procedures for these populations there is no comparison data for institutions to use. The lack of a common definition and absence of comparison data therefore denies the individual institutions the ability to track their retention and degree completion rates. A search of the literature did elucidate some information from journal articles and presentations at national conferences. The majority of the literature on graduate students focuses on those pursing their doctorates. The summary of the rest of the literature puts the focus on the barriers adult students face when pursuing their degrees.
Nontraditional students interrupt or delay their completion of a course of study for many reasons. They stop out to have baby, change jobs, close on a house, care for an ailing or dying parent, get a divorce, get married, have bypass surgery, start a business, or simply catch their breath. During any term, we can expect that up to 40 percent of our active students will not enroll for a course. Their absence does not mean they are not retained. It only means that they are not enrolled at that moment in time. If we do our job correctly, they will be back (Hadfield, 2003).
203
Proceedings of the 5th Annual National Symposium on Student Retention. Copyright 2009. C-IDEA, The University of Oklahoma.
This quote succinctly summarizes what most enrollment officer’s work with when trying to predict enrollment for graduate and adult student learners. It is very difficult to predict enrollment patterns from term to term. Consequently it is very difficult to define and measure retention. Janice Hadfield in her article titled Recruiting and Retaining Adult Students (2003) even goes so far as to suggest that students should be considered retained unless they transfer and complete a degree elsewhere or are deceased.
More recently at The National Dialog on Student Retention in June of 2008 there was a presentation entitled Where Have All The Students Gone: A comparative Study of Factor’s Related to Persistence and Attrition in Online and Campus-based Master’s Degree Programs. This presentation demonstrates that more universities are studying and analyzing data related to retention of non-traditional populations, but again the research is sporadic and incomplete. For CLU the literature informs our retention efforts and guides the underlying philosophies about student success. Based on the literature, CLU has defined and focused its undergraduate retention goals on increasing the four year graduation rate. Due to the lack of a corresponding body of research and literature for graduate and adult learners it will take us longer to synthesize and develop a plan to address student attrition. The university structure provides the ability to take the current literature and implement strategies quickly. We have therefore decided to focus our retention efforts on what is available to inform our retention plans for our graduate and adult student learners. Undergraduate Process and Plan
CLU has been doing great things in regards to retention. Our Carnegie Classification is Master’s Large and we are in the middle of the group when it comes to first-year student retention as well as four and six year graduation rates. The university offers a substantial number of the programs that are recommended by the literature to achieve student success. CLU has a mandatory first-year experience program that includes an orientation and credit bearing freshman seminar. Our students are required to reside on campus through the end of their junior year and we have assembled task forces in the past to address retention issues when needed.
However in the Fall of 2007 CLU felt the need to begin a more comprehensive and cohesive retention program. Our first-time freshman retention rate was declining and our four year graduation rate was not what we wanted to achieve. CLU had also just completed the process of establishing a strategic plan with seven goals. The second goal in the plan was to “recruit and graduate a well prepared and diverse student body that is academically accomplished and reflective of CLU's mission” (CLU Strategic Plan pg. 1, 2008). The combination of these factors led to the creation of a Director of Retention position in the Academic Affairs Division of the university. Other milestones include:
Table 1: Traditional Undergraduate Retention Milestones
Traditional Undergraduate Retention Milestones Timing CLU created Director of Retention position November 2007 Director implemented targeted retention strategies November/December 2007 Expanded attrition reports with Institutional Research January 2008 Created Undergraduate Retention Committee February 2008 Drafted Undergraduate Retention Committee purpose March 2008 Held Retention Summit for Retention Committee July 2008 Purchased retention communication and tracking software August 2008 Drafted Traditional Undergraduate Retention Plan September 2008 Coordinated and hosted Retention Consultant Assessment October 2008 Retention Plan Approved Oct-08
204
Proceedings of the 5th Annual National Symposium on Student Retention. Copyright 2009. C-IDEA, The University of Oklahoma.
The director was charged with coordinating the effort to increase the first-time freshman retention rate, creating a campus-wide retention committee and developing a retention plan for the university. As formulated, the retention committee is a sub-committee of the University Strategic Planning Committee.
The retention committee began analyzing the retention and graduation rates for the traditional undergraduate population. The calculation of these rates was done using the current accepted standard as indicated earlier in the literature review. A more in depth analysis was begun on the current retention data. As suggested by the literature, CLU looked at specific populations (i.e., 1st generation, low income, athletes, honor students, academic under-preparedness, etc.). Additional data used in the analysis included the average SAT and entering high school GPA scores, student profile data, tuition and fees, undergraduate majors trend data, attrition data, mid-semester academic difficulty notices, low completion course rates and an institutional audit of retention practices across departments on campus.
The retention committee meets monthly and began reviewing the expanded analysis of the data. The initial analysis of the data culminated in a one day Retention Summit where the Retention Committee spent the day interpreting and discussing available evidence and drafting an initial retention plan.
The retention plan was presented to the Strategic Planning Steering Committee and was accepted in the Fall of 2008. The main goal of the retention plan is focused on increasing the four year graduation rate and three strategies were developed to accomplish this goal. These strategies are: 1). Select and implement retention software with an early alert component. 2). Evaluate, improve and enhance academic advising. 3). Explore and identify possibilities of improved customer service and office communication of student services.
There were several factors that led CLU in selecting the goal of increasing the four year graduation rate. CLU prides itself on delivering a liberal arts education in the context of small class sizes, contact with faculty and the ability to finish in four years. We will begin offering a four year guarantee to first-time freshman in the Fall of 2009. Students should be able to obtain their degree in four years to get out into the workforce sooner, if that is their goal. The university has begun to employ the three strategies to increase our four year graduation rate. A retention software package will provide the ability to communicate with all university students and track, on an individual basis, progress towards graduation. The university chose a product from Hobsons Inc. EMT Retain is a Web-based early alert and strategic communication solution that helps institutions make a real impact with student success and retention rates on campus. EMT Retain not only helps institutions pinpoint the students who are most at-risk before attrition, but also provides the tools they need to reach out and engage them” (Hobsons, 2009, para. 2). This communications management tool was the ideal solution for CLU as it allows for multiple opportunities for student tracking from many different staff and faculty on campus.
Strategy number two is to evaluate, improve and enhance the academic advising program. The traditional undergraduate program uses a faculty advising model. All first-time freshmen are assigned an advisor, who also teaches their section of Freshman Seminar. Students stay with that advisor until the end of their first year. The student has the option of staying with the original advisor if the faculty member is in their major or they can switch to a different advisor in their major. For the majority of students this advising relation is effective with the faculty providing developmental advising and mentoring. For some students and faculty members the relationship is not effective which presents barriers to success. Some of these barriers are: faculty misadvising, faculty not meeting with their advisees, and/or students not following the advice of the faculty member. A mismatched advising relationship creates obstacles that can delay graduation for some students. In an effort to eliminate as many obstacles as possible it was determined that the Faculty Enrollment Committee would begin an overview of the academic advising process and identify any changes needed. The recommendations will be presented to the faculty for discussion.
The third strategy was for the university to improve customer service. Every other year for the past eight years CLU has conducted the Noel-Levitz Student Satisfaction Inventory to all sophomores and juniors. This survey provides the student perception of CLU customer service. In January of 2009 a campus wide customer service training was held. The purpose of this training was to highlight customer
205
Proceedings of the 5th Annual National Symposium on Student Retention. Copyright 2009. C-IDEA, The University of Oklahoma.
service and its impact on retention. The success of this campus wide training has evolved into department specific training sessions (i.e., Registrar’s office, student accounts, financial aid, library).
The CLU retention plan is a living document that is continually being updated and revised to stay current with the campus climate. Using the retention plan as a living document, the university has the ability to respond to changes as needed. An example was the creation of a new task force in the Fall of 2008. During a retention meeting discussing the strategies it was discovered that our international students from Norway were experiencing unnecessary registration barriers due to their government’s delayed release of educational funding. The university was not responding in a coordinated, student centered, and customer service manner to help these students persist while this temporary problem was being fixed. The institution also realized that many other students may be facing new, and perhaps temporary, problems related to the economy and this same task force was created to proactively work with all students who owed a balance. Due to the rapid changes in the economy and the financial impact on our continuing students, CLU recognized the need to respond in creative ways. We were able to hold steady the fall to spring retention in part because of this quick action to intervene and work creatively with the students and their families. This was not part of the original retention plan as it was conceived in the summer of 2008. A retention plan or retention strategies must be fluid and have the ability to be flexible to the changing student body and campus climate. Graduate Process and Plan
Working on retention with adult and graduate degree level programs presents challenges. As stated in the literature review there is little published research or evidence as to why they do or do not persist making it difficult to find consensus in defining ‘student success.’ In addition, there are no mandatory reporting or compliance requirements related to graduate and adult learner persistence and completion. The lack of comparison data hinders the process of establishing data driven goals and benchmarks.
Beginning in Spring 2004, a concerted effort has been made at CLU to provide the graduate and adult student learner programs the same level of emphasis that was being placed on the traditional undergraduate programs. In the 2004-2005 academic year a new position, the Associate Provost for Graduate/Adult Programs and Accreditation was approved and filled in the Fall of 2004. The Associate Provost was able to focus full time on the needs of the graduate and adult populations. Other milestones that advanced and increased the focus on graduate and adult learner programs and retention are listed in the table below:
Graduate and Adult Learner Retention Milestones Timeline Associate Provost for Graduate/Adult Programs and Accreditation appointed Fall 2004 Provost’s Office and Registrar surveyed students who had not enrolled in a course during the 2004-2005 academic year
Spring 2005
Director of Marketing for Graduate/Adult position created Spring 2007 Enrollment Systems Manager for Graduate/Adult Programs position created Fall 2007 Director of Retention position was created to address issues of retention for all students
Fall 2007
Institutional Research Office reporting standardized for Graduate/Adult Student Learner Programs
Fall 2007
Purchased retention communication and tracking software Summer 2008 Created Graduate/Adult Student Learner Retention Committee Fall 2008 Beginning institutional inventory of retention practices Spring 2009 Table 2: Graduate and Adult Learner Retention Milestones
206
Proceedings of the 5th Annual National Symposium on Student Retention. Copyright 2009. C-IDEA, The University of Oklahoma.
These milestones also advanced the data collection and reporting processes on campus. Until recently, there was not a systematic graduate and adult student learner reporting system in place at CLU. Requests for data and reports were being generated mostly in an ad hoc manner for the purpose of accreditation, enrollment management, marketing, program reviews, course scheduling, new program development, grant writing, faculty hiring and/or curiosity.
The first regular reporting templates related to retention and graduation completion included trends on second year persistence and time to degree. Most of these original reports provided data on the fall to fall student cohorts familiar in traditional undergraduate reporting style.
As each new report was created, the institutional research officer would request feedback from the dean or program director who had requested the data and then from other deans and program directors, the Director of Graduate and Adult Marketing, and other pertinent faculty and staff. The institutional researcher would specifically ask about how the data was being used, or could be used, the usefulness in decision making value, and for any data driven outcomes. The collaboration led to cross-functional ownership of the reporting development process, helped insure buy-in regarding the data included in the report and resulted in the establishment of university wide templates.
A definition of retention that can be used across all programs (i.e., semester, four terms a year, five terms a year) also developed over time with program wide collaboration. In the 2005-2006 academic year, as part of a master’s thesis project on campus, a CLU employee researched the enrollment trends of graduate level students. The employee analyzed the patterns of graduate students over a seven year period and determined who was still attending or had completed their credential or degree program. A summary of the results can be found in the table below, and were shared campus wide which spurred requests for expanded, streamlined, routine analysis and reporting.
Total Active Completed Withdrew Master/Credential Program N % % % Business Administration 987 28.20% 47.40% 24.40%Public Policy and Administration
Table 3: Baseline Graduate and Adult Learner Retention and Graduation Rates
A streamlined reporting style evolved into the current CLU model. New students are grouped into academic year cohorts consisting of all new students starting a program in any term within an academic year (summer terms through spring terms). These cohorts are then tracked to see who persists or graduates in any term within the following academic year and subsequent years.
The institutional research officer has been able to provide consistent, program specific, systematic reporting utilizing these criteria, since obtaining program wide consensus. Frozen census files were used to cohort students according to their entry term thereby allowing the opportunity to provide trend data by
207
Proceedings of the 5th Annual National Symposium on Student Retention. Copyright 2009. C-IDEA, The University of Oklahoma.
program. An example of this trend data can be found in the table below. This baseline data is being utilized in program specific data driven decision making. Academic Year 0001 0102 0203 0304 0405 0506 0607 All MBA - New Students 134 129 137 160 155 196 311 Retained or Graduated % 2nd Year 74.6% 81.4% 71.5% 82.5% 86.5% 83.2% 88.1% % 3rd Year 73.1% 72.9% 65.7% 71.3% 74.8% 76.5% % 4th Year 72.4% 68.2% 62.0% 71.3% 62.6% % 5th Year 73.1% 69.0% 59.1% 72.5% % 6th Year or more 72.4% 69.8% 61.3% Graduated % within 1 year 2.2% 8.5% 17.5% 16.3% 23.9% 19.9% 19.9% % within 2 years 36.6% 28.7% 33.6% 40.0% 50.3% 40.8% % within 3 years 54.5% 50.4% 46.7% 54.4% 60.0% % within 4 years 66.4% 61.2% 54.7% 64.4% % within 5 years 69.4% 66.7% 56.9% % within 6 years 72.4% Academic year = Summer, Fall, Winter and Spring of the same fiscal year Table 4: Streamlined Graduate and Adult Learner Retention and Graduation Rates
Simultaneously with the approval of the undergraduate retention plan and consensus regarding graduate and adult learner data, meetings were held to gather the program directors and faculty of each program. A Graduate and Adult Student Learner Retention Committee was established in Fall 2008. Data was presented by program and the members of the committee were asked the same question that had plagued the institutional researcher and retention director: “Where was the comparative data from other institutions?” The committee completed more research of the literature with the same outcome. While the traditional undergraduate students and doctoral students were heavily studied in regards to retention no such body of research existed for graduate and adult learners. Non-traditional students will soon constitute more than 60 percent of higher education’s potential customer base (Hadfield, 2003). As a consequence of the finding, in combination with the diverse population and the needs of the students, more research is needed on this population to meet the goals of producing a college educated society to keep up with global competition.
Committee discussions regarding student support revealed a need for a more program specific approach. Analysis is being completed on areas such as: delivery methods (i.e., online, blended, on campus), cohort versus non cohort models, program size, residential experiences, support, attitudes of the faculty, and students in each program. Preliminary results of this analysis are consistent with undergraduate trends. Students who start in a cohort, take classes on campus, and/or live on campus retain and complete at the highest rates. Retention of online learners is the lowest of any group on campus. Analysis has also moved beyond year to year to term to term being placed on ‘stop-out/leave of absence’ patterns. See data examples in tables below:
208
Proceedings of the 5th Annual National Symposium on Student Retention. Copyright 2009. C-IDEA, The University of Oklahoma.
3 Year Average Attrition Rate By:
All MBA (N=650)
On Campus MBA
(N=396) Cohort MBA
(N=127)
Online MBA
(N=127) 2nd yr 19.50% 14.40% 4.70% 24.40% 3rd yr 25.60% 28.20% 4.80% 39.40% 4th yr 34.50% 36.80% 4.80% 50.00%
Table 5: Graduate and Adult Learner Retention and Graduation Rates by Delivery Method
Public Policy and Administration 06FA 07FA 08FA
3 Yr. Avg.
Continuing students 31 34 49 36 New students 10 7 16 11 Total Headcount 41 41 65 91 Total Student Credit Units 172 204 282 219 Eligible - Not enrolled 2 4 3 4 August Graduates 3 6 4 3 Graduation rate of continuing students 9.7% 17.6% 8.2% 9.7% Percentage new students 24.4% 17.1% 24.6% 24.1% Return rate-non grads/eligible students 93.9% 89.5% 94.2% 89.7% Net Fall as a % of Summer 132.3% 91.1% 130.0% 92.2%
Table 6: Graduate and Adult Learner Term to Term Enrollment Flow
As a continuing part of the analysis, the Director of Retention will complete an institutional inventory of current retention strategies each program employs to work with its students. The compilation will provide a basis for an overall graduate and adult degree program retention plan. This plan will embrace the many differences and similarities in students and programs and create an overarching goal to increase retention and graduation rates, grounded in the data and institutional inventory.
Conclusion
As the university completes its second retention plan it has become clear that while the students of each population are unique with their own specific needs, there still exists one common dominator. This common dominator is what CLU has adopted as the retention motto of “One Student at a Time”. The One Student at a Time motto embodies the flexibility necessary to address each student population individually in a meaningful manner. It also gives CLU the ability to create a retention funnel that allows us to respond to retention issues on a macro and micro level.
209
Proceedings of the 5th Annual National Symposium on Student Retention. Copyright 2009. C-IDEA, The University of Oklahoma.
References Alexander, C., Kohnke, M., Pena, D. California Lutheran University Traditional Undergraduate
Retention: A Cross Functional Project [PowerPoint slides]. Retrieved from California Lutheran University Assessment Web site: http://www.callutheran.edu/assessment/cycle/symposium.php
California Lutheran University. (2009). Fact Book. Thousand Oaks, C.A.: Cathy Alexander California Lutheran University. (2008). Strategic Plan. Thousand Oaks, C.A. Hadfield, J. ( 2003). Recruiting and Retaining Adult Students. New Directions for Student Services, 102
(Summer 2003), 17-25. Hobson’s Website, (2009). EMT Retain. Retrieved May 15, 2009, from
http://www.hobsons.com/products/technology/emtRetain.php Mercer, S. (2007). Attrition Rates of Master and Post-Baccalaureate Programs. Retrieved from
California Lutheran University. Patterson, B. Where Have all the Students Gone: A Comparative Study of Factors Related to Persistence
and Attrition in Online Campus-based Master’s Degree Programs[PowerPoint slides]. Retrieved from Educational Dynamics Web site: http://www.educationdynamics.com/retention_conference/conference_downloads. htm
Seidman A. (2005). College Student Retention: Formula for Student Success (Seidman, A, Ed).
Westport, CT: Praeger.
210
Proceedings of the 5th Annual National Symposium on Student Retention. Copyright 2009. C-IDEA, The University of Oklahoma.
Multiple Indicators for Monitoring Undergraduate Transfers Through to the Baccalaureate: Community College Topics
Patrick Perry
Vice Chancellor of Technology, Research, and Information Systems California Community Colleges Chancellor’s Office
[email protected] Abstract – This first half of a two-part tutorial demonstrates how community college and baccalaureate institutions can collect and report data on the many facets of the transfer function. The examples to be presented have been developed primarily for the California Community College and California State University systems, but have a broad applicability to most two-year and four-year systems that have a transfer function for students. This paper and tutorial will examine the metrics of student transfer from a two-year institution and two-year segment/system viewpoint. Introduction Community colleges come under great scrutiny by policymakers over an ingrained perception of having low rates of academic outcomes and performance, especially when measured against public four-year institutional performance. Frequently cited as having low rates of degree-completion and transfer, community colleges, who tend to be open-access and lower in cost than most four-year institutions, serve populations that inherently are likely to have lower rates of success (academically underprepared students, older students, non-degree-seeking students). Unlike four-year degree-granting institutions, community colleges also have multiple missions of service, and many who attend cannot be described as having an equivalent intention to complete as those in a four-year institution. As such, institutional research studies on student intentions and subsequent outcomes are very complex for those studying community college populations. One of the most studied community college populations are students with transfer intent. This tutorial will present a number of metrics and methodologies for identifying such student populations in a community college setting and subsequently defining a proper set of measureable outcomes for this population as they move through the community college pipeline. Topics of the Tutorial This tutorial will cover the following areas:
• Basic Transfer Definitions • Data Sources • Identifying Students by Intent • Determining First-Time Status • Determining Institution of Origin • Identifying Momentum and Completion Metrics • Calculating Transfer Rates • Measuring Transfer Rates against other institution’s rates • Identifying Factors that Affect Transfer Rates
211
Proceedings of the 5th Annual National Symposium on Student Retention. Copyright 2009. C-IDEA, The University of Oklahoma.
Basic Transfer Definitions There are two main types of transfer measurement: transfer volumes and transfer rates. Volumes refer to actual numbers of students moving between segments, and are usually represented by annual headcounts. Transfer rates are ratios of actual transfers to some pre-defined set of transfer-intended students, normally measured in a first-time student cohort tracked forward some number of years. Transfer rates can be for segmented groups of students (rate by age group, gender, etc) or by institution. Data Sources Measuring transfer requires a viable data source. The more granular the data source, the more ability one has to do analysis of transfers. Unitary databases with matchable student identifiers provide a superior dataset to do this type of analysis. Better analysis can be achieved by having enrollment detail available, especially in trying to identify student intent. On the other side, data sources in the four-year segment (destinations) are a necessary requirement as well; these include local matches, system matches, and national data sources such as the National Student Clearinghouse. Other national or regional efforts to define transfer uniformly are examined, especially the Graduation Rate Survey (GRS) of the Integrated Postsecondary Education Data System (IPEDS), administered by the Federal government. Identifying Students by Intent As community colleges have multiple missions of service, the students attending a community college also have a multitude of “intentions” as related to why they are there. In many states, more often than not the community college student is a lesser academically-qualified and prepared student, and is not collegiate in aptitude. While four-year institutions have the simplicity of defining almost all students as degree-seeking, one of the tasks of community colleges is to shape, mold, and form participants into paths as the student explores whether or not they are truly collegiate; in essence, one of the “jobs” of a community college is to “make” students out of otherwise undecided participants. Some activities involve clearly non-degree seeking populations (cultural enrichment, leisure enrollees, K-12 concurrent enrollees, basic skills enhancement, citizenship, licensure recertification). Many times, however, a student will enroll because he/she is at a life crossroads, and will take some courses at a community college to see how well they do in the environment. They may take placement exams and enroll in math or English courses, introductory level vocational courses, or they may “wander” within the curriculum seeking something that hits them. Combined with marginal academic preparation, these students not clearly on a known path tend to produce a great volume of drop-outs. The question that faces a community college researcher then becomes critical: at what point does one count a student as being truly degree-seeking? One method is to use student self-stated intention on an application. Students apply for community college usually “uninformed”, or not having gone through any counseling or matriculation process, and are thus greeted on an application with the question “what is your goal or intention of enrollment?” Choices will likely include “seeking AA/AS”, “seeking certificate”, seeking transfer to a four-year institution” along with “recreational/leisure”, “basic skills remediation” and other non-degree-seeking options. Psychologically, students will be more likely to check off the intentions of a higher order (transfer, AA/AS) versus those of lower expectation, thus overinflating self-stated student intention numbers. Colleges also have an interest in making an impression upon students that these are the “desirable” outcomes of enrolling. As such, colleges that rely upon student self-stated goal/intention as a basis for cohort definition are at a disadvantage because they will likely include many students who really
212
Proceedings of the 5th Annual National Symposium on Student Retention. Copyright 2009. C-IDEA, The University of Oklahoma.
have no basis for claiming degree-seeking status, and thus calculate lower rates of success. Additionally, students may also check “degree-seeking” so they can capture financial aid. Of potentially greater accuracy in defining degree-seeking in a community college population is that of deriving degree-seeking status behaviorally. Some students can be easily identified in their course-taking patterns (take math/English early, take a large number of vocational courses in the same curricular area). Others, however, may not “become” degree-seeking until well into their collegiate career. In a community college environment, one cannot simply look at student properties/behaviors solely in the first term of enrollment and label students degree-seeking or not. Many students need many terms of remediation before becoming “collegiate”; essentially, community colleges must complete an unfinished task of K-12 before a student can even be considered “collegiate”. As such, counting these students in a degree-seeking cohort is akin to counting a community college graduation rate based on student populations still in high school. Colleges that serve a greater percentage of remedial students will inherently be disadvantaged by this in their ensuing outcome rates. Determining First-Time Status One of the very first tasks of creating a transfer rate cohort is defining a “first-time” cohort of students to track longitudinally forward. While most all student systems have data elements (student enrollment status) that collect and store this information, the source of the information varies. Most common will be student self-stated enrollment status, usually a checkbox on an application that simply asks if this is the first-time a student has ever enrolled at that particular institution. However, community college students do have a propensity towards mobility, and some may not necessarily be motivated to divulge prior enrollments, especially if this means a prior unwanted transcript follows them to a new institution. “First-time” can be a derived enrollment status. Locally, this can manifest itself by looking at past transcripts (if they exist) or by a campus looking at past electronic records to see if the student’s ID or SSN (if given) ever appears at that campus (or system). The larger the data checking source and the longer the data records go back, the better the validation source for this derived element. Ultimately, the best source for deriving “first-time” comes from a national enrollments database (such as the NSC); first a campus checks locally, then nationally, to see whether or not a student is truly new to higher education. Those institutions that derive first-time from a national data source have an inherent advantage in narrowing their first-time student cohorts, which ultimately advantages their transfer rates due to the fact that older students (who will be more likely to be miscoded as first-time when they are not) almost always have lower rates of success than younger students (who are more likely to truly be first-time) and because the thorough “scrubbing” and elimination of students who have prior enrollments will tend to eliminate populations who have enrolled once already and failed (a group likely to have high rates of failure subsequently). Determining Institution of Origin This is primarily a topic for segmental or system researchers running transfer rates on multiple institutions in a particular geographical region. Generally, he more urban the area, the greater likelihood one has of encountering students who attend multiple institutions either concurrently or over their entire academic history. When a transfer occurs for these students, the question of “which community college gets credit for the transfer?” comes into question. The primary methodologies for determining this include (a) credit to the campus where the student began his/her academic career; (b) credit to the campus where the student took a majority of his/her units in his/her entire academic career; or (c) credit to the last institution the student was enrolled at prior to transferring.
213
Proceedings of the 5th Annual National Symposium on Student Retention. Copyright 2009. C-IDEA, The University of Oklahoma.
Identifying Momentum and Completion Metrics There are any number of possible momentum and completion metrics that can be measured for these transfer-intended populations. The primary outcome metric is fairly straightforward: did the student actually transfer/enroll in another institution? Secondary outcome metrics include whether the student earned a degree/certificate at the community college and whether the student completed recognized prerequisites toward transfer (regardless of whether the student was found as actually transferring or not.) Intermediate metrics include whether the student completed remediation, completed transfer-level math and/or English, and whether the student completed various unit thresholds. Ultimately, community colleges are advantaged when they create “hybrid” outcome rates that capture any number of positive outcomes. Calculating Transfer Rates Putting all the aforementioned methodological pieces together (calculating intent, first-time status, and a multitude of outcomes), calculating transfer rates and their proxies is fairly simple. However, great care must be taken to ensure these rates are meaningful in context, “saleable” to external audiences, and explainable to lay persons. Measuring Against Other Institutions Rates The next logical step in this process of rate creation lies in the inevitable comparison of your institution or student population against other comparable populations. Care must be taken to measure comparable rates with comparable methodologies. Even when rates have been developed using one methodology, comparing institutions with different geographies and student demographies is tricky as performance and accountability reporting frequently attempts to do just that—compare rates with little context. It is important to provide a framework to allow the researcher to “adjust” institutional performance in light of exogenous factors that differentiate colleges. Identifying Factors That Affect Transfer Rates Ultimately one of the best models of true performance evaluation for institutional transfer rates comes from a combination of having a very strong cohort definition that mitigates against institutional size (using rates), controls for varying percentages of student populations there to seek transfer (transfer intent) and levels the playing field of academic preparation and the demography of local populations served. A high predictability of a colleges’ transfer rate can be achieved statistically by looking at service area demography (obtained by looking at the zip codes where your students live crossed with census data). When one “adjusts” for exogenous factors, one is left theoretically with the ability to create meaningful peer groups where the variability in outcomes is likely to be more institutional in nature. Conclusions This tutorial will cover the universe of efforts related to the aforementioned areas as it has been accomplished in California over the past decade. CSRDE members have the opportunity of using many of these techniques and methodologies in their work and as a part of the consortium to create a more useful and comparable data source.
214
Proceedings of the 5th Annual National Symposium on Student Retention. Copyright 2009. C-IDEA, The University of Oklahoma.
Multiple Indicators for Monitoring Undergraduate Transfers Through to the Baccalaureate: 4-Year Institution Topics
Abstract - Using empirical examples from the California State University, this second half of a two-part tutorial will demonstrate how to augment CSRDE graduation rates for community college students with alternative rates that account for other segments of the undergraduate transfer population found at 4-year institutions. A major topic will be methods for comparing graduation rates between cohorts of new undergraduate transfers and cohorts of new first-time freshmen. Besides graduation rates, measures of time-to-degree and academic performance also will be addressed.
Introduction What should 4-year institutions report on regarding undergraduate transfers? This is the focus of the second session of the tutorial on community college students. For many 4-year institutions, undergraduate transfers represent a significant portion of their baccalaureate-seeking population. At the California State University (CSU), for example, nearly 64 percent of all new bachelor’s degrees conferred are awarded to undergraduate transfers from California Community Colleges (CCC). So, for institutions like the CSU, it makes little sense to restrict reports on undergraduates to just to the status and progress of first-time freshmen. A complete picture on the condition of the undergraduate population is dependent on the inclusion of undergraduate transfers as objects of study. The use of valid measures and appropriate contrasts, of course, also is essential for understanding differences and similarities between the experience of undergraduate transfers and first-time freshmen. The materials presented are observed outcomes for undergraduate transfers that entered the CSU from fall 1975 to fall 2005. The CSU has a long history of generating statistical summaries on its undergraduate transfers, including the calculation graduation rates. The first comprehensive report on graduation rates for undergraduate transfers was based on students that entered the University in fall 1975 and the first comprehensive report on degrees conferred over time by institution of origin was published 20 years ago. In addition, the CSU had been disseminating annual reports on the first-year performance of community college transfers since the early 1990s. The accumulated data and analyses illustrate how indicators can be formulated, how indictors vary across campuses or time, and how disparities between groups can be interpreted.
The recommended practice for 4-year institutions is to generate a set of useful statistics on CCC transfers, that includes graduation rates, and disaggregate them by campus of origin. That way community colleges can get feedback about students that emerge from their campuses. And when necessary, 4-year colleges and universities should exchange data with community colleges to help document the student migration from 2-year to 4-year institutions.
What degree files yield? The most telling indicators in higher education usually come from longitudinal data. But a cross-sectional file containing information on undergraduate degrees conferred in one year is perhaps the initial data source researchers should investigate when they begin to analyze undergraduate transfers. The first thing they can determine is what proportion of your undergraduate degrees is awarded to undergraduate transfers. For 2006-07, the CSU awarded roughly 66,500 bachelor’s degrees. Fully, 59 percent were
215
Proceedings of the 5th Annual National Symposium on Student Retention. Copyright 2009. C-IDEA, The University of Oklahoma.
awarded to former California Community College (CCC) students, 5 percent went to undergraduate transfers from other higher education institutions, and 36 percent went to CSU “natives” (i.e., first-time freshmen). This percentage distribution supports the long-standing CSU practice of regularly reporting detailed outcomes for both native students and CCC transfers, but limiting the reports of undergraduate transfers from institutions other than the CCC to a smaller number of descriptive observations.
The second thing researchers can determine from a degree file is the time interval necessary to capture the majority of graduation events for a cohort of new undergraduate transfers. This can be done by subtracting students’ matriculation dates from their degree awarded dates. For all undergraduate transfers that earned a degree in 2006-07, nearly 95 percent earned their degrees in 6 years or less. So applying the 6-year IPEDS standard for calculating graduation rates to undergraduate transfers (i.e., the CSRDE practice) insures that not more than 5 percent of the graduation events will be censored observations. At the low end of the time-to-degree continuum, almost 30 percent of all undergraduate transfers that earned a degree in 2006-07 did so in 2 years or less. This means stable graduation rates can be computed for intervals ranging from 2 to 6 years. Computing graduation rates
The CSRDE specification for computing graduation rates among undergraduate transfers is to restricted observations to community college transfers that matriculated in fall and earned 30 semester college units or more. The 6-year completion rates for the three most recent CRSDE cohorts at the CSU look like the following:
Table 1. CSRDE Graduation Rates for Three Successive Cohorts of Undergraduate Transfers
What the rates show is consistency across time. Observed changes for corresponding rates are usually less than one percentage-point between adjacent cohorts. What is also steady is the proportion of new transfers that attempt part-time schedules in their first term. Fully, one-fourth of all the new transfer students sign up for less than 12 units at entry.
The values that are not listed in table 1, that are a part of CSRDE reporting, are the continuation rates for each cohort. If I had posted the 6-year continuation rate, the value would have been essentially 2.1 percent for each cohort. This percentage represents the censored graduation events after 6 years of tracking; that is, the cases where graduation status could not be determined because of the restricted time interval. The question is: what would happen to the 6-year graduation rate, if the time-interval were lifted? Historical analysis based on a 12-year interval indicate that each graduation rate would probably increase by 2.1 percentage points—all those still enrolled 6 years after matriculation attain degrees—and each graduation rate would increase by another 1 percentage point—some stop outs at the 6-year marker would return to the university an attain degrees. Thus the sum of the 6-year graduation rate plus the 6-year continuation rate yields a conservative estimate of the eventual graduation rate for CSRDE defined cohort.
Since CSRDE cohorts are limited to community college transfers with at least sophomore status, at issue for some is how representative are they of entire undergraduate transfer population. At the CSU, the CSRDE fall cohort only accounts for about half of all undergraduate transfers that enter in an academic year. To address the issue of representativeness, the CSU periodically computes graduations
216
Proceedings of the 5th Annual National Symposium on Student Retention. Copyright 2009. C-IDEA, The University of Oklahoma.
rates for alternative subgroups to assess the impact of the students not picked up by the CSRDE definition for inclusion. Table 2. Description of Selected Cohorts of Undergraduate Transfers: 2000-01
In fall 2000, the CSRDE cohort represented roughly 52 percent of all new undergraduate transfers for the 2000-01 academic year (column 1). The first omission that is checked is the subgroup of community college students that entered in winter or spring of the academic year. Each year this is a sizable subgroup that accounts for about 20 percent of the total under graduate transfer population (see column 2). The next omissions are all the transfers that originated from other 2- or 4-year institutions. This group accounts for an additional 13 percent of the total (see column 3). Finally, rates are produced for all undergraduate transfers, that is, freshmen transfers are added into the cohort. This subgroup accounts for just about 5 percent of all undergraduate transfers (see column 4).
Invariably, the rates for the various subgroups will deviate from the rates for the entire undergraduate transfer population, but the deviations should be small. So no matter what subgroup of undergraduate transfers you highlight, the basic story for academic performance or completion should be the same. If they are not, then special eligibility requirements for certain subgroups should explain most of the observed differences.
Time-to-Degree for Cohorts
Periodically, 4-year institutions should run graduation rates for the interval that theoretically captures 98 percent of all graduation events (an estimate of the 98th percentile is derived from the degree file). For undergraduate transfers at the CSU, that interval ranged between 10 and 12 years for cohorts that matriculated between fall 1975 and fall 1995. The first dividend is that an institution can validate the extent to which its eventual graduation rate can be represented by the sum of the 6-year graduation rate and the 6-year continuation rate. The second dividend is that a very precise measure of time-to-degree can be calculated for a specific cohort. Remember that when you calculate time-to-degree from a degree file, the degree holders represent a host of matriculation dates, but share essentially the same degree date. On the other hand, when you calculate time-to-degree from cohort data, all the students share the same start date. The advantage of the cohort-based measure of time-to-degree is that, unlike a longitudinal measure, it is not affected by changes in the size of cohorts across time.
Comparing rates for first-time freshmen and undergraduate transfers
As soon as one posts graduation rates for undergraduate transfers, observers of the institution will immediately draw comparisons with the rates already posted for first-time freshmen. If your freshmen represent a highly selective group, the two sets of 6-year rates will probably look quite similar. If your freshmen represent just a moderately selective group, the transfers will probably be associated with the higher rates. Regardless, you need to inform everyone that a direct comparison of 6-year rates will result in an ambiguous difference. The problem is that undergraduate transfers do not reflect a random group of undergraduates.
217
Proceedings of the 5th Annual National Symposium on Student Retention. Copyright 2009. C-IDEA, The University of Oklahoma.
Undergraduate transfers are in the main survivors of the lower-division curriculum. Thus, gross comparisons with first-time freshmen are distorted, since the latter group has yet to complete one lower division course. To make appropriate comparisons, freshmen observations must be adjusted so that they also reflect survivors of the lower-division curriculum. One way to adjust is to restrict the freshmen observation to only those that attained the junior class level. Now comparisons will reflect what group attained higher completion rates for the upper-division curriculum.
A less precise way to make the adjustment is to calculate the probability of eventually graduating for those in the freshmen cohort that were still enrolled three years after matriculation; that is, those that completed two years of study. This may be accomplished by computing a conditional probability for freshmen from standard CSRDE rates. Table illustrates the derivation of the conditional probability and the comparative rates between the two groups across three sets of cohorts (i.e., the two sets of numbers in italics).
Table 3. Eventual Graduation: Conditional Freshman Rates vs. Observed Undergraduate Transfer Rates
Regardless of the method used, the expectation is that the conditional rate for the freshman cohort
will yield the slightly higher rate. This is because the undergraduate transfer population has face at least one more major obstacle, transitioning from one institution to another. If the conditional rate for the freshman cohort is not the larger rate, undergraduate transfers must be from a very selective group of upper-division students.
Holding students’ high school graduation date is another way to create comparable groups of freshmen and transfers when contrasting graduation rates. Here conditional probabilities are generated for both groups. The table below outlines how the two conditional rates are calculated. All told, the comparative rates will denote 8-year tracking intervals.
Table 4. Computing Graduation Rates for Freshmen and Transfers with High School Graduation Dates
Commonality Denominator Numerator Cohort
CSU Matriculation Date
High school graduation
year
Conditional cohort
Sum of graduates
Freshman
Fall 1999
Spring 1999
Continuing students in fall 2001
Spring 2002- summer 2007
Transfer Fall 2001 Spring 1999 New transfer student in 2001
Spring 2002- Summer 2007
All told, the expectation is the same as before, the higher rates will be associated with the
freshman cohort; but using the method outlined above should produce the smallest difference between the two groups. This is because the transfers now represent the community college population that completed the lower-division curriculum in the shortest period of time.
First year outcomes
218
Proceedings of the 5th Annual National Symposium on Student Retention. Copyright 2009. C-IDEA, The University of Oklahoma.
Regular reporting on community college transfers should include highlights of their first year experience. This means posting at least first-year graduation rates and GPA at the 4-year university. The table below illustrates a report annually posted on the first year experience for transfers to the CSU. Table 5. Academic performance in the first academic year Cohort Enrolled Continuation CSU GPA CCC GPA Upper Division 32,175 0.853 2.93 2.94 Lower Division 2,121 0.763 2.73 2.83Total 34,296 0.848 2.92 2.91
Two facts of note are that lower-division transfers exhibit a first-year continuation rate that is slightly below the corresponding rate for the contemporary cohort of first-time freshmen (0.801), and the comparable rate for upper-division students is slightly about the freshman benchmark. Thus, like freshmen, undergraduate transfers have large numbers of students leaving the university without a degree after just one-year of attendance. In proportional terms, more than half of the undergraduate transfers that eventually will drop out do so within one-year. The other facts of note are that both lower-division and upper-division students earn first-year GPAs that are on par with the GPAs they earned at community colleges.
Conclusion and recommendations The amount of time and effort spent on producing educational indicators for undergraduate transfers should be proportional to their prominence on campus. At the CSU, this means computing almost as many indicators as are produced for incoming cohorts of first-time freshmen. This includes graduation rates, continuation rates, and grade reports. Moreover, the campus practice should be to isolate community college students from other undergraduate transfers (e.g., the CRSDE practice). One reason is because transfers from community colleges usually represent students with more or less common aspirations that adopt standardized paths from one campus to another, whereas other undergraduate transfers often represent a host of idiosyncratic motives for moving from one campus to another. The other reason is that community colleges often represent feeder institutions. By isolating community college transfers, 4-year colleges and universities can provide their feeder institutions with campus-specific feedback about their former students. The use of multiple indicators is the key to producing quality information on undergraduate transfers. All the aspects of graduation rates and time-to-degree, for example, may not be revealed data collected within a 6-year interval for students that entered 4-year institutions as sophomores or upper-division students. So it would be wise to calculate some alternative rates, even though these indicators might not need to be produced annually. Another key to producing useful statistics is partnerships between 2- and 4-year institutions. The exchange of ideas and data can only enhance the research on undergraduate transfers.
219
Proceedings of the 5th Annual National Symposium on Student Retention. Copyright 2009. C-IDEA, The University of Oklahoma.
Abstract- The purpose of this study was to assess the impact of dual enrollment (DE) course experiences on first-time-freshmen (FTF) by comparing the outcomes of dual enrollment students who entered the institution after high school graduation with the outcomes of students who entered the institution with no DE credits (NDE). The study examined differences in the proportion of DE and NDE students who require at least one developmental education course, the average number of semester credit hours each group enrolled in during their first semester, their average grade point average (GPA) after their first semester, and their retention rate after one year. Data for this study was obtained from 6,812 official student records of first-time-freshmen (FTF) who entered The University of Texas at Brownsville and Texas Southmost College (UTB/TSC) during the fall semester from 2005 to 2008. Across all semesters, a larger proportion of students who entered with DE credits were college ready compared to their peers who had no DE credits. In addition, DE students enrolled in a greater number of semester credit hours than their NDE peers. Data indicated by t-tests revealed significant differences between DE and NDE groups in terms of the average number of semester hours enrolled across all semesters (all t > 6, p < .001) and when semesters were aggregated. Students with DE credit earned higher GPAs than NDE students in two of the four semesters analyzed, and DE students were more likely to return to college during the following year relative to NDE students (all p < .001). Implications for policymakers and practitioners are provided at the conclusion of the study.
Dual Enrollment: An On Ramp to College Success
The need to identify models that positively impact Hispanic access to and long-term success in higher education continues to accelerate as the Hispanic population across the United States explodes, including exponential growth in nontraditional locations outside the Southwest, Florida, and New York. Nationally, Hispanics enroll in college at disproportionally lower rates than other ethnic and racial groups despite being the fastest growing population in the P-12 public school system. The Pew Hispanic Center’s report profiling Hispanic public school students authored by Fry and Gonzales (2008) stated “the number of Hispanic students in the nation’s public schools nearly doubled from 1990 to 2006, accounting for 60% of the total growth in public school enrollment over that period” (p. i). They predict decades of strong growth ahead, with the school age population increasing 166% by 2050, while non-Hispanic school-age population will grow by just 4% over the same period. Hispanic students generally face additional compounding issues such as higher poverty rates, decreased English proficiency, and a lack of understanding of the value of higher education. Uncertainty about higher education in Hispanic homes is the result of generations of low educational attainment levels among families, in fact exacerbating the low participation rate cycle. More than a quarter of Hispanic students (28%) live in poverty, compared with 16 percent of non-Hispanic students; 34 percent of Hispanic public school students have parents who have
220
Proceedings of the 5th Annual National Symposium on Student Retention. Copyright 2009. C-IDEA, The University of Oklahoma.
not completed high school compared to 7 percent of non-Hispanic students, and 70 percent of Hispanic students speak a language other than English (Fry & Gonzales, 2008).
Higher education is responding to this disturbing trend. In Texas, where more than 40% of
public school students are Hispanic, initiatives such as the legislatively mandated Closing the Gaps, strategically sets targets for Hispanic access and achievement in higher education. The state essentially mandates colleges and universities to create strategies to achieve, fund, and assess aggressive recruitment and retention strategies to meet target benchmarks. The Closing the Gaps statewide strategic plan began at the dawn of the new century. Almost a decade into the campaign, the Dallas Morning News quotes Raymundo Paredes, Commissioner of the Texas Higher Education Coordinating Board, that “although Hispanic college enrollment has increased substantially since 2000, Hispanics are still participating in higher education at a lower rate than other racial or ethnic groups and are not on target to meet state goals” (2007, ¶ 1). There was a 40 percent increase in the number Hispanic students enrolling in college in Texas from 2000 – 2008, but the rate of enrollment among Hispanics has “barely budged” when you take into account Texas’ booming Hispanic population. “Only 3.9 percent of Hispanics are enrolled in higher education compared with 5.4 percent for blacks and 5.5 percent for whites.” (Dallas Morning News, 2007, ¶3).
In an effort to mitigate issues of access to college, DE programs have become a popular
instructional design that provides high school students with college credit and the fulfillment of high school requirements simultaneously through the completion of a single college-level course. The benefits in terms of cost savings to students’ families and colleges alike appear to support the efficiency of the program in terms of cost-effectiveness. However, the effectiveness of DE programs has yet to indicate that this particular path to college matriculation has other significant effects on student success in terms of number of semester credit hours attempted, GPA at the conclusion of the first term and retention rates to the next fall semester.
The University of Texas at Brownsville and Texas Southmost College (UTB/TSC) has been
involved in DE partnerships with local independent school districts since 2000. These collaborative efforts are designed to prepare high school students for college access and success by offering no-cost (to students) direct access to college level courses before high school graduation. Delivery of courses occurs through a variety of formats including traditional DE where courses are taught at the high school by university credentialed high school teachers delivering the college curriculum. Other delivery methods include summer DE programs on the university campus and year-round university-based programs such as the Math and Science Academy or Early College High School. Each of these delivery methods varies in the level of support services provided to participants and the location where the instruction is received. Tuition and fees are waived, with each school district paying a $5 per student per course records fee and purchasing the text books and tests required for each student in each course.
In this study, DE will be defined as any college credit earned by a FTF before they graduated from high school. College readiness is defined as the attainment of college-level scores on any state approved assessment measuring reading, math, and writing preparedness for college-level course work. Students who are not college ready must enroll in required developmental education courses until they meet college readiness standards on all sections of the exam. Therefore, university records indicating students are required to take developmental education courses are classified as non-college ready.
By understanding the effects of early access programs like DE on the short-term and long-term college-going behaviors and outcomes of participating students, policymakers will have evidence needed to formulate effective policy. Whether cost-efficiency and access to underrepresented populations is the primary aim, or the long-term success and persistence of students in completing a credential at a higher
221
Proceedings of the 5th Annual National Symposium on Student Retention. Copyright 2009. C-IDEA, The University of Oklahoma.
education institution is the primary aim, evidence is necessary to demonstrate the true value of this popular new program. Theoretical implications Reindl’s (2006) research for the Jobs for the Future foundation appropriately reflects upon the speed with which accelerated learning programs such DE have propagated. He notes that “with many adaptive innovations, the creation and evolution of many (if not most) accelerated learning options has outpaced the development of a policy infrastructure to support and evaluate the expanding menu of options” (p. 1). Reindl further contends that the four primary harbingers for expansion of such programs are centered “on four primary issues: mission and purpose, culture of evidence, quality and rigor, and finance” (p. 1). The competing interests of varied constituents make the issue more dynamic than how to maximize financial return on investment. Advocates of accelerated learning programs believe that it finally closes the expectations and access gap for disadvantaged and underrepresented populations in higher education.
Hoffman and Robins (2005) report that “policymakers and educators concerned with improving
access of students underrepresented in postsecondary education are also beginning to consider DE as a strategy to introduce higher education to a ‘second population’: young people who may not consider themselves ‘college bound’. The hypothesis is that DE, if structured properly, can accustom these students to the demands of college while supporting them to meet those demands within their more familiar high school environments” (p. 1).
Hoffman (2005) further contends that DE is a “promising next best thing for states wishing to increase the number of underrepresented students gaining a postsecondary credential…allowing states to potentially subtract from the total expense of educating a young person” (p. 1). She maintains that when promoted as an acceleration mechanism or head start on college rather than a program for gifted students, a wide range of students benefit. While program participation is growing, there is a need for research regarding basic questions of effectiveness. With data regarding outcomes and learning effectiveness still scarce, the strategy for educators should be to promote college access not necessarily improved learning outcomes at this point.
In similar research studies, Hoffman, Vargas and Santos (2008) report that there is early evidence that DE programs help student complete college faster and that the experience improves their college performance. They found several studies that “conclude that high schools students who take college courses subsequently perform better in college than those with no history of DE course-taking” (p. 7). Their report also cites Karp, Calcagno, Hughes, Jeong, and Bailey (2007) which indicates that DE has a positive impact on retention and grade point average, with DE students earning 15.1 more credits than their non-DE peers three years after high school graduation. In their research, Martinez and Klopott (2005) found that among the predictors of college-going behavior, academic rigor and strong social and academic support were the most crucial predictors of a student’s successful enrollment in, and completion of, postsecondary institutions. They cite Adelman’s (1999) research in asserting that academic preparation is the most significant predictor of college success and that in addition to enrollment in a rigorous academic program, college-going behavior can be predicted based on high achievement as defined by grade point average. These predictors can be embedded in high school reform strategies to increase student achievement and college preparedness and success for underserved students. They report that some DE programs “are designed specifically to increase access to higher education for minority or low-income students” (Martinez & Klopott, 2005, p. 60). However, authors cite Clark (2001) who states that a “significant concern…is which students are taking advantage of this opportunity…Nationally, 4-year college students who participated in a high school DE program have, on average, a higher college GPA and higher 4-year graduation rate than
222
Proceedings of the 5th Annual National Symposium on Student Retention. Copyright 2009. C-IDEA, The University of Oklahoma.
students who did not participate in such a program” (Martinez & Klopott, 2005, p. 76). Yet despite the increasing popularity of DE programs, the researchers caution that there is little national data to demonstrate that low-income or first generation students are successful. Adelman’s (2004) research at the US Department of Education studied variables impacting the completion of a bachelor’s degree. He found that completing Advanced Placement courses is more strongly correlated with bachelor’s degree completion than it is with college access. Furthermore, he found that students who attend 4-year colleges and who earn fewer than 20 credits in their first calendar year of postsecondary experience have a lower chance of completing a bachelor’s degree than their counterparts who complete more hours. In Adelman’s conclusions he discusses that “the academic intensity and quality of one’s high school curriculum is such a dominant determinant of degree completion, and both test scores and high school grade point average or class rank are much weaker contributors to attainment” (p. 5). Research Questions
The purpose of this study is to compare the outcomes of DE students (DE) who entered the institution after high school graduation with the outcomes of students who entered the institution with no DE credits (NDE) to answer the following questions: Does the proportion of students who require at least one developmental education course differ between DE and NDE students? Does the average number of semester credit hours enrolled during the first semester of the freshman year differ between DE students and NDE students? Does the average GPA of first-time freshmen after their first semester differ between DE and NDE students? And, does retention rate after one year differ between DE and NDE students?
Table 1 is a summary of the demographics of the population of high school students enrolled in
DE courses with UTB/TSC in each fall semester from 2005-2008.
Table 1: DE Population 2005-2008 2005 2006 2007 2008
Total 2,012 4,155 5,809 6,128 % % % % Gender Male 59.0 56.3 58.2 58.6 Female 41.0 43.7 41.8 41.4 Ethnicity White 2.8 2.3 2.7 1.8 Hispanic 95.6 96.4 96.1 97.2 Other 1.6 1.4 1.2 1.0 Average Age 16.0 15.8 15.9 15.8 Average DE hours 3.9 3.9 4.2 4.1 Average GPA 3.10 3.08 2.96 2.94 DE course offerings 25 36 40 42
223
Proceedings of the 5th Annual National Symposium on Student Retention. Copyright 2009. C-IDEA, The University of Oklahoma.
Method
Participants The data for this study was obtained from student records of 6,812 FTF (93% Hispanic, 59% Female) after they had completed their first fall semester at The University of Texas at Brownsville and Texas Southmost College (UTB/TSC). Data from each fall semester between 2005 and 2008 were included in the study. Design and Procedure Research was taken from the 6,812 official student records of FTF who entered UTB/TSC during the fall semester from 2005 to 2008. The total sample was divided into two groups on the basis of whether or not they had entered college with DE credits. When combined over four years, 4,482 freshmen entered UTB/TSC with no DE credits (NDE), and 2,330 entered with DE credits (DE). These two groups were compared on all dependent measures, which are college readiness, semester enrollment hours, semester grade point average (GPA), and retention. College readiness was defined according to whether or not a student was required to take a developmental education course. Students were considered college ready if they were not required to take a developmental course. Semester credit hours included the number of credit hours a student was enrolled in the fall semester and semester GPA was based on a 4.0 scale. Retention was defined according to whether or not a student returned to the institution the following year.
Results
Data were analyzed by comparing DE and NDE groups on the following dependent measures: college readiness, semester credit hours enrolled, semester GPA, and retention. An alpha level of .05 was set for all analyses. The results are summarized in Table 2. Overall, the proportion of FTF who have DE credits entering UTB/TSC has been steadily increasing over the past four years. Only 14 percent of the fall 2005 incoming freshman at UTB/TSC entered with DE credits compared to 52 percent in the fall 2008 semester. This shows that an increasing number of students with DE credits are entering college.
Across all semesters, and when the data across semesters are combined, the proportion of students who were college ready was significantly higher for DE students than NDE students. Chi-square analyses were performed examining the proportion of students who were and who were not college ready as a function of DE status (DE vs. NDE). As can be seen in Table 2, a larger proportion of students who entered with DE credits were college ready compared to their peers who had no DE credits (all p < .001). In addition, DE students enrolled in a greater number of semester credit hours than their NDE peers. Due to unequal variances between groups, independent measures t-tests assuming unequal variances were performed for each fall semester separately and when data across semesters was aggregated. As can be seen in Table 2, t-tests revealed significant differences between DE and NDE groups in terms of the average number of semester hours enrolled across all semesters (all t > 6, p < .001) and when semesters were aggregated. The difference between DE and NDE groups yielded medium effect sizes (Cohen, 1988). According to Cohen, a medium effect size is one that produces a .2 to .8 difference between groups in units of standard deviation.
The findings regarding GPA were mixed (see Table 2). When the data from all semesters was combined, an independent measures t-test assuming unequal variance revealed a significant difference between DE and NDE students, t = 4.48, p < .001, d = .11. Overall, students with DE credit earned higher GPAs than NDE students. However, as can be seen in Table 2, there were no significant differences
224
Proceedings of the 5th Annual National Symposium on Student Retention. Copyright 2009. C-IDEA, The University of Oklahoma.
between DE and NDE groups during the fall 2006 and 2007 semesters. The largest impact of DE was observed during the fall 2005 semester. It should also be noted that the effect sizes associated with having DE credits is small to negligible, with the exception of fall 2005.
With respect to retention, DE students were more likely to return to college during the following year relative to NDE students. Chi-square analyses on the proportion of students who returned or who did not return as a function of DE status were significant for each of the semesters tested and when the data were combined across semesters (all p < .001). These results are also summarized in Table 2.
Table 2: UTB/TSC FTF Outcomes
Fall 2005 Fall 2006 Fall 2007 Fall 2008 Overall
Total First-time Freshmen (FTF) NDE 1,415 1,213 995 859 4,482 DE 227 498 667 938 2,330 % DE 14% 29% 40% 52% Percent College Ready NDE 54% 58% 60% 29% 52% DE 83% 79% 76% 70% 75% Chi-square ***64.63 ***64.50 ***48.65 ***294.37 ***335.23 Average Semester Hours Enrolled NDE
11.40 (2.72)
11.15 (2.86)
11.13 (3.16)
11.07 (2.82)
11.21 (2.88)
DE
12.35 (1.76)
12.65 (2.12)
12.30 (2.54)
12.27 (2.42)
12.37 (2.34)
t-test (equal variance not assumed) ***6.90 ***11.97 ***8.36 ***9.63 ***17.88 Cohen's d 0.36 0.56 0.40 0.47 0.43 Average Semester G.P.A. NDE
1.94 (1.18)
2.13 (1.19)
2.00 (1.22) 1.92 (1.18) 2.00 (1.19)
DE
2.36 (1.06)
2.23 (1.07)
2.08 (1.11) 2.06 (1.09) 2.13 (1.09)
t-test (equal variance not assumed) ***5.46 1.74 1.38 *2.47 ***4.48 Cohen's d 0.36 0.09 0.07 0.12 0.11 Percent Retention After One Year NDE 61% 59% 49% N/A 57% DE 75% 73% 59% N/A 66% Chi-square ***16.98 ***27.84 ***14.85 ***36.91 Note. Numbers in parentheses are standard deviations. NDE = no DE credits prior to entering college. DE = entered with DE credits. *p < .05 ***p < .001.
225
Proceedings of the 5th Annual National Symposium on Student Retention. Copyright 2009. C-IDEA, The University of Oklahoma.
Discussion
The literature and this study contribute to the knowledge and research regarding Hispanic student outcomes as they relate to first-time-freshmen (FTF) outcomes and participation in DE. The findings support the position of continued expansion of accelerated learning programs, and in particular DE, as a vehicle to provide access and a competitive advantage to Hispanic students pursuing higher education.
The issue of access to higher education for traditionally underrepresented groups is being addressed in a positive way by the rapidly increasing number of Hispanic students enrolled in DE at UTB/TSC. The eagerness on the part of students and families to embrace this opportunity speaks to the need for value and cost effectiveness that traditional college enrollment lacks. With cost remaining a central issue regarding access to higher education by Hispanic students, it is clear that the design of DE hastens progress towards Texas Closing the Gaps targets. Perhaps the most visibly beneficial advantage of the program is the cost-savings to the thousands of families who would otherwise struggle to cover college educational expenses. When DE programs are designed at no cost to the student, with the institution waiving tuition and fees, and the school districts financially covering other academic support needs such as texts and tests, a crucial access barrier is eliminated. The maximization of resources by educators at both the secondary and postsecondary level helps to curb the “revolving door” of first-year college drop-outs and stop-outs.
Findings indicating the advantage DE students hold over NDE students during their first year of college underscores Adelman’s finding that indicate that completion of at least 20 college credit hours in the first college year increases persistence. Furthermore, findings demonstrating that DE students are more likely to begin their first year college ready in comparison to their NDE peers has positive implications on how DE programs can maximize college resources by reducing the number of students required to enroll in developmental education courses. Bypassing developmental education decreases a student’s time to degree, an important measure of student success.
For practitioners, success of the program and the goal of increasing access to underrepresented groups depend upon eliminating or greatly reducing college costs to DE participants. UTB/TSC has had positive experiences and benefitted by strengthened partnerships with local school districts. Some of the positive results of these collaborations include embracing identified high school teachers with the appropriate higher education credentials into the community of faculty adjuncts at the university. They participate in all required training courses as other adjunct faculty, have access to the same instructional support resources, and collaborate extensively with their on-campus colleagues about curriculum and assessment of course and learning objectives. Support of the faculty in the high schools is central to ensuring an effective program that adequately and appropriately prepares students for the rigor of college courses. Dual Enrollment at UTB/TSC has truly become an “on-ramp” to postsecondary education for South Texas students and their families.
Findings suggest that in addition to unprecedented access that DE programs provide to high school students, participants appear to learn how to learn well before they graduate from high school. They appear to become accustomed to the rigor of college courses and more committed to the opportunities that college credentials will bring them. The lessons they learn early as DE students seem to positively impact their behavior, and subsequently their progress during their first year in college.
The publication, “On-Ramp to College,” Hoffman, Vargas, and Santos (2008) notes that, “new
research provides early evidence that dual enrollment programs can help students complete college faster and improve their college performance” (p.7). Dual Enrollment gives students incentives to stay in high school and the academic and social skills to ultimately matriculate successfully to postsecondary education. It also serves as a catalyst to ensure collaboration and curriculum alignment between
226
Proceedings of the 5th Annual National Symposium on Student Retention. Copyright 2009. C-IDEA, The University of Oklahoma.
UTB/TSC and partner high schools. Dual Enrollment is a cost effective and successful pathway for improving student learning outcomes and for creating a college-going culture in South Texas. It is expected that the low educational achievement and high poverty rate will be improved by students who will break the cycle by graduating from college and attaining jobs that will add value to South Texas. UTB/TSC is committed to continuing to provide quality dual enrollment opportunities for South Texas students and their families. References
Adelman, C. (1999). Answers in the Toolbox: Academic intensity, attendance patterns and bachelor’s degree attainment. Washington, DC: US Department of Education. Adelman, C. (2004). Principal Indicators of Student Academic Histories in Postsecondary Education,
1972-2000. Washington, DC: US Department of Education, Institute for Education Sciences. Clark, R. W. (2001). Dual credit: A report of programs and policies that offer high school students
college credits. Washington, DC: Pew Charitable Trust. Cohen, J. (1988). Statistical power analysis for behavioral sciences (2nd ed.). New York: Academic Press. Fry, R. & Gonzales, F (2008, August). One in five and growing fast: A profile of Hispanic public school
students. Washington, DC: Pew Hispanic Center. Hispanic college enrollment up in Texas; participation rate lags. (2007, July 19). The Dallas Morning
News. Retrieved July 26, 2009, from http://dallasnews.com Hoffman, N. (2005, April). Add and subtract: Dual enrollment as a state strategy to increase
postsecondary success for underrepresented students. Boston, MA: Jobs for the Future Foundation
Hoffman, N. & Robins, A. (2005, June). Head start on college: Dual enrollment strategies in New England 2004-2005. Boston, MA: Jobs for the Future Foundation.
Hoffman, N., Vargas, J., & Santos, J. (2008, May). On ramp to college: A state policymaker’s guide to dual enrollment. Boston, MA: Jobs for the Future Foundation.
Karp, M. M., Calcagno, J. C., Hughes, K. L., Jeong, D. W. & Bailey, T. R. (2007). The postsecondary achievement of participants in dual enrollment: An analysis of student outcomes for two states. (National Center for Career and Technical Education grant No. V051A990006) University of MN: St. Paul, MN.
Martinez, M. & Klopott, S. (2005). How is school reform tied to increasing college access and success for low-income and minority youth? Washington, DC: Pathways to College Network.
Reindl, T. (2006). Postcards from the margin: A national dialogue on accelerated learning. Boston, MA: Jobs for the Future Foundation.
227
Proceedings of the 5th Annual National Symposium on Student Retention. Copyright 2009. C-IDEA, The University of Oklahoma.
The Benefits of Dual Enrollment – Graduation Advantages
Abstract - The purpose of this study was to assess the impact of acceleration (dual enrollment) on college graduation at the associate degree level. Over 9,200 student records from 1996 to 2006 at North Iowa Area Community College were analyzed in a multivariate logistics regression model. Full and nested models were tested providing evidence that Acceleration significantly predicts graduation. Holding all other independent variables constant the odds that an accelerated student graduates compared to a non-accelerated student is about 61% greater than the odds of a non-accelerated student graduating. At the 95% level of confidence degree attainment for accelerated students ranges from a minimum of 43% greater than to at most 81% greater than the odds of a non-accelerated student graduating. Acceleration improves graduation probabilities (total effects) and marginal effects for students across all identified percentile ranges. For accelerated 75th percentile females their estimated graduation probability is nearly 78%. Male student outcomes do not equal female graduation outcomes but acceleration improves male student graduation probabilities. The effect of other covariates (high school GPA, first term credits, first term GPA and gender) on college graduation is also examined. Policy implications to address national strategic issues are provided at the conclusion of the study.
Introduction
The need for a well-educated, technically proficient workforce in a knowledge-based economy is fueling the call for significant improvements in college graduation rates. Although more students today begin college than 20 years ago, greater proportions are not graduating. Nationally, for every 100 9th-grade students, 68 graduate from high school, 40 immediately enter college, 27 are still enrolled in their sophomore year and only18 graduate within 150% time with either an associate’s or bachelor’s degree (NCHEMS 2002). Transition challenges from high school to college cause far too many students to either not choose to attend college or dropout of high school or college. This loss of human capital places the United States in a global competitive disadvantage (Council on Competitiveness 2006). Other countries have surpassed the U.S. in college attainment rates (OECD 2008). In response to this issue President Obama (2009) has established a strategic goal of putting the United States atop all countries in college-completion rates by 2020.
Many strategies will be needed to significantly improve college graduation rates. A growing body of research documents the benefits of dual enrollment as a strategy to improve graduation rates. According to the U.S. Department of Education (2004) college credits earned prior to high school graduation reduce the average time-to-degree and increase the likelihood of graduation for the students who participate in these programs. Utilizing a national database Swanson (2008) provides evidence that dual enrollment participation plays a major role in persistence and actual degree attainment if students entered college within seven months of high school graduation.
Morrison (2007A) summarizes over 20 studies associated with positive educational outcomes of dual enrollment. Dual enrollment was found to be positively related to students’ likelihood of earning a high school diploma, enrollment in college, persistence in college, higher grade point averages, earning more postsecondary credits, pursuing a baccalaureate degree, higher four-year graduation rates, increased
228
Proceedings of the 5th Annual National Symposium on Student Retention. Copyright 2009. C-IDEA, The University of Oklahoma.
confidence in math and writing skills, winning college admission and scholarships at rates that far exceeded those in their socioeconomic group, increased educational aspirations and increased satisfaction with their experience. Siegelman and Otto (2008) found dual enrollment saved Iowa $21.7 million in state general aid and $30.7 million in savings for families in future college-related expenses.
Purpose of Study and Research Hypotheses
The major purpose of this study is to assess the effect of dual enrollment, hereinafter referred to as acceleration, on associate degree college graduation, controlling for other important covariates. The other covariates in this multivariate study known to influence college graduation are high school GPA, number of first term credits (a proxy for commitment to degree attainment) and first term GPA. We test full and nested models to determine if Acceleration is a significant predictor of graduation. In addition, the following null and research hypotheses are tested:
H0 - Accelerated and non-accelerated students have equal odds for attaining a college degree, controlling for other important predictor variables.
H1 - Accelerated and non-accelerated students do not have equal odds for attaining a college degree, controlling for other important predictor variables.
Data and Methodology
The data for this study was obtained from an analysis of 9,233 student records from 1996 to 2006 at North Iowa Area Community College (NIACC). The sample split for students who participated and who did not participate in NIACC’s acceleration program is depicted in Table 1.
Table 1: Sample Split Group N Percent Non-Accelerated 7,417 80.33% Accelerated 1,816 19.67% Total 9,233 100.00%
For each student the following variables were collected as depicted in Table 2.
Table 2: Variable Names, Description and Coding
Variable Name Description Coding
Graduation (Dependent variable)
Identifies students who had successfully completed all degree requirements for graduation
Dummy coded: 1 = Graduated with an associate degree 0 = Did not graduate with an associate degree
Acceleration Identifies accelerated vs. non-accelerated students
Dummy coded: 1 - for accelerated student 0 - not an accelerated student
High School GPA Students high school grade point Reported from high school
First Term Credits College credits earned once fully matriculated at NIACC Semester hour credits
First Term GPA First term credits at NIACC (not while in high school)
First term earned GPA from NIACC transcript
Gender Gender
Dummy coded: 1 = Female 0 = Male
229
Proceedings of the 5th Annual National Symposium on Student Retention. Copyright 2009. C-IDEA, The University of Oklahoma.
Table 3 depicts descriptive statistics for accelerated and non-accelerated students.
Table 3: Descriptive Statistics High
School GPA
First Term
Credits
First Term GPA
Gender
Acceleration
Graduation N of Cases 9,233 9,233 9,233 9,233 9,233 9,233 Minimum 0.240 1.000 0.000 0.000 0.000 0.000 Maximum 4.000 29.000 4.000 1.000 1.000 1.000 Mean 2.764 11.727 2.363 0.518 0.197 0.441 SD 0.620 4.527 1.081 0.500 0.398 0.497
Statistical Methodology
As the dependent variable, Graduation, is a binary categorical variable and because we are interested in controlling for important variables that impact the odds of college graduation the analytical tool of choice is logistic regression. Logistic regression is “the most important model for categorical response data” (Agresti 2002). Logistic regression applies maximum likelihood estimation after transforming the dependent into a logit variable (the natural log of the odds of the dependent variable, graduation, occurring or not). In this way, logistic regression estimates the probability of graduation occurring, controlling for other important predictor variables.
The specified logit model has five predictors of college graduation: High School GPA, First Term Credits, First Term GPA, Gender and Acceleration. The logistics model is formally expressed as follows, Formula 1:
Error Z p-value Lower Upper Constant -4.226 0.134 -31.63 0.000 -4.487 -3.964 High School GPA 0.359 0.044 8.169 0.000 0.273 0.445 First Term Credits 0.083 0.006 14.91 0.000 0.072 0.093 First Term GPA 0.726 0.028 26.24 0.000 0.672 0.780 Gender - Female 0.289 0.048 6.04 0.000 0.195 0.383 Acceleration – Yes (1) 0.477 0.061 7.84 0.000 0.358 0.596 Likelihood-ratio (LR) = 1754.24; df = 5; p = .000; Naglekerke's R-square = 0.232
Model Interpretation The logit model is statistically significant. The reported likelihood-ratio (LR) tests that Graduation is
jointly independent of the predictors simultaneously; Ho: β1 = β2 = β3 = β4 = β5 = 0. The LR test statistic of 1754.24 is chi-squared with 5 degrees of freedom and a p-value of 0.000. This demonstrates strong evidence that at least one predictor has an effect on Graduation. Nagelkerke's R-square is an attempt to
230
Proceedings of the 5th Annual National Symposium on Student Retention. Copyright 2009. C-IDEA, The University of Oklahoma.
imitate the interpretation of multiple OLS R-square based on the likelihood. Nagelkerke's R-square can vary from 0 to 1. Twenty-three percent of the variance in Graduation is accounted for by the combined influence of five predictor variables.
Given one of the primary purposes of logistic regression is to generate an equation that can reliably classify observations into one or two outcomes we checked the model’s predictive ability through a graphical means, the ROC (Receiver Operating Characteristic) curve. The larger the area below the curve the better the model; that is, the better the predictions (Agresti 2002). The area under the ROC curve is 0.743, which is identical to another measure of predictive power, the concordance index, c. The concordance index estimates the probability that the predictions and outcomes are concordant. Values of 0.5 means predictions are no better than random guessing. Testing Full and Nested Models: Models with and without Acceleration as a Predictor
The LR test in Table 4 assesses the overall logistic model but it does not tell us if Acceleration should be part of the model. This is a key question for this study. The answer can be found by conducting a chi-square difference test of the overall model (the one we just tested) with a nested model which drops Acceleration as a predictor. Using this strategy we can test if the logistic regression coefficient for the dropped variable can be treated as 0, thereby justifying dropping Acceleration from the model. A non-significant likelihood ratio test indicates no difference between the full and the nested models, hence justifying dropping Acceleration to produce a more parsimonious model that works just as well.
To test whether Acceleration contributes significantly to the model we conducted a chi-square
difference test to compare the maximized log-likelihood, L1, for the full model to the maximized log-likelihood, L0, for the simpler model without Acceleration. The test statistic -2(L0 - L1) = 123.96 with 1 df, the difference between the numbers of parameters in the two models. The chi-squared p-value of 0.000 provides evidence that Acceleration does matter significantly in predicting Graduation. Interpretation of Coefficients
Given the above outcome we are more confident to interpret the coefficients in the full model. Table 4 indicates that all five predictors are significant (p = 0.000 for all five predictors). Nevertheless, it is known that logistic coefficients may be found to be significant when the corresponding correlation is found to be not significant, and vice versa. To make certain statements about the significance of an independent variable, both the correlation and the logistic coefficient should be significant. This additional test was completed, confirming p = 0.000 for the five predictors.
All coefficients are large relative to their standard errors and therefore appear to be important predictors of Graduation. However, the interpretation of the coefficients is quite different from ordinary least squares The logistic coefficient indicates how much the logit increases for a unit of change in the independent variable, but the probability of a 0 or 1 outcome is a nonlinear function of the logit. It is, therefore, more useful to turn to an evaluation of “odds ratios”.
Odds ratios provide a more intuitive and meaningful understanding of the impact of each predictor on
Graduation. Table 5 reports odds ratio estimates for each of the five predictor variables as well as their standard errors and confidence intervals. As we are interested primarily in the effect of Acceleration on Graduation we will begin with its impact.
Table 5: Odds Ratio Estimates 95 % Confidence
Interval Parameter Odds Ratio
Standard Error Lower Upper
231
Proceedings of the 5th Annual National Symposium on Student Retention. Copyright 2009. C-IDEA, The University of Oklahoma.
High School GPA 1.432 0.063 1.314 1.561 First Term Credits 1.086 0.006 1.074 1.098 First Term GPA 2.067 0.057 1.958 2.182 Gender - Female 1.335 0.064 1.216 1.466 Acceleration - Yes 1.611 0.098 1.430 1.815
Acceleration
Holding all other independent variables constant, the estimated odds that an accelerated student graduates with a degree compared to a non-accelerated student is 1.61 times (about 61% greater than) the odds of a non-accelerated student graduating. We may say that in comparing accelerated with non-accelerated students, the odds that Graduation occurs increases by a factor of 61%, when all the other variables are controlled.
Statistical significance of Acceleration has already been established but “confidence intervals are more informative than tests” (Agresti 2002). Table 5 provides confidence intervals for each predictor variable. At the 95% level of confidence degree attainment for accelerated students ranges from a minimum 1.43 times (43% greater than) to at most 1.81 times (81% greater than) the odds of a non-accelerated student graduating.
Interpretation of the Other Predictors of Graduation
The logit model posits four additional predictors that impact college graduation. In this section we will briefly summarize their important effects.
High School GPA. The logit coefficient for “High School GPA” is 0.359. The estimated odds ratio between High School GPA and College Graduation equals exp(0.359) = 1.432, the same value found in Table 5. A one unit increase in High School GPA, holding all other variables constant, improves the student’s odds for graduation by 43%. We may say that when High School GPA increases one unit, the odds that Graduation = 1 increases by a factor of 43%, when all other variables are controlled.
First Term Credits. With a logit coefficient of 0.083 the odds ratio for “First Term Credits” is exp(0.083) = 1.086, signifying that each unit increase in “First Term Credits” produces a multiplicative 8.6% increase in the odds to graduate, holding constant all other variables.
First Term GPA. A 0.726 “First Term GPA” logit coefficient produces an odds ratio equal to 2.07. A one unit increase in First Term GPA more than doubles the odds of graduation, holding constant all other variables. In terms of impact “First Term GPA” has the greatest influence on predicting Graduation. Acceleration is the second most important variable.
Gender. The exponentiated difference between males and females is an odds ratio comparing graduation outcomes. The difference between males and females is a 0.289 logit coefficient. With all other predictors held constant, the estimated odds that a female will graduate is exp(0.289) = 1.335 (about 34% greater than) the odds of a male student graduating.
Total and Marginal Effects of Acceleration on Graduation
We can gain further understanding of the dynamics of acceleration on graduation odds and probabilities for graduation if we set continuous variable inputs (High School GPA, First Term Credits and First Term GPA) to their 25th, 50th and 75th percentile levels and then estimate a series of logits, odds
232
Proceedings of the 5th Annual National Symposium on Student Retention. Copyright 2009. C-IDEA, The University of Oklahoma.
ratios and probabilities for accelerated and non-accelerated students. Descriptive statistics for the percentiles associated with continuous variables in the logit model are summarized below in Table 6.
Table 6: Percentiles for Continuous Variables in the Logit Model
Percentile High School
GPA First Term Credits First Term GPA 25th Percentile (Lower) 2.29 3 1.78 50th Percentile (Middle) 2.74 10 2.62 75th Percentile 3.21 14 3.31
We refer to the 25th percentile as the lower percentile, the 50th percentile as the middle percentile and
the 75th percentile as the 75th percentile. Table 6 percentile statistics were then entered into the logit model (Formula 1) for accelerated/non-accelerated males and females. Using this methodology (Agresti 2002) we can drill down to answer some important questions. For example, what are the effects of acceleration on graduation for male and female students who possess lower quartile inputs (high school GPA, first term credits and first term GPA)? Do acceleration effects differ for male and female students who possess middle or 75th percentile characteristics? Are acceleration effects uniform for male and female students who possess similar input characteristics? The results of this methodology are depicted in Table 7, depicting total and marginal effects of acceleration on graduation outcomes.
Table 7: Estimated Graduation Probabilities and Marginal Effects for Students When Continuous Variable Predictors Are Set at Their Percentile Levels
Accelerated Non-Accelerated
Gender: Female
Logit
Probability
Logit
Probability Marginal Effect of Acceleration
Lower Percentile on All Predictors -1.10 25.04% -1.57 17.17% 7.87% Middle Percentile on All Predictors 0.26 56.38% -0.22 44.51% 11.87% 75th Percentile on All Predictors 1.26 77.86% 0.78 68.58% 9.28%
Gender: Male Lower Percentile on All Predictors -2.65 6.57% -3.13 4.18% 2.39% Middle Percentile on All Predictors -0.97 27.49% -1.45 19.04% 8.45% 75th Percentile on All Predictors 0.12 53.08% -0.35 41.25% 11.83%
Graduation probabilities and marginal effects of acceleration in the above table are more easily
interpreted by presenting the probability data in Graphs 1 and 2. (It’s important to realize that Graphs 1 and 2 are not logistic curves. They are graphical representations of the data in Table 7.)
233
Proceedings of the 5th Annual National Symposium on Student Retention. Copyright 2009. C-IDEA, The University of Oklahoma.
Graph 1: Estimated Graduation Probabilities for Accelerated and Non-Accelerated Male and Female Students by Percentile Inputs:
A Graphical Summary of Table 7 Probability Data
Graph 2: Estimated Marginal Effects for Accelerated and
Non-Accelerated Male and Female Students by Percentile Inputs: A Graphical Summary of Table 7 Probability Data
Table 7, Graph 1 and 2 demonstrate that acceleration improves graduation probabilities and
associated marginal effects for both male and female students across the identified percentile ranges. Female accelerated students experienced the highest graduation probabilities (total effects) and the greatest change in marginal effects for lower and middle percentile students. For accelerated 75th percentile females their estimated graduation probability is nearly 78%. Non-accelerated females with the same inputs experienced a lower graduation probability, 68%. The marginal effect of acceleration versus non-acceleration for 75th percentile females is 77.86% - 68.58% = 9.28%. Thus, 75th percentile females who participated in an accelerated program experienced a 9.28% favorable change in graduation probability compared to their peers who did not participate in an accelerated program. Accelerated middle percentile females and 75th percentile males experienced the greatest marginal effects, nearly 12% in both cases. Accelerated lower percentile males experienced the lowest marginal effects (2.39%).
It is clear that students with lower input characteristics have lower probabilities to graduate compared to their counterparts who enjoy higher input characteristics. This occurs for both accelerated and non-accelerated students. Lower percentile, non-accelerated males experienced the lowest probability for graduation, 4.18%. Acceleration improves their chances for graduation to 6.57%, yielding the lowest marginal effect, 2.39%.
234
Proceedings of the 5th Annual National Symposium on Student Retention. Copyright 2009. C-IDEA, The University of Oklahoma.
For 75th percentile accelerated males the estimated probability for graduation is 53.08%. On the other hand, non-accelerated 75th percentile males experienced a 41.25% graduation probability. This gain is one of the highest marginal changes observed as a result of acceleration. Accelerated middle percentile females experienced a slightly higher marginal effect, 11.87%.
An interesting observation gained in Graph 1 is the marginal effect of acceleration for 75th percentile males exceeds the marginal effect of acceleration for 75th percentile females.
Conclusion
This study demonstrates that acceleration, commonly referred to as dual enrollment in the literature, has important and significant effects on educational attainment. Specifically the major findings are: 1. Holding all other independent variables constant, the estimated odds that an accelerated student
graduates with a degree compared to a non-accelerated student is 1.61 times (about 61% greater than) the odds of a non-accelerated student graduating. At the 95% level of confidence degree attainment for accelerated students ranges from a minimum 1.43 times (43% greater than) to at most 1.81 times (81% greater than) the odds of a non-accelerated student graduating.
2. Acceleration improves graduation probabilities and associated marginal effects for students across
entire percentile ranges. Female accelerated students experienced the highest graduation probabilities (total effects) and the greatest change in marginal effects for lower and middle percentile students. For accelerated 75th percentile females their estimated graduation probability is nearly 78%. Non-accelerated females with the same inputs experienced a lower graduation probability, 68%. Accelerated middle percentile females and 75th percentile males experienced the greatest marginal effects, nearly 12% in both cases. The marginal effect of acceleration for 75th percentile males exceeds the marginal effect of acceleration for 75th percentile females.
3. A one unit increase in “High School GPA,” holding all other variables constant, improves the
student’s odds for graduation by 43%. 4. Each unit increase in “First Term Credits” produces a multiplicative 8.6% increase in the odds to
graduate, holding constant all other variables. 5. A one unit increase in “First Term GPA” more than doubles the odds of graduation, holding constant
all other variables. In terms of impact “First Term GPA” has the greatest influence on predicting Graduation. Acceleration is the second most important variable.
6. Gender is also an important predictor of degree attainment. With all other variables held constant, the
estimated odds that a female will graduate is about 34% greater than the odds of a male student graduating.
Policy Implications
Morrison (2007B) summarizes policy recommendations associated with dual enrollment from national commissions, think tanks, state organizations, and noted experts. This literature and this study, taken together as a whole, now come together to inform policymakers for future action. Collectively, the body of research on acceleration supports the following policy recommendations:
235
Proceedings of the 5th Annual National Symposium on Student Retention. Copyright 2009. C-IDEA, The University of Oklahoma.
1. Expand Accelerated Opportunities. While accelerated programs have grown in numbers they remain prototypes and are not sufficiently scaled up to reach larger numbers of high school students who could benefit from the expansion. Policymakers should provide high schools and their college partners incentives for developing and implementing systemic accelerated programs. Policymakers should assure that each high school offers a minimum number of accelerated credits prior to high school graduation.
2. Connect Acceleration to Workforce Development. Career-technical education (CTE) programs,
requiring expensive advanced technology, often require the development and deployment of regional academies, leveraging the assets of community colleges and regional high schools. These CTE regional academies can serve as the backbone for workforce preparation and adult education re-training centers. Policymakers should provide incentives and funding for the creation and deployment of accelerated regional academies.
3. Connect Acceleration to Competitiveness Agenda. Accelerated program strategies should be
connected to the nation’s competitiveness agenda, including economic development initiatives. Human capital development is the engine for success in a competitive, global economy. Over the decades, we have faced major changes in our economy; we have moved from an agricultural to an industrial economy, then to a post-industrial service economy, and now one based on information age technology. Education has been the key to our competitive advantage and long-term survival as the leader in the world economy. Education has enabled us to invent, to innovate and/or to increase productivity through major shifts in the structure of our economy. It’s the old social-Darwinists adage – adapt or die. To thrive we have had to be smarter and more productive. Education has always stood and still stands as the necessary pre-requisite for 1) invention, 2) innovation and 3) an adaptable and flexible workforce. Acceleration signals an adaptive and innovative response to the changing world economy.
4. Assure Seamless Transition. To increase successful student transition from one level of education to
the next policymakers should assure that high school, community and four-year college curricula are aligned and integrated. Professional development opportunities for faculty and staff at all levels of the educational pipeline need to be integrated. Accelerated credits should readily be accepted for meeting two and four-year college graduation requirements.
5. Improve Readiness. Appropriate counseling and planning for successful experiences in accelerated
programs must begin in eighth grade. All eighth grade students should complete a career and college plan outlining prerequisite courses for a successful outcome. Progress needs to be appropriately monitored and intervention strategies need to be developed and implemented.
Acceleration holds great promise as a strategic initiative to improve access and educational attainment for both traditional and underserved populations.
Limitations As this study’s database was limited to students attending North Iowa Area Community College the conclusions from this study may not be generalized to the total population.
236
Proceedings of the 5th Annual National Symposium on Student Retention. Copyright 2009. C-IDEA, The University of Oklahoma.
References Agresti, A. (2002). Categorical data analysis (2nd ed.). Hoboken, New Jersey. John Wiley & Sons, Inc. Council on Competitiveness (2006). Competitiveness index. Washington D.C. Morrison, M. C. (2007A). Dual enrollment - what does the research say? Retrieved May 1, 2009 from
http://www.niacc.cc.ia.us/admin/pres/Presentations/Dual_Credit/Dual Credit - What Does the Research Say.pdf
Morrison, M. C. (2007B). Dual enrollment recommendations from national commissions, think tanks, state organizations, and noted experts. Retrieved May 1, 2009 from http://www.niacc.cc.ia.us/admin/pres/Presentations/Dual_Credit/Dual Enrollment Recommendations.pdf
National Center for Higher Education Management Systems (2002). Student pipeline data and calculations by state. Boulder, CO: NCHEMS.
Obama, B. (2009). Remarks by the President on higher education. Washington DC. The White House.
Retrieved May 1, 2009 from http://www.whitehouse.gov/the_press_office/Remarks-by-the-President-on-Higher-Education/
Organisation for Economic Development (2008). Education at a glance. Paris, France: OECD.
Siegelman, H., & Otto D. (2008). The economic impact of early college opportunity programs at Iowa’s community colleges. Des Moines, IA: Strategic Economics Group.
Swanson, J. (2008). An analysis of the impact of high school dual enrollment course participation on post-secondary academic success, persistence and degree completion. Paper presented at the meeting of the National Association for Gifted Children, Tampa, FL and the National Alliance of Concurrent Enrollment Partnerships, Kansas City, MO.
U.S. Department of Education (2004). Principal indicators of student academic histories in
postsecondary education 1972-2000. Washington, D.C.: U.S. Government Printing Office.
237
Proceedings of the 5th Annual National Symposium on Student Retention. Copyright 2009. C-IDEA, The University of Oklahoma.
Opportunity and Action to Stay in School (OASIS): A First Year Student Retention Mentoring Program
Joy Himmel Jamie Pyo Linda Strauss Pennsylvania State University Pennsylvania State University Pennsylvania State University
Abstract – The Opportunity and Action to Stay in School (OASIS) program, is a mentoring program for second semester freshmen at Penn State Altoona who have a GPA lower than 2.0 at the end of their first semester. Through weekly meetings, the faculty/staff mentors work with the students to identify areas of concern, goals, and provide overall support and guidance. The objectives of this program focus on academic, emotional and behavioral assessment, goal development, and utilization of resources. Student progress is measured by fall and spring GPA and pre and post Learning and Study Strategies Inventory (LASSI) scores. LASSI is an assessment tool designed to measure student’s use of learning and study strategies. Among participants, GPA and LASSI scores significantly increased by 0.6305 and 52.68 points on average, respectively, after they finished the program. Control group students did not statistically improve their grades. When we look at retention to the sophomore year, 87.5% of OASIS students returned in comparison to 60.8% of non-participants who were program eligible.
Introduction
The idea that a new and inexperienced person can gain powerful benefits from learning the ropes from a more experienced person is not new. However, it has only been since the 1970s that professional literature has given mentoring increasing attention in the fields of business, psychology, and education. A growing body of literature attests to the importance of mentoring in education (e.g., Campbell & Campbell, 1997; Kelly & Schweitzer, 1999; Pope, 2002). Trapanier-Street (2004) suggests a mentoring relationship between a teacher and a child could have numerous life-changing benefits for both the child and teacher. Through the mentoring relationship, at-risk children can come to see themselves as capable, competent, and empowered problem solvers who can construct their own knowledge and realize their learning goals. The literature, faculty, and students themselves agree that mentoring is a valuable component of the education experience.
Looking closer at the concept of mentor in the literature reveals some problems. Jacobi (1991) found the lack of a widely accepted operational definition of mentoring to be problematic. Indeed the research offers numerous definitions of mentoring, which at times can make the research appear to be about several different types and qualities of interpersonal relationships. In addition, both formal and informal mentoring programs vary widely across college campuses, so most results lack clarity about what works and what doesn’t.
A second area of concern is the lack of strong research designs evaluating the link between mentoring and academic success. Most of the research relies on self-report measures in a retrospective, correlational design with the data gathered at a single point in time (Jacobi, 1991). In addition, in most published articles outcome measures relating to retention and academic success of at-risk ethnic minority students have not been included despite the fact that most mentoring programs are designed with this goal in mind. Cosgrove (1986) reviewed a formal mentoring program which showed the effect of mentoring on satisfaction with university environment and developmental gains. Mentored students were compared to a control group; however there was no assessment of program effects on academic performance.
In addition to problems with operational definitions the literature is also divided about the importance of matching students with mentors of the same gender or ethnicity. Campbell and Campbell
238
Proceedings of the 5th Annual National Symposium on Student Retention. Copyright 2009. C-IDEA, The University of Oklahoma.
(2007) found that matching mentors and students on the basis of gender produced no statistically significant differences. In fact, data showed that the students who were gender matched completed fewer credits, had lower GPAs, graduated at a lower rate, and fewer continued on to graduate programs on campus. Campbell and Campbell (1997) found that academic success and retention rates were unrelated to the gender of the mentor, the mentee, or the matched pair. However, Moman (2002) found an interaction effect between gender and mentoring treatment to be significant on grade point averages. In developing a mentoring program for women it is suggested that success depends on appropriate matching of mentors and mentees (Putsche, Storrs, Lewis, & Haylett, 2008).
Research on mentoring has not been driven or dominated by theory, rather efforts have centered on the forms that mentoring might take and what some of the correlates and consequences are of these different forms of mentoring (Campbell & Campbell, 1997). Various definitions for mentoring or mentors exist in the literature despite efforts on the part of researchers to provide concise definitions in an effort to communicate more precisely with each other. Jacobi (1991) identified 15 functions or roles that have been ascribed to mentors in the literature. These functions include: acceptance/support/encouragement, advice/guidance, bypass bureaucracy/access to resources, challenge/opportunity/”plum assignments, clarify values/clarify goals, coaching, information, protection, role model, social status/reflected credit, socialization/“host and guide”, sponsorship/advocacy, stimulate acquisition of knowledge, training/instruction, and visibility/exposure. From various factor analyses these 15 diverse functions reflect three components of the mentoring relationship: (a) emotional and psychological support, (b) direct assistance with career and professional development, and (c) role modeling.
More recently Nora and Crisp (2007) have identified four major domains or latent constructs in the literature as compromising mentoring, despite the absence of a comprehensive theory. The four latent constructs include: 1) psychological or emotional support, 2) support for setting goals and choosing a career path, 3) academic subject knowledge support aimed at advancing a student’s knowledge relevant to their chosen field, and 4) specification of a role model. They used survey data to determine how each of these constructs is perceived by mentored students. The results indicated mentoring must include a sense of support system, emphasis on goal setting, and the identification and development of strategies to assist students in reaching that goal.
Although mentoring programs come in many different shapes and sizes some research has been done suggesting characteristics of good mentoring. Cramer and Prentice-Dunn (2007) found that good mentors are available for face-to-face interaction, knowledgeable about the variety of issues college students face and appropriate referral sources, educated and aware of diversity issues, ability to show empathy, are personable meaning they model the appropriate level of self-disclosure, encourage and support their mentees, and have passion for their field and their mentee. In addition, skillful communication has been found to increase positive perception of mentoring (Kerssen-Griep, Trees, & Hess, 2008).
Campbell and Campbell (2007) found that ethnic matching was associated with more semesters of enrollment, more credits completed, higher GPAs, higher graduation rates, and a higher percentage of students entering campus graduate programs. Campbell and Campbell (1997) found ethnicity of the mentee, the mentor, or the matched pair was unrelated to academic achievement.
Student perceptions of academic advising was significantly worse when minority students did not engage in mentoring programs compared to Caucasian and international students who had no mentor (Kelly & Schweitzer, 1999). This indicates the increased need of colleges to reach out and engage minority students with mentoring relationships. Pope (2002) found students of color felt multiple types of mentoring (both formal and informal programs) are important for minority students attending community colleges. The respondents were positive overall in their perceptions, with at least 70% of the respondents stating that each type of mentoring was important.
Despite all the problems with the current body of literature on mentoring most studies indicate it has positive effects on students. Wilson (2005) showed reports from staff indicated mentoring was useful in helping teachers get acquainted with their students, and in generating student requests for help that
239
Proceedings of the 5th Annual National Symposium on Student Retention. Copyright 2009. C-IDEA, The University of Oklahoma.
otherwise may not have been made. Regarding academic performance and retention rates, data demonstrate mentored students had higher GPAs and half of the dropout rate than controls (Campbell & Campbell, 2007). In line with this Kelly and Schweitzer (1999) found graduate students who had either a student or faculty mentor received betters grade and were more likely to receive fellowships or grants as compared to those who had both or neither. Yet another study compared GPAs of mentored students, tutored students, and a control group. The findings indicate GPAs were statistically higher for mentored students. In addition, there was a trend for the dismissal rate of mentored students to be lower (Sorrentino, 2006). It should be noted the mentoring program used here was based on the goal-setting theory of Lock. This theory assumes that people are motivated to complete goals when there is a discrepancy between where they would like to be and their current status. Lastly, a survey of 154 business schools found most students benefited greatly from participating in mentoring activities (Schlee, 2000).
The purpose of this project is to examine whether a second semester intervention program for academically poor performing students helped improve academic performance (GPA) and study skills. Demographic and behavioral variables were also measured to see if these attributes influence any changes in GPA and study skills.
Methods
The Opportunity and Action to Stay in School (OASIS) program, is a mentoring program for second semester freshmen at Penn State Altoona who have a GPA lower than 2.0 at the end of their first semester. The OASIS program’s purpose is to determine whether participants can improve their academic performance related to GPA, study skills, and intention to stay in school through the association and relationship with an adult mentor through the second semester of their first academic year. By design, this association occurs at a critical learning moment, when they discover that they had performed poorly through their first semester at college. First year students were recruited to the program through an invitation letter sent out after the fall semester. Students were also referred to the program through campus departments and academic advising. There were a total of 189 eligible for the program based on semester standing and GPA and 112 elected to participate. Students attended an organizational meeting held during the first week of spring classes, and then were assigned to a designated faculty/staff mentor. Individual charts were compiled for each participating student. The charts included documentation regarding the student’s fall grades, spring schedule, assessment print-outs, educational evaluation results and session monitoring forms.
Students completed four assessment/evaluation tools; the OASIS Application before they participated in OASIS, OASIS Program Evaluation after they participated in OASIS, and the LASSI (Learning and Study Strategies Inventory) before OASIS and after OASIS participation. The OASIS Application and OASIS Program Evaluation are surveys developed by the lead author to measure demographic characteristics and life style behaviors. These surveys consist of 24 items (application), 13 items (evaluation) and 80 items (LASSI), copies of the application and evaluation can be found in appendix A. The LASSI (Weinstein and Palmer, 2002) is an assessment tool designed to measure students’ use of learning and study strategies. LASSI consists of 80 items which create ten different subscales. The subscales include attitude, motivation, time management, anxiety, concentration, information processing, selecting main ideas, study aids, self-testing, and test strategies. Each of the 80 items are answered on a 5 point likert scale from “not at all typical of me” to “very typical of me”.
Faculty/staff mentors were recruited at the end of the fall semester through letter invitation. Mentors participated in a 90 minute group training on principles of mentoring and program structure.
240
Proceedings of the 5th Annual National Symposium on Student Retention. Copyright 2009. C-IDEA, The University of Oklahoma.
Mentors and students also received the OASIS workbook that provided worksheets and information regarding tips on obtaining both academic and personal success. Mentors met with their students’ weekly during the spring semester, established rapport, assisted with self evaluation and goal setting and provided necessary support, guidance, and encouragement, unique to the mentoring relationship. Support and guidance was provided to the mentors throughout the semester. They were also instructed to document their sessions with their students and set regular times/days for sessions. There were 52 mentors comprised of 15 staff and 37 faculty.
Results The analysis examined the changes in students’ GPA’s and LASSI scores from the beginning of the program as compared to the end of the program. Also reported are the comparisons between OASIS participants and OASIS non-participants (those who dropped out of the study). The variables for the study included students’ grade point averages measured at the end of the fall semester and at the end of spring semester. Mentors reported the number of sessions each participant attended. The OASIS instrument asked participants to rate the number of alcohol problems, the amount of alcohol consumption, the frequency of alcohol consumption and their attitudes toward alcohol. These variables are summarized in table 1. Table 1: Descriptive Statistics
Variable N Mean Standard Error Standard Minimum Maximum
Of the Mean Deviation
Frequency of Alcohol Use 49 1.122 0.122 0.86 0.00 3.000
Attitude of Alcohol Use 50 1.220 0.0917 0.65 0.00 2.000
Number of Sessions Attended
92 6.00 0.329 3.152 0.00 14.00
Sum of Alcohol Related Probls.
50 0.440 0.929 0.131 0.00 4.00
Amount of Alcohol Use 49 1.878 0.219 1.536 000 5.00
Difference of GPA 185 0.3611 0.07 0.9441 -1.97 2.67
Difference of Overall LASSI Score
63 52.68 4.92 39.01 -29.00 150.00
Difference of Anxiety Score 63 5.460 0.901 7.152 -10.00 23.00
Difference of Attitude Score 63 1.619 0.499 3.91 -6.00 12.00
Difference of Concentration 63 6.349 0.840 6.668 -4.00 28.00
241
Proceedings of the 5th Annual National Symposium on Student Retention. Copyright 2009. C-IDEA, The University of Oklahoma.
Score
Difference of Information Processing Lvl
63 4.667 0.707 5.614 -12.00 20.00
Difference of Motivation Level
63 5.032 0.630 5.000 -10.00 17.00
Difference of Study Aid Level
63 6.683 0.700 5.559 -8.00 17.00
Difference of Selecting the Main Idea
63 5.254 0.830 6.587 -11.00 18.00
Difference of Self-Testing level
63 5.889 0.568 4.512 -3.00 15
Difference of Time Management Level
63 7.444 0.834 6.621 -7.00 24.00
Difference of Test Strategy Level
63 4.286 0.674 5.347 -10.00 16.00
The data were complied and analyzed using SAS. Paired t tests were used to analyze participant change over time, and an independent sample t test was used to examine the difference in GPA’s between the two groups. The overall and subscale scores from the LASSI are analyzed for OASIS participants. Of specific interest is the impact that attending the sessions had on LASSI outcomes. The results indicate that the amount of sessions participants attend is significantly related to several explanatory variables. Overall LASSI scores increase significantly more for participants who attend 7 or more sessions (a mean difference score of 60.71) than participants who attend fewer than 7 sessions (mean score of 43.11) (t=1.78, p<.10). Participants who attend 7 or more sessions had significantly larger differences in their LASSI attitude scores from fall to spring. Specifically, the mean difference score for higher attending participants is 2.43 versus .44 for those who attended less than 7 times (t=1.89, p<.10). In addition to these significant differences students who participate in 7 or more sessions also have significantly higher difference scores on Selecting the Main Idea and Test Strategy (for SMI, the mean differences are 7.743 vs. 2.15, t=3.61, p<.05) for TS (5.57 and 2.67 respectively, t=2.17, p<.05). In addition to the significant results for the LASSI scores, participants who attend 7 or more sessions also have significantly larger differences between their fall and spring GPAs. The high attending participants have an average GPA difference of .80 and the lower attending participants have an average difference of .46 (t=1.94, p<.10). In comparing participants to non-participants a significant difference exists between the average change score in GPA from fall to spring. Specifically, those students who remain in the OASIS program have a larger difference in their GPA’s from fall to spring (.63) than students who do not remain in the program (.08) (t=4.16, p<.0001).
242
Proceedings of the 5th Annual National Symposium on Student Retention. Copyright 2009. C-IDEA, The University of Oklahoma.
There are no significant differences between average GPA changes for any groups of participants according to the number of alcohol problems, the amount of alcohol consumption, the frequency of alcohol consumption and their attitudes toward alcohol. Conclusions Completion of the OASIS program appears to positively impact grade point average change. Also, the involvement in the program, represented by the number of sessions participants attended also has positive results on a number of the LASSI subscales, the overall LASSI score and GPA. Considerations Conclusions based on this report must be interpreted with care. While using a control group is an effective strategy to compare treatments effects (in this case the OASIS program activities), the control group for this project is one of convenience (those students who refused to participate, dropped out or were dismissed). In order to make statements about the effectiveness of the program, students would need to be randomly assigned to each group.
Because students in the “control” group may have participated in some of the OASIS activities, the non-significant results may be due to these individuals receiving some of the OASIS intervention.
That mentioned, the trend of changes in the participant group and not in the control group adds evidence of the program’s effectiveness. Since ethical considerations preclude true random assignment, this compromise appears to be the most logical alternative as opposed to randomly assigning some students the benefit of the program and withholding the program from others.
This program has implications for other institutions of higher education. It is a program that enlists the campus community in the mission of enhancing the learning environment of students in a way that engages faculty and staff in roles that are often different than their usual responsibilities. This collective approach to providing guidance to students at this pivotal time frame during their freshmen year requires a fairly small investment of time although yields impressive outcomes.
243
Proceedings of the 5th Annual National Symposium on Student Retention. Copyright 2009. C-IDEA, The University of Oklahoma.
References
Campbell, T. A, & Campbell, D. E. (1997). Faculty/student mentor program: effects on academic performance and retention. Research in Higher Education, 38(6), 727-742. Campbell, T. A., & Campbell, D. E. (2007). Outcomes of mentoring at-risk college students:
ender and ethnic matching effects. Mentoring & Tutoring, 15(2), 135-148.
Cosgrove, T. J. (1986). The effects of participation in a mentoring-transcript program on freshmen. Journal of College Student Personnel, 27, 119-124. Cramer, R. J., & Prentice-Dunn, S. (2007). Caring for the whole person: guidelines for advancing undergraduate mentorship. College Student Journal, 41(4), 771-778. Jacobi, M. (1991). Mentoring and undergraduate academic success: a literature review. Review of Educational Research, 61(4), 505-532. Kelly, S., & Schweitzer, J. H., (1999). Mentoring within a graduate school setting. College
Student Journal, 3(1), 130-149.
Kerssen-Griep, J., Trees, A. R., & Hess, J. A. (2008). Attentive facework during instructional feedback: key to perceiving mentorship and an optional learning environment.
Communication Education, 57(3), 312-332.
Moman, F. (2002). The effects of a mentoring intervention on student retention in a community college. Unpublished doctoral dissertation, Indiana State University, Indiana. Abstract
retrieved March 2, 2008, from ERIC database.
Nora, A. & Crisp, G. (2007). Mentoring students: conceptualizing and validating he multi- dimensions of a support system. Journal of College Student Retention, 9(3), 337-356. Pope, M. L. (2002). Community college mentoring: minority student perception. Community
College Review, 30(3), 31-46. Putsche, L., Storrs, D., Lewis, A. A., & Haylett, J. (2008). The development of a mentoring program for university undergraduate women. Cambridge Journal of Educaion, 38(4),
513-528.
Schlee, R. P. (2000). Mentoring and the professional development of business students. Journal of Management Education, 24(3), 322-337.
Sorrentino, D. M. (2006). The SEEK mentoring program: an application of the goal-setting theory. Journal of College Student Retention, 8(2), 241-250.
Trepanier-Street, M. (2004). Teachers mentors of children. Childhood Education, 81(2), 66-69. Weinstein, C. E. and Palmer, D. R. (2002). Learning and Study Strategies Inventory, 2nd Ed.,
H&H Publishing: Clearwater, Florida.
Wilson, S. (2005). Improving retention and success: a case study approach for practical results. Journal of College Student Retention, 7(3-4), 245-261.
244
Proceedings of the 5th Annual National Symposium on Student Retention. Copyright 2009. C-IDEA, The University of Oklahoma.
The Effect of Traditional Peer Mentoring vs. Hybrid Peer Mentoring on Student Retention and Goal Attainment
Elijah G. Ward, Ph.D. Department of Sociology,
Anthropology & Criminal Justice Saint Xavier University
Abstract - This research report describes the preliminary analysis of the data gathered on two distinct approaches used in a college peer-mentoring program—traditional peer-mentoring and hybrid (traditional and online) peer-mentoring interventions—respective to their effects on student retention and goal attainment. The targeted population consisted of 35 freshman and sophomore students (protégés) who were mentored by 12 upperclassmen—juniors and seniors in good academic standing. The participants were randomly assigned to one of two groups: a traditional peer-mentoring group or a hybrid peer-mentoring group. This pilot study sought to determine if mentors and protégés participating in a face-to-face traditional peer-mentoring group had different measurable outcomes respective to retention and goal-attainment as compared to mentors and protégés who experienced face-to-face mentoring plus hybrid peer-mentoring. Individual protégés participating in the traditional peer-mentoring group met weekly for 90 minutes or less with their mentors, developed goal plans, reported progress towards attaining goals and participated in monthly group meetings. Individual protégés participating in the non-traditional, hybrid peer-mentoring group met weekly 90 minutes or less with their mentors, developed goal plans via an online software program called the Aliveguide, reported to their mentors progress toward attaining goals, and participated in monthly group meetings. Introduction
A number of studies have documented the effectiveness of mentoring in enhancing student retention and goal attainment among college undergraduates (Budge, 2006; Ferrari, 2004; Mee-Lee & Bush; Packard, 2003). Yet little empirical research with methodological rigor has been conducted to date on undergraduate peer-mentoring programs (Budge, 2006). A major goal of the present study was to investigate the relative impact of two different approaches to peer mentoring upon student retention and goal attainment. One of these approaches, which we have termed “traditional,” or “face-to-face” peer mentoring, involves the standard vision of what a peer-mentoring relationship is commonly presumed to entail. The second approach, which we have termed “hybrid” peer mentoring, makes use of the traditional face-to-face mentoring circumstance but supplements this fundamental structure with an additional, “online” component to the mentoring condition.
The present study is an analysis of a peer-mentoring project that we created and implemented in the
spring 2009 semester at a four-year, midwestern Catholic university. The peer-mentoring project was designed to encourage the development of a community of intense, nurturing relationships between mentors and protégés that could potentially, and flexibly, address and support the protégé’s growth with respect to academic, social and personal needs. We were interested in understanding the relative effectiveness of adding an online component designed to enhance goal setting and goal attainment among our students. We were also interested in the effectiveness of the unique overall design of the peer-mentoring program in terms of its capacity to generally enhance student retention and goal attainment
245
Proceedings of the 5th Annual National Symposium on Student Retention. Copyright 2009. C-IDEA, The University of Oklahoma.
among all student participants regardless of the treatment group to which they had been randomly assigned. Mentoring
Crisp and Cruz (2009) and Budge (2006), in recent reviews of the past two decades of research on mentoring programs, peer-mentoring programs and initiatives in higher education, have voiced concern over continuing definitional, conceptual and operational ambiguity and inconsistency with respect to theory, praxis and research focused on mentoring college students. Conceptual notions and definitions of what constitutes mentoring vary tremendously depending upon the situational and institutional/organizational context of the mentoring relationship as well as according to the social/cultural characteristics of the would-be mentors and protégés, complicating theory and theorizing about the subject. Moreover, the actual practices involved in “mentoring” may also vary significantly across various types of mentoring situations and programs, further complicating the research community’s efforts to conduct commensurable investigations in its project to understand mentoring and its impact on college students.
Despite the range of variation in the conceptual and operational expressions of mentoring, there are three characteristics that many researchers have generally agreed are in fact common aspects of mentoring: (1) a focus on the growth and accomplishment of individuals that includes several forms of assistance, (2) the mentoring experience may include broad forms of support including assistance with professional/career development, role modeling and psychological support, and (3) these relationships are typically personal and reciprocal in nature (Crisp & Cruz, 2009; Davidson & Foster-Johnson, 2001; Johnson & Nelson, 1999). Other Models of Mentoring
While more traditional models of mentoring have tended to include older and more experienced white males overseeing the development of younger and less experienced white males whether in corporate, business or educational settings, non-traditional models of mentoring have become more prevalent in recent decades (Budge, 2006). Indeed, the concept of peer mentoring is itself a departure from the traditional model of mentoring, for what commonly appears as peer mentoring is a situation in which one person perhaps only slightly older and more experienced is guiding a peer who has yet to undergo an important, albeit brief, transition to a new level of functioning within an institutional and developmental context. Thus, instead of having faculty mentor students, there are conditions in which some students mentor slightly less experienced and younger peers. The mentoring of women represents another departure from the traditional model. In fact, the mentoring of persons of color, whether in corporate or educational settings, and indeed the peer-mentoring of women of color, exemplifies multiple departures from the traditional model of mentoring, whether this occurs within corporate or educational environments (Budge, 2006).
Other departures from the traditional mentoring model might include a situation wherein a group of individuals is guided by one or several persons, friend-to-friend mentoring (for intimate social support, which is often seen among women), inter-mutual peer groups (in which a group of friends collectively explores an issue), and long-term relationships in which a more responsible adult “looks out for” and attempts to guide a more risk-prone adult with a tendency toward rebellion (Crisp & Cruz, 2009).
A number of studies of mentoring have revealed that mentoring relationships can vary tremendously with respect to parameters. They may be brief or long-term, formally structured (within an organizational or institutional context), or informal and thus may develop spontaneously and naturally from fortuitous circumstances and dynamics between individuals. These approaches may tend to operate within the context of, but are not in any way bound by, institutional limits or temporal limits (Campbell & Campbell, 1997; Chao, Walz, & Gardner, 1992; Eby & Lockwood, 2005: Luna & Cullen, 1995).
246
Proceedings of the 5th Annual National Symposium on Student Retention. Copyright 2009. C-IDEA, The University of Oklahoma.
Impact of Peer Mentoring on Student Retention and Goal Attainment
During the past decade, studies have documented the impact of mentoring upon a number of outcome variables including student retention and graduation rates, institutional commitment (comfort with the educational environment), and measures of academic goal attainment such as course completion rates and grade point averages. The preponderance of this evidence has supported the argument that mentoring has a positive impact on student retention and grade point average among undergraduates (Campbell & Campbell, 1997; Freeman, 1999; Kahveci, Southerland, & Gilmer, 2006; Mangold, Bean, Adams, Schwab, & Lynch, 2003; Pagan & Edwards-Wilson, 2003; Ross-Thomas & Bryant, 1994; Salinitri, 2005; Sorrentino, 2007; Wallace, Abel, & Ropers-Huilman, 2000).
Some researchers have explored the role of a number of environmental social support variables
that may represent intermediate factors influenced by mentoring that ultimately impact student retention and goal attainment, such as sense of peer support, encouragement of friends and family, social growth, and social integration. For example, Dennis, Phinney, & Chuateco (2005) found in their longitudinal study of 100 ethnic minority first-generation college students that lack of peer support negatively predicted college adjustment (the extent to which students felt a sense of belonging to the college environment) the following spring and that it also predicted lower spring GPA. A study of 280 first-year psychology undergraduates in Australia who were randomly assigned to a peer-mentoring treatment group or control group found through structural equation modeling analysis that students’ peer group interactions influenced their interactions with faculty, which affected their academic and intellectual development, ultimately influencing their levels of institutional commitment and goal commitment (Muckert, 2002).
In addition, a social-network-focused study of the impact of student social integration on
persistence found that students with a greater proportion of ties outside their direct peer group (that is, those with a broader “discussion network” of acquaintances) performed better academically and were more likely to persist. They found that these benefits also emerged for students who developed ties with other students who themselves had broader ties (Thomas, 2000).
Institutional commitment is a student's overall satisfaction, sense of belonging, impression of
educational quality, and willingness to attend an institution again (Strauss & Volkwein, 2004). It has been studied because it is a strong predictor of a student’s persistence with or retention by a given institution of higher learning. In Strauss and Volkwein’s analyses, social integration (a measure of peer relations and social involvement) had a very strong impact on institutional commitment. Additionally, students reporting greater social growth from the time they began college were more likely to indicate a greater commitment to their institution.
Academic growth and academic integration were the strongest predictors of institutional
commitment, and social integration and social growth were the next strongest predictors. Similarly, the analyses of Cabrera, Nora, & Castaneda (1993) revealed that encouragement from family and friends to pursue and continue in college was one of the strongest factors shaping institutional commitment. In addition, the largest total effect on a student’s intention to persist at an institution was institutional commitment (.56) followed by encouragement from family and friends (0.45).
Such findings are vital because they underscore the need for institutions having students with
social/cultural tendencies to feel or to be marginalized to find means (such as peer mentoring programs) to not only assist students with the critical transition from the high school to the college experience, but to proactively incorporate students into the institution though the skills-oriented and hospitality-centered relationship that a personal bond with a successful and caring upperclassperson mentor can provide.
247
Proceedings of the 5th Annual National Symposium on Student Retention. Copyright 2009. C-IDEA, The University of Oklahoma.
Use of Technology in Mentoring Programs Since the early 1990s, research on the potential of online mentoring (e.g., telementoring, e-mentoring) has been conducted by an expanding number of investigators exploring its value for a variety of institutional settings (O’Neill, Weiler, & Sha, 2005). The purpose of these studies has often been to broaden temporal and spatial limitations on the character, nature and number of mentoring bonds that can be created while an additional motive has been to enhance the potential for institutional supervision and research (Bierema & Merriam, 2002; Ensher, Heun, & Blanchard, 2003). Initially, much of this interest explored the potential use of email as the foundation for making contact and relationship building between mentors and protégés (Bennett, Hupert, Tsikalas, Meade, & Honey, 1998; Tsikalas & McMillan-Culp, 2000). Some researchers have recently begun to incorporate an internet or video element into their students’ mentoring practices (Collier & Morgan, 2006; Edwards & Gordon, 2006). Project Rationale
After reviewing university data and engaging in conversation with university administrators involved in student retention, the principal investigators realized that significant portions of all racial/ethnic student demographic populations at the university were at risk of not graduating within four years of enrollment. Specifically, only 34% of White students, 20% of Hispanics, and 9% of Blacks were graduating within four years of enrollment (Streeter, 2008).
The principal investigators concluded that the vulnerable target populations who might benefit most from peer mentoring were in fact enrolled students from virtually all racial/ethnic backgrounds. However, there was a notably more concentrated need among students of color in general and among Black females in particular, who revealed a retention rate of 52% from the 2007 fall semester enrollment to the 2008 fall semester enrollment.
The rationale for this project was that it would increase retention of the mentioned student populations as well as add to the growth and development of other student populations who were already academically thriving, irrespective of race, ethnicity, or gender. The project was designed to recruit any freshman and sophomore students who were interested in being mentored, regardless of demographic identification or level of academic performance.
Based on the trends in use of technology in mentoring, this project sought to integrate technology as a strategy for enhancing protégé interest in goal attainment. Technology was incorporated into the mentoring project, although not in a manner that involved the use of email as a basis for mentor-protégé contact or in a manner that involved the web-based organization or oversight of mentoring relationships. Instead, and in contrast to most online mentoring programs, the project directors supplemented traditional and formal, face-to-face student peer mentoring with an online goal-setting and goal-progress-monitoring tool. This tool was, in many ways, peripheral to the core peer-mentoring structure of the project, but we had anticipated that it might have an impact on goal attainment progress among those protégés encouraged to use this tool. Although in its intended form, protégés could invite their mentors (as well as other peers) online to witness and support their progress with respect to their self-established online goals, the online tool was one that they were expected to primarily explore on their own as opposed to being an activity in which we expected their mentors to become heavily involved with them. The Hypotheses We expected that we might find, by the end of the period of the study, a difference in the level of goal attainment and the rate of student retention between the group of protégés that would experience solely the traditional and formal, face-to-face peer mentoring and the group of protégés that would experience the same traditional peer mentoring along with the added online goal-management tool. Indeed, the former group of protégés would also experience a goal-management process, but it would involve a two-dimensional and non-interactive, paper-and-pen process in which they would engage with
248
Proceedings of the 5th Annual National Symposium on Student Retention. Copyright 2009. C-IDEA, The University of Oklahoma.
their mentors. The online group, on the other hand, would experience a more dynamic and interactive, web-based process of goal management that would be grounded in a software process designed specifically for this project. Methodology
This 14-week pilot study conducted in spring 2009 sought to determine if mentors and protégés participating in a face-to-face traditional peer-mentoring group had different measurable outcomes respective to retention and goal-attainment when compared to mentors and protégés who experienced face to-face mentoring supplemented by an online goal management resource. Setting and Demographics
The research population was drawn from a midwestern Catholic liberal arts university. The sample consisted of 35 undergraduate college student protégés - 24 freshmen (68%), 10 sophomores (29%), and one junior (3%) who were mentored by 12 upper classmen (juniors and seniors) college students in good academic standing. The university had a combined graduate and undergraduate enrollment of approximately 5000 students.
The demographic makeup of the protégé sample consisted of 24 (69%) women and 11 (31%)
men. Twenty (57%) were Black, 9 (26%) were White, and 6 (17%) were “Other.” Twenty-seven (77%) were referred by faculty, 8 (23%) had received a letter warning them of a mid-term grade of less than “C,” and 5 (14%) were on academic probation. Fourteen (41%) were first-generation college students. Project Design and Implementation Mentor Recruitment
The mentors that participated in the project had self-identified their interest in serving as a mentor through the completion of a mentor application before the project began. Recruitment of prospective mentors involved a mass emailing to all juniors and seniors with a GPA of at least 3.0. In addition, recruitment posters were strategically placed throughout the university. Mentor selection criteria included the following: having a class standing of junior or senior, having a GPA of at least 2.5, having good interpersonal skills, and having a sincere interest in fostering the development of a freshman or sophomore student. Of the 60 mentor applicants, 39 were interviewed and 12 were selected.
Protégé Recruitment
Recruitment of prospective protégés entailed the following strategies: a mass emailing about the project to all freshmen and sophomores who were currently on academic probation or who had received a grade of less than C in at least one class during the fall 2009 semester; a mass emailing to all university faculty inviting them to identify and refer to the project students who they felt could benefit from peer-mentoring services; an invitation to faculty involved in teaching a semester-long orientation class (that all freshmen take) to refer prospective protégés to the project; a mass emailing to freshmen and sophomores who had taken or were taking an introduction to sociology or race and ethnic relations course at the university; a recruitment poster that was strategically placed throughout the university. During the project period a total of 45 protégé applications were submitted. All 45 applicants were extended an opportunity to enroll and participate in the project. Orientation, Group Assignments and the Core Relationship
During the initial phase of the project, protégés and mentors were invited to a “Meet-‘n-Greet” orientation meeting. At the orientation, participants learned about common interests and needs while they became acquainted with one another. Additionally, all project participants participated in a candlelight induction ceremony acknowledging their commitment to the project’s philosophy and goals. At the conclusion of these project activities, mentors and protégés by secret ballot selected those with whom
249
Proceedings of the 5th Annual National Symposium on Student Retention. Copyright 2009. C-IDEA, The University of Oklahoma.
they felt they shared common interests and needs and with whom they desired to work in a mentor/protégé relationship. Based on the protégé and mentor self-determined choices, mentoring group assignments were made by the project directors. In order to ensure that a quality relationship occurred between mentors and protégés, a 1-to-3 mentor/protégé ratio was maintained.
In order to nurture a sense of community among project participants around shared values of
academic and personal success, all participants attended a two-hour monthly community meeting. Community meetings included mini-workshops on such topics as career exploration, financial literacy, time management, healthy lifestyles, study skills, and note-taking.
In the second phase of the project, mentors and protégés were randomly assigned to one of two
groups. Mentors and protégés in the traditional peer-mentoring group mutually developed a goal plan (Vision Map) for the protégé to enact during the project period. Mentors and protégés in the hybrid peer-mentoring group mutually completed an online goal plan (Aliveguide) for protégé goal attainment. After completion of the traditional goal plan (Vision Map) and the online goal plan (Aliveguide), the project mentors and protégés met weekly for approximately 90 minutes to discuss and revise strategies, monitor goal attainment progress, and to generally become aware of and address the protégé’s strengths and weaknesses and their unique developmental needs for growth as a student and as a person.
Mentors encouraged and supported protégés around their academic and other (i.e., social and
personal, depending upon the protégé) needs and goals for growth. They assisted protégés with identifying and accessing needed on-campus resources that would support protégé goal attainment. Oftentimes, this encouragement merely took the form of being a friend and giving the protégé an opportunity to express her/his points of view, especially feelings—i.e., to simply be heard and received by someone whom they know cares. This relationship, typically personal and mutual in nature, constituted the core of the peer-mentoring intervention in the lives of these undergraduates still early in their process of making a critical transition from high school to college and becoming integrated academically and socially into a still relatively new for them institutional setting..
The final phase of the project culminated with a project celebration attended by participants and the project’s university sponsors. At this event, participants celebrated the relationships formed and the personal impact of the project on their self-identified academic, social and personal goals. Instrumentation and Data Collection
Multiple researcher-developed instruments were used to determine if the assigned grouping of traditional vs. hybrid affected the retention and goal-attainment of protégés. The protégé training occurred two weeks before the onset of mentoring and three weeks prior to the trainings for the two respective strategies (traditional vs. hybrid) to be used for planning and monitoring goal attainment. Survey Instruments
During their training, protégés completed the Academic and Life Skills Assessment and the Pre-Intervention Instrument. The Academic and Life Skills Assessment instrument consisted of 27 questions and was broken down into 24 Likert-scale questions indicating a range of responses from “not at all strong” to “very strong” with values from 1 to 5 respectively. It also included three open-ended questions. The assessment collected information about the protégés’ typical level of performance in such areas as study habits, approaches to learning, time management, personal care, and emotional well-being. The pre-intervention instrument consisted of 16-core questions and was divided into nine Likert-scale questions indicating a range of responses from not strongly to very strong with values from 1 to 5 respectively. The instrument also included four multiple-choice questions and three open ended questions. The instrument collected data about the protégés’ approaches to academic attainment, self-efficacy, social connectedness, and connectedness to the university. The protégés participating in the traditional mentoring group
250
Proceedings of the 5th Annual National Symposium on Student Retention. Copyright 2009. C-IDEA, The University of Oklahoma.
completed a researcher-developed goal plan (Vision Map), while protégés that participated in the hybrid group completed a researcher-developed online goal plan (Aliveguide).
The researcher-developed Progress Tracking Form was completed at three intervals by mentors to
record the progress of all protégés toward goal attainment during the sixth, ninth and twelfth weeks of the project period. The tracking form consisted of the following categories: protégé comparison group (traditional vs. hybrid), type of goal established, goal progress, and goal issues. Multiple tracking forms for each protégé over time were summarized in a final, single score for goal attainment for each protégé for the project period based on the following scale: 0=goal established or no progress, 1=some progress, 2=significant progress, 3=goal met, 4=one goal met and at least some progress made toward a second goal or significant progress made toward each of two goals. The Broad Assessment of Protégé Engagement instrument consisted of 12 questions and was broken down into ten Likert-scale questions indicating a range of responses from “never” to “always” with values of 1 to 5, and two open-ended questions that measured protégé engagement in the project, support systems, emotional well-being, and level of success expectancy. Mentors completed the Broad Assessment of Protégé Engagement during the project period.
During the twelfth week of the study the Post–Intervention Instrument was administered to
protégés. The Post-Intervention Instrument consisted of 23 core questions and was divided into nine Likert-scale questions indicating a range of responses from “not strongly” to “very strongly” with values of 1 to 5 respectively. It also included four multiple-choice questions and four open-ended questions. The instrument collected information about the protégés’ approaches to academic attainment, self-efficacy, social connectedness, connectedness to the university and satisfaction with the peer-mentoring project.
Mentor Journals and Focus Groups Once a week, mentors recorded reflective notes in a journal that they maintained during the project period. The journal notes captured the mentors’ weekly experiences and impressions regarding the relationships they created with protégés. In addition, mentors documented the growth, progress, struggles, and goal attainment of their protégés over the project period. At the conclusion of the project, the project directors conducted two separate 90-minute focus groups—one of mentors and the other of protégés. Mentors were asked to respond to focus group questions that explored such areas as mentors’ perspectives on the effectiveness of the project in successfully nurturing the development of freshmen and sophomores, mentors’ views on factors that might explain the success or lack of success of their relationships with protégés, as well as mentor perspectives on the effectiveness of other various components of the project. Protégés, in their focus group, were asked to respond to questions that explored such areas as the following: things they would change or keep about the project, how effective the project had been in nurturing their development as students or persons, and what factors they believe shaped the success or lack of success in their relationships with their mentors.
Results
The primary purpose of this research project pilot study was to determine if mentors and protégés participating in a face-to-face traditional peer-mentoring group had different measurable outcomes respective to retention and goal-attainment as compared to mentors and protégés who experienced face-to-face-mentoring supplemented by an online goal management resource. The data collected from these 35 protégé and 12 mentors are described and analyzed as follows:
To test the primary hypothesis that there would be significant mean differences on continuous
assessment and outcome measures that were components of the intervention between the traditional and the hybrid groups, familywise error-corrected independent groups t-tests were performed. None of the results were statistically significant. However, an additional t-test comparing mean differences on a
251
Proceedings of the 5th Annual National Symposium on Student Retention. Copyright 2009. C-IDEA, The University of Oklahoma.
protégé summary score of goal attainment indicated that protégés in the hybrid group (M = 2.5, SD = 1.2) had significantly higher mean scores than those in the traditional group (M = 1.7, SD = 1.0), t(33) = 2.28, p = .03.
The mean rating by mentors of their protégés’ goal attainment (M = 2.1, SD = 1.7) was compared
against a hypothesized mean of 1.0 using a one-sample t-test. The difference was statistically significant, t(33) = 5.55, p < .001, indicating that the typical protégé made significant progress during the project period toward achieving their self-established goal(s). A mean goal attainment score of 1.0 (indicating slight progress toward the attainment of a goal) might be expected for a protégé by virtue of mere participation in a peer-mentoring project. However, the mean score for participants was significantly higher, revealing that mentors assessed the typical protégé to have reached a significant landmark in their progress toward a self-defined goal, even though that goal may not have been fully met by the end of the project period. Indeed, some goals set by protégés were not short-term goals that could be met during the project period but were instead longer-term developmental goals. To test the hypothesis that the intervention had an effect on protégé attitudes about goal attainment, results from a paired t-test indicated that protégé mean post-test attitudinal scores about goal attainment (M = 3.53, SD = 1.1) were significantly higher than their pre-test scores (M = 3.09, SD = 1.2), t(33) = 2.30, p = .03, r = .59.
To assess the hypothesis that protégés would show positive changes towards efficacy and ability
as well as various resources available (faculty, peers, the university, mentors) and the possible use of those resources, family-wise error-corrected within-groups t-tests were performed. Results indicated that for belief in self-efficacy of efforts, the post-test mean (M = 4.1, SD = 0.8) was significantly higher than the pretest mean (M = 3.8, SD = 0.9), t(32) = 1.97, p = .05, for likelihood of seeking help, the post-test mean (M = 3.7, SD = 1.2) was significantly higher than the pretest mean (M = 2.9, SD = 1.4), t(33) = 3.20, p = .003, and for connectedness to staff, the post-test mean (M = 3.1, SD = 1.2) was significantly higher than the pretest mean (M = 2.4, SD = 1.1), t(33) = 3.55, p = .001. No other within-group mean differences were statistically significant. However, it should also be noted that although not statistically significant, protégés in the hybrid group (M = 4.3, SD = 0.7) had higher “project effect” scores than participants in the traditional group (M = 3.9, SD = 1.0). Finally, regarding program retention, of the 35 protégés that initially began the program (i.e., completed the initial program enrollment requirements), 34 finished the program, resulting in a 97% retention rate. Discussion Initial Findings
The responses of protégés in the hybrid and the traditional peer-mentoring groups were not significantly different from one another on a series of items for which we compared protégés’ pre-intervention and post-intervention scores. This suggests that there were no important differences between the two groups with respect to the impact of two seemingly differing approaches to peer mentoring on a number of protégé outcome variables, including those designed to measure student retention and goal attainment.
There are several factors that may help explain the absence of statistically significant differences between the Aliveguide (hybrid) group of protégés and the Vision Map (traditional) protégé group. The results for the Aliveguide group could have been adversely affected by the fact that these protégés received only one hour of introduction to the web-based tool. Aliveguide mentors did not always support their protégés in their protégés’ use of the Aliveguide. In fact, several mentors did not themselves recognize the relevance of the Aliveguide, perhaps in part because they too were confused about its application due to lack of sufficient training in the purpose and use of the Aliveguide. Most importantly,
252
Proceedings of the 5th Annual National Symposium on Student Retention. Copyright 2009. C-IDEA, The University of Oklahoma.
there was a lack of follow-up instruction provided after the Aliveguide training by project directors to mentors and protégés regarding the use and application of the Aliveguide as a goal-planning tool. In addition, the design of the Aliveguide could have been more user-friendly, dynamic, interactive, and engaging for the intended target group of young undergraduates. In defense of the technology, however, a small number of motivated protégés introduced to the Aliveguide used it with excellent results and praised it very highly.
For the purpose of this preliminary analysis, the term “student retention” refers to the completion
of the 14-week project experience by protégé participants. Follow-up analyses are planned for fall 2009 and will expand the compass of the concept of student retention to refer also to students who return to the university after the spring 2009 semester and thereafter. Within the context of the 14-week period during which this pilot project was conducted, there was a 97% rate of retention throughout the study among those who initially formally enrolled in the project and completed the required enrollment protocol. Additional Findings
Although differences between pre-intervention and post-intervention assessment means were not statistically significant for the comparison between hybrid and traditional protégé groups, further analysis yielded promising results. For example, protégés in the hybrid group had greater overall success in making progress toward the goals they had individually set for themselves during the project period in comparison with protégés in the traditional group. Such a finding could be reflective of the fact that a very small number of protégés in the hybrid group had very positive and encouraging responses to the Aliveguide. However, this effect could also possibly be the result of project directors’ having non-verbally and unwittingly communicated to hybrid mentors and protégés an expectation of stronger performance because of their having been chosen (albeit randomly) to pilot a seemingly more technologically sophisticated tool for goal attainment than had been their traditional group counterparts, who were engaging the comparatively more prosaic Vision Map goal-attainment strategy.
The mean mentor rating of goal attainment across all protégés for the entire sample indicates that
the typical protégé made significant progress during the project period toward achieving their self-established goal(s), suggesting that overall goal progress for participants in this peer-mentoring project was clearly positive and substantial. This finding was supported by mentors’ comments about protégé progress as revealed in the mentor journal entries. Many mentors noted significant response by and growth in their protégés over the project period with respect to career direction development, improved skills in organizing their time and academic and other responsibilities/activities, making habit changes with respect to exercise and diet, making sober mutual assessments of protégé weaknesses and strengths, and outlining and targeting areas needing improvement. An outstanding and recurring theme in many journals was the depth of sensitivity, active intelligence, discernment, and compassion demonstrated by mentors in their effort to inspire, encourage, challenge, understand and serve their protégés.
The data analysis yields some evidence that protégés’ belief in the effectiveness of their personal efforts, one of the project’s explicit goals, was significantly enhanced by their participation in the project. It is also clear that their experience of the peer-mentoring relationship had significantly strengthened their likelihood of seeking resources to help them address inevitable challenges to their academic success. We suspect that this last finding has a unique and intimate connection to the following finding. A post-intervention measure of protégés’ mean “feeling of connectedness to the staff at [the institution]” emerged as significantly higher than its corresponding pre-intervention measure, indicating that one significant effect of the peer-mentoring project may be a stronger affective sense of relatedness to staff. This is the only one of four Likert-scaled measures of “feeling of connectedness,” including feeling connected “to other students…,” “to faculty…,” and “to the campus life at [the institution]” that was statistically, significantly higher in its post-intervention measure. This could be a result of the tendency of protégés in the project to socially construct their mentors and the project directors not as “other students” or as
253
Proceedings of the 5th Annual National Symposium on Student Retention. Copyright 2009. C-IDEA, The University of Oklahoma.
“faculty,” but instead as “project or university staff.” Since only limited qualitative evidence is currently available to support such a hypothesis, this is an issue that must await further exploration in the next analysis or iteration of the study. However, what the data may be suggesting is that participation in a supportive and productive peer-mentoring program may enhance student perception of a supportive and caring staff.
Though not statistically significant, one item measured on the post-intervention instrument yielded a value clearly higher than what would have been expected with a null hypothesis of “no effect.” A protégé self-report measure of the project’s effectiveness (“project effect”) in helping protégés grow as a person or student (on a scale of 1-5, where 1=not effective and 5=very effective) was clearly higher (4.1) than an expected value of 3.0. This result is supported by protégés’ qualitative responses to the subsequent question in the post-intervention instrument, which asked “Why did you answer the previous question (about the project’s effectiveness) in the way in which you did?” Twenty-six protégés (76%) gave strong and unequivocally positive, open-ended answers of why they had given the program’s effect on their growth a score of 4 or 5, including indications that the project had given them a sense of purpose and belonging, motivated them to be better and stronger students, strengthened vital academic habits and skills, honed in on idiosyncratic needs for growth, provided helpful individualized advice, care, attention and encouragement at critical junctures, helped them make an important change in career direction, encouraged them to connect with and meet others, and/or helped them become healthier persons not only academically but also emotionally, physically and socially.
Finally, it is likely that the high project retention rate (97%) is partially related to the high rate of
satisfaction among protégés with the project as evidenced in their reports of having typically established affectively strong and growth-productive relationships with their mentors. Of 29 protégés commenting on the post-test about their mentor, 27 (93%) used clearly positive terms and 24 (83%) used “glowing” terms when describing the quality of their relationship with their mentor. It is possible that if protégés in the project had not generally felt supported, more of them would have not completed this voluntary experience, suggesting that they were indeed receiving something of value in their relationships with their mentors. Limitations and Implications
This pilot study was limited to one semester of an academic school year involving mentoring activities aimed at the retention and goal attainment of freshman and sophomore students in a midwestern Catholic liberal arts university. From a quantitative standpoint, the small sample size limits statistical power and the validity of the quantitative results. However, the results are promising, and with program growth and larger sample sizes, further analyses will be conducted. Another limitation of the project was a lack of sufficient funding devoted to the development of a high-quality, web-based tool for goal development and monitoring. Future implications for this study might be that additional support and training for the Aliveguide might result in quantitatively and qualitatively different outcomes. Another implication for the study is that retention rates will in the future be analyzed not only within the project group, but that fall re-enrollment rates for project participants will be compared to fall re-enrollment rates for the freshmen and sophomores in the general university population. In addition, future analyses will need to be based on more detailed information about the nature of individual protégé goals established and pursued during the project. Conclusion The literature on peer mentoring of undergraduates suggests that factors supportive of student well-being, social connectedness to others and academic confidence may have an impact on student retention and goal attainment. To some extent, the findings of the present study provide moderate additional support for these conclusions. In conclusion, the preliminary findings of this pilot study
254
Proceedings of the 5th Annual National Symposium on Student Retention. Copyright 2009. C-IDEA, The University of Oklahoma.
demonstrated that the effects of peer mentoring are beneficial regardless of whether students received this intervention from a traditional or a hybrid approach. It is a special note that the relationship established between mentors and protégés continued to be the most critical element substantiating why peer mentoring may be a powerful strategy for retention and goal attainment. The results are very promising. This is a pilot study. The goal is to take the results from the project, refine the methodology of the project for both quantitative and qualitative data collection, enhance the level of project support provided for use of the Aliveguide, and then implement the project again in the spring 2010 semester.
255
Proceedings of the 5th Annual National Symposium on Student Retention. Copyright 2009. C-IDEA, The University of Oklahoma.
References Bennett, D., Hupert, N., Tsikalas, K., Meade, T., & Honey, M. (1998). Critical issues in the design and
implementation of telementoring environments (CCT Technical Report No. 09-1998b). New York, Center for Children and Technology.
Bierema, L. L., & Merriam, S. B. (2002). E-mentoring: using computer mediated communication to enhance the mentoring process. Innovative Higher Education, 26(3), 211-227.
Budge, S. (2006). Peer mentoring in postsecondary education: implications for research and practice. Journal of College Reading and Learning, 37(1), 71-85.
Cabrera, A. F., Nora, A., & Castaneda, M. B. (1993). College persistence: structural equations modeling test of an integrated model of student retention. The Journal of Higher Education 64(2), 123-139.
Campbell, T. A., & Campbell, D. E. (1997). Faculty/student mentor programs: effects on academic performance and retention. Research in Higher Education, 38(6), 727-742.
Chao, G. T., Walz, P. M., & Gardner, P. D. (1992). Formal and informal mentorships: a comparison on mentoring functions and contrast with nonmentored counterparts. Personal Psychology, 45(3), 619-636.
Collier, P. J., & Morgan, D. L. (2006). Student’s first mentoring project: using role-theory to improve low-income, first generation student retention. Paper presented at the Annual meeting of the American Sociological Association, Montreal Convention Center, Montreal, Quebec.
Crisp, G., & Cruz, I. (2009). Mentoring college students: a critical review of the literature between 1990 and 2007. Research in Higher Education. doi:10.1007/s11162-009-9130-2
Davidson, M., & Foster-Johnson, L. (2001). Mentoring in the preparation of graduate students of color. Review of Educational Research, 71(4), 549-574.
Dennis, J. M., Phinney, J. S., & Chuateco, L. I. (2005). The role of motivation, parental support, and peer support in the academic success of ethnic minority first-generation college students. Journal of College Student Development, 6(3), 223-236.
Eby, L. T., & Lockwood, A. (2005). Protégés’ and mentors’ reactions to participating in formal mentoring programs: a qualitative investigation. Journal of Vocational Behavior, 67, 441-458.
Edwards, J. L., & Gordon, S. M. (2006). You should—I should: mentoring responsibilities as perceived by faculty, alumni and students. Paper presented at the annual meeting of the American Educational Research Association, San Francisco, CA.
Ensher, E. A., Heun, C., & Blanchard, A. (2003). Online mentoring and computer-mediated communications: new directions and research. Journal of Vocational Behavior, 63, 264-288.
Ferrari, J.R. (2004). Mentors in life and at school: impact on undergraduate protégé perception of university mission and values. Mentoring and Tutoring, 12(3), 295-307.
Freeman, K. (1999). No services needed? The case for mentoring high-achieving African American students. Peabody Journal of Education, 74(2), 15-26.
Johnson, W. B., & Nelson, N. (1999). Mentor-protégé relationships in graduate training: some ethical concerns. Ethics & Behavior, 9(3), 189-210.
Kahveci, A., Southerland, S. A., & Gilmer, P. J. (2006). Retaining undergraduate women in science, mathematics, and engineering. Journal of College Science Teaching, 36(3), 34-38.
Luna, G., & Cullen, D. L. (1995). Empowering the faculty: mentoring redirected and renewed. ASHE-ERIC Higher Education Reports, 3, 1-87.
Mangold, W. D., Bean, L. G., Adams, D. J., Schwab, W. A., & Lynch, S. M. (2003). Who goes who stays: an assessment of the effect of a freshman mentoring and unit registration program on college persistence. Journal of College Student Retention, 42(2), 95-122.
Mee-Lee, L., & Bush, T. (2003). Student mentoring in higher education: Hong Kong Baptist University. Mentoring and Tutoring, 11(3), 263-271.
Muckert, T. (2002). Investigating the student attrition process and the contribution of peer-mentoring interventions in an Australian first year university program. Dissertation. Griffith University.
256
Proceedings of the 5th Annual National Symposium on Student Retention. Copyright 2009. C-IDEA, The University of Oklahoma.
O’Neill, D. K., Weiler, M., & Sha, L. (2005). Software support for online mentoring programs: a research-inspired design. Mentoring and Tutoring, 13(1), 109-131.
Packard, B. W. L. (2003). Student training promotes mentoring awareness and action. Career Development Quarterly, 51, 335-345.
Pagan, R., & Edwards-Wilson, R. (2003). A mentoring program for remedial students. Journal of College Student Retention, 4(3), 207-225.
Ross-Thomas, E., & Bryant, C. E. (1994). Mentoring in higher education: a descriptive case study. Education, 115(1), 70-76.
Salinitri, G. (2005). The effects of formal mentoring on the retention rates for first-year, low-achieving students. Canadian Journal of Education, 28(4), 853-873.
Sorrentino, D. M. (2007). The SEEK mentoring program: an application of the goal-setting theory. Journal of College Student Retention, 8(2), 241-250.
Strauss, L. C., & Volkwein, J. F. (2004). Predictors of student commitment at two-year and four-year institutions. The Journal of Higher Education, 75(2), 203-227.
Streeter, P. (2008). SXU retention and graduation rates: report on first-year cohort data. Chicago, IL: Saint Xavier University, University Office of Research, Planning and Assessment.
Thomas, S. L. (2000). Ties that bind: a social network approach to understanding student integration and persistence. The Journal of Higher Education, 71(5), 591-615.
Tsikalas, K., & McMillan-Culp, K. (2000). Silent negotiations: a case study of roles and functions utilized by students, teachers and mentors in project-based, telementoring relationships. Paper presented at the International Conference of the Learning Sciences, Ann Arbor, MI, June 14-17, 2000.
Wallace, D., Abel, R., & Ropers-Huilman, B. R. (2000). Clearing a path for success: deconstructing borders through undergraduate mentoring. The Review of Higher Education, 24(1), 87-102.
257
Proceedings of the 5th Annual National Symposium on Student Retention. Copyright 2009. C-IDEA, The University of Oklahoma.
A Touch of CLASS:
Centering Learners Attention on a Super School – Cheyney University
Shelly Weeks-Channel, Ph.D. Assistant Professor of Education
Abstract - The research literature suggests that racial and ethnic minorities in large metropolitan areas face extreme disparities within the American public education system. They are not being prepared to share equal partnership in all social groups. In Philadelphia alone, less than one-half of students in public schools complete high school. The problem is that “the much higher rates of high school completion among these minorities’ suburban counterparts – who may literally live and attend school right around the corner – place in a particularly harsh and unflattering light the deep undercurrents of inequity that plague American public education” (EPE Research Center, 2008). Add to this reality the recent attention and concern regarding a projected decline in students attending colleges and universities over the next decade. We implemented a ten-week educational program to 6th, 7th, and 8th graders, and conducted a comparative analysis of the middle schoolers and ninth graders on “education knowledge” and “educational attitudes” using a survey instrument. Results revealed more positive outcomes for 6th, 7th, and 8th graders than 9th graders. Findings suggest inner-city youth are more likely to benefit from early intervention strategies where opportunities are provided for students to build their skills regarding admission to and success in university education.
Introduction
Cheyney University of Pennsylvania is proud of its legacy as America’s oldest historically black institution for higher education. The Cheyney legacy in American education is fundamental to its mission of upholding its tradition of academic excellence and historical commitment to educate students whose access to academic development may have been denied by a lack of opportunity for educational, social, and economic growth. Providing opportunity and access for a diverse student population and for African Americans in particular, supports the paramount goal of ensuring generations of confident and competent visionary leaders that are reflective and responsible citizens.
Founded in 1837 by Richard Humphreys, a Quaker philanthropist, the school was initially called the Institute for Colored Youth, the city of Philadelphia’s first colored high school. Humphreys’ desire was to establish a school of higher learning "...to instruct the descendents of the African Race in school learning, in the various branches of the mechanic Arts, trades and Agriculture, in order to prepare and fit and qualify them to act as teachers...." Richard Humphreys became interested in the plight of African Americans after witnessing their struggles in society. According to Clark (2007), the establishment of Cheyney was a major leap forward and a bitter setback for sinister time bandits who doggedly preyed on the fertile minds of Philadelphia’s youth.
Despite threats of violence and arson, the Institute continued to thrive and expand. After the Institute moved to George Cheyney’s farm in 1902, a rural area twenty-five miles west of Philadelphia, its name changed to Cheyney State Teachers College. Subsequently, it became the State Normal School at
258
Proceedings of the 5th Annual National Symposium on Student Retention. Copyright 2009. C-IDEA, The University of Oklahoma.
Cheyney, Cheyney State College, and after joining the State System of Higher Education in 1983, Cheyney University of Pennsylvania.
Cheyney University, situated on 275 stunning acres, now belongs to a more suburban area. The school is a coeducational public institution with approximately 1,500 students. Bachelor’s degrees in various disciplines are offered, as well as post-baccalaureate degrees in Cheyney’s graduate programs.
The graduates of Cheyney University continue to become leaders in teacher education. However, they also serve in fields such as business, politics, science, journalism, government, medicine, sports, communications, and law. Cheyney University is dedicated to preparing students for lifelong learning, career success, responsible citizenship, and ultimately the development of human potential and talent. Various cultures and nationalities are represented within the student body, and Cheyney enriches the educational environment with supportive services, as well as cultural and social experiences that help students develop the necessary skills in meeting the competitive and technological challenges of the 21st century. Theoretical Foundation
The Noel-Levitz philosophy is at the center of the process of Cheyney University’s admissions
procedures. That philosophy, in part, is predicated on an enrollment administration model that is viewed as a “systematic, holistic, and integrated approach to achieving enrollment goals” (Noel-Levitz, 2001). The college admissions policies are based on the idea that effective administration happens through diverse approaches including social interactions such as college tours, student advising and recruitment, financial aid orientation, instruction, and workshops. Cheyney’s admissions policies are also based on commercial presence in the media and culture which involves marketing and school advertisement in local publications, and in-person video productions to student groups. Thus, the school’s administration model is based significantly on the Noel Levitz model which promotes “exerting more control over those institutional factors that shape the size and characteristics of the student body … including activities associated with attracting and retaining students.” Additionally, it involves “examining institutional mission, program and service offerings, organizational structure, and resource allocation. The process relies heavily on the use of pertinent data and information for informed decision making.” While the admissions administration model is based considerably on the Noel-Levitz model, it is also based on the school’s overall mission statement and person-to-person communication.
The current philosophy that undergirds the admissions administration model is one with the capacity to create a system-wide comprehensive utilization analysis. The analysis will yield immediate system-wide campus master planning initiatives to generate an atmospheric assessment that is linked to the campus visitation experiences on a pilot project basis.
The Noel-Levitz model is based on a results-oriented consulting team approach specific to all aspects of enrollment management, including staff development, student recruitment, financial aid, student retention market research and publications, and web site development (Louisiana Board of Regents, 2001). The enrollment and financial aid management under this model seeks to integrate recruitment, retention, financial aid, and other strategies in a comprehensive approach to enrollment and net revenue management.
The scholar, Noel-Levitz (cited in Louisiana Board of Regents, 2001), has convened the National Conference on Student Retention and “helped hundreds of institutions across North America to reduce dropout rates without lowering academic standards.” He uses a system-wide strategic enrollment analysis that has three phases: 1) review and analyze data/information; 2) focus group interviews with key administrators and staff members; and 3) exit executive briefing and written report. These work phases generate the data used to develop a strategic plan for achieving full enrollment potential for Cheyney University.
Noel-Levitz believes that Cheyney University has significant potential to grow and shape enrollment in the years ahead. Growing and shaping enrollment begins with influencing the decisions of students who, by definition, will not enroll unless Cheyney does something new and different to intervene
259
Proceedings of the 5th Annual National Symposium on Student Retention. Copyright 2009. C-IDEA, The University of Oklahoma.
(Louisiana Board of Regents). Accordingly, the binding philosophy behind Cheyney’s admissions administration model affirms that the potential student enrollment pools, not knowing enough about Cheyney, must be aggressively targeted, informed, and influenced in order for them to enroll. Increased enrollment can only be accomplished through a variety of improved written, electronic, phone and personal communications. Thus, Cheyney University must favorably influence students’ decisions to attend the university. As a result, A Touch of CLASS: Cheyney University was introduced.
The theoretical framework for A Touch of CLASS: Cheyney University is connected to the notion of bureaucracy. Max Weber, a prominent sociologist, theorized about bureaucracies. Bureaucracies are a powerful form of social organization. From a sociological viewpoint, the process of learning about a higher educational institution and applying for admission would be complex and frustrating for youngsters. Why? Bureaucracies tend to be bound by red tape. Consequently, their rules may impede the purpose of the organization (Henslin, 2002). In other words, students impacted by the educational inequity that plagues American public education may not be motivated or have the knowledge to successfully be admitted to higher institutions of education because of bureaucratic red tape. Early outreach programs, such as A Touch of CLASS: Cheyney University, are essential in ensuring an understanding of how the process works at colleges and universities, thus assisting students and their families in having an easier time with the process of admissions. Statement of the Problem
Projections reveal that over the next decade, a sharp decline in enrollment at higher education institutions will occur, and educators and analysts indicate that innovative steps are now being taken by colleges and universities to address this projected drop in enrollment in much of the nation (Strauss, 2008). College and university admissions officials are scrambling to attract Hispanic and low-income students, who have been underrepresented at private and public colleges and universities (Finder, 2008).
To address the issue of growing non-white and academically/economically disadvantaged cultural groups, educational initiatives and perspectives of inclusion are being developed in urban school programs. With the recent thrust for multiculturalism in education, programs aimed at the academically and economically challenged populations attract an increasing percentage of students of diverse ethnic backgrounds.
The problem is that the type of community in which these students live and attend school exerts a strong and pervasive influence on educational outcomes (EPE Research Center, 2008, p. 1). These youngsters remain at a disadvantage because of poverty and unequal access to college preparedness experiences. Disparities in educational programs exist between urban educated students and their suburban peers. By the time they reach high school, there is insufficient time to effectively facilitate the higher learning processes. Their prospects for becoming first-generation college graduates are gloomy without adequate college readiness skills. The dearth of academic role models in their home environments also contribute to their academic inefficiencies, such as college preparedness.
Project Implementation
Cheyney University has experienced a decline in enrollment and retention over the last decade. In an attempt to draw students to the university and effectively retain and graduate them, several admissions programs have been implemented throughout the years. For example, participation in phone-a-thons, personalized customer service, expedited admissions, and the ‘Distinct Market’ which is a specialty HBCU college fair drawing applicants from various cities such as Indianapolis, Connecticut, New Jersey, Philadelphia and New York. In addition, the Keystone Honors Academy draws several students to Cheyney. Students are admitted to the Academy based on a high GPA, and admission to the Academy comes with a tuition waiver, a personal computer, and other incentives. Through a wide variety of programmatic offerings, learning activities, innovative approaches to pedagogy, scholarships, special
260
Proceedings of the 5th Annual National Symposium on Student Retention. Copyright 2009. C-IDEA, The University of Oklahoma.
programs, and events, the Keystone Academy inspires students to discover new intellectual interests and encourages lifelong learning.
Furthermore, the model for effectively recruiting, retaining, and graduating students, which is the focus of this chapter, was created in Spring 2008 and implemented Fall 2008. The project entitled, A Touch of CLASS: Cheyney University means A Touch of Centering Learners Attention on a Super School: Cheyney University (ATOC). It is a program designed to touch the lives of junior high school racial and ethnic minorities, some who are economically disadvantaged, by inspiring them to dream and focus on the possibility of a college or university education.
The primary objective of the project was to address the issue of social inequity for inner city youngsters by initiating the process to increase the enrollment at a higher education institution, particularly Cheyney University, in a context where projections suggest a decline in enrollment. More specifically, the intent of this model for success was twofold: to introduce to a multicultural population of sixth, seventh, and eighth graders (an early intervention strategy) the notion of attending a higher education institution like Cheyney University upon high school graduation, and provide this population of students with information regarding the benefits and rewards of high academic achievement. Moreover, implementation of the project allowed for working collaboratively with inner-city youngsters to build their skills in seeking admission to and success in university education; expanding partnerships with schools to build an awareness and increase the number of students from underrepresented groups enrolling in historically black colleges and universities; and providing more opportunities for teacher candidates to work with diverse populations, students with disabilities, and students in urban settings.
The project upholds the basic administrative philosophy that growing and shaping enrollment is predicated on influencing the decisions of students. In order to influence the decisions of youngsters, Cheyney University needs to strengthen communications among and between dominant groups of individuals influencing the minds of students, including university and school faculty. The promise of influencing the decisions of students to enroll in Cheyney University is directly correlated with the strength of communications between the groups with special advantage to sway student thinking. The more likely that these groups are sending encouraging messages to students, the more likely those students will be influenced toward choosing Cheyney. Orientating students on the advantages of matriculating at Cheyney University and increasing their knowledge of a state school system, especially Cheyney University’s unique economic offerings are essential to the program. These offerings include minority initiatives and outreach programs such as R.O.T.C., Call Me MISTER, and the Keystone Honors Academy. The more aware students are of the academic and economic advantages of matriculating at Cheyney, the more likely the occurrence of increased student enrollment. The basic administrative philosophy that regards growing potential student enrollment pools as not knowing enough about Cheyney University in general, and particularly about Cheyney’s unique offerings is realized; thus they need to be informed.
A Touch of CLASS: Cheyney University, a model in effectively recruiting, retaining, and graduating [minority] students, was developed by two Cheyney University faculty members who identify a high correlation between seizing the attention of [minority] students at an early age, and increasing the likelihood of recruiting, retaining, and graduating them at an institution of higher education.
The U.S. Department of Education believes that the best time for college planning is in sixth, seventh, and eighth grades. This philosophy was used to ensure greater admission rates for Cheyney University. Several tasks were implemented. First, a grant proposal was written explaining the specific elements of the project. Once the Pennsylvania State System of Higher Education (PASSHE) funded the grant, arrangements were made to visit the targeted school and develop a timeline for implementation of workshops for middle school students. A rapport had been previously established with the inner-city school’s administration. Consequently, the overall implementation of the project was smooth. School and university personnel had a prior good working relationship. In order to execute the tasks, sixth, seventh, and eighth graders at Imani Education Circle Charter School (IEC) were identified as the target population for the successful model.
261
Proceedings of the 5th Annual National Symposium on Student Retention. Copyright 2009. C-IDEA, The University of Oklahoma.
Imani Education Circle Charter School is an inner-city, community-based public school that uses a multicultural-centered approach for teaching reading, math, the sciences and technology. IEC provides students in grades K-8 an academically rigorous program in a safe and caring environment. By building on the strengths of each student’s cultural heritage and life experiences, IEC addresses the needs of the students, their families, and their communities. Geographically situated in Germantown in northwest Philadelphia, IEC is characterized by its inclusive nature and its holistic student-centered approach and community focus. This approach encourages students from all backgrounds to be guided in work toward building cross-cultural and intra-cultural relationships and achieving academic and social success. The professional affiliation between co-project directors and IEC promotes collaboration with Cheyney University, and that upholds the basic administrative philosophy delineated herein.
A Touch of CLASS: Cheyney University aims to inspire students through a series of junior high school-oriented workshops to increase awareness of the significance of high academic achievement, as well as offer the opportunity to explore university life, meet university students, professors and other personnel. The project co-directors and select teacher candidates traveled to the school’s inner-city location and visited sixth, seventh, and eighth graders at Imani Education Circle Charter School. The project tasks (goals) included working with the school administration to set up a ten-week program for approximately 100 students. Per the grant proposal requirements, an outline of workshops was developed. The university assistant professors researched information for the workshops which included ten sessions: 1) What is A Touch of CLASS: Cheyney University? 2) What is a College? Why Attend College? What Types of Colleges Exist? 3) How to Prepare Academically For college, Why is Self-Esteem/Academic Achievement Important? What can students do in school and outside of the classroom to prepare for high academic achievement and college? 4) How do you choose a college or university? Introducing Cheyney University, professors, and students. Information session about Cheyney 5) Tour/Lunch at Cheyney 6) How much does a college education cost? What is financial aid? 7) Thinking about a career, 8 & 9) Assisting students in creatively expressing what they learned, and 10) Finale.
The University professors infused a service learning component into the ATOC project wherein additional Cheyney students besides selected teacher candidates could participate in the project. This was facilitated by both Cheyney Assistant Professors choosing Cheyney students from their courses in the disciplines of Communications and Education. Students were selected based on their leadership abilities and interests in community affairs that would lend to the overall quality and positive student-to-student interactions in the project. The steps also included making arrangements for the college tour, and the campus lunch. Finally, materials such as Cheyney University folders, copy paper, pencils and Cheyney paraphernalia were purchased in preparation for the sessions. The project’s curricula during each session were presented in a typical classroom setting involving interactive workshops on colleges and universities in general, and Cheyney University in particular. A question-and-answer period followed each session. The program provided information and resources regarding how to get from junior high to high school to college/university. An assessment of how the project impacted students was determined from the pre-and post-survey of knowledge, assessment of student attitudes, data from the participants’ finale and from comments and reactions in follow-up conversations with students and school administrators. A description of the itinerary is included in Appendix A. Impact of ATOC
Based on the implementation of Cheyney’s enrollment management model, enrollment statistics reveal an 8.2-percent increase between Fall 2007 and Fall 2008. A Touch of CLASS: Cheyney University, as an integral part of enrollment management procedures, achieved promising results in attracting students to Cheyney. According to Taylor, Interim Executive Director of Admissions (2008), an enrollment management model includes a process and various activities that involve the entire campus community. The results of A Touch of CLASS: Cheyney University was drawn from a random sample of 120 surveys, which is 20-percent of a total of 407 target population surveys. The total surveys
262
Proceedings of the 5th Annual National Symposium on Student Retention. Copyright 2009. C-IDEA, The University of Oklahoma.
included nineteen and eighteen pre-and post-surveys respectively on “educational knowledge” of sixth graders, including eighteen educational attitude assessments; fifteen and fourteen pre-and post-surveys respectively on “educational knowledge” of seventh graders, including eighteen educational attitude assessments; and thirty-seven and thirty-four pre-and post-surveys respectively on “educational knowledge” of eighth grade students, including thirty-seven attitudinal assessments. A comparative group of 100 ninth grade students were surveyed on “education knowledge” and educational attitudes for a total of 200 ninth grade surveys/assessments. Major outcomes and successes are reflected in the survey results.
A survey measuring attitudes toward education was administered by the co-project directors. This was done after introducing the notion of attending a higher education institution such as Cheyney University upon high school graduation to middle school students and providing them with information regarding the benefits and rewards of high academic achievement through the series of informational workshops. When asked how important it is for young people to attend college, more than half the Imani sixth-grade participants felt that college was the most important thing in their lives. When the seventh graders were asked the same question, more than 50-percent selected college as being the “most important thing in their lives,” and less than 10-percent selected “fairly important.” In examining eighth graders’ attitudes toward education, 71-percent believed it is “the most important thing in their lives” to go to college, 21-percent reported “it is very important”, and 8-percent responded it is “fairly important” to go to college.
Eighty-six percent of the sixth graders rated their credibility of receiving a college education as “extremely worthy.” Fifty percent of the seventh graders rated their credibility of receiving a college education as “extremely worthy,” and 36-percent said “very worthy.” Fifty percent of the eighth graders rated their credibility of receiving a college education as “extremely worthy,” and 50-percent also reported “very worthy.”
Seventy-one percent of sixth graders indicated that they were “highly likely” to become college students and 29-percent responded that they were “very likely” to become a college student. Fifty percent of seventh grades indicated they were “highly likely,” to become a college student, 36-percent said “very likely,” and 14-percent said “fairly likely.” Seventy-one percent of eighth graders indicated that they were “highly likely” to become college students while 29-percent responded that they were “very likely” to become a college student.
Sixth graders’ thoughts on college educated individuals revealed that 50-percent felt that educated individuals were “very important” and 50-percent of the respondents felt these individuals were “the most important people in their lives”. Seventh graders’ thoughts on college educated individuals revealed that 21-percent felt that educated individuals were the “most important people in their lives,” 43-percent said, “very important,” and 36-percent felt these individuals were “fairly important.” The thoughts of the eighth graders on college educated individuals revealed that 64-percent felt that educated individuals were “very important” and 21-percent of the respondents felt these individuals were “the most important people in their lives” while 15-percent reported they were “fairly important.”
Ninety-three percent of the sixth graders responded “extremely important” to the question: how important is it to your parents that you attend college? Seven percent responded, “very important.” Seventy-one percent of the seventh graders felt that it was “extremely important to their parents” that they attend college, and 21-percent said “very important.” Eighty-six percent of eighth graders believe it is “extremely important” to their parents that they attend college while 14-percent indicated it was “very important” to their parents.
To the question: How likely are you to graduate college, 79-percent of sixth graders responded “extremely likely,” and 21-percent responded “very likely. Sixty-four percent of the seventh graders said “extremely likely,” 29-percent said “very likely,” and 7-percent said, “fairly likely.” Of the eighth graders, 64-percent responded “extremely likely,” and 36-percent responded “very likely.”
Fifty-percent of the sixth graders felt that it would take “more than ten [additional] years” to graduate college. At least 64-percent of sixth graders indicated that they would be between the ages of 18 and 22 when they would become a college graduate; thirty-six percent stated they would be between the
263
Proceedings of the 5th Annual National Symposium on Student Retention. Copyright 2009. C-IDEA, The University of Oklahoma.
ages of 23 and 27.” Thirty-six percent of seventh graders in the sample population responded that it would take them only ten years to graduate college, 14-percent of the seventh graders felt that it would take “more than ten [additional] years to graduate college and 50-percent agreed that it would take them less than ten years. Thirty-six percent of seventh graders indicated that they would be between the ages of 18 and 22 when they would become a college graduate and more than 50-percent said they would be between the ages of 23 and 27 or older. Seventy-one percent of eighth graders believe that it would take no more than ten [additional] years” to graduate college. At least 36-percent reported that they would be between the ages of 18 and 22 when they would become a college graduate; fifty-seven percent stated they would be between the ages of 23 and 27 and 7-percent responded that they would be between the ages of 28 and 32 when they would become a college graduate.
The middle schoolers’ attitudes toward education became more positive as their level of knowledge [as assessed by the pre/post surveys] about academic achievement and colleges/universities increased, thus confirming the importance of early intervention programs pertaining to academic achievement and higher education. The unmistakable impact of the program will be when A Touch of CLASS: Cheyney University students are admitted to college in general, and to Cheyney University in particular. Conclusion
After program implementation, the data suggest that middle school students, many who come from socially, educationally, and economically distressed communities, feel strongly about education in a positive way; their concepts of education and educated individuals are overwhelmingly and consistently highly regarded, meaning they place high priority on education ideas. The post surveys of educational knowledge revealed significant increases compared to information analyzed on pre-assessments for Imani sixth, seventh, and eighth graders.
Ninth grade students at New Media Technology Charter School were asked if they received information prior to entering ninth-grade about the notion of attending a higher education institution such as Cheyney University upon high school graduation, or information regarding the benefits and rewards of high academic achievement through the series of informational workshops. One-hundred percent responded that they had not received the information. Most of them had experienced educators and family members stressing the importance of high academic achievement, but never received a series of workshops in middle school on the benefits of college and academic achievement. A comparative analysis was completed with ninth graders from New Media Technology to determine how these students who were not exposed to the workshops in middle school would compare with Imani students in attitudes toward education.
In analyzing the data, sixth, seventh, and eighth graders expressed similarly high attitudes toward the importance of attending college, while ninth graders expressed a significantly lower attitude of 25-percent regarding college as being the most important thing in their lives. Compared to 50-percent of middle schoolers across sixth, seventh, and eighth grades, only 25-percent of ninth graders rated their credibility of receiving a college education as “extremely worthy.” The percentage of ninth graders that had the attitude that they were highly likely to become a college student was also considerably lower than those of the sixth, seventh and eighth graders at 25-percent. Only 15-percent of ninth graders sampled reported that educated individuals were “most important in their lives compared to 21-percent of seventh and eighth graders and 50-percent of sixth graders. Although the ninth graders’ attitudes regarding their parents’ expectations of them going to college as being “extremely important” was rated 70-percent, the middle schoolers’ ratings were even higher.
Thirty-five percent of ninth graders said it is “extremely likely” they would graduate college which is significantly lower than the responses of Imani students. Ten-percent of ninth graders responded to not knowing how many more years it would take for them to graduate college and how old they would be as a college graduate compared to none of the middle schoolers responding in this manner. Moreover,
264
Proceedings of the 5th Annual National Symposium on Student Retention. Copyright 2009. C-IDEA, The University of Oklahoma.
the ninth-grade surveys of educational knowledge revealed a lower knowledgebase of information about workshop topics compared to Imani students.
The results of the surveys have significant implications for the educational needs of inner-city youth. They are more likely to benefit from early intervention strategies, such as A Touch of CLASS: Cheyney University, where an opportunity is provided for students to build their skills regarding admission to and success in university education. The assessment resulted in comparative data pertaining to the target population and a group of high school ninth graders. The findings suggest growth between what middle schoolers did not know and what they now know about preparing for college and the process of admission to institutions of higher education. The fundamental applicability to retention can be seen by viewing ATOC as phase one of the student access and success continuums.
Acknowledgments
Our gratitude is extended to the special people at the following institutions for assistance in making the project and paper possible: The Pennsylvania State System of Higher Education, Cheyney University, Imani Education Circle Charter School, and New Media Technology Charter School.
265
Proceedings of the 5th Annual National Symposium on Student Retention. Copyright 2009. C-IDEA, The University of Oklahoma.
References
Bomer, R. & Dworin, J. 2008. “What we all (supposedly) know about the poor: A Critical discourse analysis of Ruby Payne’s ‘framework,’ English Education.” 40 (2), 101-121.
Clark, S. (2007). The rains: Voices for American liberty. Philadelphia, PA: Laureate House Press. Cheyney University of Pennsylvania. (2004). Employee Handbook. Pennsylvania: Cheyney University of Pennsylvania. Editorial Projects in Education Research Center. (2008, April 1). Cities in Crisis.
Special Analytic Report on High School Graduation. Retrieved April 1, 2008. from americaspromise.org/Dropout Crisis/SWANSONCitiesInCrisis
Finder, A. (2008). Decrease in high school graduates will increase college admission rates. The New York Times, 128 (11). Henslin, J.M. (2002). Essentials of Sociology. Allyn and Bacon: Boston. Levitz, N. (2001). (cited in) Louisiana board of regents public colleges and universities: Executive summary report of finding and recommendations. Louisiana: Louisiana
Board of Regents. McIntyre, D. (2005). Bridging the gap between research and practice. Cambridge
Journal of Education, 35(3), 357-382. Strauss, V. (2008). Population shift sends universities scrambling. Washington Post. Retrieved March 10,
2008 from www.washingtonpost.com. Taylor, Michael. Personal Interview. November 25, 2008. The Annie E. Casey Foundation. (2008, March 11). Ensuring racial and ethnic equity. Retrieved March 11, 2008 from http://www.aecf.org/OurApproach/ EnsuringRacial
AndEthnicEquity.aspx, 2007. U.S. Department of Education, http://www.ed.gov. U.S. Department of Education. (2002). Digest of education statistics 2001. [On-Line].
Available: http://nces.ed.gov/pubs2002/digest2001/tables/PDF/table170.pdf, 2001. U.S. Department of Education. (2002). Think college early: Average college costs. [Online]
Abstract - The number of underprepared students attending college is growing and has not been matched by increases in success or retention rates. A first year program designed to meet students’ needs was implemented to provide needed student support services in a small, rural, liberal arts university. Assessment of the program in terms of semester to semester, fall to fall retention rates, and academic performance resulted in support for and modification to the program. Between 2006 to the present the program has been continuously evaluated and revised to enhance the academic success of these students resulting in moderate increases in student success and retention. This paper will examine the results of the past three years of an intentional, mandatory skill development and advising program for incoming at-risk students in a small liberal arts university.
Retention Initiatives for At-Risk College Students Research on the topics of college student retention and academic performance has steadily increased. Most studies have revealed that early academic performance and warning systems, social and academic interaction especially with faculty, participation in learning communities, and attitudes toward educational attainment and career goals, as well as the sense of belonging to a community positively affect student retention (Potts & Schultz, 2008; Jamelske, 2008, Abrams & Jernigan, 1984; Mattson, 2007; Szafran, 2001; Beck & Davidson, 2001; Pescarella & Terenzini, 1991; Tinto, 1993; Tinto, 1998; Zhao & Kuh, 2004). University Background Heidelberg University typically enrolls an average of 350 first year first time students and has an average overall enrollment of 1100 full-time undergraduate students. Heidelberg is unique in that on average, the percentage of incoming male students (54%) exceeds that of the incoming women students (46%). The five year average student profile of the incoming class is an ACT composite score of 21.43 and a high school GPA of 3.18. In addition, the University has a large portion of incoming students – approximately sixty to sixty-five percent – who indicate they will be participating in one or more athletic teams. The STARTS Program The STARTS (Staying on Track and Reaching Toward Success) program at Heidelberg University (formerly College) was established in 2002 through the Admissions Office to provide academic support and/or structure beyond that received in the classroom for students who did not meet the standard admissions criteria (ACT composite: 18; high school GPA: 2.5). The STARTS program had two main goals: 1) the development of academic skills, study habits, and attitudes necessary for students to be successful in their chosen academic program and 2) helping students acclimate to the college culture.
268
Proceedings of the 5th Annual National Symposium on Student Retention. Copyright 2009. C-IDEA, The University of Oklahoma.
Between 2002 and 2005 there were incoming cohorts of 23, 55, and 34 of students designated as STARTS students. The one year retention rate for these cohorts was 43.5%, 52.7%, and 35.3%. Less than thirty-five percent of these students returned sophomore year, and less than ten percent graduated. During this time there was little assessment of the efficacy of the program. Moreover there was no clear qualification for admission into the program, no real program components, and no administrative oversight for the success of these students. During this time, NDI 128—The Learning Process in an Academic Environment was a suggested study skills course that covered topics such as time management, memory techniques, reading skills, note taking, and test taking strategies. Students were also encouraged to take the University’s required English composition course during the first semester. In addition, individual tutoring was also available to these students if they choose to participate. At no point was the study skills course or other academic support systems required for STARTS students. In 2005-06, the University implemented a Student Success Committee that was charged with examining and assessing existing policies and practices that may contribute to student success. The committee worked with data from prior institutional surveys (NSSE, CIRP, in-house writing assessment, Cornell Critical Thinking) to review and recommend the types of intervention programs and practices that are linked to student success and student persistence. In the Fall semester of 2006 NDI 128 was required for all incoming students in the STARTS program. In addition, a one-hour course (NDI 100 – Critical Thinking) was added to supplement the required study skills course. NDI 100 – Critical Thinking, was designed to help students build critical thinking, writing and reading skills so they can begin to (1) distinguish between fact and opinion, ask questions, make detailed observations, uncover assumptions and define their terms, and make assertions based on sound logic and solid evidence; (2) use vocabulary in context, and recognize main ideas and supporting details; and (3) respond to texts in meaningful ways. Furthermore, all first year students, including those in the STARTS program, took a required first year experience course (FYE 100) which focused on writing, reading, critical thinking skills and campus engagement. FYE 100 is a themed 3-credit academic course, not a college success or extended orientation type of first year class. For the first time retention numbers for the STARTS population improved. During the spring semester 2007, the University’s retention committee began reviewing academic support issues on campus. At this time the committee began looking in earnest at how to define the STARTS program – its purpose, its goals, its methodology, and its target population. Even after a year of intentional programming, the STARTS program existed more as a label for academically underprepared students than anything else; it was unclear which students qualified, by what process students were enrolled in the program, and what the program hoped to accomplish. The University also established that spring an Academic Success Center that would centralize academic support and The committee developed a clear system for identifying at-risk students and for determining which at-risk students are eligible for admission to Heidelberg. It was assumed that developing a better sense of the target population for the STARTS program would aid in the development of a coherent and effective program of study for the students it serves. The committee also determined that the curriculum and outcomes of the STARTS program needed to be reviewed to ensure that the program’s academic goals were met and that the program meshed effectively with the University’s general education curriculum. The committee was also concerned with the lack of structured support in the spring semester and believed some type of intentional intervention needed to be implemented. Charged with developing a more structured program, the committee came up with the following recommendations which were implemented fall semester 2007 and communicated to students prior to their enrolling at the University.
269
Proceedings of the 5th Annual National Symposium on Student Retention. Copyright 2009. C-IDEA, The University of Oklahoma.
Qualification for Admission into the STARTS Program 1. All prospective students will be scored on an admissions index using a formula combining high
school grade point averages with SAT/ACT scores. a. If the high school grade point average is less than 2.0 (on a 4.0 scale), the applicant must have
a minimum composite score of 18 on the ACT or 870 or the SAT b. If the applicant's composite score on the ACT is less than 18 (but not less than 15) or 870 on
the SAT (but not less than 740), he/she must have a cumulative high school grade point average of 2.3 or better (on a 4.0 scale)
c. a score of 18 ACT in English (450 on the critical reasoning portion of the SAT) and a 19 ACT in Math (460 on the math portion of the SAT)
2. Current University resources restrict the number of STARTS participants to 40 students. Requirements for STARTS Participants 1. STARTS students are admitted to Heidelberg University with the belief that they have the potential to
succeed in college, but would benefit from extra mentoring and assistance from faculty and staff. Students in the STARTS program are on academic warning for the first year.
2. STARTS participants must successfully complete all components of the STARTS program and meet
minimum GPA and credit-hour requirements during their first two semesters in order to remain enrolled at the University. Students will be evaluated at the end of each semester by the Director of the Academic Success Center to determine if they have met the requirements of their conditional admission:
Fall Semester: completion of STARTS program components, GPA of at least 1.6 for 12 semester
hours of coursework Spring Semester: completion of STARTS program components, GPA of at least 1.7 for 12-16
semester hours of coursework 3. STARTS students may not enroll in more than 12 credits during their first semester at Heidelberg.
Revised STARTS Program Components and Services Fall Semester 1. STARTS students will enroll in three required courses (totaling eight semester hours) and will work
with their faculty advisor to enroll in four additional hours appropriate to their major and/or interests.
Each STARTS student will enroll in ENG 101 and NDI 128/NDI 100 fall semester. These classes will be structured in a learning community/cluster environment which will allow students to work closely with one another and the faculty teaching these courses. These classes are mandatory and students may not withdraw.
In addition to these classes, each student will also take their FYE 100 seminar depending on their interests and course availability.
2. STARTS students will complete at least five regularly scheduled, required appointments with the following individuals during the semester:
a. Director of the Academic Success Center (two meetings) i. Discuss issues related to academic transition to college
b. Student Support Coordinator (one meeting)
270
Proceedings of the 5th Annual National Symposium on Student Retention. Copyright 2009. C-IDEA, The University of Oklahoma.
i. Establish areas for academic support and arrange for tutors in those areas c. Director of Career Development (one meeting)
i. Discuss career and major options d. Director of Student Activities and Leadership (one meeting)
i. Discuss issues related to social engagement/involvement in college 3. STARTS students will participate in regularly scheduled tutorial sessions during at least ten weeks
during the semester. Areas for academic support will be determined by the Student Support Coordinator.
4. STARTS students will demonstrate participation in the life of the College (campus events, residence hall meetings and activities, student organizations, intercollegiate or intramural athletics).
Spring Semester 1. Depending on the fall semester GPA, STARTS students may be allowed to enroll in more than 12
credit hours spring semester. Students whose fall GPA is between 1.6 and 2.5 will follow a structured 12 credit semester; students whose fall GPA is over 2.6 will be allowed to take up to 15 credit hours.
2. STARTS students will participate in regularly scheduled tutorial sessions during at least ten weeks
during the semester. Areas for academic support will be determined by the Director of the Academic Success Center.
Performance Analysis and Retention Results The following measures were used to determine the effectiveness of the STARTS Program:
1. Fall to fall retention rates 2. Academic indicators (i.e., course completion, term and cumulative GPA) 3. One year follow up of the 2007 cohort group including a check of GPA
Since the implementation in 2006 of a structured, compulsory program, the University has seen first to second year retention rates (Table 1) increase as well as course completion rates and grades for students in the STARTS program (Table 2). Table 1: Retention Rates of STARTS Students
*2008 preliminary return rate based on spring registration for Fall 2009; official fall to fall retention numbers are run on the 15th day of the semester.
271
Proceedings of the 5th Annual National Symposium on Student Retention. Copyright 2009. C-IDEA, The University of Oklahoma.
*preliminary grade and retention results spring semester 2009. For comparative purposes, the academic success of the incoming Fall 2007 cohort was tracked into their sophomore year (Table 3). Four students chose to withdraw from the institution at the end of their 3rd semester leaving 21 of the original 38 students. These students finished their second year with the following results: Table 3: Academic Success of Fall 2007 Cohort
First Fall Term Average GPA Fall 07
Average GPA Spring
08
Average GPA Fall 08
Average GPA Spring
09
2007 2.60 2.38 1.92 2.29 Although their grades fluctuate each semester these are students who, starting their junior year, are persisting towards a degree. Twenty-one of the original 38 (55.2%) in the cohort are returning. Future Challenges In 2008 the number of students in the STARTS program nearly doubled and due to University resources, the STARTS curriculum was readjusted again. The academic success and critical thinking courses were taught as a cohort, but students opted to take either a 2-semester English composition sequence or the one required English composition course not as part of the learning community. The one hour critical thinking course evolved into an advising/college transition course taught by the STARTS faculty advisor. In addition we made the decision to have the STARTS students take the first year seminar (FYE 100) in the spring semester to provide these students a year long intentional first year program, give them more classroom academic support, and offer a course in the second semester that was focused on specific skill development. The retention rate of this cohort is lower than the previous year. One factor that we have not addressed is the large number of athletes who may or may not remain active in their respective sport. Anecdotally we see STARTS students who are enrolled fall semester to play a sport with little intention of returning spring semester or completing a degree. As we gear up for another influx of students in this program determining motivation and career goals will be instrumental in helping them succeed. Discussion It appears that generally the STARTS program is having a beneficial impact on the students in the program. We have begun to see some improvement in retention as well as gains in grades. However, a major concern is the increase in the number of students admitted into the program with no growth in resources. We need to find creative ways to advise students and help them find connections on campus
272
Proceedings of the 5th Annual National Symposium on Student Retention. Copyright 2009. C-IDEA, The University of Oklahoma.
that engage them beyond a team. In addition, many of the students admitted into the STARTS program are first generation and minority students and are not finding faculty, staff and to an extent other students like them. Discussion regarding mentoring programs has begun and that may provide a much needed enhancement to the program. Based on the past three years, the program will continue to be structured as a learning community cohort. Further plans based on University assessment data show a need to include more intentional interventions during the sophomore year. As the third semester GPA indicates, once students are taking more challenging courses in their major, the skill level required to be successful becomes that much more pronounced. Although students who have worked for a year with required writing courses and assistance more than likely will continue to need writing support that provides specific assistance in their major field.
273
Proceedings of the 5th Annual National Symposium on Student Retention. Copyright 2009. C-IDEA, The University of Oklahoma.
References Abrams, H.G. & Jernigan, L.P. (1984). Academic support services and the success of high-risk college
students. American Educational Research Journal 21 (2) , 261-74. Beck, H.P. & Davidson, W.D. ( 2001). Establishing an early warning system: predicting low grades in
college students from survey of academic orientations scores. Research in Higher Education, 42 (6), 709-723.
Jamelske, E. (2009). Measuring the impact of a university first-year experience program on student GPA
and retention. Higher Education. 57 (3), 373-391. Mattson, C.E. (2007, summer). Beyond admission: understanding pre-college variables and the success of
at-risk students. Journal of College Admission, 9-13. Potts, G. & Schultz, B. (2008). The freshman seminar and academic success of at-risk students. College
Student Journal, 42, 647-658. Pescarella, E.T. & Terenzini, P.T. (1991). How college affects students. San Fransisco: Jossey-Bass. Szafran, R. (2001). The Effect of academic load on success for new college students: is lighter better?.”
Research in Higher Education, 42(1), 27-50. Tinto, V. (1993). Leaving college: rethinking the causes and cures of student attrition. Chicago:
University of Chicago Press. Tinto, V. (1998). Stages of students departure: Reflections on the longitudinal character of student
leaving. Journal of Higher Education, 68 (6), 599-623. Zhao, C.M. & Kuh, G.D. (2004). Adding value: Leaning communities and students engagement.
Research in Higher Education 45 (2), 115-138.
274
Proceedings of the 5th Annual National Symposium on Student Retention. Copyright 2009. C-IDEA, The University of Oklahoma.
A Longitudinal Look at the Summer Bridge Program at Chaminade University
Curtis Washburn
Director of Academic Advising and Retention Chaminade University of Honolulu
Abstract - Chaminade University is a small, private Catholic institution in Hawaii. We have been operating a summer bridge program for conditionally admitted students for the past 7 years. The program was originally designed for students who needed pre-college work in English and/or Math, but it has since grown to include a variety of other “at-risk” students as well. From 2002, when we had 11 students arrive, to 2008, when we had 52–the program has increased in size and scope. A longitudinal look at the experience of students indicates that they like the program, and their retention and graduation rates match those of the institution overall. This paper will look at the challenges, successes and assessments of the program over the seven years of operation.
Summer Bridge Studies The research done on the impact of Summer Bridge has been varied. While there seems to be data
to suggest that bridge programs assist with the transition to college (Santa Rita 1996), and improved initial placement in key coursework (Ami 2001) there seems to be disagreement as to whether summer bridge has an impact on the overall retention and graduation of students. Some claim improvement in retention but not GPA (Suhr 1980). Others show improved retention for ethnically diverse students who were unconditionally admitted (Buck 1985). Others have noted in their literature review that findings regarding the success of summer bridge programs are inconsistent (Walpole 2008 – note: Walpole did show similar retention rates for Summer Bridge and control group students). In this paper I will make some rudimentary comparisons between our conditionally admitted students who attended Summer Bridge and the conditionally admitted students who chose not to attend, as that is the closest we can get to a representative control group. Due to university assessments and changes to the program from one year to the next, true comparisons between various years of the program are difficult. Also, the collection of qualitative data has been inconsistent from one year to the next. Nonetheless, our experience in running the summer bridge program can be used to make some conclusions that may be of interest to other institutions facing similar challenges.
Original Problem Prior to 2002, our conditionally admitted students would start their matriculation during the fall
semester. They were limited to 12 credits, but for those students who were taking pre-college classes 7 credits were in pre-college courses for which they were not granted graduation credits, and 5 credits were elective credits that did count. Students were still charged full tuition. Once it became evident to students that they were paying the same, but getting less credit, they sometimes expressed that they felt cheated. In turn, they began to tell their story to other students on campus, creating a perception that the university was taking students’ money unfairly. We made a decision to offer Summer Bridge classes for conditionally admitted students so that they could complete pre-college classes before the beginning of the fall semester. These courses were priced at a less costly summer rate and financial aid was available for students with need from our Trio program, making the program very affordable for most students.
Different Levels of Conditional Admittance Chaminade has four levels of conditional admittance. Level one is for those students whose high
school record and test scores indicate a need for developmental, pre-college coursework to be completed
275
Proceedings of the 5th Annual National Symposium on Student Retention. Copyright 2009. C-IDEA, The University of Oklahoma.
in both English and Mathematics. Level two indicates students whose record and test scores indicate a need only for pre-college English. Level three is for those whose record and scores indicate a need only for pre-college Math and level four is for those students who do not appear to need any pre-college coursework, but whose high school gpas are low. The table below (Table 1) indicates the criteria used for students at each level of conditional admittance.
Table 1: Chaminade Conditional Admittance Classifications Conditional Admit Status Description Criteria Level one Needs Developmental Math and English <400/17 SAT/ACT Math
<400/17 SAT/ACT English Level two Developmental English only >=400/17 SAT/ACT Math
<400/17 SAT/ACT English Level three Developmental Math only <400/17 SAT/ACT Math
>=400/17 SAT/ACT English Level four College courses HS GPA <2.25 or SAT <900 but
Math/English both >=400 The initial years of the summer bridge program were geared only toward those who needed pre-
college English (i.e. Levels one and two). The table below (Table 2) shows the course offerings during the various summer bridge programs as we made changes throughout the years to reflect changing administrative thinking.
Table 2: Summer Bridge Course Offerings by Year Year Summer bridge offerings Student Participation 2002 English pre-college only Voluntary participation only 2003 English and Math pre-college only Voluntary participation only 2004 English pre-college and 1st year seminar Voluntary participation only 2005 English/Math pre-college and 1st year seminar Voluntary participation only 2006 English/Math pre-college and 1st year seminar Voluntary participation only 2007 English/Math pre-college and 100 level Mandatory for level one conditional admits 2008 English/Math pre-college and 100 level and 1st
year seminar Mandatory for level one conditional admits and conditionally admitted from mainland.
2009 English/Math pre-college and 100 level and 1st year seminar
Mandatory for all conditionally admitted students.
Design of the Program The initial design was to offer 2 pre-college courses in the span of five weeks. Our pre-college
reading course (English 091) and our developmental writing course (English 100). The rationale behind this model was that the students with need for developmental need in English were the most at-risk during their first semester of college work, in which they may be exposed to writing intensive courses for which they were not prepared. Unfortunately, this meant that students whose only academic preparation gap was Math would not have anything available to them in the summer, and they would have to wait for the fall to begin enrollment. In the second year, we changed to offering pre-college English and Math courses in the summer bridge, but found that taking the pre-college reading without taking the writing course was not a good fit in terms of content, and it created scheduling problems in the writing sequence in subsequent semesters. By 2004 we added the first year seminar course (known as CUH 100 on campus) to the summer, as we felt that many of the issues that were covered in that course were concepts that we wanted students to be exposed to earlier in the process. By 2007 we decided to make the bridge program mandatory for those students who were level one conditional admits (i.e. students who needed both pre-college English and Math). In 2008, we made it mandatory for level one conditional admits and students
276
Proceedings of the 5th Annual National Symposium on Student Retention. Copyright 2009. C-IDEA, The University of Oklahoma.
from the mainland, as these groups have been among our most at-risk in terms of retention, according to our own internal research.
Voluntary Attendance Since the first years of Summer Bridge were completely voluntary, we were concerned with
convincing enough students to attend so that the program would be effective. In order to entice students that it was in their interest to start college early, we decided that the most effective message would be to the parents. The invitation letters sent to students in the first years emphasized to parents that the cost of the program was lower than the fall, that there was financial aid available, and that completion of the summer program would improve the students’ chances of completing their degree in 4 years, which would be a substantial overall savings. While the number of students who attended in the first years was very small (11 the first year, 12 the second and 12 the third), surveys done with those students indicated that, when asked “who made the decision for you to attend summer bridge?”, a strong majority (8 of 11 in year 1) indicated that one or both of their parents made the decision for them to attend.
Testing Effectiveness In the first years of the program, with such small numbers of students to work with, making
conclusions from the quantitative data was difficult. We had to rely on the qualitative information we received from students in the program and from faculty involved. The results of surveys and discussions with faculty, staff and students supported the notion that students felt summer bridge was preparing them for college academically and socially. However, this was often expressed by students at the end of Summer Bridge, before they had the chance to test their new skills in the fall. Faculty in the courses that followed the pre-college courses, such as English 101 – Introduction to Composition, reported that students in the summer bridge program were better prepared academically than students who did not attend. Students were surveyed in a focus group setting mid semester of their first fall semester to see if they still felt the positive effect of the summer program. Significantly, students responded that they felt that they were better prepared for the academic rigor of college. Perhaps more important to the students though was that they felt more comfortable in navigating the university in general. They had already created bank accounts on the island, they knew how to navigate the bookstore, the cafeteria, where to shop off-campus, etc. So, while other students arriving on campus at the beginning of the fall semester were still having difficulty navigating college in the first few weeks and attempting to stay engaged with their courses, the summer bridge students were already comfortable and were able to keep up with coursework in the fall much sooner than their counterparts. This can perhaps best be understood by a common refrain from summer bridge students who reported in October of their first fall semester that “when other freshman got here in August, they thought we were juniors.”
Curriculum Changes
As noted above, in the initial years of the program, the summer courses were geared toward those students whose pre-college needs included English. We noted that the English courses were greater in sequence (EN 091 and EN 100, then EN 101, then EN 102). In other words, completing EN 091 and EN 100 in the summer program would help students to potentially complete their writing requirements by the end of the first year. For those students who needed pre-college Math, (MA 098), one additional semester of 100 level Math might be their terminal Math course, depending on their chosen major. As the years progressed and we noticed the apparent benefits of the summer bridge program, the decision was made to include courses for those who needed pre-college Math as well.
Program Growth As Summer Bridge continued, and students needing pre-college Math and English were already
established as our target audience for summer bridge participation, the Natural Science and Mathematics department saw another opportunity. Two of our popular programs at Chaminade are the major in
277
Proceedings of the 5th Annual National Symposium on Student Retention. Copyright 2009. C-IDEA, The University of Oklahoma.
Biology (and pre-health science programs) and the major in Forensic Sciences. However, faculty noted that many of the students who entered the university in the first year intending to major in those fields were placed in MA 103 (College Algebra) and were unprepared for the Math skills required in coursework in Biology and Chemistry. Generally, students should enter their first year at the pre-calculus level to be successful in those courses. Offering what we called “Science Bridge” expanded the pool of potential participants even further. Where we began with only those conditional admits who needed pre-college English, then to include conditional admits who needed Math, the Science bridge afforded the opportunity to offer summer participation to two additional groups; conditional admits who were conditional for high school gpa rather than low test scores in English or Math and unconditional admits who were interested in a program in the sciences and wanted to get a head start on their Math skills.
As we saw the apparent benefits of the summer bridge program based on qualitative information gained, we also saw Summer Bridge as a way of testing the motivation of some of our conditional admits to see how serious they were about coming to Chaminade for academics. In 2007, we decided to make summer bridge attendance mandatory for conditional admits who represented two of our biggest retention challenges; conditionally admitted students from the mainland and those students who needed pre-college work in both English and Math. Our internal research on retention has shown that among the most significant pre-enrollment factors affecting retention are geographical origin and high school GPA. In 2009, Chaminade has decided to make summer bridge participation mandatory for all conditionally admitted students, regardless of location or level of conditional admittance.
Successes and Challenges The value of our summer bridge program and the changes we have made have not come through
discernible quantitative analysis showing improved scores or retention. However, we have seen a number of benefits to the university and the student body that are difficult to quantify. As Chaminade has moved from making summer bridge attendance voluntary to “voluntary for some and mandatory for others” to finally “mandatory for all” conditionally admitted students, our admissions department is reporting in Spring 2009 that the decision to make the program mandatory has had an immediate and positive effect on the academic reputation of the school among local high school counselors. We are hopeful that this will also raise the level of the applicants in coming years.
Large Group Strains Resources Chaminade has faced challenges over the years as policies have changed and offerings expanded
to create much larger summer bridge cohorts. In the first few years, when we averaged approximately 12 students for the summer, it was fairly easy for a small group of faculty, staff and peer mentors to assist these students. The summer bridge of 2008, with 52 students, tested our institutional capacity to handle such a large group. In summer 2009, we have over 100 students. While we view this as positive in terms of the project meeting its’ intended objectives of preparing academically underprepared students for the rigor of college work, one of the main objectives of creating a small cohort of students who become engaged with the university quickly is more difficult to manage as the group gets larger each summer. The summer 2009 group represents over one-third of the incoming freshman class. This is already creating enormous challenges for the university in considering how to administer fall orientation, the impact on faculty loads for the fall semester, the impact of first year cohorting, etc.
Quantitative Effects While the qualitative data gathered has not been consistent in the manner collected (on-line
surveys, focus groups, informal discussions), it has been fairly consistent in the responses from students, faculty and administrators. All see the value of the summer programs in terms of preparation of students for their college. Unfortunately, the quantitative look at the difference between summer bridge students and other conditional admits does not show dramatic improvement in retention. The tables below show the how the summer bridge students compared in a variety of measures with those conditionally admitted
278
Proceedings of the 5th Annual National Symposium on Student Retention. Copyright 2009. C-IDEA, The University of Oklahoma.
students who chose not to attend. Since Chaminade has made it mandatory for all conditionally admitted students to attend Summer Bridge starting in 2009, comparisons of this nature will not be possible in the future. As can be seen in the data, while Summer Bridge students have generally performed better in some areas than their non-attending counterparts, the difference is not dramatic and the non-attending students fare better in other areas.
Comparison – Pre Entry As noted in the following tables (Tables 3 and 4)), in comparison with the other conditionally
admitted students, our summer bridge students have generally entered the university with slightly higher high school gpas, but lower total SAT scores. This is consistent with their placement. As the early years of the summer bridge program were only for those who needed to complete pre-college work, students with higher SAT scores would not have been invited to Summer Bridge. Many of our conditionally admitted students fit into one of two possible scenarios; “high gpa with low sat/act” or “low with high sat/act”. Generally, those in the first scenario were the students invited to Summer Bridge in the beginning years of the program. Note: the following tables compare conditionally admitted students who attended Summer Bridge with conditionally admitted students who did not attend Summer Bridge. This part of the paper is not making comparisons to the unconditionally admitted students.
Table 3: High School GPA by Summer Bridge attendance
Comparison – Retention, First Term GPA and Cumulative GPA The next three tables (Table 5, 6 and 7) show a comparison of summer bridge students and non-
attending summer bridge students in terms of their first fall GPA and their second and third fall retention
279
Proceedings of the 5th Annual National Symposium on Student Retention. Copyright 2009. C-IDEA, The University of Oklahoma.
rates. Note that retention is also compared to the unconditionally admitted students who would not be part of Summer Bridge and who begin in the fall semester. With respect to first tem GPA, as is shown in the far right column, the difference has not been consistent. Some years our summer bridge students appear to perform better in the first fall, some years not.
Table 5: First Term GPA by Summer Bridge Attendance
Based on the literature regarding summer bridge programs around the country, we would have hoped that the retention rate for summer bridge students would exceed those of other conditional admits. As is noted in tables 6 and 7, the retention rates are compared between summer bridge students, other conditionally admitted students and the unconditionally admitted students. As is indicated in the following tables, the retention of summer bridge students is inconsistent in comparison with other conditional admits. Some years we see better retention among summer bridge students, some years not.
Table 6: Second Fall Retention by entry type. Year Summer
* based on pre-registration as of July 20, 2009 In the next table (Table 8), we see the difference between summer bridge students and non
attending students in terms of their cumulative GPA over their entire enrollment at Chaminade. Once again, the difference is not consistent, with some summer bridge cohorts doing better than their non
280
Proceedings of the 5th Annual National Symposium on Student Retention. Copyright 2009. C-IDEA, The University of Oklahoma.
attending counterparts and some cohorts doing worse. With the exception of the 2003 cohort, most years are consistent in that gains in the first term were held in the cumulative. In 2008, the variance between cumulative and first fall GPA can be explained by the GPA achieved in the summer classes for the summer bridge attendees.
Table 8: Cumulative GPA by Summer Bridge Attendance
Credits Completed The next table (Table 9) shows the average (mean) credits completed by summer bridge students,
as compared to those conditionally admitted students who chose not to attend Summer Bridge. The last column (Difference in credits) shows that while summer bridge students do appear to complete more credits at Chaminade, the difference is modest. Note: credits completed in pre-college courses are not included in the totals.
Table 9: Credits Completed by Summer Bridge attendance.
Academic Standing Compared The next table (Table 10) compares the experience of Summer Bridge attending students and
those who did not in terms of whether they remained in good academic standing while at Chaminade. Good Academic Standing at Chaminade is maintaining a cumulative GPA of 2.0 or higher. Once again, the difference of experience between the 2 groups is not dramatic, and in many years the non summer bridge attending students were slightly less likely to stay in good standing as compared to non attending conditional admits. One theory that has been discussed on campus is that summer bridge students sometimes become a little over-confident after the summer program, and are prone to slumping in their freshman fall or spring.
281
Proceedings of the 5th Annual National Symposium on Student Retention. Copyright 2009. C-IDEA, The University of Oklahoma.
Table 10: Academic Standing by Summer Bridge attendance
Degree Completion at Chaminade The next table (Table 11) shows the number and percentage of students who completed their
bachelor’s degree at Chaminade, comparing summer bridge attendees and non-summer bridge attendees. Again, the gains in the summer bridge program are modest, and it is difficult to make conclusions with such small data sets.
Table 11: Degree Completion by Summer Bridge Attendance
Future Challenges Even though we are not seeing gains in retention or graduation rates for those students attending
Summer Bridge, we have expanded the program by making Summer Bridge mandatory for all conditional admits. In July 2009, we had 106 students arrive for Summer Bridge, more than doubling last year’s group. This will limit our ability to make comparisons to control groups of students on campus, but larger groups will afford us the potential to look at our summer bridge students with more statistical significance.
One of the internal institutional challenges of having large numbers of students in the summer is that it will impact fall cohort scheduling, which will alter the essence of our attempt to create learning communities in the first year cohorts. Another point of potential future research is to see if perhaps Summer Bridge is creating over-confidence in some students, thereby weakening their chances for long-term success?
282
Proceedings of the 5th Annual National Symposium on Student Retention. Copyright 2009. C-IDEA, The University of Oklahoma.
Discussion
While our experience with Summer Bridge has been generally positive, it is disappointing that we do not see greater gains in retention and degree completion between our summer bridge students and other conditionally admitted students. We hope that our summer bridge students will continue to graduate at rates that approach the university’s overall graduation rate. Further research should look into the difference between our summer bridge students and other conditional admits in terms of transferring. Of those students who do leave our institution, how many enroll and complete degrees at other institutions? Looking back, we could have done more qualitative analysis of our conditionally admitted students who chose not to attend Summer Bridge to see if their experience was significantly different in terms of making connections on campus. For future cohorts of summer bridge students, we will have to alter our methods of testing their experience to make meaningful conclusions.
Despite the apparent lack of improvement in retention and GPA among students who attend Summer Bridge, the institution has so far remained committed to growing and improving the program. This is due to the other less tangible benefits that we have seen over the years of the program. Some of these benefits include: a) improved academic reputation of the institution among local high school counselors (i.e. we are viewed as being a more serious institution); b) the ability to weed out problem students during the summer, thereby minimizing the problems they may cause over the course of a long fall semester within a much larger population of students; c) the students reported satisfaction with the program; d) faculty responses in the fall semester, indicating that summer students appear to be better prepared. However, the challenges of 2009 are already leading to conversations on campus about the best ways to administer the program in the future, in light of the challenges we face.
283
Proceedings of the 5th Annual National Symposium on Student Retention. Copyright 2009. C-IDEA, The University of Oklahoma.
References Ami, C. (2001, January 1). The Effects of a Four-Week Summer Bridge Program. (ERIC Document
Reproduction Service No. ED460016) Retrieved May 10, 2009, from ERIC database. Buck, C. (1985, February 18). Summer Bridge: A Residential Learning Experience for High Risk
Freshmen at the University of California, San Diego. (ERIC Document Reproduction Service No. ED264462) Retrieved May 10, 2009, from ERIC database.
Santa Rita, E., & Bacote, J. (1996, February 26). The Benefits of College Discovery Prefreshman
Summer Program for Minority and Low Income Students. (ERIC Document Reproduction Service No. ED394536) Retrieved May 10, 2009, from ERIC database.
Suhr, J., & California Univ., D. (1980, October 1). Study of the 1978 Summer STEP. The Summer Bridge
Program at the Learning Skills Center, University of California, Davis. (ERIC Document Reproduction Service No. ED256275) Retrieved May 10, 2009, from ERIC database.
Walpole, M., Simmerman, H., Mack, C., Mills, J., Scales, M., & Albano, D. (2008, January 1). Bridge to
Success: Insight into Summer Bridge Program Students' College Transition. Journal of The First-Year Experience & Students in Transition, 20(1), 11-30. (ERIC Document Reproduction Service No. EJ798201) Retrieved May 10, 2009, from ERIC database.
284
Proceedings of the 5th Annual National Symposium on Student Retention. Copyright 2009. C-IDEA, The University of Oklahoma.
Alphabet Soup: The ABCs of GPAs
Jaclyn Cameron Research Associate DePaul University
[email protected] Abstract: Research has consistently supported first year grade point average as a standard predictor of retention and graduation, such that students earning higher first year GPAs are more likely to persist to graduation. However, GPA is relative, as two students with the same GPA could have vastly different academic experiences, as a 2.50 GPA could represent grades of mostly Cs, or a combination of As and Fs. This research will explore the notion that going beyond the calculated GPA can help better define student attrition behaviors. The hypothesis suggests that students who more frequently earn grades at the extremes will graduate at a lower rate than those consistently earning moderate grades. Using traditional freshmen earning first year GPAs between 2.0 and 3.0, cluster analyses will form groups based on grades earned. After comparing retention and graduation rates of the groups, course analyses will identify if similar or different ‘problem’ subjects exist among the clusters. Additionally, the grade clusters will be linked back to high school GPAs to determine if patterns can be identified. This research has implications for early warning and at-risk models, student advising, and potentially student service programs targeting stressors of academic achievement. Introduction Research has highlighted the importance of first year GPA on retention and degree attainment (Adelman, 1999; Pascarella and Terenzini, 1991; NCES, 2001). It wasn’t until Adelman revised his first “Toolbox” that researchers in higher education began to think critically about student coursework that directly contributes to one’s grade point average (2006). Gateway courses, or those courses in which students academically struggle, are widely recognized within institutions and academic programs, but are rarely discussed outside the hallways and conference rooms of institutional property. It is common practice, however, to place students on academic probation, pending academic dismissal if a minimum grade point average is not maintained. It is this practice that goes frequently unquestioned, such that academic investigation into the causes of low grade point average remains unpublicized. A scholarly search relating grade point average to coursework primarily returns specialized research focused on specific disciplines (such as the math and science fields) and remedial coursework. This study attempts to break away from the specifics and venture into the realm of generalized study. Based on an internal institutional report authored by a colleague, this study investigates the grade earning patterns of students with a first year GPA between 2.0 to 3.0 (Filkins, 2003). The institution at which the original study was first done requires a minimum 2.0 GPA to maintain academic good standing. The group of 2.0 to 3.0 GPA students was selected due to containing both the most at-risk students as well as students who are academically average. The intent is to identify differences in retention and graduation rates of students based on the patterns of grades earned, within the GPA range. Additionally, this research looks at course subjects that may be potentially detrimental to grade patterns. The institution at which this research was conducted is a large, private, 4-year, research intensive university in a Midwest urban location.
285
Proceedings of the 5th Annual National Symposium on Student Retention. Copyright 2009. C-IDEA, The University of Oklahoma.
Methodology Three years of entering freshmen cohorts were aggregated (n= 2,134) and first year college GPAs were collected. Students with first year GPAs within the range of 2.00 and 3.00 were extracted as the research sample. Course rosters for the first year of enrollment provided the number of courses enrolled within the first year and the count of each letter grade earned (A through F) for each individual student. Only courses in which the student earned a grade between A to F were included in the total course counts. Counts of each letter grade were recoded into a proportion of total grades earned. Additional data such as yearly retention/graduation statuses, high school GPA, and course descriptions were also compiled into the dataset.
The distribution of grades earned by the students is represented in Graph 1. As is expected, the distribution is unimodal, with a majority of B’s earned. A k-means cluster statistical procedure was used to identify groups of students with similar distributions of grade proportions. The cluster analysis fit the sample into six clusters, based on the proportion of A’s, A-‘s, B+’s, etc. earned. Table 1 displays the results of the cluster analysis. The clusters were named based on the highest proportion of grades earned
286
Proceedings of the 5th Annual National Symposium on Student Retention. Copyright 2009. C-IDEA, The University of Oklahoma.
within that group. Thus, the groups resulted in the A/F cluster (n=273), B+ cluster (n=346), B cluster (n=433), B- cluster (n=410), C+ cluster (n=344), and C cluster (n=328). Average first year GPAs additionally help illustrate the differences between the groups. The A/F cluster has a mean GPA of 2.66, the B+ and B clusters are just above at 2.78 and 2.72, the B- and C+ clusters have a mean of 2.53, and the C cluster has the lowest mean GPA of 2.48. Graph 2 illustrates the distribution of grades earned within each cluster. Notice that the A/F cluster has the highest percent of earned F’s, and the B- and C+ clusters are very similar in distribution.
Results Retention and Graduation Rate Comparisons Retention and graduation rates were compared between the six groups as well as in relation to the overall University three year average rates. Retention rates are shown separately across six years in Graph 3. The B+ cluster has the highest first through third year retention rates at 87%, 81% and 77% respectively, closely followed by the B cluster. The lower grade clusters (C and A/F) are retained at the lowest rates, even below the average university rates. Beyond the third year rates, we see the most drastic drop in retention rates of the A/F cluster, partially due to a proportion of students graduating. Interestingly, the C cluster has become the most likely group to retain through the later years, as compared to the other grade clusters and the university average.
Graduation rate comparisons mimic the same pattern of success across the groups, such that the B cluster graduates at higher rates compared to other groups. Graph 4 shows the rates of each group. The overall University four year rate is higher than any of the groups, but is slightly surpassed by the B cluster at the sixth year. The A/F cluster has the lowest graduation rates and is noticeably lower than the overall six year graduation rate.
By combining the retention and graduation rates across six years into an overall success measure, the patterns of each group can be generalized. Graph 5 illustrates the B and B+ clusters as having the greatest amount of success. The lower grade clusters have the lowest success rates, as expected. The B- cluster experiences the most interesting pattern, as early success rates closely follow the University rates but fall below the overall rates by the third year and continue to remain below standard. A similar pattern is also observed in the C+ cluster.
287
Proceedings of the 5th Annual National Symposium on Student Retention. Copyright 2009. C-IDEA, The University of Oklahoma.
288
Proceedings of the 5th Annual National Symposium on Student Retention. Copyright 2009. C-IDEA, The University of Oklahoma.
Problem Subjects by Clusters The first year courses were analyzed to determine if particular course subjects for each cluster could be identified as potential problem courses in which student earned low grades. Overall, the top ten subjects (13 in total, as 5 subjects had the same proportion of D’s and F’s earned) with at least 100 enrollments and the highest percent of students earning D’s and F’s are shown in Table 2. As is evidenced, mathematics related subjects are plentiful, with economics courses topping the list for this population of students. Also on the list, notably, are the subjects of anthropology, Spanish, and religion - subjects that may be unique to this population. For each of the clusters, however, a different picture emerges. Only course subjects with at least 50 enrollments were analyzed for each cluster. The top five courses are presented, along with the percent of D and F grades earned for any additional top ten subjects that do not appear in the group top five. As illustrated in Table 2, the A/F group only has enrollments in seven of the top thirteen overall subjects. Interestingly, this group performs poorly on remedial coursework at a high rate. This may indicate that this group may not have been as academically prepared for the rigor of college coursework as other groups. Unfortunately, the inadequacy of academic preparation is not being easily conquered, as it is the introductory coursework which is designed to prepare the student for college level coursework that many of these students are earning low grades in. The B+ cluster reveals a different array of course subjects. What is most striking, however, is the lower rate of D’s and F’s earned overall, compared to the overall rates of the A/F group. The B cluster subjects show a shift in a few subjects, compared to the B+ group. The B group has slightly higher D/F rates than the B+ group, but comparably lower rates than the A/F group. The B- group results with a very similar distribution to the B group, with a few minor rearrangements. One concern with the B- group may be that students are fairly likely to earn a D or F in Biology courses. Additionally, this group is more at risk of earning low grades in general, compared to the other two B groups. The C+ group shows Biology as the subject with the most D’s and F’s earned. Courses in religion are also high on this list, although the D/F
289
Proceedings of the 5th Annual National Symposium on Student Retention. Copyright 2009. C-IDEA, The University of Oklahoma.
Table2. Top Subjects of D or F Grades Earned. Sorted by overall top subjects.
290
Proceedings of the 5th Annual National Symposium on Student Retention. Copyright 2009. C-IDEA, The University of Oklahoma.
rate for this group is lower than the D/F rate of the B- group. Political science, however, results in a lower D/F rate for this group than all groups above this group who have adequate enrollments, as well as overall. Again, it can be noticed that the D/F rates for this group are higher, in general, than the B+ group specifically. The last group, the C cluster, shows yet another variation of subjects in regards to D/F rates. Similar to the B+ group, this group has lower D/F rates in general. Overall, math subjects remain constant problematic subjects for this set of students. Interestingly, the subject of anthropology only appears on the overall list and is not specific to any particular group. Although the lists differ for each clustered group, the only obvious noteworthy difference is the remedial coursework that exists high on the A/F cluster list. Cluster Relationship to High School GPA The final analysis examines if a relationship between the pattern of grades earned and high school GPA exists. The premise is that high school GPAs may help identify students that have always performed consistently average from students that performed above average in high school and have found obstacles with particular coursework in college. Initial correlations reveal that high school GPAs are related to first year GPAs for all the grade clusters except the B+ group (Table 3). As illustrated, the correlations are significant; however, the strength of the association is weak for all the groups. A One-Way ANOVA was performed to test if differences exist between the groups on high school GPA. The test was significant, F(5, 1965) = 3.09, p < .01, however Scheffѐ post hoc tests revealed no significant differences between the groups. The result of the ANOVA is most likely a reflection of the large sample size. A look at the means of the groups describes the expected pattern. The A/F cluster had a 3.10 average GPA and the B+ group averaged a 3.12. The additional groups all had lower average GPAs from 3.04 for the B cluster, 3.00 for the B- cluster, 3.02 for the C+ cluster, to 3.00 for the C cluster. Conclusion Overall, grade patterns do distinguish students on measures of success. Students that earned high proportions of A’s and F’s in the first year were least likely to be retained after the first year. The drop in retention rates by the fourth year was not indicative of large proportions of students graduating, but was rather evidence of student attrition. Coupled with the evidence that these students also earn a high proportion of D’s and F’s in remedial coursework, this group emerges as a potentially at-risk population. It may be that these students have unique characteristics not captured in this study that could be identified in order to remedy the pattern.
Students who earn predominantly C’s are more likely to be retained than the A/F group, although it seems they may need additional time to complete degree requirements. According to the subject list, though, these students earn lower proportions of D’s and F’s. Depending on the institution’s academic probation policy, these students may constantly teeter on the border such that one below average grade can push them into the red. The B, B- and C+ clusters share common ‘problem’ subjects of math and biology, and differ only slightly in the proportions of D’s and F’s earned in the subjects overall. Earning a larger proportion of higher grades, however, does result in higher retention and graduation rates.
Cluster Pearson’s Correlation Significance
A/F .170 .007
B+ .081 .148
B .181 .000
B- .169 .001
C+ .122 .030
C .206 .000 Table 3. Correlations of GPA and Grade Cluster
291
Proceedings of the 5th Annual National Symposium on Student Retention. Copyright 2009. C-IDEA, The University of Oklahoma.
The B+ cluster is the best off group in terms of low D/F rates and high retention/graduation rates across the board. It appears that this group is either postponing enrollment in some of the notoriously dangerous subjects such as biology, economics, and computer science, or they are in academic programs that do not require such subjects. An alternative explanation is the advising students received, which may have suggested a more balanced course load between problem subjects. Additionally, given the fact that these students also have the highest high school GPA, this result may be indicative of a desire to avoid the perceived harder courses in order to maintain a high GPA.
The implications of this study are wide ranging. First, although high school GPAs are not significantly different between the groups, there is a pattern of lower GPAs for the lower grade earning groups. This knowledge may be useful to advisors when helping student plan their course enrollments. Second, the A/F group may have specific needs that should be addressed by academic support programs in order to better balance course enrollments and provide the necessary tools for overall success. It is obvious that these students have academic talent, but are encountering detrimental road blocks. Third, just as there are ‘problem’ subjects, there may also be the ‘easy’ subjects. It is possible that the B+ students have taken advantage of the ‘easy’ subjects but are only postponing the inevitable. Alternatively, there may be a lesson that can be learned from this group, as it may not be beneficial for students to jump in to the deep waters of college level math and sciences in the first year, but should start by wading into the rigor of college coursework. Last, early warning and at-risk systems would benefit from the knowledge of both the pattern of grades earned by students, as well as the subjects in which those grades are earned. A low grade in an upper level math course may not be as detrimental to a student’s success as a low grade in a middle level math course, coupled with a low grade in psychology. This may seem intuitive, but early warning and at-risk models are commonly simplified in order to catch students at a desperate point.
In conclusion, this research study highlights the fact that a GPA functions exactly as it is defined – it is an average. As a useful, quick description, it can identify the general performance of a student. However, without delving into the mathematical theory underneath the concept, an average collapses extreme scores into a mediocre middle. The underlying patterns beneath the same average can tell vastly different stories about students and their likelihood of success. Although institutions cannot monitor every student, we should not be complacent with generalized information if we strive to best serve our students and improve our success rates.
292
Proceedings of the 5th Annual National Symposium on Student Retention. Copyright 2009. C-IDEA, The University of Oklahoma.
Bibliography
Adelman, C. (1999). Answers in the Toolbox: Academic Intensity, Attendance Patterns, and Bachelor’s Degree Attainment. U.S. Department of Education, Office of Educational
Research and Improvement. Washington, DC: U.S. Government Printing Office. Adelman, C. (2006) The Toolbox Revisited: Paths to Degree Completion From High School
Through College. Washington, D.C.: U.S. Department of Education. Filkins, J. (2003). “An Analysis of Course Grade Patterns of the 2.0-2.5 GPA Group”. Internal
report for the Office of Institutional Planning and Research, DePaul University. Retrieved at http://oipr.depaul.edu/surveys/gradereten/Coursehome.asp.
National Center for Education Statistics (2001). High School Academic Curriculum and the
Persistence Path Through College, NCES 2001–163, by Laura Horn and Lawrence K. Kojaku. Project Officer: C. Dennis Carroll. Washington, DC.
Pascarella, E.T., and Terenzini, P.T. (1991). How College Affects Students: Findings and
Insights From Twenty Years of Research. San Francisco: Jossey-Bass.
293
Proceedings of the 5th Annual National Symposium on Student Retention. Copyright 2009. C-IDEA, The University of Oklahoma.
Growing the Nurse Pipeline: Examining the Role of the BSN
Nathan Daun-Barnett Educational Leadership and Policy
Abstract – States across the nation and the healthcare industry as a whole continue to struggle with the increasing demand for skilled nurses, high attrition among the existing workforce, and a pool of potential nurses that is inadequate to meet the growing demand. This shortage is exacerbated by an aging population that is becoming more ethnically and racially diverse. Nursing professionals agree that the central barrier to producing more nurses is the constrained pipeline of nurse educators and clinical supervisors. In this paper, we argue this is an issue of retention, though framed in slightly different terms. In research on nursing education and professional practice, retention is central to the conversation. Educators focus on retaining students in programs and at institutions; employers are concerned with the quality of the work place and work experience. Less attention has been paid to retaining more students and nurses in the education pipeline where the critical linkage is the Bachelor’s of Science in Nursing (BSN), which we argue is the key to solving the systemic retention challenges. Currently, the Associate’s and the Bachelor’s both lead to certification as an RN. High entry-level wages serve as a deterrent to remain in the educational pipeline.
Introduction
America is facing a crisis in healthcare and one of the central challenges is the growing shortage of nurses. The National nursing shortage is estimated to reach anywhere from a total of 500,000 (Joynt & Kimball, 2008) to nearly 800,000 Registered Nurses (RN's) (American Association of Community Colleges, 2006) by 2025. Higher than average wages for nurses, frequent expenses for mandatory overtime, and nurse attrition are driving up the costs for providing healthcare. The nursing shortage also has the potential to affect the quality of the healthcare provided to people across the country and particularly in settings that cannot afford to compete for the scarce pool of nurses.
In June 2008, the Department of Labor, Employment, and Training Administration (Joynt & Kimball, 2008) in conjunction with several other leading organizations held a summit to consider how best to increase our nation’s capacity to train more nurses to meet the demand. Their report suggests four pillars to increasing the nurse production pipeline: (1) creating strategic partnerships to align and leverage resources, (2) increasing nurse faculty capacity and diversity, (3) redesigning nurse education, and (4) improving flexibility of policy and regulation. Most strategies for increasing the capacity of the nursing pipeline recognize the important role of training more nurse educators in the classroom and the clinical setting. Similarly, there is some recognition of the importance of increasing retention of nurses while in school and also in the profession where burnout can be high. Both student retention and workforce retention are critical issues but a third component is equally critical - nurse pipeline retention. In order to expand the nurse faculty pipeline, it is critical to keep nurses engaged as lifelong learners who progress to the masters and doctoral levels of education.
The conventional pipeline metaphor is aptly described in terms of supply and demand of students and nurses – more students are interested in nursing than can be accommodated by
294
Proceedings of the 5th Annual National Symposium on Student Retention. Copyright 2009. C-IDEA, The University of Oklahoma.
existing educational programs; programs are constrained by a lack of faculty and clinical supervisors; the system is not sufficient to the task of training an adequate number of nurses; and too few nurses are produced as a result. In simple terms, this depiction of the pipeline is true. But a closer look at the sequencing of steps in the education of a nursing professional indicates an important challenge that needs to be addressed.
Currently, there are no fewer than three points of entry into the nursing profession - Licensed Practical Nurse (LPN), the Associates Degree in Nursing (ADN), and the Bachelor of Science in Nursing (BSN). A particular challenge for nursing has is that both the ADN and the BSN lead to the same certification as an RN (through successful completion of the degree program and passage of the N-CLEX). In simple economic terms, the fact that both degrees lead to the same level of the nurse professional introduces a sort of market failure where high demand and salary, coupled with a shorter pathway to the RN through the ADN, results in fewer BSN trained nurses. The more important problem is that without the BSN, nurses cannot enter into the appropriate training programs at the masters and doctoral level to become nursing educators. Currently, colleges and universities produce nearly twice as many ADNs as BSNs (National Center for Education Statistics, 2008). The market failure then is that the expected benefit of earning the BSN after practicing in the field as an RN is less than the cost of attaining the additional credential. A growing number of employers will pay a premium for a BSN level nurse professional but the direct costs of the degree combined with the potential costs of foregone wages reduce the incentive for remaining in the pipeline.
From this perspective, this paper suggests that educators and healthcare professionals should consider nurse retention in all three ways – institutionally, professionally, and systemically – in order to effectively address the nursing shortage. The paper begins by examining the current nursing crisis, considers the evolution of the profession and the changing role of nurses. Next, the paper discusses current retention practices at each level and makes particular recommendations to address the systemic level of retention, which has been less clearly established and addressed in the literature. The Nursing Shortage Driving the Agenda
The nursing shortage is, in very simple terms, an issue of supply and demand. On the supply side, the nursing workforce is aging, meaning there are not enough nurses entering the profession and in many cases entering nurses are above the traditional college age (Heller, Oros, & Durney-Crowley, 2006; Michigan Center for Nursing, 2005). Retirements continue to open more spaces than are currently being filled. The faculty is aging as well and this may be even more pronounced than the shortage in direct care (National League for Nursing, 2006a). MONE and others (2006) estimates 36% of full time faculty members are 55 or older. Most colleges and universities at all levels find it exceedingly difficult to fill open faculty positions. The National League of Nursing (NLN) for example, notes in congressional testimony that more than 8% of nursing faculty positions remain unfilled (about 1 of every 12) (National League for Nursing, 2006c). Additionally, there are too few clinical sites to provide adequate on-site training and supervision for even the existing pool of students.
On the Demand Side, as the baby boomer generation enters retirement and life expectancy continues to climb, there will be more people demanding greater levels of care. American demography is shifting toward a more culturally, racially, and ethnically diverse population calling for more nurses from a variety of backgrounds (Heller, Oros, & Durney-Crowley, 2006). In 2007, more than 36,000 otherwise qualified students were turned away from BSN programs across the country (American Association of Colleges of Nursing, 2008). These numbers approach nearly 125,000 prospective nurses turned away from all accredited programs across the country at the Associates and Bachelor’s levels (National League for Nursing, 2006b).
295
Proceedings of the 5th Annual National Symposium on Student Retention. Copyright 2009. C-IDEA, The University of Oklahoma.
The National League of Nursing (NLN), the National Council of State Boards of Nursing (NCBSN), and the American Association of Colleges of Nursing (AACN), among others, have provided vocal leadership within the profession to diagnose the problem and to find promising practices to address the challenge. Figure 1 demonstrates that for the past decade, the numbers of nursing graduates at public two-year and four-year institutions has risen steadily. According the Integrated Postsecondary Education Data System (IPEDS) annual completion surveys, the production of nurses at the Associates and Bachelor’s levels at public colleges and universities has increased from a low of nearly 58,000 nurses in 2000 to more than 91,000 in 2006. Even with these improvements, the demands in the profession are outpacing higher education’s ability to meet the needs of healthcare providers. The Bureau of Labor Statistics estimates that more than one million new and existing nursing positions will need to be filled by 2016. In other words, the US needs to produce nearly 143,000 new nurses per year for the next 7 years; even at 10% growth per year, the production of nurses would fall short of filling expected vacancies.
An Evolving Nursing Profession
While nursing shortages continue to grow and the role of nurses continues to change, as it has done over the past thirty years, there are growing calls for a shift toward the Bachelor’s degree as the standard for practice. The nursing community in the state of Michigan put forth a bold vision to the Chief Nurse Executive of Michigan calling for the “educational advancement of the nursing profession in Michigan”. The proposal puts forth a plan to shift the standard of practice in Michigan toward greater emphasis on BSN trained Registered Nurses (RN). This is an important distinction that should not pass by unnoticed.
In the late 1980s, North Dakota enacted policy requiring that the baccalaureate degree become the only acceptable path to the RN. Nelson (2002) reports, not surprisingly that more than 54% of nurses in the state are now at the BSN level. The North Dakota initiative was not an entirely new idea. In fact, it can be traced to a paper presented almost forty years ago at the American Nursing Association annual meeting (Nelson, 2002). The Michigan proposal to the Chief Nurse executive sets four goals for the state, identifying an increase in the proportion of BSNs in the nursing workforce and a plan for getting there. The proposal then calls for a system that facilitates movement of nurses through the educational pipeline gradually and over the course of their careers. This difference is critical because it recognizes the central value of the certificate and associate level credentials (AAS and ADN). Eliminating the shortage can simply not be accomplished if the pre-Bachelor’s entry points are not appropriately valued and maximized. Finally, proposal then calls for a system that facilitates movement of nurses through the educational pipeline gradually and over the course of their careers.
There are several rationales for the advancement of the BSN as the standard for practice in the profession. Below we describe three major rationales put forth to make the case that the BSN should become a part of the standard practice for nurses. We differentiate rationales in this case from theories for two reasons: (1) they are utilized for expressly political purposes, and (2) they are based upon mostly correlational data (with the exception of the Aiken article discussed below). Rationales are developed as mechanisms for influencing the political process and as such, multiple rationales may be brought to bear on a given public policy issue. In this case, each of the three rationales described below are attempts to explain the nature of the problem, suggesting one final outcome: BSN as the standard for the nursing profession. We suggest that the rationales may not constitute fully formed theory and they may not be rigorously and empirically tested, but they capture important elements of an important public policy debate.
The Changing Role of Nurses
The Michigan proposal spends a great deal of time articulating the evolution of the medical field and the nursing profession over the past 50 years. They point out accurately that today’s nurses are asked to perform more complex procedures, deal with more difficult sorts of
296
Proceedings of the 5th Annual National Symposium on Student Retention. Copyright 2009. C-IDEA, The University of Oklahoma.
patient care like that experienced in cardiac units, understand a vastly expanded array of pharmaceutical products, become computer literate, and establish stronger levels of interpersonal rapport with patients who spend less and less time in the clinical care setting. These are important changes that should not be minimized because they clearly indicate that the role of the nurse is vastly different today than it was 50 years ago. However, the changing role of nurses is limited in one important way: the profession continues to view knowledge as essentially static. Nursing curricula need to evolve to instill in learners an understanding of the dynamic nature of learning. This can be challenging at an associates level, but the higher-level degree gives the nurse greater opportunities to acquire more knowledge and skills. At the same time, it is critical that educators critically examine the nursing curriculum to ensure that it is tailored to a new and differently engaged learner. Nurses and nurse education professionals operate in a knowledge economy that requires different assumptions about learning than in previous generations.
Knowledge has always played an important role in shaping our national and global economies, but in the past its contribution was more predictable. It is important to understand that the new knowledge economy is distinctly different from its industrial predecessor. Conventionally, knowledge was an input that fueled innovation, which in turn, led to increased manufacturing and well paying manual labor. Today, burgeoning technology, global competition, and increasing demands for postsecondary education have all contributed to the creation of a new economy – the knowledge economy. Where knowledge was once an input it is now the end product. Workers in knowledge producing industries not only require advanced training beyond what was typically provided in high school, but they will increasingly be expected to remain current in their fields by becoming life-long learners. Additionally, knowledge workers will be required to be more flexible and adaptable, technologically proficient, entrepreneurial, interdisciplinary thinkers, and global citizens. The Impact of BSN training on Patient Outcomes
Perhaps no rationale for moving toward the BSN as the standard for nursing practice has received more attention – both praise and ridicule – than the implication that higher proportions of BSN trained nurses in health care institutions result in lower surgical patient deaths. Indeed, the gold standard for legitimacy in the health care profession is to link what you do with the quality of patient care, particularly in the reduction of mortality rates. And for the same reason, any attempt to move the conversation in that direction is likely to receive considerable scrutiny. In 2003, Aiken and colleagues (Aiken, Clarke, Cheung, Sloane, & Silber, 2003) published a comprehensive study of more than 200,000 cases discharged from 168 hospitals in Pennsylvania. The study has been challenged on methodological grounds from others in the profession and those within the higher education community. Viterito (2006) points out in his critique that there are other, arguably more salient relationships responsible for the differences in mortality rates reported across hospitals, including patient age and the quality of resources and technology. The American Association of Community Colleges (AACC) (2003) has assumed a political position in defense of the Associates degree and they site a litany of challenges to the Aiken study, some of which are more valid than others.
In the following sections, we examine the importance of retention in each of the three domains discussed previously - retention of students in school, retention of nurses in the profession and the retention of nursing professionals in the education pipeline. All three are critical to expanding the nurse pipeline and addressing the growing shortage of nurses in the field. We begin by exploring approaches to retain students and the issue is two-fold. Many retention efforts focus on keeping students enrolled in school, but from a nursing perspective, it is equally important that nursing students remain in nursing programs. Next we address a number of issues impacting attrition in the workplace. Nurses are in high demand and even though there are fewer nurses than are required, the workload is the same. As a result, burnout is high. Reducing stressors in the workplace can play an important role in keeping nurses in the profession and in a
297
Proceedings of the 5th Annual National Symposium on Student Retention. Copyright 2009. C-IDEA, The University of Oklahoma.
position to transition to educators in the future. Finally, we need to develop strategies keep nurses in the education pipeline. In many ways the economic incentives work against moving experienced nurses into education roles. We need strategies to overcome those obstacles. Retention of Students at Institutions
In many ways, issues facing the retention of nursing students are typical of issues faced by traditional students enrolled in most college programs. Volumes have been written on student retention and much of it is derived from Tinto’s (1993) model of student retention, which emphasizes pre-college attributes in combination with both social and academic integration while in school. Tinto likens student departure to the withdrawal tendencies exhibited by those considering suicide; in the absence of means for integrated oneself into the social fabric of a community, those contemplating suicide have no where to turn and as a result withdraw from society. Along the same lines, when students lack a connection to the institution and to other students, either in the classroom or in the social setting, their likelihood of leaving increases. Others have considered the importance of integrating students into the academic and social communities of college campuses (Astin, 1993; Pascarella & Terenzini, 2005) and their treatments are far more thorough than what can be addressed here. Instead, we focus on a particular subset of students that are not well understood in the context of Tinto’s model and others: non-traditional age students.
There are some aspects of the retention challenge that would be more appropriately targeted to the non-traditional/adult learner, which comprises more than 50% of the learners in ADN and BSN programs (Michigan Center for Nursing, 2005). This section will focus on retention efforts targeted toward adult learners who are critical in the nursing pipeline. While there are a number of aspects to consider in respect to retaining the adult learner, the two we will discuss are curricular innovation and institutional services to support and retain these students. Curricular Challenges
While learning styles and adult learning theory have been studied and applied to education for years, nursing education tends to follow the traditional one-size fits all approach to teaching and learning. The Oregon Consortium for Nursing Education (OCNE) is a partnership between colleges and university and was created to expand capacity in educational programs. Oregon recognized that teaching the traditional way caused content overload, which was not an effective tool in getting students involved in their learning. The new model promotes experiential learning where students are asked to think and learn more critically (OCNE, 2006). This technique is very effective with adult learners, since it makes them active participants in their learning. The consortium designed a variety of learning experiences, including media based instruction, case based scenarios, expert lecturers, and simulation labs; all strategies that have the tremendous potential of retaining adult learners by means of helping them feel successful and involved in their learning. Shifting nursing curricula from a lecture based learning model to an active learning model is an imperative but cumbersome task. One of the ways schools are implementing this shift is through the use of simulation and other technological advances. Student Services
Due to the nature of adult learners, it can be assumed that they wear a number of hats on any given day. Many are providers, parents, caregivers, and/or homemakers, who are also expected to juggle the rigor of school. This can be very daunting and overwhelming, potentially leading to attrition. Nursing programs and educational institutions need to work together to identify student needs and provide services to these learners to assist them in achieving success. For many years colleges and universities have spent considerable time and energy finding new
298
Proceedings of the 5th Annual National Symposium on Student Retention. Copyright 2009. C-IDEA, The University of Oklahoma.
and different ways to meet the service needs of adult learners. Of all the approaches to improve retention of students, colleges and universities have arguably focused most heavily in this area. Student success centers and one-stop shops have been commonplace for the past ten years and the proliferation of web utilities has obviated some of the challenges of connecting students with the appropriate services during the conventional work hours. Today on many campuses, students can sign for financial aid with the click of a button, register for classes on line at any time of day, pose questions to 24 hour service centers, and even attend office hours in virtual space through course management systems. Services continue to be an important issue, but not to the degree it was even 10 or 15 years ago. Preparation for Academic Success
Tinto and others recognize the importance of integration into the academic community and an important precursor is a student's level of preparation entering the institution. For the purposes of this work, we suggest that academic preparation reflects the degree to which students have been exposed to and learned the appropriate content and that they have developed the skills and general habits of mind that will allow them to succeed in the college classroom. Academic preparation is a critical element in the admissions process and it is also a predictor of whether students will remain in school. However, in the context of nursing education, academic preparation has to be thought about in two ways. First, like all students, poorly prepared students may require remedial coursework. These students are less likely to continue to degree, particularly as the number of remedial courses increases. Second, given the nature of the nursing curriculum and the rigor that it possess, even academically prepared students may lack the soft skills to be successful: study skills, work ethic, personal responsibility, interpersonal skills. Other math and science rich fields face similar challenges. St. John, Daun-Barnett, and Williams (2006) has found that engineering students at a top research university are more likely to leave the major area of study than they are to leave the institution altogether. A similar question needs to be asked in nursing education. Can nursing students be retained in the nurse education pipeline? If the answer is no, then it will remain difficult to effectively address the nursing shortage. Retention of Nurses in the Workforce
General Accounting Offices (GAO), approximately18% of RN’s are not working in the field and the number one reason they leave is lack of satisfaction with the job, including poor working conditions, lack of autonomy, unbalanced workloads, as well as lack of communication and shared decision-making (Scanlon, 2004). This section focuses on the key challenges to retaining practicing nurses in the profession: the quality of the work environment. Improved Work Conditions for Health
A healthier working environment is linked to a healthier workforce. Nurses who rate their facilities as positive environments have fewer absences due to illness, lower rates of musculoskeletal pain, and better self-rated health. Research shows that organizational and managerial support lessens nurse dissatisfaction and burnout. As well, a positive link has been identified between nurses’ job satisfaction and patient outcomes. A study conducted in Ontario teaching hospitals showed that patient satisfaction with nursing care was directly related to how satisfied nurses were with their jobs. (Nursing Council Working Group on Magnet Environments, 2003)
Foley (2000) frames ergonomic conditions in the context of the cost of worker
compensation, the loss of capable nursing professionals, and the need for preventative and early intervention solutions to deal with work related injuries. The challenge is particularly acute in
299
Proceedings of the 5th Annual National Symposium on Student Retention. Copyright 2009. C-IDEA, The University of Oklahoma.
operating rooms and radiology according to Foley, and one of the ways some hospitals have begun to address the problem is through the use of “lifting teams”. This approach recognizes that given the frequent number of times nurses are required to lift patients and heavy objects, teams will help distribute weight, allow for correct lifting, and minimize the potential for musculoskeletal damage. These are important and real problems, but in the context of the nursing pipeline, they are additionally important influences on job satisfaction that ultimately impacts retention of existing nurses and indirectly, the recruitment of future nurse professionals. While some may actually suffer injuries that result in worker compensation, a number of nurses may leave before the problem goes that far. The result is early exit from the profession. Differential Pay
The challenge of differential pay may be the consequence of a market failure in the supply and demand of nurses. Currently, entry-level nursing professionals earn considerably more on average, than other associates degreed professionals. According to the Bureau of Labor Statistics (2008) the median salary for an Associates degree is $38, 272. At the same time, Salary.com (2009) reports RNs at the 25th percentile for earnings make more than $55,000 annually.1 The salary differential is a natural consequence of the high demand for nurses. However, while this is an attractive salary for entering a profession with a 2-year degree, the salary ladder is relatively flat, making it difficult to rationalize continuing one’s education beyond the ADN. The clearest example is the move from the ADN to the BSN. Both are legitimate points of entry into the RN position, but there is not an appreciable difference in salary. For two additional years of schooling, the cost of tuition and foregone wages does not appear worth the investment of time.
The wage differential is compounded by a challenge that plagues technical and professional fields. Nurses earn more in the private sector than they will as nurse educators – and they can do so with comparatively less formal education. To teach in nursing, one is typically expected to earn at least a Masters degree (in two-year colleges) and typically a PhD (at the four-year institution). To reach these levels educationally, an RN may need from 4-8 years of additional education and at the instructor or assistant professor level, will likely earn about the same as in the clinical setting (Salary.com, 2009). It is not until the associate or full professor level that nurses may earn more than they would as practicing nurses. At this level of education, colleges and universities are typically unable to compete with the much higher salaries in nursing administration positions.
Reducing Mandatory Overtime
Both mandatory overtime and flexible scheduling may be two sides of the same coin. Mandatory overtime is in large part, a consequence of the nursing shortage and a contributing factor to the attrition of early career nurses. No employee likes to be compelled to work additional hours, even when they are adequately compensated for doing so. Mandatory overtime may provide a short-term solution to a shortage of nurses but it creates a long term problem in terms of retaining nurses. In 2004, Connecticut adopted a policy that places limits on the amount of time that can be required in overtime and further sets minimum thresholds for nurse to patient ratios (American Nursing Association, 2007).
West Virginia passed legislation, which prohibited hospitals from mandating overtime, except in specific circumstances, and Minnesota has prohibited taking action against nurses that refuse mandatory overtime. It is always difficult to legislate professional practice, because it is
1 The 25th percentile is a useful point of comparison because median RN salaries include both ADN and BSN trained nurses. Since the majority of RNs are trained at the associates level, this is a conservative estimate.
300
Proceedings of the 5th Annual National Symposium on Student Retention. Copyright 2009. C-IDEA, The University of Oklahoma.
generally accepted that the professions know best how to provide their services and construct their operating environments. However, in this case, private practices can have a potentially deleterious impact on the provision of a public good (healthcare) and as such, may require intervention at the policy level. The CT approach may exacerbate conflicts because when you regulate both the practice (mandatory overtime) and the consequence (higher patient to nurse ratios) when the supply of nurses is low, clinical settings will be placed in a position where they cannot meet both conditions, at least in the short term. Release Time for Continuing Education
One way to address this challenge and incentivize a return to school. Employers for example, might pay for release time to earn credits toward a degree program in nursing. This may include credits toward the BSN completion degree or it might also include specializations or coursework toward a Masters degree in nursing. From a policy perspective, it may be useful for legislators to consider efforts to pay for the cost of release time as a way to invigorate the nursing education pipeline. To our knowledge, no state takes up this charge. A report on surveys of nursing faculty in Iowa (Iowa Department of Public Health, 2004) revealed that current faculty returning to school for additional training saw both release time and tuition reimbursements as important incentives that were not often included as part of their employment and benefit package. These costs represent one of the major barriers that affect both the recruitment of nurses into the upper levels of the nursing pipeline and also the satisfaction of nurses who are interested in continuing the educations. Retention of Nurses in the Education Pipeline
Keeping nurses in the educational pipeline is a different way to think about retention than is conventional for higher education professionals. Both retaining students in nursing programs and keeping active nurses in the profession are important to expanding the nursing pipeline, but they are insufficient to overcome the growing shortage. In addition to the institutional and professional approaches articulated above, the nursing profession must begin to examine and address the challenge of moving capable nurse professionals through the educational pipeline to the BSN, MSN, and doctoral degrees. The lynchpin in any systemic effort to expand the nursing educator pipeline is the BSN. With nearly twice as many RN's entering the profession with an ADN over a BSN, combined with higher wages resulting from the tremendous demand for nurses in the field, there are disincentives for nurses to continue their education. The following sections address several approaches to increasing the numbers of BSN trained nurses who are ultimately positioned to pursue graduate work and become educators. Requiring the BSN as the Standard of Care for the Profession
In the case of adopting the BSN as the standard, New York may not be the first to do it, but it was perhaps the first to try and the second to make what appears to be the most amenable proposal balancing the changing needs of the profession with the limitations of the existing pipeline. As it happens, New York attempted unsuccessfully in 1985 to pass legislation requiring a BSN to enter the profession. That proposal failed and it took another 20 years before the state elected to take up the issue again. North Dakota is the one state to adopt the BSN as the standard for the profession (Nelson, 2002), but as we will illustrate, it differs from New York in important ways that recognize the process of diffusion involves learning from the successes and limitations of other approaches while tailoring to the unique conditions of the state.
In 1987, North Dakota formally adopted the BSN as the single point of entry to the RN, effectively eliminating the Associates level degree and placing the onus of responsibility for nursing preparation on the four-year institutions in the state. Nelson (2002) suggests that after 10 years, the policy change has changed the ratio of BSN to ADN appreciably to the point where
301
Proceedings of the 5th Annual National Symposium on Student Retention. Copyright 2009. C-IDEA, The University of Oklahoma.
54% of the practicing RNs were BSN trained (compared to approximately 30% nationally). The community college system in North Dakota is unique to most in the nation. As George and Young (1990) indicate, states with a smaller proportion of Associates to Bachelors programs were more likely to act on proposals to move toward the BSN standard. There are only three formally designated community colleges, a technical college, a tribal college, which is two year, and a two year campus of a four year institution. Essentially, there were so few community colleges that they did not constitute a large proportion of the nursing programs in the state.
The North Dakota proposal is problematic for two reasons. The first is it suggests that the ADN or its equivalent is not a valuable entrée into the profession; a position that will hinder our collective ability to right the ship and overcome the nursing shortage. But second, and more important, is that the proposal fails to appreciate the role of nurses as knowledge workers that require a life-long relationship with higher education. As has been demonstrated in prior briefings, the rate at which knowledge is being produced and made available for public consumption is growing exponentially (Salmi, 2002) and the healthcare industry is on the forefront of this knowledge explosion. The BSN requirement is not only a reflection of the need for more advanced skills at a moment in time, it is a belief that nurses need to be equipped with the skills to be active and engaged learners throughout their careers, in much the same way as doctors and other medical professionals. Establishing the BSN as the point of entry obviates the fact that a great deal of learning happens on the job and through continuing education in the healthcare setting and it pre-supposes that one visit to higher education is sufficient to meet the evolving demands placed upon nurses.
The New York Legislature has proposed an alternative to the North Dakota policy (which has been advocated in California and other states, without success in terms of implementation). The proposal would require nurses to earn the Bachelor’s credential within 10 years of entering the profession as a practicing RN. As is common with these sorts of initiatives, current nurses would be exempt from the requirement essentially allowing for a ten-year phase-in from the date at which it is accepted. RNs who fail to meet the requirement would be placed on probation, with the possibility of losing their license. The New York proposal has two advantages. First, it recognizes that researchers and the professional community are suggesting the Bachelor degree is becoming necessary training for successful caregiving as a nurse. Second, the more modest approach advocated by New York and New Jersey recognizes that the ADN is a critical access point to nursing that cannot and should not be eliminated, but rather seen as a step in the evolution of the life long learning nurse professional. Community College Baccalaureate Degrees
Over the past ten years, there has been a growing movement in the US and Canada promoting the offering of baccalaureate degrees at certain community colleges in specific high need fields (Community College Baccalaureate Degree Association, 2008). Nursing is consistently one of three academic disciplines considered by advocates of the expanded community college role. Proponents of the approach suggest that community colleges are uniquely positioned to fill this demand because many of them are located in places where it would be difficult for practicing nurses to attend a traditional four-year institution. Critics recognize that allowing baccalaureate degrees at community colleges will fundamentally alter their stated missions (Levin, 2004). The research to date on the community college baccalaureate is largely descriptive and as such does not yet answer some of the important questions regarding actual implications for students. What is less clear is whether allowing community colleges to offer the BSN or the BSN completion degree would actually increase the number of highly trained nurses to begin to address the nursing shortage. Given that the ADN remains the key point of entry for RNs and the BSN is not yet a requirement anywhere except North Dakota, it is unlikely the community college baccalaureate would yield more nursing professionals in the
302
Proceedings of the 5th Annual National Symposium on Student Retention. Copyright 2009. C-IDEA, The University of Oklahoma.
field. It may however serve as a bridge to move some nurses from the RN into the graduate level programs training nurse educators. Conclusion
The nursing pipeline is both complex and multi-faceted and it cannot be effectively expanded without attention to the many constraints placed upon it. Retaining students in nursing programs and at colleges and universities is an important place to start. Because of the nature of the problem it is essential to pay close attention to retaining nurses in the field and that is in large measure a function of the quality of the work environment. Finally, the piece, which receives relatively less attention from a retention perspective, is the education pipeline. Nursing is unique with respect to the educational and professional trajectories. In particular, the two pathways to the RN through the ADN and the BSN create a market failure, keeping many nurses in the field without the necessary credentials to move into the teaching ranks. Similar disincentives are built in throughout the pipeline. Nursing professionals consistently earn more in private practice than as educators and those gaps can continue to pose challenges.
In our estimation, the key to addressing the nursing shortage and to overcoming the systemic market failures is to find additional ways to ensure more nurses earn the BSN and are eligible to continue their education to the MSN and beyond. Requiring the BSN is one approach, which assumes the employment market will prevent many nurses from returning to education on their own. Alternative strategies making the acquisition of the BSN easier are valuable assuming the key barriers are ready accessibility of BSN programs and proximity to those programs. Finally, we argue that in order to address the nursing shortage, we must address all three sets of retention challenges. Institutions must do their part to keep students in school and potential nurses in their programs; the healthcare industry must do more to improve the workplace and keep more nurses in the field; and all partners must focus on keeping nurses engaged in the academic pipeline to encourage and promote more nurses into teaching and clinical supervision. Only then can we effectively address the nursing shortages across the country.
303
Proceedings of the 5th Annual National Symposium on Student Retention. Copyright 2009. C-IDEA, The University of Oklahoma.
References
Adams, V. W., & Price-Lea, P. J. (2004). A critical need for a more diverse nursing workforce. North Carolina Medical Journal, 65(2).
Adelman, C. (1999). Answers in the Tool Box: Academic Intensity, Attendance Patterns, and Bachelor's Degree Attainment. In U.S. Department of Education (Ed.) (pp. 73). Washington, DC: National Center for Educational Statistics.
Aiken, L., Clarke, S. P., Cheung, R. B., Sloane, D. M., & Silber, J. H. (2003). Educational Level of Hospital Nurses and Surgical Patient Mortality. Journal of the American Medical Association, 290(12), 1617-1623.
All Nursing Schools. (2006). Wayne State University. Retrieved January 22, 2007, from http://www.allnursingschools.com/schools/ID595/
American Association of Colleges of Nursing (2009). Nursing Shortage Fact Sheet. Retrieved April 2, 2009 from http://www.aacn.nche.edu/Media/pdf/NrsgShortageFS.pdf
American Association of Community Colleges (2006). Fact Sheet: Articulation Agreements Among Nursing Education Programs. Retreived April 2, 2009 from http://www.aacn.nche.edu/Media/pdf/AAFS.pdf
American Nursing Association. (2007). Appropriate Staffing. Retrieved January 16, 2007, from http://www.nursingworld.org/staffing/ct10th.htm
Bensing, K. (2001). Nursing as a second career option. Retrieved January 22, 2007, from http://nursing.advanceweb.com/common/Editorial/Editorial.aspx?SEC=CC&CC= 17400
Bureau of Labor Statistics. (2008). Education Pays. Retrieved May 14, 2009, from http://www.bls.gov/emp/emptab7.htm
Coalition of Michigan Organizations of Nursing. (2006). The Nursing Agenda for Michigan: 2005-2010 Actions to Avert a Crisis. Lansing, MI.
Community College Baccalaureate Degree Association. (2004). Position Statement. Retrieved December 6, 2006, from http://www.accbd.org/
Edquist, P. (2005). Nursing as a second career. The Milwaukee Business Journal Online Retrieved January 22, 2007, from http://milwaukee.bizjournals.com/milwaukee/stories/2005/11/14/focus1.html
Foley, M. (2000). Testimony of the American Nurses Association on OSHA's Proposed Ergonomics Standard. Retrieved January 16, 2007, from http://www.nursingworld.org/gova/federal/legis/testimon/2000/ergomf.htm
George, S., & Young, W. (1990). Baccalaureate entry into practice: An example of political innovation and diffusion. Journal of Nursing Education, 29(8), 341-345.
Heller, B.R., Oros, M.T. & Durney-Crowley, J. (2000). The future of nursing education: 10 trends to watch. Nursing and Health Care Perspectives, 21(1), 9-13.
Iowa Department of Public Health. (2004). Center for Health Workforce Planning Bureau of Health Care Access. Retrieved January 16, 2007, from http://www.idph.state.ia.us/hpcdp/common/pdf/workforce/nursing_ed_speakout.pdf
Joynt, J. & Kimball, B. (2008). Blowing Open the Bottle: Designing New Approaches to Increase Nurse Education Capacity. Washington, DC: US Department of Labor, Robert Wood Johnson Foundation, & American Association of Retired Persons (AARP).
Levin, J. S. (2004). The community college as a baccalaureate-granting institution. Review of Higher Education, 28(1), 1-22.
Massachusetts Department of Higher Education (2008) Massachusetts Higher Education and the Nursing Shortage: Expanding the Nursing Education Pipeline. Retrieved May April 2, 2009 from http://www.championnursing.org/uploads/MAEducationRedesign200809NursingPipelineGraphic.pdf
304
Proceedings of the 5th Annual National Symposium on Student Retention. Copyright 2009. C-IDEA, The University of Oklahoma.
Michigan Center for Nursing. (2005). Survey of Nurses 2005. from http://www.michigancenterfornursing.org/mimages/nursesurvey2005.pdf
National Center for Education Statistics (2009). Integrated Postsecondary Education Data System (IPEDS). Data Analysis System. Washington, DC.
National Commission on Excellence in Education. (1983). A Nation at Risk. Washington, DC: U.S. Department of Education.
Nursing Council Working Group on Magnet Environments. (2003). Improving Nursing Workplaces for Health. Retrieved January 16, 2007, from http://www.health.gov.sk.ca/ic_improving_nursing_workplaces.pdf
Pascarella, E. T., & Terenzini, P. T. (2005). How college affects students: A third decade of research (2nd ed.). San Francisco: Jossey-Bass.
Sacramento City Unified School District. (2006). Health Professions High School. Retrieved January 15, 2007, from http://schools.scusd.edu/healthprofessions/
Salary.com. (2009). Nursing Salaries by Job Title. Retrieved May 14, 2009, from http://www.salary.com
St. John, E., Daun-Barnett, N., & Williams, K. (2007). State Policy, STEM Preparation, and College Access: A Comparison of Michigan and Other States in the Great Lakes Region. Educating a STEM Workforce: New Strategies for U-M and the State of Michigan Conference Proceedings. University of Michigan.
Tinto, V. (1993). Leaving college: Rethinking the causes and cures of student attrition (2nd ed.). London: University of Chicago Press.
305
Proceedings of the 5th Annual National Symposium on Student Retention. Copyright 2009. C-IDEA, The University of Oklahoma.
Practical Retention Solutions for the Community College
Abstract - The focus of this paper is starting retention efforts on a small campus with a limited budget. We know that to increase student success there are several broad strategies we need to follow. We need to engage students in the college experience and their education, promote peer-to-peer relationships, encourage faculty to student relationships, and help students set career goals. This paper provides easy and innovative ideas to engage students and provide tutoring, career counseling, and other helpful services with a limited budget. It will include what has been learned and adopted from others such as Noel-Levitz, media searches, visits to other institutions and Ozarka TRiO and Career Pathways programs. The strategies in this workshop focus on helping students set and achieve career goals, working with other groups and individuals on your campus to provide things such as workshops, tutoring, and other forms of student engagement. Additional topics include a student success center, intrusive advising, and faculty, student and family newsletters. This paper will provide practical solutions you can take back to your campus and implement immediately.
Introduction
With "retention" as the new buzzword around many college campuses, it is important to know what retention is and how it is impacted. Alan Seidman defines retention as "the ability of an institution to retain a student from admission to the university through graduation" (Seidman). Research has determined several factors, which have an impact on retention. "Socioeconomic background, financial means, college readiness, and support from home substantially influence whether a person will earn a credential or degree" (Kuh, How to Help Students Achieve). Additionally, career planning is important to increased retention and decreased degree completion times (Cuseo). Retention efforts will vary at each college based on student needs. This paper examines Ozarka College and the retention efforts that worked.
Ozarka College is a small, public, community college in rural Arkansas, which serves approximately 1300 students split between one main campus and two off-campus sites. Ozarka serves a high percentage of underprepared students. Approximately 39% of students at Ozarka are enrolled in two or more developmental courses (Arkansas Department of Higher Education).
Ozarka College is the recipient of a TRiO Student Support Services grant and state funded Career Pathways grant. TRiO serves students who are typically high-risk. To qualify for the program, students must be seeking an Associate of Arts degree and meet eligibility requirements including low-income, first-generation or have a documented disability. TRiO students are eligible for an equipment lending program which loans out laptops, flash drives, and graphing calculators to students in need. TRiO also provides students with cultural enrichment activities and transfer trips.
Career Pathways Initiative is a state funded grant that provides services to students who have a child in the home. Research shows that having children makes it less likely a student will succeed in college (Seidman). Career Pathways tries to offset some of the challenges struggling parents face. To be eligible for the program, students must have a child in the home under 18-years of age and either be low-income or receiving some sort of Department of Health service. Eligible students who sign up for the
306
Proceedings of the 5th Annual National Symposium on Student Retention. Copyright 2009. C-IDEA, The University of Oklahoma.
program can receive transportation assistance in the form of a weekly gas card, tuition assistance or childcare assistance. In addition, Career Pathways recently implemented a book loan program, which allows students to trade their used textbooks with other students.
In 2007, the overall one-year retention rate for the college was 56.5%, which is higher than the average retention rate of 54% for two-year institutions in the state (Arkansas Department of Higher Education). TRiO had a one-year retention rate of 81% and Career Pathways had a statewide retention rate of 77% for the same time period. In 2007, a retention specialist was hired with funding from Carl Perkins Grant and Ozarka College funds. The aim of this new position was to improve overall retention, provide services, and support to the underserved student population, which is primarily technical students.
Don't Reinvent the Wheel, Steal
Step one to improving retention is to gather ideas. There are numerous resources available, and many are free. The Student Success Specialist first looked to the successes of TRiO and Pathways for a model to increase student success. It was found that both programs provide free tutoring to their students and this contributes greatly to their success, providing content enrichment, study skills improvement, and self-confidence in the student. In addition, both programs practice intrusive, holistic advising of program participants. Advising in these two programs is not merely creating a schedule but rather setting goals, planning for the future, and monitoring the results. Additionally, the use of intrusive advising creates a "home base" for students and fosters relationships among staff and students, therefore, increasing the likelihood of student success and persistence.
These two grants serve approximately 500 students with intrusive advising, financial services, academic services and other forms of support. Both programs have proven to be very successful. Kuh suggests that "if a program or practice works, make it widely available" (Kuh, How to Help Students Achieve). With such successful TRiO and Career Pathways programs on campus, it was an easy decision to try to replicate their services for the approximately 800 who do not receive service from either of these programs.
Next, Ozarka utilized internet searches to produce retention information. Many schools post their retention efforts online, providing an excellent place to start. Online searches led us to implement an advising newsletter, a family newsletter, student success newsletter, and even a retention newsletter for faculty.
The internet also led to webinars by companies including Noel-Levitz and Innovative Educators. Some webinars cost money, but others are free. The free ones often attempt to sell a product but offer very valuable information just the same. Faculty, staff and administration were provided valuable professional development along the lines of retention through a combination of free and purchased webinars. These webinars subsequently set the stage for most of the retention efforts that were adopted.
Another valuable resource, advancing Ozarka's efforts in student success, was visiting other colleges in Arkansas. These model-school visits yielded a wealth of information including the implementation of a Student Success Center, Online Tutoring, and improvements to New Student Orientation.
Student Success Center
Kuh has several recommendations when it comes to increasing student retention. His ideas include the following: "Teach first-year students as early as possible how to use college resources effectively; Develop networks and early-warning systems to support students when they need help; Connect every student in a meaningful way with some activity or positive role model; Remove obstacles
307
Proceedings of the 5th Annual National Symposium on Student Retention. Copyright 2009. C-IDEA, The University of Oklahoma.
to student engagement and success" (Kuh, How to Help Students Achieve). These are precisely the principles behind Ozarka College's Student Success Center. The idea of a Student Success Center was implemented after a model school visit to Mid-South Community College in West Memphis, AR. Administrators and staff from Ozarka spent the day touring MSCC's Learning Success Center; meeting students, staff and faculty and hearing from the president, academic vice president and student services vice president of the college how the center had increased their student retention.
Upon returning to the Ozarka campus, great effort and enthusiasm went into opening a Student Success Center (SSC) the following semester modeled after MSCC's Learning Success Center. Initially the Success Center offered tutoring and career counseling and served as a hub where students could go to ask a question or get pointed in the right direction. The success center was positioned beside the student computer lab, which made it easier for students to ask for assistance.
Tutoring
During the initial semester of the SSC, there was a limited budget for tutoring, and faculty and staff members were asked to donate time to the SSC. Many faculty members were willing to volunteer an hour or more each week, and this made a huge impact. In addition, several staff members who held administrative jobs at the college also volunteered to tutor in the SSC each week. Faculty in the math and English disciplines were asked for recommendations of students who were strong academically and could tutor in those subjects. This led to the hiring of several students to serve as peer tutors for 3-8 hours each week. In addition, professional tutors were recruited through our alumni records and the area Retired Teachers Association. Both avenues produced quality tutors for the Student Success Center. This combination of peer and professional tutors, along with faculty and staff volunteers, led to a well-balanced tutoring schedule for the main campus and both off-campus sites.
The next step was to attract students into the center. One of the simple, yet very effective tricks used on the main campus was to offer free coffee. This is relatively inexpensive, but it certainly brought the students into the SSC. They did not all seek assistance initially, but they became familiar with the center and the staff and eventually started picking up tutoring schedules and making appointments. SSC tutors and staff also visited each of the classrooms on the first day of class. This was a mild interruption and a lot of footwork but an effective tool in recruiting students. Each student received a copy of the tutoring schedule and a brief description of the services offered. Faculty referrals became very important for getting students into the success center. Referral cards were created and distributed to all full-time faculty and adjunct instructors. These cards made it easy for faculty to refer students quickly and discreetly. The SSC did not gain popularity over night, but it did catch on. The first semester there were approximately 120 tutoring sessions in the SSC and there were over 400 the following year!
Recently, an online tutoring option was added to the services provided by the SSC. While there is software available to facilitate this, it was more cost effective to use a chat room inside the Ozarka student website and a webcam. The purchase of the camera was the only expense incurred. Online tutoring is currently offered three hours in the evening in a handful of subjects, but as demand increases, additional resources will be delegated to that project.
Career Preparation
In today's tight job market and down economy, career services are becoming increasingly important on college campuses (Lipka). "A wide-range of institutions now see career planning as a way not only to recruit students but also to retain them" (Lipka). The SSC offers career counseling to students and alumni.
308
Proceedings of the 5th Annual National Symposium on Student Retention. Copyright 2009. C-IDEA, The University of Oklahoma.
The KUDER Career Assessment is offered to all students by appointment or walk-in basis. This online career planning system matches student's interests with career clusters. After completing the assessment, students have the capability to research specific careers, the education pathway necessary for that career and the subsequent income potential. The KUDER is also encouraged as part of the institution's first-year seminar. Success Center staff members walk them through their assessment results, paying special attention to the career paths recommended.
Helping students develop a career plan is important, but it is not the only need students face when entering the workforce. After speaking with students and professionals, it was determined that Ozarka students are often unprepared for interviews. This led to the creation of the Student Success Closet and "Next Step" workshops. To furnish the Student Success Closet, faculty and staff were asked to donate any new or gently used interview appropriate attire they no longer wore. The results were phenomenal! Donations came rolling in from everyone on campus. The closet eventually outgrew its initial space and additional rods had to be added. The closet is open to any student who is in need of an interview outfit. It is available by appointment or during interview workshops that are presented each semester.
A "Next Step Workshop" is a service provided when a teacher has a free class period or has to be absent. The staff of the SSC put together a workshop that discusses creating a résumé, dressing for a job interview, preparing for interview questions and sending a thank you note. The workshop is tailored to the students participating in it. Depending on the time available, students are assisted in creating and saving a résumé and given the opportunity to answer typical interview questions.
The final step to prepare students for entering the workforce is providing mock interviews to interested students. Ozarka faculty and staff, who are not familiar with the individual student, volunteer to interview that student and provide feedback. This allows the student to practice skills prior to the first real job interview.
Ozarka also provides job placement assistance to students and alumni. Letters were mailed out to local businesses to make them aware of this new service. Within the first week, several companies had submitted their openings. Received entries are posted to the student web portal, my.Ozarka, for two weeks before they are removed.
Mini-Workshops
As a way to increase relationships among students and faculty/staff, the Success Center started hosting mini-workshops each month. This proved to be very useful at increasing student engagement. Workshops offered in the past include Grammar 101, Computer Basics, Christmas Crafts on a Budget, Government Made Easy and Job Interview Skills. These workshops utilize faculty and staff who may not otherwise be involved in the Success Center. For example, our Director of Admissions is not on campus consistently enough to volunteer each week for tutoring, but she has an English degree and is more than willing to host a workshop once or twice during the semester. Likewise, our librarian is a very creative and talented individual. She was able to showcase her skills and teach the students how to make Christmas ornaments and gifts in a workshop. These mini-workshops are very effective with little or no cost. It is as simple as using the existing talents of staff and faculty who are more than happy to help. Most really enjoy being able to interact and engage with students in ways that differ from their normal routine.
Early Alert System
The early alert system at Ozarka is one more way the SSC tries to stay involved with students and let them know where help can be found. The success of Career Pathways and TRiO is due in part to their intrusive advising which includes mid-term counseling with their students. While the SSC does not have
309
Proceedings of the 5th Annual National Symposium on Student Retention. Copyright 2009. C-IDEA, The University of Oklahoma.
the staff to meet with all students, early alert calls provide a system to counsel those who are having trouble.
Instructors are encouraged to submit an early alert on students who have any number of issues including poor attendance, poor homework grades, and lack of participation or failing test grades. These early alerts are submitted to the Vice-President of Academic Affairs who sends each student a letter discussing the problem and encouraging the student to seek assistance before it is too late. The early alerts also come to the Student Success Center for further follow-up. Staff in the SSC email and call all students to offer personalized assistance. In addition, emails are sent to the student's academic advisor. Advisors are encouraged to contact the student and offer assistance or support. The goal of this early intervention is to get students the help they need in a timely fashion. It also encourages students to take advantage of tutoring and other services offered by the college.
The Success Center also follows up with students who are failing at mid-term. However, Kuh cautions that mid-term "is often too late for a student to salvage a semester" (Kuh, How to Help Students Achieve). It is essential to an effective early alert system to catch the students while they can still bring up their grades. Early alert intervention needs to be specific for each student. Some students will need tutoring, others may need study skill improvement, and others only need encouragement to attend class. It is important to remember that all students are different and face different issues. What works for one will not work for all.
Newsletters
Another effort to keep retention on the forefront of conversations is to publish newsletters addressing retention issues. Ozarka puts out a retention newsletter for the faculty each semester, which focuses on current institutional retention data, national retention trends and ways to implement improvements on campus. In addition, an advising newsletter is published twice each semester.
According to Richard Light, "good advising may be the single most underestimated characteristic of a successful college experience" (Light). Ozarka feels that quality advising is important to a successful retention program. The advising newsletter, Wiser Advisor, addresses ways faculty can improve academic advising and offers tips for more intrusive advising. This newsletter often features articles from advisors who discuss their advising strategies and what works for them.
In order for students to be successful, Ozarka also realizes that it takes more than just academic resources. For many of our students to be successful, they must find a balance between schoolwork, a low-paying job, and time with their children. A student newsletter, S.T.E.P to Success: Stories, Tips, Events and Practices, is published twice a semester to addresses the student in a very holistic way. It features articles that look at all areas of student success from academics to finances to time and stress management. This newsletter offers practical solutions to the challenges Ozarka students are facing.
Finally, a family newsletter was published to encourage understanding and support for students from their parents, spouses, and children. The newsletter featured a calendar of upcoming events, information on FERPA, and articles about the importance of education. Due to budget constraints, this newsletter is no longer published; but it is a useful idea to keep in mind.
First-Year Seminar
Ozarka's First-Year Seminar was recently moved under the leadership of the Student Success Center. This one-credit course is designed as an extended orientation and is required of all first-time, full-time students. The content is focused heavily on introducing students to the college and services provided as well as teaching students about basic study skills, including note taking, time-management and test-
310
Proceedings of the 5th Annual National Symposium on Student Retention. Copyright 2009. C-IDEA, The University of Oklahoma.
taking skills. This course is intentionally designed to connect students to the campus and, provide interaction with each other, instructors and advisors. It also provides a career exploration component to help students set goals and plan for the future. "First-Year seminars can result in a 2% to a 10% increase in first- to second-year retention" (Barefoot). When designing a first-year course it is important to recruit quality instructors, employ active learning techniques, and develop content that is useful for the students unique to each institution of higher learning (Petschauer).
Collaboration
Ozarka's retention efforts have been very inexpensive. By looking at what is working around the Ozarka campus and at other colleges in the area, SSC staff gained valuable information and ideas. These ideas were used to increase student engagement, help students set and meet their career goals, and promote peer-to-peer relationships and relationships with faculty and staff.
"A key to academic success for students is their engagement" (Kuh, How to Help Students Achieve). All of Ozarka's retention efforts are centered on student engagement in one way or another. "Student engagement has two key components that contribute to student success. The first is the amount of time and effort students put into their studies and other activities that lead to the experiences and outcomes that constitute student success. The second is the ways the institution allocates resources and organizes learning opportunities and services to induce students to participate in and benefit from such activities" (Kuh, Kinzie and Schuh). The SSC provides opportunities for students to interact and connect with their peers, faculty members, and staff. Every attempt is made to reach out to students in the classroom, over the internet, through phone calls and emails, and in the Success Center.
Retention is everyone's job, and that is an important fact to remember when designing a retention program. It is essential to involve administration, faculty, and staff in the design and implementation of retention efforts. Professional development is vital to getting buy-in for retention efforts by others at the college, leading to collaboration. An example on the Ozarka campus occurred when advising webinars were held on campus followed by both a faculty member and a division chair attending NACADA advisor training, funded as a student success initiative. Upon return, this two-member team presented a PowerPoint to the administration and faculty. Two vice presidents, along with the division chair and faculty member, remain strong proponents for advising improvements. As a direct result, an Advising Committee was instituted, as well as advisor training. If one wants to generate momentum for a student success project, professional development at all levels is necessary to achieve maximum cooperation.
The key to Ozarka's retention initiatives is the collaboration with others on campus. Ozarka found it very useful to provide professional development for a variety of faculty, staff, and administrators across campus in areas other than advising. Providing opportunities for faculty, staff, and administration to attend workshops and conferences and then present their findings to the college as a whole, increased buy-in across the campus. Institutions of higher education are populated with people who care about students and want to help. It is just a matter of channeling this help into productive efforts for student success.
While Ozarka retention efforts will never end, the many venues explored over the last three semesters seem promising and effective. Ozarka's research based initiatives encourage student success by providing academic assistance and intervention, career preparation, and mini-workshops to students. They also provide professional development opportunities and retention information to faculty, staff and administration. With the continued support of college administration, faculty, staff and students, Ozarka has high hopes its retention rate will continue to climb.
311
Proceedings of the 5th Annual National Symposium on Student Retention. Copyright 2009. C-IDEA, The University of Oklahoma.
Resources
Arkansas Department of Higher Education. First-Time Entering Freshmen and Those Assigned to Remediation in Arkansas Public Instiutions. 11 December 2008. 2009 6 May <www.adhe.edu/>.
—. Retention and Cumulative Graduation Rates of First Time Freshmen at Arkansas Public Institutions. 2008. 6 May 2009 <www.adhe.edu>.
Barefoot, Betsy O. "The First-Year Seminar: Closing the Revolving Door of Student Attrition." Student Success Symposium. Conway: University of Central Arkansas, 2009.
Cuseo, Joe. "The Empirical Case for the First-Year Seminar: Promoring Positive Student Outcomes and Campus-Wide Benefits." University of South Carolina. 11 May 2009 <listserv.sc.edu.
Kuh, George. "How to Help Students Achieve." The Chronicle of Higher Education 15 June 2007: 12-13.
Kuh, George, et al. Student Success in College: Creating Conditions That Matter. San Francisco: Jossey-Bass, 2005.
Light, Richard. Making the Most of College: Students Speak Their Minds. Cambridge: Harvard University Press, 2001.
Lipka, Sara. "In Tight Employment Market, Career Services Gain Clout." The Chronicle of Higher Education 16 May 2008: A.1.
Petschauer, Joni Webb. "Developing Content and Curriculum for the First Year Seminar." Institute for First-Year Seminar Leadership. Columbia: National Resource Center for The First-Year Experience, 2009.
Seidman, Alan. College Student Retention. Westport: Praeger Publishers, 2005.
312
Proceedings of the 5th Annual National Symposium on Student Retention. Copyright 2009. C-IDEA, The University of Oklahoma.
Priced out? Does Financial Aid Affect Student Success?
Daniel Jones-White Peter M. Radcliffe Linda Lorenz Office of Institutional Research Office of Planning & Analysis Office of Institutional Research
Abstract: While the literature on postsecondary student success identifies important academic and social factors associated with student outcomes, one question that persists concerns the influence of financial aid. We use the National Student Clearinghouse’s StudentTracker service to develop a more complete model of graduation, transfer success, or dropout. Multinomial regression techniques reveal that need aid appears to equalize the odds of success for receiving students, use of loan aid appears to encourage students to search out alternative institutions or drop out entirely, and merit aid appears to increase the likelihood of the receiving student remaining and graduating from their entry institution. Introduction As public institutions of higher education continue to face eroding financial support in the form of shrinking state appropriations, public colleges and universities are turning to tuition dollars as a likely replacement for this declining source of revenue. College prices, consequently, have increased by more than four percent annually over the past two decades (College Board, 2008). In response to the rising cost of college, students are increasingly relying on financial aid to help pay for college. While early financial aid programs utilized grant subsidies to offset the financial barriers associated with post secondary degree attainment, we have witnessed a dramatic shift in the philosophy of higher education in recent decades under which students are required to assume a greater personal stake in financing their education through the use of student loans. As a result, students are leaving college with sizable debt burdens, with nearly two-thirds of students graduating from a public college or university left with a debt obligation averaging $17,250 (AASCU, 2006). As the popularity of student loans as a means of financing higher education continues to climb, the long-term consequences associated with student borrowing are frequently cited as a concern for individuals with a stake in higher educational outcomes (Smith, 2007; Ronstadt, 2009). On the one hand, policy-makers worry that students with high debt burdens will “put off life milestones such as buying a car, owning a home, getting married, or entering certain low-paying professions like teaching or social work” (AASCU, 2006, p. 2). On the other hand, college administrators are concerned with findings that suggest that students with debt burdens after college may be less likely to enter graduate and first-professional school (Millett, 2003). While the long-term effects of student borrowing are clearly important, the consequences of student financial decisions are not simply a long-term concern. According to the American Association of State Colleges and Universities, “It is not uncommon for students, especially low-income students, to drop out of college only after accumulating thousands of dollars in student loan debt. Nearly one in five students who do not graduate from college leave with $20,000 in student loan debt” (2006, p. 3). Consequently, student financial decisions pose serious challenges for colleges and universities. Unfortunately, very little is currently known about how different forms of financial aid, such as student loans, affect a student’s persistence decision. The potential relationship between financial factors and student persistence is of particular importance to public college and university administrators who are finding that justifications for state appropriations are increasingly tied to outcomes on performance indicators, such as institutional graduation and retention rates (Burke & Minassians, 2001; Zumeta, 2001). Despite heightened institutional spending on programs targeted at improving student success, student attrition rates remain at undesirable levels at many of the nation’s colleges and universities. One estimate suggests that while
313
Proceedings of the 5th Annual National Symposium on Student Retention. Copyright 2009. C-IDEA, The University of Oklahoma.
retention rates vary by institutional type, as many as four out of every ten students that enter college fail to graduate from the institution of entry (Horn, 2006). While recent enrollment trends suggest growth in the popularity of multi-institutional enrollment for students on their way to completing a college degree (Adelman, 2006), most research on student retention continues to simplify the persistence decision to a simple choice: either to reenroll or drop-out. Although such an approach is consistent with federal and state reporting guidelines, it ignores important nuances associated with higher educational degree attainment. As spiraling tuition rates strain both individual and institutional budgets at the same time that institutions face mounting pressure to improve graduation rates, it is important to consider if financial aid influences the likelihood of graduation. This question has taken on greater significance as the increased reliance on student loans has forced students to assume a greater personal stake in financing their education. Utilizing a measure of degree attainment that accommodates graduation outcomes beyond the institution of entry, this paper considers if the type of student aid utilized by students affects the trajectory of their educational career path. For example, if it is the case that promoting borrowing behavior among students encourages them to more carefully consider their educational choices, then the availability of lower priced educational alternatives in the market place may work against an institution’s retention goals. Understanding how the primary forms of financial assistance differentially influence patterns of persistence can aid administrators, trustees, and legislators in weighing the potential returns to institutional investments or changes in tuition policy. Literature Review Early studies of student finance explored the relationship between financial aid and the matriculation decision, paying little attention to persistence decisions (St. John, 2000). Focused primarily on the issue of college access, these early studies of student finance attempted to identify how different pricing strategies (St. John, 2000; Leslie & Brinkman, 1987; St. John, 1994; Heller, 1997) and different aid packages (Ehrenberg & Sherman, 1984) potentially influenced an individual’s ability to attend college, as well as their decision about where to go. Much of this early research was focused specifically on the role of government grants as a positive factor in promoting access to college (St. John, 2000; Jackson, 1978; Schwartz, 1985). As financial aid patterns began to shift away from grant based aid in response to the rising cost of tuition and stagnation in grant award amounts, research conducted by Somers and St. John (1997) and DesJardins, Ahlburg, & McCall (1999) suggested that grants were no longer enough to help promote access for those individuals least able to pay (St. John, 2000). As students were increasingly encouraged to borrow or rely on other types of financial aid such as work study, it became increasingly important to assess whether the observed changes in financial aid patterns were affecting a student’s enrollment decisions (St. John, 2000). This decision continued to be constrained to matriculation with very few studies considering the impact of financial aid on long-term enrollment behavior. Where studies did address the link between financial aid and persistence, the results were largely conflicting or confusing. For example, as St. John (2000) pointed out, early research into the potential relationship between financial aid and persistence articulated a strong positive relationship between aid and student success (e.g. Terkla, 1985; St. John, 1990). Utilizing data from large cross-national longitudinal studies, these studies suggested that a student’s decisions to persist in, and ultimately graduate from, college were highly responsive to financial aid. As a result, increasing need-based aid was promoted as an effective solution to rising tuition prices (St. John, 2000; St. John, 1990). This finding, however, was challenged when researchers turned attention away from cross-national studies to institutional based approaches (Moline, 1987; Braunstein, McGrath, and Pescatrice, 2000). For example, in a previous study at the University of Minnesota, Moline (1987) identified no significant effect of financial aid on persistence, instead identifying the importance of academic ability and preparedness in predicting college persistence. DesJardins, Ahlburg, and McCall (1999) also studied persistence patterns at the University of Minnesota-Twin Cities, identifying that while “loans, earnings, and scholarships generally reduce the stopout probabilities, they do not appear to have a profound effect
314
Proceedings of the 5th Annual National Symposium on Student Retention. Copyright 2009. C-IDEA, The University of Oklahoma.
on dropout behavior” (p. 387). What explains these different results? One possible answer is provided by St. John (2000) who suggested that this shift in the impact of student aid on persistence was largely an artifact of the increased attention on public colleges in more contemporary studies. He notes that these “differences are attributable to the amount private colleges invested from their own resources in grant aid. Public colleges did not make these adaptive changes, further reinforcing the notion that supplemental institutional or state investment was needed to raise aid to an adequate level” (St. John, 2000, 69). As a result, it appears that the impact of financial aid on persistence varies by the institution or type of institution the student attends. There is a growing interest in the potential impact of financial aid on student persistence (DesJardins, Ahlburg, & McCall, 2002; Dowd, 2004; Herzog, 2005; Singell and Stater, 2006; MacCallum, 2008). While the growing body of literature on postsecondary student success has identified important academic and social factors associated with retention and graduation, one question that remains largely unexplained is how financial aid affects a student's drop out or transfer decision. With college costs growing substantially over the last thirty years, there has been a significant shift in the philosophy of funding higher education. As college students are asked to shoulder the increasing costs of their education with student loans, it is important to identify whether this growing financial responsibility is acting as a road-block to success. Methodology To provide a more comprehensive analysis of the relationship between financial aid and student success, we utilize the StudentTracker service available from the National Student Clearinghouse to more accurately distinguish whether departers from the University are transferring or dropping out of college. Because the existing literature relies on a narrow interpretation of student retention as a simple dichotomy, it ignores how factors such as financial aid may differentially relate to a broader interpretation of student success. Multinomial regression techniques are utilized to effectively model this polychotomous variable.
Sample To explore if factors related to student finances affect the reenrollment decision of freshman at the
University of Minnesota-Twin Cities, we utilized tenth-day census data for the Fall 2002 freshman cohort freshman obtained from the University’s data warehouse. The University of Minnesota-Twin Cities campus is the state’s Land Grant institution and is classified as a Research University with Very High Research Activity (RU/VH) by the Carnegie Foundation. In fall 2002, the University enrolled 48,677 students, 28,103 of which were undergraduate students. The original data sample consisted of 5,188 New High School Students, which the University defines as first-time, full-time students. After removing cases with missing observations, the analysis was conducted on the 5,116 students remaining, or 99 percent of the original sample.
Measuring Student Success Currently, federal reporting requirements distort the true picture of student success by limiting
graduation counts to completion of a degree at the institution of entry (Adelman, 2006; Stratton, O’Toole, &Wetzel; Jones-White, Radcliffe, Huesman, & Kellogg, 2008). To facilitate our desire to model the factors such as financial aid that contribute to college completion beyond simply the institution of entry, we utilized the StudentTracker service offered by the National Student Clearinghouse (NSC) to identify if students who departed the University but completed a degree at another institution of higher education. According to its organizational documents, the National Student Clearinghouse is a non-profit organization that provides third-party enrollment and degree verification for secondary and post-secondary institutions across the country. With more than 3,300 colleges participating in the Clearinghouse’s different verification services, the NSC serves as a rich source of data pertaining to the educational career paths of more than 90 percent of college students in the United States (NSC, 2009). Specifically, subscribing to the StudentTracker service offered by the Clearinghouse allows member
315
Proceedings of the 5th Annual National Symposium on Student Retention. Copyright 2009. C-IDEA, The University of Oklahoma.
institutions to query their “database of 93 million post-secondary enrollment and degree records” (NSC, 2009, p. 2).
Figure 1 Plot of Factor Change in Odds Ratio for Four Financial Aid Variables
To accurately identify the graduation outcomes for those students departing the University prior to obtaining a degree, the cohort was initially divided into two groups; those who graduated from the University within six years (just under 66 percent) and those who did not. The list of non-graduates was sent to the National Student Clearinghouse to determine whether the students graduated within six years from another institution. Graduation outcomes were produced for 440 of these students, suggesting that more than 24 percent of students who drop out of the University of Minnesota graduate from another four-year institution within the same six year period. The result is a three outcome variable that indicates whether a student obtained a degree from the University of Minnesota, obtained a degree from another four-year institution, or failed to earn a degree within the period of observation. The distribution of these outcomes is illustrated in Figure 1. To date, very few studies have modeled the student retention decision as an outcome with multiple categories. Where studies have used a multi-outcome dependent variable, they have largely attempted to distinguish between the stop-out, transfer out and persistence behavior of students after the first year (Porter, 2003; Herzog, 2005; Stratton, O’Toole, & Wetzel, 2008). Both Porter (2002, 2003) and Herzog (2005) utilized data from the National Student Clearinghouse to construct persistence models with multiple outcomes, but constrained their analysis to a student’s first-year persistence decision. While first-year retention remains an important piece of the student success puzzle, it is important to note that as schools continue to invest more and more resources in first year retention programs, there is less to explain in first year retention outcomes. For example, more than 85 percent of students enrolled as freshman at the University of Minnesota-Twin Cities return for a second year. Of those that chose not to return after their first year, estimates from the National Student Clearinghouse suggest that as many as 62 percent of these students end up in another post-secondary institution within the next year. Because we believe persistence challenges remain throughout the course of student’s educational path, this paper builds on the expanded interpretation of student success developed by Jones-White, Radcliffe, Huesman, and Kellogg (2008) which constructs student success as multi-categorical outcome of degree attainment either at the University or another four-year institution within six-years. Analytic Approach For our results to be consistent and efficient, we need a statistical methodology that fits the structure of our data. Since our dependent variable represents unordered categories, standard regression techniques are not appropriate. Likewise, the binary logit approach commonly used to model student retention or graduation cannot accommodate the multi-categorical definition of degree attainment used in this study. It is possible to estimate binary logit models comparing each pair of possible outcomes, but the number of possible comparisons can make this both conceptually and computationally confusing (Long,
316
Proceedings of the 5th Annual National Symposium on Student Retention. Copyright 2009. C-IDEA, The University of Oklahoma.
1997; Long & Freese, 2003), while the resulting differences in sample sizes makes drawing comparisons across models difficult.
As in our previous work in this area (Jones-White, Radcliffe, Huesman, and Kellogg, 2008), we address these issues in model specification by applying multinomial logit (MNL) techniques. Multinomial logit can be understood as “simultaneously estimating binary logits for all possible comparisons among the outcome categories” (Long, 1997, p. 151). By simultaneously estimating all the logits, rather than estimating each pair wise comparison separately, the MNL both “…enforces the logical relationship between the parameters and uses data more efficiently” (Long, 1997, p. 151). Formally the multinomial model can be expressed as the probability model:
.
Conceptual Framework and Model Specification The explanatory variables utilized in this study are based on the existing student retention literature and reflect characteristics of a student collected both prior to admission and during their first semester. Specifically, we adopt elements of Beekhoven, De Jong and Van Hout’s (2002) combined integration and rational choice approach to understanding student persistence. This approach suggests that in addition to the traditional measures of academic and social integration used to understand student persistence, academic progress can further be understood by incorporating elements of rational choice, which suggests that individuals make decisions based on cost-benefit analysis. Specifically, Beekhoven et al (2002) suggest three cost-benefit mechanisms that potentially influence the educational decisions of individuals: 1) financial resources available to the student associated with family income, 2) the social costs the student associates with dropping out, and 3) the subjective expectations the student has about their personal abilities (p. 580). We expand this interpretation to also include concepts of personal finance as related to the consequences of different types of financial aid. Specifically, we hypothesize that the type of financial aid available to a student influences their educational career path, with sources of financial aid that require greater stake in paying for their education increasing the likelihood of seeking out other educational alternatives.
Academic Background. The first group of variables incorporated into our model control for the precollege academic ability and preparedness. The composite ACT score variable reports the score on the ACT examination. Where students submitted SAT rather than the ACT scores, we computed an equivalent score based on the conversion scale provided by the College Board. First generation college is a dichotomous variable that captures whether the student is the first in their family to attend college and attempts to identify the familial resources students have available to them. Because the University of Minnesota-Twin Cities allows students to apply to more than one of the University’s academic colleges (e.g. College of Liberal Arts, College of Biological Sciences), we created a dichotomous variable to identify whether the student was admitted to their first-choice college or not. Its explanatory role is to provide an early indication of the lack of congruence between the student’s goals and the University’s offerings. Advanced placement credit is a count of the number of credits new high school students were able to transfer in via advanced placement testing. Remedial course taken is a dichotomous variable identifying whether the student was enrolled in a remedial course during their first semester, and is a proxy for academic preparation.
Academic Performance. According to previous research on retention and graduation, first-term GPA is often strongly associated with student success (Pascarella & Terenzini, 1991, p. 388). Unfortunately, because of both its explanatory power and strong correlation with other variables in the model, GPA often obfuscates the influence of other variables known to impact persistence. To correct for this, we utilize several alternative variables to measure first semester performance. The first academic performance measure is the ratio of credit hours earned-to-attempted. To help with inference, this ratio was multiplied by 100 so that a unit change reflects a 1/100th change rather than a change across the total scale. We also include independent measures of the counts of Cs, Ds, and Ws received by the student during the first term.
317
Proceedings of the 5th Annual National Symposium on Student Retention. Copyright 2009. C-IDEA, The University of Oklahoma.
Demographic Characteristics. In addition to variables controlling for the student’s academic preparation and performance, we also include several dichotomous variables to control for the potential influence of demographic characteristics. Female is a dichotomous variable coded 1 if the student was a woman, 0 if not. Underrepresented minority is a dichotomous variable to indicate whether the student is from one of the historically underrepresented racial/ethnic groups in higher education: Native American/American Indian, African American, or Hispanic. Because the University of Minnesota-Twin Cities also has a significant population of Asian students (11.0 percent), a separate dichotomous variable was also created. Because retention patterns of student athletes may not mimic those of the general population (DesJardins, Ahlburg, & McCall, 1999; Radcliffe, Huesman, Kellogg, & Jones-White, 2009), we incorporated a dichotomous variable to control for these students as well.
Geographic Origin. One of the important features of the University of Minnesota-Twin Cities is that the state of Minnesota participates in a heavily-used reciprocal pricing program with its neighboring states: Wisconsin, North Dakota and South Dakota. These reciprocity agreements allow for students in neighboring states to enroll at the institution under in-state tuition pricing. To account for this reduced pricing system for select out of state students, two dichotomous variables were created to control for geographic origin. Reciprocity state identifies those students enrolled from a state participating in the reciprocity agreements. To capture all other out-of-state students, another variable was created.
Social Integration. Four measures of social integration are also included in the model. The first is living on-campus. This is a dichotomous variable measuring whether or not the student lives in one of the University’s dormitories. The second variable we utilize to measure social integration is whether or not the student participates in one of the University’s living learning communities. The final two variables measure whether or not the student worked on-campus. Utilizing dichotomous variables, we capture whether students worked on-campus through either to federal work-study program or other campus employment.
Financial Aid. To assess the impact of financial aid on the student’s retention decision we incorporated four variables meant to identify whether a student’s usage of different types of aid potentially influenced the student’s choice of educational career path. The first financial aid variable is need aid award which is a dichotomous variable that measures if the student accepted need-based financial aid offered through the federal Pell Grant program, the Minnesota state grant program, and SEOG grants. In fall 2002, 39 percent of new high school students received a need award. The average award for students receiving need based aid their first semester was $1,990.83. The second financial aid variable we incorporated into our model is merit aid award. This variable identifies whether the student accepted aid offered through the admissions office in the form of a scholarship. Approximately 12 percent of students in our sample received merit based aid with an average first term amount of $1,383.46. The third financial aid variable in our model is the amount of loan aid the student accepted. This value reflects all loan aid processed through the University and consequently is unable to measure loans given directly to the student and/or his or her parents. Approximately 46 percent of freshman enrolled during fall 2002 accepted a loan award, with the average borrower accepting $3,376.69. The final financial aid measure included is the amount of remaining unmet financial need a student had for the semester. Findings and Interpretations The results for our multinomial logit model of six-year student success were produced utilizing STATA and are presented in Table 1. Although a multinomial dependent variable with three outcomes yields six potential comparisons, only three of the comparisons are unique and, therefore, relevant. As a result, it is important to identify the comparisons reported in Table 1. The logit coefficients and standard errors comparing degree attainment at the University of Minnesota relative to dropping out are provided in columns I and II. Columns III and IV report the coefficients and standard errors for the decision to complete a degree at another institution relative to the decision to drop out, while columns V and VI provide the results comparing transfer success relative to graduation at the University of Minnesota. Logit coefficients reflect the ceteris paribus change in the log-odds and are interpreted such that positive
318
Proceedings of the 5th Annual National Symposium on Student Retention. Copyright 2009. C-IDEA, The University of Oklahoma.
values increase the likelihood of the comparison outcome relative to the reference, or base, outcome. Negative outcomes, conversely, decrease the likelihood of the comparison outcome relative to the reference outcome. Significance levels are reported at the 0.01 (***), 0.05 (**), and 0.10 (*) levels. Table 1. Multinomial Logit model of Drop out, Other 4‐Year Degree and UMN Degree
Number of obs 5116Log likelihood ‐3571.7Pseudo R2 = 0.1526
UMN|Dropout Other 4‐Yr|Dropout Other 4 Yr|UMN
The multinomial logit model in Table 1 provides evidence that some pre-college student characteristics affect college success. Among the tested variables that are associated with a student’s
319
Proceedings of the 5th Annual National Symposium on Student Retention. Copyright 2009. C-IDEA, The University of Oklahoma.
academic background and ability, both first generation college and enrolling in a remedial course act to decrease the likelihood of success across all institutions of higher education. This finding suggests that the effects of these variables are not associated specifically with a lower likelihood of success at the University specifically, but rather serve as a roadblock for success in a potentially more general way. Conversely, the number of advanced placement credits accepted by the University increases the likelihood of success at the University of Minnesota relative to dropping out, while decreasing the likelihood of obtaining a transfer degree relative to a degree from the home institution. The results related to first term academic performance are both consistent and robust. The course completion ratio, the variable measuring courses passed out of courses taken, is positively associated with completion at both the University and other four-year institutions relative to dropping out. This suggests that first semester performance during the first semester is a good indicator of overall likelihood of success for students starting at the University. Further, the significantly negative association between the likelihood of obtaining a degree from another four-year institution relative to a obtaining a degree from the University of Minnesota suggests that better first semester performance, as measure by the first semester completion rate, increases the likelihood of success at the University of Minnesota-Twin Cities relative to each of the other alternatives. Conversely, the count variables associated with the number of Cs, Ds, and Ws obtained by the student during their first semester at the University consistently1 decrease the likelihood of student success across institutions. Specifically, an increase in each of these variables decreases the likelihood of obtaining a degree at either the home institution or another four-year institution relative to dropping out. For those students who continue on to be successful in college, higher numbers of Cs, Ds, and Ws during their first semester increases the likelihood of obtaining their degree from another four-year institution rather than graduating from the University. The multinomial logit model also highlights significant demographic differences related to the pathways to student success. Women are more likely than men to obtain a degree both at the home institution and at another four-year institution than to drop out, but are also more likely than men to obtain a degree from an institution different than the home institution. Asian students are less likely to obtain a transfer degree than a degree from the University of Minnesota and are also less likely to earn a transfer degree than drop out. Underrepresented minorities are less likely than non-minorities to get a degree either at the home institution or at another four-year institution than drop out, suggesting that the persistence challenges facing underrepresented minority are widespread across institutions of higher education. Students participating in University sponsored athletics demonstrate considerable commitment to the University as they are both more likely to obtain a degree from the home institution than drop out and less likely to obtain a degree from another four-year institution than from the University. That this result may appear contrary to our expectations about student-athletes potentially reflects our society’s fascination with a subset of student athletes (Buhayar, 2007; Splitt, 2007), specifically, those participating in revenue generating sports such as football and basketball. On average, being a student athlete generally increases the chance of success at the University of Minnesota-Twin Cities. Geographic origin at the time of application also affects the academic career paths of students starting at the University of Minnesota-Twin Cities. While geographic origin does not specifically influence the likelihood of success at the University of Minnesota relative to dropping out, enrolling from either out-of-state or from a reciprocity state does increase the likelihood of transfer behavior. Table 1 suggests that nonresident students are more likely than Minnesota residents to obtain a four-year degree from institution other than the University of Minnesota than either drop out or complete their degrees at the University. The results of living on-campus in either a residential hall or in a living learning community are encouraging. Students living on-campus are more likely to earn a degree either at the home institution or
1 Only the variable for D count is not significant in the model for obtaining a degree from another institution relative to dropping out.
320
Proceedings of the 5th Annual National Symposium on Student Retention. Copyright 2009. C-IDEA, The University of Oklahoma.
another four-year institution than drop out, suggesting that the on-campus experience helps to effectively transmit the importance of higher education and where students do not successfully integrate; they seek other alternatives rather than give up. Participation in living learning communities has a similar impact on the decision to earn a degree from the home institution rather than drop out, but does not affect the other likelihoods. After controlling for other variables in the model, participation in on-campus
Factor Change Scale Relative to Category 0
Logit Coefficient Scale Relative to Category 0
.75
-.29
.86
-.15
.99
-.01
1.15
.14
1.33
.28
1.53
.43
1.77
.57
2.04
.71
2.36
.86
1 2
0
1 2
0
1 2
0
1 2
0
Unmet Need (100s) Std Coef
Need Aid 0/1
Loan Aid 0/1
Merit Aid 0/1
Figure 2 Plot of Factor Change in Odds Ratio for Four Financial Aid Variables
employment, despite the potential for helping to integrate students into the institution, does not appear to impact the likelihood of success.
Financial factors also affect a student’s academic career path. As indicated on Table 1, while unmet need does not increase the likelihood of success relative to dropping out, students with high unmet need during their first semester are more likely to be successful at another four-year institution than they are to be successful at the University of Minnesota. Additionally, results based on the type of financial aid awarded to the student indicate that aid awards differentially affect a student’s graduation path, providing evidence in support of our hypothesis that the type of aid utilized by students matters. Need awards, for example, decrease the likelihood of transfer behavior while normalizing the chances of success for students across all institutions relative to dropping out of college. Reliance on student loans, however, has a significantly different effect as it decreases the likelihood of success at the home institution and increases the likelihood of transfer success. This implies that students are likely to search for better educational deals when they are forced to take a personal stake in financing their education through student loans. Of the types of student aid available to students, none is currently as controversial in the literature on financial aid as the concept of merit aid because of its perceived benefits to students who already have access to college (Heller, 2006). Despite these concerns, merit aid seems particularly effective from an institutional perspective, as merit aid acts to increase the likelihood of success at the University and decrease the likelihood of transfer behavior. To aid with interpretation, Figure 2 plots the odds ratios of the four financial variables of interest in this study: total unmet need, received a need award, received a loan award, and received a merit award. Figure 1 illustrates the factor change in the odds for a standard deviation change in our single continuous variable (unmet need) and a unit change for each of our three dichotomous variables (need award, merit award, and loan award). Because the decision to drop out is the base, or referent, category, its position is constrained to the odds ratio of 1. Consequently, the locations of the integers on Figure 1 represent the factor change in the odds of either obtaining a degree from the University of Minnesota (outcome 2) or another 4 year institution (outcome 1) relative to dropping out of college (outcome 0). Lines connecting outcome variables indicate where changes are not statistically significant between the different outcomes. As illustrated in Figure 2, a standard deviation increase in the amount of unmet need a student has increases the likelihood of transferring relative to obtaining a degree from the University. Conversely, students receiving need aid are less likely to obtain a degree from an institution other than the University, suggesting either that as student’s financial burdens are offset with institutional aid their odds of
321
Proceedings of the 5th Annual National Symposium on Student Retention. Copyright 2009. C-IDEA, The University of Oklahoma.
transferring to another institution are reduced, or, perhaps more troubling, that individuals relying on need aid to pay for college potentially lack the necessary financial resource to explore other educational opportunities beyond the university they first attend. Accepting a student loan decreases the odds of obtaining a degree from the University as compared to either dropping out or obtaining a degree from a different institution, although the differences between both transferring and dropping out (0 versus 1) are not statistically significant. The most striking effect in terms of changes in the odds is associated with merit aid. Acceptance of merit aid dramatically increases the odds of success at the University as opposed to dropping out or transferring. Taken together these results demonstrate the disparate impact of different aid packages. Where the University invests in students, either through need or merit based aid, students are likely to persist and be successful. Where students are left with a high amount of unmet need or are encouraged to finance their education through student loans, students are more likely to seek out educational opportunities potentially more affordable to them. Conclusions Most existing studies on student retention utilize a strict dichotomy to characterize student success: students either persist or depart. While parsimonious, this interpretation of student success does not accurately reflect the different options available to students in their pursuit of a college degree. Recognizing that students often have educational career paths that lead them to graduation beyond the institution of entry, the results in this study demonstrate how utilizing data from the National Student Clearinghouse, combined with a methodological approach that accommodates the estimation of relationships across polychotomous outcomes, allows for a more comprehensive and reliable understanding of factors associated with student success. By using a multinomial logit model to estimate the factors associated with the student’s decision to either persist until graduation, successfully transfer, or drop out, we found significant differences in the ways different variables influence the different choices available to student that are hidden by the failure to distinguish transfers and drop outs. These different influences are clearly illustrated in the results concerning financial aid. The results for our model suggest that, at least for this cohort of college freshmen, the type of financial aid differentially impacts the likelihood of specific academic career path choices. This is consistent with other studies using a similar approach (Herzog, 2005; Stratton, O’Toole, and Wetzel, 2008). As we would hope, students accepting need based aid are no more or less likely to graduate from the either the University or another four-year institution than they are to drop out, suggesting that that need based aid has a potentially equalizing effect on the likelihood of graduation. Where need based aid does appear to matter is in the decision of where to graduate, as students receiving need based aid are less likely to graduate from another institution rather than earning their degree at the University of Minnesota. Taken together, these results provide some initial evidence for administrators at the University of Minnesota that need based aid is successful in helping alleviate the financial barriers to higher education for low-income students. Merit aid, however, appears to substantially decrease the likelihood of student departure. While it is difficult to completely disentangle the relationship between merit aid and academic ability, our model suggests that the provision of merit aid increases the likelihood of success at the institution of entry relative to both transfer completion and drop out behavior even after controlling for other factors designed to capture a student’s academic ability. This suggests that by lowering the price of attendance relative to other higher educational alternatives, merit aid has the potential to improve the competitive position of the offering institution relative to its competitors. While the concept of merit aid remains highly controversial, it appears that it has the potential to be a highly effective mechanism for college administrators to decrease the likelihood of departure of students. Perhaps our most interesting finding relates to student borrowing. According to our model, accepting a student loan substantially decreases the likelihood of success at the institution of entry. Students who borrow during their first semester are more likely to transfer or drop out after their first semester relative to their odds of graduating from the University of Minnesota. Given the increased pressures associated with higher costs of college attendance that encourage students to borrow, this is
322
Proceedings of the 5th Annual National Symposium on Student Retention. Copyright 2009. C-IDEA, The University of Oklahoma.
extremely important as it directly undermines institutional retention goals. Moreover, the institution encourages students to take out loans in order to avoid the substantial opportunity costs of delaying graduation while working to pay for college. To overcome this challenge to student persistence, the University could potentially benefit from first-year programs aimed to help student borrowers make more informed financial decisions.
323
Proceedings of the 5th Annual National Symposium on Student Retention. Copyright 2009. C-IDEA, The University of Oklahoma.
References AASCU (American Association of State Colleges and University). (2006). Student debt burden. Policy
Matters. Vol. 3, No. 8. August.
Adelman, C. (2006). The Toolbox Revisited: Paths to Degree Completion from High School Through College. Washington, DC: U.S. Department of Education [online]. February. Available at: http://www.ed.gov/rschstat/research/pubs/toolboxrevisit/toolbox.pdf
Beekhoven, S. De Jong, U., & Van Hout, H. (2002). Explaining academic progress via combining concepts of integration theory and rational choice. Research in Higher Education. Vol. 43, No. 5. October.
Braunstein, A, McGrath, M. & Pescatrice, D. (2000). Measuring the impact of financial factors on college persistence. Journal of College Student Retention. Vol.(2)3. 191-200.
Buhayar, N. (2007, April 2). “College players struggle to make the grade: Colleges’ record mixed when it comes to graduation rates among basketball players.” Online NewsHour Extra. http://www.pbs.org/newshour/extra/features/jan-june07/ncaa_4-02.html
Burke, J. C. & Minassians, H. (2001). Linking State Resources to Campus Results: From Fad to Trend – The Fifth Annual Survey.
College Board. (2008). Trends in College Pricing. New York, New York: The College Board. http://professionals.collegeboard.com/profdownload/trends-in-college-pricing-2008.pdf
DesJardins, S.L., Ahlburg, D.A., & McCall, B.P. (1999). An event history model of student departure. Economics of Education Review. 375-390.
DesJardins, S. L., Ahlburg, D. A., & McCall, B. P. (2002). Simulating the longitudinal effects of changes in financial aid on student departure from college. The Journal of Human Resources. Vol. 37, No. 3. 653-679. Summer.
Dowd, A. C. (2004). Income and financial aid effects on persistence and degree attainment in public colleges. Education Policy Analysis Archives. 12(21).
Ehrenberg, R. G. & Sherman, D. R. (1984). Optimal financial aid policies for a selective university. The Journal of Human Resources. Vol. 19, No. 2. Pp 202-230.
Heller, D. E. (1997). Student price response in higher education: An update to Leslie and Brinkman. The Journal of Higher Education. Vol. 68, No. 6. Pp. 624-659.
Heller, D. E. (2006). Merit Aid and College Access. Paper presented at the Symposium on the Consequences of Merit Based Student Aid. Madison, WI. March.
Herzog, S. (2005). Measuring determinants of student return vs. dropout/stopout vs. transfer: A first-to-second year analysis of new freshmen. Research in Higher Education. Vol. 46, No. 8. Pp. 883-928.
Horn, L. (2006). Placing College Graduation Rates in Context: How 4-Year College Graduation Rates
Vary With Selectivity and the Size of Low-Income Enrollment (NCES 2007-161). U.S. Department of Education. Washington, DC: National Center for Education Statistics.
Jackson, G. A. (1978). Financial aid and student enrollment. The Journal of Higher Education. Vol. 49, No. 6. Pp. 548-574.
324
Proceedings of the 5th Annual National Symposium on Student Retention. Copyright 2009. C-IDEA, The University of Oklahoma.
Jones-White, D., Radcliffe, P.M, Huesman, R. L. Jr., Kellogg, J. P. (2008). Redefining student success: Assessing different multinomial regression techniques for the study of student retention and graduation across institutions of higher education. Paper presented at the Association for Institutional Research Annual Forum. Seattle, WA. May 24th-28th.
Leslie, L. L., & Brinkman, P. T. (1987). Student price response in higher education in the United States. The Journal of Higher Education. Vol. 58. Pp. 181-204.
Long, J. S. (1997). Regression Models for Categorical and Limited Dependent Variables. Sage Publications. Thousand Oaks: CA.
Long, J. S. & Freese, J. (2003). Regression Models for Categorical Dependent Variables Using Stata: Second Edition. Stata Press. College Station: TX.
MacCallum, M. (2008). Effects of financial aid processing policies on student enrollment, retention and success. NASFAA Journal of Student Financial Aid. Vol. 37, No. 2. 17-32.
McPherson, M. S. & Schapiro, M. O. (1991). Does student aid affect college enrollment?: New evidence on a persistent controversy. The American Economic Review. Vol. 81, No. 1. Pp. 309-318.
McPherson M. S. & Schapiro, M. O. (2002). Changing patterns of institutional aid: Impact on access and educational policy. In Heller, D. E., (Ed.). Condition of Access: Higher education for lower income students. Westport, DT: Praeger Publisher 73-94.
Moline, A. E. (1987). Financial aid and student persistence: An application of causal modeling. Research in Higher Education. Vol. 26., No. 2. 130-147.
Millett, C. M. (2003). How Undergraduate Loan Debt Affects Application and Enrollment in Graduate or First Professional School. The Journal of Higher Education. Vol. 74, No. 4. Pp. 386-427.
NSC (National Student Clearinghouse). (2009, April 8). About the National Student Clearinghouse. http://www.studentclearinghouse.org/about/pdfs/Clearinghouse_profile.pdf
Pascarella, E. T. & Terenzini, P. T. (1991). How college affects students: Findings and insights from tweny years of research. Jossey-Bass. San Francisco, CA.
Porter, S. R. (2002). Including transfer-out behavior in retention models: Using the NSC EnrollmentSearch data. AIR professional file No. 82)
Porter S. (2003). Understanding Retention Outcomes: Using multiple data sources to distinguish between dropouts, stopouts, and transfer-outs. Journal of College Student Retention, 5(1), 53-70.
Radcliffe, Peter M., Ronald L. Huesman, Jr., John P. Kellogg, and Daniel Jones-White. (2009). “Identifying Students at Risk: Utilizing Survival Analysis to Study Student Athlete Attrition.” IR Applications 21. Forthcoming, Spring,
Ronstadt, R. (2009, February 27). Don’t Fix the Student Aid System. Kill it. Chronicle of Higher Education, 55(25), A36-A37. Retrieved July 31, 2009, from Professional Development Collection database.
Singell, L. & Stater, M. (2006). Going, going, gone: The effects of aid policies on graduation at three
large public institutions. Policy Sci. 39: 379-403.
Smith, L. (2007, June 15). Congress Considers Linking Student Loan Terms to Income. Chronicle of Higher Education, 53(41), A17-18. Retrieved July 31, 2009, from Professional Development Collection database.
325
Proceedings of the 5th Annual National Symposium on Student Retention. Copyright 2009. C-IDEA, The University of Oklahoma.
Splitt, F. G. (2007, April 9). The academic performance of college athletes: No doubt worse than reported. http://www.thedrakegroup.org/Splitt_Academic_Performance_of_College_Athletes.pdf
Stratton, L. S., O’Toole, D.M., & Wetzel, J.N. (2008). A multinomial logit model of college stopout and
dropout behavior. Economics of Education Review. 27: 319-331.
Schwartz, J. B. (1985). Student financial aid and he college enrollment decision: the effects of public and private grants and interest subsidies. Economics of Education Review. Vol. 4, No. 2. Pp. 129-144.
St. John, E. P. (1990). Price response in enrollment decisions: An analysis of the High School and Beyond senior cohort. Research in Higher Education. Vol. 31, No. 4. Pp. 387-403.
St. John, E. P. (1994). Assessing tuition and student aid strategies: Using price-response measures to simulate pricing alternatives. Research in Higher Education. Vol. 35, No. 3. 301-334.
St. John, E. P. (2000). The impact of student aid on recruitment and retention: What the research indicates. New Directions for Student Services. No. 89. 61-75. Spring.
Somers, P., & St. John, E. P. (1997). Interpreting price response in enrollment decisions: A comparative institutional study. Journal of Student Financial Aid. 29(3). 15-36.
Terkla, D. E. (1984). Does financial aid enhance graduate persistence? Paper presented at the American Educational Research Meeting
Zumeta, W. (2001). Public Policy and Accountability in Higher Education: Lessons from the Past and Present for the New Millenium. In Heller, D. E., (Ed.). The States and Public Higher Education Policy: Affordability, Access, and Accountability. The Johns Hopkins University Press. Baltimore, MD.
326
Proceedings of the 5th Annual National Symposium on Student Retention. Copyright 2009. C-IDEA, The University of Oklahoma.
Programs and Practices That Retain Students in the First-Year: Insights from a National Study
Linda DeAngelo
Higher Education Research Institute University of California, Los Angeles
Abstract – Using a national longitudinal dataset from the Cooperative Institutional Research Program (CIRP) that includes over 20,000 freshman who started college in 2007 and completed The Freshman Survey (TFS) as they began college and the Your First College Year (YFCY) survey at the end of their first year, this study examines how the experiences students have during their first year affects the likelihood that they intend to return to college for their second year. Among the findings are that students who are engaged in academic experiences outside of the classroom, especially discussing course content with students outside of class, are more likely to intend to return to campus than those who are not engaged or engaged to a lesser extent. Curriculum for first-year students – first-year seminars for academic success, learning communities, and service learning – did not have direct effects on retention, but college grade-point average did have a significant positive effect. In addition, students with major concerns about financing college at the end of the first year are less likely to intend to return to college for their second year. Introduction
Reforming and improving the first-year college experiences has been a focus of retention efforts on college campuses since the 1980s. Much of this reform has been at the program-level (Alexander & Gardner, 2009), and on many, if not most, college campuses new first-year curricula, layered with more traditional general education and introductory courses for the major, are now the normative classroom experience during the first college year. Among the curricula that have now become standard during the first-year are learning communities, service learning, and freshman seminars. Though the potential of these types of curricula has been well documented (See Upcraft, Gardner, & Barefoot, 2004), and studies have emerged indicating that innovations are efficacious (See Barefoot et al., 2005; Kuh, 2008), there is still much to learn about how participating in these experiences affects first-year retention. Indeed, as noted by Alexander & Gardner (2009), because many of these efforts still operate at the margins of campus they may not have much of an effect on students.
Given the effort that campuses have put into reforming their first-year curricula so as to maximize retention, there is a tremendous need for studies examining how these efforts affect retention. This study is intended to begin to fill in this research gap. Understanding first-year retention is also important since as noted by Tinto (1993) college attrition is most likely to occur during or immediately following the first-year of college. As reported by ACT (2002), at four-year colleges the probability that a first-year student will not return for their second year is approximately 25%. Research Background
While studies examining the first-year experience and specifically first-year curricula and involvements are needed, the research literature on retention is well developed. Most studies of persistence rely on Tinto’s (1975, 1987, 1993) theory of student departure. Tinto proposes a longitudinal model of persistence that take into account pre-college student characteristics and involvement and engagement in the college environment, examining how academic and social integration into the campus community affects retention. Through his research Tinto (1996) identified seven factors that explain why students decide not to return to campus: 1) academic difficulties, 2) adjustment difficulties, 3) uncertain,
327
Proceedings of the 5th Annual National Symposium on Student Retention. Copyright 2009. C-IDEA, The University of Oklahoma.
narrow, or new goals, 4) external commitments, 5) financial concerns, 6) lack of student-institution fit, and 7) isolation from campus life. In regards to these areas, researchers have generally found that they are predictors of retention.
Specifically, past researchers have found that persistence is related to student expectations for college (Braxton, Vesper & Hossler, 1995), their satisfaction with the college experience (Cabrera, Stampen & Hansen, 1990; Gilmartin & Sax, 2002), the amount and type of financial aid they receive (Hu & St. John, 2001; St. John, Hu & Weber, 2001; St. John, Kirshstein & Noell, 1991), students concerns about financing their education (Gilmartin & Sax, 2002), attributes of the institution attended (Berger & Braxton, 1998), place of residence (Christie & Dinham, 1991; Pike, Schroeder & Berry 1997), characteristics of peer group (Terenzini & Pascarella, 1984), career self-efficacy (Peterson, 1993), and student-faculty interaction (Gilmartin & Sax, 2002; Pascarella & Terenzini, 1977, 1979, 1980). In addition, research has generally found that the effects of student background on retention are mostly indirect and that once the college experience is controlled these factors are less important (See Cabrera, Nora, Terenzini, Pascarella & Hagedorn, 1999; Pascarella & Terenzini 1977, 1979; Hu & St. John, 2001).
Few studies have examined how participation in academic experiences both inside and outside of the classroom affects the retention decision. Exceptions to this are the later work of Tinto (1997) and a study of first-year retention by Gilmartin & Sax (2002). As measure of academic and social integration, Tinto’s recent research examines the effect of learning communities on retention and generally finds that they are positively connected to retention. Gilmartin & Sax on the other hand find no effect for participating in first-year seminars on retention.
Research Objective
Using past research as a guide, this study is intended to expand our understanding of how the
first-year experience students have inside and outside of the classroom affects retention, specifically the intent to return to campus for the sophomore year. Although intent to re-enroll is not a direct measure of retention, Bean’s (1980, 1982, 1983) research indicates that intention to return is a very powerful predictor of actual retention. The focus of this research is on the programs and practices both inside and outside of the classroom that have been the focus of reform efforts on campuses during the last three decades. Method Data Source and Sample
Data were derived from the Cooperative Institutional Research Program’s (CIRP) 2007 Freshman Survey (TFS) and 2008 Your First College Year (YFCY) survey. CIRP is housed at the Higher Education Research Institute (HERI) at the University of California, Los Angeles and has been collecting data on college students for more than forty years. The TFS is administered during summer orientation or the first few weeks of class and the YFCY is administered to students at the end of their first year of college. In total, over 26,000 students from 487 4-year institutions participated in both surveys, constituting a longitudinal dataset of the first year of college.
For the first time in its history, CIRP weighted the longitudinal YFCY dataset to represent the national population of students at 4-year institutions who complete the first year of college. Data from IPEDS on fall to fall first-time full-time retention rates for 1st year students was used to represent the national population. Thus, the sample of students for weighting was limited to first-time, full-time students in both fall 2007 and spring 2008, reducing the sample slightly to 25,602 students. The weighting technique employed adjusts the sample upwards to the population (Babbie, 2001; Dey 1997); taking into account individual as well as institutional response bias. For a detailed description of the weighting analysis and variables used in the weighting, please see www.heri.ucla.edu.
328
Proceedings of the 5th Annual National Symposium on Student Retention. Copyright 2009. C-IDEA, The University of Oklahoma.
Missing Data In order to preserve the full national longitudinal dataset in its near entirety, an expectation-
maximization (EM) algorithm was used to compensate for missing values. This method provides a more accurate estimation for missing data than options such as replacing missing values with the mean value for the variable across respondents (McLahlan & Krishnan, 1997). Data for gender, and other dichotomous independent variables and for the dependent variable was not imputed and cases with missing data on these variables were deleted. This created a final national longitudinal dataset of 24,443 students for this study. Variables
Key Variables
A full list of the variables used in this study is included as Appendix A. The outcome variable, taken from the YFCY, asks – “What do you think you will be doing in Fall 2008?” Possible responses were – “attending your current (or most recent) institution,” “attending another institution,” “don’t know/have not yet decided,” and “not attending any institution.” For the purposes of this study, students who answered “attending your current (or most recent) institution” were coded as 1 and students who answered “attending another institution” or “not attending any institution” were coded as 0. Students who were undecided about their decision were not included in the analysis.
Key independent variables were intended to capture of effect of recent undergraduate curriculum reform efforts on the intent students have to re-enroll for the second year of college. Many of these curriculum reform efforts were intended to enhance the first-year experience and aid in retention. This study includes variables to measure the effect of first-year housing, participation in service learning, learning communities, and first-year seminars designed to assist students in adjusting to college. The selection of these three particular classroom experiences was based not only on major curriculum reform efforts, but on literature (Kuh, 2008) indicating that these experiences are connected to student learning gains in the first year of college.
Classroom behaviors in the first-year of college were also captured through a set of three latent constructs. The first construct measured academic adjustment, or the ease with which students adjusted to the academic demands of college. The second measured usage of “habits of mind” (Conley, 2005) needed for academic success and lifelong learning, and the third measured academic disengagement. Indicators of each these latent constructs were identified using factor analysis, and then evaluated and scored using Item Response Theory (IRT). Specifically, Samejima’s (1969) graded response model (GRM) was applied using MULTILOG 7 (Thissen, Chen, & Bock, 2002) to get item parameters and to score students. The scoring procedure results in scores that have a z-score metric (mean of zero and standard deviation of one). For ease of interpretation the scores were re-scaled to have a mean of fifty and a standard deviation of about ten.
This study also includes a set of variables intended to capture student experiences and behaviors outside of the classroom, all of which have been linked to learning outcomes of a liberal education (AAC&U, 2007). These variables include discussing course content with students outside of class, studying with other students, working on a professor’s research project, having meaningful and honest discussions about race/ethnic relations outside of class with students from racial/ethnic groups other than your own, and having intellectual discussions outside of class with students from racial/ethnic groups other than your own. In addition, this study includes a latent construct measuring the effect of student-faculty interaction, first-year college GPA, and working full-time while attending college. The student-faculty interaction construct was created and scored in the manner described in the previous paragraph. Lastly, this study gauges the effect of financial concerns at the end of the first year of college.
Other Independent Variables
In addition to the key independent variables, this study includes a set of control variables. These variables include gender, first-generation status, scholastic aptitude test (SAT) scores, with ACT scores
329
Proceedings of the 5th Annual National Symposium on Student Retention. Copyright 2009. C-IDEA, The University of Oklahoma.
converted to SAT scores, financial concerns at the beginning of college, likelihood of needing extra time to complete your degree, likelihood of transferring, attending a private institution, and the selectivity of the institution attended. Data Analyses
This study used blocked binary logistic regression in STATA 11 to predict intent to re-enroll for the sophomore year at the same college. This statistical approach permits the researcher to analyze more effectively how a particular set of experiences influences an educational choice, while simultaneously controlling for confounding factors (Cabrera, 1994), and is the appropriate method when a dependent variable is dichotomous (Hosmer & Lameshow, 2000). In this study, the variables were blocked into 6 groups: 1) control variables, 2) residence and employment status, 3) classroom experiences/behaviors, 4) experiences/behavior outside of the classroom, 5) first-year academic achievement, and 6) retention risk at the end of the first year of college. This method of logistic regression was chosen in order to allow for a more nuanced understanding of how the experiences students have during the first-year of college effects their intent to re-enroll for the 2nd year of college. Odds ratios were calculated to provide a sense of the practical significance of each variable in the logistic regression. This approach calculates the percentage increase or decrease in the chance of intending to re-enroll based on each unit increase in an independent variable. Results
Results for the final logistic regression model are included in Table 1, and a summary of the odds ratios at each regression step is provided as Appendix B. The final model shows the various control and study variables that significantly predict intent to re-enroll after all of the blocks of variables were in the logistic regression. Of the control variables only gender, likelihood of needing extra time to complete degree, likelihood of transferring, attending a private institution and institutional selectivity were significant. Of these being female, likelihood of transfer, and attending a private institution were negatively associated with the outcome, whereas the likelihood that you will need extra time to complete your degree and institutional selectivity were positively associated with the outcome. In terms of interpreting the odds ratios, for a binary independent variable such as gender the interpretation would be that female students are 22.2% less likely to intend to return to their campus for a second year than male students, controlling all other variables. For a quasi-interval variable such as chance that students will need extra time to complete their degree the interpretation would be that for each unit increase in anticipation of needing extra time to degree the odds that a student will return to campus for their second year increases 17.4%. Results related to gender will be explored further as results related to experiences/behaviors outside of the classroom are discussed.
Residence and Employment Status
Contrary to the popular notion, which has been supported in past research (Christie & Dinham, 1991; Pike, Schroeder & Berry, 1997), this study finds that students who live on campus are less likely rather than more likely to be retained. Specifically, as compared to students who live in first-year or special interest housing, students who live-off campus during their first year of college are actually more not less likely to intend to return to campus for year two. Additionally, students who live in first-year/special interest housing as freshman are just as likely to be retained as those that live in regular campus residential housing during their first year of college. This seemingly indicates that in terms of retention to year two there is no additional benefit of living in first-year/special interest housing as compared to other on-campus housing.
In order to explore the effect of living off-campus on intent to re-enroll further an additional regression was run with same independent variables and regular campus housing as the reference group. This additional regression supported findings of off-campus housing in comparison to first-year/special interest housing, specifically that students who live off-campus during their first year are more likely to
330
Proceedings of the 5th Annual National Symposium on Student Retention. Copyright 2009. C-IDEA, The University of Oklahoma.
intend to return for their second year than those who live on-campus. A suppressor effect is also evident for off-campus housing (see Appendix B Model 3). Once the positive effect of interactions outside of the classroom are controlled, the positive effect of living off-campus on retention gets stronger. This is evidence that students who live on-campus are more likely to engage outside of the classroom which is positively connected to retention, but once you take that interaction into account the “true” effect of living off-campus in this case as compared to living in first year/special interest housing is evident. In the final model students who live off-campus have a 93.6% higher likelihood of intending to return for their second year of college than those who live in first-year/special interest housing. Lastly, and not surprisingly, students who work full-time in their first year of college are less likely to be retained.
Table 1. Final Logistic Regression Model Predicting Intent to Return to Campus for College Year Two Odds Ratios Std. Error 95% Confidence Interval Control Variables Background Gender: Female .778* .078 .639 .947 First-Generation Status: Yes .788 .102 .611 1.015 Parental Income .964 .019 .928 1.001 SAT Comp Score 1.000 .000 .999 1.002 Retention Risk Entering Freshman Financial Concern (Ref Gr: None) Some 1.082 .133 .851 1.378 Major .990 .212 .951 1.506 Likely Need Extra Time for Degree 1.174* .087 1.015 1.358 Likely Transfer to Different Inst .524*** .030 .468 .587 Institution Attended Institutional Type: Private .742** .065 .625 .882 Institutional Selectivity 1.000*** .000 1.001 1.003 Study Variables Residence and Employment Status 1st Year Place of Residence (Ref Gr: 1st Year/Special Interest) Regular Student Housing .978 .108 .789 1.214 Off Campus Housing 1.936** .406 1.283 2.921 Worked Full Time 1st Year .693* .115 .501 .959 Classroom Experiences Ease of Academic Adjustment .987* .007 .974 1.000 Habits of Mind for Student Success .987 .007 .973 1.001 Academic Disengagement .987 .006 .975 1.000 Service Learning (Ref Gr: Not at All) Occasionally 1.076 .114 .875 1.324 Frequently 1.394 .299 .916 2.123 Learning Community: Yes .890 .111 .698 1.136 First Year Success Seminar: Yes .980 .094 .813 1.183 Experiences Outside of Classroom Discuss Course Content w/Students (Ref Gr: Not at All) Occasionally 1.996*** .354 1.409 2.826 Frequently 2.321*** .443 1.597 3.374
331
Proceedings of the 5th Annual National Symposium on Student Retention. Copyright 2009. C-IDEA, The University of Oklahoma.
Studied with Other Students (Ref Gr: Not at All) Occasionally 1.193 .188 .876 1.624 Frequently 1.529* .270 1.082 2.161 Worked on Professor’s Research Proj (Ref Gr: Not at All) Occasionally .763* .086 .613 .951 Frequently 1.057 .218 .705 1.583 Had w/Other Racial/Ethnic Groups: Meaningful Discussions about Race 1.097 .055 .995 1.210 Meaningful Intellectual Discussions 1.113* .056 1.009 1.223 Student-Faculty Interaction 1.029*** .007 1.016 1.044 First Year Academic Achievement College GPA 1.166** .061 1.053 1.292 Retention Risk End of First Year Financial Concern (Ref Gr: None) Some 1.077 .135 .842 1.377 Major .609** .104 .435 .852 BIC 413338.4AIC 413070.9 N=24,443. Data has been weighted to represent the national sample of first-time, full-time freshmen who retained through year one. * = p < .05, ** = p < .01, *** = p < .001
Classroom Experiences/Behaviors
None of the first-year classroom experiences significantly affect intent to return for a second year, meaning that participating in service learning, learning communities, and first-year seminars is not significantly associated with retention. For some this finding may seem alarming given the attention these curricular initiatives have been given in undergraduate education reform, but these results are consistent with other research completed on the first-year experience (DeAngelo & Hurtado, 2009). This is not to say that participation in these types of curricula in the first-year does not have a positive effect, but as suggested in DeAngelo & Hurtado (2009) the effect is likely indirect and delivered through how participation in these courses influences interaction outside of the classroom. Indeed, significance tests run at the end of each block of the regression indicated that this block of variables significantly contributed to intent to re-enroll, even though only one variable in the block significantly predicted the outcome. The variable that significantly contributes to retention in this block is the ease with which students adjust to the academic experience of college and the association in negative. This means that as student’s perception of the ease with which they adjusted to college increases the chances that they will return for a second year actually decreases. The decrease is slight, just 1.3% for each unit increase in the variable, but this is a continuous variable and this amount becomes practically important pretty quickly as unit increases or decreases in the variable are added together.
Experiences/Behaviors Outside of the Classroom
In terms of intent to return to college for the second year, student experiences and behaviors outside of the classroom are key to understanding how what students experience in the first year of college affects whom will be back on campus for year two. Significance tests run along with the regression showed that by far and away this block of variables was the most important in terms of
332
Proceedings of the 5th Annual National Symposium on Student Retention. Copyright 2009. C-IDEA, The University of Oklahoma.
understanding under what circumstances students are likely to be retained. This block of variables is also important to understanding why women are less likely to return to campus for a second year then men.
This study finds that student-faculty interaction, having meaningful intellectual discussions outside of class with student of races/ethnicities other than your own, studying with other students frequently as compared to not at all, and discussing course content outside of class with other students frequently as compared to not at all, and occasionally as compared to not at all are significantly and positively related to intent to re-enroll. Of these experiences, discussing course content with other students outside of class is the most important to retention, and in fact this experience is the strongest predictor in the model of who will return to campus for year two. Students who discuss course content with other students outside of class occasionally as compared to not at all are 99.6% more likely to intend to return, and at the frequent level as compared to not at all the percentage is 132.1% more likely. This means that encouraging this type of activity and facilitating this type of interaction is the single most important activity that colleges should consider in retention efforts aimed at the first year.
Understanding how discussing course content with other students outside of class affects women and men differently is also important to understanding why women are significantly less likely than men to intend to come back to campus for year two. In order to explore why being female becomes significant in Model 4 (see Appendix B), a suppressor effect, a conditional marginal effects procedure was preformed. During this procedure all of the quasi-interval and continuous variables in the model were held constant at their mean values and the categorical variables were set to the reference group value (not at all or no). This allowed for the focus to be solely on gender and discussing course content outside of class. Results for this procedure show that in terms of retention to year two men benefit more from discussing course content outside of class than women. As shown in Table 2 at the not at all category the probability that a women will return for year two is higher than for men, but at the occasional and frequently category the probability that a man will return for year two is actually higher than it is for a woman. This indicates that although the probability of return is higher at frequently for both men and women, meaning that this activity is a positive for both groups, in terms of retention men get an extra boost from discussing course content outside of class that women do not get. This pattern of extra benefits is evidenced not only in the change from women to men having a higher probability of returning, but also by examining how the difference in probability of returning for year two decreases between men and women between the not at all category to the occasional category and then again to the frequently category.
Table 2. Marginal Effects Model Testing Effects of Gender and Discussing Course Content Outside of Class on Intent to Return in College Year Two
Discussing course content outside of class Gender Margin Std. Error Not at all Male .901*** .028 Female .918*** .025 Occasionally Male .962*** .010 Female .946*** .012 Frequently Male .962*** .009 Female .957*** .010 *** = p < .001
333
Proceedings of the 5th Annual National Symposium on Student Retention. Copyright 2009. C-IDEA, The University of Oklahoma.
The only experience in this block that is negatively associated with intent to re-enroll is working on a research project with a professor occasionally. Students who engage in this academic activity are 23.7% less likely to intend to return for year two than students who have never worked with a professor on a research project. Further, there is not a significant difference in terms of retention between those who never worked on a professor’s research project and those who worked on these projects frequently. Certainly these results are curious and counterintuitive and further research will need to be completed to better understand how engaging in research during the year one affects retention to year two.
First-Year Academic Achievement
As expected, as academic achievement in the first year of college increases students are more likely to intend to re-enroll for year two. Specifically, after controlling for all other variables in the model, at each unit increase in college GPA students are 16.6% more likely to expect to return to campus for their second year. This means, for instance, that students who report that they have a B average during their first year of college are 16.6% more likely to intend to return for year two than students who earn at B-/C+, and that students who report earn and A-/B+ average and 33.2% more likely to return as compared to those earning a B-/C+.
Retention Risk at the End of the First Year
In this study retention risk at the end of the first year is measured by students’ response to a question regarding their concerns about their ability to have enough funds to finance the rest of their college education. There is not a significant difference in retention between students who have some concerns about finances as compared to no concerns, but students who have major concerns (think they may not have enough funds) are significantly less likely than those with no financial concerns to plan to return for year two. In fact, the odds that a student with major financial considerations as compared to none plans to return to campus for year two is 39.1% less. This large decrease in the odds of returning is despite (or controlling for) the experiences that a student has during year one. These results likely mean that some institutions need to think more strategically about how they package their financial aid in order to not only attract students to their institutions but insure that they have enough aid to return. Discussion
This study was intended to explore how the experiences students have on campus effect the likelihood that they will return to campus for their sophomore year. The study focused on exploring how the experiences students have inside and outside of the classroom during their first year affect retention, with particular attention paid to the effects of first-year curricular reform efforts that have occurred within the last three decades. This study used a dataset that was weighted to represent the national population of students who are retained through the end of year one, meaning that they were enrolled in courses during their entire freshman year of college. Among the findings are that the academic experiences students have outside of the classroom have the largest effect on the odds that a student will return for their sophomore year, and that colleges interested in retaining more of their first-year students would be well served if they focused their attention on creating situations for students to interact with one another and discuss course content outside of class.
As was found in past studies of retention, once the experiences students have in college are controlled the effects of student background characteristics on retention are mitigated. This is good news for colleges, meaning that the college experiences, something colleges have some control over, is much more important to who returns for year two, than factors and characteristics that students bring with them to college. Though this is the case generally, gender is the one of the areas that campuses still need to consider in their retention efforts. Specifically, this study found that although both men and women benefit from discussing course content with other students outside of class, men get an extra boost from this type of interaction and this extra boost seems to create a situation in which men are more likely to be retained than women. Given this, colleges need to further consider how to retain both their female and
334
Proceedings of the 5th Annual National Symposium on Student Retention. Copyright 2009. C-IDEA, The University of Oklahoma.
male students. In addition, further research needs to be done to explore what is behind the extra benefit men derive from discussing course content with students outside of class and what campuses can do to increase the retention of their female students.
This study found no effects for participation in service learning, learning communities, and first-year student success seminars. As suggested by Alexander & Gardner (2009) these results may stem from the fact that these programs still operate on the margins at most campuses, and thus the effects are likely muted. An alternative hypothesis is that the effects of this type of curricula may be indirect and delivered through how they influence the interaction that students have outside of the classroom. Certainly further research is needed to explore the effect of these first-year curricular efforts on retention.
335
Proceedings of the 5th Annual National Symposium on Student Retention. Copyright 2009. C-IDEA, The University of Oklahoma.
References AAC&U. (2007). College level learning for the new global century: A report from the National
Leadership Council for Liberal Education and America’s Promise. Washington, DC: Association of American Colleges and Universities.
ACT. (2002). Updated return/graduation rate data for 2001. Retrieved 3/1/02 from World Wide Web at
http://www.act.org/news. Alexander, J. S., & Gardner, J. N. (2009, May-June). Beyond retention: A comprehensive approach to the
first college year. About Campus, 14(2), 18-26. Babbie, E. (2001). The Practice of Social Research. Belmont, CA: Wadsworth. Barefoot, B. O., Gardner, J. N., Cutright, M., Morris, L. V., Schroeder, C. C., Schwartz, S. W., Siegel, M.
J., & Swing, R. L. (2005). Achieving and sustaining institutional excellent for the first year of college. San Francisco: Jossey-Bass.
Bean, J. P. (1980). Dropouts and turnover: The synthesis and test of a causal model of student attrition.
Research in Higher Education, 12, 155-187. Bean, J. P. (1982). Student attrition, intentions, and confidence: Interaction effects in a path model.
Research in Higher Education, 17, 291-320. Bean, J. P. (1983). The application of a model of turnover in work organizations to the student attrition
process. The Review of Higher Education, 6, 1290148. Berger, J. B., & Braxton, J. M. (1998). Revisiting Tinto’s internationalist theory of student departure
through theory elaboration: Examining the role of organizational attributed in the persistence process. Research in Higher Education, 39, 103-119.
Braxton, J. M., Vesper, N., & Hossler, D. (1995). Expectations for college and student persistence.
Research in Higher Education, 36, 595-612. Cabrera, A. F. (1994). Logistic regression analysis in higher education: An applied perspective. In J. C.
Smart (Ed.), Higher Education: Handbook of theory and research (Vol. 10, pp. 3225-256). New York: Agathon.
Cabrera, A. F., Stampen, J. O., & Hansen, W. L. (1990). Exploring the effects of ability to pay on
persistence in college. The Review of Higher Education, 13, 303-336. Cabrera, A. F., Nora, A., Terenzini, P. T., Pascarella, E. T., Hagedorn, L. S. (1999). Campus racial
climate and the adjustment of students to college: A comparison between White students and African-American students. Journal of Higher Education, 70, 134-160.
Christie, N. G., & Dinham, S. M. (1991) Institutional and external influences on social integration in the
freshman year. Journal of Higher Education, 62, 412-436. DeAngelo, L. & Hurtado, S. (2009, June). Fostering “habits of mind” for student learning in the first-
year of college: Results from a national study. Paper presented at the Annual Meeting of the Association for Institutional Research, Atlanta: GA.
336
Proceedings of the 5th Annual National Symposium on Student Retention. Copyright 2009. C-IDEA, The University of Oklahoma.
Dey, E. L. (1997). Working with low survey response rates: The efficacy of weighting adjustments.
Research in Higher Education, 38, 215–227. Gilmartin, S. K., & Sax, L. J. (2002, June). What leads to dropping out after the first college year?:
Findings from the 2001 CIRP-YFCY national study of retention. Paper presented at the annual meeting of the Association for Institutional Research, Toronto: CN.
Hosmer, D. W., & Lemeshow, S. (2000). Applied logistic regression. (2nd Ed.). New York: John Wiley &
Sons. Hu, S., & St. John, E. P. (2001). Student persistence in a public higher education system. Journal of
Higher Education, 72, 265-286. McLahlan, G. J. & Krishnan, T. (1997). The EM algorithm and extensions. New York: Wiley. Kuh, G. D. (2008). High-impact educational practices: What are they, who has access to them, and why
they matter. Washington, DC: Association of American Colleges and Universities. Pascarella, E. T., & Terenzini, P. T. (1977). Patterns of student-faculty informal interaction beyond the
classroom and voluntary freshman attrition. Journal of Higher Education, 48, 540-552. Pascarella, E. T., & Terenzini, P. T. (1979). Interaction effects in Spady and Tinto’s conceptual models of
college attrition. Sociology of Education, 52, 197-210. Pascarella, E. T., & Terenzini, P. T. (1980). Predicting freshman persistence and voluntary dropout
decisions from a theoretical model. Journal of Higher Education, 51, 60-75. Peterson, S. L. (1993). Career decision-making self-efficacy and institutional integration of underprepared
college students. Research in Higher Education, 34, 659-685. Pike, G. R., Schroeder, C. C., & Berry, T. R. (1997). Enhancing the educational impact of residence halls:
The relationship between residential learning communities and the first-year college experience and persistence. Journal of College Student Development, 38, 659-685.
Samejima, F. (1969). Estimation of latent ability using a response pattern of graded scores.
Psychometrika Monograph Supplement, No. 17. St. John, E. P., Hu, S., & Weber, J. (2001). State policy and the affordability of public higher education:
The influence of state grants on persistence in Indiana. Research in Higher Education, 42, 401-428.
St. John, E. P., Kirshstein, R. J., & Noell, J. (1991). The effects of student financial aid on persistence: A
sequential analysis. The Review of Higher Education, 14, 383-406. Terenzini, P. T., & Pascarella, E. T. (1984). Freshman attrition and the residential context. The Review of
Higher Education, 71, 591-615. Thissen, D. Chen W.H., & Bock, D. (2002). MULTILOG, 7. Chicago: Scientific Software Incorporated.
337
Proceedings of the 5th Annual National Symposium on Student Retention. Copyright 2009. C-IDEA, The University of Oklahoma.
Tinto, V. (1975). Dropout from higher education: A theoretical synthesis of recent research. Review of Educational Research, 45, 89-125.
Tinto, V. (1987). Leaving college: Rethinking the causes and cures of student attrition (1st Ed.). Chicago:
The University of Chicago Press. Tinto, V. (1993). Leaving college: Rethinking the causes and cures of student attrition (2nd ed.). Chicago:
The University of Chicago Press. Tinto, V. (1996). Reconstructing the first year of college. Planning for Higher Education, 25, 1-6. Tinto, V. (1997). Classrooms as communities: Exploring the educational character of student persistence.
Journal of Higher Education, 68, 599-623. Upcraft, M. L., Gardner, J. N., Barefoot, B. O. (Eds) (2004). Challenging and supporting the first-year
student: A handbook for improving the first year of college. San Francisco: Jossey-Bass.
338
Proceedings of the 5th Annual National Symposium on Student Retention. Copyright 2009. C-IDEA, The University of Oklahoma.
Appendix Appendix A. Description of Variables and Measures Variables Scale Dependent Variables Intent to Re-Enroll at Current Institution 0 = no, 1 = yes Independent Variables Control Variables Student Background Characteristics Gender: Female 1 = no, 2 = yes First-Generation Student: Yes 1 = no, 2 = yes SAT Comprehensive Score Continuous Retention Risk as Entering Freshman Concern with Financing College (Reference Group: None) Some 1 = no, 2 = yes Major 1 = no, 2 = yes Likely Need Extra Time to Degree 1 = no, 2 = yes Likely Transfer to Different Institution 1 = no, 2 = yes Institution Attended Institution Type: Private 1 = no, 2 = yes Institutional Selectivity Continuous Study Variables Classroom Experiences Ease of Academic Adjustment Continuous – A construct measure that includes four
variables assessing success at what your professors expect of you academically, developing effective study skills, adjusting to the academic demands of college, and managing time effectively. Each of the variables are on a three-point scale: 1 = unsuccessful to 3 = completely successful.
“Habits of Mind” for Student Success Continuous – A construct measure that includes eleven variables assessing the frequency of asking questions in class, supporting opinions with a logical argument, seeking solutions to problems and explaining them to others, revising papers to improve writing, evaluating the quality and reliability of information, taking a risk because you have more to gain, seeking alternative solutions to a problem, looking up scientific research articles and resources, exploring topics on your own, even though it was not required for class, accepting mistakes as part of the learning process, and seeking feedback on your academic work. Each of the variables are on a three-point scale: 1 = not at all to 3 = frequently.
Academic Disengagement Continuous – A construct measure that includes five variables assessing the frequency of coming late to class, falling asleep in class, turning in course assignments late, turning in course assignments that did not reflect best work, and skipping class. Each of the variables are on a
339
Proceedings of the 5th Annual National Symposium on Student Retention. Copyright 2009. C-IDEA, The University of Oklahoma.
three-point scale: 1 = not at all to 3 = frequently. Community Service as Part of Class (Reference Group: Not at All) Occasionally 1 = no, 2 = yes Frequently 1 = no, 2 = yes Learning Community/Linked Courses 1 = no, 2 = yes First Year Seminar: College Adjustment 1 = no, 2 = yes Experiences Outside of the Classroom Discussed Course Content with Students (Reference Group: Not at All) Occasionally 1 = no, 2 = yes Frequently 1 = no, 2 = yes Studies with Other Students (Reference Group: Not at All) Occasionally 1 = no, 2 = yes Frequently 1 = no, 2 = yes Worked on Professor’s Research Project (Reference Group: Not at All) Occasionally 1 = no, 2 = yes Frequently 1 = no, 2 = yes Had Meaningful and Honest Discussions about Race/Ethnic Relations Outside of Class with students from a Racial/Ethnic Group Other than Your Own
1 = never to 5 = very often
Had Intellectual Discussions Outside of Class with students from a Racial/Ethnic Group Other than Your Own
1 = never to 5 = very often
Student-Faculty Interaction Continuous – A construct measure that includes six variables assessing if you have meet with faculty during office hours or communicated regularly with faculty. Both measured on a two-point scale: 1 = no, 2 = yes. If you have received advice or educational guidance about your educational program from professors and asked professors for advice after class. Both measured on a three-point scale: 1= not at all to 3 = frequently, the amount of contact you have had with faculty outside of office hours. Measured 1 = never to 6 = daily, and satisfaction with the amount of contact with faculty. Measured 1 = can’t rate/no experience to 6 = very satisfied.
First-Year Academic Achievement College GPA 1 = C – or less (below 1.75) to 6 = A (3.75 to 4.0) Retention Risk at End of First-Year Concern with Financing College (Reference Group: None) Some 1 = no, 2 = yes Major 1 = no, 2 = yes
340
Proceedings of the 5th Annual National Symposium on Student Retention. Copyright 2009. C-IDEA, The University of Oklahoma.
Appendix B. Summary of Odd-Ratios for Each Regression Model Model 1 Model 2 Model 3 Model 4 Model 5 Model 6 Control Variables Background Gender: Female .857 .866 .835 .787* .758** .778* First-Generation Status: Yes .805 .780 .778 .800 .791 .788 Parental Income .964* .968 .967 .971 .970 .964 SAT Comp Score 1.00*** 1.00*** 1.00*** 1.00*** 1.000 1.000 Retention Risk Entering Freshman Financial Concern (Ref Gr: None) Some 1.034 1.037 1.053 1.043 1.027 1.082 Major .716 .731 .742 .740 .730 .990 Likely Need Extra Time for Degree 1.184* 1.182* 1.194* 1.175* 1.177* 1.174* Likely Transfer to Different Inst .531*** .525*** .529*** .528*** .521*** .524*** Institution Attended Institutional Type: Private .802** .835* .803* .732*** .734*** .742** Institutional Selectivity 1.00*** 1.00*** 1.002*** 1.00*** 1.00*** 1.000*** Study Variables Residence and Employment Status 1st Year Place of Residence (Ref Gr: 1st Year/Special Interest) Regular Student Housing .926 .983 .987 .990 .978 Off Campus Housing 1.702** 1.708** 1.989** 1.966** 1.936** Worked Full Time 1st Year .664* .647** .650** .655* .693* Classroom Experiences Ease of Academic Adjustment .997 .995 .989 .987* Habits of Mind for Student Success 1.015* .988 .987 .987 Academic Disengagement .983* .981** .986* .987 Service Learning (Ref Gr: Not at All) Occasionally 1.194 1.109 1.082 1.076 Frequently 1.693* 1.137 1.385 1.394 Learning Community: Yes .973 .904 .886 .890 First Year Success Seminar: Yes 1.045 .983 .979 .980
341
Proceedings of the 5th Annual National Symposium on Student Retention. Copyright 2009. C-IDEA, The University of Oklahoma.
Experiences Outside of Classroom Discuss Course Content w/Students (Ref Gr: Not at All) Occasionally 2.030*** 2.003*** 1.996*** Frequently 2.377*** 2.323*** 2.321*** Studied with Other Students (Ref Gr: Not at All) Occasionally 1.182 1.989 1.193 Frequently 1.510* 1.542* 1.529* Worked on Professor’s Research Proj (Ref Gr: Not at All) Occasionally .748* .763* .763* Frequently 1.106 1.075 1.057 Had w/Other Racial/Ethnic Groups: Meaningful Discussions about Race 1.090 1.090 1.097 Meaningful Intellectual Discussions 1.100 1.108* 1.113* Student-Faculty Interaction 1.031*** 1.029*** 1.029*** First Year Academic Achievement College GPA 1.174** 1.166** Retention Risk End of First Year Financial Concern (Ref Gr: None) Some 1.077 Major .609** BIC 432874.8 430197.7 427310.0 416912.6 415201.5 413338.4 AIC 432782.7 430084.2 427139.8 416669.5 415452.7 413070.9 N=24,443.Data has been weighted to represent the national sample of first-time, full-time freshman who are retained through year one. * = p < .05, ** = p < .01, *** = p < .001
342
Proceedings of the 5th Annual National Symposium on Student Retention. Copyright 2009. C-IDEA, The University of Oklahoma.
The Academic Intervention and Mentoring Model: A Comprehensive Academic Initiative for
Abstract: Utilizing a multi-pronged approach, the Academic Intervention and Mentoring (AIM) program tackles retention challenges for at risk, first-year students. The model targets difficult course content, underdeveloped study skills, and other factors that often put first-year students at risk. Supplemental Instruction is offered in historically challenging first year courses – those with a high D, F, W (withdrawal) rate or sequential courses like mathematics or computer programming – in order to improve study habits, peer learning relationships, and academic performance. Similarly, the AIM program provides drop-in peer tutoring for challenging content courses such as mathematics and physics. This service is provided directly in the residence halls, where most first year students live. Finally, the AIM program offers additional support for at-risk students, those with a D, F or W grade in their first year of college, by offering them a learning assistant who works with them individually to design an action plan to assist with the coordination of campus support services through a case management model. The AIM program has completed a two-year pilot with great success, including positive persistence and academic performance indicators.
Introduction
Based on consistent and compelling evidence that first year students with low performance indicators – specifically D or F grades and/or course withdrawals (W) – were at a greater risk for attrition, the leadership of Rochester Institute of Technology (RIT) designed a new initiative to address these risk factors. The Academic Intervention and Mentoring (AIM) program has three major components which are designed to address varying aspects of academic challenge. The three major components include Supplemental Instruction (SI) for historically challenging courses, content area tutoring in mathematics and physics, and individualized academic support via a learning assistant role. Together these elements address concerns stemming from poor study and learning skills, deficits in content area mastery, and challenging course material and delivery while supporting the student’s overall growth. Additionally, this initiative benefitted from actively engaged senior leadership and an organizational model that intentionally spanned both the academic and student affairs’ divisions. Outcome data from the two-year pilot indicate the initial success of each of these components based upon usage/participants rates, and indicators of persistence and academic performance.
Background
From the inception, the AIM program sought to offer seamless academic and developmental support in an engaging and multi-layered approach. Initial planning focused on a program that would provide students with traditional academic support, peer interactions, and the assistance of a professional learning assistant to support student growth and development. The AIM program, co-sponsored and co-led by academic
343
Proceedings of the 5th Annual National Symposium on Student Retention. Copyright 2009. C-IDEA, The University of Oklahoma.
affairs and student affairs, sought to intentionally support first year learning in order to reduce D, F, and W grades in the first year and increase graduation rates.
The authors were charged to develop this program based on their divisional affiliations, one in student affairs, the other in academic affairs, and their experiences with academic, transitional, and assessment programs. The authors hold a breadth of practical experience and knowledge of research in academic support services, learning assistance techniques, First Year Enrichment (FYE), learning communities, SI, developmental academic advising, and assessment. In order to develop a program that would be beneficial to students, as well as embraced and valued by the institution, the authors consulted existing literature and best practice, with a focus on collaboration and excellence. The following section will share salient and meaningful research that serves as the underpinnings of the program.
Student engagement in college is widely accepted as integral to academic success and persistence (Pascarella & Terenzini 2005, Kuh 2007). However, it is not uncommon for first year students to experience individual courses as separate entities with no relevance to other courses; students may also find themselves disconnected from a consistent group of peers (Tinto, 1999). Astin’s (1999) involvement theory includes the belief that “the amount of student learning and personal development associated with any educational program is directly proportional to the quality and quantity of student involvement in that program” (p.519) . Some first year initiatives, such as FYE and learning communities, have been implemented to help build connections inside and out of the classroom. Through discussion and thoughtfully planned curricula, these initiatives may help students find meaning and relevance in their own college education. Research indicates that students are more likely to graduate from institutions that that provide academic, social, and personal support to their students (Tinto, 1999). The AIM program recognizes that in order to assist students, we need to foster student engagement and involvement on multiple levels—from encouraging communication and interaction with faculty to providing students the opportunity to talk with their peers in a student-run discussion about their coursework.
Learning Reconsidered (2004) posits the whole campus as a learning community, and an argument is made for an integrated definition of student learning to incorporate both academic learning and student development into the educational experience (ACPA & NASPA, 2004). As the AIM program evolved, this concept was imbedded in communication, materials, and training agendas.
The Center for Postsecondary Research at Indiana University’s DEEP (Developing Effective Educational Practice) project identified effective educational practices at strong performing colleges and universities. These schools, known as DEEP institutions, recognize that partnerships between student affairs and academic affairs benefit students by creating strong and supportive--rather than isolated and competitive--learning environments that benefit students (Kuh, Kinzie, Schuh, Whitt & Associates, 2005). These institutions model excellence through academic rigor, collaborative learning relationships and innovative practices.
The Policy Center on the First Year of College established criteria for institutional excellence for the first year of college, and, through a detailed selection process, identified thirteen exemplary colleges and universities that have committed to institutionally relevant approaches to the first year experience (Barefoot, et.al, 2005). In addition to some of the more common first year initiatives at institutions of excellence such as first year seminars, learning communities, orientation, and core curriculum, Supplemental Instruction was also included as an initiative that contributes to excellence in the first year (Barefoot, et.al., 2005).
Supplemental Instruction is a well established model of academic assistance. It allows students another layer of interaction and academic integration while providing important transitional and academic
344
Proceedings of the 5th Annual National Symposium on Student Retention. Copyright 2009. C-IDEA, The University of Oklahoma.
support. SI leaders may introduce learning and study strategies in SI sessions, including how to take good notes, cooperating in group assignments, test review, navigating a course syllabus, and using a text as a study tool (Martin, Arendale, & Associates, 1993). The University of Missouri-Kansas City (2007) provides Supplemental Instruction’s goals: “improve student learning; reduce rates of attrition within targeted historically difficult courses; increase graduation rates” (slide 2). In sharing 2003-2006 national data, The University of Missouri-Kansas City reported that students who use SI earn higher final course grades and withdraw from courses less frequently than students who do not attend SI; data also indicate “higher reenrollment and graduation rates” for students who use SI (slide 5). The correlation between SI use and decreased D, F, and W grades, as well as the correlation between SI use and higher incidence of reenrollment and graduation, provided evidence for incorporating SI in the AIM program design. An additional compelling reason to utilize SI was demonstrate by the opportunity to increase student engagement and involvement through modeling and support provided by SI leaders. Adelman (2006) articulated three important benchmarks to inform advising and intervention: a minimum of twenty credits earned by the end of the first calendar year of enrollment, the quality of persistence in the second year and beyond, and the use of summer term to increase the likelihood of graduation rates. The AIM program attempted to intervene by setting up a program to help reduce D, F, and W grades, strengthen study skills and learning behaviors for success throughout college, and reward successful students with a summer tuition waiver.
Model
The AIM model was developed to specifically target the first year student population in order to eliminate or greatly reduce D, F, and W grades. Recent institutional data revealed that students with D, F, or W in their first year had two year attrition rates of 28.8% compared to only 8.2% for those students with stronger academic standing. By reducing failing grades and withdrawals early in a student’s academic career there is a opportunity to avoid a low grade point average which can be difficult to overcome later, reduce the need to repeat courses which could artificially extend time to graduation, and increase self-efficacy. Specifically, the parameters and goals for the AIM program were to:
Reduce the D, F and withdrawal grades in historically difficult or sequential first-year courses Provide individual interventions and support for first year students with D, F course grades Increase the availability of tutoring for first year students by expanding services in evenings
and residence hall locations
In both years of the two-year pilot, the SI, learning assistance and tutoring components were available and followed the same basic protocols. In year one, however, the entire AIM program was incentive-driven which influenced certain program decisions and protocols. Free summer tuition was made available to those students who completed all of the AIM requirements such as attending SI for appropriate courses, meeting with an AIM Learning assistant or attending study skills workshops. Given the nature of the incentive plan, it was necessary to have contracts with students and to strictly monitor participation. The staff working with the AIM program felt strongly that the restrictiveness required to maintain the incentive-based model was problematic and should be eliminated in year two. In the second year, all program elements were the same except for the incentive model. There was no tuition waiver option for the year two cohort. Participants in year two were able to take advantage of SI, learning assistance and tutoring and the problem closely tracks activity and outcome data, but the contracts and strict requirements were removed.
Supplemental Instruction The Supplemental Instruction design at RIT was based on the national model created at the University of Missouri-Kansas City’s International Center for Supplemental Instruction. SI was placed in primarily
345
Proceedings of the 5th Annual National Symposium on Student Retention. Copyright 2009. C-IDEA, The University of Oklahoma.
first-year courses with a history of high D, F, or W rates. All courses and sections selected to include SI were reviewed and approved by the academic departments as well as the AIM staff. Under this initiative, SI leaders were undergraduate students who had previously demonstrated a high level of performance in the related course. Faculty reviewed and approved all applicants who were hired. On a weekly basis, SI Leaders attended class to observe and identify barriers to the students’ learning, held two one- hour study sessions, and attended weekly SI leader training session. SI study sessions were facilitated by SI leaders to help students process and consolidate course content and learn how to adapt study skills for the course. Evaluation of SI included regular assessment of:
SI session attendance Grades of students in SI supported sections Persistence of students in SI supported sections Feedback from SI Leaders via clipboard survey Evaluation of SI experience from faculty members in supported courses End of quarter survey to students in supported course regarding their experience with SI SI Supervisor’s evaluation of SI Leaders
Learning Assistance
Learning assistance at RIT was based on a case management and intrusive intervention framework. The goal for this component of the AIM program was to intentionally target first year students with D, F or W grades with an overall GPA of no less than 2.0. Program staff have come to refer to this group as those who “have stumbled, but not fallen”. RIT had other initiatives in place for the highest risk group of students (below a 2.0) that are more intensive in scope and commitment. AIM was designed to address those students with at-risk indicators but who were not yet on a clear path to suspension. This component supported students in making meaningful connections with resources, information, and their own learning.
Students who received a D, F, or W grade in the previous quarter were invited (email and hard copy invitation) to participate. Specifically, the process began with a formal intake meeting which allowed the learning assistant to understand the student’s complete background and the factors that may have contributed to their academic difficulty. Additionally, the learning assistant completed a mid-quarter and final report to ensure that students received ongoing feedback and communication about their progress, course grade status and clear, concise recommendations for improvement. This information was provided in a narrative report to each student, was shared with students’ academic advisors, and, when appropriate, disseminated to other professionals with whom the student had worked.
Tutoring
In order to supplement existing math, physics and study skill support offered by the Academic Support Center at RIT, the AIM program allocated resources to offer the services in new locations and during evening hours. Traditional peer-lead math and physics tutoring was offered Monday through Thursday evenings in the main residential area of campus where most first year students live. In addition, professional staff offered evening study skills workshops on note-taking, test taking, time management and other topics.
Outcomes
Considerable and broad reaching assessment was conducted from the beginning of this initiative and provides evidence of success and a rationale for continuing the efforts. Although many formative assessments such as satisfaction surveys or mid-quarter reviews were implemented, the primary and summative outcomes were intentionally aligned to the major program goals.
346
Proceedings of the 5th Annual National Symposium on Student Retention. Copyright 2009. C-IDEA, The University of Oklahoma.
DFW Distribution of SI vs. Non-SI Attendees* Winter Quarter 08-Winter Quarter 09
SI n=777, Non SI n=1329
20%
29%
0%
10%
20%
30%
40%
50%
SI Attendees Non-SI Attendees
* Indicates % w ithin each group who received a DF or W grade. i .e. 29% of students who did not attend SI earned a D, F or W.
% o
f stu
dent
s Goal #1 Reduce the D, F, W rates in historically difficult or sequential first-year courses. During the two year pilot, 64 course sections were supported with SI. From these sections, 777 students attended at least one SI session. Results show that SI attendees were 10-15% less likely to receive a D, F, or W in the supported course. 20% of the attendees compared to 29% of the non-attendees received a D, F or W.
In addition to the quantitative data, the following observations were drawn from the student, faculty and staff surveys, and from an analysis of the student data base for SI participants.
SI helped students at various levels of academic need. Regular participation in SI assisted in lowering the chance of receiving a D, F, or W in the
supported course. SI session attendance was positively affected by the SI leader’s ability to connect with the
students and by their relationship with the faculty member. Faculty and department buy-in to the program was imperative to the success of the SI in the
supported course. Students struggling with a large amount of course content benefitted from SI, but also needed
more intensive tutoring.
347
Proceedings of the 5th Annual National Symposium on Student Retention. Copyright 2009. C-IDEA, The University of Oklahoma.
Goal #2 Provide individual interventions for first-year students with D, F, & W grades. During the two year pilot, 171 students participated. The term GPA for participants rose from an average of 2.22 in the quarter prior to participation to a 2.35 for the term of participation.
Through qualitative assessment and observations, it was found that Learning Assistance participants could be broken up into three groups:
High risk (2.3 GPA and below): needed more intensive intervention Medium risk (2.3-3.0 GPA): were the best fit for program Low risk (3.0 + GPA): did not need services as frequently
Goal #3 Increase the availability of tutoring for first-year students by expanding services in evenings and residence hall locations.
Between winter 2008 and winter 2009, 2445 students took advantage of the tutoring options in math, physics and study skills. High attendance supported the assumption that there was a need for math and physics tutoring on the residential side of campus. With a lack of accessible and group-friendly study spaces in the residence halls, an alternate location for students to study outside of their rooms has proven to be effective. It is important to note that even with the addition of tutoring services in the evenings and in the residence halls, the main Math Lab did not experience a decrease in use.
Learning Assistance Student TERM GPA Winter 2008 - Winter 2009
N= 171
2.2 2.35
0
0.5
1
1.5
2
2.5
3
3.5
4
Pr evious Ter m GPA Par ticipation Ter m GPA
348
Proceedings of the 5th Annual National Symposium on Student Retention. Copyright 2009. C-IDEA, The University of Oklahoma.
Discussion
The AIM program has quickly become a well-respected model of collaborative student support at RIT. Data-sharing at the end of every term has provided faculty, staff, and students a transparent view of the program’s services and support initiatives. The clarity of information paired with the program staff’s eagerness to collaborate has strengthened the reputation of the services provided by the AIM program. Additionally, the data itself indicates that the initiatives of the AIM program support student success by reducing D, F, and W grades and fostering independent learning.
Shared administrative responsibility across academic and student affairs ensures a rewarding and dynamic program. Cross-divisional collaboration at all levels, including senior leaders, professional administrators, and student support professionals, creates a robust, carefully crafted, and meaningful student success program. However, a shared leadership model also presents challenges. Day to day administrative tasks may become challenging and time-consuming because of dual budgets, shared decision-making, and split reporting structures. A shared model of leadership requires constant communication in order to be seamless and successful. If an institution is considering the implementation of a shared model, deliberate efforts to communicate consistently and clearly must be made on a regular basis.
The model presented may be adapted by institutions interested in strengthening services for high-risk students and/or students in transition. By intentionally linking academic support and developmental support through a menu of services, initiatives such as the AIM program support students’ holistic growth, and may help students to integrate their learning inside and outside the classroom.
An additional outcome of the initiative has been the positive experiences SI offered to the SI leaders. Though the program focused primarily on the benefits of SI for the student attendees, it quickly became apparent that SI leaders also benefitted from the opportunity to connect with faculty and gain valuable leadership skills while providing an academic support role for their peers. SI leaders are often the same students who have been recognized for their academic excellence. It is a privilege to offer these students the opportunity to model strong study behaviors, facilitate peer learning, and build meaningful relationships with students and faculty on campus.
349
Proceedings of the 5th Annual National Symposium on Student Retention. Copyright 2009. C-IDEA, The University of Oklahoma.
References
Adelman, C. The toolbox revisited: Paths to degree completion from high school through college. Washington, D.C.: U.S. Department of Education, 2006. American College Personnel Association & National Association of Student Personnel Administrators.
(2004). Learning reconsidered: A campus-wide focus on the student experience. Washington, D.C.: Author.
Astin, A.W., (1999). Student involvement: A developmental theory for higher education. Journal of College Student Development, 40(5), 518-529.
Barefoot, B.O., Gardner, J.N., Cutright, M., Morris, L.V., Schroeder, C.C., Schwartz, S.W., et al. (2005).
Achieving and sustaining institutional excellence for the first year of college. San Francisco: Jossey-Bass.
Bowles, T.J., McCoy, A.C., and Bates, S. (2008). The effect of supplemental instruction on timely
graduation. College Student Journal 42(3), 853-859. DeBerard, M.S., Spielmans, G.I., Julka, D.L. (2004). Predictors of academic achievement and retention
among college freshmen: A longitudinal study. College Student Journal 38(1), 66-80. Kuh, G.D., Kinzie, J., Schuh, J.H., Whitt, E.J., & Associates (2005). Student success in college: Creating
conditions that matter. San Francisco: Jossey-Bass. Kuh, G.D. (2007, June 15). How to help students achieve. The Chronicle of Higher Education. Retrieved
March 20, 2009, from http://chronicle.com/weekly/v53/i41/41b01201.htm Martin, D.C., Arendale, D., & Associates (1992). Supplemental instruction: Improving first-year
student success in high-risk courses. Columbia, SC: National Resource Center for The Freshman Year Experience.
Ogden, P., Thompson, D., Russell, A., & Simons, C. (2003). Supplemental instruction: Short and long term impact. The Journal of Developmental Education, 26(3), 2-8.
Painter, S.L., Bailey, R., Gilbert, M., & Prior, J. (2006). New directions for supplemental instruction. New
Directions for Teaching and Learning, 106, 73-84. Pan, W., Guo, S., Alikonas, C., Bai, H., (2008). Do intervention programs assist students to succeed in
college?: A multilevel longitudinal study. College Student Journal 42(1), 90-98.
Pascarella, E.T. (2005). Cognitive impacts of the first year of college. In Feldman, R.S. (Ed.), Improving the first year of college: Research and practice. (pp 111-140). Mahwah, New Jersey: Erlbaum.
Pascarella, E.T. & Terenzini, P.T. (2nd ed.) (2005). How college affects students: A third decade of
research. San Francisco: Jossey-Bass. Strange, C.C. (2004). Constructions of student development across the generations. New Directions for
Student Services, 106, 47-57.
350
Proceedings of the 5th Annual National Symposium on Student Retention. Copyright 2009. C-IDEA, The University of Oklahoma.
Tinto, V. (1999.) Taking retention seriously: Rethinking the first year of college. NACADA Journal,
19(2), 5-9. University of Missouri-Kansas City (2007). Supplemental instruction national data: Fall 2003-fall 2006.
Retrieved April 10, 2009, from http://www.umkc.edu/cad/si/si-docs/National-Data-SI-2003-2006.pdf
Upcraft, M.L., Gardner, J.N., Barefoot, B.O., & Associates. (2005). Challenging & supporting the first-year student. San Francisco: Jossey-Bass.
351
Proceedings of the 5th Annual National Symposium on Student Retention. Copyright 2009. C-IDEA, The University of Oklahoma.
The Comprehensive Retention Review: A Step By Step Guide for Evaluating
the Overall State of Retention at Your Institution Kerri A. Sleeman
Director, Center for Orientation, Mentoring, and Academic Student Success (COMPASS)
Abstract - Retention is a key part of institutional success. It is important for the university community to understand strengths and areas for improvement. The first step in gaining this understanding is a retention review. There are many variables that exist between institutions with regard to whether their retention is considered successful: type of institution, whether standard or effective retention is the focus, the specific populations they are seeking to retain, etc. A retention review provides an opportunity to look at overall retention and also focus on specific groups that have been historically successful or challenging, and utilize that information to develop a retention plan that encourages overall retention.
According to Noel-Levitz (2005), prior to developing a retention plan, a number of steps must be taken, including a review of historical retention data, a review of retention data by program and various student characteristics, a comparison with available national retention data, a review of retention literature, and the identification of successful retention strategies already in place.
This paper will share the process of completing a retention review using current staffing and readily available data. Lessons learned from the authors’ experiences will be shared. The presentation will include time for questions and answers. Introduction
According to Webster’s (2002), retention is “retaining or being retained”. In higher education it is often defined in a rate of students who return the following year. An often studied area of concern, higher education conferences, journals, and newsletters regularly include presentations, articles, and studies on retention issues. Noel-Levitz and numerous other companies offer in-depth retention consulting as well as retention tools such as student satisfaction surveys, student profile surveys, faculty and staff training modules, institutional priority and profile surveys, and other tools targeted for specific student subsets.
In the face of the current economy there is even greater focus on retaining those students already enrolled at the university. For most institutions, it is more economical to retain a current student, than to recruit a replacement. Retention is not only a key aspect for measuring institutional success, it is also big business. There is no doubt it is important that each university understand their strengths and areas for improvement; for most, the first step in doing this is completing a retention review. Retention reviews are a critical piece in understanding and improving retention and implementing a retention plan. According to Noel-Levitz (2005), prior to developing a retention plan, a number of steps must be taken, including: a review of historical retention data, a review of retention data by program and various student characteristics, a comparison with national retention data, a review of retention literature, and the identification of successful retention strategies already in place. Tinto noted in Leaving College: Rethinking the Causes and Cures of Student Attrition (1993), a complete analysis of retention must also reference institutional climate and patterns of interaction between students, staff, and faculty.
352
Proceedings of the 5th Annual National Symposium on Student Retention. Copyright 2009. C-IDEA, The University of Oklahoma.
Background
Michigan Technological University (Michigan Tech) has studied retention initiatives and retention among some student subsets in the past while attempting to better understand and increase retention; student success initiatives (including advising, student outreach, target group programs, career services, etc.) have been the subject of eleven documented internal task forces or committees since 1991. Additionally, retention and other outcomes are studied by each college, major, individual program or initiative, specific academic and non-academic areas, and most likely many other entities. However, there is no one inclusive report or resource that identifies or compiles the bigger picture of retention and retention initiatives across the entire campus.
Kuh (2008) notes that higher education is far behind other industries in benchmarking, literature review, and using those resources to implement effective programs and activities. Additionally, few institutions share internally the information they do have or learn, especially substantive, data driven information. Additionally, individual departments or areas may hold on tightly to data specific to their needs that could benefit the direction of institutional retention as a whole.
Individual areas at an institution contribute to the lack of knowledge sharing in a number of ways. Certainly, one way is how some university departments and areas tend to “silo” themselves from each other, holding onto resources and information that they feel proprietary over. In certain situations individual areas are requesting identical information from retention coordinators or institutional analysis unbeknownst to one another. As with many aspects of collaborating across disciplines and departments in higher education, there is often room for improvement. Sharing of information can serve to save valuable resources such as time and effort when embarking upon a review. Another condition that may stunt successful collection and sharing of retention information is fear. Retention statistics provide a quantitative value by which performance can be measured. Without a clear agreement about institutional and/or departmental goals, and what success in retention means, areas may feel they will be unfairly assessed.
Responsibility for Review
Generally, members of the campus community can agree that all areas contribute in some way to the individual student experience and their subsequent satisfaction at an institution. If everyone has a role, and certainly a stake, then who is responsible for understanding why students leave? A survey of 100 institutions conducted by the Project on Academic Success (PAS) at Indiana University reported that 43% of those institutions polled had a retention coordinator with considerable authority; only 26% had authority to finance retention efforts and programming (Hoover, 2007). Ultimately, this indicates that the responsibility of efforts often fall onto areas not specifically designated to be responsible for both the gathering of information and the recommendations for improvement.
When designating a group, area, or individual responsible for a retention review, cross campus representation reinforces the importance of retention to the ongoing success of an institution and provides valuable perspective from individual units. Faculty and staff who work primarily with specific populations have more first-hand information about what supports those students’ success. Different areas also can provide specific strategies for retention such as financial aid providing insight on increased funding, or an area such as a math learning center providing ideas for support for students in traditionally challenging courses. Often, a retention review will fall onto one area or committee to complete. The Center for Orientation, Mentoring, Parents and Academic Student Success (COMPASS) and Excelling the Student Experience of Learning (ExSEL) Program partnered to implement a Michigan Tech Retention Review. Additionally, this was completed, in part, as a master’s practicum for the current COMPASS Director.
There are several committees focused on retention and student data collection at Michigan Tech, including the Student Success Committee and the Student Affairs Assessment Committee. The Student Success Committee is comprised of members from across campus including faculty, administrators, academic advisors, student affairs professional staff, and is lead by the Director of COMPASS. This
353
Proceedings of the 5th Annual National Symposium on Student Retention. Copyright 2009. C-IDEA, The University of Oklahoma.
committee meets monthly and focuses on different, specific retention issues each academic year; for instance, they have studied and provided recommendations on transfer, commuter, and first year student retention and support, academic advising issues, inter-departmental transfer concerns, and first and second year courses with high percentages of D, F, and withdrawal grades. The Student Affairs Assessment Committee is the central location for all assessment projects completed within Student Affairs. This includes both internally generated assessments as well as national assessment instruments. The committee provides a quick point of access to understand what information is available, making it easier to utilize data from multiple sources. Input from these types of committees is integral to a successful retention review; it might be accomplished through overlapping retention review committee membership or requested input at the draft stage.
There are numerous outside companies or consultants available to either entirely complete or assist with a campus wide retention review. However, as noted by Kuh (2008), the data and the expertise are already in place on most campuses, and these consultants do not generally have the time to genuinely diagnose the specific issues and needs of an individual campus. Really, the only needed resources not already existing are usually personnel (time) and a definition of “retention review” for the particular institution.
Methodology
In Developing a Comprehensive Institutional Quality of Student Life and Learning (Retention) Plan Noel-Levitz (2005) notes a number of steps that should be included when conducting a retention review including the following:
• Review the institution strategic plan • Perform a retention related strengths, weaknesses, opportunities, and threats (SWOT) analysis • Compile and review historical retention data • Review retention data by student characteristics (Noel-Levitz suggests this be done by gender,
race, ethnicity, age, commuter/resident, and academic ability; we will discuss additional possible subsets later in this paper)
• Conduct a review of retention literature and national and benchmark data • Reconfirm retention target groups at the institution (e.g. academically underprepared, undeclared
students, commuters, etc.) • Analyze results from campus satisfaction surveys • Review recommendations and work to date from retention committees and task forces • Identify successful retention strategies and activities that have worked in the past or are currently
working (based on collected data) • Compile a listing of all current retention-related programs at the institution • Develop a list of retention planning assumptions • Clarify definitions and nomenclature that will be used in the retention review process
While more simplistic in content, Karp & Logue (2004) suggest the steps in the process of designing, developing, and implementing a successful retention program include:
• Institutional acknowledgment that improved retention is desirable • Assembly of comprehensive information derived from multiple sources including student records,
surveys, questionnaires, etc. to determine the academic and non-academic needs of students • Assess the availability of retention resources with respect to the needs to be addressed (derived
from step above) • Review and evaluate the efficacy of potential retention programs • Put areas of retention need in priority order • Plan program execution
354
Proceedings of the 5th Annual National Symposium on Student Retention. Copyright 2009. C-IDEA, The University of Oklahoma.
• Design and implement program evaluation process • Implement the program(s) • Widely disseminating the results from program evaluation(s) • Modify the program(s) as needed
Customizing the Review Process to the Needs of an Institution
Noel-Levitz focuses on more of an overarching review assuming that a number of programs are in place, while Karp & Logue seem to begin their review checklist with the assumption that the review is the beginning of the institution’s retention journey. It is our experience that a combination of the Noel-Levitz and Karp & Logue checklists can be used to create an institution specific retention review checklist. Indeed, these checklists should serve as guides to creating the approach that will best serve the needs of the institution.
For example, while it is not included in either reference checklist above, based on the Michigan Tech retention review experience the final steps in the retention review process should include developing a 5-10 year retention plan. This retention plan should include retention rate goals, a listing of existing retention initiatives that should continue to be supported, those that need to be re-thought (based on collected data), and a listing of new initiatives to implement and assess. The new initiatives will come from the benchmarking and retention literature review and need to include an assessment plan with a timeline in order to best support the 5-10 year plan.
A draft of the entire retention review should be shared with a variety of entities for feedback prior to campus-wide dissemination of the final product. While each campus will determine the shared entities needed, at Michigan Tech these entities included the Dean of Students, Vice President for Student Affairs, Athletic Director, currently existing retention committees, the Office of Institutional Diversity, faculty members and graduate students currently performing retention or student success related research, and the director or coordinator of each office or initiative that was studied as a current retention related program.
Current retention programs that are valuable to include might be: grant funded targeted outreach programs, residential and non-residential learning communities, learning centers, first year success seminars, probation outreach initiatives, supplemental instruction (SI) programs, summer transition programs, and university sponsored pre-college programs. Each university also needs to consider any unique populations or circumstances they have. For instance, there are large portions of commuter and out of state students at Michigan Tech; accordingly, it was important that these specific student subsets also be studied. It may be necessary to approach reviewing information tied to specific populations multiple ways, such as by ACT or SAT scores, gender, ethnicity, high school GPA, advanced placement courses, participation in summer transition or pre-college preparedness programs, financial need, or first generation status.
Though not mentioned by Noel-Levitz, Michigan Tech chose to consider retention by college/school. Detailed information by major was not considered at this time, as a big picture view was desired (though each of the colleges/schools does collect and review this information themselves annually).
Also important to note, all of the practices and methodologies described in this paper can easily be translated into appropriate processes for performing retention reviews on a smaller scale, such as within an academic program or support initiative.
While both of the previously mentioned methodologies discuss assembling comprehensive information that pertains to retention as one of the initial and critical steps to completing a review, recognizing the value of qualitative information is also beneficial. For example, if an area or individual worked with a high number of African-American students and noticed their persistence seemed lower in science and engineering than that of other groups of students on campus they may be a population to be concerned about, especially if the success of these students align with institutional strategic goals, such as increasing the diversity of the campus community. The retention data may or may not substantiate that belief, and/or prompt further investigation. From there, what does the data request indicate?
355
Proceedings of the 5th Annual National Symposium on Student Retention. Copyright 2009. C-IDEA, The University of Oklahoma.
Collection Example
Three years of data of retention of African-American undergraduate students in Science, Technology, Engineering and Mathematics (STEM) majors Figure 1 indicates somewhat erratic patterns of retention. In 2006, the data indicates the group had higher retention numbers than the total population, although the next two years indicate lower retention rates. This type of information can prompt additional research into areas that may be causing specific challenges for these students. This is when a wide range of perspectives can be helpful to identify potential challenges to research further.
/ Figure 1: 2006-07 First Year Retention Comparison of Undergraduate
African American and Total Students in STEM Field Majors Where does evaluation go from here? Having more years of data would certainly benefit analysis; 2006 may be highly unusual when reviewing 10-15 years of data. Another direction may be to review academic performance, and identify any specific concerns that may be surfacing. One source of research indicates that one challenging area for African-American students, who are the largest domestic underrepresented population on Michigan Tech’s campus, are success in specific gateway courses required to pursue certain degrees in STEM majors, as detailed in Figure 2. Course Percent of African American Students Receiving Grade of
C (2.0) or Below Precalculus 59% Calculus 67% Engineering Problem Solving 76% General Chemistry 50% University Physics 1 63%
Figure 2: Performance of African-American Undergraduate Students (Attending Michigan Tech as of Fall 2009) in Select Gateway Courses at Michigan Technological University
Findings or results
As mentioned earlier, comparison with nationally available data is important to review. Several of the resources Michigan Tech used for this data are ACT, Inc. and the Consortium for Student Data Retention Exchange (CSRDE). Below are examples of how this information was used (Figure 3 and 4).
356
Proceedings of the 5th Annual National Symposium on Student Retention. Copyright 2009. C-IDEA, The University of Oklahoma.
Figure 3: First Year Retention (data for 1999 not available for 4 year Selective Public Institutions) (Public Institutions and
Selective Public Institutions data from ACT, Inc.)
Figure 4: 2006-07 First Year Retention Comparison
Benchmark universities also need to be considered. There are several key institutions that the
Michigan Tech College of Engineering benchmarks against; however, additional benchmark institutions were included in this study. Admissions data indicates specific colleges students chose to attend instead of Michigan Tech after they had placed a deposit at the university. Additionally, based on the Registrar’s exit survey data, the universities students leave Michigan Tech to transfer to were documented. The high percentage colleges and universities from these sources were used as benchmarks also; these are the universities students are being lost to, and need to be considered.
Once the retention data has been gathered, evaluated, and the necessary follow up information has been identified and collected, it is time to draft a report that includes the data as well as data driven recommendations about the direction to take. As previously mentioned this draft should be supplied to key decision makers and highly involved campus entities. From there it is important to request and collect feedback to use in developing a 5-10 year retention plan that should be completed with key decision makers at the institution. As this type of undertaking supports institutional success, the findings should be relayed in a public forum, preferably with a high level champion present, such as a president, vice-
2007 2006
357
Proceedings of the 5th Annual National Symposium on Student Retention. Copyright 2009. C-IDEA, The University of Oklahoma.
president, or provost. Scheduled periodic campus updates should be planned for with the time line for these based on implementation of initiatives and goals.
Lessons Learned
With the Michigan Tech retention review at the draft review stage, a number of lessons have already been ascertained.
A critical component to complete at the beginning of the process is to set limits to what data and information will be included in the review. There are a number of programs and large amounts of data or ways to look at the data, without limits or boundaries the retention data collection and program review stage can become overwhelming. Setting limits beforehand keeps the retention review team focused from the start. The Michigan Tech retention review is being completed by two staff members from retention focused areas. While not done at Michigan Tech, such a large and all encompassing project benefits from a campus-wide team, even when a retention coordinator is in place. A team aids in data collection, supplies campus-wide program and initiative knowledge and increases the likelihood of buy-in for the final retention plan across campus.
Throughout this discussion, review teams have been referenced. At many institutions, there are opportunities to pull students in as part of the process. One mutually beneficial way is to develop the retention review as part of a student research project. This could be a part of graduate work in any number of disciplines, or an undergraduate project. Students should also be included when developing committees and task forces that relate to retention and success, as they bring additional perspectives. As indicated previously, one co-author successfully used components of this process as part of a practicum for a master’s degree in engineering.
When collecting data it is important that the team request the data from each program or area that is responsible for it. Often times it is quicker and there is greater likelihood of an accurate comparison if the team collects or requests the data themselves from institutional analysis (or similar entities), however, buy-in for the project and depth of data is increased when working through the program owners. Additionally, the amount of data requested can be significant, thus placing an undue burden on already potentially overwhelmed institutional analysis staff.
It is important to do a longitudinal review of key events or changes that have taken place at the university and review these in relation to retention data. While data collection is at the mercy of those that collect it, much of the data should be available over a long term; be sure to pick the time period that will be included in the review so that it includes any of those critical key changes. For instance, Michigan Tech moved from a quarter calendar system to semesters in 2000; for this reason, at least one year prior to this change was included in the data wherever possible. Other examples of critical events or changes are the move from charging a base rate of tuition for 12-18 credits to charging per credit hour for tuition and the tragedy on September 11, 2001 (impacting international student attrition and enrollment). Keep in mind that student success initiatives such as learning centers, online learning, 2+2 transfer agreement students, study abroad, or service learning initiatives may need to be reviewed in a separate way. For instance, academic success in comparison to those that do not utilize the resource may need to be considered in place of retention. With this in mind, these programs are not necessarily retention initiatives and may not be best addressed in the retention review. Michigan Tech reviewed results from a number of national surveys the campus participates in, including the National Survey of Student Engagement (NSSE), Your First College Year survey (YFCY), and the Cooperative Institutional Research Program (CIRP) Freshman Survey. This provided an opportunity to identify trends that might not have otherwise been noticed and to check correlation with retention results. Survey results also supply insight into a wider variety of student needs and challenges. The Michigan Tech retention review began with focusing only on first year retention and retention initiatives; as we progressed however, second and third year retention as well as first, second and third year effective retention (retention by matriculated college or school) were added to provide a better picture of retention as a whole.
358
Proceedings of the 5th Annual National Symposium on Student Retention. Copyright 2009. C-IDEA, The University of Oklahoma.
Effective retention is especially significant to specific Schools and Colleges at an institution, and may or may not be a priority of the college or university overall. Obviously, as a dean or a department chair, you logically don’t want to lose students to other majors. Reviewing the data, may help to decipher why students leave disciplines, but don’t leave a University, and support the development and/or improvement of any number of systems or policies affiliated with an area including admissions policies, academic advising, tutoring services and the curriculum and instruction of mandatory courses.
Conclusion
As Tinto noted, “Though successful retention programming does require some skill and not an inconsiderable amount of effort, it does not require sophisticated machinery. It is within the reach of all institutions if they only give serious attention to the character of their educational mission and the obligations it entails. In short, successful retention is no more than, but certainly, no less than, successful education”.
Certainly, a retention review also requires some skill and a significant amount of effort, but when broken down, is not a complicated process. Considering retention data from a variety of perspectives supports driving student success and ultimately their persistence, which should be a focus of any institution. While a retention review requires effort and collaboration across campus, it should not feel like an overwhelming challenge. Dedication and cooperation makes it a streamlined process, with potential to benefit all areas of an institution.
359
Proceedings of the 5th Annual National Symposium on Student Retention. Copyright 2009. C-IDEA, The University of Oklahoma.
References Hoover, E. (2007). Administrator Stresses Importance of Retention. The Chronicle of Higher Education,
LIV (11), A33. Karp, R., Logue, R. (2003). Retention initiative for unscheduled sophomores and unscheduled readmits.
Journal of College Student Retention: Research, Theory & Practice, 4(2), 147-172.
Kuh, G.D. (2008). Diagnosing Why Some Students Don’t Succeed. The Chronicle of Higher Education, LV (16), A72.
Noel-Levitz, Inc. (2005). Developing a Comprehensive Institutional Quality of Student Life and Learning (Retention) Plan.
Tinto,V. (1993). Leaving College – Rethinking the Causes and Cures of Student Attrition. (2nd Edition).
The University of Chicago Press.
Webster’s New World Dictionary and Thesaurus. (2nd Edition). (2002). Hungry Minds, Inc.
360
Proceedings of the 5th Annual National Symposium on Student Retention. Copyright 2009. C-IDEA, The University of Oklahoma.
Attempting to Make Sense of First Generation Student Success: Part II (Part I: Is There Such a Thing as Too Much of A Good Thing When It Comes to
Education? Reexamining First Generation Student Success)
Dr. Mary Lou D’Allegro Planning, Research & Assessment
Abstract: Data mining and analyses at a less selective institution revealed that the relationships between parents’ education level and pre college, first year success indicators, and six year graduation are not linear. Specifically, students who report that either parent(s) or guardian(s) have an education level beyond a baccalaureate degree or do not report parent education level fair worse on some first semester and first year success indicators as well as some pre-college enrollment characteristics than those students whose parent(s) or guardian(s) have a baccalaureate degree. The student success indicators used for the study were: (a) first semester credits attempted, (b) first semester credits earned, (c) first semester GPA, (e) first year credits earned, (f) first year cumulative GPA, (g) one year retention, and (h) six year graduation rates. Several inferential statistics were employed. This includes ordinary least squares (OLS) and logistic regression techniques to determine the predictability of several demographic, pre college, and college characteristics on these student success indicators. Introduction Evidence continues to suggest that students whose parents or guardian that have not graduated from college are not as successful as their non-first generation counterparts. That said, these first generation students do not have the same access to post-secondary education. As an example, first generation students earned less credits in their first year than non-first generation students (Chen, 2005b). First generation status was shown to be a significant predictor of degree completion when considering student characteristics (Adelman, 2006). Further, these students are less likely to stay in college and subsequently graduate than students whose parents are college graduates (Ishitani, 2006; Warburton, Burgarin, & Nunez, 2001). In addition, research has demonstrated that first generation students are less engaged in college than non-first generation students (Pascarella, Pierson, Woniak, & Terenzini, 2004; Pike & Kuh, 2005). However, student success does not incrementally improve with increased levels of parent education level. D’Allegro and Kerns (2008) demonstrated that students with parents who had an education level beyond a baccalaureate fared worse than students whose parents had a baccalaureate degree on several pre-college and college success indicators. That said, the study only investigated first semester credits attempted, first semester credits earned, first semester GPA, and one year retention. Examining longer term student success indicators may have produced different results. Therefore, this study attempts to builds on this previous research to include first year credits earned, first year GPA, and six year graduation rates. Background Penn State Berks is a public college campus of Pennsylvania State University (PSU). Penn State Berks is one of five PSU college campuses that confers both associate and baccalaureate degrees. The overall enrollment was 2,800 students in fall 2008 with approximately 926 new baccalaureate degree-seeking freshmen. Although its 2000 Carnegie Classification is Baccalaureate-Arts & Sciences, twenty percent of PSU Berks students are enrolled in science, technology, engineering, or mathematic (STEM) majors. Between fall 2000 and fall 2007, the duration of this study, the average combined Mathematics
361
Proceedings of the 5th Annual National Symposium on Student Retention. Copyright 2009. C-IDEA, The University of Oklahoma.
SAT and Critical Reading SAT score for new baccalaureate degree-seeking freshmen was 1,007. However, the fall 2008 average combined SAT score for new baccalaureate degree-seeking freshmen was 983 grouping Penn State Berks with other less selective institutions. Methodology New baccalaureate degree-seeking students enrolled at Penn State Berks for fall semesters between 2000 and 2007 were included for this study. Information was collected using the PSU Data Warehouse. Three types of independent variables available in the PSU data warehouse were drawn for analysis: (a) student demographic information (gender, ethnicity and parent education level), (b) pre-college data (Mathematics SAT scores, Critical Reading SAT scores, English placement tests, and Mathematics placement tests), and (c) college variables (student enrolled in a major in first semester, student enrolled in a STEM major in first semester). To avoid possible multicollinearity among SAT scores, a combined SAT score was not included in any of the regression models. The dependent variables were (a) first semester GPA, (b) first semester credits attempted, (c) first semester credits earned, (d) first year credits earned, (e) first year cumulative GPA, (f) one year retention, and (g) six year graduation rates. Chi square goodness of fit tests were employed to detect statistical differences among parent educational level for the college variables: declared a major in first semester and declared a STEM major in the first semester. To discern differences among parent education groups, an Analysis of Variance (ANOVA) were employed for each precollege and dependent variable. To ascertain the predictability of the demographic, pre-college, and college variables on the student success factors ordinary least squares (OLS) regressions were employed for the dependent variables, (a) first semester GPA, (b) first semester credits attempted, (c) first semester credits earned, (d) first year credits earned, and (e) first year cumulative GPA. Logistic regression is appropriate when the dependent variable is dichotomous and, therefore, was used to test the predictability between one year retention and six year graduation (Chen, 2005a). Descriptive Statistics Demographics The percent of students by parent education level is shown in Table 1. Approximately half (46.9%) of the students used for the analysis did not report that at least one parent or guardian completed a baccalaureate degree. About one-fourth (23.0%) of the students are from families in which no parent or guardian attended college paralleling national student enrollment trends (Chen, 2005b). One-fourth (23.9%) of the students are from families in which at least one parent or guardian experienced at least some college. Table 2 lists the percent of students included in the study by ethnicity, parent, or education level. A larger proportion of females (55.4%) than males (44.6%) comprise the missing parent education level group. Males out number females in every non-missing parent education level category. This parallels the student enrollment at the College. The proportion of Caucasian students is largest for the baccalaureate education level (86.1%). On the other hand, the proportion of African-American and Hispanic students is lowest for the baccalaureate parent education level (3.2% and 1.9% respectively). Note that African American students (23.0%) are more likely to not report parent education level than any other ethnic group.
362
Proceedings of the 5th Annual National Symposium on Student Retention. Copyright 2009. C-IDEA, The University of Oklahoma.
Variable N Percent Parent Education Level High School or Less 1,407 23.0% (23.6%) Some College 1,464 23.9% (24.2%) Baccalaureate Degree 1,350 22.0% (21.3%) Beyond Baccalaureate Degree 1,546 25.2% (25.1%) Missing 361 5.9% (5.8%) Total 6,128 100.0% (100.0%) * Parentheses indicates percents in fall 2000-fall 2006, Part I analyses Table 1 Proportion of Students by Parent Education Level Parent Education Level Less than High Some Beyond Missing School/High School College Baccalaureate Baccalaureate Gender
Male 44.6% 58.2% 57.0% 64.8% 61.8% Female 55.4% 41.8% 43.0% 35.2% 38.2% Ethnicity Native American 0.0% 0.1% 0.0% 0.0% 0.1% African American 23.0% 8.2% 5.9% 3.2% 4.4% Asian 7.2% 6.5% 3.0% 4.2% 5.4% Hispanic 6.1% 4.9% 3.5% 1.9% 1.6% Caucasian 56.2% 75.1% 82.8% 86.1% 82.4% Non-Resident Alien 0.8% 1.1% 0.2% 0.1% 0.9% Missing 6.6% 4.1% 4.6% 4.4% 5.2% Has a Major (first semester)* Yes 75.3% 71.6% 77.0% 73.0% 74.8% No 24.7% 28.4% 23.0% 27.0% 25.2% Is a STEM Major (first semester)** Yes 23.8% 28.0% 29.6% 30.1% 30.3% No 76.2% 72.0% 70.4% 69.9% 69.7% * The goodness of fit chi square was significant (χ2(3, N = 5,767) = 12.30, p ≤ .01) ** The goodness of fit chi square was not significant (χ2(3, N = 5,767) = 2.24, p = .53) Table 2 Demographic and College Information by Parent Education Level Pre-College Indicators Means for the pre-college variables by first generation status are shown in Table 3. As seen, students in the missing parent education groups post the lowest mean Mathematics SAT and mean Critical Reading SAT scores. Students who report parent education level as less than high school/ high school have the second lowest mean Mathematics and Critical Reading SAT scores. As the parent education level increases, so does both the mean Mathematics SAT and mean Critical Reading SAT. One exception is the mean Mathematics SAT garnered for students in the beyond baccalaureate degree parent education level is lower than students who reported a parent education level of baccalaureate. ANOVA for the Mathematics SAT and the Critical Reading SAT confirm differences for both (F(3, N = 5,716) = 27.96, p ≤ .001 and F(3, N = 5,716) = 50.63, p ≤ .001 respectively) among the parent education level groups.
363
Proceedings of the 5th Annual National Symposium on Student Retention. Copyright 2009. C-IDEA, The University of Oklahoma.
Parent Education Level Less than High Some Beyond Demographic Missing School/High School College Baccalaureate Baccalaureate SAT
Six Year*** Graduation 57.4% 47.7% 58.4% 65.6% 67.0% *** ANOVAs all significant, p < .001. Table 3 Means for Pre-College Variables and Student Success Indicators by Parent Education Level
Similarly, students who do not report parent education level fare worse in all placement tests. Mean placement test scores increase as parent education level increases. Two exceptions are the Punctuation Placement Test and the Basic Math Placement Test. A lower mean for the Punctuation Placement score was obtained for students who report parent education level beyond the baccalaureate degree than students who reported a parent education level of baccalaureate. Likewise, students who report parent education level as beyond baccalaureate degree obtained a lower mean Basic Math Placement score than students who reported a parent education level of baccalaureate. However, the differences for both the mean Punctuation Placement score and the Basic Math Placement score between these two parent education groups are small. An ANOVA was conducted for each Placement Test by parent education level. All ANOVA results were statistically significant (p < .001). Caution on the significance of these inferential tests is warranted. Undoubtedly, the large sample size, approximately 5,700 students used for these analyses contributed to the significance of each ANOVA. With large sample sizes, even small difference can produce statistically significant results. That said, first generation students consistently underperformed in comparison to non-first generation students and the differences are perceptible. College Indicators The percent of students who enrolled in a major in the first semester by parent education level is listed in Table 2. Also shown is the percent of students who enrolled in STEM majors in his/her first semester. As seen in Table 2, very slight differences exist between students in terms of choice of major among the parent education groups. Interestingly, students with missing parent education information were the most likely to have declared a major in the first semester. Those students whose parent or guardian had
364
Proceedings of the 5th Annual National Symposium on Student Retention. Copyright 2009. C-IDEA, The University of Oklahoma.
less than a high school education or high school diploma were least likely to declare a major in the first semester. The proportion of STEM majors increases as parent education level increases. Table 3 depicts first semester credits attempted, first semester credits earned, first semester GPA, first year credits earned, first year cumulative GPA, first year retention, and six year graduation rate by parent education level. In general, these student success indicators increase as parent education level increases. Students with missing parent education level performed better than those whose parent or guardian had less than a high school diploma or a high school diploma on every first semester and first year success indicator. It appears that the effect of a student’s parent education level does not seem to dissipate over a student’s college career, at least in the first year. An examination of one year retention among parent education levels indicates that one year retention increases as parent education level increases. Interestingly, students with missing parent education information still outperform those students who report that his/her parent or guardian have an education level of less than a high school diploma or a high school diploma. The same pattern that was exhibited with first semester and first year success indicators holds for six year graduation. Specifically, students who do not report parent education level have a higher six year graduation rate than those students whose parents or guardians have less than a high school or a high school diploma. Regression Models Twenty-five OLS stepwise regression models were estimated for each of the three dependent variables with continuous scales, first semester credits attempted, first semester credits earned, first semester GPA, first year credits earned, first year cumulative GPA. Differentiated by independent variable type, the four models were constructed: (a) demographic variables, (b) pre-college parameters, (c) college indicators, and (d) an overall model consisting of all independent variables from the three independent variable types. For all dependent variables, the overall model provided the best predictability and fit. Therefore, the discussion will focus only on the five overall models. A dichotomous variable, minority status, was used as a proxy for ethnicity. Students who are not Caucasian, including non-resident aliens are categorized as minorities. Standardized beta weights are reported because the variables vary in scale type and range. For example gender, is a binary categorical variable and parent education level is an ordinal four level parameter. Similarly, SAT scores range from 200 to 800 on a continuous scale while Placement Test score ranges, although continuous, are varied. First Semester Credits Attempted The results of the overall regression model for the dependent variable, first semester credits attempted, are presented in Table 4. The variance attributed by the independent variables (R2 = .036) and the overall model fit (adjusted R2 = .033) are modest. The standardized beta weight for parent education level is significant in the overall model (β = .064, p ≤ .001) as is gender (β = -.076, p ≤ .001). Note that the negative standardized beta weight (β) for gender implies that being male negatively impacts the number of first semester credits attempted. Conversely, a positive parent education level status beta weight (β) indicates first semester credits attempted is positively associated with parent education level.
365
Proceedings of the 5th Annual National Symposium on Student Retention. Copyright 2009. C-IDEA, The University of Oklahoma.
R2 Adjusted R2 Standardized Beta Weight Model Credits Credits Credits Credits Credits Credits Attempted Earned GPA Attempted Earned GPA Attempted Earned GPA Overall .036 .037 .086 .033 .035 .084 Gender-Male (Male = 1, Female = 0) -.076*** -.070*** -.158*** Minority Status (Caucasian = 1, Other = 0) -.008 .000 .034** Parent Education Level .064*** .078*** .079*** SAT Mathematics -.037 -.055* -.032 SAT Critical Reading -.016 -.025 .042 Placement Test Vocabulary .008 .005 .013* Placement Test Spelling .004 .007 .019 Placement Test Grammar -.012 -.021 -.014 Placement Test Punctuation -.025 -.021 -.005 Placement Test Basic Math .050* -.049* -.048* Placement Test Algebra/Trigonometry .068* .067* .114*** Placement Test Business Calculus .014 .025 .061 Placement Test Calculus .088** .090** .063* Has a Major (first semester) .072*** .077*** .058*** Is a STEM Major (first semester) -.018 -.025 -.077*** p ≤ .05, ** p ≤ .01, *** p ≤ .001 Table 4 Standardized Beta Weights by Regression Models for First Semester Credits Attempted, First Semester Credits Earned and First Semester GPA First Semester Credits Earned Table 4 also shows the regression models for the dependent variable, first semester credits earned. The first semester credits earned overall model (R2 = .037) accounted for slightly more variance than the first semester credits attempted regression model (R2 = .036) and the first semester credits earned overall model fit (adjusted R2 = .035) is slightly better than the first semester credits attempted overall model fit (adjusted R2 = .033). The standardized beta weights for gender (β = .070, p ≤ .001) and parent education level are significant (β = .078, p ≤ .001). First Semester GPA As seen in Table 4, the variance attributed to the overall first semester GPA model and the fit of this model is larger than the other overall first semester regression models (R2 = .086 and adjusted R2 = .084 respectively). Each demographic variable resulted in a significant standardized beta weight: gender (β = -.158, p ≤ .001), minority status (β = .034, p ≤ .01), and parent education level (β = .079, p ≤ .001). Other significant regression coefficients were: SAT Mathematics (β = -.032, p ≤ .01), Vocabulary Placement Test (β = .013, p ≤ .05), Basic Math Placement Test (β = -.048, p ≤ .05), Algebra/ Trigonometry Placement Test (β = .114, p ≤ .001), and Calculus Placement Test (β = .063, p ≤ .05). Note that the quantitative tests posted negative standardized beta weights (β) associating an increase in test scores with a decrease in first semester GPA. First Year Credits Earned Table 5 lists the regression models for the dependent variable, first year credits earned. In both the first semester credits earned and first year credit earned overall models, gender (β = -.070, p ≤ .001 and β = -.072, p ≤ .001 respectively) and parent education level (β =.078, p ≤ .001 and β =.087, p ≤ .001 respectively) disclosed significant beta weights. Only Algebra/ Trigonometry (β = .067, p ≤ .05 and β = .069, p ≤ .05 respectively) and Calculus Placement Tests were significant (β = .090, p ≤ .01 and β = .083, p ≤ .01 respectively) for both models. Interestingly, in both overall models, declaring a major in the first semester (β = .077, p ≤ .001 and β = .093, p ≤ .001 respectively) was significant.
366
Proceedings of the 5th Annual National Symposium on Student Retention. Copyright 2009. C-IDEA, The University of Oklahoma.
R2 Adjusted R2 Standardized Beta Weight Model Credits Credits Credits Earned GPA Earned GPA Earned GPA Overall .041 .106 .039 .103 Gender-Male (Male = 1, Female = 0) -.072*** -.188*** Minority Status (Caucasian = 1, Other = 0) .007 .044** Parent Education Level .087*** .069*** SAT Mathematics -.031 -.007* SAT Critical Reading -.021 .052** Placement Test Vocabulary .001 .014 Placement Test Spelling .016 .016 Placement Test Grammar -.017 -.003 Placement Test Punctuation -.026 -.003* Placement Test Basic Math .028 .045* Placement Test Algebra/Trigonometry .069* .115*** Placement Test Business Calculus .019 .071* Placement Test Calculus .083** .052 Has a Major (first semester) .093*** .070*** Is a STEM Major (first semester) -.008 -.065** * p ≤ .05, ** p ≤ .01, *** p ≤ .001 Table 5 Standardized Beta Weights by Regression Models for First Year Credits Earned and First Year Cumulative GPA First Year Cumulative GPA Table 5 also shows the regression models for the dependent variable, first year cumulative GPA. In both the first semester GPA and first year cumulative GPA overall models all demographic variables are significant. For both these overall models regression coefficients for Basic Math Placement Test (β = -.048, p ≤ .05 and β = .045, p ≤ .05 respectively) and Algebra/ Trigonometry Placement Test (β = -.114, p ≤ .001 and β = .115, p ≤ .001 respectively) are significant. Declaring a major in the first semester (β = .058, p ≤ .001 and β = .070, p ≤ .001 respectively) and declaring a STEM major in the first semester (β = .077, p ≤ .001 and β = -.065, p ≤ .001 respectively) posted significant beta weights for both overall models. However, declaring a STEM major in the first semester appears to have an adverse effect on first year cumulative GPA as evidenced by the negative standardized beta weight (β). One Year Retention Of the four models, the overall model was associated with the smallest log likelihood. Model predictability increases as log likelihood decreases (Garson, 2008). Therefore, the subsequent discussion will focus on the regression coefficients and odds-ratios for the overall model. Reported in Table 6 for the overall model is the log likelihood (-2LL), goodness of fit chi square (χ2), and Nagelkere R2. The goodness of fit chi square (χ2), corresponding test of significance, and log likelihood (-2LL) connote if the model is better than a model with no variables included, in other words, the intercept model (Garson, 2008). The Nagelkere R2 is similar to the R2 reported in the OLS models and is an estimate of the variation explained by the model. Chiefly, it is an estimate of the additional variation explained by a model with the independent variables included above the model with only an intercept term. The beta weights or regression coefficients and corresponding odds-ratios for each variable in the overall logistic regression model are reported in Table 6. Derived from the beta weights, an odds-ratio is an estimate of the probability of obtaining a certain outcome in relation (Chen, 2005a). As seen in Table 6, in the overall model, females are seventeen percent more likely (1.167) to be retained in the first year than males. The probability of a student whose parent education level is high school or less being retained through the first year of college decreased by a factor of 2.044 (reciprocal of .489) compared to students whose either parent or guardian(s) have earned a credential beyond that of a
367
Proceedings of the 5th Annual National Symposium on Student Retention. Copyright 2009. C-IDEA, The University of Oklahoma.
baccalaureate degree. In other words, students whose either parent or guardian(s) have obtained a credential beyond a baccalaureate degree are more than twice than likely to be retained in the first year than those whose either parent or guardian(s) only have earned a high school diploma or less. The odds-ratios of one year retention increases with parent education level but are not on par with those students whose either parent or guardian(s) have achieved an educational level beyond a baccalaureate degree. Of note is that Mathematics SAT garnered a negative regression coefficient. Expressly, a one-point increase in the Mathematics SAT score decreases the probability of one year retention by two-tenths of a percent (reciprocal of .998 = 1.002). However, SAT scores are reported in base ten (101). Therefore, the odds-ratios would be more meaningful if both the probability and the odds-ratio were multiplied by ten. Therefore, a two percent (1.002 – 1= .002; .002 x 10 = .02) decrease in the probability of being retained one year is associated by a ten-point increase in the Mathematics SAT score. Goodness of Nagelkerke Regression Odds- Model -2LL of Fit χ2 R2 Coefficient Ratio Overall 5171.925 163.612*** .047 Gender-Female .154 1.167 Not Caucasian -.042 .959 Parent Educational Level High School -.716 .489 Some College -.255 .775 Bachelor’s Degree -.159 .853 SAT Critical Reading -.002 .998 Mathematics .000 1.000 Placement Tests Vocabulary -.018 .982 Spelling .020 1.020 Grammar -.028 1.003 Punctuation -.017 .972 Basic Math .026 .984 Algebra/Trigonometry .053 1.027 Business Calculus .024 1.054 Calculus .017 1.025 Has Not Declared Major -.115 .891 (first semester) Not a STEM Major -.046 .955 (first semester) * p ≤ .05, ** p ≤ .01, *** p ≤ .001 Table 6 Beta Weights and Odd-Ratios by Regression Models for One Year Retention Six Year Graduation Six year graduation rates were only available for the fall 2000 and fall 2001 cohorts. Similar to the one year retention models, the overall model resulted in the smallest log likelihood of the four constructed models. Reported in Table 7 is the log likelihood (-2LL), goodness of fit chi square (χ2), and Nagelkere R2. The beta weights or regression coefficients and corresponding odds-ratios for each variable in the overall logistic regression model are also reported in Table 7. As seen from Table 7, the effect of gender and parent educational level is more pronounced than with one year retention. In the overall model, females are fifty-one percent more likely (1.509) to graduate in six years than males. The probability of a student whose parent education level is high school or less graduating in six years decreased by a factor of 2.101 (reciprocal of .476) compared to students whose either parent or guardian(s) have earned a credential beyond that of a baccalaureate degree. Similar to one year retention, the odds-ratios of six year retention
368
Proceedings of the 5th Annual National Symposium on Student Retention. Copyright 2009. C-IDEA, The University of Oklahoma.
increase with parent education level but less than those students whose either parent or guardian(s) have achieved an education level beyond a baccalaureate degree. Of note is that the Mathematics and Critical Reading SAT both produced zero regression weights. In addition, the Vocabulary Placement Test posted a negative regression coefficient indicating a three percent decrease in the likelihood of graduating in six years for every one point increase in the Vocabulary Placement Test. As mentioned, this placement test was a significant positive predictor of first semester GPA and one year cumulative GPA.
Goodness of Nagelkerke Regression Odds- Model -2LL of Fit χ2 R2 Coefficient Ratio Overall 1709.714 75.404*** .075 Gender-Female .411 1.509 Not Caucasian -.215 .806 Parent Educational Level High School -.743 .476 Some College -.357 .700 Bachelor’s Degree -.043 .958 SAT Critical Reading .000 1.000 Mathematics .000 1.000 Placement Tests Vocabulary -.028 .972 Spelling .043 1.044 Grammar -.012 .988 Punctuation .005 1.005 Basic Math .017 1.047 Algebra/Trigonometry .045 1.046 Business Calculus .029 1.029 Calculus .008 1.008 Has Not Declared Major -.001 .999 (first semester) Not a STEM Major .100 1.105 (first semester) * p ≤ .05, ** p ≤ .01, *** p ≤ .001 Table 7 Beta Weights and Odd-Ratios by Regression Models for Six Year Graduation Limitations Several limitations should be considered in the interpretation and generalization of the results of this research. First, this study was conducted at a less selective institution. Results may have been different at a college with a different selectivity classification. Second, Penn State Berks has a large number of STEM majors, twenty-two (22.2%) percent of all enrolled students. Conducted at an institution with a more typical enrollment may have produced different results. The present study did not distinguish between students whose parent(s) or guardian(s) have less than a high school diploma and parent(s) or guardian(s) have a high school diploma. In addition, this study did not discern between students parent(s) or guardian(s) obtained some creditenial beyond a Bachelor’s degree and students who hail from households in which either parent or guardian have at least one graduate degree. In light of the present research results, more specific information about parent education level may have provided valuable insight into the factors that affect student success.
369
Proceedings of the 5th Annual National Symposium on Student Retention. Copyright 2009. C-IDEA, The University of Oklahoma.
Discussion This study entailed a more detailed examination of the relationship between parent education level and student success than previous research. In part, this was accomplished by discerning the pre-college, college, and student success indicator differences among four parent education levels: (a) high school diploma or less, (b) some college, (c) Bachelor’s degree obtainment, and (d) obtainment of education beyond a Bachelor’s degree. Also examined were the pre-college, college, and student success indicator aggregates for students who did not report parent education level. The available demographic, pre-college, and college parameters were regressed on several student success indicators. The student success indicators used for the study were: (a) first semester credits attempted, (b) first semester credits earned, (c) first semester GPA, (e) first year credits earned, (f) first year cumulative GPA, (g) one year retention, and (h) six year graduation rates. As indicated by the ANOVA results for the SAT, placement tests, first semester success indicators, first year success indicators, and six year graduation rates, students whose parents or guardians that do not have any college perform worse than those students whose parents or guardians have at least some college. This parallels previous research findings in which first generation students completed fewer credits than non-first generation students (Pascarella et al., 2004). Likewise, significant beta weights were posted for parent education level in the overall models for all first semester and first year success indicators. Additionally, the most pronounced differences in the one year retention and six year graduation variable odd-ratios were those of the three levels of parent education level in comparison to the reference group, either parent or guardian(s) have earned a creditential beyond a baccalaureate degree. Students whose either parent or guardian(s) have no college creditentials perform more poorly than those students whose parent(s) or guardian(s) have some college experience. On the other hand, students whose parent(s) or guardian(s) have a Bachelor’s degree do better on some of the pre-college and college indicators than students whose parent(s) or guardian(s) have schooled beyond a Bachelor’s degree. For example, students whose parent(s) or guardian(s) have achieved schooling beyond a Bachelor’s degree did not do better than their Baccalaureate counterparts on the Mathematics SAT, Punctuation Placement Test, or the Basic Math Placement Test. Moreover, these two groups attained similar average first semester GPA results. Students whose parent(s) or guardian(s) have earned some credential beyond a Bachelor’s degree outpaced students whose parent(s) or guardian(s) have earned only a Bachelor’s degree with regards to one year retention and six year graduation. In short, the relationship between parent education level and pre-college and student success indicators is not linear. Conclusions The purpose of this study was to assess the relationship between parent education level and key pre-college and college success indicators using data from one less selective institution. The population used in this study was comprised of new baccalaureate degree-seeking students who began their studies in the fall semesters between 2000 and 2007. This was achieved by comparing means, deploying several inferential tests, and devising several OLS and logistic regression models. This study demonstrated that students who whose parents or guardian have no college experience typically perform worse on pre-college variables but not necessarily in college. However, evidence from this study demonstrates that student success does not hinge solely on parent education level (Warburton et al., 2001; Ishitani, 2006). There may be differences among the different parent education levels regarding engagement and campus involvement but these differences may be attributable to a much more complex set of parameters, not just parent education level (Orbe, 2008). Suggested disadvantages of first generation students are the lack of access to college procedures, expectations, and support (Pascarella et al., 2004). Although possibly inherent to first generation students, these factors may be salient to success in college regardless of parent education level. Importantly, strategies for engagement to ensure the success of first generation students begins well before students are considering college enrollment (Somers et al., 2004).
370
Proceedings of the 5th Annual National Symposium on Student Retention. Copyright 2009. C-IDEA, The University of Oklahoma.
This is clearly resonated in Table 3 in which students whose parent(s) or guardian(s) with less than high school/ high school perform worse than the other parent education groups for both pre college and college success indicators. Correspondingly, further investigation of why students whose either parent or guardian(s) have schooled beyond a baccalaureate degree did not outperform Bachelor’s degree parent education level counterparts on the Mathematics SAT and some placement tests should be undertaken. For this study conducted at a less selective institution, a parent education level of a Bachelor’s degree seems to be sufficient to do well. Post secondary institutions that are more selective or not selective may yield different results. Possibly, students with parents or guardians with advanced degrees have expectations that are not congruent with obtaining an undergraduate degree at a less selective institution. These expectations, imposed on these students, may actually be a deterrent to student success in college, at least at less selective institutions. Research is needed to determine the relationship between parent education level and student success indicators at less selective institutions not employed in this study. For example, the comparison of the academic attributes of high schools attended by first generation students compared to non-first generation students may underscore the factors affecting pre-college differences between these two types of students (Chen, 2005b; Cushman, 2007; Ishitani, 2006). This investigation may be particularly relevant at less selective institutions which accept a larger percent of students from underperforming high schools by virtue of their pre-college indicators (Johnson, 2008). Implications Penn State Berks has continued to fund the Aspire Program, in part, because of this research. Targeted at underrepresented student groups including first generation students, this program offers intense instruction and acclimation to the Penn State Berks campus for six weeks in the summer before entry to college. Because of the success of this program, the campus commitment is unwavering in light of the decision by the Pennsylvania State University not to participate in a similar program funded by the Pennsylvania Department of Education (PDE). Several partnerships with area high schools are underway. Penn State Berks supports the Project Lead the Way (PTLW). PTLW promotes pre-engineering classes for middle and high school students (Project Lead the Way, 2008). In addition, a National Science Foundation (NSF) grant was recently submitted to avail academic computing capabilities to area middle and high schools. Faculty in the Elementary and Kindergarten Education Program have increased the training offerings to Reading mathematics and science teachers. According to the U.S. Census, Reading trails Pennsylvania with the smallest percent of the population 25 or older with a bachelor’s degree or higher (Pennsylvania State Data Center, 2008). In concert with these teacher workshops, these faculty are also working with the parents and families of the students that comprise the Reading School District. The Penn State Berks Retention Plan for 2010-2015 will include specific objectives for improving second and third year retention noting that second and third year retention rates as well as graduation rates for first generation and underrepresented students are lower than that of the overall student population. Among those objectives being discussed are specific advising initiatives for sophomores and juniors, Career Center counseling, and availability of enriching academic experiences. Unique to the 2010-2015 Retention Plan will be strategies that specifically target underrepresented and non-traditional student cohorts. Summary
Exclusive to this research was the articulation of specific parent education levels and corresponding academic performance. Results reinforce that students whose either parent or guardian(s) have not attended any college are at a distinct disadvantage compared to other students. Future research endeavors should help to determine which intervention strategies while in college or beforehand best improve a student’s academic performance on pre-college and student success indicators.
371
Proceedings of the 5th Annual National Symposium on Student Retention. Copyright 2009. C-IDEA, The University of Oklahoma.
References
Chen, C. C. (2005a). Analyzing student learning outcomes: Usefulness of logistic and Cox regression models. IR Applications, 5, 1-18.
Chen, X. (2005b). First generation students in postsecondary education: A look at their college transcripts.
Washington, DC: U.S. Department of Education, National Center of Educational Statistics. Cushman, K. (2007). Facing the culture. Educational Leadership, 64(7), 44-47. D’Allegro, M. A., & Kerns, S. L. (2008). Is there such a thing as too much of a good thing when it comes
to education? Reexamining first generation student success. Paper presented at the Fourth Annual National Symposium on Student Retention, Little Rock, AR.
Garson, G. D. (2008). Logistic regression. Retrieved July 1, 2008, from
http://www2.chass.ncsu.edu/garson/PA765/logistic.htm Ishitani, T. T. (2006). Studying attrition and degree completion behavior among first generation college
students in the United States. Journal of Higher Education, 77(5), 861-885. Johnson, I. (2008). Enrollment, persistence and graduation of in-state students at a public research
university: Does high school matter? Research in Higher Education, Online First. Retrieved July 21, 2008, from http://www.springerlink.com/content/jr3645u15j21hr15/fulltext.pdf
Orbe, M. P. (2004). Negotiating multiple identities with multiple frames: An analysis of first-generation
college students. Communication Education, 53(2), 131-149. Pascarella, E. T., Pierson, C. T., Wolniak, G. C., & Terenzini, P. T. (2004). First-generation college
students: Additional evidence on college experiences and outcomes. Journal of Higher Education, 75(3), 249-284.
Pennsylvania State Data Center. (2008). New 2005-2007 American Community Survey data released: First
multi-year estimates bring new data for dozens of counties and cities. Harrisburg, PA: Author.
Pike, G. R., & Kuh, G. D. (2005). First and second generation college students: A comparison of their engagement and intellectual development. Journal of Higher Education, 76(3), 276-300.
Project Lead the Way. (2008). General FAQs. Retrieved July 8, 2009 from http://www.pltw.org/General-
FAQs/General-FAQs.cfm Somers, P., Woodhouse, S., & Cofer, J. (2004). Pushing the boulder uphill: The persistence of first
generation college students. NASPA Journal, 41(3), 418-435. Warburton, E., Burgarin, R., & Nunez, A. (2001). Bridging the gap: Academic preparation and
postsecondary success of first-generation students. Washington, DC: U.S. Department of Education, National Center for Educational Statistics.
372
Proceedings of the 5th Annual National Symposium on Student Retention. Copyright 2009. C-IDEA, The University of Oklahoma.
Facilitating Student Success Through a System of Prescriptive Engagements and Transitions
Roosevelt O. Shelton
The Office of Enrollment Management Kentucky State University
Abstract – Evolving out of an historical commitment to access and student success, the Summer Academic Bridge Program (SABP) represented an intrusive system of prescribed engagements and motivational strategies that were primarily designed to remove various impediments to the successful transition of academically at-risk and first-time freshman students to postsecondary education. The central tenet of the SABP was the belief that student capacities to perceive, engage, and navigate educational transition points directly influenced the probability that those students would persist and succeed. Transition point persistence rates for all SABP cohorts far exceeded those associated with the general population of first-time freshmen, and those rates were maintained across all key transition points. Introduction
Initially chartered in 1886 as a normal school for the training of black teachers for the black schools
of Kentucky, Kentucky State University long demonstrated a history of providing postsecondary access to populations that, otherwise, were denied such access and opportunities for success. To a large extent, the issue of access represents only one of three major thresholds for students' postsecondary matriculation, with the other two being persistence and success. For the better part of a century, such access represented an immediate pathway to better lives for thousands of students who were genuinely at-risk in their collective efforts to maneuver the various social, political, and economic impediments associated with the plight of African Americans. The institution’s faculty, staff, and administration melded and implemented an archetypal model of student access and success that essentially evolved out of their collective experiences, centering around motivational beliefs and self-regulated learning skills.The institution’s focus was on clearly delineated precepts that were designed to nurture and engage students, as they transitioned through the various phases of their college matriculation and pursued ascension into society. To a large extent, active engagement was not optional, but mandatory, and fully informed by their collective experiences.
Over the subsequent 123 years the institution grew and evolved to become the state’s unique, small, liberal studies institution, serving students without regard to their race, age, sex, national origin, or economic status, and representing the most diverse institution of higher education within the Commonwealth of Kentucky. The institution’s commitment to access and student success remained at its core. Unfortunately, the unique institutional and collective memory associated with the archetypical model of student success diminished. While a new and vastly more diverse generation assumed its place in the history of the institution, new and more abstruse challenges to access and student success quickly evolved. For example, while the high school graduation rate for all Kentuckians reached 71.5%, rates for African Americans and Hispanics ascended to only 58.2 and 49.4 percent, respectively (Editorial Projects, 2008). Over 50 percent of Kentucky high school graduates and 65 percent of the institution’s first-time freshmen required at least one developmental course. The proportion of Kentucky adult learners with one or more developmental need reached 92.0 percent. More alarming, the one-year attrition rate for all under prepared students entering Kentucky public colleges approached 40 percent (Kentucky Council, 2009).
.
373
Proceedings of the 5th Annual National Symposium on Student Retention. Copyright 2009. C-IDEA, The University of Oklahoma.
The Summer Academic Bridge Program
The institution’s desire to recapture its collective memory, resuscitate dormant precepts, and forge a paradigm that addressed the current challenges associated with college readiness led to the development and implementation of the Summer Academic Bridge Program (SABP). The SABP facilitated four cohorts between the summers of 2005 and 2008, including the initial pilot cohort of 2005. The project represented a program for enhancing the academic background and experience of high school graduates, via a selective sequence of courses and experiences during the initial summer academic term. The Office of Enrollment Management and the university administration acknowledged the potential of those students, and the program represented a supportive, challenging, and learner-centered introductory environment designed to ensure their ease of transition to KSU, continued persistence, and eventual academic success.
Participants
The program targeted 251 first-time freshman students with demonstrated academic deficiencies that
precluded them from enrolling in college-level English and math courses, and Table 1 details the collective college readiness and placement profile of the four SABP cohorts, with approximately 90 percent of the participants requiring more than one developmental course. While the designation of “at-risk” status to the cohorts was primarily precipitated by their record of academic performance, the designation was additionally informed by their financial/economic status, as delineated by their eligibility for the Federal Pell Grant Program and other need-based financial assistance. Upon completion of the program, participants earned up to nine academic credits and faced the second semester fully exposed to the various strategies that the Bridge program modeled. Table 1. Cumulative 2005-08 College Readiness Placement Profile Placement Number Percentage Developmental math 234 93% Developmental English 212 85% General Education math 17 7% General Education English 39 16%
Methodology
Relevant research indicated that the traditional pathway to earning a baccalaureate degree had become the exception rather than the rule, and while the proportion of high school graduates who continued on to postsecondary education had increased, rates of baccalaureate degree completion had remained steady (Horn & Carroll, 1998; Adelman, 2004). A variety of transitional points were directly inferred by KSU’s organizational, academic, and college readiness policies and practices, and the most recognizable transition point occurred as our students entered the institution. It was at this critical point that they would decide whether to persist (remain enrolled) at KSU, transfer to a different institution, or leave KSU and postsecondary education altogether.
Issues of persistence, in terms of establishing sufficient credits to lead toward degree completion, are
often paired with issues of success (ultimately completing the degree). However, it is important to note that the roles and responsibilities of students are continually changing during this implied transition (Adelman, 2007). It remained imperative, in our efforts to maximize student access and success, that the initial entrance transition point be fully integrated into the operational procedures and instructional practices of the program. Therefore, our definition of success was expanded to include maintenance of an acceptable GPA throughout the delineated transition points. Prior to their arrival on campus, program participants were administered internally developed
374
Proceedings of the 5th Annual National Symposium on Student Retention. Copyright 2009. C-IDEA, The University of Oklahoma.
diagnostics that provided critical insight into individual personality types, learning styles and sensory preference.
SABP services were delivered via a living and learning community environment and the program
prescribed and mandated specific levels of individual engagement. The SABP environment engaged participants in (1) completing a mathematics, English, and University Orientation class, (2) extensive tutoring and full academic support, (3) one-on-one and small group tutoring, supplemental instruction, and structured study groups, and (4) a variety of social, service, and leadership opportunities available on campus and in the local community. These coordinated programs were designed and implemented to compliment and extend the academic experiences of the program’s participants outside of the formal classroom. The SABP provided frequent seminars that were specifically designed to develop skills such as (1) personal development, (2) self-esteem, (3) etiquette, (4) self-motivation, and (5) self-discipline. For example, one seminar sequence focused on the CNN series, “Black in America with Soledad O'Brien” and program participants were engaged in dialogue and reflections regarding the issues of “women and families” and “the plight of the Black male in America.” Additionally, programming was designed and implemented in effort to connect the program’s participants with the Kentucky State University community, and each program participant was required to complete one community service-learning project. Finally, programming was designed and implemented to embellish the social dimension of program participants, and included weekly movie nights, shopping excursions, skating trips, museum tours, and outings to the Kentucky Kingdom theme park and the Louisville Metropolitan Zoo. Motivation and Student Success
The design of the SABP emphasized motivational beliefs and self-regulated learning skills (e.g. goal setting, active engagement, accurate analysis of task demands, selection of appropriate learning strategies) because those variables had been shown to predict the academic achievement of college students (Pintrich & DeGroot,1990; Lindner & Harris, 1998;VanZile-Tamsen & Livingston, 1999). A number of studies had shown that at-risk students exhibited personal characteristics that distinguished them from regularly-admitted college students. For example, Larose and Roy (1991) examined the role of prior academic performance and affective variables, such as fear of failure and test anxiety, in predicting the success of at-risk college students. Affective variables were more reliable predictors of academic success for at-risk students, but high school GPA more accurately predicted course grades for regularly-admitted students. Also, among freshmen enrolled in a developmental mathematics course, Higbee and Thomas (1999) reported that SAT scores and high school GPA were not significantly correlated with course grades, whereas students' beliefs about their ability (self-efficacy beliefs) were more closely aligned with their achievement.
Lindner and Harris (1998) found a significant correlation between motivation and GPA (r = .46) in graduate and undergraduate education majors. Motivational variables may have been a key distinction between at-risk or developmental and regularly-admitted college students. Ley and Young (1998) indicated deficiencies in developmental college students in both motivational beliefs and use of self-regulated learning strategies, in relation to their regularly-admitted peers. In addition, VanZile-Tamsen and Livingston (1999) reported considerably higher correlations between motivational orientation and self-regulated strategy use for lower-achieving students (r = .69) as compared to higher-achieving students (r = .40). Thus, motivational orientation predicted use of self-regulated learning strategies more for lower-achieving students than for higher-achieving students.
375
Proceedings of the 5th Annual National Symposium on Student Retention. Copyright 2009. C-IDEA, The University of Oklahoma.
Educational Transitions and Student Success
Educational transitions research (Mare, 1980; Shavit & Blossfeld,1993) suggested that the effects of social background were stronger for earlier educational transitions than for later ones, and those students with fewer resources and less access to information may have been more likely to follow an “involuntary pathway” through college that would more likely lower their odds for completion (Wagner, 2001, Vol. 22). Moreover, students who followed the traditional route to a baccalaureate degree were in the minority. Generally, such students comprised only one-fourth of the undergraduate population (Choy, 2002). Over 50 percent of students who began at a four-year institution attended more than one college within five years, and 15 percent attended more than two (McCormick, 2003). National studies also revealed that 25 to 35 percent of undergraduates took time off from college and eventually returned, a pattern known as “stopout” (Berkner, 2002; Carroll, 1989). One study of first-time freshmen who began their postsecondary education in 1995-96 found that among those students who transferred institutions at least once before 2001-02, 30 percent also stopped out of school for a period of time (Berkner, 2002). Put another way, they began college at one school, took time off, and returned to another school.
Goals and Objectives
A central tenet of the SABP was our belief that participant capacities to perceive, engage, and navigate educational transition points directly influenced the probability that they would persist and succeed. Therefore, the program focused on three critical transition points, as they regarded coordinating and utilizing Kentucky State University’s various support services to: (1) remove impediments to the successful transition of academically at-risk and first-time freshman participants, (2) facilitate effective motivational strategies, (3) increase the persistence rate of participants. These areas of focus were translated into the following overarching SABP goal: Participants would effectively engage available student and academic support services to successfully navigate educational transition points, resulting in greater persistence and personal success.
Three attendant objectives were associated with this overarching goal:
Objective 1: Participants would demonstrate an informed awareness of the various educational transition points that comprised their undergraduate matriculation at KSU.
Objective 1: Participants would demonstrate an informed awareness of the various educational transition points that comprised their undergraduate matriculation at KSU.
Objective 3: Participants would demonstrate their capacity to apply the knowledge, skills, attitudes, and strategies gained from their interactions with support services to (1) successfully navigate the various transition points, (2) demonstrate a positive motivational orientation, (3) maintain and demonstrate academic growth and success, and (4) persist in their enrollment at the institution.
Cohort Demographics
Table 2 details the collective demographic profile of the four SABP cohorts. The initial 2005 SABP pilot successfully transitioned 14 participants, the Summer 2006 program transitioned 42 participants, the Summer 2007 program transitioned 94 participants, and the Summer 2008 program transitioned 101 participants, for a cumulative total of 251 participants. Participants accessed the opportunities to complete a mathematics, English, and University Orientation course and to significantly remove the various developmental prescriptions that resulted from their admission status and college readiness placements.
376
Proceedings of the 5th Annual National Symposium on Student Retention. Copyright 2009. C-IDEA, The University of Oklahoma.
Table 2. Cumulative 2005-08 Cohorts Demographic Profile Number Percentage Black, Non Hispanic 234 93% White, Non Hispanic 11 4% Hispanic 6 2% Male 121 48% Female 130 52%
Table 3 provides collective cohort data regarding the participants’ individual personality type, learning
style, and sensory preference. Insight into this dimension was highly valuable to engendering a sense of individual self-awareness, exploring student motivational beliefs, and implementing self-regulated learning strategies. It also better informed program staff and faculty members in their efforts to tailor and individualize instructional and engagement strategies. Table 3. Cumulative 2005-08 Personality Type/ Learning Style Preference Number Percentage Introverted 113 45% Extroverted 138 55% Formal text processing 75 30% Listening, verbal-aural 116 46% Tactile 45 18% Visual 15 6% With a learning disability 18 7%
Assessment
Assessment of the Summer Academic Bridge Program was directly aligned with the overarching goal and objectives of program. Formative strategies were designed to facilitate a level of continuous feedback that engaged program participants (students, instructors, and support staff) in self-reflective processes. While this strategy was not designed to provide immediate and contextualized feedback, it was useful for determining the efficacy of the SABP and for shaping revisions and improvements to the program. Likewise, summative strategies were designed to summarize the efficacy of the program at clearly delineated transition points, including the first to the second semester, the first to the second year, and the fifth semester. More specifically, the efficacy of the program was assessed in terms of (1) the level and frequency of individual student engagement, as indicated by attendance patterns and levels of interaction within the prescribed activities of the program, (2) student attitudinal data, regarding participants’ perceived value of the program’s precepts and strategies (3) student assessment data, regarding participants’ perceptions of the value and efficacy of specific program components, and (4) participant persistence at clearly delineated transition points. While student academic success, as indicated by cumulative grade point averages and the fulfillment of developmental prescriptions were tracked over the entire period of enrollment in the institution, those variables were not used as sources of cohort (i.e., SABP versus institutional) comparisons.
377
Proceedings of the 5th Annual National Symposium on Student Retention. Copyright 2009. C-IDEA, The University of Oklahoma.
Results and Findings
Table 4 provides the results of the participants’ individual self-ratings, which focus on the various behaviors implying active engagement in the SABP learning environment. These behaviors also infer self-awareness, motivational beliefs, and self-regulated learning skills. Generally speaking, the results suggest that (1) a majority of the participants remained actively engaged within their educational environment, and (2) the prescriptive focus on these behaviors engendered an environment through which self-assessment and self-regulated learning strategies were developed and practiced. Table 4. Cumulative Participant Self-Rating of Engagement and Personal Behaviors Behavior Number confirming Percentage confirming Late for class 5 2% Late for support sessions 5 2% Absent from class 17 7% Absent from support sessions 40 16% Failure to submit assignments 22 9% Completed work on time 184 73% Vocal/participated in class/seminars 194 77% Asked questions of instructor/staff 156 62% Requested clarification/assistance 153 61% Mastered math content 148 59% Mastered English content 153 61% Mastered study skills content 85 34%
The behaviors appearing in Table 4 greatly informed the program in its efforts to monitor
affective changes within participant cohorts. The current findings acknowledge the evasive nature of affective change, as it can only be documented through extended observation. Nevertheless, since self-motivation arises from values, and values infer replication, evidence of affective change is inferred from these specific participant behaviors.
Additionally, Table 5 and Table 6 represent attitudinal data regarding participant individual perceptions of (1) the efficacy of programmatic components, and (2) the value of the program to their future and continued success. It is our assumption that those components that were assigned the greatest value will be engaged in the future within a more informed context. Likewise, valued behaviors will be replicated by individual participants as they continue their matriculation at the institution.
Table 5. Cumulative Participant Rating of Programmatic Components Component Average rating * Math content 3.3 English content 3.1 Orientation content 3.7 Study skills content 2.7 Seminar content 3.5 Math faculty effectiveness 3.1 English faculty effectiveness 3.4
378
Proceedings of the 5th Annual National Symposium on Student Retention. Copyright 2009. C-IDEA, The University of Oklahoma.
Scale: 1 = poor 2 = fair 3 = good 4 = excellent
Generally speaking, assessment results indicate that the majority of the participants felt that academic content had been mastered. However, only approximately one-third of the participants felt that prescribed study skills had been fully mastered. Participants clearly felt that the program was challenging, rewarding, and prepared them for future academic success.
Table 6. Cumulative Participant Self-Perceptions of Programmatic Outcomes Outcome Number confirming Percentage confirming Well prepared for academic success 185 74% Understanding of future challenges 173 69% Viewed SABP experiences as challenging 208 83% Viewed SABP experiences as valuable 218 87% Strongly recommend the program to other students 244 97%
The confirmations on Self-perception of appearing in Table 6 clearly indicate the assignment of an
exemplary level of value to the program by participants, and it is our assumption that this value will greatly contribute to their future ability to remain self-motivated and engaged. However, one specific programmatic rating indicates that the mastery of specific strategies is less obvious. Those strategies included study skills, and it is reasonable to assume that their eventual mastery is highly dependent upon continued exposure to and experience in actively engaging those strategies.
Table 7 provides comparative data on specific persistence rates at each transition point, as they regard the individual SABP cohorts and the corresponding general first-time freshman cohort. Those results indicate that the persistence rates associated with the SABP cohorts consistently exceed those of the corresponding general student cohorts. Table 7. Comparative Persistence Rates Across Transition Points Cohort 1st to 2nd semester 1st to 2nd year 4th to 5th semester 2005 SABP 99% 85% 54% 2005 institutional 75% 55% 38% 2006 SABP 98% 85% 66% 2006 institutional 76% 48% 30% 2007 SABP 99% 68% 58% 2007 institutional 78% 49% * 2008 SABP 2008 institutional
98% 69%
* *
* *
Orientation faculty effectiveness 3.8
Study skills staff effectiveness 2.6 Seminar staff effectiveness 3.3 Math faculty mastery of knowledge 3.5 English faculty mastery of knowledge 3.3 Orientation faculty mastery of knowledge 3.6 Study skills staff mastery of knowledge 3.3 Seminar staff mastery of knowledge 3.3
379
Proceedings of the 5th Annual National Symposium on Student Retention. Copyright 2009. C-IDEA, The University of Oklahoma.
* Cohort and Institutional Data pending for fall 2009
Various factors equally contributed to the cohort rates, which would significantly diminish if those factors were isolated from each other. In short, those factors are the precepts, strategies, and structured experiences of the SABP. It remains our belief that the third transition point (the 4th to 5th Semester) is most crucially related to eventual degree completion, because this has been the point of greatest student attrition over the past three years. Therefore, generally speaking, those students who successfully transition through that point are very likely to continue toward degree completion. Countless other factors also impact attrition at that point, e.g. unsuccessfully attempting an unreasonable number of hours, thus jeopardizing financial aid eligibility.
Table 8 provides SABP cumulative cohort data on the specific grade point averages attained by
program participants. Those results indicate that more than 90% of those participants attained a GPA of at least 2.3 on an institutional 4.0 scale.
Table 8. Cumulative 2005-08 Cohort Grade Point Average Distribution Transition Point GPA Range Percentage Attaining 1st to 2nd Semester 2.0 or below 9% 2.3 to 2.6 26% 3.0 20%% 3.3 to 3.5 26% 3.6 to 4.0 19%
Table 9 provides SABP cumulative cohort data on the academic success of program participants, as it
regards the successful completion of developmental courses during the initial semester and prior to the initial transition point. Several studies have found that high school GPA and ACT Composite score were only effective in predicting success at the 2.00, 2.50, and 3.00 levels of first-year GPA (Noble & Sawyer, 2002). However, high school GPA was not an effective predictor of success at higher levels of first-year GPA. A 4.00 high school GPA corresponded to very low probabilities of success at the 3.25, 3.50, and 3.75 levels of first-year GPA, and high school GPA values below 3.00 provided little differentiation among students across first-year GPA levels. Table 9. Cumulative 2005-08 Developmental Course Success Rate Course Percentage Successful Percentage Failing Developmental English 97% 3% Developmental math 83% 17% University Orientation* 99% 1%
*while required of all first-time freshman this is not a developmental course
Implications and Summary Discussion
It is important to note that prescriptive engagement, as a concept within this project, refers to a level of student, staff, and faculty engagement that is synergetic and mandated, rather than detached and optional. The prescriptive engagement facilitated by the SABP appears to be an effective mechanism for navigating clearly delineated transition points, and may serve as a model for other institutions desiring to positively impact the transition and persistence rates of academically at-risk and first-time freshman students. A more thorough comparison of the SABP cohort and the institutional cohort characteristics may better illuminate this finding,
380
Proceedings of the 5th Annual National Symposium on Student Retention. Copyright 2009. C-IDEA, The University of Oklahoma.
especially as it regards the issue of academic and financial at-risk status. For example, SABP cohorts represented targeted at-risk first-time freshman students selecting to participate in the program, whereas the institutional cohorts represented both those at-risk students who declined to participate in the program and those students with no at-risk status at all. While 61% of the institutional first-time student cohorts were eligible for the Federal Pell Grant Program, over 80% of the SABP cohorts were Pell eligible. However, the average percentage of need that was met for either cohort awarded any need-based aid was 25%. Moreover, while more than half of the students within the institutional first-time student cohorts required at least one developmental course, 100% of the students within the SABP cohorts required at least one developmental course.
These considerations are important because they further clarify the levels of risk associated with
membership in either cohort. Unfortunately, recently developed factors portend an even greater expansion of this at-risk population. For example, while Federal Pell funding is on the rise, the Commonwealth of Kentucky recently adopted even higher standards for determining college readiness. It is anticipated that those standards will significantly increase the number of students required to complete developmental courses at the institution. Nevertheless, developmental courses represent only one possible option for remediation, and institutions will be challenged to develop more efficient strategies for facilitating a growing population of students designated as “at-risk.”
The findings indicate that engagement of this at-risk student population is effectively facilitated when
it is directly prescribed, as opposed to being open to individual choice. In many ways, student success encompasses much more than simply maintaining an acceptable or exemplary grade point average. For far too many students it is simply surviving, persisting, and remaining enrolled, and all of these factors may be severely impacted by their academic and financial status. To attain such a goal, students must be actively engaged by and with their educational environment. Students within the SABP cohorts demonstrated a greater level of persistence over the delineated transition points than did those students within the general institutional cohorts. Various engagements for the former cohort were mandated, while those for the latter cohort were subject to individual choice.
A significant implication of this finding, which is related to degree completion, is the need for
continued reinforcement and engagement strategies during the subsequent 6th and 7th semesters of matriculation, and perhaps even further. With the exception of the initial 1st to 2nd Semester transition point, participants persisted and succeeded without any formal or structured intervention. Put another way, participants drew upon their SABP experiences to survive, persist, and remain enrolled.
The SABP has been developed, implemented, and maintained by the Kentucky State University Office
of Enrollment Management (OEM). It represents a logical extension of the office’s vision, and ongoing desire to recapture and utilize the institution’s collective memory in the provision of its services. Therefore, the most valuable consequence of this initiative recently resulted when the institution pursued the development of an acceptable Quality Enhancement Plan (QEP). Core Requirement 2.12 of the Southern Association of Colleges and Schools’ Principles of Accreditation requires institutions to demonstrate that the plan is part of an ongoing planning and evaluation process. The Office of Enrollment Management worked with the QEP topic selection committee to fashion a plan that replicated the various precepts, tenets, strategies, and structured experiences of the Summer Academic Bridge Program. This is considered a critical and valuable consequence because, as a logical extension of the program, it serves to fully institutionalize the intrusive system of prescribed engagements and motivational strategies.
With specific regard to success, as the maintenance of an acceptable GPA throughout the delineated
transition points, additional data regarding individual cohort and cumulative participant grade point averages indicate that the predictive value of our current admissions criteria on student persistence and academic achievement in college may be, at best, questionable. For example, as of the 2009 Spring semester, the average
381
Proceedings of the 5th Annual National Symposium on Student Retention. Copyright 2009. C-IDEA, The University of Oklahoma.
cumulative GPA for all participants was 2.40. Twenty-two percent maintained a 3.00 GPA or higher, and 6 percent maintained a 3.50 GPA or higher.
Finally, universities commonly accept the belief that college readiness standards should ideally inform
classroom instruction, whether general or developmental. Unfortunately, an examination of current placement and developmental instruction practices indicates that this is not always a discernable process. While performance on the ACT is directly related to first-year college grade point average, placement and developmental instruction practices may often result in the misapplication of those assessment results. There is little disagreement that our campus policies, practices, and culture directly impact student persistence and success, and programs centered on prescriptive engagements throughout critical transition points will better inform those policies and practices, in a collective effort to facilitate both access and success to at-risk student populations.
382
Proceedings of the 5th Annual National Symposium on Student Retention. Copyright 2009. C-IDEA, The University of Oklahoma.
References Adelman, C. (July/August 2007). Retrieved January 22, 2008, from Do We Really Have an Access
Problem? Web site: http://www.heldref.org
Adelman, C., (2004). Retrieved March 3, 2007, from Principal Indicators of Student Academic Histories in Postsecondary Education, 1972-2000. Washington, DC: U.S. Dept. of Education. Web site: http://www.ed.gov/rschstat/research/pubs/prinindicat/index.html
Berkner, L., (2002). Retrieved April 2, 2006, from Descriptive Summary of 1995-1996 Beginning Postsecondary Students: Six Years Later. Washington DC: NCES. Web site:http://nces.ed.gov/pubsearch/pubsinfo.asp?pubid=2003151
Carroll, C. D., (1989). Retrieved December 15, 2006, from College Persistence and Degree Attainment for 1980 High School Graduates: Hazards for Transfers, Stopouts and Part-Timers. Washington, DC: U.S. Dept. of Education. Web site:http://www.eric.ed.gov/ERICDocs/data/ericdocs2sql/
content_storage_01/0000019b/80/1e/7b/b4.pdf Choy, S. P., (2002). Retrieved December 11, 2007, from Nontraditional Undergraduates: A Special Analysis. Washington DC: NCES. Web site: http://nces.ed.gov/programs/coe/ 2002/analyses/nontraditional/index.asp
Editorial Projects in Education Research Center (2008). Retrieved January21, 2009, from Diplomas Count. Web site: http://www.edweek.org/rc/
Higbee, J. L., & Thomas, P. V. (1999). Affective and cognitive factors related to mathematics achievement. Journal of Developmental Education, 23, 8-24.
Horn, L. J. & C. D. Carroll, (1998). Retrieved December 3, 2007, from Stopouts or Stayouts? Undergraduates Who Leave College in their First Year. Washington DC: U.S. Dept. of Education. Web site: http://nces.ed.gov/pubsearch/pubsinfo.asp?pubid=1999087 Kentucky Council on Postsecondary Education (2006). Retrieved December 3, 2008, from The Preparation of Students Entering Kentucky’s Public Colleges and Universities in 2002 and 2004. Web site: http://www.eric.ed.gov/ERICDocs/data/ericdocs2sql/
content_storage_01/0000019b/80/27/fd/f8.pdf
Larose, S., & Roy, R., (1991). The role of prior academic performance and nonacademic attributes in the prediction of the success of high-risk college students. Journal of College Student Development, 32(2), 17 1 - 177. Ley, K., & Young, D.B., (1998) Self-regulation behaviors in underprepared (developmental) and regular admission college students. Contemporary Educational Psychology 23, 42-54.
Ley, K., & Young, D.B., (2001) Instructional principles for self-regulation. Educational Technology Research and Development, 49(2), 93-103.
Lindner, R. W. & Harris, B.R. (1998). Self-regulated learning in education majors. Journal of General Education, 47, 1, 63-78.
383
Proceedings of the 5th Annual National Symposium on Student Retention. Copyright 2009. C-IDEA, The University of Oklahoma.
Mare, R. D., (1980). Social Background and School Continuation Decisions. Journal of the American Statistical Association, 75, 295-305.
McCormick, A. C. (2003). Swirling and Double-dipping: New Patterns of Student Attendance and Their Implications for Higher Education. In J. King (Ed.), New Directions for Higher Education (Vol. 121, pp. 13-24).
Noble, J. & Sawyer, R. (2004). Retrieved December 3, 2008, from Predicting Different Levels of
Academic Success in College Using High School GPA and ACT Composite Score. ACT Research Report Series Web site: http://www.act.org/research/researchers/reports/
Pintrich, P. R., & De Groot, E. V. (1990). Motivational and self-regulated learning components of classroom academic performance. Journal of Educational Psychology, 82 (1), 33-40.
Shavit, Y., & Blossfeld, H.P., (1993). Retrieved December 9, 2008, from Persistent Inequality: Changing Educational Attainment in Thirteen Countries. Boulder, CO: Westview Press. Web site: http://asj.sagepub.com/cgi/reprint/47/1/91
VanZile-Tamsen, C. and Livingston, J.A. (1999). The differential impact of motivation on the self-regulated strategy use of high- and low-achieving college students. Journal of College Student Development, 40, 54-60. Wagner, A. (2001). From Higher to Tertiary Education, International Higher Education Newsletter (Vol.
22). Boston, MA: Boston College Center for International Higher Education.
384
Proceedings of the 5th Annual National Symposium on Student Retention. Copyright 2009. C-IDEA, The University of Oklahoma.
Five Factors for Improving Nontraditional Student Retention: Findings from a 2004 Comparative Analysis Study
Using National BPS Data and Data from a 2008-09 Study at Santa Fe College
Angela Long, Ed.D.
Coordinator of Student Leadership & Activities Santa Fe College, Gainesville, FL
Abstract: This paper presents findings derived from a 2004 national research study on GED student attrition at community colleges conducted by Dr. Angela Long. Several significant findings are presented herein, specifically: (1) GED students who persist after one year of studies are as academically successful as high school diploma holders, and (2) unless college officials take proactive approaches to retaining nontraditional students at the outset of their first term of college, it is likely that half will drop out. The presentation will focus upon research relating to the "Five Factors for Improving Student Retention," with special emphasis upon non-traditional students who enroll at community colleges. Introduction
Educators have long been cognizant of the problem of student attrition. The majority of studies reveal that overall student attrition and retention is critical to the community college environment (Manzo, et.al., 2002, p. 503). However, the way in which student retention and attrition is defined and measured is a problem for community colleges. Due to the fact that community colleges are less homogeneous than any other type of college or university, it has become difficult to generalize the definitions and measures developed for student retention in 4-year institutions. For the majority of GED graduates, community colleges serve as the primary point of access into the postsecondary education process. Students are generally trained for GED preparatory classes in a designated off-campus site and are then required to step foot on a community college campus in order to be tested for GED certification. Due to such contact, many GED students become partially familiarized with the college campus environment and campus staff. In this regard, community colleges have the opportunity to attract and matriculate potential GED students interested in pursuing postsecondary education opportunities. Without question, 2-year institutions of higher education are one of the primary sources of GED test preparation. Virtually all community colleges have policies to admit GED graduates, with the majority having earned reputations as providing quality GED testing services. Collectively, they comprise a large proportion of the approximately 3,400 GED testing centers throughout the nation (Community College Week, 2002). Differing from 4-year private and public institutions that require ACT or SAT scores as one of their several criteria for admission, community colleges have open admissions standards. And also differing from the for-profit trade schools, the bulk of payroll costs and other General Fund expenditures at community colleges are commonly paid with tax dollars, not tuition revenues (AACC Fast Facts, 2003). Therefore, due to the low tuition rates and open enrollment policies found at community colleges, it is not surprising that the preponderance of GED completers who seek a postsecondary degree consider these 2-year public institutions to be the most practical for advancing their higher education objectives.
385
Proceedings of the 5th Annual National Symposium on Student Retention. Copyright 2009. C-IDEA, The University of Oklahoma.
It was recently reported by the GED Testing Service (2002) that one out of every seven Americans who earns a high school credential does so through the General Educational Development program. During the 2001 calendar year, slightly more than 1,016,000 residents of the United States and its territorial protectorates took the GED battery of exams (ACE Website, Table 106). The GED Testing Service now estimates that approximately 1 in 20 students enrolled in their first year of college is a GED diploma holder (GED Testing Service, 2002). In a former national publication entitled Who Took the GED? 2001 Statistical Report, it was stated that 25,316,152 people completed at least one of the five batteries of the General Educational Development (GED) tests between the years 1949 and 2002 (Table 3). This same report further noted that 15,393,652 of those test-takers successfully passed all five exams (Table 3). In other words, the number of people who earned a GED diploma during the past 50 years is roughly equal to the combined populations of 17 American states! Certainly numbers of these magnitudes are worthy of the attention of college admissions officers and student support personnel.
Despite the magnitude of this group of GED students, a dearth of national data nonetheless has existed concerning the persistence and attrition of GED graduates at the postsecondary education level. To underscore this point, out of the hundreds of articles published in the Community College Journal of Research and Practice between January 1992 and December 2002, only one article dealt with GED completers who began their postsecondary education at community colleges (i.e. Soltz, D.F., "The achievements of community college students with GED certificate", CCJRP, 20, 269-276).
Without question, most research on student attrition has historically been conducted on traditional college students, that is, "those students who are between 18 and 21 years of age, financially dependent on parents, and have graduated with a traditional, four-year high school diploma" (Osei, p. 12). Perhaps because most educators were themselves high school graduates--i.e., pure traditional students in every definitive sense--the bulk of research on student attrition at the postsecondary level has tended to be biased toward traditional students who attend 4-year institutions rather than nontraditional students who attend community colleges. Inception of Study: My Experience at Two Community Colleges
2001 - 02 Academic Year - Oregon Rural Community College
44% Drop Out!
17(Obtain AAOT)
163(Dropped Out 1st Term)
375(Enrolled)
1,186 Students(Obtained GED)
Illustration #1: Attrition Pattern of GED Students While working as a part-time employee at a rural Oregon community college during the 2001-02 academic year, I was assigned the job of collating data that pertained to the number of students who had
386
Proceedings of the 5th Annual National Symposium on Student Retention. Copyright 2009. C-IDEA, The University of Oklahoma.
been administered the General Educational Development Tests during the preceding 5-year period at this particular institution. As the numbers taken from the students’ files were being tallied, I was surprised to discover that the overwhelming bulk of this particular GED population became "dropouts" after having been enrolled for two terms or less. More specifically, I found that out of the 1,186 students who had successfully passed the GED’s battery of tests between June 1996 and June 2001, a total of 375 students subsequently were matriculated at the community college where I was employed. Out of that reduced number, I counted only 17 GED completers who persisted to obtain an associate’s degree. I was amazed to find that 163 people out of the original 375 matriculated students had dropped out either during or at the end of their first term of college studies. Nearly 44 percent of the GED completers made a evolutionary decision to leave college less than 3 months after having first been enrolled! This finding that four out of every ten GED completers left college either during or immediately following their first term served to kindle my curiosity. As a consequence, I wondered: Was this figure of 44 percent an anomaly, being entirely atypical of what was happening at other community colleges? In order to answer this question, I made a telephone call to another Oregon community college to request information as to what the institution had encountered in this regard. Two days later, I received my answer: 56.6 percent of GED completers who began their postsecondary education at this other community college did not register for a second term of courses. Out of 534 GED completers who had been matriculated at this other college during the same 5-year period, 302 of them became “college dropouts” in one term or less—a retention problem more statistically significant than what had occurred at my own community college. Thus, I began to ask myself the following questions: What is occurring at the national level? Will the national data line up with the local findings? National Experience Thereafter, I traveled to Washington D.C. to meet with strategic employees of the National Center for Education Statistics (NCES) and the American Council on Education (ACE)—trained researchers who could offer me advice and guidance regarding the most practical methodologies for collecting GED persistence data on a nationwide basis. During those meetings, I learned that the quantitative data needed for my doctoral dissertation research were contained within the dataset of the completed BPS: 1996/2001 longitudinal study. Through its unique and comprehensive design, the National Center for Education Statistics (NCES) Beginning Postsecondary Students Longitudinal Study: 1996-2001 (BPS: 1996/1998/2001) tracked the academic progress and persistence of a cohort of 12,083 randomly selected students who entered postsecondary institutions for the first time during the 1996 academic year through the end of the 2001 academic year. This cohort was a scientific sampling that statistically represented nearly 3 million other students who concurrently enrolled in 4-, 2-, and 1-year institutions of higher education. An earlier longitudinal study of similar national importance also conducted by the NCES—specifically, the National Education Longitudinal Study of 1988 (NELS: 88)—monitored the progress of a cohort of 1988 high school graduates over a time span of 5 years. But the BPS: 1996/2001 study differed from the NELS: 1988 study in two important respects: (a) the BPS: 1996-2001 yielded a national database which, for the very first time, distinguished GED completers as a categorical group that were separate and distinct from high school graduates; and, (b) data on GED student persistence, attrition, and attendance patterns (which subsequently tracked students from institution to institution) were recorded for the first time. Thus, it is this latter study that opened up new windows of insight and paths of understanding regarding the persistence rates of a cohort of GED completers who were matriculated in 1, 2 or 4-year postsecondary institutions of learning during the 1995-96 academic years.
387
Proceedings of the 5th Annual National Symposium on Student Retention. Copyright 2009. C-IDEA, The University of Oklahoma.
My experiences at the national level and at two Oregon community colleges ultimately served as the fountainhead and springboard for my doctoral research. Purpose of Research Study
This first of its kind study was conducted through the National Center for Education Statistics - US Department of Education. Through means of the NCES BPS: 1996/2001 database, national data was extrapolated to compare and analyze attrition rates between GED certificate holders and high school diploma holders for the first time at community colleges. Dr. James Griffith, Director of Longitudinal Studies at the NCES and Dr. Sen Qui, Research and Policy Analyst for the American Council on Education, both served on my research committee. The primary intent of this research project was to use national data to compare the dropout rates of a cohort of GED certificate holders and a cohort of high school graduates during their beginning two terms of enrollment at community colleges. A secondary objective was to compare the rates of certificate or degree attainment experienced by both cohorts during their postsecondary experience at community colleges.
In keeping with the primary objective of this study, my focus question was selected to determine the following: Is there a significant difference in the rates of attrition between GED completers and high school graduates who began their postsecondary educations at community colleges? Factors such as age, gender, race, and marital status were analyzed so as to ensure comparability of the student populations studied. Findings From The Study
Attrition of Full-Time Students at the End of their Fifth and Tenth Months
0
10
20
30
40
50
60
5 months 10 months
HS DropGED Drop
Illustration #2: Attrition Pattern of First-time Enrolled after 5th and 10th Months.
Upon close examination of the data, it became increasingly clear that a significant percentage of
GED recipients initiate their postsecondary educations at 2-year public and private colleges rather than 4-year colleges and universities. Due to this fact, the focal point of this study necessarily turned toward an investigation of data acquired from the BPS: 1996/2001 database that pertains to BPS cohorts enrolled at public 2-year institutions during the 1995-96 academic years. Having established this research parameter, one of the main objectives of my research study--namely, the collation and measurement of national data
388
Proceedings of the 5th Annual National Symposium on Student Retention. Copyright 2009. C-IDEA, The University of Oklahoma.
that enables a conclusive and irrefutable answer for the focus question stated at the outset of this chapter--became far easier to attain and less cluttered with extraneous material. Outlined below is a summary of the research findings:
• H.S. Attrition (First Term): It was found that the BPS database yielded information that suggested within the brief period of 30 days or fewer following the onset of the 1995-96 school year's fall term, students within the high school cohort began to drop out of college. Specifically, by the end of the fifth month of studies, one out of every three high school students at community colleges, or 38.8 percent had dropped out or stopped-out in their first year of studies, more than half of the high school graduates who had started taking classes as full-time students (1996 BPS Data).
• H.S. Attrition (Second Term): At the end of ten months, nearly 53% of the high school graduates at community colleges had dropped out or stopped-out -- more than half who began their first year of postsecondary education as full-time students (1996 BPS Data).
• GED Attrition (First Term): In regard to the GED cohort, the percentage of full-time students who dropped out of college by the end of the 5th month was even higher than their counterpart of high school graduates, amounting to approximately 42.9 percent of that cohort's membership.
• GED Attrition (Second Term): By the end of the 10th month, another 12% followed suit and left college, amounting to 54.8 percent by the end of the academic year. Thus, while the GED cohort had a greater percentage of its members leave college than high school graduates within a period of 5 months after having been matriculated, the statistical differences between these two groups had diminished greatly as the 1995-96 academic year came to a close.
• GED students tend to dropout at a faster rate within the first 5 months of community college enrollment as compared to their HS counterparts. However, after 10 months, the dropout percentages with HS Diploma Holders are comparable --approximately 50% (1996 BPS Data).
• GED students at community colleges tend to be older, female, have higher GPA’s, attend part-time, and enroll with fewer credit hours.
• CCrreeddiitt HHoouurrss –– 9955//9966:: The BPS: 96/2001 survey showed that GED completers at community colleges take fewer credit hours on average than their high school counterparts.
• GPA - 95/96: Even though a greater percentage of the GED cohort at community colleges had a grade point average of 0.00 at the end of five months, the GPA statistical mean for high school graduates was 2.60, whereas the GPA statistical mean for the GED cohort during the same period of time was 2.82.
• Degree Attainment - Public 2-Year Enrollment Outcome - 2001: High school graduates who first began at community colleges are more likely than GED completers to attain either an associate’s degree or a bachelor’s degree. On the other hand, a higher percentage of GED completers go on to earn vocational certificates more so than their high school counterparts.
Recommendations
In all likelihood, many college administrators would not be unduly taken back by this researcher's
finding that roughly half of the BPS:1996 cohort of full-time GED recipients dropped out of college during their first year of enrollment. But the coupled finding that a similar rate of attrition was experienced by the BPS:1996 cohort of high school graduates who first enrolled at community colleges should not be summarily dismissed by college student services personnel.
Thus the BPS: 1996/2001 longitudinal study creates a "policy paradox" of sorts. That is, the data show GED certificate holders as being much more likely to drop out of college within one or two months after first being enrolled than are high school graduates. This finding supports the position taken by the US Department of Education that possession of a GED certificate is a risk factor which weighs negatively
389
Proceedings of the 5th Annual National Symposium on Student Retention. Copyright 2009. C-IDEA, The University of Oklahoma.
against a student's probability to persist in college to the point of attaining a formal award of some kind. Still, the BPS data also revealed that of those GED recipients who persist through their first year of studies, their grade point averages (GPAs) tend to be higher than high school graduates who also persisted through two semesters of college coursework. This finding stands partially in opposition to the US Department of Education's view that possession of a GED certificate be classified as a risk factor.
Indeed, the above finding corroborates what was found by an organization titled Community College Survey of Student Engagement (CCSSE.), which issued the following admonition to its members:
"Colleges that do careful cohort tracking generally note that when community colleges lose students, they lose them early. All of these findings together illustrate the critical importance of connecting with students from the moment of their earliest encounter with the college. In other words: Engage early. Engage often." (http://www.ccsse.org.survey/nr_closing.html. Accessed May 2004)
This advice to college administrators given by officials at the CCSSE organization is especially
applicable to GED completers who begin their postsecondary education at community colleges. Indeed, the BPS:1996/98 survey yielded data which revealed that approximately 42.9 percent of the GED cohort that first enrolled at public 2-year institutions had departed college life before the end of their fifth month following matriculation. This rate of premature departure was significantly higher than what was experienced by its counterpart BPS cohort of high school graduates. In light of this very high drop out rate that GED completers witnessed happening among their peers, the advice given to college administrators by officials at the CCSSE --specifically, "Engage early [and] Engage often"--may be especially applicable with respect to that segment of GED enrollees who voluntarily select to abandon their postsecondary educations soon after being enrolled.
Researchers who conduct qualitative research express their opinions on the findings quite freely. But researchers who undertake quantitative investigations restrain themselves from such discussions, preferring instead to silence their own voice so as to allow the reader to draw his or her own conclusions from the findings. From the outset, I intended this research project to be quantitative in design; hence, I initially envisioned my dissertation as concluding with a statement that encouraged other people to conduct further research on this topic in the future. But some of the findings of this research were so significant as to warrant an exposition. Therefore, this paper concludes with three main recommendations.
My first recommendation is that the appropriate policymakers within the US Department of Education give consideration to re-thinking their earlier decision that resulted in the GED certificate being listed as one of seven risk factors that serves to negatively impact student persistence and degree attainment at the college level.
My second recommendation is that administrators at community colleges review their institution's existing student retention policies, looking closely at what their college has done to integrate GED completers into the campus environment.
My third recommendation is for community colleges to begin utilizing strategic factors for improving nontraditional student retention into their institutions. Based upon research, the institutions that have witnessed the most progress in lowering student attrition rates have been those that take an aggressive and proactive role in connecting newly enrolled freshmen with their institutions' campus life. Listed below for the reader's perusal is an outline of ideas that a few 2- and 4-year colleges have formulated in an effort to lower rates of negative attrition, as well as ideas that I believe are worthy of consideration by college administrators when they formulate new policies on this issue.
390
Proceedings of the 5th Annual National Symposium on Student Retention. Copyright 2009. C-IDEA, The University of Oklahoma.
Five Factors for Improving Nontraditional Student Retention
“Embarrassment, disappointment, and desolation can be felt by a student who has failed to meet the academic requirements of his or her institution. Imagine experiencing all of these emotions and not
knowing how to get back on track.”- Christie Cruise
The Fondness Factor Make the students "fall in love" with your college.
1. Communicate to the nontraditional GED student that he or she is being inducted into an elite
organization that truly cares about the welfare of its members--an organization always there to lift up any member who stumbles and falls.
2. A caring relationship is often evidenced by some kind of outward sign or symbol, such as an engagement ring. Hence, the college must give its GED or nontraditional students some kind of physical evidence that bears witness to their relationship with the college (e.g., lapel pins, necklaces, t-shirts, etc.).
3. Constructively critique the nontraditional students' academic performance with "caring," i.e., pointing out deficiencies needs improvement as helpful "coaches," not as uncaring "critics." Create opportunities for students to connect with each other--both inside and outside of the classroom environment--for support. Examples of this include support groups and student clubs created by the students themselves. Involve students to help recruit one another to be a part of such groups.
Examples: Administrators at Del Mar College of Texas conducted a survey that indicated two
important reasons why students enrolled at that particular college were achievement of "personal improvement" and "meeting interesting people." This college concluded that, inasmuch as the campus social environment was important to enrolled students, there needed to be friendly personal interactions between the students and the institution. The college thereafter adopted several retention strategies based on these two survey findings.
A study undertaken by Raymond Padella and Jesus Trevino (1997) examined the characteristics
of minority students who persist in their college studies to attain a formal award. Rather than focusing on why students prematurely leave college, they instead looked at what actions minority students took in order to graduate from college. This study found that successful minority students built their own peer support groups by creating or joining clubs. An earlier study conducted by Brent Mallinckrodt (1988) found that African-American students who belonged to groups which provided strong peer support and survival skills to its membership were much more likely to successfully adjust to the college environment than students who were lacking that kind of support. The Functional Factor
The word "functionalism" refers to the practice of adapting method, form, and materials, etc., primarily with regard to the purpose at hand. The function of a "student" is to "study." Hence, the college must encourage its students to effectively and efficiently perform this function. Some ways this might be done are:
1. Offer "Study Skills" seminars that provide students with tips on note-taking, test-taking, etc. However, in order for such seminars to be thought of as productive, students must be given opportunity to interact and "teach" on the topic. A purely lecture-driven format is often non-
391
Proceedings of the 5th Annual National Symposium on Student Retention. Copyright 2009. C-IDEA, The University of Oklahoma.
engaging and irrelevant to the students' lives. Therefore, instructors need to teach according to a "hands-on" constructivist-type model in order for students to learn and retain the necessary information.
2. Offer a type of "Cliff Notes Subject Review" seminars wherein an instructor overviews key ideas in certain subjects and provides written study notes. For GED students enrolled in remedial classes, provide required "comment cards" to be submitted to the instructor at the end of each class that state what the student has learned and what they are most confused about. The instructors can use this information to help students during the next class.
3. Create opportunities for the GED students to serve the college in some way that is important. For example, appoint them to taskforces and committees that explore reasons why students drop out of college and make recommendations to administrators as to how those dropouts can be brought back to the college.
4. Register GED students together in a block of classes. By making GED students a cohort in and of themselves, those taking two or more classes together can form study teams.
5. Tap into students' "multiple intelligences." According to Howard Gardner, author of the multiple intelligences theory, there are eight multiple intelligences that encompass the adult learner (Brualdi, 1996). These intelligences--musical, bodily-kinesthetic, spatial, environmental, linguistic, mathematical-logistical, intrapersonal, and interpersonal--must all be taken into account before instructing and assigning tasks to adult GED learners. Allow the GED student to express him/herself in a myriad of ways when completing assignments or presenting new information to others, rather than via means of the "paper and pencil" approach. Assess student learning gains, based upon the multiple intelligences approach, by recognizing the individual potential of each student.
Examples: Seattle Central Community College in the state of Washington implemented a "Coordinated Studies Program" wherein enrollees take courses together, then meet together three times a week for 4 to 6 hours to discuss what they learned. Vincent Tinto reported that students who participated in this program were retained at a rate approximately 25 percent higher than non-participating students (Tinto, 1998).
In her paper entitled "The Challenge of Learning Communities as a Growing National Movement," Barbara Leigh Smith (2001), Co-Director of the National Learning Communities Project based at Evergreen State College (WA), infers that if frustrated students on the brink of dropping out of college ask themselves the question "education for what?" the institutions must have retention strategies that assist those students in answering that question. The Freedom to Fail Factor
Teddy Roosevelt said, "Show me a person who has never made a mistake, and I'll show you a person who has never done anything."
1. Communicate the idea that most successful people experience a number of failures along their journey toward success, as well as make a lot of mistakes. Indeed, it is imperative for GED students to understand that failure is not an ignoble thing, provided that it is used as a learning tool to further the student's knowledge of what to do…and what not to do.
2. Use GED completers who are in their second year (sophomores) as mentors for the freshmen cohort of GED completers.
3. Squash stereo-typed status barriers (e.g., GED graduates are "academically inferior" to high school graduates): Provide examples of GED graduates who achieved national prominence, such as Peter Jennings, Bill Cosby, Senator Ben Nighthorse Campbell of Colorado, and so forth.
392
Proceedings of the 5th Annual National Symposium on Student Retention. Copyright 2009. C-IDEA, The University of Oklahoma.
In his speech entitled "Learning Communities: Building Gateways to Student Success," Vincent
Tinto (1998) made the following observation:
"For some students, especially those who in the past had struggled in school, the collaborative environment of the learning community provided a safe place, a smaller knowable place of belonging, in which they were valued and in which they discovered they could learn. As one student put it 'You realize you know something, like you're not dumb'."
The Friendship Factor
Develop multiple lines of communication between faculty and students, as well as between the cohorts of students of differing years.
1. Strive to create a sharing, cooperative partnership--a team environment that celebrates development and growth not only for the students, but also for the college and its faculty.
2. If a student does not register for an upcoming term, send a letter, telling the student that he or she is missed. Follow-up with a telephone call, asking if the student will be reenrolling the following term.
Examples: St. Louis Community College has a policy of sending letters to all non-returning students encouraging them to return to college. The first letter sent tells the students that they are missed; a follow-up letter is sent reminding them of the registration deadline for the upcoming semester. Administrators at St. Louis Community College found that the return rate of students who received these letters was significantly higher than students who dropped out of college but were never contacted (NVCC, 2003).
The Fun Factor
Capture the hearts of the students by making it fun and exciting to be on campus; breathe life into the students' learning experience.
1. There is an old axiom that says, "What is good for the goose is good for the gander." If we suppose that there is truth in this ancient saying, then when students have fun on campus, the faculty is also having fun; and, when everyone is having fun, then the campus environment takes on an exciting new life of its own.
2. Creating a fun environment involves not only community college faculty, but administration, staff, counseling personnel, financial aid, admissions, etc…
Illustration #3: Successful Students Graduating
393
Proceedings of the 5th Annual National Symposium on Student Retention. Copyright 2009. C-IDEA, The University of Oklahoma.
Conclusions
Prior to the Department of Education's BPS 1996-2001 longitudinal survey, virtually all research concerning attrition rates of nontraditional students who began their postsecondary educations at community colleges was conducted on a "micro" scale that involved just one or two institutions--not on a "macro" (i.e., national) level. Therefore, the significance of this study is based on the fact that it is the first research project to collate data collected on a national level that compares the attrition rates of GED diploma holders and regular high school graduates matriculated at public community colleges.
The findings presented in this paper also clearly outline our nation's most recent attrition problem with regard to GED diploma holders and regular high school graduates at community colleges; that is, 52.6% HS dropout rate versus 54.8% GED dropout rate. The fact that roughly one out of every two enrollees at public community colleges select to not continue their postsecondary educations at a community college for the second academic year is a matter of great budgetary significance. Of course, some of that attrition is "positive," that is, being attributable to completion of one-year technical programs, transfers to 4-year institutions, or fulfillment of personal goals. On the other hand, the bulk of that attrition is "negative," that is, being a loss of student body through a "dropout" decision. Thus, a rough estimate of the annual monetary loss to community colleges during the 2005-06 academic year resulting from students prematurely ending their postsecondary educations calculates to be in excess of $350 million in lost tuition revenues. As such, the above research findings presented in this paper conclusively attest to the following: (1) GED students who persist after one year of postsecondary studies are as academically capable and successful as their counterpart equivalent, high school diploma holders; (2) unless community college officials take proactive approaches to retaining GED students at the outset of their first term of college, it is likely that half will drop out shortly after being matriculated, thus resulting in the loss of hundreds of millions of dollars in tuition revenues; and (3) by proactively implementing all five factors of retention, community colleges will create a means to retain and successfully matriculate GED and other nontraditional students into the campus environment. It is my recommendation that the findings contained within this study be given serious consideration by the decision-makers at community colleges who are empowered with authority to formulate institutional policies on student retention. It may be said that most community college institutions already utilize one or two of the above main five factors; however, the possibilities for retaining nontraditional students becomes greatly enhanced when all five factors are put into place and working conjointly together. In the final analysis, the bottom line message for community college personnel is this: Connect Right Away, Everyday, and Without Delay! In so doing, student lives will be positively changed and impacted for the betterment of society and communities at large.
394
Proceedings of the 5th Annual National Symposium on Student Retention. Copyright 2009. C-IDEA, The University of Oklahoma.
References
AACC Fast Facts (2003). American Association of Community Colleges, National Council of Higher Education: Washington, DC. Retrieved February 2, 2004, from: http://www.aacc.nche.edu/content/NavigationMenu/aboutcommunitycolleges /Fast_Facts1Fast_Facts.html.
ACE Fast Facts (2003). Table 3. Retrieved February 4, 2004, from: http://www.acenet.edu/ca. Berkner, L., Horn, L., & Clune, M. (2000). Descriptive summary of 1995-96 beginning
postsecondary students: Three years later; With an essay on students who started at less than 4-year institutions. (NCES 2002-171). Washington, D.C.: NCES, U.S. Dept. of Ed.
Brualdi, Amy C. (September, 1996). Multiple Intelligences: Gardner's Theory. ERIC
Clearinghouse on Assessment and Evaluation. Washington DC. ERIC Document Number: ED410226. Retrieved May 17, 2004, from: http://www.ericfacility.net/ericdigests/ed410226.html. Community College Survey of Student Engagement (2004). Retention Initiative. Retrieved May 10, 2004, from: http://www.ccsse.org/retention/retention.html GED Testing Service (2002). Who took the GED? GED 2001 statistical report.
Washington, D.C.: American Council on Education. (Table 11 and 2. Trends in GED Testing, 1949-2001) Manzo, K.K., et. al. (April 2002). General Educational Difficulties. Community College
Week. Retrieved September, 2003, from: http://search.epnet.com/direct.asp?an=6500689&db=f5h National Center for Education Statistics. (June, 2003). Community college students:
Goals, academic preparation, and outcomes. Washington, DC: U.S. Department of Education. NCES 2003-164.
National Center for Education Statistics. (July 2002). Beginning Postsecondary Students
Longitudinal Study: 1996-2001 (BPS: 1996/2001) Methodology Report. Technical Report. Washington, DC: U.S. Department of Education. NCES 2002-171.
NCES Fast Facts (2002). Washington, D.C.: National Center for Statistics, U.S. Department of Education. (NCES 96-155). Retrieved April 19, 2004, from: http://nces.ed.gov/fastfacts/ Soltz, D.F. (1996). The achievements of community college students with GED certificates: A longitudinal perspective. Community College Journal of Research and Practice, 20, 269-276. Tinto, V. "Learning communities: Building gateways to student success." Online speech. Retrieved May 10, 2004, from: http://soeweb.syr.edu/hed/tintospeech.html. Osei, M.A. (2002). GED diploma graduates performance, persistence, and attrition in four-year postsecondary education institutions. [W&M University, 2002]. UMI Number: 3029881
395
Proceedings of the 5th Annual National Symposium on Student Retention. Copyright 2009. C-IDEA, The University of Oklahoma.
Progress toward Graduation: The 30-60-90 Student Success Roadmap
Continuous Improvement University of Minnesota Twin Cities
[email protected] Abstract: Data-driven strategic planning within an environment that fosters creativity supplied the foundation for the University of Minnesota Duluth’s 30-60-90 Student Success Roadmap. Drawn from the campus’ strategic plan for improved retention and graduation rates, the Roadmap engages all students in monitoring their progress to graduation, delineates student on-track versus off-track status, provides benchmarks for data collection and analysis, and clarifies areas for process improvement. While results are still preliminary, the project’s stakeholder plan combined with a comprehensive communication plan have engaged stakeholders - students, faculty, staff, administrators, and parents - in supporting student success. Introduction
Senior Vice President for Enrollment Management and Marketing at DePaul University, David
Kalsbeek, stated that “institutions typically fail in their efforts to improve rates of degree completion because they focus more on persistence than progress and fail to develop processes which are centered on communicating to students (and to faculty, advisors, and staff) the importance of timely, successful progress towards degree completion and helping them be planful in degree planning.” He congratulated the University of Minnesota Duluth (UMD) on its approach and development of the ’30-60-90 Roadmap’ and deemed it a “perfect illustration of how to approach student retention strategically” (personal communication, October 1, 2008).
UMD’s story of how it arrived at the 30-60-90 Student Success Roadmap is a journey in which significant institutional learning took place around strategy-driven organizational change. This article describes UMD’s strategic approach to improving graduation rates and the innovative thinking that resulted in development of the 30-60-90 Student Success Roadmap. Background
UMD, a comprehensive regional university, enrolls approximately 9,200 undergraduate students
and offers thirteen baccalaureate degrees in seventy-seven fields. Students are admitted to UMD on a moderately selective basis using high school rank, ACT/SAT scores, and academic preparation. Between the years 2000 and 2005, UMD’s first-year retention rate averaged 78%. Based on the fall 2000 freshman cohort, UMD’s four year graduate rate is 26%, five year graduate rate is 50.8% and six year graduate rate is 57%. In 2006 the University of Minnesota’s (UM) Board of Regents set ambitious goals for UMD to improve its graduation rates by the year 2012 to 40% at four years, 60% at five years and 65% at six years. Despite previous task force recommendations for improving graduation rates in 1986,
396
Proceedings of the 5th Annual National Symposium on Student Retention. Copyright 2009. C-IDEA, The University of Oklahoma.
1997, and 2004, UMD’s retention and graduation rates had remained relatively unchanged for the previous twenty years. Coupled with new graduation rate goals, a change in high school demographics necessitated closer scrutiny of UMD’s student retention efforts. According to the Minnesota Office of Higher Education, the number of Minnesota high school graduates is projected to begin to decline in 2010, with an overall reduction of 10 percent by 2015 (2006). As a result, Minnesota higher education institutions are anticipating a similar decline in qualified applicants leading UMD to look to improved retention as one way to maintain current enrollment levels.
In response to the Regents’ new graduation goals and the changing high school demographics, UMD Chancellor Kathryn A. Martin appointed a working team to identify actions UMD should take to improve its retention and graduation rates. As a result of her charge, the Student Success Work Team (SSW) was created in May 2006. The six-member SSW team was cross-functional, representing UMD administration, student affairs, academics, and student support services. A coach from the UM’s Office of Service and Continuous Improvement, who is knowledgeable in organizational strategy, change and continuous improvement methodologies, helped guide the team throughout its activities. The team and coach met every 2–3 weeks between May and September 2006. During this time, the team conducted a review of the literature, studied best practices, gathered survey data and collected many ideas from students, faculty and staff on what UMD should do to improve its retention and graduation rates.
The team used continuous improvement tools to slow the process to define, measure, and analyze issues before recommending and taking a plan to action. One step in particular, creation of a campus-wide goal tree, caused the team to slow down and to deliberate the ideal representation of its findings. Creating priorities aligned with traditional organizational departments, i.e. aligned with current campus divisions and departments, was problematic in that it directed the team’s thinking to existing services and processes. One member of the team proposed a new schema for naming priorities through “core process areas” based on extensive examination of the literature. Her presentation of the core process areas – Fit, Financial, Learning, Support, and Culture - to the SSW team provided an “aha” moment for the team. There was not only unanimous approval from the team, but there was a sense of relief because the newly identified process areas would not limit priorities or solutions. Using the structure of the core process areas, the team created the UMD Strategy Map for Improving Student Success (Strategy Map) (Figure 1). After an intensive time of campus presentations and discussions that were intentionally guided by the team’s stakeholder plan and communication plan, the SSW team completed its work with a detailed set of recommendations on how to operationalize the Strategy Map. The Strategy Map provided the campus with a single visual picture of the many variables impacting student success and allowed for the many strategic cause-and-effect relationships to be effectively outlined and debated.
Beginning in the spring of 2007, campus-wide retention efforts using the Strategy Map were coordinated by two half-time positions. Both individuals had served as members of the SSW team. The scope of activities for the coordinators spanned the entire campus community. This was in accordance with reports in the literature that schools with higher than expected graduation rates all had a campus culture of shared responsibility for student success across the entire campus (AASCU, 2005). Significant activities during this phase included project-based training in continuous improvement strategies, department initiated student success projects, and implementation of a campus-wide communication plan.
Foundational Research
Favorable reception of the Strategy Map was supported through the research conducted by SSW.
Each of the core process areas, Fit, Financial, Learning, Support and Culture, are firmly grounded in research and continue to be primary reference points in campus-wide efforts to improve retention and graduation rates.
397
Proceedings of the 5th Annual National Symposium on Student Retention. Copyright 2009. C-IDEA, The University of Oklahoma.
Figure 1. Overview of UMD Strategy Map for Improving Student Success
5 Core Process Areas:
1. Fit – Interests and educational goals of students are aligned with UMD, its programs, and regional setting
2. Financial – Students have access to sufficient resources and knowledge to plan for and invest in their education
3. Learning – Students are engaged in challenging learning activities leading to timely degree completion
4. Support – Students are connected to a strong network of caring faculty, staff, and students
5. Culture – Students, faculty, and staff are valued participants in, and contributors to a diverse and inclusive community that is educationally purposeful.
Within the Strategy Map, each of the five core process areas is expanded with three strategic planning categories.
Core Process Area: five campus goals for improved student success
Strategic Priorities: identify key findings from surveys, reports, and literature
Opportunities for Action: highlight the best practices specific to each strategic priority
Initiatives for Action: identify projects currently underway or completed
UMD’s first core process area, Fit, is defined as how the interests and educational goals of students are aligned with UMD, its programs and regional setting. While Fit is clearly important as students enter an institution, Fit remains critical as students travel through their college experience. Commitment to attainment of a bachelor’s degree from the institution, academic preparation for college-level course work, and achieved social integration are key elements of Fit during the first year. Students’ attitude about attachment to the institution is essential for retention (Bean, 2005). Graunke, Woosley, and Helms found that first-year students with a high institutional commitment and a clear educational goal were more likely to graduate within six years (2006). Conversely, low educational goals have been found to have the strongest negative effect on student retention in the first year (Nora, Barlow, & Crisp, 2005). In a UMD survey of non-enrolled students conducted in 2006, UMD students cited a mismatch between themselves and the institution, either its programs or its culture, as a factor in their decision to leave. Intellectual competency and academic self-confidence have been shown to have a strong relationship with college retention (Lotkowski, Robbins, and Noeth, 2004). Data collected by the American College Testing (ACT) shows that institutional persistence rates from freshman to sophomore year are directly related to the academic selectivity of the institution (Mortenson, 2005). “Students with the most successful academic records in high school are also most likely to be academically successful in college. And colleges that enroll these students are more likely to have higher persistence rates than do other colleges that are less academically selective in their admissions,” (Bean, 2005, p. 39). Identification of students not achieving academic or social fit must occur as early as possible. Issues related to Fit are also prevalent during the sophomore year and beyond as students often lack a sense of purpose, experience uncertainty about major and career plans and encounter dissatisfaction with the experience at the university or in their personal relationships (Finning, 2008).
Financial, defined as whether students have access to sufficient resources and knowledge to plan for and invest in their education, is UMD’s second core process area. In numerous studies cited by Braxton and Hirchy, it is documented that “a student’s ability to pay and the student’s perceptions of the costs of his or her education influence persistence” (2005, p. 62). Finances play a major role in student withdrawal decisions, especially in the second and third years. Research indicates that students are significantly more likely to persist between the second and third years if they receive financial aid, (Nora, Barlow, & Crisp, 2005). Moreover, the amount and kind of money students have access to also matters to
398
Proceedings of the 5th Annual National Symposium on Student Retention. Copyright 2009. C-IDEA, The University of Oklahoma.
student success. Too little money can make it impossible for students to pay for their college education, while too great a loan debt can hinder student persistence (Kuh, Kinzie, Buckley, Bridges, & Hayek, 2007). Respondents to UMD’s 2006 non-enrolled survey, cited financial issues most often as a factor in their decision to leave UMD and 35% of respondents reported receiving no financial help from their family. The third core process area, Learning, examines student engagement in challenging learning activities leading to timely degree completion. This process area includes both students’ perceptions of their learning as well as their actual learning achievements. Student learning is the root of student persistence. As stated by Tinto, “students who learn, are students who stay,” (1999, p. 6). Tinto continues, “Students who find support for their learning, receive frequent feedback about their learning and are actively involved in learning, especially with others, are more likely to learn and in turn more likely to stay” (p. 6). Similarly, student attitude and perceptions about being a student are also important for retention. Bean discusses the connection between students’ belief in their ability to survive and adapt in an academic environment and the self-confidence that leads to achievement of academic success and degree completion (2005). In other words, successful learning leads to more successful learning. The types of learning opportunities provided are also critical. Numerous studies describe the merits of reforming the college learning environment to shift the emphasis from faculty teaching to student learning (Kuh, et al., 2007). Positive outcomes of such a shift include setting higher expectations for students, raising academic standards, and increasing student responsibility for their learning. This final item, student responsibility, is often associated with time on task. It is widely acknowledged that students are not spending enough time studying (Tinto, 2005). Tinto states that this is partly “because we do not expect enough of them or construct educational settings that required them to study enough,” (Tinto, 2005, p. 321). Support, defined as students are connected to a strong network of caring faculty, staff, and students, is UMD’s fourth core process area. Bean suggests that successful institutions engage students in support activities that move them from an external to an internal locus of control (2005). Well formed first-year experience programs are one way to achieve this. Numerous studies point to the positive outcomes of coherent first-year experience programs, which include pre-college and ongoing orientation programs, first-year seminars, and other new student advising and study group experiences (Kuh et al., 2007). Institutions that provide the most comprehensive orientation and advising programs report higher graduation rates. Additional evidence points to the need to design further support during the sophomore year. Specifically designed learning environments that provide opportunities for self-exploration and reflection, resources supporting academic and career needs, and opportunities to enhance and establish social and academic connections are noted successful sophomore interventions (Finning, 2008). UMD’s final core process area, Culture, is defined as students, faculty, and staff are valued participants in and contributors to a diverse and inclusive community that is educationally purposeful. The commitment of the campus community to the success of all students, the physical environment of the campus, and the social integration of students are key elements of Culture. A study of twelve public four-year colleges and universities with higher than expected retention and graduation rates showed that these schools did not have a direct focus on retention or graduation rates but that their higher rates were a byproduct of creating a high quality learning environment and a campus culture committed to supporting students (AASCU, 2005). A campus culture that emphasizes shared responsibility for student success was also prevalent amongst these institutions. Kuh et al. (2007) agree that effective partnerships among faculty and student affairs professionals are essential to creating a campus culture that supports student success. This shared commitment to student success can be evidenced through reward systems aligned with enhancing the student experience. Tinto notes that “unless the education and retention of students is rewarded, in particular through promotion and tenure systems, many faculty will only give it lip service” (2006, p. 9). The importance of faculty-student contact is evidenced in the retention literature (Kuh et al., 2007) and, thus, faculty commitment evidenced through action is essential to this effort. Beyond the people that make up the institution’s community, a strong sense of place also contributes to a campus environment that creates meaningful experiences and memories and, thus, promotes persistence (Kuh et
399
Proceedings of the 5th Annual National Symposium on Student Retention. Copyright 2009. C-IDEA, The University of Oklahoma.
al., 2007). Likewise, the campus environment can significantly impact opportunities for social connections. Students’ social integration represented by cohesion in the peer environment and participation in college-sponsored activities positively influence completion of a bachelor’s degree (Pascarella and Terenzini, 1991). Kuh et al. (2007) state that connection to a social group that is achievement oriented and engagement in activities that develop skills and competencies further influence persistence. Making these experiences available and welcoming to all students is critical. Wathington states, “Gaps in achievement relate directly to disparate student experiences on college campuses. Minority students’ expressions of alienation, exclusion, and discrimination on predominately white campuses remain an issue,” (2005, p.190). Incorporating many of the elements already discussed, student satisfaction with the institution is an important variable in determining the overall quality of the student experience. “Satisfaction represents a sense that the student feels he or she belongs at, and is loyal to, the institution and is highly correlated with engagement, persistence, and academic performance” (Kuh, et al., 2007, p. 60). The core process areas of Fit, Financial, Learning, Support, and Culture are the pillars of UMD’s effort to improve student success. The elements of this framework should not be viewed as isolated components but as fundamentally linked. The five core process areas are tied to each other and, thus, consideration must be given to all areas. For instance, increased student engagement (Learning) will reap the greatest benefits if students are enrolled in courses that match their academic interests and abilities (Fit) and financial resources make it possible for all students to afford course tuition (Financial). Likewise, all campus departments are linked within the common goal of supporting a successful student experience. The responsibility for improved retention and graduation rates does not reside within any one unit or series of departments. The entire UMD campus community and every individual within our community contribute to the success of our students and the achievement of institutional learning outcomes. Collaboration and cooperation across units and individuals are fundamental to the success of this initiative. 30-60-90 Student Success Roadmap
UMD’s Strategy Map details the core process areas, strategic priorities and new initiatives to
improve student retention and graduate rates and allows administration to clearly see both progress being made as well as gaps within those efforts. While the Strategy Map is the foundation to meeting campus graduation goals, as a nineteen page document it is not captivating to all stakeholders. Students, faculty, staff, and parents require a more succinct and personal way to engage in monitoring student progress toward graduation.
As the two campus retention coordinators began to conceptualize how to communicate the primary concepts of the Strategy Map to all stakeholders, they played with the concept related by Kuh and associates in Student Success in College (2005) - that of drawing a path to student success. This concept, along with a UM report plotting students along the 0 to 120+ credit continuum led the coordinators to consider what a map for student success at UMD would look like. To complete this exercise, they revisited the research conducted during development of the Strategy Map. An initial first step was to plot the strategic priorities of the Strategy Map, which encapsulated the key findings from the literature, along the credit continuum. The items were fine-tuned and the overall concept revised numerous times in order to deliver the desired outcome – a one page document providing a clear pathway to a successful student experience at UMD (Figure 2).
The UMD 30-60-90 Student Success Roadmap (30-60-90 Roadmap; Roadmap) delineates student on-track versus off-track status and provides for data collection and ongoing process improvement. The 30 (sophomore status), 60 (junior status), and 90 (senior status) credit benchmarks are one set of measures of student progress to degree completion. However, the Roadmap is about more than the accumulation of credits. It also highlights successful student behaviors and experiences that lead to a more satisfying college experience. A student-friendly version of the Roadmap was also developed in order to share the
400
Proceedings of the 5th Annual National Symposium on Student Retention. Copyright 2009. C-IDEA, The University of Oklahoma.
significant strategic priorities of the Strategy Map with students, faculty, staff, and parents in a less scholarly tone.
Since the metrics for many of the benchmarks listed on the Roadmap are clearly measurable, reports are being generated from a central database showing students on and off track. The reports serve as dashboards indicating where students are succeeding and where additional assistance is needed. It serves both as a means of identifying models of success and indicators for intervention. On an individual basis, the benchmarks are also conversational. An advisor can easily reference the Roadmap and ask a first-year student how many close friendships she has established or whether she has completed the first two years of her graduation plan and, in follow up, provide the necessary support based on the student’s responses.
Figure 2. UMD 30-60-90 Student Success Roadmap
ongo
ing
benc
hmar
ks
Acceptance and implementation of the Roadmap has taken place on three primary fronts. First, the collegiate associate deans were drawn upon for early feedback on the Roadmap and were ultimately asked to approve the benchmarks listed. The retention coordinators meet monthly with the associate deans. Second, both the Strategy Map and an early version of the Roadmap were presented to the collegiate deans and academic department heads at a breakfast hosted by the chancellor. This signified administrative support and invited feedback from key stakeholders. A follow up breakfast was recently held with this same group to provide updates on the project. Third, a cross-functional team was formed in summer 2008 to devise and implement a communication plan for the Roadmap. As a result, the Roadmap has been presented to all freshmen. The team has developed additional communications for off-track students, i.e. students not meeting particular benchmarks, as well as to reinforce the positive behaviors of all students. All academic advisors have also been introduced to the Roadmap and workshops for parents were held during Parent & Family Weekend. The Roadmap website receives nearly two-thousand hits each month.
Additional ways to engage students with the Roadmap are being sought. In fall semester 2009, freshmen enrolled in UMD’s one-credit orientation course will participate in a series of self-assessments asking them to rate their status on key first-semester benchmarks, such as time on task, social connections, and academic performance. Results will be shared with the course instructor and appropriate
401
Proceedings of the 5th Annual National Symposium on Student Retention. Copyright 2009. C-IDEA, The University of Oklahoma.
interventions made. The goal is not only to address student needs on a timely basis but to also engage students in monitoring their own progress on benchmarks contributing to a successful experience.
The 30-60-90 Roadmap is intended to communicate consistent expectations to students, to guide student actions, to facilitate discussions between academic advisors and students, and to reinforce the important role each member of our community plays in promoting student success. While we believe each student is the primary architect of his/her college experience, faculty and staff are responsible for engaging students in curricular and co-curricular activities and for reinforcing the positive student behaviors that contribute to a successful educational experience. The Roadmap provides a clearly marked route to a successful college experience at the University of Minnesota Duluth. Reflections
During his plenary address at the 2008 CSRDE National Symposium on Student Retention
(September 20, 2008), David Kalsbeek described what he terms The 4 Ps of Student Retention. While Dr. Kalsbeek’s presentation was a bit surprising to some in attendance, for UMD’s retention coordinator who was present it confirmed the strategic approach our campus has taken to improve graduation rates. Among his comments, Dr. Kalsbeek called on institutions to move away from a focus on persistence and, if degree attainment is the goal, to focus on progress and to concentrate on those processes and policies that help or hinder the majority of students in that progress. He stated, “A comprehensive model adopts a more systemic perspective which focuses attention on high-risk processes more than at-risk persons.” UMD’s 30-60-90 Roadmap provides a clear example of such a model.
UMD’s strategic approach came about partly due to a campus culture that embraces continuous improvement strategies. Creative thinking, which led to development of the 30-60-90 Roadmap, was encouraged and celebrated. UMD’s chancellor was a significant contributor to this success. She raised the level of discourse, insisting that progress to plan would be monitored by the vice chancellors and deans quarterly. Ownership of the Strategy Map was thereby transferred to the entire campus community and acceptance of the Roadmap was made easier.
Support from the Office of Service and Continuous Improvement was essential to a strategic initiative such as this. Training and coaching in strategic thinking and data-driven process improvement skills have allowed staff and administrators to feel more comfortable not immediately knowing the solution to complex questions. Use of these strategy, change and performance improvement tools are becoming more commonplace across UMD, thereby increasing the likelihood other problems will be addressed in similar strategy-driven ways.
Initial results, albeit preliminary, show a 3.9% increase in freshman retention rates from 2007 to 2008. Projections suggest that if this modest increase is sustained along with an increased emphasis on student progress to degree completion, UMD is on target to meet graduation rate goals set by University Regents. Furthermore, if freshman admissions dip in accordance with Minnesota high school graduation estimates, the sustained improvement in retention has the potential to maintain campus enrollment near current levels.
Finally, it won’t be known for a few years whether the Strategy Map and the 30-60-90 Roadmap facilitate achievement of UMD’s long-term graduation rate goals. However, we are confident in the research and the collaborative efforts that led to creation and campus adoption of both of these documents. The strategy-driven Roadmap will continue to evolve as will the Strategy Map. Data collection and operational measures are still a work in progress and will continue to develop as the needs of our students and our campus are refined. Instead of focusing strictly on solutions, our emphasis is on a measurable strategic process that allows for different solutions at different points in time. This is a formula for innovative and continuous improvement of student success that is working at UMD.
402
Proceedings of the 5th Annual National Symposium on Student Retention. Copyright 2009. C-IDEA, The University of Oklahoma.
References
American Association of State Colleges and Universities (2005). Student success in state colleges and universities: A matter of culture and leadership. Retrieved June 2006 from http://www.calpoly.edu/~acadsen/documents/AASCU-GRO_Report_093005.pdf.
Bean, J. P. (2005). Nine themes of college student retention. In A. Seidman (Ed.), College student retention:
Formula for student success (215-243). Westport, CT: Praeger Publishers. Braxton, J. M. & Hirschy, A. S. (2005). Theoretical developments in the study of college student departure. In A.
Seidman (Ed.), College student retention: Formula for student success (61-87). Westport, CT: Praeger Publishers.
Finning, S. (2008). Presentation at NASULGC Annual Meeting 2008: Clemson University Sophomore Year
Experience. [PowerPoint slides]. Retrieved December 2008 from http://www.aplu.org/NetCommunity/Page.aspx?pid=1105&srcid=183.
Graunke, S. S., Woosley, S. A., & Helms, L. L. (2006). How do their initial goals impact students’ chances to
graduate? An exploration of three types of commitment. The Journal of the National Academic Advising Association, 26, 13-18.
Kuh, G. D., Kinzie, J., Buckley, J. A., Bridges, B. K., & Hayek, J. C. (2007). Piecing together the student success
puzzle: Research, propositions, and recommendations. ASHE Higher Education Report, 32 (5). Washington, DC: Association for the Study of Higher Education.
Kuh, G. D., Kinzie, J., Schuh, J. H., & Whitt, E. J. (2005). Student success in college: Creating conditions that matter. San Francisco: Jossey-Bass.
Lotkowski, V. A., Robbins, S. B., & Noeth, R. J. (2004). The role of academic and non-academic factors in
improving college retention. ACT Policy Report. Retrieved June 2006 from http://www.act.org/research/policymakers/reports/index.html.
Minnesota Office of Higher Education (2006). Minnesota high school graduates will peak in 2009. Retrieved April
2009 from http://www.ohe.state.mn.us/pdf/Enrollment/INSIGHT/InsightApr06.htm. Mortenson, T. G. (2005). Measurements of persistence. In A. Seidman (Ed.), College student retention: Formula
for student success (31-60). Westport, CT: Praeger Publishers. Nora, A., Barlow, E., & Crisp, G. (2005). Student persistence and degree attainment beyond the first year of
college: The need for research. In A. Seidman (Ed.), College student retention: Formula for student success (129-153). Westport, CT: Praeger Publishers.
Pascarella, E. T., & Terenzini, P. T. (1991). How college affects students: Findings and insights from twenty years
of research. San Francisco: Jossey-Bass. Tinto, V. (1999). Taking retention seriously: Rethinking the first year of college. The Journal of the National
Academic Advising Association, 19, 5-9. Tinto, V. (2005). Epilogue: Moving from theory to action. In A. Seidman (Ed.), College student retention:
Formula for student success (317-333). Westport, CT: Praeger Publishers. Tinto, V. (2006). Research and practice of student retention: What next? Journal of College Student Retention
Research, Theory & Practice, 8 (1), 1-19. Wathington, H. D. (2005). Talking the talk: Rhetoric and reality for students of color. In R. Hersh & J. Merrow
(Eds.), Declining by degrees: Higher education at risk (185-193). New York: Palgrave MacMillan.
403
Proceedings of the 5th Annual National Symposium on Student Retention. Copyright 2009. C-IDEA, The University of Oklahoma.
Life-Health Sciences Internships: Research and Professional Experience Internships as an Undergraduate Retention Tool
Abstract - The Life-Health Sciences Internships program was created to improve retention and graduation rates in undergraduates at Indiana University-Purdue University Indianapolis (IUPUI). In this program students participate in research and professional experience internships under the mentorship of faculty and staff in the campus’ graduate and professional schools. These experiences were designed to engage students in research and professional experiences, improve retention, encourage persistence to graduation, and lead to enrollment in graduate or professional programs. Student internship and academic progress were tracked through entrance and exit interview questionnaires, grade monitoring, enrollment, graduation, and professional school placement. There have been 83 participants since January 2007. To date, 77 students have completed the full year of the internship. Five of the 77 transferred to professional programs at other universities and fifteen have graduated. Eleven of the graduates have applied or were accepted to graduate or professional programs on the IUPUI campus. At the end of the first two years of the program, 93.5% of participants are remaining enrolled at IUPUI or have graduated. All participants who left the university prior to graduation are enrolled in professional programs at other universities.
Introduction
Life-Health Sciences Internships (LHSI) is an experiential education program for sophomores and juniors interested in careers in life and health sciences disciplines at Indiana University-Purdue University Indianapolis (IUPUI). Approximately 50 undergraduate students per academic year work with faculty and staff mentors for up to ten hours per week in units associated with the university’s graduate and professional programs and nearby hospitals. Most of the participants engage in some research activities for at least part of the experience and all are actively engaged in meaningful work within the particular location. Monthly community-building events are held such as career workshops, panels with graduate and professional school information, and casual events to spend time with the other participants. At the end of the experience, participants present posters to the campus community. The goal is to encourage learning and a sense of connectedness to campus, increase retention in participants, and lead to graduation and enrollment in graduate or professional programs. This is accomplished by engaging participants in relevant, on-campus employment experiences that provide them with the necessary skills to continue on the path to graduate or professional school and a career in life and health sciences fields. Each participant is eligible for one year. At the end of the year participants may continue with the mentor under a different source of funding or find another research or internship opportunity. The University
IUPUI is “Indiana’s urban research and academic health sciences campus” with over 30,000 students enrolled (About IUPUI, 2009). It houses the only medical and dental schools in Indiana, producing 85 percent of the state’s dentists, 50 percent of the physicians, and over one third of the nurses. Most of the research on campus (94%) is related to life and health sciences, providing many opportunities for student involvement (IUPUI Office of Communications and Marketing, 2009). According to the Indiana Life Sciences Initiative, the Indiana University system awards 43 percent of health and life sciences degrees in the state (Indiana Life Sciences Initiative, 2009).
404
Proceedings of the 5th Annual National Symposium on Student Retention. Copyright 2009. C-IDEA, The University of Oklahoma.
The graduation rate for IUPUI is 31 percent and the fall-to-fall retention rates were 75 percent at all levels in 2006-2007. For students in LHSI, the School of Engineering and Technology and the School of Science are the most relevant school comparisons. The School of Engineering and Technology had an overall retention rate of 79 percent, with 74 percent retention in freshman/sophomore and 83 percent in junior/senior. The School of Science had a similar retention rate of 82 percent overall, with 73 percent retention in freshman/sophomore years and 85 percent in junior/senior years (Table 1). Freshman/Sophomore Junior/Senior All
IUPUI 66% 83% 75% School of Engineering and Technology 74% 82% 79%
Undergraduate Population LHSI is designed for sophomore and junior undergraduate students interested in careers in life and
health science disciplines. IUPUI has relevant undergraduate majors in Biology, Chemistry and Chemical Biology, and Psychology in the School of Science, and Biomedical Engineering in the School of Engineering and Technology. Undergraduates may also identify a pre-professional concentration in medicine, dentistry, physical therapy, occupational therapy, pharmacy, optometry, and veterinary medicine. Other students interested in life and health sciences careers, but outside these schools or majors (e.g. anthropology, physics, etc.), are also eligible if they have taken appropriate coursework for the internship they are seeking. Internship Locations
Internship locations are housed within the graduate and professional programs and related areas on or near campus. Participants work with faculty and professional staff in the School of Dentistry, School of Health and Rehabilitation Sciences, School of Medicine, and School of Nursing, as well as in the School of Optometry clinics, Clarian Health Pharmacy Department, and Methodist Hospital (Clarian Health) research laboratories. The Deans and leaders of these locations approved this partnership and agreed to provide internship experiences for IUPUI undergraduate students in this program. Internship experiences are varied; most interns participate in some sort of research for at least part of the time. Other activities include attending meetings, shadowing clinicians, and assisting with day to day work in the laboratory or department. Mentors strive to keep the experiences educational and productive with no more than an hour or two per week on routine busy work. Program Overview
The LHSI program runs during the two major semesters (fall and spring) of the academic year. LHSI participants apply and interview at the end of the prior spring semester. Orientation to the program is held prior to the start of the fall semester. From late August to early May, interns work for up to ten hours per week and hold regular meetings with the mentor. Participants are encouraged to participate in department or lab meetings as well as any other relevant activities identified by the mentor or intern. Program events are held monthly, on varied topics such as career development workshops, graduate and professional school panels, and informal events to interact with other interns. Over the course of the internship there are two site visits by the program director. During these site visits, interns and mentors complete progress evaluations and provide a verbal report of the work being completed. This provides an opportunity for participants to report their accomplishments and practice communication skills. A poster presentation event is held at the end of the academic year to showcase the research and internship work of the participants. In preparation for this event, interns design a poster and many practice presenting in front of their department or laboratory group. For participants interested in presenting their work at a national level, competitive travel grant awards are available for those interested in attending and presenting at a conference or national meeting.
405
Proceedings of the 5th Annual National Symposium on Student Retention. Copyright 2009. C-IDEA, The University of Oklahoma.
Purpose
IUPUI is a public urban research university with graduate and professional programs in dentistry, health and rehabilitation sciences, medicine, and nursing. The Indiana University Optometry clinics and Clarian Health Pharmacy Department are easily accessible to those on campus. The undergraduate programs of LHSI student participants are generally not housed in these schools; the LHSI program therefore gives them an opportunity to investigate careers, make connections outside their home department and meet potential future professors and coworkers. The program seeks to engage students in potential career options early and keep them engaged throughout the rest of their undergraduate careers, with the goal of retaining them to graduate and professional programs or careers with the university, research and hospital systems.
Program Design
LHSI was designed to simultaneously address many retention issues facing this population. The university has many existing first-year retention initiatives and senior research or project requirements. The program bridges the gap between freshman initiatives (First Year Seminars and a successful Freshman Work Program in the Department of Biology) and senior requirements (capstone, research, and final projects) by connecting sophomores and juniors with faculty and professional staff mentors. This program provides career-related experiences in on-campus research and professional settings, allowing participants to explore potential careers early in their education and to clarify and solidify career goals. As a large research university, there is an opportunity to engage students in research and professional work before they get to the end of their undergraduate career. It has been shown that retention and engagement is positively impacted in undergraduates participating in research and related work with faculty mentors (Hathaway, Gregerman, & Davis, 2003). The internship encourages a campus connection other than just academic. Undergraduates who engage in part-time, academically relevant work alongside academics have shown to be successful at organization, efficiency, and academic performance and have higher rates of graduation than their peers (Dundes & Marx, 2006).
The structure of LHSI was designed using resources for starting a quality internship or experiential education program. The six best practices outlined in “The Elements of Effective Experiential Education Programs” were utilized as a framework (Gold, 2002). These best practices included providing meaningful work experiences, guiding students’ development through mentoring, offering compensation and/or benefits, communicating promptly and frequently with stakeholders, being consistent but flexible, and looking for ways to improve the program. Each intern worked with a mentor to design meaningful internship goals and the steps to get to those goals. Interns were paid hourly and sometimes worked with their academic department to get academic credit for the experience. A weekly e-mail newsletter was sent to all interns, longer newsletters were sent at the end of each semester all interns and mentors, and periodical messages were sent to academic departments with notifications of participant achievements and program announcements. Program events were scheduled monthly, with rotating times and dates to ensure participants were able to attend at least a few events over the course of the internship period. Participants completed surveys on satisfaction with the program and events and feedback was used to modify the program for subsequent years. A study by Kardash (2000) formed the basis for the evaluations used during the internship period. This study evaluated the changes in undergraduate research skills and abilities through participation in a research experience. The method used was a self-evaluation at the beginning and end of the internship as well as an evaluation by the faculty mentor for comparison. For LHSI, self-evaluations and mentor evaluations were used in the same manner. A study by Lopatto (2004) of undergraduates from 41 institutions on the benefits of undergraduate research experiences was a model for the evaluation content.
406
Proceedings of the 5th Annual National Symposium on Student Retention. Copyright 2009. C-IDEA, The University of Oklahoma.
Assessment Methods
LHSI is a program for IUPUI undergraduate students with sophomore or junior standing. Many IUPUI undergraduates have transfer credits leading to standing designation not indicative of actual projected graduation date or a four year path to graduation. For the purposes of this program sophomore or junior standing is defined as having completed the first year of courses prior to the start of the internship period and completing the last year of courses after the internship period. An overall GPA of at least 2.5 and a 3.0 in the major are required for participation, and all students are required to be enrolled for at least 12 credit hours (full time) to be admitted to the program and remain enrolled for at least 12 credit hours during each semester of participation.
Between January 2007 and May 2009, 83 students participated in the LHSI program with 77 completing the internship period. The remaining 6 completed only the first half, but discontinued after the first semester to take other internship opportunities, focus on a heavy course load, or for personal reasons (all remain enrolled at IUPUI). Participants represent a number of academic majors primarily housed in the School of Science and the School of Engineering and Technology and academic minors primarily in the School of Science and the School of Liberal Arts. Approximately 63 percent of participants were female, 37 percent male (Figure 1) and 80 percent of participants were white/Caucasian (Figure 2).
Figure 1. Gender of Participants by Year and Total
Figure 2. Race/Ethnicity of All Participants
407
Proceedings of the 5th Annual National Symposium on Student Retention. Copyright 2009. C-IDEA, The University of Oklahoma.
Data were collected by a review of academic records and entrance and exit interview questionnaires of interns. Between spring 2007 and spring 2009, student transcript and graduation status information was collected at the end of every semester via OneStart, the university’s web-based portal for student records and information.
A number of measures are in place to determine success of the program. Student persistence is measured by a full-time course load (at least 12 credit hours) in the fall semester after the internship, as well as student graduation rates. Post-internship plans are monitored, including continuation at the internship location, beginning a different research or internship experience, and graduate and professional school applications and enrollment. Evidence of continued engagement in research and professional experiences, such as conference attendance and publishing work, is also collected.
Results
As of the end of spring semester 2009, 72 of 77 (93.5%) of participants enrolled for the semester following the internship and all 72 of those students have remained enrolled or graduated. Of the forty participants from the 2008-2009 group, all are enrolled for the following summer or fall semesters. The remaining five participants transferred to professional schools outside the IUPUI system. Fifteen of the 72 participants (19.5%) have graduated. Of the 20 graduates and transfers, sixteen (80%) have applied to, been accepted at, or are currently enrolled at graduate and professional schools. The average GPA upon entering the program was 3.53 with a range of 2.62 to 4.0 and the average GPA at the end of the experience was 3.52 with a range of 2.63 to 4.0 on a 4.0 scale.
Responses to exit interview questionnaires note continued engagement in research and professional activities and the intent to pursue graduate education.1 32.4 percent (22 of 68 responders) reported continuing at the internship location for the year following the internship experience:
“… I gained priceless experience and connections that have already led to further opportunities, including being currently employed at the site where I did my internship.” (Biology major)
73.5 percent (50 of 68 respondents) reported starting another experience or the senior thesis or
project in the year following the internship experience. Nearly 34 percent (23 of 68 respondents) intended to apply to graduate or professional school during the following academic year:
“The experience made me seriously consider graduate school.” (Clinical Laboratory Science major)
Participants indicated gains in professional and research skills and active engagement at the
internship location. Many noted the application of information learned in the classroom:
“LHSI is a wonderful opportunity to learn and to apply classroom knowledge into practical manner.” (Pre-Nursing major) “…it took science out of the book.” (Biology major)
Others noted that the skills and experiences will carry over to future work and schooling:
“From here as a sophomore I'm already building upon my resume or CV to have a strong application into further programs.” (Psychology major) “…the skills that I learned and knowledge that I gained will definitely stay with me as I continue my education.” (Biomedical Engineering major)
1 Respondents were able to choose more than one activity in response to post-internship plans. Responses do not equal 100%.
408
Proceedings of the 5th Annual National Symposium on Student Retention. Copyright 2009. C-IDEA, The University of Oklahoma.
And how these experiences helped shape decisions about their career and graduate school options:
“I was inspired by seeing the impact that important research can have on society and I am now excited to tackle research projects and graduate school.” (Pre-Nursing major) “…I was able to explore my different career options in a way that helped me make a decision for my future. It made me realize what it is that I want to do for my career before applying to the pre-professional programs of my choice.” (Biology major) “After interning with LHSI, I now have a much better plan of action for applying to medical school, succeeding as a physician in a hospital, and have narrowed down my career choices as far as which specialty I wish to pursue.” (Biomedical Engineering major)
Participants noted not only engagement in the work experience, but also with one another:
“This internship has got to be one of the best ways to get into the best research labs on campus and meet and mingle with other students with similar majors and interests.” (Biology, Pre-Medicine major)
Twelve participants have utilized the travel grant to attend conferences or meetings:
“I never thought research could open so many doors…I even got to go to Miami, FL to present!” (Chemistry major) “I was able to do my own project and present it at an international conference for just that topic area.” (Chemistry and Biology, Pre-Medicine major)
Participants articulated their perceived gains from this experience, indicating engagement, new skills learned, and benefits for their future career and academic goals. Discussion
Undergraduates participating in the LHSI program are remaining enrolled and graduating in a timely fashion, and the few that leave the university are pursuing professional degrees at other universities. Of the graduates, a high percentage (80%) are immediately applying to and attending graduate and professional programs. Participants are utilizing these experiences to increase their knowledge and skills and to make more informed decisions about the future. Many see this program as a way to examine or solidify career decisions and gain valuable experience for the graduate or professional program that they hope to attend. Participants sometimes find through this experience that their original pathway and goals are not for them and set new career goals. This is a positive result in that participants are deciding on a new path early in their undergraduate career rather than after a degree has been obtained.
A control group was not identified for this program. In comparison with similar groups, the participants are being retained at similar or better rates. The retention rate of 93.5 percent is higher than that of full-time students employed on campus (85% for sophomores and 91% for juniors), and is consistent with the retention rate of 92 percent for sophomores and 93 percent for juniors for full-time students employed on campus making $10 per hour or more (the rate paid in the program) (Office of Information Management and Institutional Research, 2008). It is also higher than the retention rates of both the School of Science (82%) and the School of Engineering and Technology (79%).
Participants maintain their GPA and the majority remain enrolled at IUPUI. Participants who do leave the university are enrolled in programs at other universities more in line with their long-term career goals and are not available on the IUPUI campus (such as pharmacy school). Because LHSI participants are sophomores and juniors at the time of participation and 2008-2009 was the second
409
Proceedings of the 5th Annual National Symposium on Student Retention. Copyright 2009. C-IDEA, The University of Oklahoma.
year of the program, graduation data is just beginning to be collected. Almost 20 percent of the participants who remained at IUPUI have graduated and the numbers look promising with the rest continuing to be enrolled at IUPUI and maintaining connections to the internship locations or continuing on to other research experiences. LHSI experiences help undergraduates obtain other research opportunities and gain entrance to graduate and professional programs, as evidenced by the high percentage of participants who continue at the internship location or participate in other research opportunities, and of those who have graduated, 80 percent have applied or been accepted to a variety of relevant graduate or professional programs.
Moving forward, the program will continue to track retention and graduation data. The participant group is relatively small at this point, but the pool of participants will grow in subsequent years and previous participants will graduate and attend graduate or professional school, providing more reliable data. With the information gathered thus far, LHSI appears to have a positive effect on retention, graduation, and graduate/professional school placement. Conclusions
At the conclusion of the first two years of LHSI, the program has been successful in retaining and
graduating a high percentage of participants. Due to the class standing of the population upon entering the program, the complete picture of graduation rates and graduate and professional school placement cannot yet be determined. The early data are promising, with almost all participants remaining enrolled at IUPUI or graduating. Many of the graduates are going on to apply and attend relevant graduate and professional programs. The program has been successful in helping participants decide on and articulate career goals and continuing on a path to meeting those goals. Acknowledgments
Life-Health Sciences Internships is funded by an Indiana University Commitment to Excellence grant to N. Douglas Lees, PhD and Simon J. Rhodes, PhD.
410
Proceedings of the 5th Annual National Symposium on Student Retention. Copyright 2009. C-IDEA, The University of Oklahoma.
References
About IUPUI (2009). IUPUI Core Vision, Mission, Values & Diversity. Retrieved May 13, 2009 from
http://www.iupui.edu/about/core.html Dundes, L. & Marx, J. (2006). Balancing work and academics in college: Why do students working
10 to 19 hours per week excel? Journal of College Student Retention, 8(1) 107-120. Gold, M. (2002). The Elements of Effective Experiential Education Programs. Journal of Career
Planning & Employment, 62 (2), 20-24. Hathaway, R.S., Gregerman, S.R., & Davis, C.S. (2003). Assessment and evaluation of innovation
programs: measuring their impact. Council on Undergraduate Research, retrieved from http://www.cur.org/Publications/AIRE_RAIRE/michigan.asp.
Indiana Life Sciences Initiative (2009). IU’s Commitment to Indiana’s Future. Retrieved May 13,
2009, from http://lifesciences.iu.edu/background/education.shtml Indiana University-Purdue University Indianapolis (IUPUI), University College (2008). Indiana
University-Purdue University Indianapolis Annual Retention Initiatives Report 2007-2008 [Data file]. Retrieved from http://uc.iupui.edu/uploadedFiles/Assessment/retinit08.pdf
IUPUI Office of Communications and Marketing (2009). IUPUI Quick Facts. Retrieved May 13,
2009 from http://ocm.iupui.edu/factbook/ Kardash, C. (2000). Evaluation of an undergraduate research experience: perceptions of
undergraduate interns and their faculty mentors. Journal of Educational Psychology, 92(1),191-201.
Lopatto, D (2004). Survey of undergraduate research experiences (SURE): first findings. Cell
Biology Education, 3, 270-277. Office of Information Management and Institutional Research (2008). Trends for Student Employees
at IUPUI, Fall 2003 through 2006 [Data file]. Retrieved from http://ucrg.uc.iupui.edu/docs/handouts/sc/042408/TrendsStudEmp.pdf.
411
Proceedings of the 5th Annual National Symposium on Student Retention. Copyright 2009. C-IDEA, The University of Oklahoma.
The Relationship of What Students Know and Who They Are in Predicting Academic Success: Assessment of Non-Cognitive Factors
Affecting the Success of Freshmen
Patricia Mulkeen Melissa Gomez Director, Institutional Research and Effectiveness Director, New Student Programs
Abstract: Academic success of students is measured regularly. Today, most higher education institutions determine the propensity for success in university-level course work in two ways: the ACT and SAT and high school GPA. While those indicators are important, many students are coming to public universities that serve unique populations based on the areas in which they are located. Students enroll full of enthusiasm and sure of their success. Yet, even those who would appear to be sufficiently prepared do not succeed. Austin Peay State University serves a population with characteristics of low income and low educational attainment. The majority of students receive some form of student financial aid; more than half enter with mathematics deficiencies and many with reading and writing deficiencies as well. In order to learn more about the relationship between non-cognitive factors and academic success, we now administer the TCI to incoming freshmen during orientation. The results have revealed that assumptions we often made simply were not true. This presentation will provide some insight into assessment needs in a very complex academic world. Introduction
Improving student retention has been the focus of much research and many initiatives on college campuses and in state strategic plans. Tennessee’s Higher Education Commission has emphasized retention over enrollment growth in strategic planning and performance funding efforts over the past 9 years (THEC, 2000). While enrollment has grown substantially at Austin Peay State University, retention has lagged behind our state peers (THEC, 2009). The SACS Quality Enhancement Plan for APSU has retention at its center.
Efforts to understand and improve retention rates began with analyses of academic characteristics of students (such as high school GPA, ACT scores, and academic deficiencies) and expanded to include family characteristics (Pell grant receipt, parental education). Analyses of APSU data mirrored results found on other campuses in that less prepared and financially needy students were at higher risk of attrition (Schutz, 2002). This data was paired with information from the CIRP Freshman Survey to develop a picture of the incoming freshmen. Yet this picture was still incomplete. ACT and high school GPA for students not retained were only one point and one quarter point lower than for retained students (Smyth, 2009). CIRP data was interesting for comparisons to other campuses but not for identifying students at risk of not being retained.
A different type of assessment of incoming freshmen was needed. The criteria for a different assessment was that it provide non-cognitive information about the students, could be administered pre-entry (to provide early alert data), and produce results quickly to allow for adequate intervention and assistance. As with many public institutions, cost was also a factor.
After research and discussion, APSU chose to administer the Transition to College Inventory (TCI; Pickering, Calliotte, & McAuliffe, 1992), for the first time, in the summer of 2008 to the Fall 2008 first-time, full-time cohort of students. This paper will present how one institution administered and utilized data from the TCI, how that data has been merged with other student data to provide a more complete picture of our students, the results of data analysis focused on student success and retention
412
Proceedings of the 5th Annual National Symposium on Student Retention. Copyright 2009. C-IDEA, The University of Oklahoma.
related to the TCI and other data collected, how this assessment and data have or will direct future decisions, and current and future interventions that are planned to help students succeed based upon non-cognitive information gained via the TCI. Background Although first-time student enrollment has steadily increased over the past ten years, retention and graduation rates have not increased at the same rate, if at all (National Center for Educational Statistics, 2004). This is not new news to those in higher education as faculty, staff and administrators struggle to find a solution to the problem of students dropping out of college. Some institutions choose to simply increase admissions standards, thus only accepting those students who have cognitively demonstrated they have the potential to succeed. Other institutions serve as the only affordable, local option for students to continue their education and thus must remain accessible to a wide range of students from varying cognitive and demographical backgrounds. The question then becomes, regardless of student’s cognitive ability, are there other factors that impact that student’s chances of success, and if so, how can an institution identify and intervene early to help mitigate any non-cognitive factors that put a student at risk? Also central to the question of student success and retention, is the importance of using relevant, timely and accurate data to direct decisions related to admission and retention policies, allocation of resources, and staff and faculty development opportunities. In response to the question of non-cognitive factors impacting students’ success, Pickering, Calliotte and McAuliffe (1992) developed the Transition to College Inventory (TCI) to “measure non-cognitive factors that might contribute to freshman academic difficulty and related attrition” (slide 15, CSRDE paper presentation, 2005). Robbins, et al. (2004) also attempted to go beyond the traditional methods of high school GPA (HSGPA) and standardized test scores in predicting success and suggested that some psychosocial and study skill factors (PSFs) could potentially predict success. Through the meta-analysis, the researchers found the greatest predictors of college retention were academic goals, academic self-efficacy, and academic related skills. However, regarding collegiate GPA, achievement motivation was one of the strongest predictors.
Originally titled “The Freshman Survey” the TCI consists of items related to students’ attitudes, behaviors, traits or circumstances that “were expected to be associated with either academic difficulty and attrition or academic success and retention” (Pickering, Calliotte, McAuliffe, 1992, p. 15). The non-cognitive factors that are identified and measured via the TCI are college involvement, influences on college choice, student role commitment, athletic orientation, personal/academic concerns, self confidence, institutional commitment, socializing orientation, and independent activity focus (Pickering, Calliotte and Zerwas, 2005). Students take the 120 item inventory and the result is a risk score that is based upon the way the student answered the questions compared to the way those questions were answered by students who had academic difficulty. Pickering, Calliotte and McAuliffe (1992) found non-cognitive variables contributed to the prediction of both academic difficulty and success not only at the end of the first year, but attrition/retention into the second year as well. They also reported a combination of cognitive and non-cognitive variables is more powerful in predicting academic success or difficulty and when demographic variables are included the combination is then most powerful in predicting attrition/retention. The researchers also recognized the data could be used to impact admissions decisions, but suggested a more useful application of the tool would be for early identification and interventions for admitted students identified as “at-risk” based upon non-cognitive factors. Methodology Data Collection
In the spring of 2008 the researchers contacted the developers and administrators of the TCI for summer 2008 implementation. This particular assessment was administered online via a url provided to the researchers by the administrators of the TCI. All new students (first-time and transfer) are required to
413
Proceedings of the 5th Annual National Symposium on Student Retention. Copyright 2009. C-IDEA, The University of Oklahoma.
attend a special advising and registration session, referred to as Summer Welcome, to be advised and register for classes. Only first-time students were administered the TCI during the Summer Welcome program, prior to registration. Computer labs were secured across campus and trained student leaders directed the students to the url which included the informed consent and the instrument itself. It took the students approximately 15-25 minutes to complete the assessment. Administration of the assessment occurred over the course of 10 registration sessions and results were provided to the researcher within one week of the final registration session. The results included individual reports for each student who took the TCI, as well as aggregate data which was delivered via SPSS. The individual reports were printed and sorted by enrollment in the freshman seminar course and delivered to the instructors (with students permission) of the freshman seminar courses. The instructors met with the researcher when they received the results in order to explain the scoring, what the risk ranges were and to discuss possible ways to use the information to assist their students. In cooperation with the Registrar’s office and the office of Institutional Research and Effectiveness, the TCI results were merged with other student data available via the institutional data warehouse. Data were then compared on students based upon pre-entry cognitive (ACT/SAT, HSGPA, first semester GPA, registration for subsequent semesters, developmental studies placement) and non-cognitive (TCI data) factors and correlated with first semester/year GPA and subsequent semester (spring 2009) registration (note: data collected regarding subsequent semester registration is not spring to fall or fall to fall retention rates, but instead whether or not the student was enrolled in classes for spring 2009 and/or fall 2009). Population Of the 1471 entering freshmen at APSU in Fall 2008, 1326 were first time full time students whose retention and graduation will be tracked and reported over the next six years. The majority of entering students are 18 years of age; however, with open admissions for students 21 and over, APSU’s 2008 freshmen class includes 148 students (11%) entering over age 21 with requirements for placement testing but no admission standards to be met. Academic deficiencies identified by ACT scores or COMPASS testing are common among the entering freshmen with 20% entering with deficiencies in reading, 25% in writing, and 42% in math. While fall-to-fall retention data for the Fall 2008 cohort is not yet available, previous cohorts have demonstrated retention rates ranging from 61% for the 2003 Freshman cohort to 67.6% for the 2007 cohort. A better than 6 point rise in retention in 4 years is a worthwhile accomplishment, yet there is significant room for improvement. Results The results presented in this paper attempt to answer a few key questions regarding how well the non-cognitive factors identified by the TCI translate into “predictions” of success and retention for our students. We have not yet implemented a comprehensive intervention program based upon the TCI results but instead, initially, wanted to better identify at-risk students and gather more timely data about our students. The questions generated by this first year of TCI implementation are:
1. Does the TCI risk level differ for students retained to Spring 2009 and those not retained and also for those pre-registered for Fall 2009?
2. Is there a correlation between the level of risk based upon non-cognitive factors and when a student attends a Summer Welcome session?
3. Is there a relationship between the TCI risk level and students' HSGPA, ACT/SAT, first college semester GPA and cumulative GPA?
Does the TCI risk level differ for students retained to Spring 2009 and those not retained? To answer this question a One-way ANOVA was run with spring enrollment status (yes or no) as the independent variable and the TCI risk index as the dependent variable. See Table 1.
414
Proceedings of the 5th Annual National Symposium on Student Retention. Copyright 2009. C-IDEA, The University of Oklahoma.
Level of Risk and Date of Summer Welcome Attendance Anecdotal evidence often implies the later a student waits to register the less likely he/she will be prepared for college. Pearson r correlations were run to determine if there was a relationship between when a student attended a summer registration session and the student’s TCI risk index. Table 2 provides the mean TCI risk index for students who attended each of the summer registration dates. APSU uses a conditional admission status for students with multiple academic deficiencies; students in this category must meet with tutors and receive more intensive advising in order to give them the tools they need to be successful. Separate Summer Welcome Sessions are conducted for Conditional and Unconditional Admits. Table 2
Date (description) N Mean Risk factor significant differences
5/29 (Scholarship) 112 4.643 The risk was significantly low for 5/29 compared
to all other dates except June 13. June 12
(Conditional) 89 7.494 The risk was significantly higher for 6/12 compared to 5/29 and 6/13 only.
June 13 (Unconditional) 175 5.480
The risk was significantly lower for 6/13 compared to all other dates except 5/29, 7/12, and
7/17. July 12
(unconditional) 149 6.638 There was no significant difference between the risk of 7/12 and all other dates except 5/29.
July 16 (conditional) 67 7.851 The risk was significantly higher for 7/16
compared to 5/29 and 6/13. July 17
(unconditional) 198 6.551 There was no significant difference between the risk of 7/17 and all other dates except 5/29.
July 30 (unconditional) 170 6.976 The risk was significantly higher for 7/30
compared to 5/29 and 6/13 only. August 1
(conditional) 55 7.909 The risk was significantly higher for 8/1 compared to 5/29 and 6/13 only.
August 12 (unconditional) 147 7.190 The risk was significantly higher for 8/12
compared to 5/29 and 6/13 only. Aug. 19
(unconditional) 5 8.800 N/A too few results to determine significance
Relationship between risk level, academic characteristics and college GPA
Table 1 Descriptive and Inferential Statistics for TCI risk index based upon Spring 2009 enrollment Condition Enrolled Spring 09 Not Enrolled Spring 09
Item M SD M SD Fa TCI Risk Index 6.35 3.73 7.92 3.98 21.78*
a d.f. =1179 p < .001
415
Proceedings of the 5th Annual National Symposium on Student Retention. Copyright 2009. C-IDEA, The University of Oklahoma.
High school GPA and ACT scores are significantly related to TCI risk with lower GPA and test scores associated with higher risk on the TCI index. Pearson r correlations revealed a significant, negative, moderate relationship between the TCI risk and students’ HSGPA (r (1166) = -0.40, p < .01). Pearson r correlations revealed a significant, negative, weak relationship between the TCI risk and students’ ACT score (r (1167) = -0.22, p < .01). TCI risk index is significantly related to first term GPA (college GPA). Pearson r correlations showed a moderate, negative but significant relationship between TCI risk and students’ first term GPA (r (1166) = -0.31, p < .01). Spring 2009 GPA is not available at this time but will be incorporated into the analysis and reported in the conference presentation. Discussion Based upon the results of the data analysis, we have been able to draw some conclusions about our students that we had not been able to do previously. We now know based upon the results of the one-way ANOVA, the TCI risk is significantly higher for students who did not return in the subsequent semester than those that did. With the mean TCI score for each population, we can now better target our focus on students with a higher risk for not continuing. We also know there is a relationship between the risk score and first semester success. Also, our initial suspicions that students who register later in the summer are at greater risk; this is confirmed by the students’ TCI risk indexes are higher the later their registration session. TCI risk is associated with retention of students to the subsequent semester. Unlike academic characteristics such as high school GPA and ACT scores, the TCI provides additional information that can be used to enhance student success starting in the first semester. These results will be used in the coming academic year to identify and intervene with students at greater risk of attrition. Implications and Future Research Now that we have a baseline to progress forward we plan on implementing a pilot mentoring program in Fall 2009 targeting students based upon their TCI Risk Index. This mentoring program will center on staff members serving as mentors to new students with a TCI risk between 6 and 8. We also plan on investigating ways to connect students to the appropriate campus resources, programs and services based upon the areas they show greatest risk. For example, for the students who indicate low academic confidence, we could possibly send a list of those students to our Academic Support Center so the center could possibly be more deliberate in informing those students of their services. Another example would be to provide the Student Life and Leadership Office a list of students who were high risk for not getting connected to the campus; to perhaps specifically invite them to campus activities and events. We also need to continue to gather data and explore what combinations of data provide the most accurate picture of our students and their potential for success or difficulty. Finally, it is important to use this information to not only target those students at-risk, but to also support and confirm for those students at low risk that they made a good choice in attending our institution.
416
Proceedings of the 5th Annual National Symposium on Student Retention. Copyright 2009. C-IDEA, The University of Oklahoma.
References National Center for Educational Statistics. (2004). College persistence on the rise? Changes in 5-year
degree completion and postsecondary persistence rates between 1994 and 2000. Available at: http://nces.ed.gov/pubsearch/pubsinfo.asp?pubid=2005156
Pickering, Calliotte, & McAuliffe. (1992). The effect of noncognitive factors on freshman academic
performance and retention. Journal of the Freshman Year Experience, 4(2), 7-30. Robbins, S.B., Lauver, K., Le, H., Davis, D., Langley, R., & Carlstrom, A. (2004). Do psychosocial and
study skill factors predict college outcomes? A meta-analysis. Psychological Bulletin, 130, 261-288.
Schutz, G. (2002). Regression analysis of first time full time freshmen retention. Institutional Research
and Effectiveness Report, Austin Peay State University, Clarksville, TN. Smyth, E. (May 15, 2009). Who are the freshmen at Austin Peay? Presentation to Advisor Training
Abstract – This paper analyzes the effect of curricular reform initiatives on first and second year retention rates at Trinity Washington University’s College of Arts and Sciences. Trinity’s CAS is a small, historic, Catholic liberal arts college in Washington, D.C. that serves undergraduate women, most of whom are first-generation college-goers and who tend to have widely disparate levels of college preparedness. Two years ago, Trinity implemented a new, highly structured, assessment-friendly General Education curriculum aimed at improving both learning outcomes and student retention. Linchpin components of our curricular reform include foundational skills courses, Learning Communities, mastery grading, and early alert data collection and management. Retention is a key indicator in our assessment of outcomes from this reform. Our first two years of data show that our student retention has improved while academic probations have decreased. These indicators suggest that we are both retaining a higher percentage of students and preparing them better to succeed academically. In addition to being significant to Trinity, our strategies and results may be helpful to other institutions serving high-risk students. Introduction
As a leader among four-year private institutions in the U.S. in terms of diversification and college access initiatives, Trinity University’s historic College of Arts and Sciences is well-positioned to participate in the burgeoning national discussion of how to improve retention rates for high-risk student populations.
For the last 20 years, Trinity’s CAS has been reaching out to women who aspire to a college education but who typically face substantial obstacles to matriculation, academic progress, and graduation. The risk factors with which our students present are multi-faceted; their challenges are social, economic, and educational. The typical “Trinity woman” is the first in her family to attend college. She is likely to come from a family whose income is below the national median, and she may well have been raised in poverty. She probably identifies herself as either Black or Hispanic; English may not be the language she speaks at home. Her high school education likely occurred in the District of Columbia,1 where the public school district, according to a recent Quality Counts report, rated 51st among the 50 states and the District in education performance and policy for the year 2007 (“Trinity: Committed to the Education of D.C. Students,” 2006; Greenwell, 2008, p. B1).
In serving these students, Trinity has become a kind of crucible for testing college access and college success strategies and initiatives. Through a lengthy process of trial and error, culminating in a major overhaul of our General Education curriculum in Fall 2007, we have identified a number of factors that are enabling us to improve learning outcomes for our student population and concomitantly, our retention rates. These factors include: first, clarity of mission; second, the willingness to acknowledge and address students’ academic deficits; third, capitalizing on student strengths such as aspiration, resilience, and
1 We enroll more D.C. residents in our degree programs than any other private university in the U.S.
418
Proceedings of the 5th Annual National Symposium on Student Retention. Copyright 2009. C-IDEA, The University of Oklahoma.
optimism; fourth, faculty and administration collaboration in all aspects of curricular development and implementation; and finally, the infusion of assessment into all institutional interactions with students. We believe that while our strategies grow out of Trinity’s particular goals and needs, they are both transparent and portable, making them easily adaptable to other institutional contexts and needs.
The title of this paper deliberately invokes the campaign slogan of President Obama. In reinventing itself in service of college access and college success for underserved populations, Trinity has had to grapple with considerable obstacles, both internal and external, and the challenges will continue for the foreseeable future. However, today’s Trinity also offers an object lesson in how even a tiny school with limited resources can contribute to the national imperative to grow the U.S. population of college graduates while simultaneously helping to rectify some of the inequities in higher education: indeed, “Yes, we can.” Curricular Reform: Context and Rationale
From its inception, Trinity College has served the underserved. It was founded in 1897 as a women’s college, enrolling women who sought a Catholic faith-based education but to whom the doors of other Catholic institutions of higher learning were closed. When Catholic universities in America became co-educational in the 1960s and 1970s, Trinity College lost a large portion of its constituency, leaving our college with only two options: adapt or perish.
We chose the former. If Catholic women were no longer the underserved in higher education, we needed to focus on other populations of women who still faced barriers. In time, we began to actively recruit among groups whose access to higher education remains limited: women of color, women of modest means, graduates of Washington, D.C. schools, Islamic women, and others for whom higher education still remained largely out of reach. Today, Trinity’s CAS is a highly diverse and growing collegiate unit of the university as a whole. Enrollments have been climbing steadily; we are currently educating approximately 650 undergraduate women a year from diverse social, economic, geographic, and ethnic backgrounds, and we expect that number to climb to 675-700 in Fall 2009.
In our growing enrollments, we are reaping the fruits of an arduous and eventful transition. In its first 80 or so years, Trinity’s students derived primarily from elite, white families. Some of Trinity’s graduates from decades past are now prominent national figures, such as Speaker of the House Nancy Pelosi, former Kansas governor and current cabinet member Kathleen Sebelius, and Hearst Magazines president Cathie Black. These past generations of Trinity students typically arrived well prepared for college-level academics, not only intellectually, but also in terms of their social acculturation to the expectations and processes of higher education.
That was then. This is now: more than half of our current students are first-generation college goers. More than two-thirds report a level of family income below the national median, 24% report their family income to be below $20,000, and 14% report their family income to be below $10,000; and median parental income hovers at around $30,000 (McGuire, 2008a, p. 7). In order to attend Trinity, 95% of our student population receives an average 40% tuition discount, and 62% receive Pell Grants (McGuire, 2008b, pp. 2-3). Explicit measures of students’ academic preparation at entrance also suggest deficiencies. In 2007, only 30% of our First Year students placed into the terminal General Education Mathematics requirement, and 88% required a preparatory course in composition. Our students are, at least to some extent, aware of their preparation deficiencies; 60% report expecting they will need help in Mathematics, and 33% report expecting they will need help in Composition (McGuire, 2008a, p. 11).
Nearly 90% of Trinity’s students are Black and Hispanic, and of our entering class in Fall 2007, the corresponding statistic was 95% (McGuire, 2008a, p. 3). Of course, all are female. For one fifth of respondents, English is not the primary language spoken in the household, less than one third report that their parents are living together, 66% report high school to be their fathers’ terminal education level, and 57% report high school to be their mothers’ terminal education level (McGuire, 2008a, pp. 4-10).
419
Proceedings of the 5th Annual National Symposium on Student Retention. Copyright 2009. C-IDEA, The University of Oklahoma.
A Historical Perspective on Retention: What Graduation Rates Tell Us
In evolving to meet new kinds of student circumstances and needs, we have had to develop different academic plans, different academic support services, different financial services, and different social networks. Most importantly, though, we have had to be more systematic and more intentional about retaining students. While the provision of better services, both academic and co-curricular, is fundamental, we cannot serve our students if we cannot keep them enrolled.
By our own accounts, “…no data set reveals more about the challenges inherent in the paradigm shift in Trinity’s student population than the statistics on retention, persistence and completion. Nationwide data reveals that, for all students, completion in four years is increasingly rare, and more than half of all college students attend at least two institutions during their college careers” (“Assessing Trinity 2000 – Approaching Trinity 2010: Self Study for Middle States Comprehensive Accreditation Review,” 2006, p. 22). Generally, Trinity College’s six-year graduation rate is quite respectable for the population we serve. Between 1997 and 2002, our graduation rate was between 54% and 47% (“Assessing Trinity 2000 – Approaching Trinity 2010: Self Study for Middle States Comprehensive Accreditation Review,” 2006, p. 22). According to The Education Trust, it then plunged to 37% in 2003, recovering again to 44% by 2004 and 53.3% by 2005 (College Results Online, 2008). While those rates might seem modest by some standards, they are on average better than 47%, the national average for low-income, minority students (“Higher Education Financial Services DC Tuition Assistance Grant Program,” n.d.). Moreover, our success rate is quite impressive with certain populations, chief among them DC TAG (District of Columbia Tuition Assistance Grant) Program students. Though graduation rates for all participants in the DC TAG program are low at 36-38%, in comparison 65% of Trinity’s DC TAG participants from 2000 to 2006 either completed their program or were still enrolled (“Higher Education Financial Services DC Tuition Assistance Grant Program,” n.d.; McGuire, 2008b, p. 2). Despite our relative success, however, we felt that we were losing too many students. In the end, while graduating 50% of those who enter within six years can be perceived as a success, the reasons for the attrition of 50% of our entering class within six years remained unclear. Analyzing attrition has been a driving force for our work since 2003.
We designed our retention strategy in two steps. We first sought to identify the factors that pressure students to leave, and we then created a retention plan to combat those pressures. In 2003, Trinity created an Enrollment Management Team comprising all academic and nonacademic units, whose goal was and continues to be the analysis of factors causing attrition and the development of more effective programs and services in response. What emerged from that work is a more coherent understanding of how each unit in the institution functions to promote student persistence.
Like so many other institutions, we discovered that in CAS, our students’ most perilous year was the first. Further, we found that at the heart of attrition was poor academic performance. For example, of those students we enrolled in the Fall of 2006, 12% did not return in the Spring semester; of those, a full 68% experienced academic difficulties. Academic nonperformance is even more pronounced among our First Year students. A full 63% of our entering class experienced academic difficulties by midterm, and 72% were on academic probation by the end of their first semester, which in part explains first year students’ overrepresentation among non-returning students. First Year students represented only 37% of our student body in the academic year 2006-2007, but they represented 60% of those who did not enroll in the Spring of 2007. Enrollment data for the Fall of 2007 to the Spring of 2008 reveal a similar pattern: of the 14% of students who did not enroll in the Spring of 2008, 83% failed to meet academic standards. Again, First Year students were overrepresented among those who did not return, in that they represented 70% of non-returning students and 37% of the total student body for the academic year.
Our data also suggested that many of our students were not well served by our then-general education curriculum, called the Foundations for Leadership (FLC) curriculum. Designed to accommodate the academically prepared and relatively savvy college consumer of an earlier Trinity era, the FLC offered students a high degree of flexibility and autonomy. Analysis of student records revealed that many of our
420
Proceedings of the 5th Annual National Symposium on Student Retention. Copyright 2009. C-IDEA, The University of Oklahoma.
current students did not have the cultural capital required to navigate the kind of choices inherent in the FLC, or indeed, to fully understand the meaning, purpose, and structure of a liberal arts education. As a result, many students tended to undertake major courses immediately as a perceived pragmatic, professionalization strategy, deferring foundational and skills courses until late in their academic career. In too many cases, this pattern resulted in academic self-sabotage.
For example, 30% of First Year students enrolled in 2005 did not take college composition as freshmen as expected, and 3% did not take it in either of their first two years, suggesting that for some of our students, writing was being overlooked as a necessary foundational skill for subsequent courses. The same was true of our Communication requirement; a third of students did not complete their Communication requirement within their first two years. Finally, only 62% of the students enrolled in 2005 completed their numeracy requirement in their first year. For 25%, basic Mathematics was something they postponed until their junior year, and for a full eight percent, Mathematics was something they took only in their senior year (“Assessing Trinity 2000 – Approaching Trinity 2010: Self Study for Middle States Comprehensive Accreditation Review Middle States Report,” 2005, pp. 60-61). In other words, many of our students were postponing enrollment in foundational skills courses, when in fact, those were the courses they most desperately needed.
Our new General Education curriculum responds to these findings in a number of ways, incorporating our “lessons learned” experiences around retention and attrition into a set of best practices for a transformative academic experience. The initial centerpiece of the curriculum is our First Year Experience (FYE), described at length below; we are currently working on expanding and strengthening the Second Year component to create an equally powerful academic experience for our sophomores. Curricular Reform as a Retention Tool: A Description of the First Year Experience at Trinity College The new General Education curriculum is deeply informed by social science research into strengths-based learning. While infused with strategies aimed at correcting academic deficiencies, the curriculum also aims to capitalize on our students’ characteristics of aspiration, resilience, and optimism.
After analyzing our data on retention and academic progress, a committee comprising both administrators and faculty concurred that our students require a much more prescriptive and structured curriculum for the first year, in particular one that emphasizes foundational skills such as college-level reading, writing, and numeracy. We also determined that to encourage persistence and intellectual engagement, we needed to give students the opportunity to explore their putative majors, but without punishing them for deficits in foundational skills.
What does all of this mean in practical terms? First, we established nine goals to ensure that by the end of their first year, each Trinity woman will have
1. Developed her ability to read, understand, and analyze texts 2. Developed her ability to communicate effectively in speech and in writing 3. Developed her ability to understand and use quantitative reasoning to solve problems 4. Developed her ability to locate, evaluate, and synthesize information in the construction of
knowledge 5. Begun to explore and connect fields of knowledge in the liberal arts 6. Begun to apply diverse modes of inquiry to the study of human societies and the natural
world 7. Appreciated and adhered to the principles of academic honesty 8. Developed a capacity to engage in civil discourse 9. Developed the skills needed for academic success, including the ability to manage time
efficiently, study effectively, and take responsibility for her own learning.
421
Proceedings of the 5th Annual National Symposium on Student Retention. Copyright 2009. C-IDEA, The University of Oklahoma.
To accomplish these goals, the FYE includes five important curricular initiatives. First, we committed to deliver ALL foundational skills courses in the first three semesters of our students’ academic experience. Second, we created three new courses designed to help students’ ability to read, think, and communicate at the college level. Third, we added “supplemental instruction” sections to course sequences in Critical Reading, English Composition, and Mathematics as a strategy for accelerating progress through developmental course work. In those courses, we adopted “mastery grading” policies. Fourth, we determined that each new first-year student would participate in a Learning Community (LC) during her first semester and that her LC instructor would also be her academic advisor for at least her first two semesters. Finally, we created the General Education capstone seminar, intended as a culminating experience within the General Education curriculum that will enable students to synthesize the skills and knowledge obtained in their first three semesters while at the same time transitioning into their major fields.
In addition to coursework, our revamping of the FYE included a more intentional and coordinated commitment of institutional resources toward academic and personal support for our students, including designation of an associate dean for FYE and an assistant dean of advising for CAS. Prior to implementation of the new curriculum, we identified the students with the perceived greatest academic deficiencies in each incoming class (typically 10 to 15% of the class) and provided intensive advising and academic support to this cohort, called Future Focus. With the new curriculum, we decided to treat ALL of our students as high-needs and to reallocate our resources to make intensive support services more broadly available to all new students. Finally, in Fall 2008, we launched a week-long orientation for all new first-year students; programming emphasized acculturation to college through “practice classes,” multiple meetings with faculty and staff advisors, role play exercises around academic integrity, and field trips in the D.C. area relevant to majors offered at the college. The Timing of Our Course Delivery2
In Fall 2008, we revised our registration process, moving to a model where college advising staff created each new student’s schedule for her first semester, addressing both her required courses and courses relevant to her stated area(s) of interest, if any. While labor intensive, we have found this approach to student schedules a great improvement over previous years, when students chose courses themselves and then sought approval from faculty advisors. While first-year students can and do adjust their schedules, we are finding that our greater degree of control over their course selection in that crucial first semester is ensuring that almost 100% of students in their first semester are enrolled in foundational courses appropriate for their level of ability.
The process works as follows: all students arriving with less than sophomore status (all first year and first year transfer students) undergo assessment of their writing and numeracy skills in the form of Accuplacer tests. Their scores, along with their statement of areas of interest, are utilized to create cohort-like schedules in which students are placed in a Learning Community course, usually a critical reading seminar or another foundational course in which the topic material centers on the stated area of interest. For example, a student who professes interest in international affairs will be placed in a critical reading seminar taught by a full-time faculty member in that department. The course will be designed specifically to engage students in critical reading in this area. Typical first-semester schedules also include composition, math, communication and/or critical reasoning courses, with the course level determined by the student’s assessment score. Students scoring in the low ranges in all areas will be limited to 12-13 credits; students scoring in the high range in all areas may be additionally enrolled in the introductory level course in their intended major. Anecdotal reports suggest that last year, the first year in which we instituted this new approach to scheduling, few students chose to adjust their schedules after
2 We are indebted to Dr. Carlota Ocampo, Associate Dean for First Year Experience, for her contributions to this section.
422
Proceedings of the 5th Annual National Symposium on Student Retention. Copyright 2009. C-IDEA, The University of Oklahoma.
receiving then, and what little adjustment did occur tended to revolve around times or sections of courses, not levels or changes in foundational offerings. Foundational Courses
In their first year, our students take courses in five foundational skills areas. First, we require that students complete both an English Composition and a Mathematics course, both courses that we had already developed. In addition, we created three additional foundational courses, one a Critical Reading Seminar, one a Critical Reasoning Seminar, and one a Communication for Academic Success course. Altogether, the goals of the five courses are that
1. Students will develop their abilities to read, understand, and analyze texts 2. Students will develop their abilities to communicate effectively in speech 3. Students will develop their abilities to communicate effectively in writing 4. Students will develop their abilities to understand and use quantitative reasoning to solve
problems 5. Students will develop their abilities to locate, evaluate, and synthesize information in the
construction of knowledge. Supplemental Instruction and Mastery Grading
In addition to creating three new foundational courses, we also added Supplemental Instruction Sessions for preparatory courses in Mathematics, the Critical Reading Seminar, and the preparatory course in English Composition. The creation of supplemental instruction sessions was intended to diminish the number of semesters that students spent completing remedial work, while at the same time increasing their often modest success rate in preparatory courses by increasing time on task. All Supplemental Instruction sessions carry four credits.
Minimizing the number of semesters students take to complete their preparatory courses responds to our concern that the more time students spend doing preparatory academic work, the less likely they are to persist. National data suggest that students’ need for remediation has a huge impact on completion rates; according to Carey, students who need no remediation have a completion rate of 76%, those who need one remediation course (so long as it is not reading) have a 61% completion rate, and those who need two or more remedial courses have a completion rate of only 49% (Carey, 2004, p. 16). The persistence problem likely results at least in part from students’ inability to handle concurrent, higher level work for which they are not prepared, which we avoid through prescriptive scheduling (discussed below). In addition, we work toward eliminating the potentially discouraging effect of having to spend a long time, sometimes more than one year, doing work that in their mind’s eye, does not position students any closer to the finish line.
As part of our decision to invest more resources in delivering strong foundational skills to students, we decided to hire teaching specialists in developmental reading, composition, and math as the primary instructors for our Supplemental Instruction classes. The specialists work closely with faculty in related departments, but report directly to the Dean. All hold an MA or PhD in their area of specialization. As 12-month employees of the university, their responsibilities include teaching, course development, faculty development, and assessment of learning outcomes in foundational courses. Now in the second year of the specialist approach, we are starting to see some powerful indicators of student progress. For example, in Fall 2007, 55% of students passed MATH 101 with Supplemental Instruction. In Fall 2008, the pass rate increased to 72%. In Critical Reading with Supplemental Instruction, 68% of students in the sample cohort passed the course, compared with 48.8% the year earlier.
Factors contributing to this improvement include the adoption of “mastery grading” in all Supplemental Instruction courses, a technique whereby any student work (quizzes, papers, exams) earning less than a C must be revised until the C is attained. In order to pass the course as a whole and progress to the next course in the sequence, students must obtain a grade of “C” or better. In adopting this
423
Proceedings of the 5th Annual National Symposium on Student Retention. Copyright 2009. C-IDEA, The University of Oklahoma.
strategy, we are capitalizing on our students’ resilience and tenacity. Through pre and post testing data, we are able to demonstrate to both ourselves and our students that even those students who do not pass the course the first time make, almost without exception, significant progress in their learning outcomes. Armed with this knowledge, students are empowered to retake the class with confidence that they will pass on the second try. Learning Communities
In addition to the explicitly curricular elements of our reform, a central piece of our plan involved placing all our incoming students in a course taught by a faculty member who will serve as their academic advisor, thereby creating Learning Communities. Most of our entrants are placed in discipline-specific courses that align with their stated area of academic interest. This means that the new student at Trinity will have a chance to work closely with a faculty member in her potential major in her very first semester, and that this relationship will continue into the second semester as the LC instructors are also the students’ advisors for the first full year.
The design of the Learning Community facilitates the relationship between our First Year students and faculty members. In addition to fostering her academic curiosity and skills, the LC instructor also helps students navigate some of the institutional processes and resources that may be daunting or alien to higher ed newcomers, such as financial issues, tutoring, and health care, both physical and mental, work study opportunities, and so forth. In short, our goals for the Learning Communities are first, to improve academic success through the promotion of academic and social networks with faculty and peers, and second, to increase interaction, involvement, and learning inside and outside the classroom. For example, for the last three semesters, each Learning Community class has attended a theatrical performance in D.C. chosen by the instructor, and that experience has been woven into the learning objectives for the class. The Capstone Seminars As stated above, the curricular elements of the General Education culminate in the Capstone Seminar, a course taken once a student has completed at least 40 General Education credits. Capstone courses are taught by fulltime faculty only. They typically focus on a particular, relatively narrow topic; they are expected to have an interdisciplinary element or elements, must help students synthesize their foundational skills, and require successful completion of a research-based seminar paper. Trinity’s faculty have embraced this new element of the curriculum and have developed or revised more than a dozen courses for this category of the General Education, including Women and Popular Culture, Victorian Studies, the Biology of Women, Human Sexuality, Writing for Social Change, and Food Microbiology. All courses must be approved for capstone status by a committee comprised of five elected CAS faculty members and the Dean of the College, which has helped ensure consistency of course parameters, as well as goals and objectives. Beginning in Fall 2009, we will integrate the capstone seminars into our assessment of both the General Education as a whole and outcomes in our major programs. Institutional Elements of the FYE
In addition to its curricular elements, the implementation of the FYE has required additional institutional resources. First, we changed several academic policies so that we could detect academic issues early: we shortened the Drop/Add period and followed it with an immediate college-wide intervention for all students not attending classes; we reported midterm grades earlier, and again, followed up with an immediate college-wide intervention for students in academic difficulty. The increased level of intervention required additional decanal staff, as did the coordination of Learning Communities. We hired developmental experts in critical reading, mathematics, and writing, as discussed above. We improved our social networks in a variety of ways, including providing students with a comprehensive
424
Proceedings of the 5th Annual National Symposium on Student Retention. Copyright 2009. C-IDEA, The University of Oklahoma.
directory of services, such as food provision, shelter, immigration services, legal services, and employment assistance (“Trinity: Committed to the Education of D.C. Students,” 2006). Finally, we instituted a program titled TAPS (Trinity’s Academic and Personal Success), through which students receive personalized academic help, such as tutoring, as well as health and mental health programming, programming on optimal social interaction, an introduction to the arts, and institutional guidance on issues such as how to seek financial aid and support, all of which has required increased resources on the part of academic support staff, student services staff, and other auxiliary institutional staff. Preliminary Results: Retention Rates and Academic Probation Rates as Indicators of Student Progress After the Curricular Reform
Historically, retention rates for First Year students hovered at around 80% for their first semester (Fall to Spring of their first year) and 70% from (Spring to Fall of their second year). Thus, we historically lost 45% of our entrants by their second year.
Two years into the curricular reform, our preliminary data, which we summarize in Table 1, support our hypothesis that a simultaneously rigorous and intellectually galvanizing first-year experience improves retention. Our retention rates for Fall 2006 entrants was 79% in the first semester; by comparison, first semester retention rates for Fall 2007 and Fall 2008 entrants were 84% and 85%, respectively. In other words, in the first year of our curricular reform, our first semester retention rates increased by 5%, and the pattern held for both years subsequent to the reform.
Our FYE improved subsequent semesters’ retention rates as well. The year prior to the implementation of our curricular reform, our second semester retention was 71%; by comparison, our post-reform second semester retention rate was 77%. The implications of such an improvement are made more obvious once we consider its cumulative effect: whereas our first year retention rate for 2006-2007 was 56%, it was 65% for 2007-2008, a full 9% improvement in one year. Table 1: Retention Rates for Trinity College, by Cohort Entrants Fall 2006
(Pre-Reform) Entrants Fall 2007 (1st Year Post-Reform)
Entrants Fall 2008 (2nd Year Post-Reform)
1st to 2nd Semester Retention 79% 84% 85%
2nd to 3rd Semester Retention 71% 77% NA
3rd to 4th Semester Retention 79% 81% NA
4th to 5th Semester Retention 80% NA NA
5th to 6th Semester Retention 97% NA NA
It is worth noting that our curriculum was put in place just as we admitted that largest entrant class since the 1970s. In other words, the increase in retention represents a very substantial increase in the number of students we served since Fall 2007. Other collegiate yardsticks by which we are assessing the effects of curricular reform on student progress include academic standing reports, since probations and dismissals occur disproportionately in the first four semesters. Our data, which we summarize in Table 2, suggest that we had 112 CAS students on academic watch or probation and 11 dismissals in Fall 2008, compared to 146 cases of academic watch or probation and 14 dismissals in Fall 2007, and 140 cases of academic watch or probation and 7 dismissals in Fall 2006. As a proportion of class size, the numbers suggest a decrease in academic
425
Proceedings of the 5th Annual National Symposium on Student Retention. Copyright 2009. C-IDEA, The University of Oklahoma.
nonperformance from 28% in Fall 2006 to 26% in Fall 2007 to 20% in Fall 2008. Similarly, the proportion of students that earned a place on the Dean’s List for their work in Fall 2008, 22%, represents an increase of 3% over those in Fall 2007, 19%. Though our data are insufficient to discern definitive patterns, we can say that our students’ academic performance appears to be improving, in terms of both increasing measures of success and decreasing measures of failure. Table 2: Academic Standing at Trinity College, by Cohort Fall 2006 Fall 2007 Fall 2008
Trinity’s College of Arts and Sciences underwent a remarkable transformation in the 1980s and 1990s, moving away from educating elite, Catholic women and instead focusing its efforts on the new underserved population: women whose modest means and social circumstances make access to higher education a nearly impossible dream.
Such a transformation required that we not only provide more comprehensive services, but also that we offer a number of new ones. It also required, for the first time, that we consider attrition as a serious issue. While our graduation rates were certainly better than the national average for the population we served, we knew we could do better.
To do so, we first identified those factors that most seriously compromise our students’ persistence, particularly early attrition stemming from academic difficulties. Faculty and administrators then collaborated on designing a new General Education Curriculum. Its centerpiece is a First Year Experience that focuses on developing foundational skills that will ensure academic progress; moreover, we have infused the FYE with non-curricular initiatives intended to facilitate our students’ ability to navigate the transition from high school to university through such measures as Learning Communities headed by faculty advisors, early academic intervention programs headed by a dean of advising, and a variety of more granular initiatives intended to capitalize on our students’ tenacity and optimism.
Since the curricular reform was put in place, our data show a significant increase in retention. Whereas our historical retention rates for First Year students hovered at about 80% for the first semester and 70% for the second semester, for a FY retention rate of around 55%, we now are seeing a first-semester retention rate hovering around 85% and a second semester retention rate of 75%, for a FY retention rate of 64%. Moreover, the improvement persists since the reform, though the data are insufficient to declare victory over attrition quite yet.
The preceding overview of Trinity’s transformation and its effect on retention elides for the most part the many difficult discussions and decisions involved in our curricular reform, which ranged from disputes over credit counts to questions about the value of the degree we offer. It was not easy for us to publicly acknowledge that in embracing high-risk students, we would admit students who might read at an eighth grade level or struggle with concepts of basic algebra. The ability of our aggressive and pervasive assessment strategies to confirm that we actually can rectify students’ academic deficiencies has helped mitigate some of the stress of our transition and transformation. Mission has been even more important. While student demographics have changed at Trinity, our mission has not. The fact that
426
Proceedings of the 5th Annual National Symposium on Student Retention. Copyright 2009. C-IDEA, The University of Oklahoma.
Trinity remains faithful to its core institutional mission of service, particularly service to women, has been an anchor in the sea of change. Asked by some of the early Sisters of Notre Dame how to instruct their charges, order foundress St. Julie Billiart advised, “Teach them what they need to know.” This continues to be our mantra today. Although it is too early to know the full effects of our curricular reform on student progress and retention, we consider our progress to date a very encouraging chapter in our College’s ongoing story.
427
Proceedings of the 5th Annual National Symposium on Student Retention. Copyright 2009. C-IDEA, The University of Oklahoma.
References Carey, Kevin (2004). A Matter of Degrees: Improving Graduation Rates in Four-Year Colleges and Universities. Retrieved July 7 2008 from http://www2.edtrust.org/NR/rdonlyres/11B4283F-104E-4511-B0CA-1D3023231157/0/highered.pdf Greenwell, M. (2008, January 10). Md., Va. School Systems Ranked in Nation’s Top 5 Report Places the District Behind All States. The Washington Post, p. B1. McGuire, Patricia (2008a, April 15). 2007 Trinity CIRP Results First Time Full Time Freshmen In Fall 2007. Testimony of President Patricia A. McGuire Trinity Washington University Before the Senate Banking Committee. McGuire, Patricia (2008b, April 15). Regarding the Impact of the Credit Crunch on the Student Loan Market and College Students. Testimony of President Patricia A. McGuire Trinity Washington University Before the Senate Banking Committee, pp. 1-12. State Superintendent of Education (n.d.). Higher Education Financial Services DC Tuition Assistance Grant Program. Retrieved July 5 2008 from http://www.seo.dc.gov/seo/cwp/view,a,1225,q,560318,seoNav_GID,1511,.asp The Education Trust (2008). College Results Online. Retrieved July 5 2008 from http://www.collegeresults.org/search1a.aspx?institutionid=131876 Trinity Washington University (2006). Assessing Trinity 2000 – Approaching Trinity 2010: Self Study for Middle States Comprehensive Accreditation Review. Retrieved July 5 2008, from http://trinitydc.edu/about/middlestates/Trinity%20Middle%20States%20Report%20Complete.pdf Trinity Washington University (2006). Trinity: Committed to the Education of D.C. Students. Retrieved July 5 2008 from http://trinitydc.edu/dc/
428
Proceedings of the 5th Annual National Symposium on Student Retention. Copyright 2009. C-IDEA, The University of Oklahoma.
Panel Sessions
Panel Session 1 – Dual Enrollment
Panel Overview: What is the relationship between Dual Enrollment and Student Success? Panels will be discussing how Dual Enrollment has worked at their institutions. Presenters from the University of Texas at Brownsville and Texas Southmost College and North Iowa Area Community College will also be addressing many of the questions asked about the benefits and implications of dual enrollment programs.
Dual Enrollment: On Ramp to College Success
Linda Fossen Blanca Trevino Bauer Matthew Johnson The University of Texas at
Abstract: The purpose of this study was to assess the impact of dual enrollment (DE) course experiences on first-time-freshmen (FTF) by comparing the outcomes of dual enrollment students who entered the institution after high school graduation with the outcomes of students who entered the institution with no DE credits (NDE). The study examined differences in the proportion of DE and NDE students who require at least one developmental education course, the average number of semester credit hours each group enrolled in during their first semester, their average grade point average (GPA) after their first semester, and their retention rate after one year. Data for this study was obtained from 6,812 official student records of first-time-freshmen (FTF) who entered The University of Texas at Brownsville and Texas Southmost College (UTB/TSC) during the fall semester from 2005 to 2008. Across all semesters, a larger proportion of students who entered with DE credits were college ready compared to their peers who had no DE credits. In addition, DE students enrolled in a greater number of semester credit hours than their NDE peers. Data indicated by t-tests revealed significant differences between DE and NDE groups in terms of the average number of semester hours enrolled across all semesters (all t > 6, p < .001) and when semesters were aggregated. Students with DE credit earned higher GPAs than NDE students in two of the four semesters analyzed, and DE students were more likely to return to college during the following year relative to NDE students (all p < .001). Implications for policymakers and practitioners are provided at the conclusion of the study.
The Benefits of Dual Enrollment: Graduation Advantages
Michael Morrison Karen Pierson North Iowa Area Community College North Iowa Area Community College
Abstract: The purpose of this study was to assess the impact of acceleration (dual enrollment) on college graduation at the associate degree level. Over 9,200 student records from 1996 to 2006 at
429
Proceedings of the 5th Annual National Symposium on Student Retention. Copyright 2009. C-IDEA, The University of Oklahoma.
Panel Sessions, cont’d Dual Enrollment, cont’d North Iowa Area Community College were analyzed in a multivariate logistics regression model. Full and nested models were tested providing evidence that Acceleration significantly predicts graduation. Holding all other independent variables constant the odds that an accelerated student graduates compared to a non-accelerated student is about 61% greater than the odds of a non-accelerated student graduating. At the 95% level of confidence degree attainment for accelerated students ranges from a minimum of 43% greater than to at most 81% greater than the odds of a non-accelerated student graduating. Acceleration improves graduation probabilities (total effects) and marginal effects for students across all identified percentile ranges. For accelerated 75th percentile females their estimated graduation probability is nearly 78%. Male student outcomes do not equal female graduation outcomes but acceleration improves male student graduation probabilities. The effect of other covariates (high school GPA, first term credits, first term GPA and gender) on college graduation is also examined. Policy implications to address national strategic issues are provided at the conclusion of the study.
430
Proceedings of the 5th Annual National Symposium on Student Retention. Copyright 2009. C-IDEA, The University of Oklahoma.
Panel Sessions, cont’d
Panel Session 2 – Programs to Engage African American Students
Panel Overview: Retention and completion rates for underrepresented minority males are significantly lower than their other classmates. The panelists from the University of Arkansas, Southern Arkansas University, and Arkansas State University will discuss programs at their institutions which are making a difference in the retention and completion of these students.
Student African American Brotherhood & Brother-2-Brother: Retaining Black & Latino Males in Higher Education
Abstract: The Student African American Brotherhood (SAAB) Organization is a dynamic organization established to assist African-American and Latino males excel academically, socially, culturally, professionally, and in the community. Over the past decade, SAAB has improved the retention of African American and Latino males by helping 80% of SAAB participants persist from their freshman to sophomore year and helping 86% graduate. The SAAB program has attracted national attention as an innovative prototype for personal and academic enrichment, and has been successfully expanded to serve students at both public and private four-year institutions, including both predominantly white and historically Black institutions. Brother-2-Brother:Brother-2-Brother was designed to focus on the retention and refinement of African American men. While many from this group choose to join fraternal organizations, a large majority opt not to affiliate with such groups. Research has shown that students who are more involved in co-curricular activities tend to persist and graduate at a higher rate. With this goal in mind, Brother-2-Brother was established to intentionally expose African American men in higher education to opportunities, organizations, and accomplished professionals that will help them to see college as a means to an end and not the final destination.
431
Proceedings of the 5th Annual National Symposium on Student Retention. Copyright 2009. C-IDEA, The University of Oklahoma.
Panel Sessions, cont’d
Panel Session 3 – Early Alert Panel Overview: Is it possible to identify students at risk for failing or dropping out before it is too late? The panelist from Carroll University and the University of North Texas will be discussing successful early alert systems at their institutions. Practical examples of how students are identified, how the strategies for intervention, and effectiveness will be addressed.
Carroll University's Retention Alert System
Kyle Hawkins Jeff McNamara James Wiseman Elizabeth Towell Carroll University Carroll University Carroll University Carroll University
Abstract: In partnership with Jenzabar, Carroll University has developed and implemented a Retention Alert System (RAS) to help organize activities and data resources aimed at student persistence. The system utilizes a mathematical model derived from historical retention data and applies that model to current students to calculate a probability of an individual student leaving Carroll. The model was built off of a logistic regression tool in SPSS combining both static variables such as academic ability, and dynamic variables such as the number of unfavorable grades. This system updates every night and alerts us about at risk students and provides us with a mean to track changes in their probability. Carroll has hired a full time Director of Student Success who uses this data along with reports from a web based alert system available campus-wide, to coordinate, customize, and implement intervention strategies for students at risk of leaving Carroll. The system is only in its infancy but we have already learned much more in identifying significant retention variables, developing intervention strategies, and implementing more proactive processes in alerting the Director of Student Success of at risk students.
Abstract: Early alert systems offer institutions systematic approaches to identifying and intervening with students exhibiting at-risk behaviors. Many of these systems rely on a common format for student referral to central receiving point. Systems at larger institutions often use web-based technology to allow for a scalable (available campus-wide) approach to at-risk intervention. This paper describes the development and implementation of a web-based, fully integrated early alert referral system at a large, public university in the Southwest. After a brief review of the academic early alert concept, the paper describes the development of the system from a conceptual perspective, including how administrative, faculty, and student service input guided development. The next section details the technical aspects of system design, presented from the end-user perspective, emphasizing the integration of the system into the campus student information system. The following section includes a thorough description of the first term’s experience implementing the system, including aggregated descriptive data for those using the system, the students referred, and the follow-up to the referrals. Initial analysis indicates a modest positive relationship between personal follow-up to referral and student success. The paper concludes with recommendations for research and practice.
432
Proceedings of the 5th Annual National Symposium on Student Retention. Copyright 2009. C-IDEA, The University of Oklahoma.
Panel Sessions, cont’d
Panel Session 4 – Mentoring
Panel Overview: We know that mentorship is extremely helpful in the development of professionals within higher education. What about mentorship for students? There is research that suggests that students benefit academically and socially from mentorship programs. The panelists from Penn State Altoona, St. Xavier University, and the University of Connecticut will discuss mentorship programs at their institutions, providing examples of how it have been implemented and how they are impacting student success.
OASIS-Opportunity and Action to Stay in School
Joy Himmel Jamie Pyo Linda Strauss Penn State University Altoona Penn State University Altoona Penn State University
Abstract: Opportunity and Action to Stay in School, (OASIS), is a mentoring program for second semester freshmen at Penn State Altoona who have a GPA lower than 2.0 at the end of their first semester. Through weekly meetings, the faculty/staff mentors work with the students to identify areas of concern, goals, and provide overall support and guidance. The objectives of this program focus on academic, emotional and behavioral assessment, goal development, and utilization of resources. Student progress is measured by fall and spring GPA and pre and post Learning and Study Strategies Inventory (LASSI) scores. LASSI is an assessment tool designed to measure students use of learning and study strategies. Among participants, GPA and LASSI scores significantly increased by 0.6305 and 52.68 points on average, respectively, after they finished the program. Control group students did not statistically improve their grades. When we look at retention to the sophomore year, 87.5% of OASIS students returned in comparison to 60.8% of non-participants who were program eligible. Average GPA for OASIS participants and non-participants in fall- 1.3; spring GPA for OASIS participants was 2.1 and non-participants- 1.43.
The Effect of Traditional Peer-Mentoring vs. Hybrid Peer-Mentoring on Student Retention and Goal Attainment
Abstract: This research report describes the preliminary analysis of the data gathered on two distinct approaches used in a college peer-mentoring program--traditional peer- mentoring and hybrid (traditional and online) peer-mentoring interventions--respective to their effects on student retention and goal attainment. The targeted population consisted of 35 freshman and sophomore students (protégés) who were mentored by 12 upperclassmen--juniors and seniors in good academic standing. The participants were randomly assigned to one of two groups: a traditional peer-mentoring group or hybrid peer-mentoring group. This pilot study sought to determine if mentors and protégés participating in a face-to-face traditional peer-mentoring group had different measurable outcomes respective to retention and goal-attainment as compared to
433
Proceedings of the 5th Annual National Symposium on Student Retention. Copyright 2009. C-IDEA, The University of Oklahoma.
Panel Sessions, cont’d
Mentoring, cont’d mentors and protégés who experienced face-to-face mentoring, plus participated in a hybrid peer-mentoring experience. Individual protégés participating in the traditional peer-mentoring group individually met weekly for up to 90 minutes with their mentors, developed goal plans, reported progress towards attaining goals and participated in monthly group meetings. Individual protégés participating in the non-traditional hybrid peer-mentoring group met weekly for up to 90 minutes with their mentors, developed goal plans via an online program called the Aliveguide, reported progress towards attaining goals, and participated in monthly group meetings.
434
Proceedings of the 5th Annual National Symposium on Student Retention. Copyright 2009. C-IDEA, The University of Oklahoma.
Panel Sessions, cont’d
Panel Session 5 – Bridging the Student Experience for Success
Panel Overview: Many students come to college unaware of the expectations and unprepared to fulfull those expectations. Higher Education professionals are increasingly interested in how to bridge the gaps between K-12, community colleges, and 4-year institutions to provided better continuity to the student experience. The panelists from Cheyney University of Pennsylvania, Heidelberg University, and Chaminade University of Honolulu will be discussing several bridging activities that show how higher education is making connections in the K-12 environment, after high school graduation, and continuing into the first year to support students.
A Touch of CLASS: Cheyney University
Shelly Weeks-Channel Marlene Archie Cheyney University of Pennsylvania Cheyney University of Pennsylvania
Abstract: The research literature suggests that racial and ethnic minorities in large metropolitan areas face extreme disparities within the American public education system. They are not being prepared to share equal partnership in all social groups. In Philadelphia alone, less than one-half of students in public schools complete high school. The problem is that “the much higher rates of high school completion among these minorities’ suburban counterparts – who may literally live and attend school right around the corner – place in a particularly harsh and unflattering light the deep undercurrents of inequity that plague American public education” (EPE Research Center, 2008). Add to this reality the recent attention and concern regarding a projected decline in students attending colleges and universities over the next decade. We implemented a ten-week educational program to 6th, 7th, and 8th graders, and conducted a comparative analysis of the middle schoolers and ninth graders on “education knowledge” and “educational attitudes” using a survey instrument. Results revealed more positive outcomes for 6th, 7th, and 8th graders than 9th graders. Findings suggest inner-city youth are more likely to benefit from early intervention strategies where opportunities are provided for students to build their skills regarding admission to and success in university education.
Students Staying on Track and Reaching Toward Success - A Retention Program for At-Risk First Year College Students
Abstract: The number of under-prepared students attending college is growing and has not been matched by increases in success or retention rates. A first year program designed to meet students’ needs was implemented to provide needed student support services in a small, rural, liberal arts university. Assessment of the program in terms of semester to semester, fall to fall retention rates, and academic performance resulted in support for and modification to the program. Between 2006 to the present the program has been continuously evaluated and revised
435
Proceedings of the 5th Annual National Symposium on Student Retention. Copyright 2009. C-IDEA, The University of Oklahoma.
Panel Session, cont’d Bridging the Student Experience, cont’d to enhance the academic success of these students resulting in moderate increases in student success and retention. This paper will examine the results of the past three years of an intentional, mandatory skill development and advising program for incoming at-risk students in a small liberal arts university.
Summer Bridge and Conditional Admits at a Small Private Institution
Abstract: Chaminade University is a small, private Catholic institution in Hawaii. We have been operating a summer bridge program for conditionally admitted students for the past 7 years. The program was originally designed for students who needed pre-college work in English and/or Math, but it has since grown to include a variety of other “at-risk” students as well. From 2002, when we had 11 students arrive, to 2008, when we had 52–the program has increased in size and scope. A longitudinal look at the experience of students indicates that they like the program, and their retention and graduation rates match those of the institution overall. This paper will look at the challenges, successes and assessments of the program over the seven years of operation.
436
Proceedings of the 5th Annual National Symposium on Student Retention. Copyright 2009. C-IDEA, The University of Oklahoma.
Panel Session, cont’d
Panel Session 6 – The Consortium
Sandra Whalen Blake Cannon CSRDE, The University of Oklahoma CSRDE, The University of Oklahoma
Abstract: The Consortium for Student Retention Data Exchange began in 1994 as a collaboration among Institutional Researchers who were interested in benchmarking student retention. Since then it has grown into a research consortium of almost 650 two-year and four-year institutions. The consortium members benchmark the retention and graduation rates of community college students, community college transfers into the 4yr institution, baccalaureate degree seekers, and STEM majors. We've gone beyond swapping data to sharing knowledge by sponsoring the National Symposium on Student Retention and our annual monthly webinar series on the most current research. Come learn more about the CSRDE and about how the CSRDE can support your efforts to improve student success. This session will also showcase the technology tools available to CSRDE institutional representatives.
437
Proceedings of the 5th Annual National Symposium on Student Retention. Copyright 2009. C-IDEA, The University of Oklahoma.
Panel Presentation at the 5th Annual National Symposium on Student Retention, Buffalo, NY. September 30-October 2, 2009
Student African American Brotherhood
Robert C. Mock Jr., Ed.D. Assistant Vice Chancellor for Student Affairs
Abstract – Student African American Brotherhood (S.A.A.B) was designed to focus on the retention and refinement of African American men. While many from this group choose to join fraternal organizations, a large majority opt not to affiliate with such groups. Research has shown that students who are more involved in co-curricular activities tend to persist and graduate at a higher rate. With this goal in mind, Student African American Brotherhood was established to intentionally expose African American men in higher education to opportunities, organizations, and accomplished professionals that will help them to see college as a means to an end and not the final destination.
Introduction
Dr. Tyrone Bledsoe founded the Student African American Brotherhood Organization on the campus of Georgia Southwestern State University, October 17, 1990. S.A.A.B has grown to more than 185 chapters across college campuses and high schools in 39 states throughout the United States (Bledsoe, 2008). The S.A.A.B. chapter at the University of Arkansas has developed and implemented programs dedicated to helping African American males maximize their potential (Bledsoe, 2008). SAAB History at the University of Arkansas
An initial discussion between Dr. Joseph Seabrooks who was the Assistant Vice Chancellor for student affairs at that time and Quantrell Willis who was an alumnus at the University of Arkansas, about the experiences of African-American men at the University of Arkansas prompted the two to explore the possibility of creating a S.A.A.B. chapter at the U of A. After the discussion, they garnered the participation of 3young men who were pursuing their undergraduate studies at the University of Arkansas. Through much brainstorming and careful planning these 5 African-American men laid the foundation for what is now one of the most respected organizations on the University of Arkansas campus. S.A.A.B. was recognized as an official registered student organization of the University of Arkansas in September of 2006.
Mission
In order to empower and promote brotherhood, the brothers of Student African- American Brotherhood, embrace the principles of accountability, proactive leadership, self-discipline, and intellectual development. Through our beliefs and convictions, we uphold this mission at all times. I am my brother’s keeper, and together we shall rise. Through the mission, the S.A.A.B. chapter at the University of Arkansas has developed and implemented programs dedicated to helping African- American males maximize their potential.
438
Proceedings of the 5th Annual National Symposium on Student Retention. Copyright 2009. C-IDEA, The University of Oklahoma.
Panel Presentation at the 5th Annual National Symposium on Student Retention, Buffalo, NY. September 30-October 2, 2009
Black Experience
Student African-American Brotherhood sponsored several programs and events that were held at the University of Arkansas. Alonzo Jones from Arizona State University visited the University of Arkansas campus. Mr. Jones gave the U of A campus community a general overview of the black experience; from historical time periods leading to this current period. He concluded with an examination of the multiple identities shared through the black experience, and the importance of protecting the central identity of students in preparing for cultural, family, and personal development. It’s Easier than you think
SAAB also hosted Tobias Brown, who spoke about the 5 principles that students can use to instantly boost their GPA. Students left the experience understanding how to apply the 5 principles in their daily lives. They were given action items to instantly improve their overall grade point average. Furthermore, they were excited about emerging as top students, able to share information learned with fellow students. The Cooperation of the Word Nigger
Another program implemented by SAAB was “The Cooperation of the N-Word” with Bryant Smith as the guest speaker. This interactive workshop was designed to examine the methods used to mainstream the word “nigger” through popular culture. The program provided historical and theoretical background for the word and gave its cultural significance in present day race relations and popular culture. The programs showed how the globalization of hip hop as a culture, especially the popularity of rap music throughout the world raises concern about the images of Black, Latin, and other people of color. Cooperation of the Word Nigger Program Evaluation
From the results of The Cooperation of the Word “Nigger” program assessment, participants rated the overall program as follows: 28 out of 40 individuals responded to the program as Excellent. 12 out of 40 individuals responded to the program as Good.
The presenters enthusiasm, knowledge of the topic, preparation, and ability to communicate the material effectively was rated as follows: 36 out of 40 individuals responded Excellent, 3 out of 40 responded Good, 1 out of 40 individuals had No response.
439
Proceedings of the 5th Annual National Symposium on Student Retention. Copyright 2009. C-IDEA, The University of Oklahoma.
Panel Presentation at the 5th Annual National Symposium on Student Retention, Buffalo, NY. September 30-October 2, 2009
All of the participants of the evaluation would recommend this program to a friend.
The Box of Horrors SAAB presented The “Box of Horrors,” an experiential learning activity that puts ten of the
hottest issues in America in their proper context for participants to experience. The “Box of Horrors” exposed the participants to societal issues and historical truths about the following: Native American genocide and the trail of tears, the African slave trade, the Jewish holocaust, domestic violence, police brutality, sexual assault; homelessness in America, hate groups, issues for individuals with disabilities, and prostitution. Box of Horrors Program Evaluation From the results of The “Box of Horrors” program evaluation, participants rated the overall program as follows: 64 out of 90 individuals responded excellent. 24 out of 90 individuals responded Good, 1 out of 90 individuals responded Fair. 1 out of 90 individuals had No Response.
The presenters enthusiasm, knowledge of the topic, preparation, and ability to communicate the material effectively was rated as follows: 74 out of 90 individuals responded Excellent, 14 out of 90 individuals responded Good, 1 out of 90 individuals responded Fair, 1 out of 90 individuals had No response.
Participants indicated that they would recommend this program to a friend. 88 out of 90 individuals responded - Yes. 1 out of 90 individuals responded No. 1 out of 90 individuals had no response.
440
Proceedings of the 5th Annual National Symposium on Student Retention. Copyright 2009. C-IDEA, The University of Oklahoma.
Panel Presentation at the 5th Annual National Symposium on Student Retention, Buffalo, NY. September 30-October 2, 2009
SAAB Retention Rate
In 2005, SAAB established its first at the University of Arkansas with 23 founding members. In 2006 the new membership numbers were 7 students bringing the new total membership to 30 students. In 2007 the new membership number increased to 12 students and 13 members joined in 2008. Students join SAAB at different academic status levels. The retention rate for African American students for their 2nd year is 79.1%, 3rd year 75.5%, 4th year 65.9% and 6th year graduation rate is 43.9%.( Office of Institutional Research, 2008).Thus a cohort potentially could be comprised of freshman, sophomores, juniors, and seniors. Student African American Brotherhood Participants 2005-2006 Cohort # of African Am males in SAAB 23 Graduated as of SP 2009 9 Enrolled in 2009 10 Transferred 4 Unknown 0 Total graduated or still enrolled as of Spring 2009 82.60% Student African American Brotherhood Participants 2006-2007 Cohort # of African Am males in SAAB 7 Graduated as of SP 2009 1 Enrolled in 2009 6 Transferred 0 Unknown 0 Total graduated or still enrolled as of Spring 2009 100% Student African American Brotherhood Participants 2007-2008 Cohort # of African Am males in SAAB 12 Graduated as of SP 2009 1 Enrolled in 2009 10 Transferred 2 Unknown 1 Total graduated or still enrolled as of Spring 2009 75%
441
Proceedings of the 5th Annual National Symposium on Student Retention. Copyright 2009. C-IDEA, The University of Oklahoma.
Panel Presentation at the 5th Annual National Symposium on Student Retention, Buffalo, NY. September 30-October 2, 2009
Student African American Brotherhood Participants 2008-2009 Cohort # of African Am males in SAAB 13 Graduated as of SP 2009 0 Enrolled in 2009 13 Transferred 0 Unknown 0 Total graduated or still enrolled as of SP 2009 100% *Retention to be determined Fall 2009 Student African American Brotherhood Participants 2005-2009 Total # of African Am males in SAAB 55 Graduated as of SP 2009 11 Enrolled in 2009 39 Transferred 6 Unknown 0 Total graduated or still enrolled as of Spring 09 90.90% University of Arkansas Office of Institutional Research (2008). Conclusion
Student African-American Brotherhood operates through student run chapters on college and high school campuses throughout the nation. SAAB members excel, socially, culturally, spiritually and in service to the community. SAAB has been a great asset to the University of Arkansas campus and community. The programs sponsored by SAAB were beneficial. Surveys indicated that the majority of the participants who attended the Student African American Brotherhood sponsored programs were very satisfied with the learning outcomes and the programs. References: Bledsoe, T. (2008) Student African American Brotherhood
www.2cusaab.org University of Arkansas Retention and Graduate Report. October 30, 2008, Office of Institutional Research.
Abstract – Brother to Brother was designed to focus on the retention and refinement of African American men. While many from this group choose to join fraternal organizations, a large majority opt not to affiliate with such groups. Research has shown that students who are more involved in co-curricular activities tend to persist and graduate at a higher rate than those who do not. With this goal in mind, Brother to Brother was established to intentionally expose African American men in higher education to opportunities, organizations, and accomplished professionals that will help them to see college as a means to an end and not the final destination. Introduction
This panel will explore programs at 3 different institutions in Arkansas geared towards retaining the African American male. State University is an institution with an enrollment of approximately 11,000 students, presently with admissions requirements of a minimum 2.00 grade point average and no minimum ACT requirement. This institution is contrasted with the other two panel members’ institutions being the flagship institution with an enrollment of over 19,000 and admissions requirements of 3.00 grade point average and minimum 20 ACT and the 3rd institution being located in rural South Arkansas with an enrollment of approximately 3,100, minimum 2.00 grade point average required and minimum ACT of 16. Background Southern Arkansas University is a predominantly white, regional, comprehensive university with an enrollment of approximately 3,100 students. The average ACT composite during the 2007/2008 school year was 20.8. Approximately 1,000 (30%) African American students are enrolled, to include approximately 400 men.
Cordara and Obrion are two African American male juniors at Southern Arkansas University. Both students were admitted to the University with an ACT composite of 16, the minimum requirement. Cordara is an actively involved student, who maintains a 3.20 grade point average. He is a member of and holds positions of leadership within a fraternity, the President’s Ambassadors, the Black Students Association, Genesis Ministry Choir and he is a Residents Assistant. Additionally, Codara has been selected for an internship in London, England during the summer of 2009.
Conversely, Obrion is not affiliated with any organizations; he does not support campus activities and spends a number of hours each day playing dominoes in the student center. Obrion started the year on academic probation and ended it on academic suspension. Additionally, he
443
Proceedings of the 5th Annual National Symposium on Student Retention. Copyright 2009. C-IDEA, The University of Oklahoma.
Panel Presentation at the 5th Annual National Symposium on Student Retention, Buffalo, NY. September 30-October 2, 2009
spent a lot of out-of-class time pursuing romantic interludes with the opposite sex. As a result, he recently became an unwed father.
While both young men are from similar backgrounds, they are experiencing to totally different matriculations. Cordara is on track to graduate with honors and a plethora of experiences that will translate to capable leadership. He will be a significant contributor to society. Obrion, on the other hand, is the student that Brother-to-Brother was established to capture and refine. That student that possesses potential but lacks guidance and direction is representative of a significant portion of the African American male population at SAU. Michael Cuyjet reported Shaun Harper’s findings that posited “involvement is central to the success of the African American male collegian, as he is highly likely to reap a return on the investments in his experience.” It has been suggested that time is the most precious resource during the college years and that the way in which students spend that time affects what they learn and gain from college (Astin, 1984).
African American male students were achieving, persisting, and involved in campus organizations and activities at significantly lower rates than other demographic groups at Southern Arkansas University. As a result, surveys were conducted and meetings convened to discover reasons for the lackluster performance of the Black men on campus. From those meetings, it was discovered that Black men did not access campus resources effectively, and generally, did not connect with the culture of the campus (based on the lack of co-curricular involvement).
Brother-to-Brother In an effort to enhance and refine the ethos of African American male college students, Brother-to-Brother was established in the fall of 2007, at Southern Arkansas University. The primary goals of the program are (1) to provide a forum for African American male students to become more aware of campus resources, opportunities, organizations, and activities, (2) to assist with and promote the progression towards graduation, (3) to provide opportunities to develop leadership among African American male students who are not actively involved in campus organizations, and (4) to expose participants to accomplished African American male faculty, staff, administrators, alums and community leaders.
The program is open to any interested student but it targets Black male students and their interests and issues. Currently, a “shotgun” approach has been taken, in that the program reaches out to all Black men on campus, however there has been consideration to narrow the focus to a select few, due to a lack of staff and the need for greater intervention.
Mentoring
Mentoring is facilitated through peer and professional interactions. Those students who
have demonstrated academic and social success are matched with students in need of a “road map” and an example of “it can be done.” Additionally, Black male faculty, staff and administrators often interact with students during the monthly meetings and are readily available to counsel students in need of assistance with individual issues and challenges. Meeting topics lend themselves to the expertise of Black men from within the community to address the group, thus providing opportunities for networking. Positive Black male interaction among peers, faculty, staff, administrators and community leaders has proven to enhance the campus environment for African American students (Brown, 2006).
444
Proceedings of the 5th Annual National Symposium on Student Retention. Copyright 2009. C-IDEA, The University of Oklahoma.
Panel Presentation at the 5th Annual National Symposium on Student Retention, Buffalo, NY. September 30-October 2, 2009
Challenges Challenges facing the program are somewhat daunting. Because the target is approximately 400 Black men on campus, the need to provide effective intervention is grossly hindered. Ideally, intervening with faculty before academic issues arise or as they arise should take place. The Office of Multicultural Services is staffed with one professional and a graduate assistant and the scope of providing tailored services for 400 men, not to mention the female students of color, is an enormous task.
Additionally, the Reynolds Campus and Community Center is the campus student center and many of our Black male students congregate there, despite the fact that “hanging out” is strongly discouraged. And as its name suggests, the Reynolds Center is open to community activities and campus tours. That being said, the manner in which Black male students communicate and interact with each other is often perceived as hostile and offensive. So the lack of space that can be deemed the “Brothers’ hang out” presents the challenge of gaining trust and confidence from the group when presenting strategies for their success.
Another challenge is communicating with the group to advertise the resources, meetings
and activities. Emails, mail-outs and campus flyers have proven ineffective. Often, information is disseminated through word-of-mouth communication and it’s not always guaranteed to reach the individuals who really need it. Efforts to compile a database of cellular phone contacts are underway. Research Southern Arkansas University Black Male Retention Rates by Cohort 2005
020406080100
2005 2006 2007 2008 2009 2010 2011
Fall (Began)
% Retained
445
Proceedings of the 5th Annual National Symposium on Student Retention. Copyright 2009. C-IDEA, The University of Oklahoma.
Panel Presentation at the 5th Annual National Symposium on Student Retention, Buffalo, NY. September 30-October 2, 2009
Southern Arkansas University Black Male Retention Rates by Cohort 2006 Southern Arkansas University Black Male Retention Rates by Cohort 2007 Conclusion While the challenges are sometimes overwhelming, the need to provide opportunities for the success of Black men on campus greatly outweighs the challenges and setbacks. Producing more Cordara-esque students (academically successful and intensely involved in co-curricular activities) is the driving principle to continue efforts to reach out to as many Black male collegians as possible. Passion, education, research, staying current on best practices, and knowledge of the Black man on campus are all contributors to the success of Brother-to-Brother. There is room for improvement and a desire to consistently do so.
0
20
40
60
80
2006 2007 2008 2009 2010 2011 2012
Fall (Began)
% Retained
0
20
40
60
80
100
2007 2008 2009 2010 2011 2012 2013
Fall (Began)% Retained
446
Proceedings of the 5th Annual National Symposium on Student Retention. Copyright 2009. C-IDEA, The University of Oklahoma.
Panel Presentation at the 5th Annual National Symposium on Student Retention, Buffalo, NY. September 30-October 2, 2009
Student African American Brotherhood & Brother to Brother: Retaining Black Males in Higher Education
Lonnie R. Williams, Ed.D.
Associate Vice Chancellor for Student Affairs Arkansas State University
Abstract- Brother to Brother was designed to focus on the retention and refinement of African American men. While many from this group choose to join fraternal organizations, a large majority opt not to affiliate with such groups. Research has shown that students who are more involved in co-curricular activities tend to persist and graduate at a higher rate. With this goal in mind, Brother to Brother was established to intentionally expose African American men in higher education to opportunities, organizations, and accomplished professionals that will help them to see college as a means to an end and not the final destination. Introduction
This panel will explore programs on 3 different institutions in Arkansas geared toward retaining the African American male. State University is an institution with an enrollment of approximately 11,000 students, presently with admissions requirements of a minimum 2.00 grade point average and no minimum ACT requirement. This institution is contrasted with the other two panel members’ institutions being the flagship institution with an enrollment of over 19,000 and admissions requirements of 3.00 grade point average and minimum 20 ACT and the 3rd institution being located in rural South Arkansas with an enrollment of 3,150, minimum 2.00 grade point average required and minimum ACT of 16. Background
In 2006, State University created an organization called Brother to Brother to assist in the retention of African American males. With an enrollment of over 11,000 students and an African American enrollment of over 1,900, retention and graduation rates for African American males were a concern. As Schmidt (2008) reported, “The overall college performance of black men is so poor that some college officials and advocates for black students are reluctant to even talk about the problem, for fear that doing so will further stigmatize black men and make things even worse.” We were not hesitant to talk about it on campus, but the situation had persisted so long that the subject seldom received much traction. The class of 2002 six year graduation rates for whites is 43 percent, blacks 23 percent and others 32 percent. In 2003, the six year graduation rate for black males was 16 percent. First to second year retention for black males was 56 percent in 2006. Average ACT score for blacks for 2008 was 17.8 and average high school grade point average for entering black males was 2.59
While these numbers are alarming, they are not much different than national numbers. Nealy (2009) reported on national numbers presented by Dr. Shaun Harper. “According to Harper’s research, 67.5 percent of black male freshmen never complete their degrees.”
The low graduation rate can be attributed to a number of factors including the low admission requirements for entering the school with no minimum ACT score required. By having a minimum 2.00 grade point average requirement, the institution is just one step ahead of open admissions. Remediation is a problem with 76 percent of first-year African Americans requiring some type of remediation.
447
Proceedings of the 5th Annual National Symposium on Student Retention. Copyright 2009. C-IDEA, The University of Oklahoma.
Panel Presentation at the 5th Annual National Symposium on Student Retention, Buffalo, NY. September 30-October 2, 2009
Brother to Brother Program
The Brother to Brother Program and its sister program, Circle of Trust, were created in 2006 to turn the tide on retention and graduation rates for both black males and females. Although data is not being presented on the female program, Circle of Trust, the program has had much greater success than the Brother to Brother program in terms of the retention rates for its members compared to non-members. The mission was to provide an avenue to increase the retention rates of black male students by providing a nurturing environment based on promoting campus connectedness, character development, and mentoring.
There is no pre-selection process for participation in the program. No minimum grade point average, major, or hours. Any black male can participate in the program from first-year student to seniors. The officers generally set up a table in the student union to pass out flyers on the program announcing meeting times and places and membership is taken from those that show up. Occasionally, some students will be referred by advisors and on rare occasions by the Student Conduct office. The composition of the group is 20 percent first-year, 41 percent sophomore, 35 percent are juniors and 4 percent are seniors. Mentoring
The mentoring aspect of the program is done with faculty, administrators and staff members in professional positions. Each mentor is assigned a certain number of mentees, generally 4 -6, with whom he would maintain contact thru bi-weekly meetings/visits. In addition, the program participants would meet once a month with a featured speaker i.e. one of the mentors presenting a program or some other campus individual or office with information deemed pertinent to the participants.
By exposing the group to all of the mentors on a monthly basis, students discover resources to assist them in navigating the campus culture and pitfalls that may await them. The influence the mentors have on the participants can not be overstated. One of the most interesting dynamics to watch is at the first meeting, the number of participants that show up with their pants sagging and how that number decreases as the semester goes (decreases because they start to take more pride in themselves and start to immolate the upper classmen and mentors). Weakness
The flaw with the development of this program was lack of funding and a dedicated person to operate the program. In contrast to the Circle of Trust, a graduate student was found with an interest in the program with good organizational skills. The male program did not have such a person. The program was created out of the office of diversity, but was being coordinated by a graduate student who did not have the organizational skills to manage the program. This happened in two consecutive years with two different graduate students, thus the program has not experienced the success envisioned. With proper organization, a coordinator fully monitoring the participants’ activity and coordinating things for the mentors, the potential for the program is enormous as can be seen from the preliminary data gathered for this presentation in the chart below. Our plan for the upcoming year is to work on locating a responsible coordinator and pitching the program to parents during orientation sessions during the summer to increase the enrollment of first-year students. Mid-term grade monitoring and advising is a component of the program that has been missing. It could play a vital role in retention and academic progress. When looking at the students no longer enrolled, 75 percent of the program participants had grade point averages of less than a 2.00 compared to 72 percent of non-participants, which indicates a need for more assistance with academic support at the institution.
448
Proceedings of the 5th Annual National Symposium on Student Retention. Copyright 2009. C-IDEA, The University of Oklahoma.
Panel Presentation at the 5th Annual National Symposium on Student Retention, Buffalo, NY. September 30-October 2, 2009
Conclusion As stated previously, upper classmen can participate in the program. In the two years of the
program, 7 upper-classmen (7 percent) have graduated compared to 8 non-participants (2 percent). When you look at the “total graduated or still enrolled,” 56.4 percent of the participants have graduated or still in school compared to 38.3 percent of the non-participants. The attrition rate for the program is 43. 6 percent compared to 61.8 percent of non-participants. First to second year retention rate for the institution for black males 55.8 percent in 2006 to 63.5 percent in 2007. Grade wise, 54 percent of the participants have a 2.50 grade point average or higher compared to 43 percent of non-participants. Only 9 percent have less than a 2.00 grade point average compared to 16 percent for non-participants.
The preliminary data looks very promising for the program. It shows the program can have a positive affect on increasing the retention rate of the students.
Brother To Brother
Participants Non-
Participants
2006/2007
2007/2008 Total
African Am. Males
Number of African American Males 46 48 94 400 Graduated 6 1 7 8Enrolled Spring 2009 14 32 46 145
Total Graduated or Still Enrolled 20 33 53 153Total Graduated or Still Enrolled as a % of
Total 43.5% 68.8% 56.4% 38.3% Not Graduated - Not Enrolled 26 15 41 247Total Not Graduated or Not Enrolled as a %
of Total 56.5
% 31.3
% 43.6
% 61.8%Success Rate Comparison - Brother to Brother Participants vs. Other Non-Participant African American Males References: Nealy, M. (Feb. 11, 2009). Black males achieving more on college campuses. Diverse Issues in
Higher Education. Schmidt, P. (Oct. 10, 2008). Colleges seek key to success to black men in classroom. The Chronicle of
Proceedings of the 5th Annual National Symposium on Student Retention. Copyright 2009. C-IDEA, The University of Oklahoma.
Posters Presented
The following poster session was sponsored by Hobsons. Hobsons U.S. is a leader in the business of delivering solutions that support education professionals in the preparation, recruitment, management, and advancement of students. More information can be found at http://hobsons.com.
Hobsons EMT Retain: Improve Student Retention by
Integrating Institutional Changes, Student Resources and Technology
Abstract: Hobsons’ EMT Retain product identifies at-risk students and optimizes campus communications to specifically target them and intervene.EMT Retain is a Web-based retention and communication application, designed to assist campuses in identifying at-risk students quickly. This product allows institutions to determine their strategic communication goals and develop a strong communication plan targeted to students considered at risk due to financial, academic, or social factors. With EMT Retain, institutions are able to streamline communications and administrative tasks with an early alert automation process, allowing campus staff more availability to personally interact with at-risk students.
Breaking the Promise: Examining the Gap Between State Policy Adoption and Institution-level Implementation
Abstract: In December of 2006 Governor Jennifer Granholm signed into law the Michigan Promise Grant Act (Act 479), guaranteeing $4,000 to every Michigan high school graduate that completes a full two-years of college. The Promise scholarship effectively replaces the less generous Michigan Merit Scholarship ($2,500) and was at least partly informed by the work of the Cherry Commission on Higher Education and Economic Growth. The Promise scholarship is credit contingent, meaning that all or part of the award is made once a certain number of postsecondary credits are earned at an approved institution. In May of 2009, the first group of eligible students is expected to earn the complement of 60 credit hours, meaning they will have earned the full $4,000 award. The Promise Scholarship was a political decision that neglected the
450
Proceedings of the 5th Annual National Symposium on Student Retention. Copyright 2009. C-IDEA, The University of Oklahoma.
Poster Sessions, cont’d Breaking the Promise, cont’d challenges of implementation and the result has been a higher cost of administration for institutions and a gap in funding for students during the semester they are expected to become eligible for the award. This is a particular problem for low-income students who will be forced to cover that gap until they are reimbursed by the state. The result may be barriers to persistence among qualified students.
If at First You Don't Succeed, Try Community College: An Analysis of Community College Transfers Who Applied as
First Time Freshmen
Jaclyn Cameron DePaul University
[email protected] Abstract: Community colleges have been regarded as important stepping stones on the path to student success. The primarily general education curriculum along with the availability of pre-college level coursework offered at the community college provides a low cost, local opportunity to strengthen academic profiles. This research supports the argument that community college enrollment can be key to student success. The study will compare first time freshmen, admitted non-matriculated students who entered later as community college transfer students, and denied applicants who entered later as community college transfers. First, 4-, 6-, and 8-year graduation differences will be compared. Second, entering academic profile information (including high school GPA and ACT scores) of the groups will further distinguish differences in graduation rates. Lastly, the expected graduation rates of the transfers, based on if they had entered as freshmen, will be modeled from freshmen academic profiles, and compared to actual rates. Issues concerning time between first application and transfer entry, full versus part time enrollment, and number of hours transferred in will be related to the findings. This research has implications for strengthening support for community colleges, institutional partnerships, dual enrollment programs, and pre-entrance advising.
Integration of Retention Programs to Improve Student Graduation and Success Rates
James Mackin S. Ekema Agbaw Jonathan Lincoln Irvin Wright
Bloomsburg University of Pennsylvania
Bloomsburg University of Pennsylvania
Bloomsburg University of Pennsylvania
Bloomsburg University of Pennsylvania
[email protected][email protected][email protected][email protected] Abstract: Several different types of student retention programs have been developed recently at Bloomsburg University of Pennsylvania. The Living and Learning Program was initiated in 1996 as a collaborative effort of Academic Affairs and Student Affairs. A total of eleven living and learning communities have been created to-date. Each community has a faculty director, upper-
451
Proceedings of the 5th Annual National Symposium on Student Retention. Copyright 2009. C-IDEA, The University of Oklahoma.
Poster Sessions, cont’d Integration of Retention Programs, cont’d class student mentors and a community assistant who all interact on a regular basis. Through the years, the living and learning communities have fostered a collaborative atmosphere for faculty and students to construct innovative strategies for integrating in and out-of-classroom experiences. One of the living and learning communities is associated with the Frederick Douglass Institute, which also includes a teaching scholars program. The Institute is specifically designed to improve retention of traditionally at-risk students and promote interactions among diverse constituencies on the campus. The institute has evolved over the years and has recently spawned the Frederick Douglass Academic Achievement Program. This latter program was created to enhance the retention rates of sophomores, juniors and seniors, and ensure their timely graduation. All of these programs are linked to the Act 101/EOP Program, which is part of a state-wide effort to improve the success of economically disadvantaged students. Justifying Investments in Retention Efforts Based Upon their
Return on Investment
Charles Perkins Anne Skleder Point Park University Chatham University
[email protected][email protected] Abstract: Increasing a college or university’s retention rate is conceptually appealing to academic leaders. Many quality and benchmarking measures are use first to second year retention and graduation rates as strong indicators of institutional quality. Colleges and universities have worked to implement those initiatives which can be improved through attention to detail and heightened customer service. We start this paper by reviewing many of the actions which, while individually not costly, can require resources to coordinate and work across organizational units. Such actions can result in a positive improvement in retention. When taken in conjunction with some dedicated specific actions, these interventions may not only impact retention rates but also the quality of the experience for all students. We then explore the financial arguments which can be used to demonstrate the positive impact of increased retention on the “bottom line,” and conclude with a simple system which can be used to collect and present both actions and their results.
Life-Health Sciences Internships: Research and Professional Experience Internships as an Undergraduate Retention Tool
Brandi L. Gilbert N. Douglas Lees Simon J. Rhodes
Indiana University-Purdue University Indianapolis
Indiana University-Purdue University Indianapolis
Indiana University-Purdue University Indianapolis
[email protected][email protected][email protected] Abstract: The Indiana University-Purdue University Indianapolis (IUPUI) Life-Health Sciences Internships program is part of a university-wide initiative to improve retention and graduation rates in undergraduate students. Students participate in on-campus research, clinical, and professional internship experiences in life and health sciences disciplines during the academic
452
Proceedings of the 5th Annual National Symposium on Student Retention. Copyright 2009. C-IDEA, The University of Oklahoma.
Poster Sessions, cont’d Life-Health Sciences Internships, cont’d year. Progress was monitored through exit interview questionnaire responses as well as a review of grades and enrollment. There were 83 participants between January 2007 and May 2009. Of the 83 participants, 77 completed the full year of the internship. After the first two years of the program 93.5% of participants remain enrolled at IUPUI or graduated. All participants leaving the university prior to graduation enrolled at other universities in line with their academic and career goals. Eleven of the fifteen graduates have applied to or were accepted to graduate and professional programs on the IUPUI campus. According to exit interview questionnaire responses, during the academic year following the internship 33% (23 of 69 respondents) continued to work at the location of the internship, 38% (26 of 69) started another research or internship experience, and 35% (24 of 69) planned to apply to graduate or professional school.
Matters of Success: A Deliberative Approach to Retaining Students
Abstract: This poster presents a student success study conducted at Austin Peay State University (APSU) during the spring 2009 semester. This study uses a methodology known as deliberative polling in which subjects (in this case, students) are viewed as having the potential to develop informed opinions to be used in the formation of specific policy goals and initiatives. The entire population was invited to complete an initial survey on the effectiveness of a wide variety of strategies to increase student retention and promotion. Those who completed the survey were then invited to a four-hour on-campus event, the deliberative poll, at which they participated in a series of in-depth deliberations on three strategies. At the conclusion of these deliberations, a final survey was administered to these participants. Researchers found significant shifts in their attitudes and opinions concerning how best to promote student success at APSU. On a normative level, an argument can be made that university decision-makers should pay closer attention to the positions and insights articulated by participants in the deliberative poll. More Than Balls and Whistles: An Examination of the Impact
Physical Activity Courses have in Student Retention
Dylan Naeger David Britt University of Louisville University of Louisville
[email protected][email protected] Abstract: Minority-student attrition and corresponding retention interventions are of considerable interest (Bennett & Okinaka, 1990). We examine how participation in at least one physical activity course during the first two years of college (as a retention intervention), ethnicity, and gender impact the chances of a students returning for a fifth semester. Data were gathered for
453
Proceedings of the 5th Annual National Symposium on Student Retention. Copyright 2009. C-IDEA, The University of Oklahoma.
Poster Sessions, cont’d More Than Balls and Whistles, cont’d both full and part-time bachelor degree seeking freshman cohorts from Fall 2001-2005 (N=11,587). The data were analyzed using the fsQCA program (which is particularly sensitive to the alternative scenarios by which retention might be achieved) and within-ethnic-group odds ratios. The QCA and odds-ratio analyses demonstrated the significant impact of participating in an activity course on fifth-semester retention. Caucasian students participating in activity courses were 1.96 times more likely to return for a fifth semester than those students not enrolled. Minority students enrolled in these courses were more than two times more likely to return for a fifth semester. As funding sources become increasingly limited, universities must focus on other financial sources and develop strategies promoting student persistence. Our findings demonstrate the effectiveness of activity-course enrollment in contributing to student retention. The Comprehensive Retention Review: A Step by Step Guide
for Evaluating the Overall State of Retention at Your Institution
Abstract: Retention is a key part of institutional success. It is important for the members of a college or university to understand opportunities for improvement; as well as where their strengths lie. The first step in gaining this understanding is a retention review. There are many variables that exist between institutions with regard to whether their retention is considered successful: type of institution, whether standard or effective retention is the focus, the specific populations they are seeking to retain, etc. A retention review provides an opportunity to look at overall retention and also focus on specific groups that have been historically successful or challenging, and utilize that information to encourage overall retention. This poster will provide a step by step review of the recommended steps in conducting a retention review and developing a retention plan, based on guidelines from both Noel-Levitz and Karp & Logue. As part of the overview of each recommended step findings, recommendations and experiences from Michigan Tech’s retention review will be shared.
Penny Pinchers: The Impact of the Economic Downturn on Student Financial Persistence in Higher Education
Abstract: Tinto (1993) found that typically the “impact of finances upon persistence occurs before or at the point of entry into higher education.” However, with the economic crisis
454
Proceedings of the 5th Annual National Symposium on Student Retention. Copyright 2009. C-IDEA, The University of Oklahoma.
Poster Sessions, cont’d Penny Pinchers, cont’d financial persistence has emerged as a concern. This poster will briefly review theory and best practices as they relate to financial persistence. Rebound: Second-Chance Seminar For Freshmen In Academic
Difficulty
Linda J Burke Maureen Wogan Carrie Scahde Susan Swisher Saint Xavier University
Saint Xavier University
Saint Xavier University
Saint Xavier University
[email protected][email protected][email protected][email protected] Abstract: Project Rebound was developed to provide multi-prong support for freshmen in academic difficulty at a mid-sized liberal arts university in Chicago. Designed to increase retention and satisfactory academic progress among students at a high risk of dropping out, the intervention took the form of a second semester workshop required of all freshmen who fell on academic probation. Rebound focused on three components of freshmen difficulties: academic, financial, and personal, with the goal of matching support to individual needs. This paper will focus on the data-driven aspects of the development, implementation and evaluation of this pilot program and how the evaluation of the program informed the fine-tuning of the Rebound in its second year. Saint Xavier University has a very diverse undergraduate body, and has recently experienced large increases in its population of full-time residential freshmen. These students have experienced greatly increased rates of academic probation. Members of the Retention Steering Committee who oversaw the development and evaluation of the program will present both our experiences, a variety of data from multiple sources, and recommendations for those facing similar problems. Additionally, our presentation will include video success stories from Rebound instructor and students.
Abstract: Currently in higher education, there is over 80 years of research devoted to retention theories. However, it was not until the later part of the 20th century that the research on college student departure swayed from psychological models (Tinto, 1993). In the review of this comprehensive literature, it is evident that many theorists strive to answer the question of how a college and university can change their activities to retain students. Midway College, the only all women’s college in the state of Kentucky, has been innovative in creating new retention programs that resulted in a three point increase in the retention of women’s college students over the past year. This poster will provide a brief overview of retention literature, best practices, and a working model of institutional specific retention strategies that address students during their entire tenure with the institution.
455
Proceedings of the 5th Annual National Symposium on Student Retention. Copyright 2009. C-IDEA, The University of Oklahoma.
Poster Sessions, cont’d The Effect of Locus of Control, Motivation and Learning Style on Retention in Online Community College Courses
Vondra Armstrong L. Carolyn Pearson
Charles Donaldson Edward Franklin
Pulaski Technical College University of Arkansas at Little
Rock
University of Arkansas at Little Rock
Arkansas Association of Two-
Year Colleges [email protected][email protected][email protected][email protected] Abstract: Online enrollment has grown faster than traditional enrollment in higher education. The number of students enrolled in at least one online course has doubled since the fall of 2002 from 1.6 million to almost 3.5 million by the fall of 2006. Although online education is gaining tremendous popularity, it is accompanied by a high drop rate and as a result many students are not completing online courses. The literature is replete with the uniqueness of the community college student as it relates to remediation, persistence, and academic success; yet very little literature exists on the community college and retention in online courses. The conceptual framework for the study includes a discussion of student characteristics, locus of control, motivation, learning styles, and the outcome of retention in online community college courses. A descriptive discriminant function analysis revealed one function that was primarily defined by age and ethnicity, locus of control was not supported, while motivation and learning style preference were predictors of retention to a lesser degree. Completers tended to be non-traditional, White, satisfied with the course, and had a learning style preference of sensor and sequential.
When It's Not Working--Fix It: Redesign Developmental Mathematics at Austin Peay State University
Abstract: In 1984, the Tennessee Board of Regents mandated that all higher education institutions address mathematics and writing deficiencies by implementing a Developmental Studies program as a stand-alone unit in the college/university. Students were required to address their deficiencies by completing non-credit courses. The program was supposed to end 5 years later as high schools added rigor to the curriculum. Twenty-two years later and several modifications later, the program was still required. Developmental Studies never achieve the success that envisioned. Thus, in 2006, TBR implemented a 3-year pilot for redesigning developmental studies and received funding from a FIPSE grant to support their efforts. An alignment with National Council for Academic Transformation was created; Austin Peay State University was selected as a pilot for redesigning developmental mathematics. The redesign pilots began in Fall, 2007. The result of the APSU pilot are most promising; the pilot was selected by NCAT as a national model for redesign.
456
Proceedings of the 5th Annual National Symposium on Student Retention. Copyright 2009. C-IDEA, The University of Oklahoma.
Poster Sessions, cont’d When It's Not Working, cont’d We will share the plan, the results, and challenges from the change that eliminated developmental courses and replaced them with regular core courses supported by Structured Learning Assistance.
CSRDE: Data, Knowledge and Innovation
Sandra Whalen Blake Cannon CSRDE, The University of Oklahoma CSRDE, The University of Oklahoma
While best known for its Benchmarking Survey on the Retention and Graduation Rates of First-Time Full-Time Freshman, the Consortium for Student Retention Data Exchange has evolved into an organization which not only provides data, but also supports the sharing of best practices and the most current research. This poster session highlights not only the CSRDE surveys, but also the continuing professional education opportunities provided by the CSRDE.
457
Proceedings of the 5th Annual National Symposium on Student Retention. Copyright 2009. C-IDEA, The University of Oklahoma.
Workshops
Early Alert and Warning Programs: An IntentionalApproach to Ensuring Student Success and Persistence
Abstract: This workshop will provide essential information to administrators, enrollment managers, faculty and professional advisors for designing and implementing a comprehensive and collaborative early alert and intervention program for their own respective campuses. Specific topics that will be addressed in this presentation include: description of key components of an early warning system, overview of relevant literature as well as existing early alert/intervention programs, methods for recruiting, training, maintaining communications with key stakeholders, techniques for engaging students in the process of grade recovery and planning for future success, as well as a discussion of assessment models that identify students most likely to depart prior to degree completion.
Abstract: You've just been named coordinator of student retention at your institution-now what? Retention for Rookies is intended to give you a solid orientation about the retention field. Learn basic retention concepts. Identify resources that can help you evaluate the current state of affairs at your institution. Discover retention strategies that get results at two-year and four-year institutions and learn the best ways to plan for programs by laying the groundwork for success and gaining faculty support. A good starter course for those of you who have recently been told that "retention and student success" have been added to your responsibilities.
458
Proceedings of the 5th Annual National Symposium on Student Retention. Copyright 2009. C-IDEA, The University of Oklahoma.
Workshops, cont’d
Targeted Intervention for At-Risk First-Time College Students and Transfers
DeLaine Priest Charlene A. Stinard Bernadette M.E. Jungblut
Abstract: How does the academy focus on identifying and utilizing targeted intervention programming for at-risk First Time in College students (FTICs) and transfer students confronting retention failure? This data-driven session examines in detail the retention challenges for specific sub-groups of FTICs and transfer students; the results of programs designed to address those challenges; and the transferability of these identification and programming experiences to other colleges and universities. We envision a three-dimensional mapping of data and findings with reference to at-risk students, program options, and institutional contexts that will provide workshop participants with at least three (3) strategies for implementation in their respective campus communities.
Data and Decisions to Support Student Success
Gerald McLaughlin Rich Howard Josetta McLaughlin DePaul University University of Minnesota Roosevelt University
Abstract: Increasingly, college and university leaders base strategic decisions on data. The ability to access, analyze, and convert data into strategic information is critical for institutions to remain competitive with other institutions. This full day workshop will focus on ways to identify peer and competitive institutions, define key institutional performance measures related to retention and compare relative positions on these measures with other institutions. A team approach will be used in this workshop, so senior management and their institutional researchers are encouraged to sign up together for this workshop for maximum benefit. Note: Lunch is included
459
Proceedings of the 5th Annual National Symposium on Student Retention. Copyright 2009. C-IDEA, The University of Oklahoma.
Workshops, cont’d
Predictive Modeling Tutorial: Logistic Regression
Kyle Hawkins Carroll University
[email protected] Abstract: In partnership with Jenzabar, Carroll University has developed and implemented a Retention Management System to help organize activities and data resources aimed at student persistence. The system utilizes a mathematical model derived from historical retention data and applies that model to current students to calculate a probability of an individual student leaving Carroll. The model was built off of a logistic regression tool in SPSS combining both static variable such as academic ability and dynamic variables such as the number of unfavorable grades. This workshop will focus on performing logistic regression using SPSS to predict retention and detail how to apply the model to a new cohort. General topics will include how to prepare data for modeling, how to perform logistic regression through SPSS, how to read the results, and how to verify and validate the results. This workshop will cover concepts of regression such as goodness of fit, tests of significance, classification tables, and correlation.
Two-part Tutorial: Multiple Indicators for Monitoring Undergraduate Transfers Through to the Baccalaureate
Abstract for Community College Topics: This first half of a two-part tutorial demonstrates how community college and baccalaureate institutions can collect and report data on the many facets of the transfer function. The examples to be presented have been developed primarily for the California Community College and California State University systems, but have a broad applicability to most two-year and four-year systems that have a transfer function for students. This paper and tutorial will examine the metrics of student transfer from a two-year institution and two-year segment/system viewpoint. Abstract for 4-Year Institution Topics: Using empirical examples from the California State University, this second half of a two-part tutorial will demonstrate how to augment CSRDE graduation rates for community college students with alternative rates that account for other segments of the undergraduate transfer population found at 4-year institutions. A major topic will be methods for comparing graduation rates between cohorts of new undergraduate transfers and cohorts of new first-time freshmen. Besides graduation rates, measures of time-to-degree and academic performance also will be addressed.
460
Proceedings of the 5th Annual National Symposium on Student Retention. Copyright 2009. C-IDEA, The University of Oklahoma.
Abstract: An orientation session for attendees who are new or "nearly new" to the world of student retention and success. Student Retention and Success is a complex field of study. This session will address common terms used in the field as well as introduce participants to readily available resources that can help them better assist institutional efforts to improve student retention. Tip: The next session in this room will provide a good overview to commonly used strategies and interventions for improving student retention. Taken together, those who are unfamiliar with the field but who have been assigned to "do something about retention" should have a better sense of the scope of their responsibilities.
461
Proceedings of the 5th Annual National Symposium on Student Retention. Copyright 2009. C-IDEA, The University of Oklahoma.